3.1. Evaluation of the Suitable Variant
The results of the tests mentioned above were evaluated in order to be able to make a decision for the preferred variant on the basis of this information. The pressure swelling test yielded the results shown in
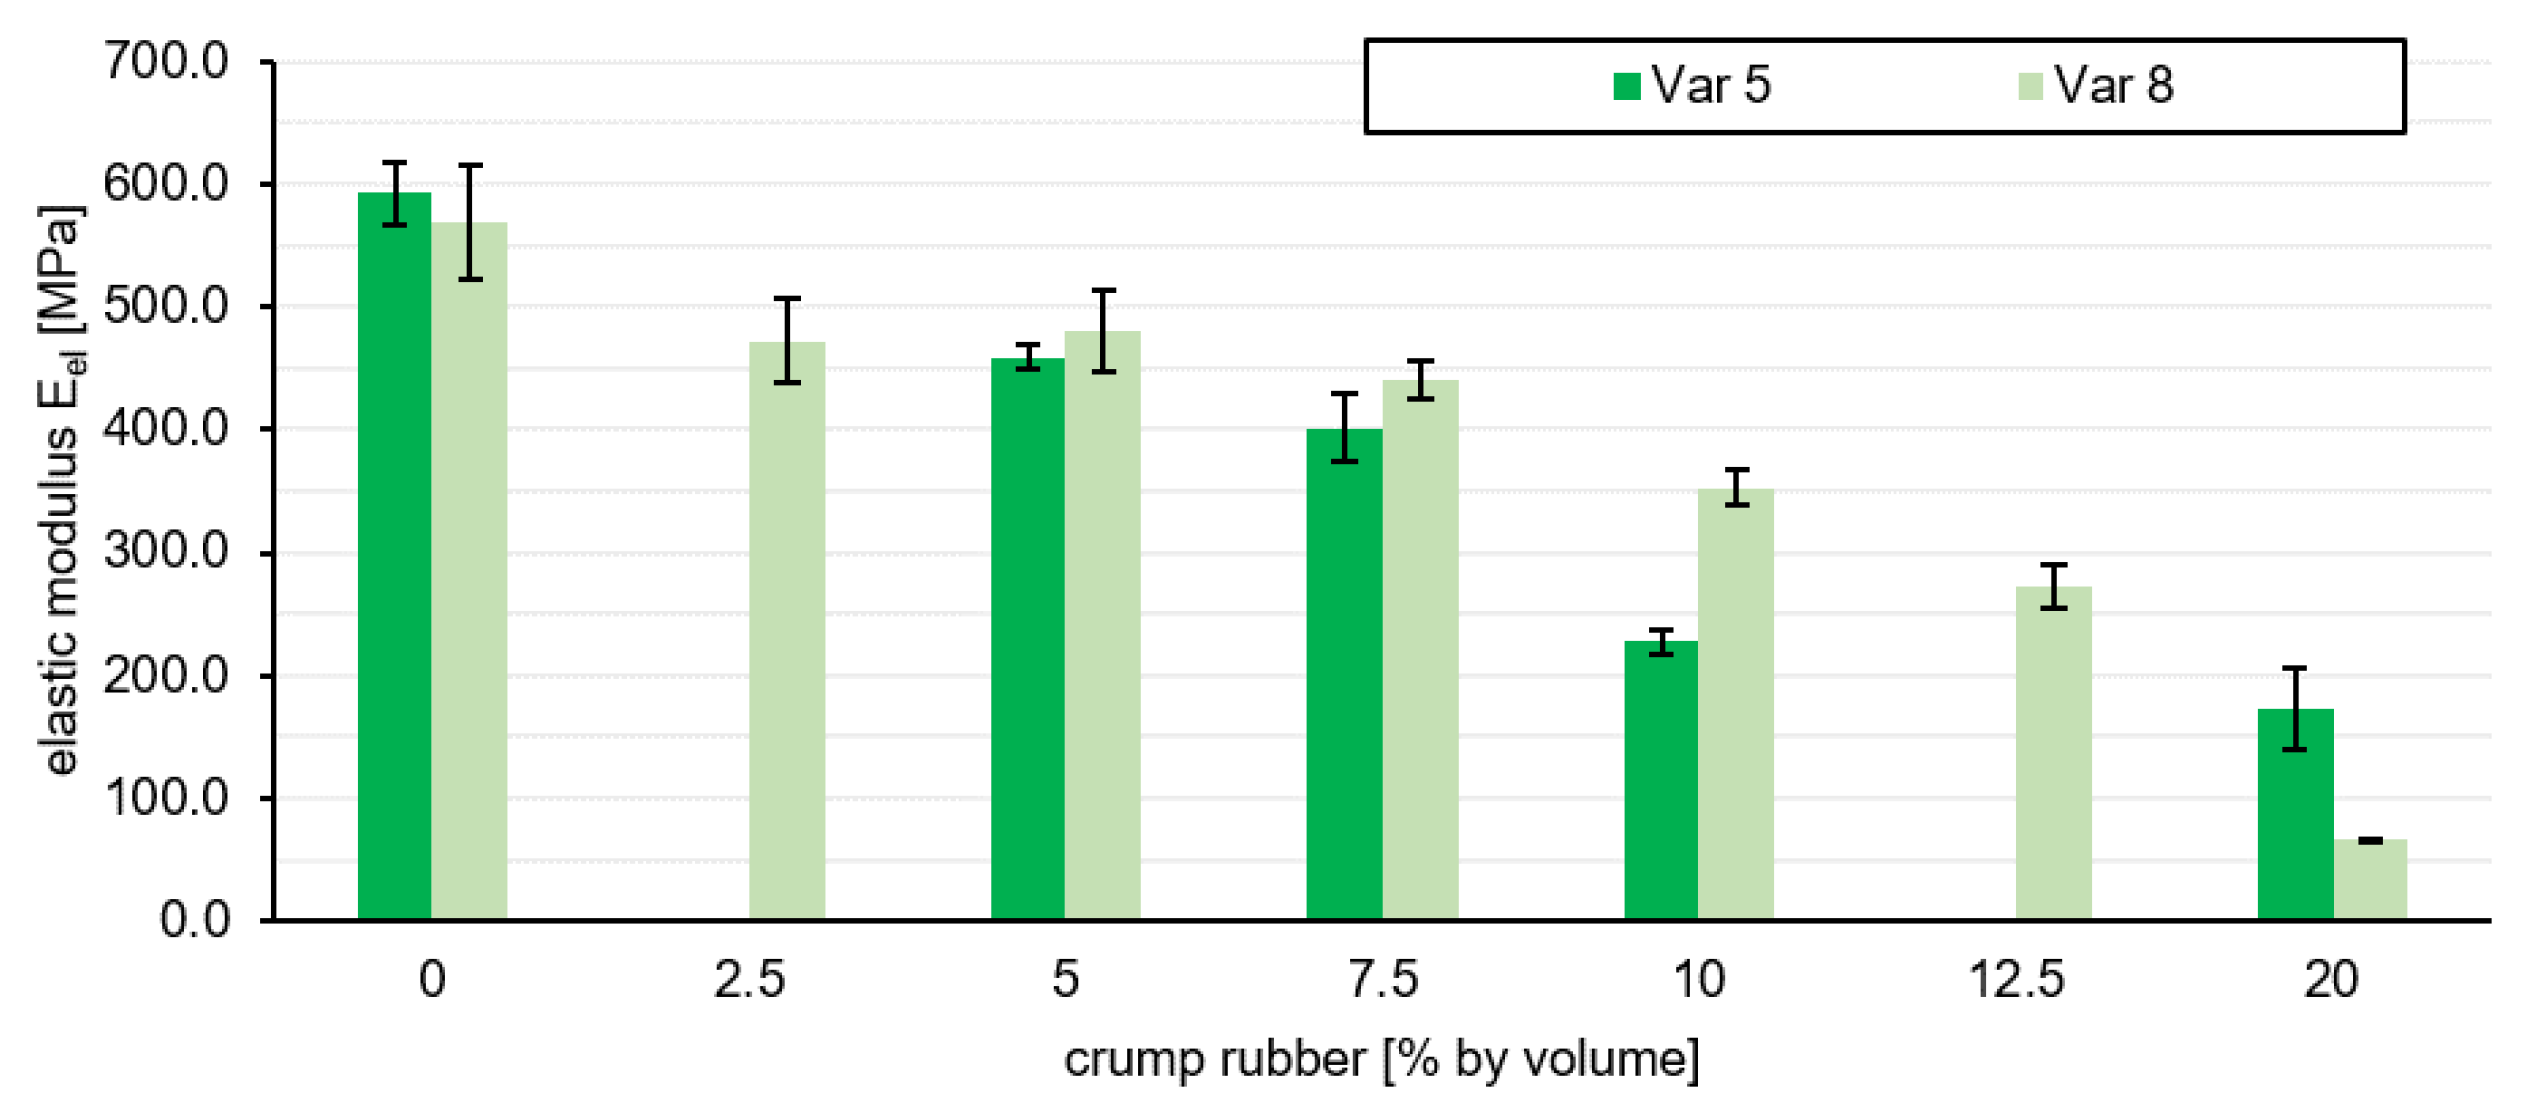
Figure 6. The evaluation of the layer performance is based on the elastic modulus of elasticity E
el in accordance to the best absorption properties. Three specimens of each variant have been tested. The final elastic modulus E
el used in the assessment is a mean value of the individual values.
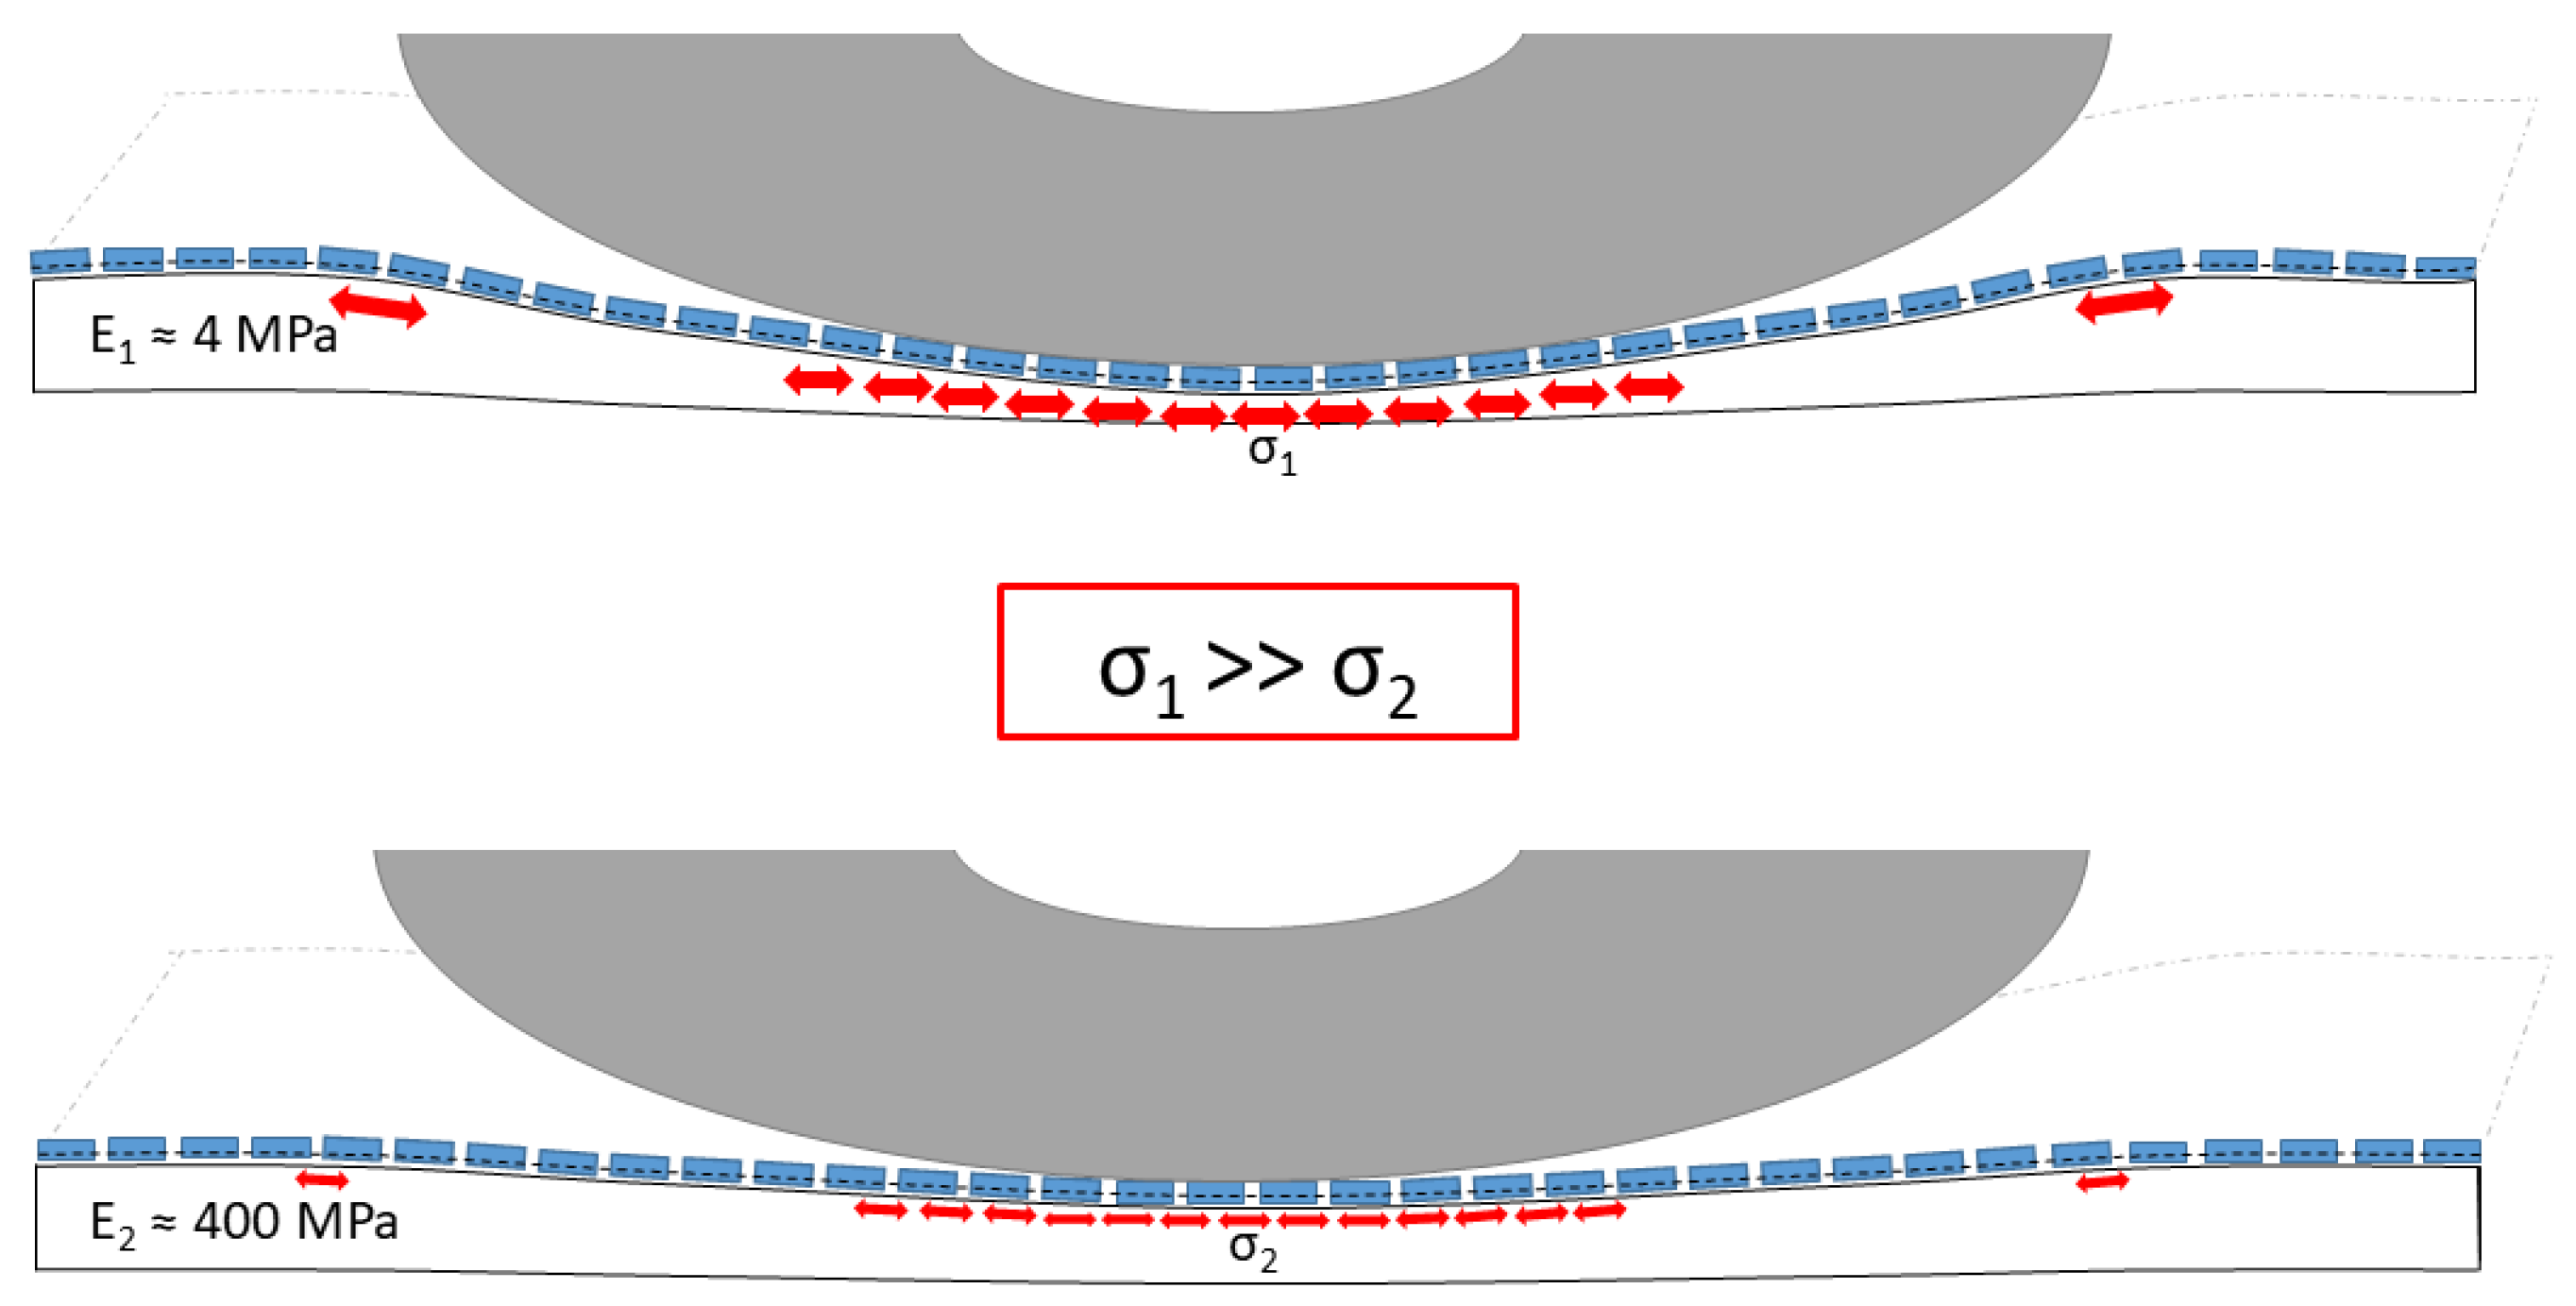
The variants without crumb rubber have an elastic modulus of MPa (Var 5-0) and MPa (Var 8-0). The more aggregates are substituted by rubber granulate, the smaller is the Eel of both grading curve variants, which is MPa for Var 5-20 and MPa for Var 8-20. It can be stated that the addition of rubber granulate leads to a reduction in stiffness. The force is transmitted within the polyurethane asphalt layer via a supporting skeleton formed by the aggregates. Due to the volume-accurate, proportional substitution of the aggregates by crumb rubber, a part of the applied force is absorbed by the rubber granules.
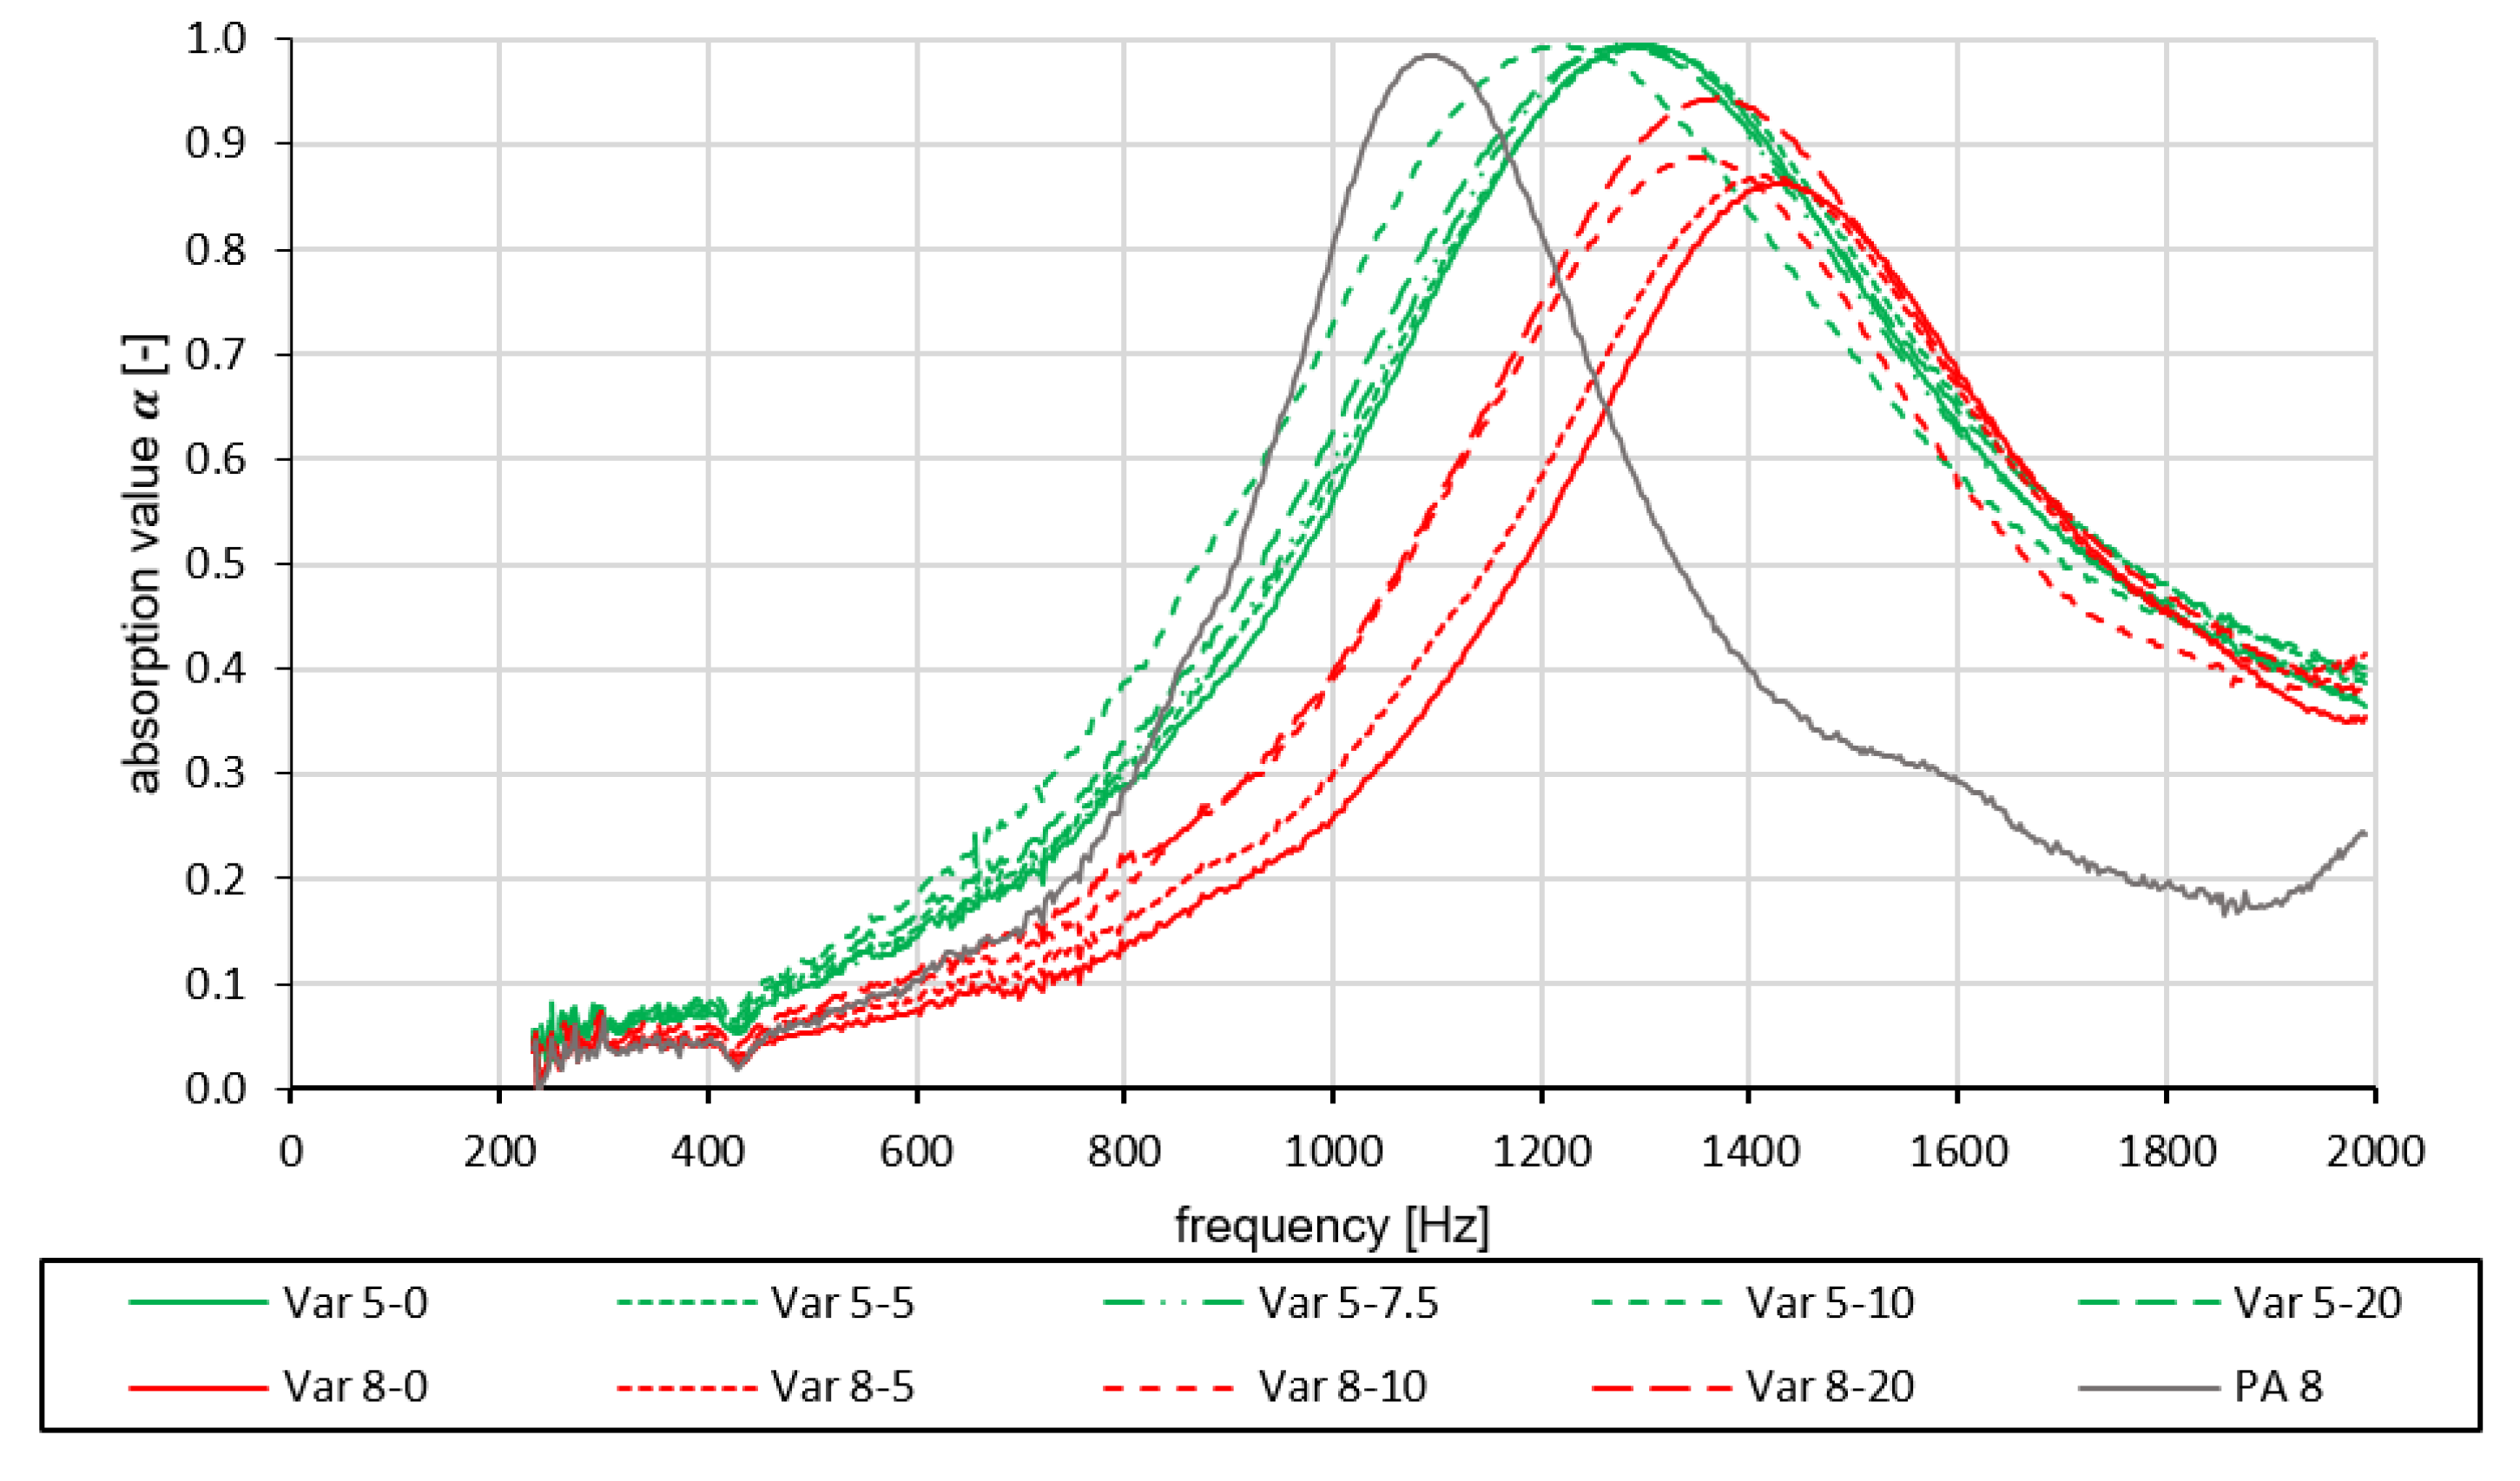
Basically, it can be seen that the absorption curves of the variants tested in this study differ from those of a conventional porous asphalt PA 8. The PA 8-curve is integrated as a reference value in
Figure 7 in order to compare it with the used mix variants from this study.
Looking at the test results in
Figure 7, it can first be seen that the frequency bands of the sound absorption coefficient of the tested variants have pronounced maxima in the range from 1200 to 1300 Hz (Var 5) and from 1350 to 1450 Hz (Var 8). The maximum values of the absorption coefficient of Var 5 with
to
are significantly higher than those of Var 8 (
to
). In addition, the absorption maximum of Var 5 covers a wider frequency range (
from approx. 900 to 1700 Hz) than the one of Var 8 (
from approx. 1100 to 1700 Hz). Both variants Var 5 and Var 8 have slipped higher in the frequency range compared to the reference variant and their curves cover a wider frequency range. The wider shape of the absorption curves indicates that the new material guarantees higher degrees of absorption in a larger frequency range.
When comparing the absorption coefficients of Var 5, no clear influence of the rubber content can be discerned due to the very similar curves. However, it is noticeable that the maximum of Var 5-10 is shifted by approx. 100 Hz to a lower frequency range compared to the other four curves. In comparison to Var 5, clear differences can be observed in the curves of Var 8 depending on the rubber content. By increasing the rubber content, increased maximum degrees of absorption can be achieved with (Var 8-10) and (Var 8-20). In addition, a dependency of the associated frequency on the rubber content is discernible, as it moves into a lower frequency range. An explanation is that the cavities of Var 5 have smaller diameters or locally smaller volumes due to the reduced proportion of coarse aggregates. The cavity system in the test specimens, which is responsible for the absorption of the incident sound, becomes smaller and closer meshed as a result. The enlarged inner surface of the polyurethane asphalt skeleton absorbs the incident sound more effectively. Watching the absorption curves of the different variants Var 5 and Var 8, it can be seen that the amplitudes of the absorption curves differ. This is a consequence of higher flow resistance which is characterized through Var 5 which forms a narrow and branched cavity system resulting from a smaller grain size distribution.
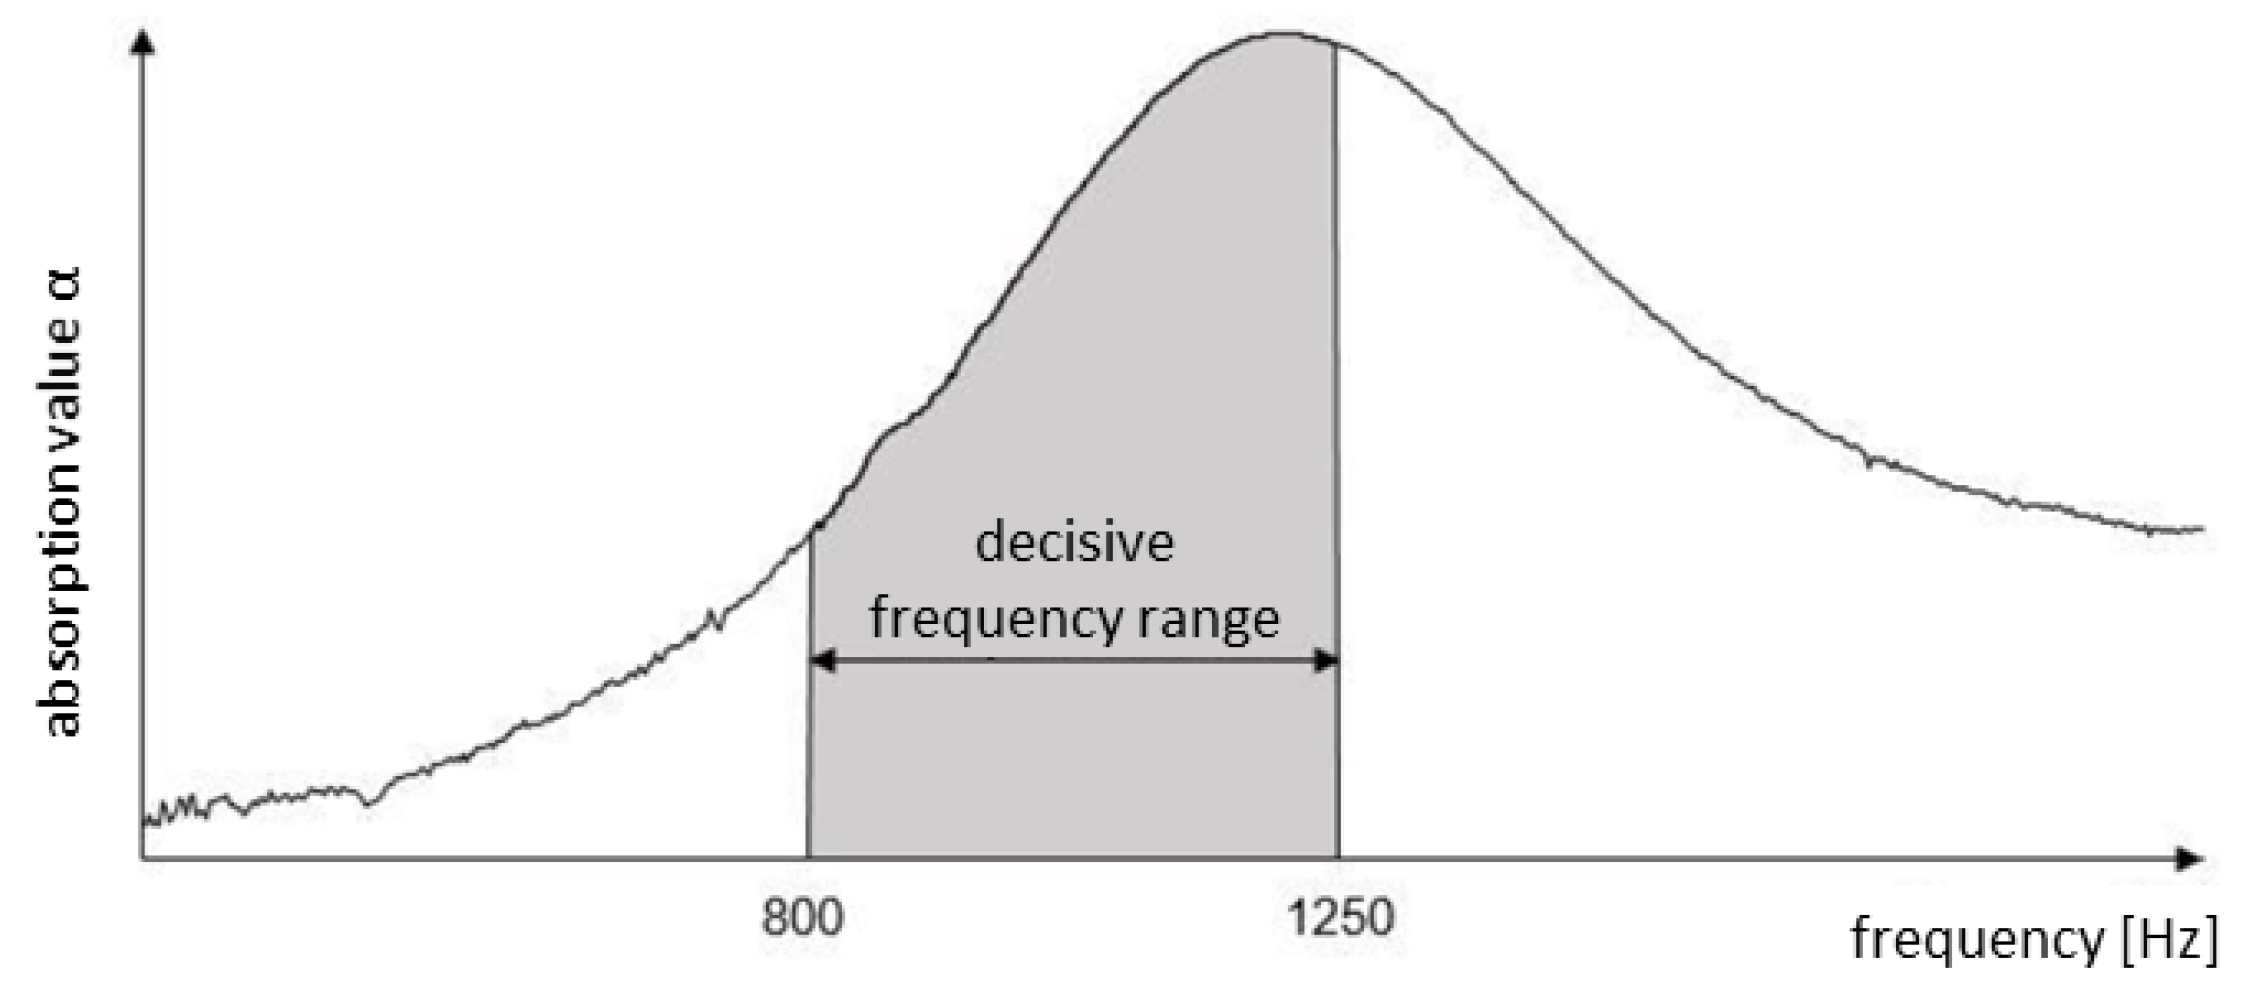
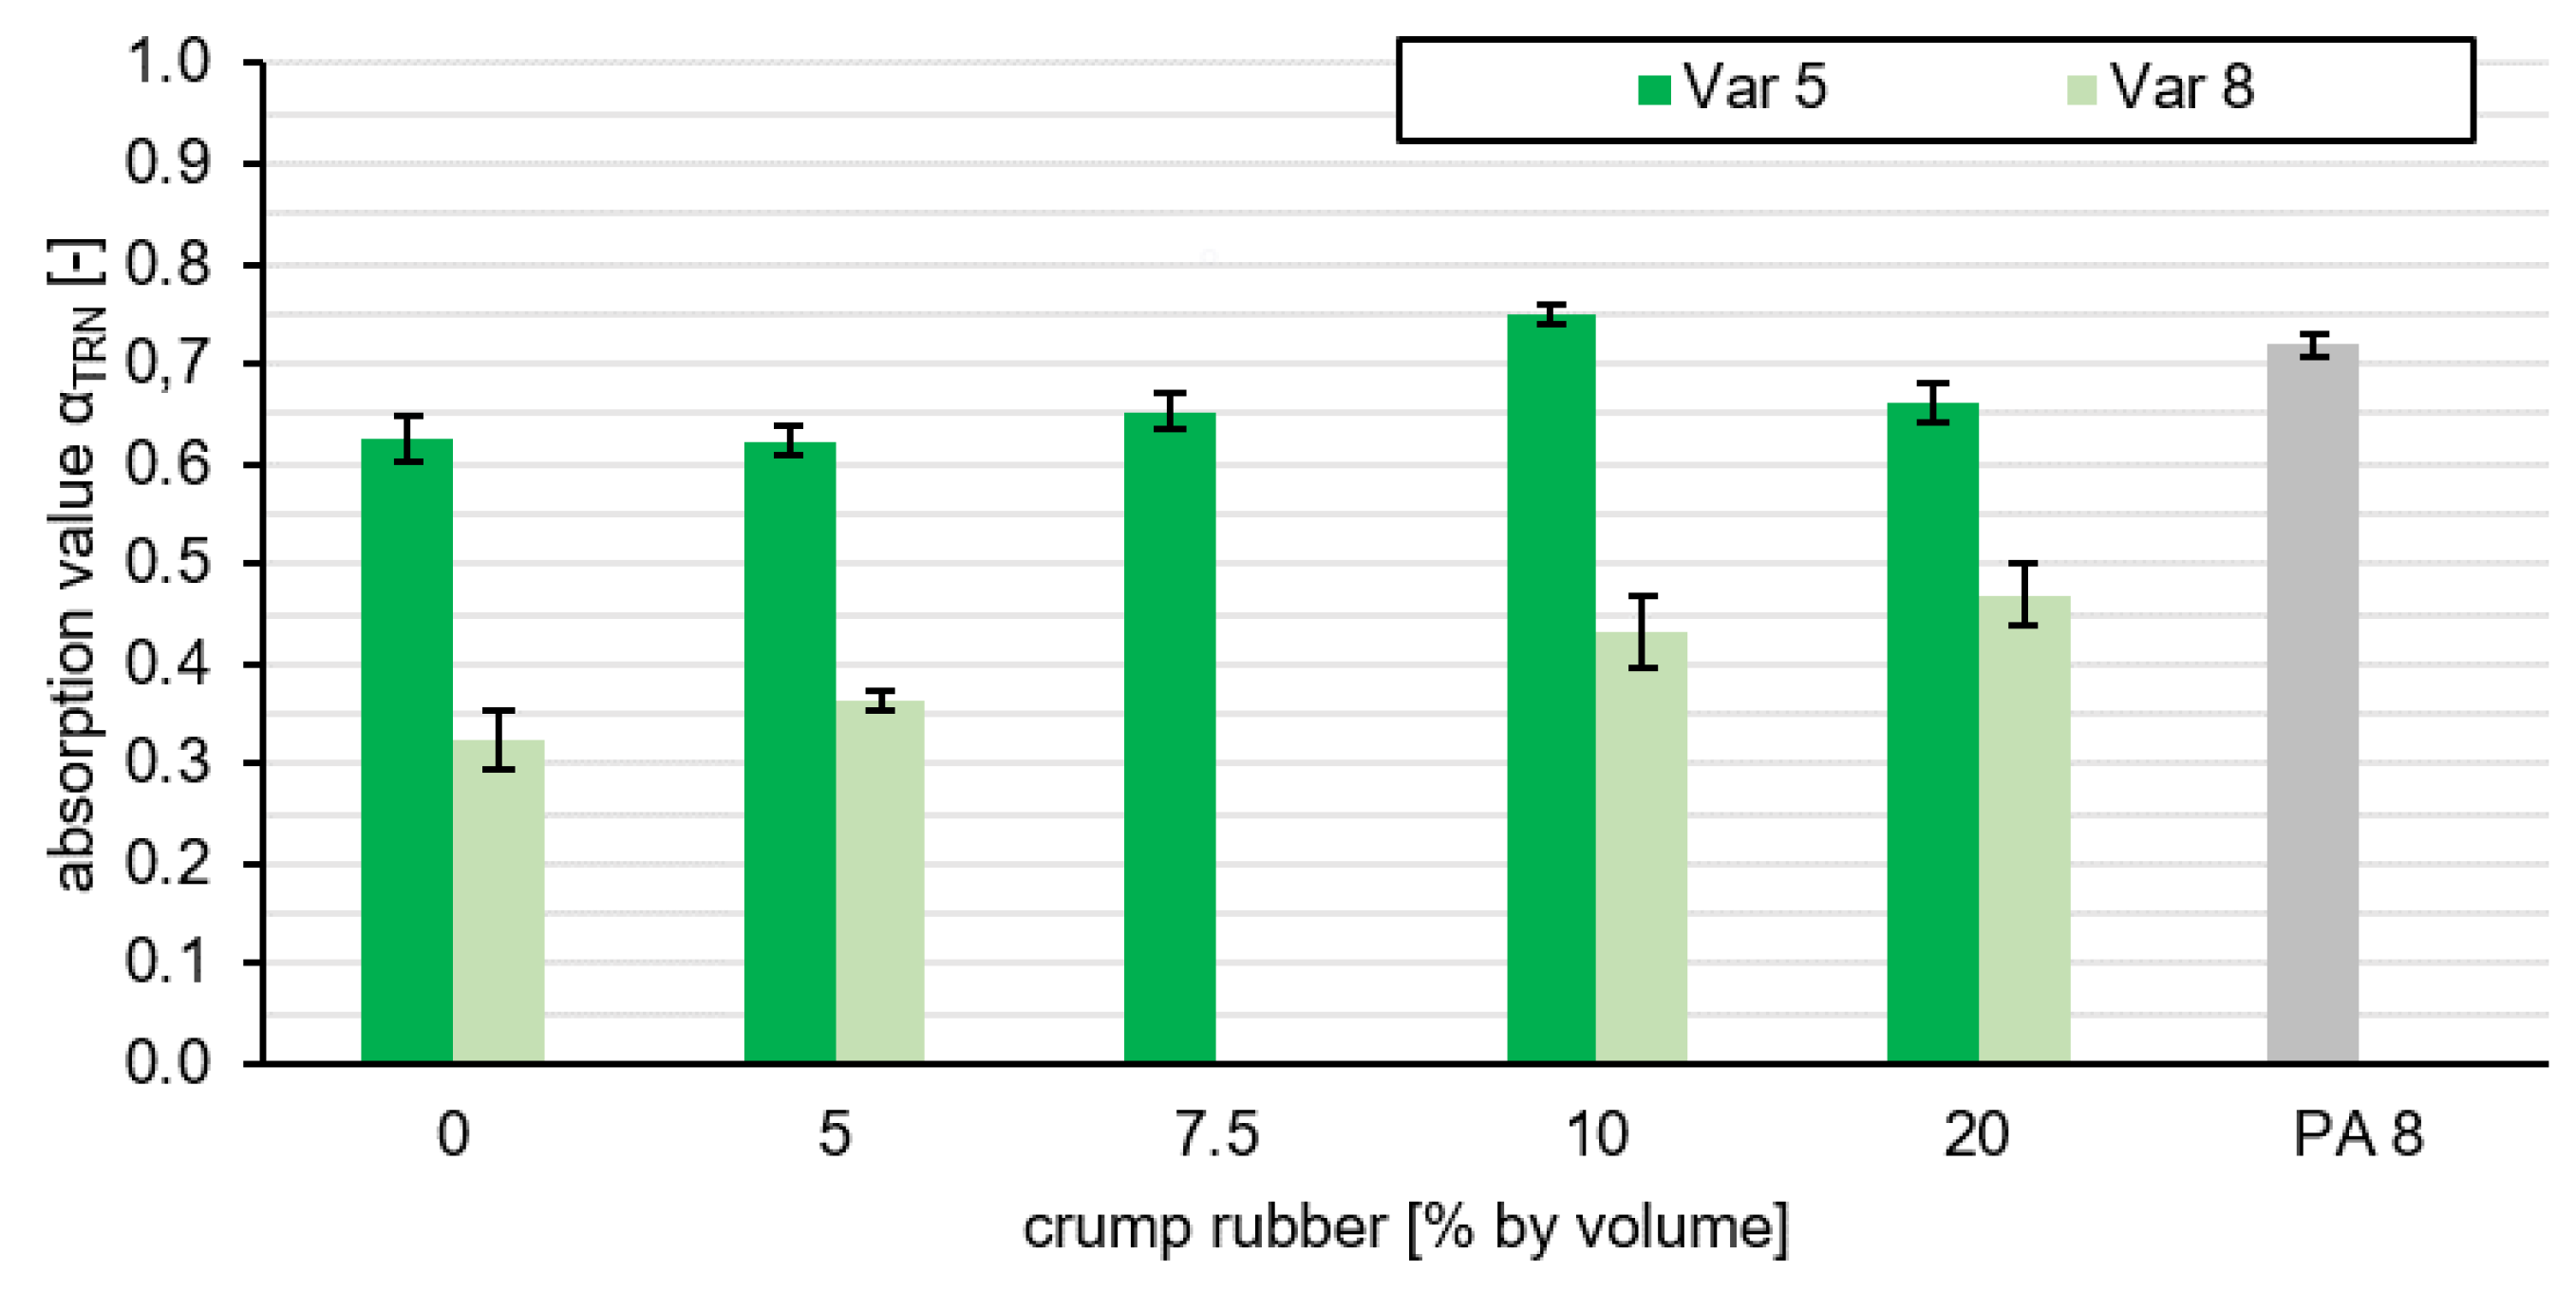
In order to determine which variant is suitable both acoustically and in terms of durability, the proportion of space below the absorption curve in the range of 800–1250 Hz is used to evaluate all variants. The procedure was explained in
Section 2.2.1. Finally, the normalization results in an absorption value for each tested variant
.
Figure 8 shows that Var 5 has higher absorption values compared to Var 8.
Figure 8 describes the absorption value of the respective variant in dependence of the rubber content. From this it can be clearly deduced that the grain size has a decisive influence on the absorption potential of a road layer, because all absorption values of Var 5 are significantly higher than those of Var 8. The PA 8 was also examined with regard to its absorption value. In
Figure 8, the layer PA 8 is regarded as the comparative value, which shows that the variant Var 5 examined here has very similarly good noise-reducing properties. Since Var 5 contains additional rubber particles, we expect a further noise-reducing effect due to the mechanical impedance effect. This, however, is not examined in this study.
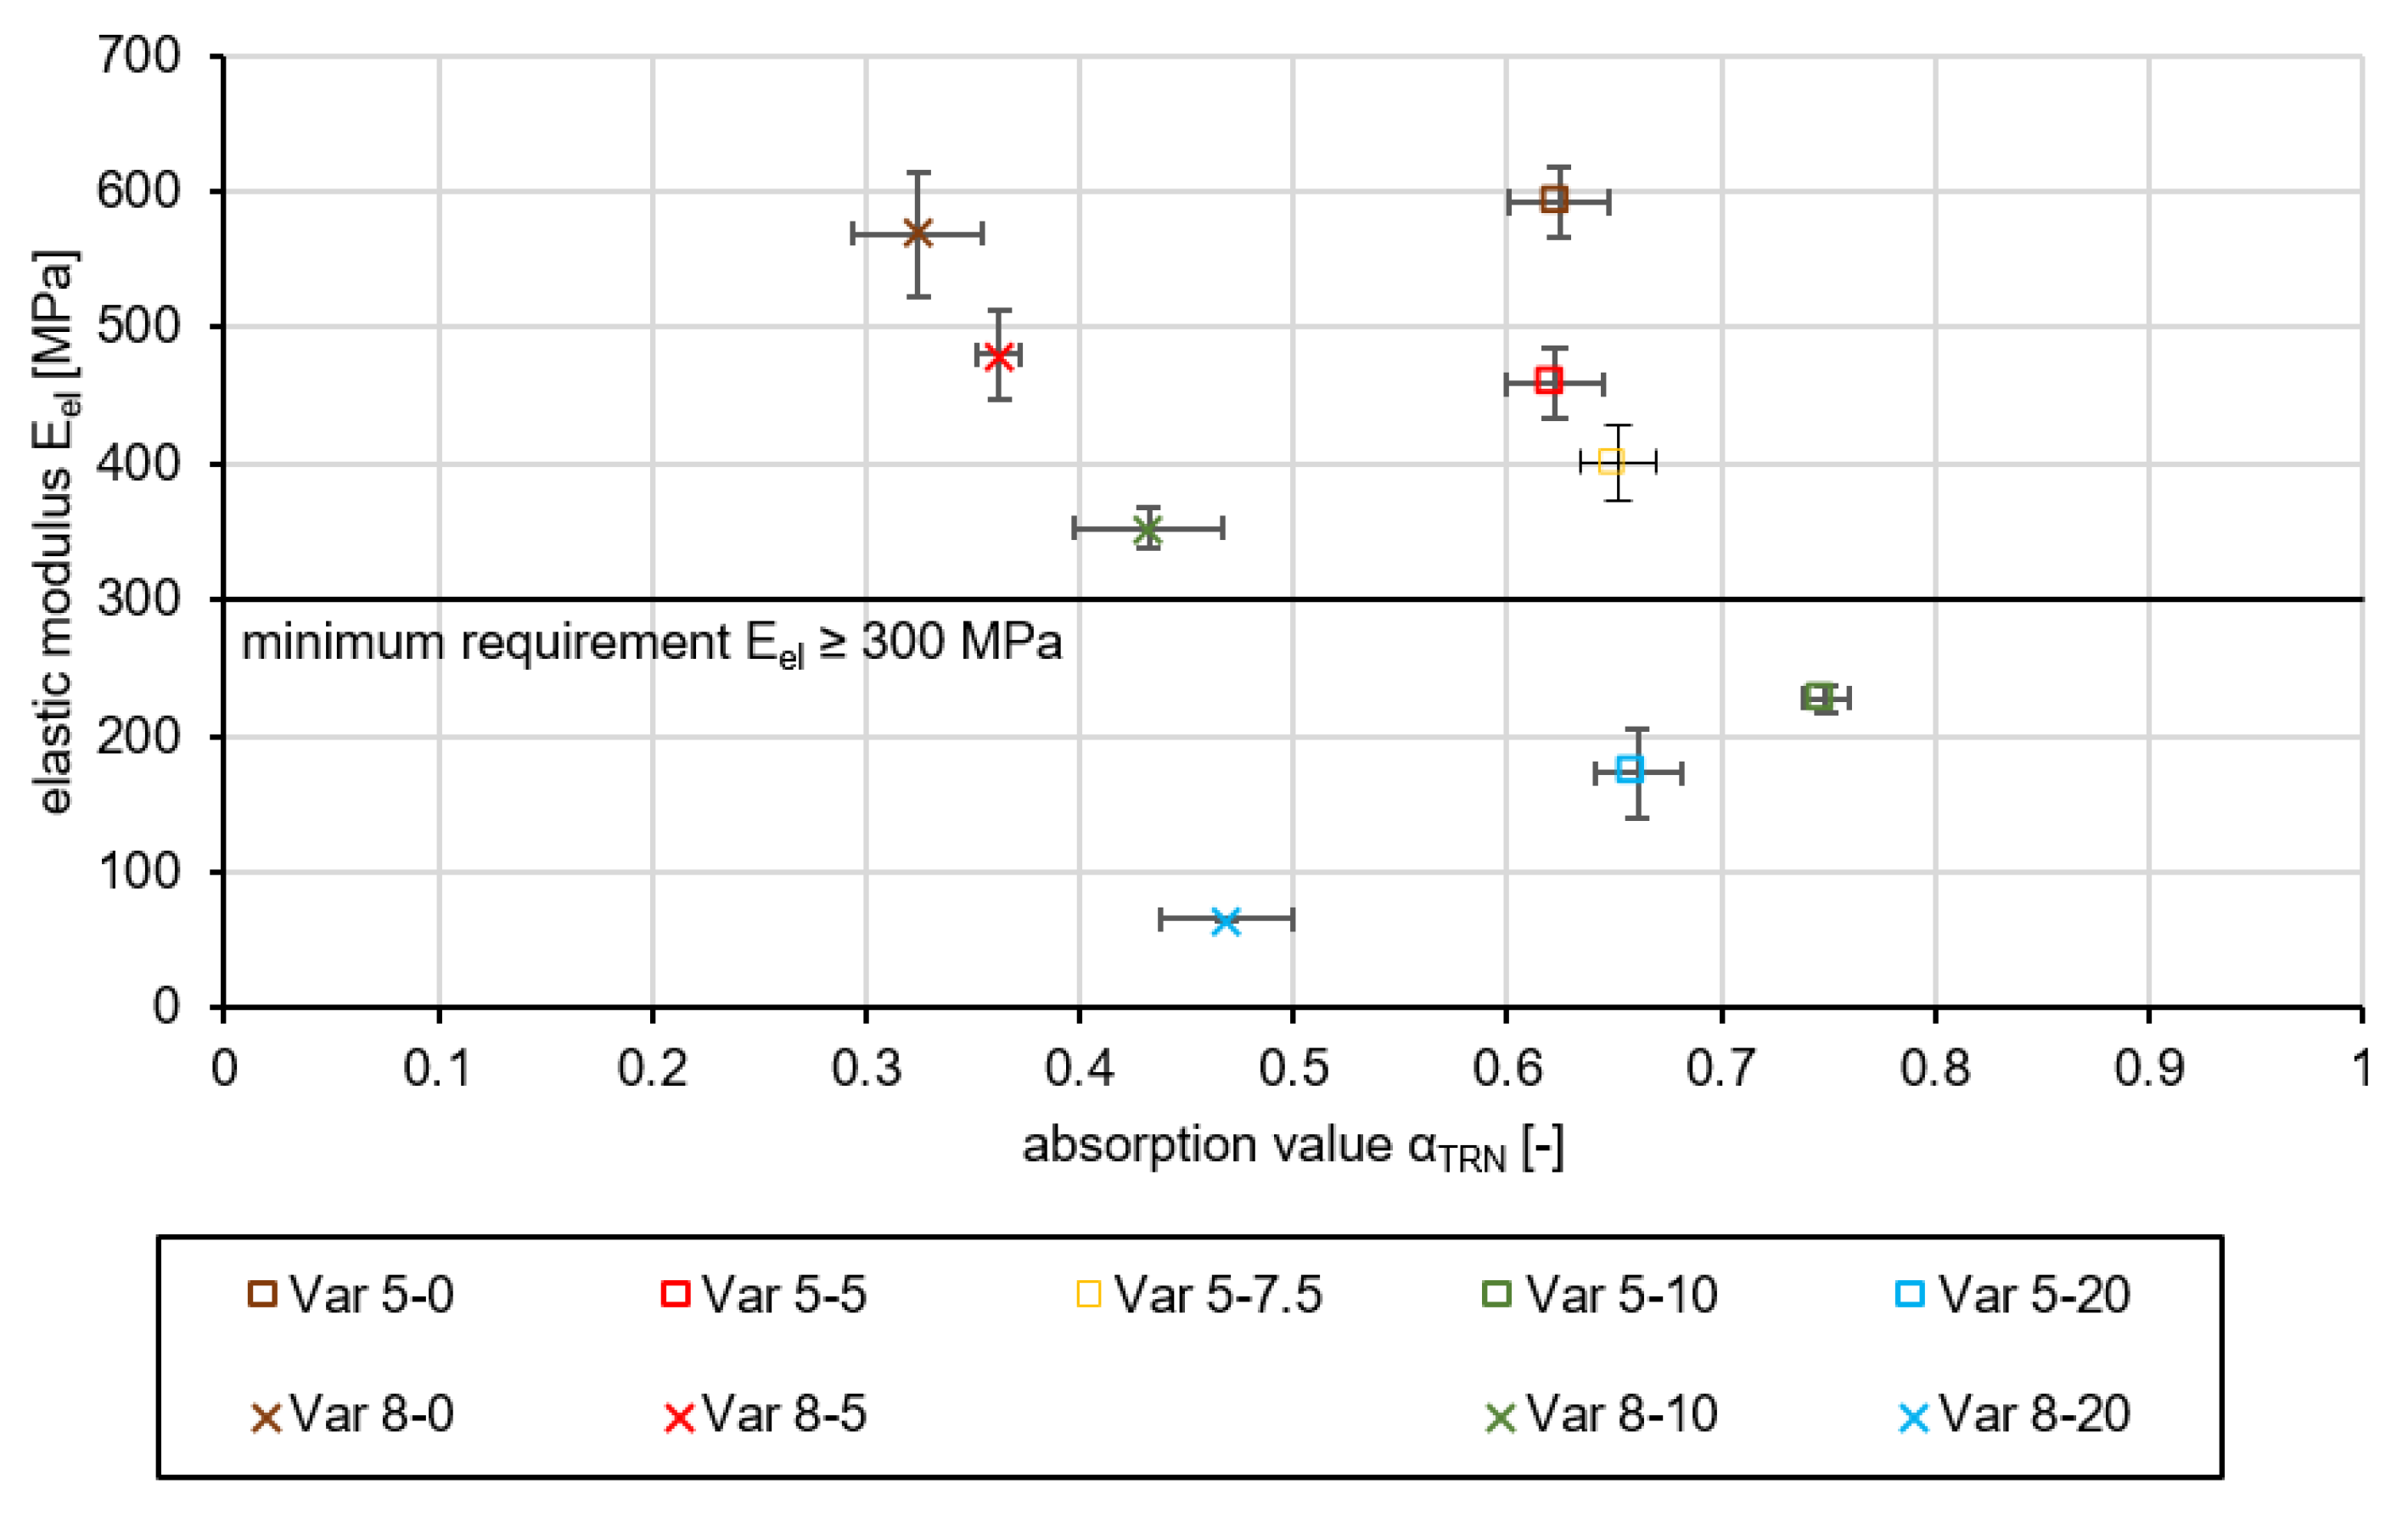
In order to consider not only the acoustic effectiveness but also the durability, the calculated elastic moduli were plotted on the absorption values in
Figure 9.
It can be seen that variants with a high absorption capacity have low elasticity values. There are also variants with a higher elastic modulus that have lower absorption values. Nevertheless, on the basis of
Figure 9, a statement can be made about the variant that has the best absorption coefficient at the minimum requirement of E-modulus ≥ 300 MPa.
Due to higher and wider acoustic absorption of sound, it can be concluded that Var 5 has better acoustic properties than Var 8. One possible cause is the finer pored and nested structure of the cavity network caused by the smaller aggregates, which leads to a shift of the absorption maximum to a lower frequency and a higher flow resistance. However, Var 5-7.5 forms the highest acoustic efficiency with a stable design. For this reason, it is examined and evaluated by asphalt perfomance tests in order to see whether it is suitable for use in road traffic.
3.2. Asphalt Performance of Var 5
To test the performance of the developed material, test specimens with the composition of the final variant Var 5 were prepared. This is followed by tests on deformation behavior using the pressure swelling test, tests on fatigue resistance using the three-point bending test and tests on low-temperature behavior using the uniaxial tension stress test and the thermal stress restrained specimen tests. The specimens are produced in accordance with the dimensions required for testing and are shown in
Table 2. In order to obtain the corresponding dimensions, plates were produced from which the test specimens were drilled or cut.
In order to evaluate the findings from this study, a comparison to values from the literature is conducted. The results of the variants tested by [
25,
28] were used for this purpose. In his studies, Ref. [
25] compared the polyurethane-bonded mixtures PU-Var. A and PU-Var. B with regard to performance characteristics, in which only the size of the maximum grain size of the aggregates used is differentiated. PU-Var. A consists of a grading curve with a maximum grain size of 8 mm whereas PU-Var. B contains a maximum grain size of 5 mm.
3.2.1. Pressure Swelling Test
The compression-swelling test according to TP Asphalt-StB [
27] is carried out to test the deformation resistance of the material. The test specimen is loaded by a load stamp with a defined force over 10,000 cycles. The load is applied by a load pulse which applies a maximum stress of
MPa in a haversine-shaped course. During the loading pause the specimen is exposed to an undervoltage of
. Since an unpublished preliminary study has shown that reacted polyurethane is nearly temperature-independent, the test temperature is reduced from 50
C to 20
C.
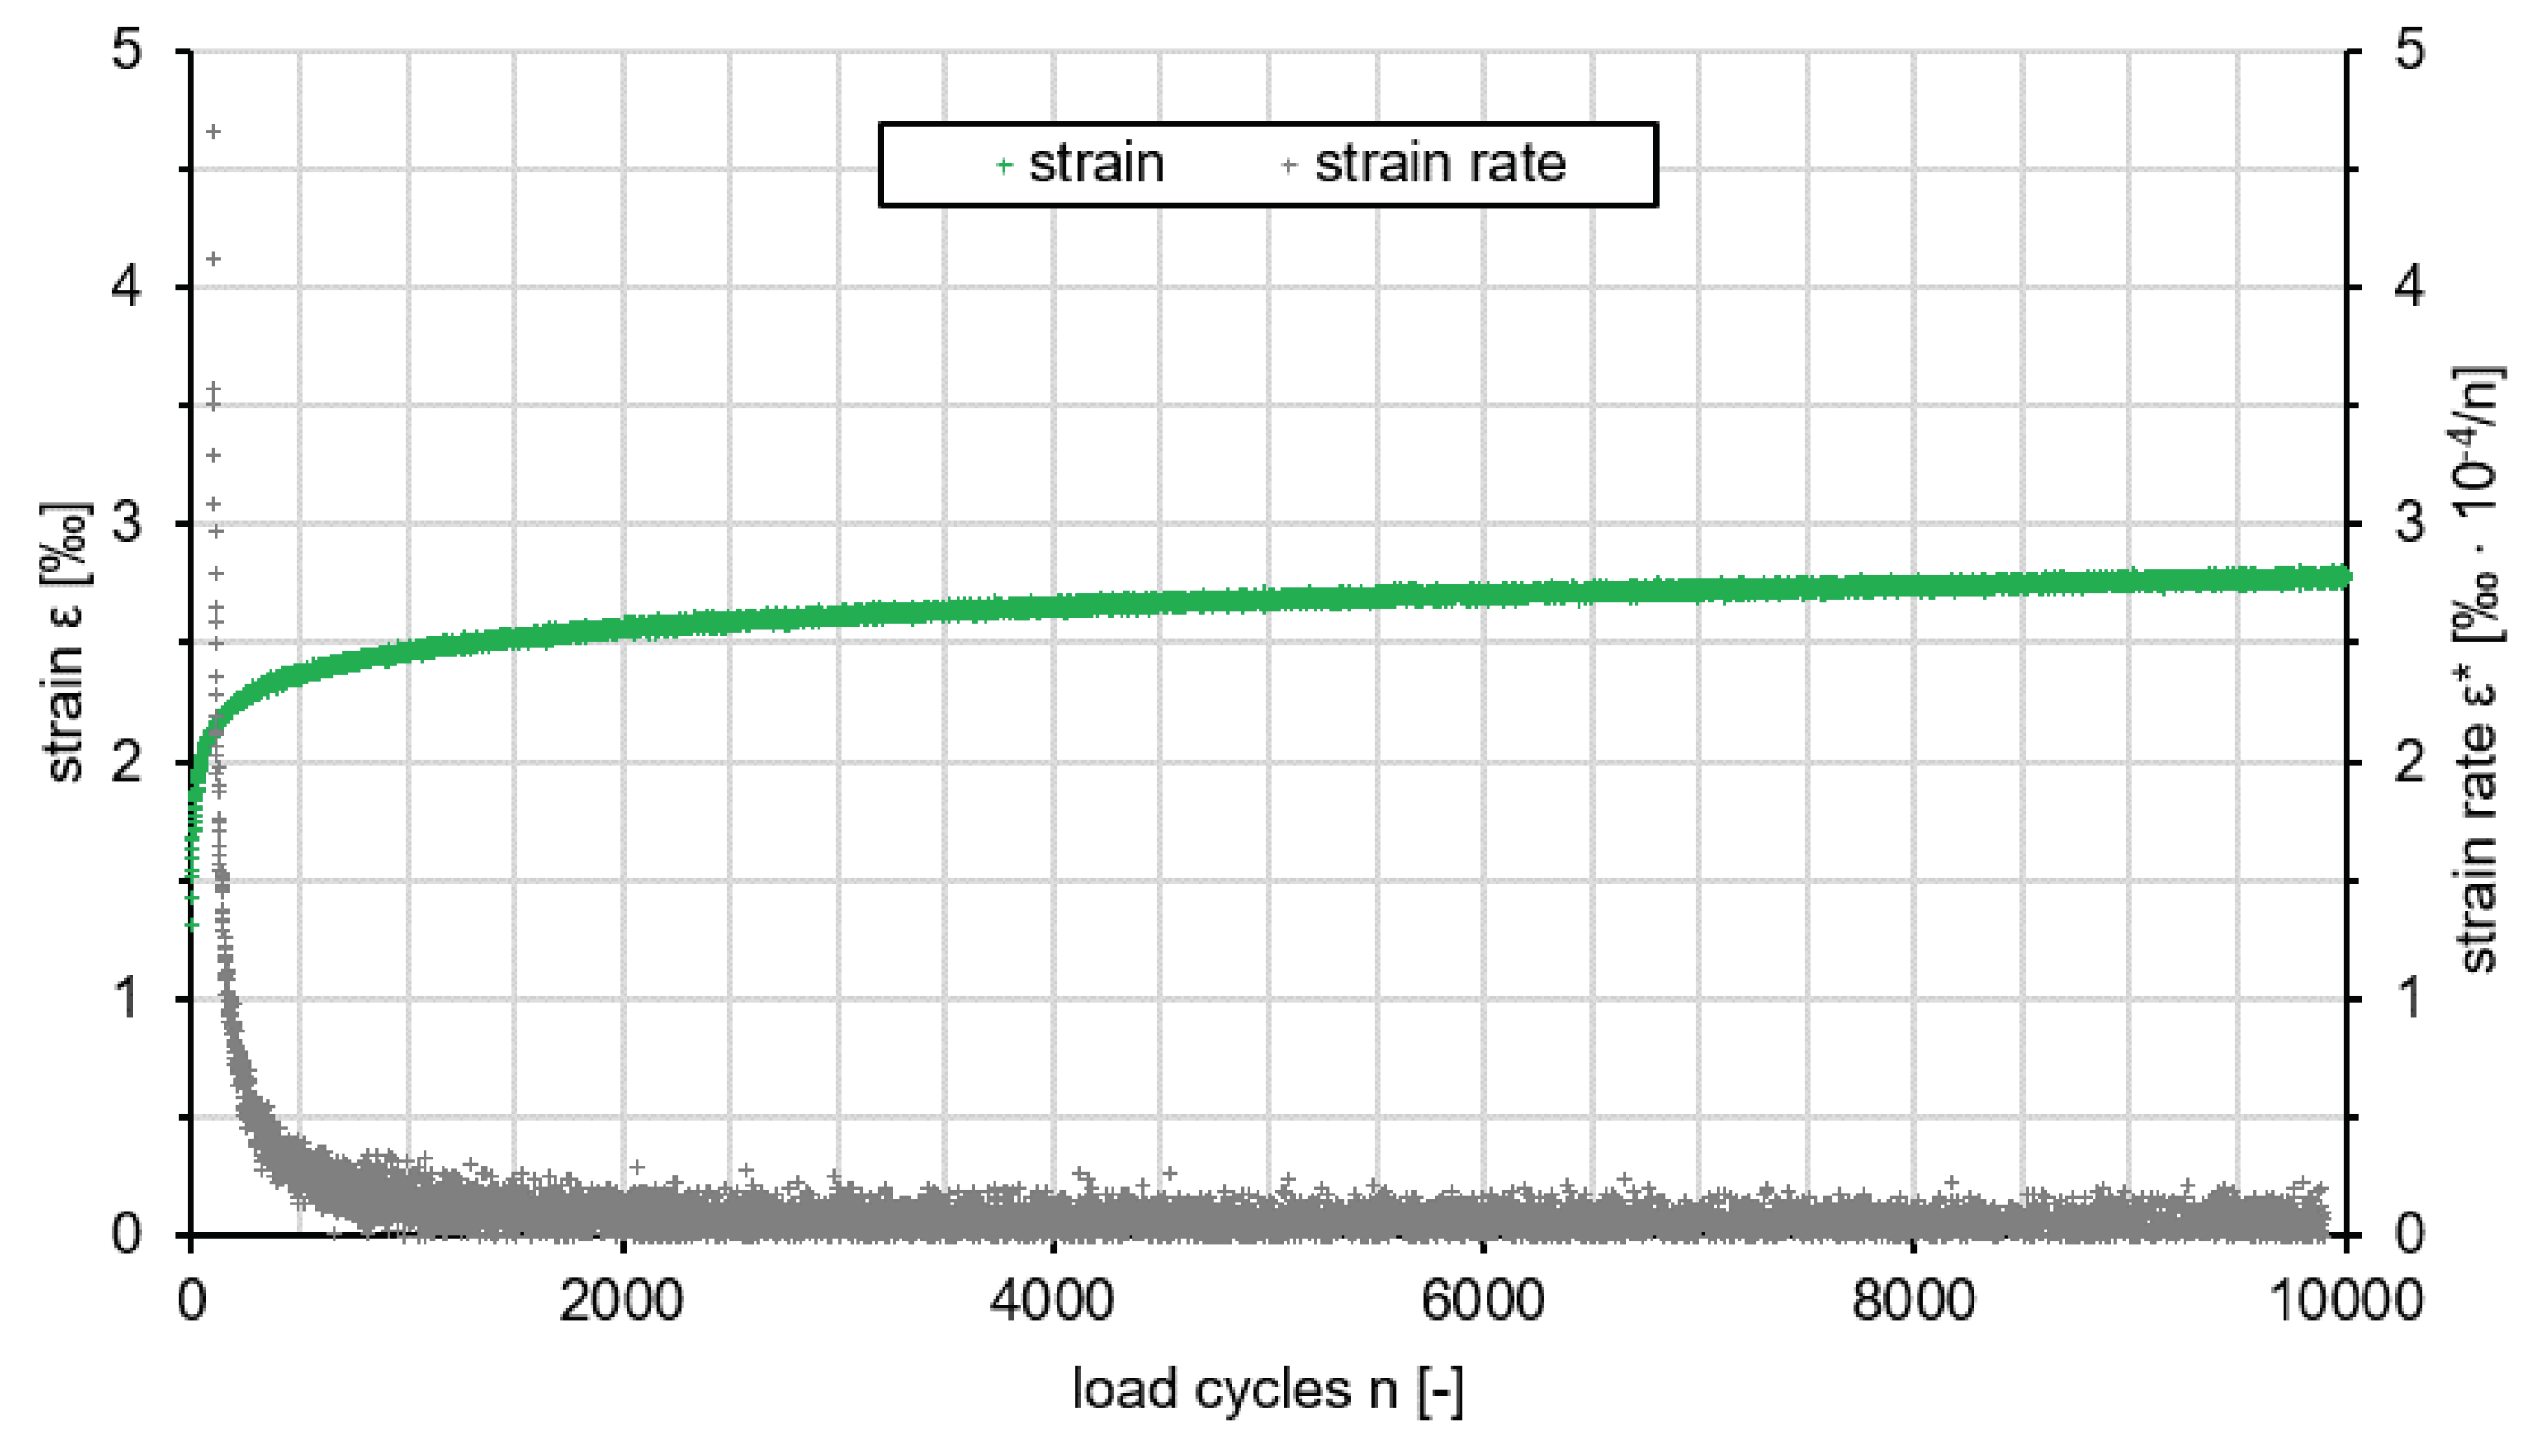
3.2.2. Deformation Resistance
Strain and strain rate of Var 5-7.5 are shown in
Figure 10 as a function of the load cycle. The strain of the variant has the typical course of a pulse creep curve without a turning point. There is no failure of the test specimens according to the recorded data. This was confirmed in the visual evaluation of the test specimen after loading, since no external damage was visible. After a stronger deformation at the beginning of the test, the strain rate decreases regressively (
‰
after load cycle 1000) and approaches asymptotically zero within the 10,000 load cycles (
‰
at the end of the test).
In comparison to reference variants PA 8 and PU-Var. B taken from [
25], Var 5-7.5 has an extremely high resistance to deformation. While the PA 8 with a deformation of 90.42‰reaches the turning point at 263 load cycles and fails after about 750 load cycles, the strain rate of the Var 5-7.5 at the same time is only 2.28‰. Also, the associated strain rate (PA 8: approx. 2.2‰
) is clearly lower with 0.569‰
. The tested PU-Var. B from [
25] seems to have a similar course as the Var. 5-7.5 tested in this study. There is no turning point during the 10,000 load cycles and an deformation of approximately 10‰is achieved. It fails after about 40,000 load cycles.
The resistant material behavior of Var 5-7.5 is mainly based on the use of the polyurethane binder. This will possibly be supported by the highly regenerable rubber granulate. The complete coating of the aggregates with polyurethane results in a monolithic structure despite the open-graded structure of the polyurethane asphalt mix. The reduction of the strain rate over the increasing number of load cycles can be attributed to the fact that no binder-induced creep occurs with polyurethane-bound aggregates and that the test specimen can only be damaged due to higher loads. A modification (increased loads) has been made by [
25] for this case to cause the material to fail. This has not been applied to the present material, yet.
In conclusion, it can be stated that the deformation properties of the investigated Var 5-7.5 proved to be very good. Compared to an porous asphalt PA 8, there is very little deformation.
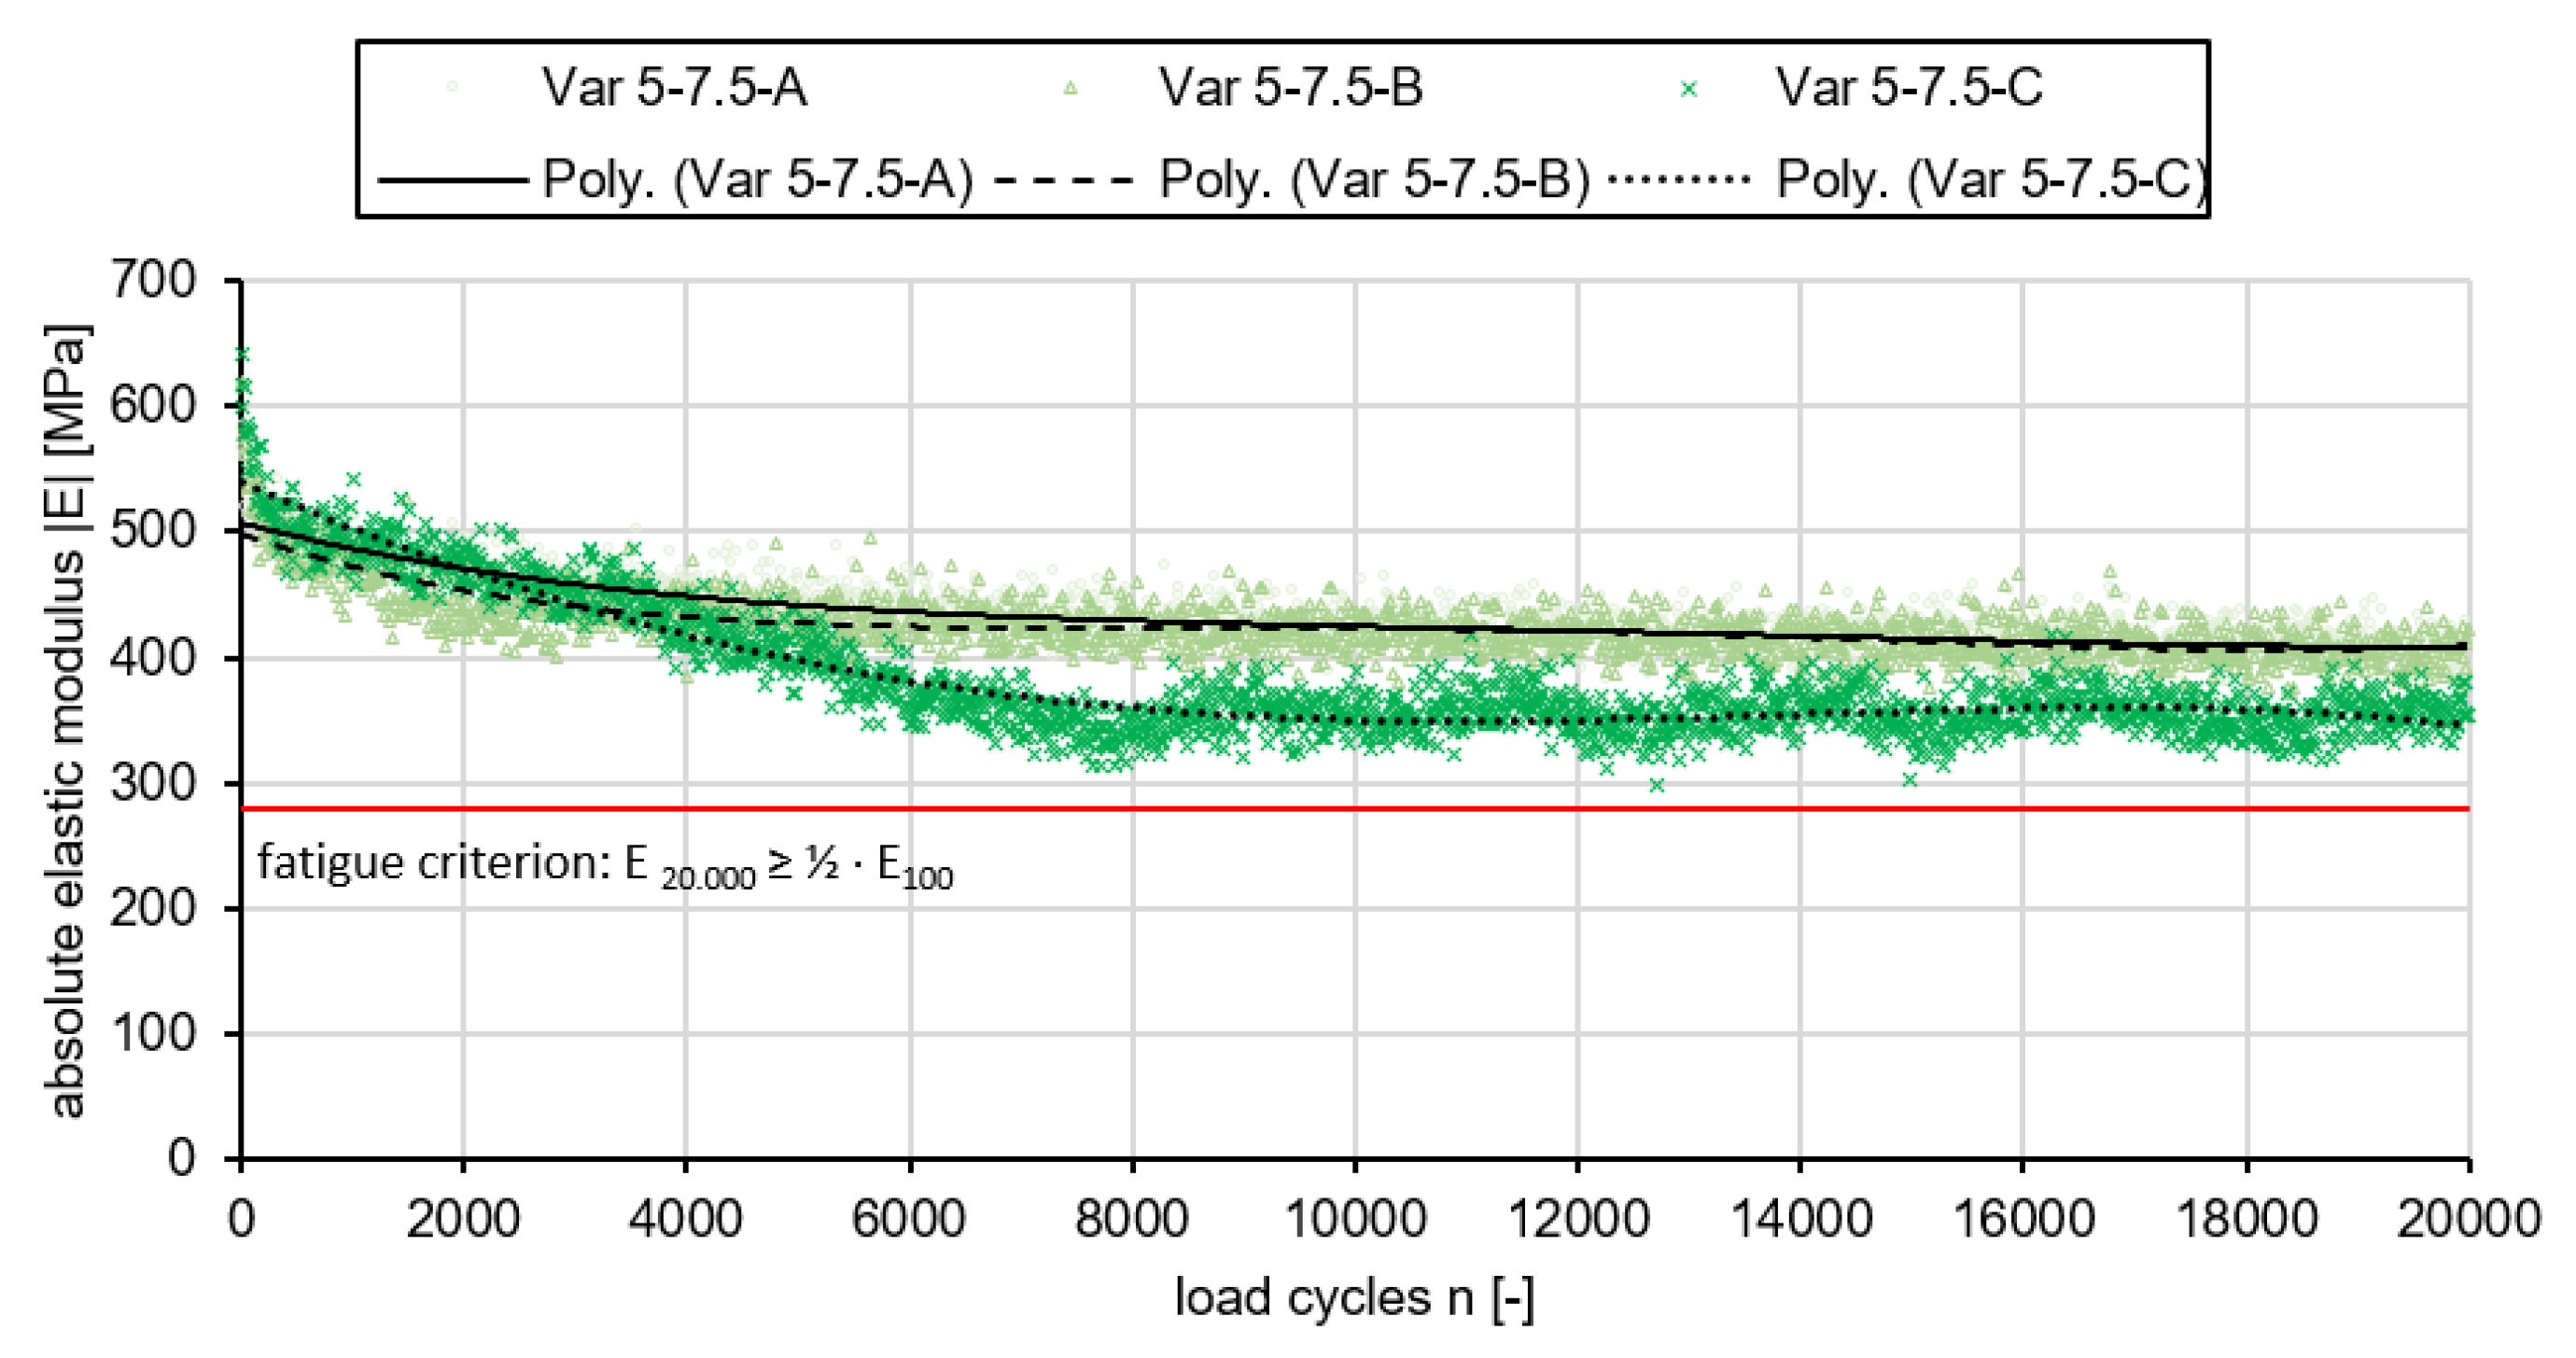
3.2.3. Results of the Three Point Bending Test
Following, the results of the three point bending test are shown in
Figure 11. Three tests on the same polyurethane asphalt mix have been conducted. Looking at them, it is visible that two of the three (A and B) have an almost same course, while Var 5-7.5-C differs slightly. First, the absolute elastic modulus of the test specimens drops sharply to a relatively constant level and shows hardly any fatigue in the course of time. At Var 5-7.5-C, the elastic modulus sinks slightly longer until it also stabilizes at a certain level.
The fatigue test results are also shown in
Table 3. A specimen is considered fatigued when the stiffness
, which decreases over the period of loading, drops to half the initial stiffness. The initial stiffness is the stiffness recorded at the 100th load cycle. The load cycle at which fatigue occurs is important for evaluation in order to draw a comparison of fatigue times between different mixes. For the evaluation a mean value of all tested variants (A, B and C) was taken as a basis. Compared to the initial stiffness after 100 load cycles, which at 537 MPa is significantly lower than that of the PU-Var. B (
MPa) of [
25], there is only a slight decrease in stiffness over the further load cycles. After 20,000 load cycles, the mean stiffness of all tested variants is 386.1 MPa and thus still corresponds to 72% of the initial stiffness
. No external damage or cracking could be observed on the test specimens after the end of the test.
The number of load cycles at which the value of the elastic modulus assumes half of its initial value cannot be determined, since the tests were terminated after the 20,000 load cycles, in accordance with the test procedure of the DIN standard.
In summary, it can be said that the newly developed material Var 5-7.5 has a fundamentally lower elastic modulus compared to other mix variants ([
25,
28]). However, the variant is characterised by its partial elasticity, which has decreased only slightly over the course of the tests carried out. Fatigue that occurred with other polyurethane-bound variants of [
25] was not achieved by the variants tested in this study, although the test conditions adapted to the material were applied. Accordingly, the material has good fatigue resistance and is suitable for use in transport infrastructure.
3.2.4. Results of the Uniaxial Tensions Stress Test and the Thermal Stress Restrained Specimen Test
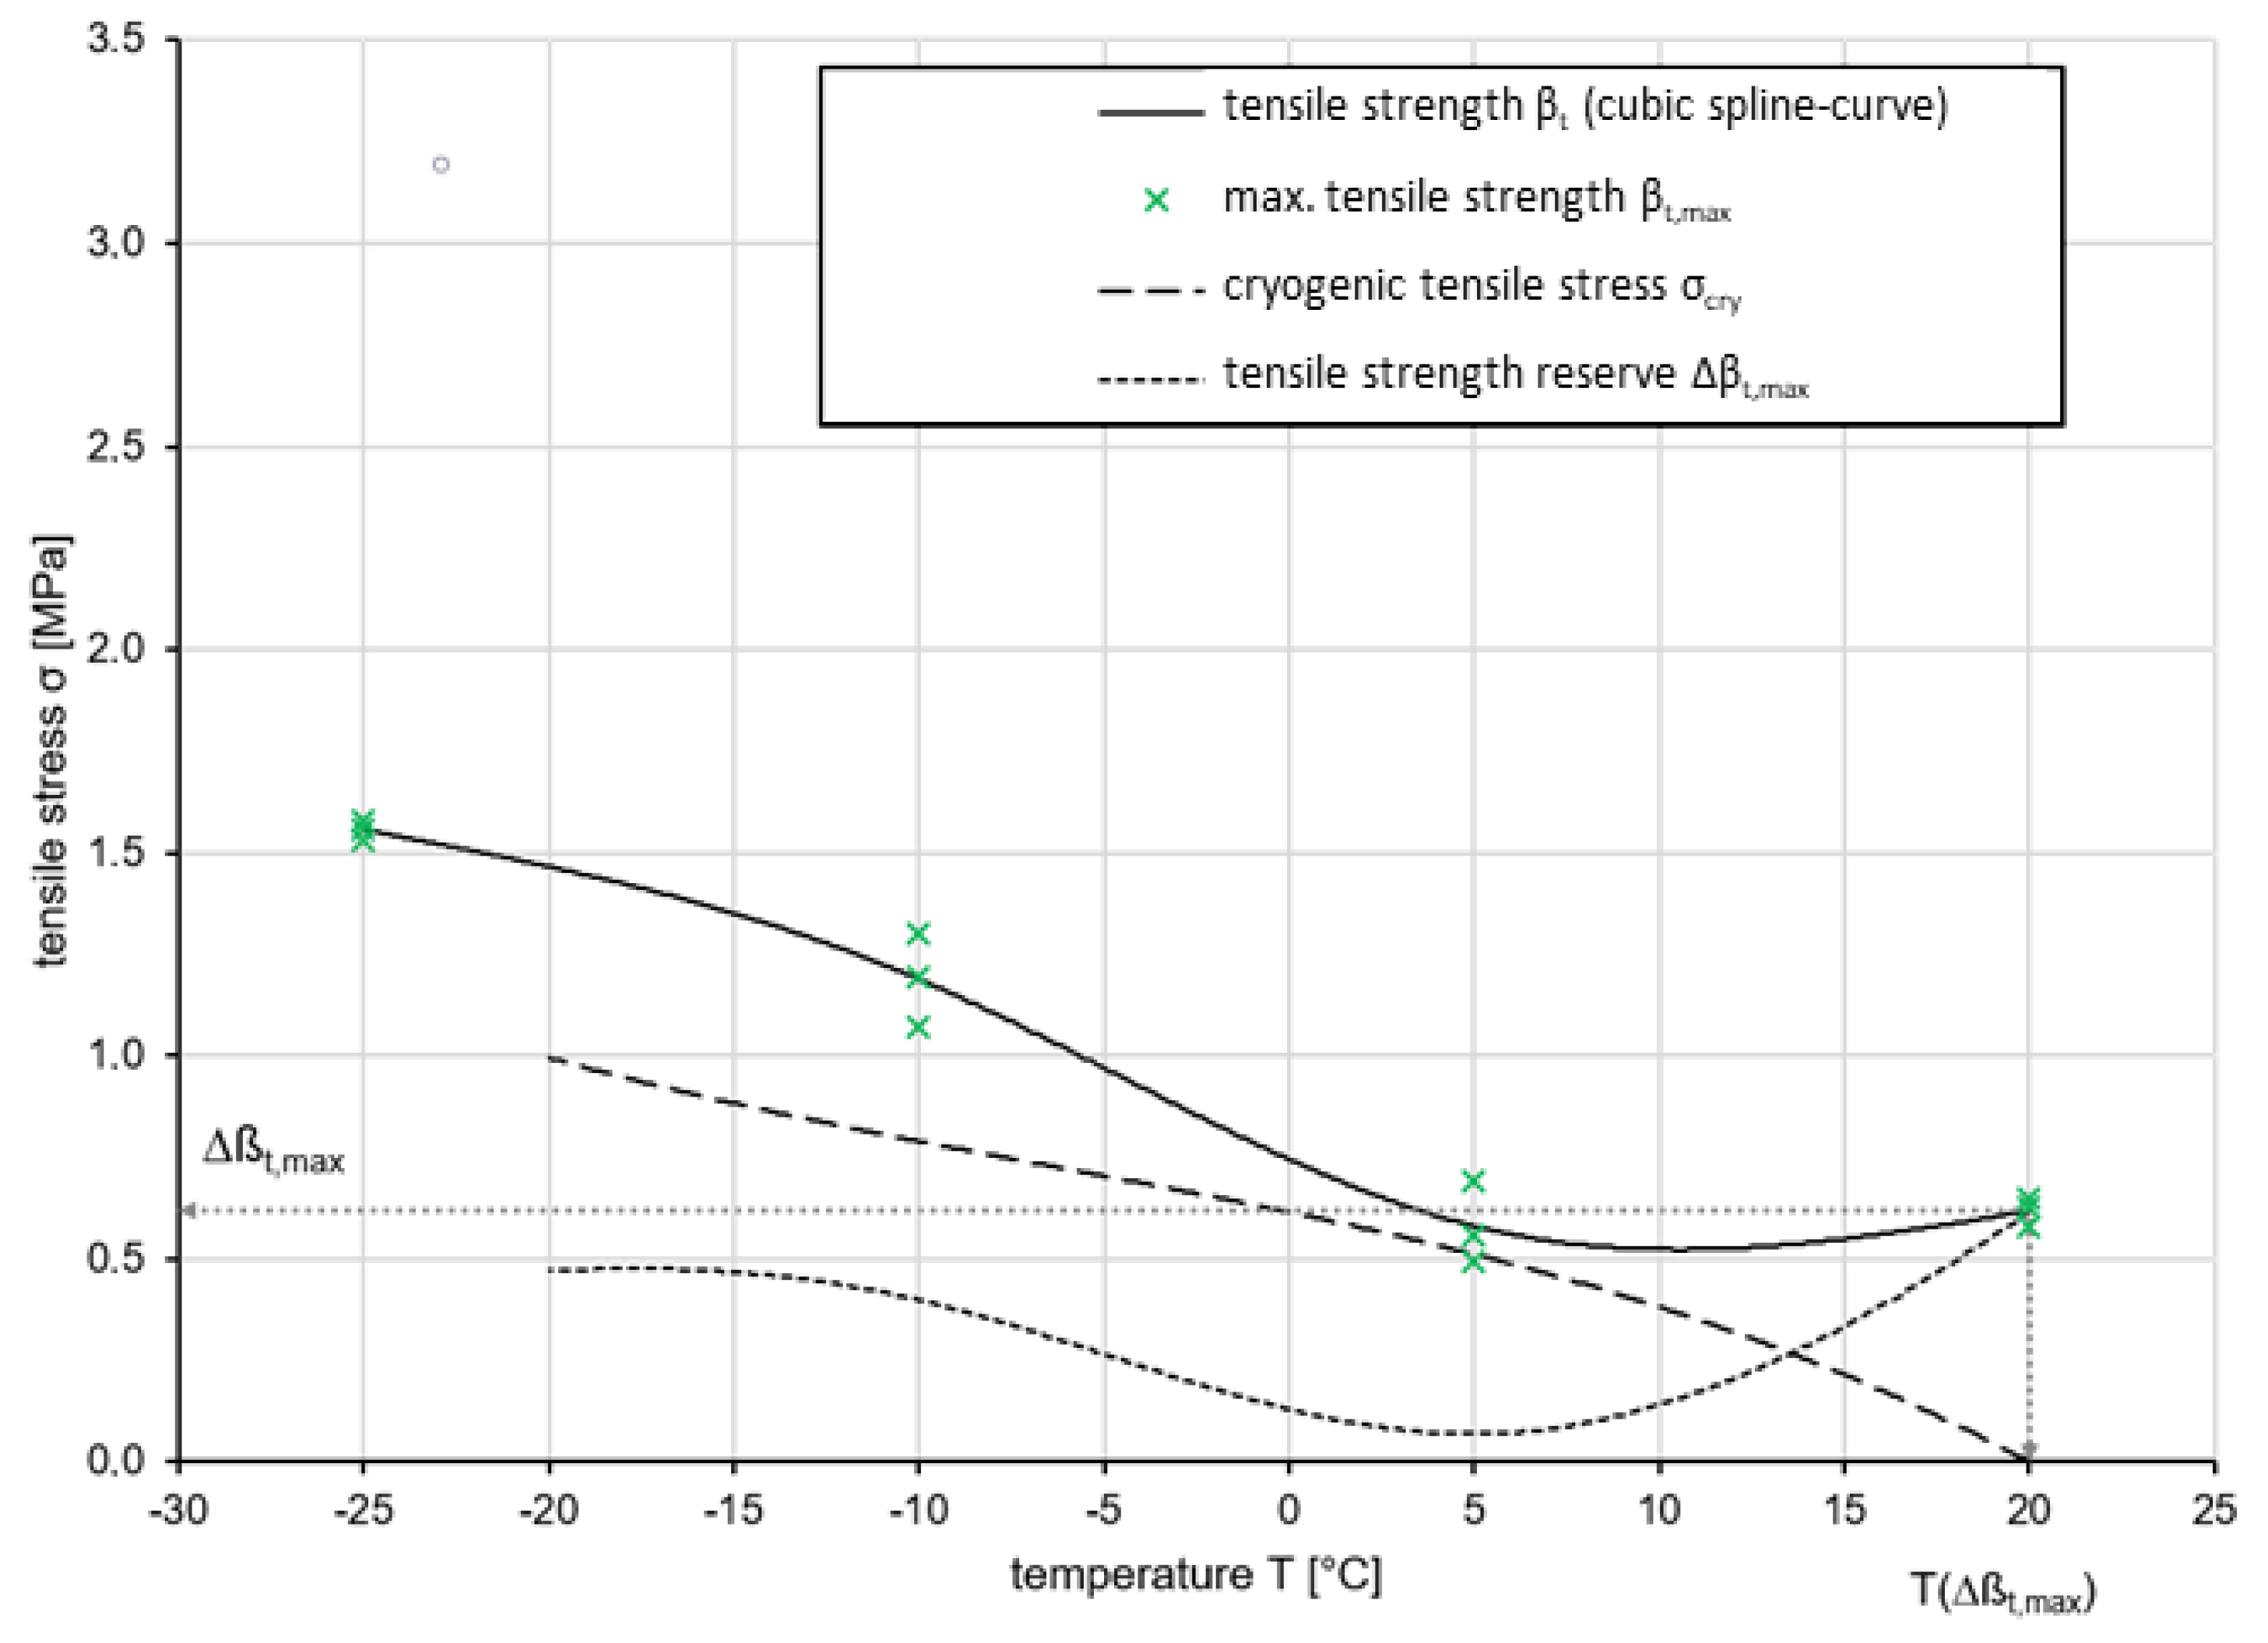
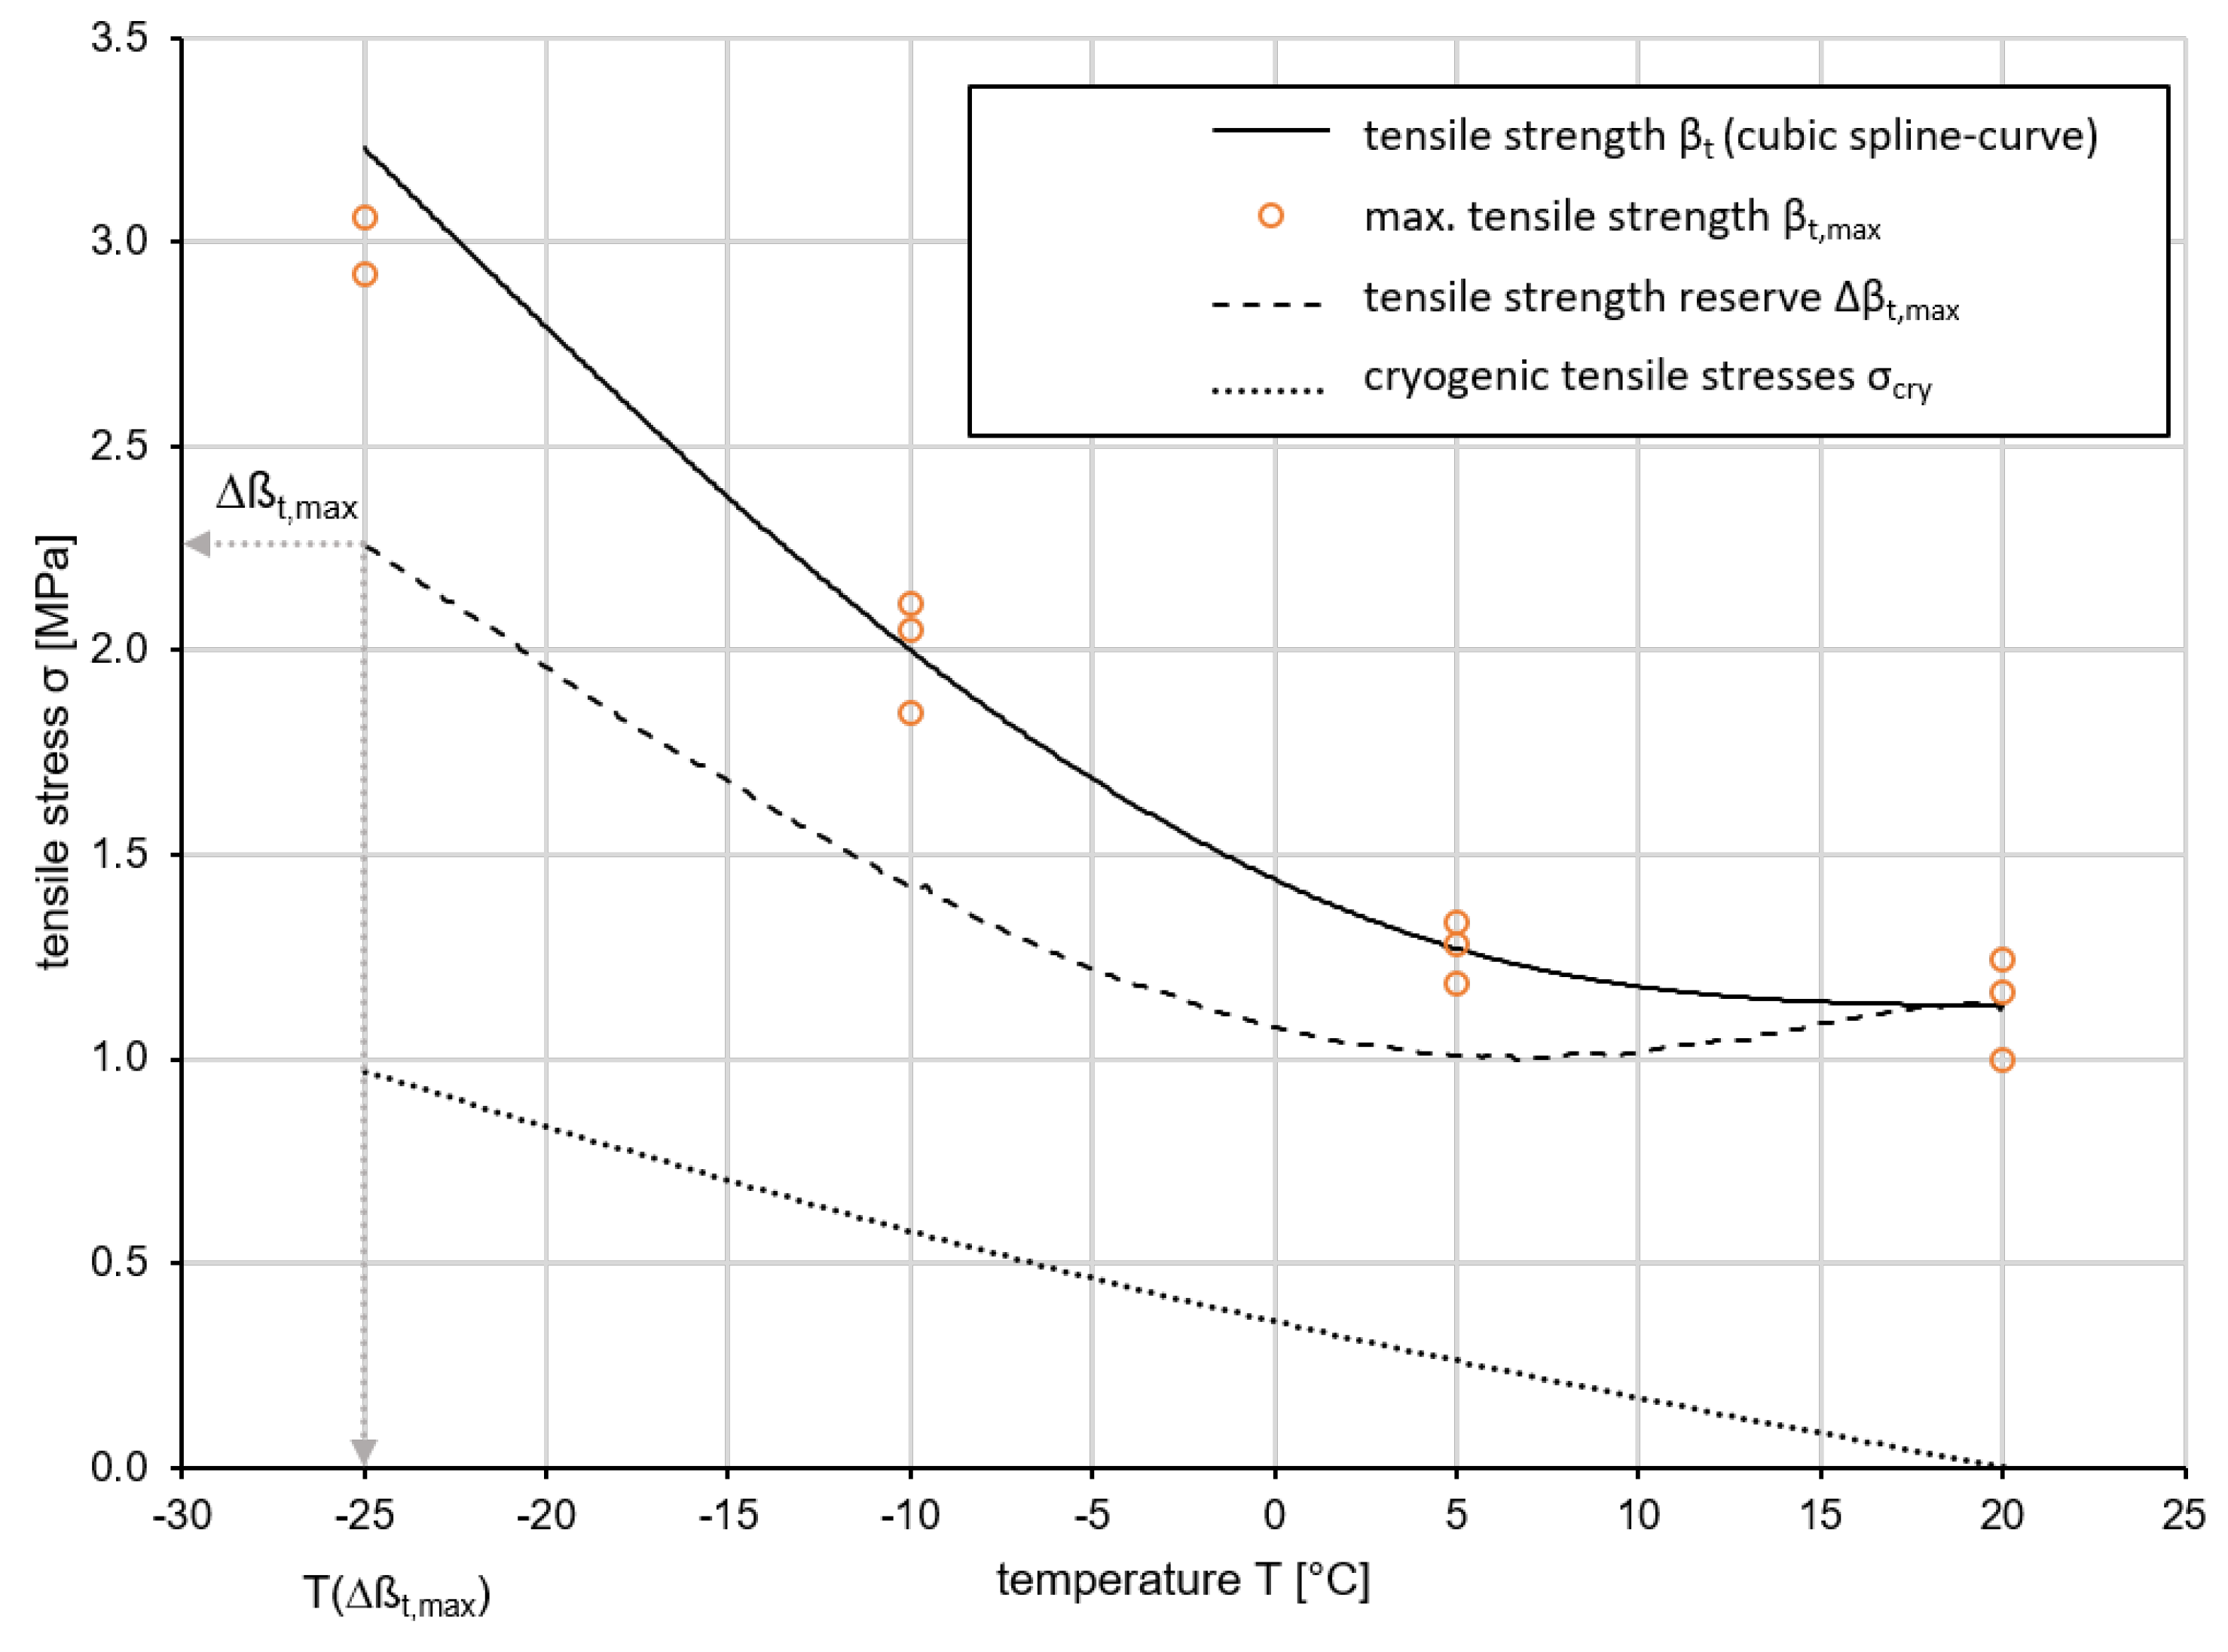
To evaluate the low-temperature behavior of asphalts, a combined evaluation of UTST and TSRST is performed. The maximum tensile stresses are plotted on a cubic spline curve in a diagram as a function of temperature. The curve of thermal stresses of the material is integrated in the same diagram in order to determine the tensile strength reserve from the difference between the two curves.
The cryogenic behavior of Var 5-7.5 is shown in
Figure 12. It can be seen that the cryogenic tensile stress has its maximum of 0.62 MPa (
) at 20
C, reaches a minimum at lower temperatures (
(5
C) = 0.06 MPa) and rises again to
(−17.7
C) = 0.48 MPa. The tensile strength reserve
resulting from the difference between the two input variables increases to 0.52 MPa at 5
C and doubles to −20
C (0.99 MPa).
It can be seen that the cryogenic tensile stress increases to 0.52 MPa at 5 C and doubles to −20 C (0.99 MPa). Its function has an initially degressive and then linear course. The tensile strength reserve resulting from the difference between the two input variables has its maximum of 0.62 MPa () at 20 C, reaches a minimum at lower temperatures ((5 C) = 0.06 MPa) and rises again to (−17.7 C) = 0.48 MPa.
On the basis of the measurement results, the low temperature behavior of Var 5-7.5 can be assessed as inadequate. Even at a temperature drop to 5 C, the tensile strength reserve for absorbing mechanogenic, i.e., traffic load-related tensile stresses drops to a critical level of 0.06 MPa. The tensile strength, which remains unchanged at this temperature, contrasts with increasing cryogenic stresses.
Therefore, the material has been modified in terms of its binder content. The polyurethane content would be increased from 6% by volume (2.2% by weight) to 13% per volume (5% by weight). This binder content was determined to be optimal in studies which tested several amounts of binder at low temperatures and it was determined in the study of [
25] as well. An increase in the binder content considerably increases the tensile strength of the material, but prospectively does not limit its deformation and durability behavior, as the polyurethane-film merely wraps around the aggregate to form a monolithic system. Excess material concentrates at the bottom of the specimen.
Probably the monolithic structure at Var 5-7.5 was not completely formed, so that there were unglued areas in the aggregate structure. This circumstance could now be counteracted. Performance in terms of deformation and durability on the adjusted mixture should continue to be consistent if not better.
The low temperature behavior of Var 5-7.5-T is shown in
Figure 13. In contrast to Var 5-7.5, Var 5-7.5-T has a significant higher tensile reserve, which is due to the high tensile strength of the material. By increasing the binding agent, the material can be compared with conventional asphalts and classified in an appropriate range.
A comparison of the variants from [
25] with the characteristic values for low temperature behavior is made using the
Table 4. The maximum tensile strength reserve and the corresponding temperature were used for the evaluation.
Var 5-7.5-T does not achieve higher tensile forces in the low temperature range than the polyurethane variant of [
25] or the SMA 11 S [
25]. However, the maximum tensile strength reserve values of the materials tested in this study occur at completely different temperatures. Especially cryogenic stresses decrease with increasing temperature. A difference to the PU-Var. A of [
25] is the used crumb rubber and the elastified polyurethane in Var 5-7.5 and Var 5-7.5-T, which leads to a more elastified construction and thus, to lower tensile strength. A course that is common in conventional asphalt cannot be determined in the presented results. It should be noted that the low-temperature behavior of the comparative values was investigated by different testing institutes (University of Siegen and asphalt-labor, Arno J. Hinrichsen GmbH & Co.) and that therefore identical test conditions cannot be guaranteed.


