New Polyphenol-Containing LDL Nano-Preparations in Oxidative Stress and DNA Damage: A Potential Route for Cell-Targeted PP Delivery


Abstract
:1. Introduction
2. Materials and Methods
2.1. Materials
2.2. Isolation and Purification of LDL
2.3. DLS Particle Size Measurement
2.4. Cell Culture Conditions
2.5. Neutral Red Uptake (NRU) Assay of Cell Metabolic Activity
2.6. Determination of the Level of Reactive Oxygen Species in a 2780 Human Ovarian Cancer Cells
2.7. DiL Staining of Lipoproteins
2.8. LDL Binding Assay
2.9. Plasmid Nicking Assay
3. Results
3.1. Influence of PP Saturation on the Size of the LDL Particle
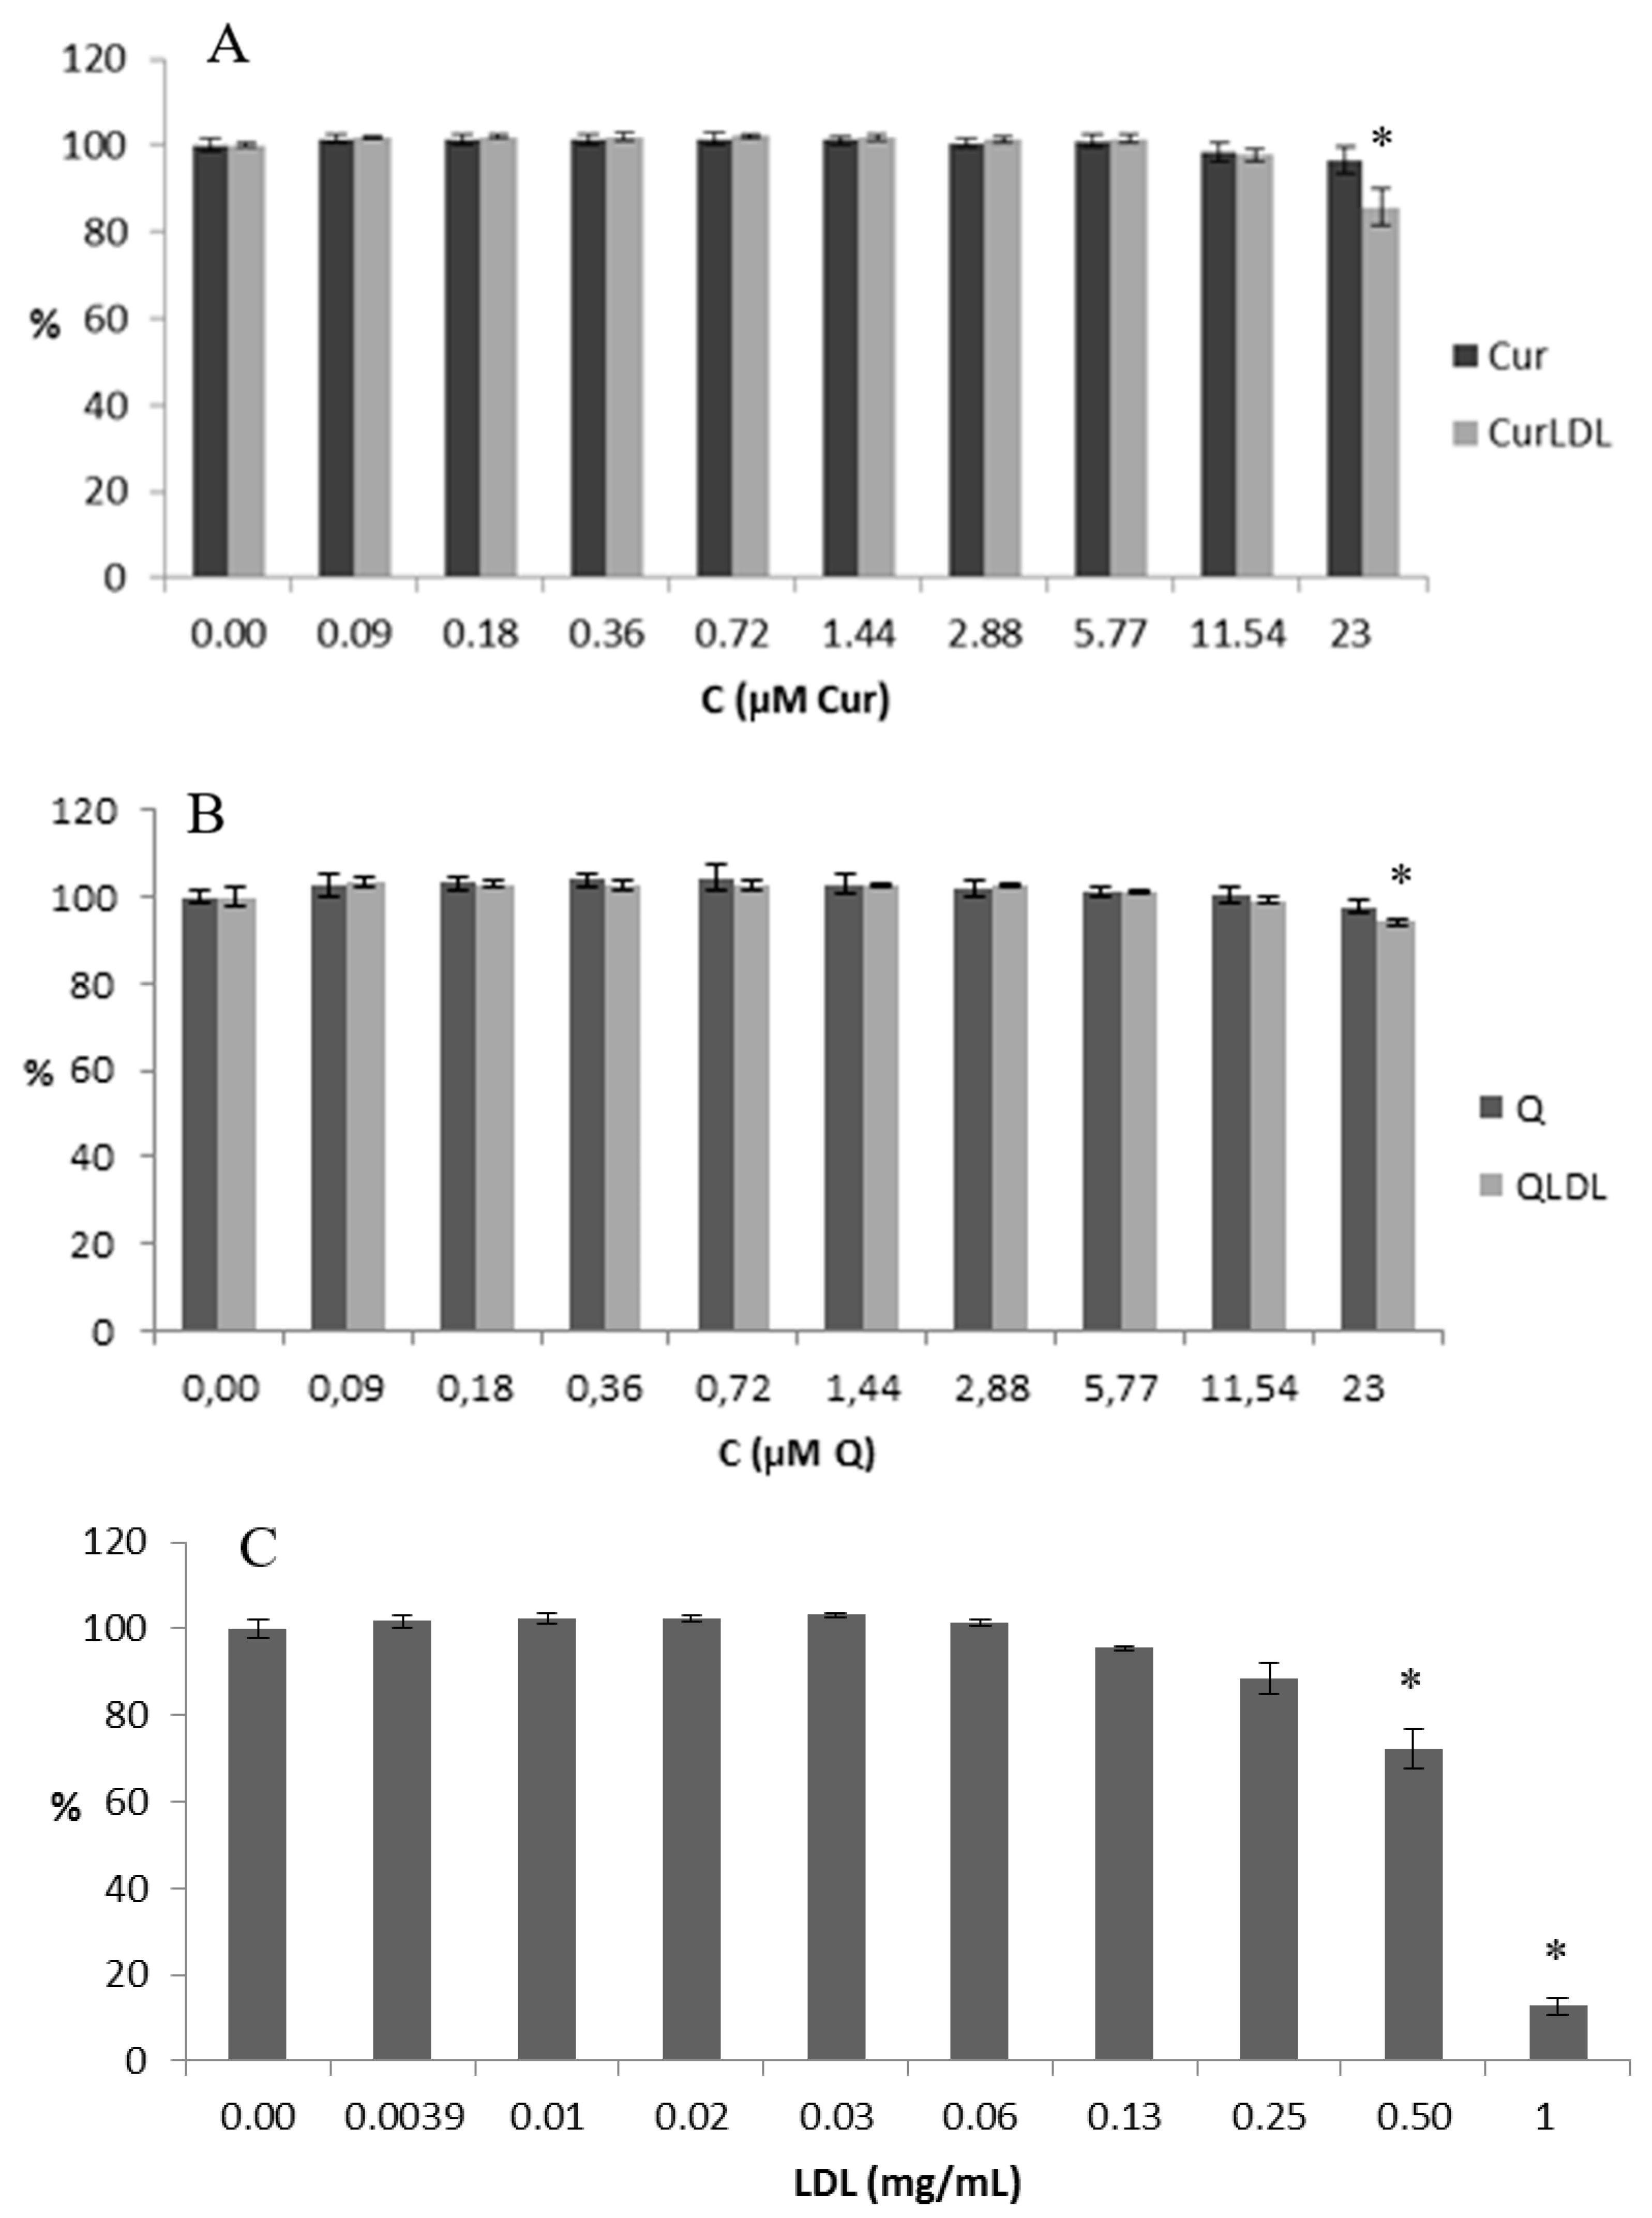
3.2. Toxicity
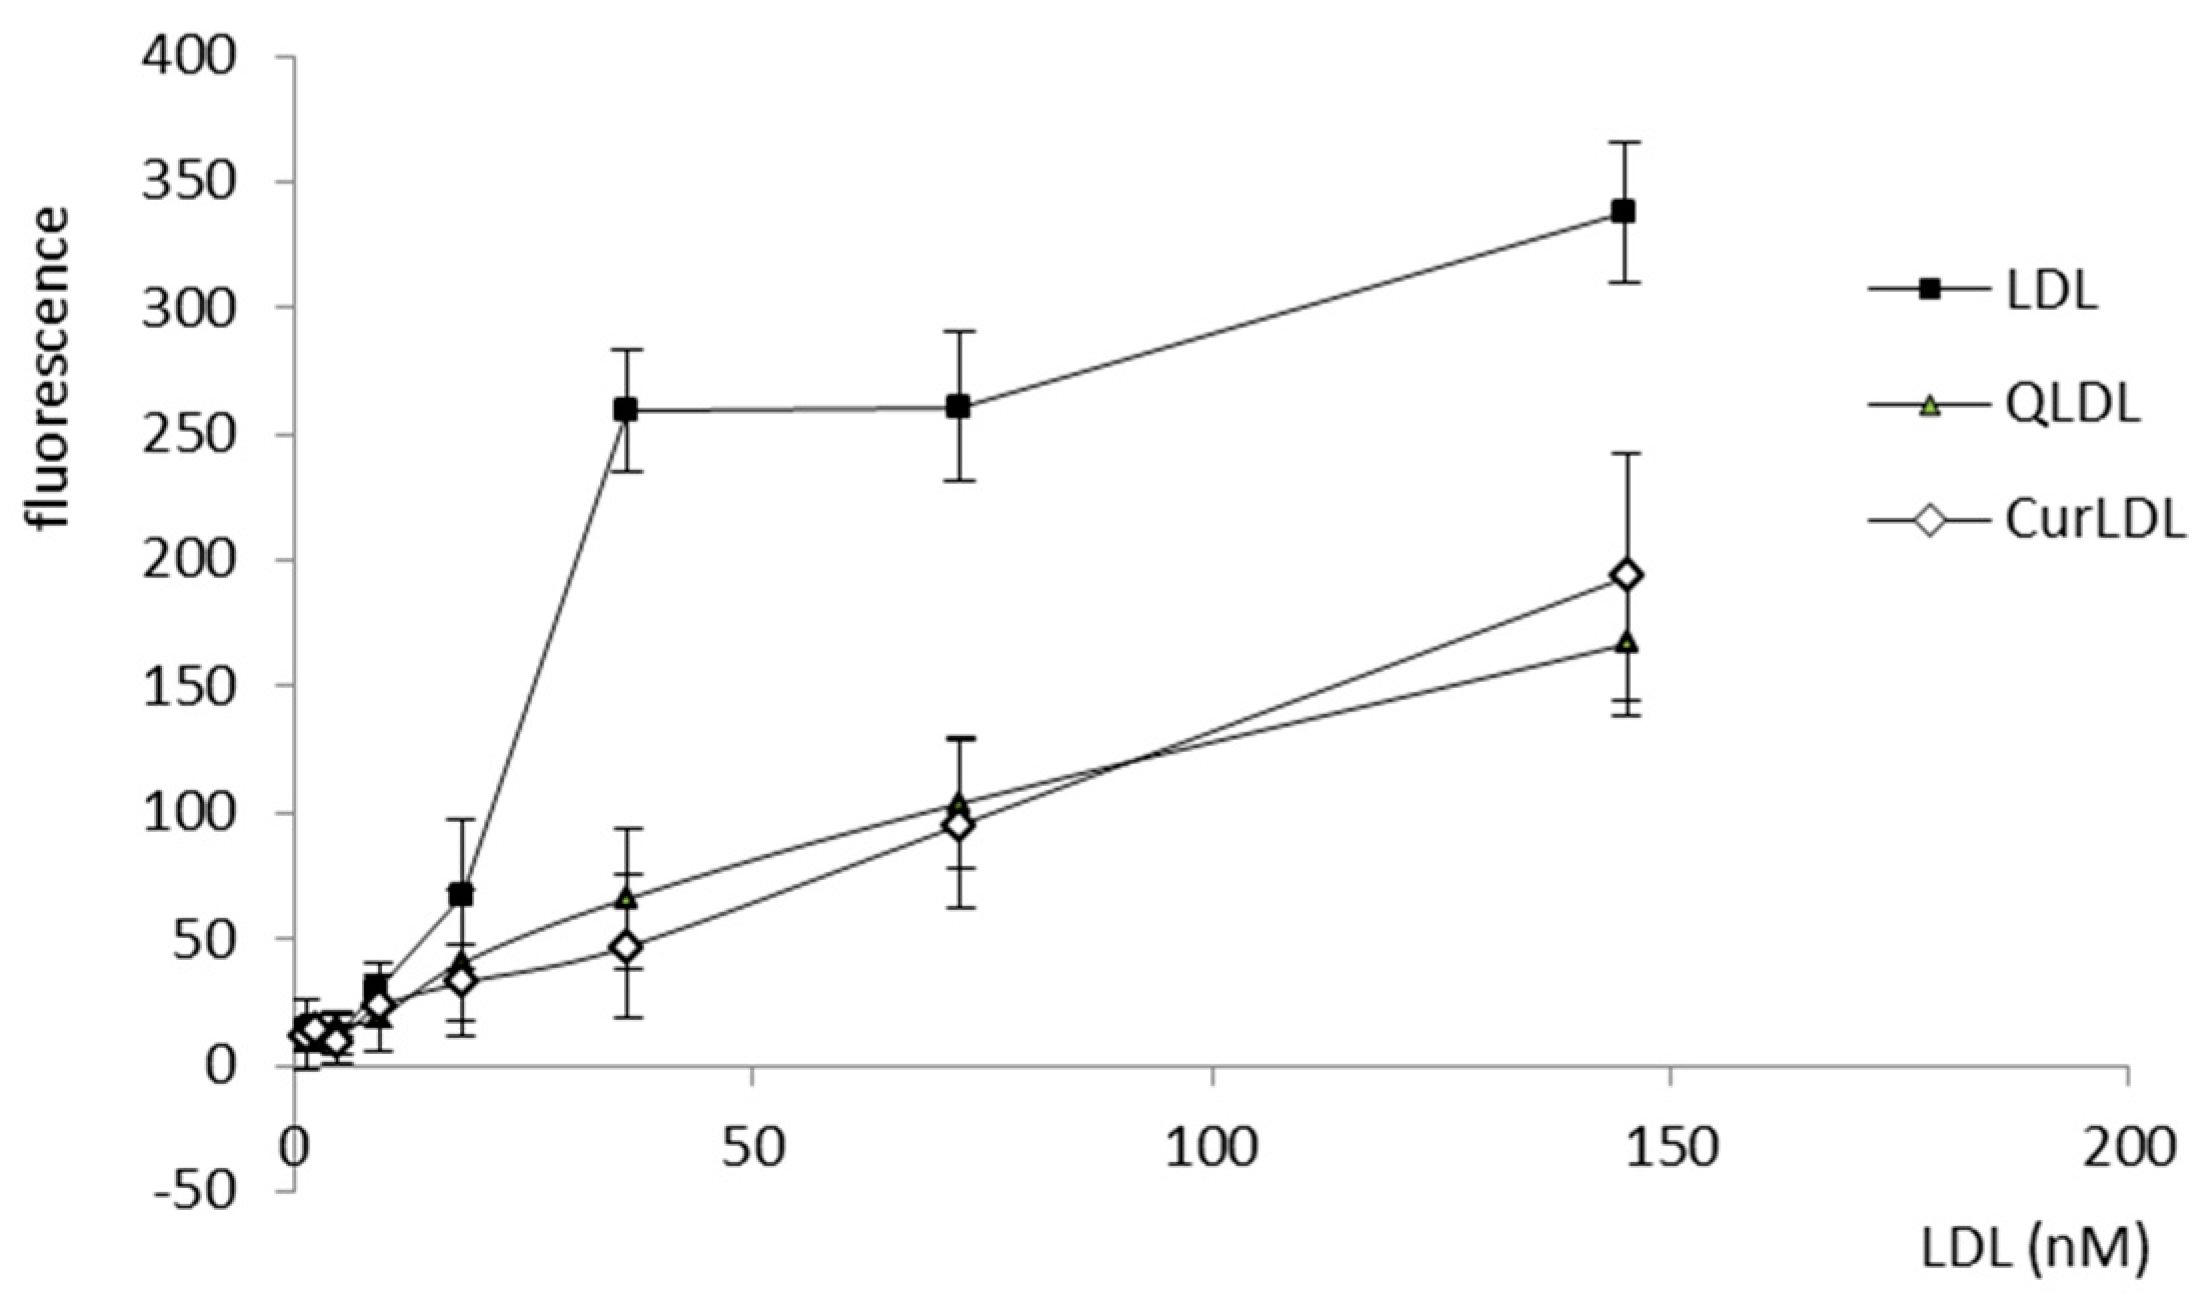
3.3. LDL Binding Affinity Test
3.4. The Level of the Reactive Oxygen Species
3.5. Plasmid Nicking Assay
4. Discussion
5. Conclusions
Supplementary Materials
Author Contributions
Funding
Conflicts of Interest
References
- Kalinowska, M.; Bielawska, A.; Lewandowska-Siwkiewicz, H.; Priebe, W.; Lewandowski, W. Apples: Content of phenolic compounds vs. variety, part of apple and cultivation model, extraction of phenolic compounds, biological properties. Plant Physiol. Biochem. 2014, 84, 169–188. [Google Scholar] [CrossRef] [PubMed]
- Nelson, K.M.; Dahlin, J.L.; Bisson, J.; Graham, J.; Pauli, G.F.; Walters, M.A. The Essential Medicinal Chemistry of Curcumin: Miniperspective. J. Med. Chem. 2017, 60, 1620–1637. [Google Scholar] [CrossRef] [PubMed]
- Tangney, C.C.; Rasmussen, H.E. Polyphenols, inflammation, and cardiovascular disease. Curr. Atheroscler. Rep. 2013, 15, 324. [Google Scholar] [CrossRef] [PubMed]
- Azqueta, A.; Collins, A. Polyphenols and DNA damage: A mixed blessing. Nutrients 2016, 8, 785. [Google Scholar] [CrossRef]
- Martin, K.R.; Appel, C.L. Polyphenols as dietary supplements: A double-edged sword. Nutr. Diet. Suppl. 2009, 2, 1–12. [Google Scholar] [CrossRef] [Green Version]
- Salehi, B.; Mishra, A.; Nigam, M.; Sener, B.; Kilic, M.; Sharifi-Rad, M.; Fokou, P.; Martins, N.; Sharifi-Rad, J. Resveratrol: A double-edged sword in health benefits. Biomedicines 2018, 6, 91. [Google Scholar] [CrossRef] [Green Version]
- Lewandowska, H.; Kalinowska, M.; Lewandowski, W.; Stępkowski, T.M.; Brzóska, K. The role of natural polyphenols in cell signaling and cytoprotection against cancer development. J. Nutr. Biochem. 2016, 32, 1–19. [Google Scholar] [CrossRef]
- Wei, H.; Zhang, X.; Zhao, J.-F.; Wang, Z.-Y.; Bickers, D.; Lebwohl, M. Scavenging of hydrogen peroxide and inhibition of ultraviolet light-induced oxidative DNA damage by aqueous extracts from green and black teas. Free Radic. Biol. Med. 1999, 26, 1427–1435. [Google Scholar] [CrossRef]
- Leanderson, P.; Faresjö, Å.O.; Tagesson, C. Green tea polyphenols inhibit oxidant-induced DNA strand breakage in cultured lung cells. Free Radic. Biol. Med. 1997, 23, 235–242. [Google Scholar] [CrossRef]
- Nie, G.; Wei, T.; Shen, S.; Zhao, B. Polyphenol protection of DNA against damage. Methods Enzymol. 2001, 335, 232–244. [Google Scholar]
- Lewandowska, H.; Kalinowska, M. Genotoxicity studies of the effect of selected polyphenols on free radical-induced DNA damage. Annu. Rep. INCT. 2019, 53–55. [Google Scholar]
- Nguyen, T.T.H.; Si, J.; Kang, C.; Chung, B.; Chung, D.; Kim, D. Facile preparation of water soluble curcuminoids extracted from turmeric (Curcuma longa L.) powder by using steviol glucosides. Food Chem. 2017, 214, 366–373. [Google Scholar] [CrossRef] [PubMed] [Green Version]
- Feng, T.; Wei, Y.; Lee, R.J.; Zhao, L. Liposomal curcumin and its application in cancer. Int. J. Nanomed. 2017, 12, 6027–6044. [Google Scholar] [CrossRef] [PubMed] [Green Version]
- Yang, X.; Li, Z.; Wang, N.; Li, L.; Song, L.; He, T.; Sun, L.; Wang, Z.; Wu, Q.; Luo, N. Curcumin-encapsulated polymeric micelles suppress the development of colon cancer in vitro and in vivo. Sci. Rep. 2015, 5, 10322. [Google Scholar] [CrossRef]
- Maiti, K.; Mukherjee, K.; Gantait, A.; Saha, B.P.; Mukherjee, P.K. Curcumin–phospholipid complex: Preparation, therapeutic evaluation and pharmacokinetic study in rats. Int. J. Pharm. 2007, 330, 155–163. [Google Scholar] [CrossRef]
- Gera, M.; Sharma, N.; Ghosh, M.; Huynh, D.L.; Lee, S.J.; Min, T.; Kwon, T.; Jeong, D.K. Nanoformulations of curcumin: An emerging paradigm for improved remedial application. Oncotarget 2017, 8, 66680–66698. [Google Scholar] [CrossRef] [Green Version]
- Sasaki, H.; Sunagawa, Y.; Takahashi, K.; Imaizumi, A.; Fukuda, H.; Hashimoto, T.; Wada, H.; Katanasaka, Y.; Kakeya, H.; Fujita, M. Innovative preparation of curcumin for improved oral bioavailability. Biol. Pharm. Bull. 2011, 34, 660–665. [Google Scholar] [CrossRef] [Green Version]
- Maeda, H. The enhanced permeability and retention (EPR) effect in tumor vasculature: The key role of tumor-selective macromolecular drug targeting. Adv. Enzym. Regul. 2001, 41, 189–207. [Google Scholar] [CrossRef]
- Karpinska, J.; Świsłocka, R.; Lewandowski, W. A mystery of a cup of coffee; an insight look by chemist. BioFactors 2017, 43, 621–632. [Google Scholar] [CrossRef]
- Ay, M.; Charli, A.; Jin, H.; Anantharam, V.; Kanthasamy, A.; Kanthasamy, A.G. Quercetin. In Nutraceuticals; Elsevier: Amsterdam, The Netherlands, 2016; pp. 447–452. [Google Scholar]
- Hewlings, S.J.; Kalman, D.S. Curcumin: A Review of Its’ Effects on Human Health. Foods 2017, 6, 92. [Google Scholar] [CrossRef]
- Pajouhesh, H.; Lenz, G.R. Medicinal chemical properties of successful central nervous system drugs. NeuroRx 2005, 2, 541–553. [Google Scholar] [CrossRef] [PubMed] [Green Version]
- Ehrhardt, C.; Kim, K.-J. Drug Absorption Studies: In Situ, In Vitro and In Silico Models; Springer Science & Business Media: Berlin, Germany, 2007; ISBN 0-387-74901-2. [Google Scholar]
- Abraxane (Paclitaxel Protein-Bound Particles for Injectable Suspension). Available online: https://www.centerwatch.com/directories/1067-fda-approved-drugs/listing/3061-abraxane-paclitaxel-protein-bound-particles-for-injectable-suspension (accessed on 24 January 2020).
- Doxil (Doxorubicin HCl Liposome Injection). Available online: https://www.centerwatch.com/directories/1067-fda-approved-drugs/listing/3407-doxil-doxorubicin-hcl-liposome-injection (accessed on 24 January 2020).
- Havel, R.J.; Eder, H.A.; Bragdon, J.H. The distribution and chemical composition of ultracentrifugally separated lipoproteins in human serum. J. Clin. Investig. 1955, 34, 1345–1353. [Google Scholar] [CrossRef] [PubMed] [Green Version]
- Waterborg, J.H. The Lowry method for protein quantitation. In The Protein Protocols Handbook; Humana Press: Totowa, NJ, USA, 2009; pp. 7–10. [Google Scholar]
- Quitschke, W.W. Differential solubility of curcuminoids in serum and albumin solutions: Implications for analytical and therapeutic applications. BMC Biotechnol. 2008, 8, 84. [Google Scholar] [CrossRef] [PubMed] [Green Version]
- Lyczko, K.; Lyczko, M.; Meczynska-Wielgosz, S.; Kruszewski, M.; Mieczkowski, J. Tricarbonylrhenium(I) complexes with the N,6-dimethylpyridine-2-carbothioamide ligand: Combined experimental and calculation studies. J. Coord. Chem. 2018, 71, 2146–2164. [Google Scholar] [CrossRef]
- Kapka-Skrzypczak, L.; Męczyńska-Wielgosz, S.; Matysiak-Kucharek, M.; Czajka, M.; Sawicki, K.; Kruszewski, M.; Brzóska, K. Nuclear Factor kappa B activation by Ag, Au nanoparticles, CdTe quantum dots or their binary mixtures in HepG2 cells. Ann. Agric. Environ. Med. 2020, 27, 231–234. [Google Scholar] [CrossRef] [PubMed]
- Grzelak, A.; Wojewódzka, M.; Meczynska-Wielgosz, S.; Zuberek, M.; Wojciechowska, D.; Kruszewski, M. Crucial role of chelatable iron in silver nanoparticles induced DNA damage and cytotoxicity. Redox Biol. 2018, 15, 435–440. [Google Scholar] [CrossRef]
- Balaiya, S.; Chalam, K. An In Vitro Assay to Quantify Nitrosative Component of Oxidative Stress. J. Mol. Genet. Med. 2014, 8, 120. [Google Scholar]
- Stemmer, U.; Ramprecht, C.; Zenzmaier, E.; Stojčić, B.; Rechberger, G.; Kollroser, M.; Hermetter, A. Uptake and protein targeting of fluorescent oxidized phospholipids in cultured RAW 264.7 macrophages. Biochim. Biophys. Acta (BBA)-Mol. Cell Biol. Lipids 2012, 1821, 706–718. [Google Scholar] [CrossRef] [Green Version]
- Lewandowska, H.; Męczyńska-Wielgosz, S.; Sikorska, K.; Sadło, J.; Dudek, J.; Kruszewski, M. LDL dinitrosyl iron complex: A new transferrin-independent route for iron delivery in hepatocytes. BioFactors 2018, 44, 192–201. [Google Scholar] [CrossRef]
- Pruszynski, M.; Koumarianou, E.; Vaidyanathan, G.; Revets, H.; Devoogdt, N.; Lahoutte, T.; Zalutsky, M.R. Targeting breast carcinoma with radioiodinated anti-HER2 Nanobody. Nucl. Med. Biol. 2013, 40, 52–59. [Google Scholar] [CrossRef] [Green Version]
- Schmidt, T.; Friehs, K.; Schleef, M.; Voss, C.; Flaschel, E. Quantitative analysis of plasmid forms by agarose and capillary gel electrophoresis. Anal. Biochem. 1999, 274, 235–240. [Google Scholar] [CrossRef] [PubMed]
- Sagripant, J.; Kraemer, K. Site-specific oxidative DNA damage at polyguanosines produced by copper plus hydrogen peroxide. J. Biol. Chem. 1989, 264, 1729–1734. [Google Scholar]
- Repetto, G.; Del Peso, A.; Zurita, J.L. Neutral red uptake assay for the estimation of cell viability/cytotoxicity. Nat. Protoc. 2008, 3, 1125. [Google Scholar] [CrossRef] [PubMed]
- Lewandowska, H.; Stępkowski, T.M.; Męczyńska-Wielgosz, S.; Sikorska, K.; Sadło, J.; Dudek, J.; Kruszewski, M. LDL dinitrosyl iron complex acts as an iron donor in mouse macrophages. J. Inorg. Biochem. 2018, 188, 29–37. [Google Scholar] [CrossRef] [PubMed]
- Starok, M.; Preira, P.; Vayssade, M.; Haupt, K.; Salomé, L.; Rossi, C. EGFR inhibition by curcumin in cancer cells: A dual mode of action. Biomacromolecules 2015, 16, 1634–1642. [Google Scholar] [CrossRef]
- Gupta, S.C.; Prasad, S.; Kim, J.H.; Patchva, S.; Webb, L.J.; Priyadarsini, I.K.; Aggarwal, B.B. Multitargeting by curcumin as revealed by molecular interaction studies. Nat. Prod. Rep. 2011, 28, 1937–1955. [Google Scholar] [CrossRef] [Green Version]
- Gutzeit, H.O.; Henker, Y.; Kind, B.; Franz, A. Specific interactions of quercetin and other flavonoids with target proteins are revealed by elicited fluorescence. Biochem. Biophys. Res. Commun. 2004, 318, 490–495. [Google Scholar] [CrossRef]
- Shintani, H. LDL Isolation and Copper-Catalysed Oxidation. Pharm. Anal. Acta 2013, 4, 1–2. [Google Scholar] [CrossRef] [Green Version]
- Beard, C.M.; Barnard, R.J.; Robbins, D.C.; Ordovas, J.M.; Schaefer, E.J. Effects of Diet and Exercise on Qualitative and Quantitative Measures of LDL and Its Susceptibility to Oxidation. Arterioscler. Thromb. Vasc. Biol. 1996, 16, 201–207. [Google Scholar] [CrossRef]
- Wang, C.; Li, P.; Xuan, J.; Zhu, C.; Liu, J.; Shan, L.; Du, Q.; Ren, Y.; Ye, J. Cholesterol enhances colorectal cancer progression via ROS elevation and MAPK signaling pathway activation. Cell. Physiol. Biochem. 2017, 42, 729–742. [Google Scholar] [CrossRef] [PubMed]
- Cao, J.; Liu, Y.; Jia, L.; Jiang, L.-P.; Geng, C.-Y.; Yao, X.-F.; Kong, Y.; Jiang, B.-N.; Zhong, L.-F. Curcumin attenuates acrylamide-induced cytotoxicity and genotoxicity in HepG2 cells by ROS scavenging. J. Agric. Food Chem. 2008, 56, 12059–12063. [Google Scholar] [CrossRef] [PubMed]
- Barzegar, A.; Moosavi-Movahedi, A.A. Intracellular ROS protection efficiency and free radical-scavenging activity of curcumin. PLoS ONE 2011, 6, e26012. [Google Scholar] [CrossRef] [PubMed] [Green Version]
- Larasati, Y.A.; Yoneda-Kato, N.; Nakamae, I.; Yokoyama, T.; Meiyanto, E.; Kato, J. Curcumin targets multiple enzymes involved in the ROS metabolic pathway to suppress tumor cell growth. Sci. Rep. 2018, 8, 1–13. [Google Scholar] [CrossRef] [PubMed]


| Polyphenol | Water Solubility g/L | logP |
|---|---|---|
| Curcumin | 0.00575 | 3.62 |
| Quercetin | 0.261 | 1.81 |
| Chlorogenic acid | 3.44 | 0.17 |
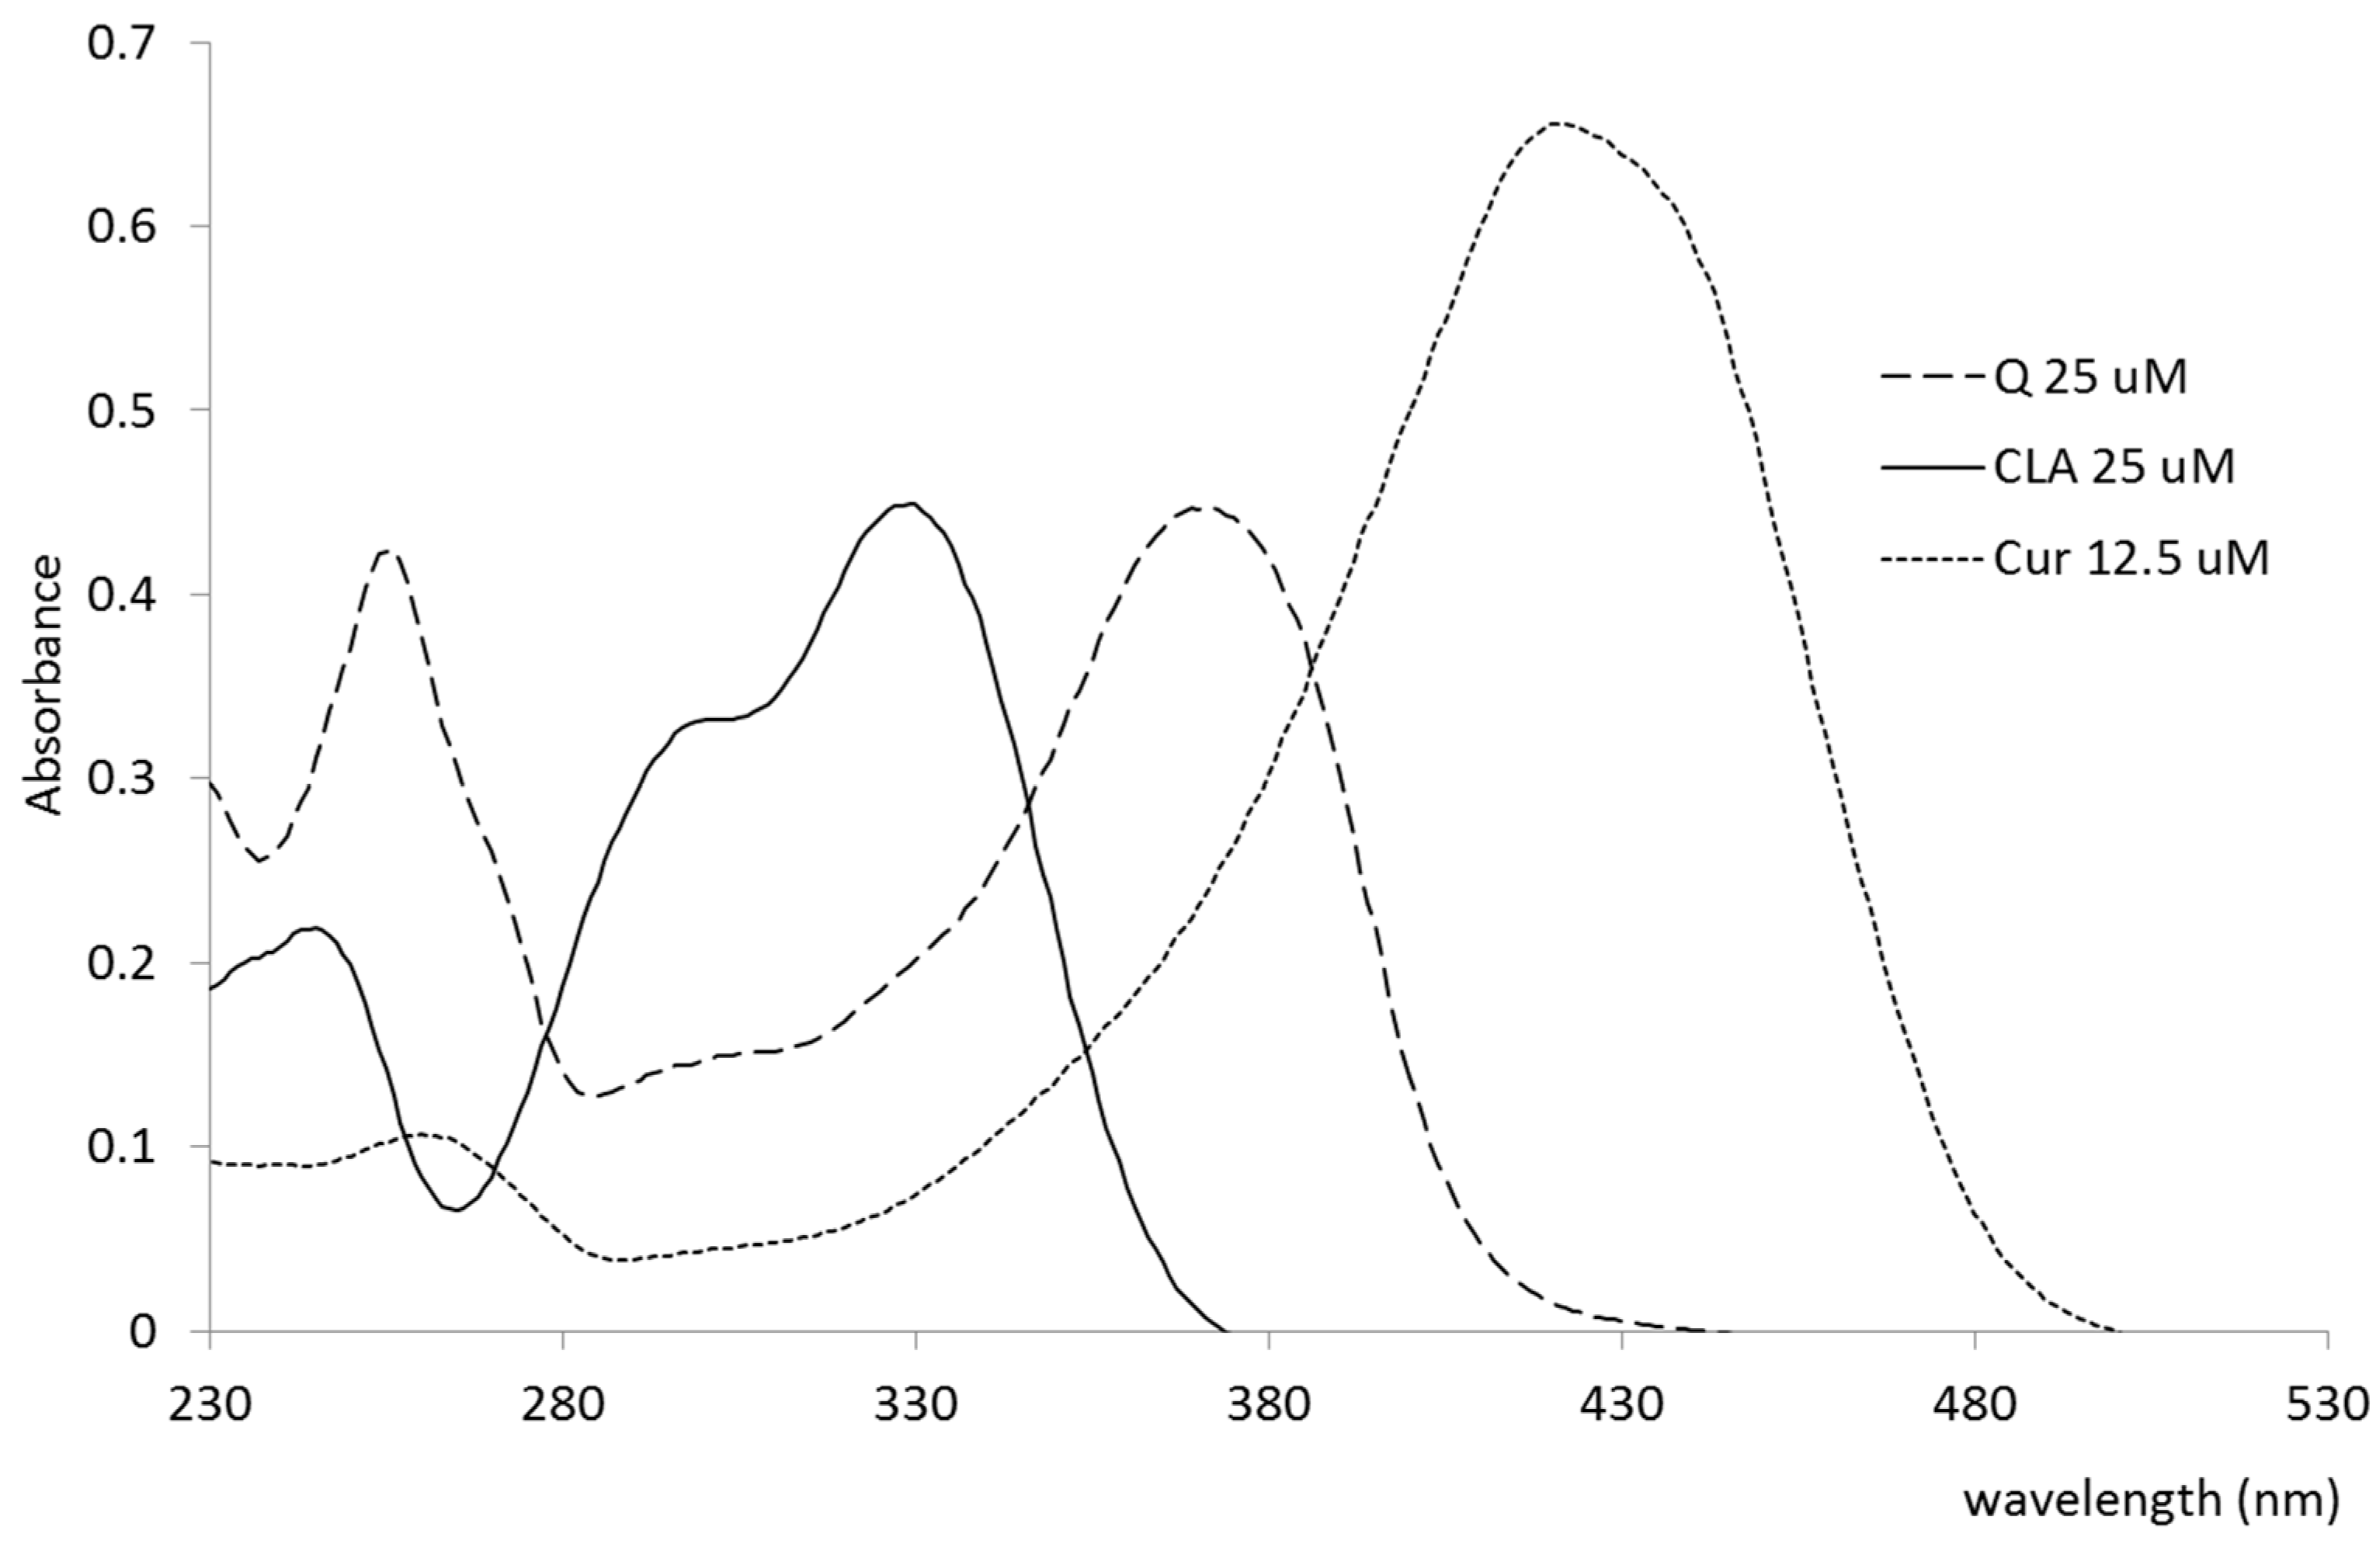
| Polyphenol | Max (nm) | ε (mol−1cm−1) |
|---|---|---|
| Q | 372 | 17864 |
| Cur | 422 | 52472 |
| CLA | 329 | 17971 |
| Preparation | Average Diameter (nm) | Main Diameter (nm) | PDI |
|---|---|---|---|
| LDL | 28.9 | 23.4 | 0.159 |
| QLDL | 29.7 | 23.0 | 0.195 |
| CurLDL | 29.6 | 24.5 | 0.185 |
| CLALDL | 30.9 | 22.8 | 0.195 |
| PP | Concentration (2 h, µM) | Concentration (11 h, µM) |
|---|---|---|
| Q | 8.4 | 69.2 |
| Cur | 31.8 | 87.9 |
| CLA | 0 | 0 |
Publisher’s Note: MDPI stays neutral with regard to jurisdictional claims in published maps and institutional affiliations. |
© 2020 by the authors. Licensee MDPI, Basel, Switzerland. This article is an open access article distributed under the terms and conditions of the Creative Commons Attribution (CC BY) license (http://creativecommons.org/licenses/by/4.0/).
Share and Cite
Lewandowska, H.; Kalinowska, M. New Polyphenol-Containing LDL Nano-Preparations in Oxidative Stress and DNA Damage: A Potential Route for Cell-Targeted PP Delivery. Materials 2020, 13, 5106. https://doi.org/10.3390/ma13225106
Lewandowska H, Kalinowska M. New Polyphenol-Containing LDL Nano-Preparations in Oxidative Stress and DNA Damage: A Potential Route for Cell-Targeted PP Delivery. Materials. 2020; 13(22):5106. https://doi.org/10.3390/ma13225106
Chicago/Turabian StyleLewandowska, Hanna, and Monika Kalinowska. 2020. "New Polyphenol-Containing LDL Nano-Preparations in Oxidative Stress and DNA Damage: A Potential Route for Cell-Targeted PP Delivery" Materials 13, no. 22: 5106. https://doi.org/10.3390/ma13225106