Article

Effect of Zr Content on Phase Stability, Deformation Behavior, and Young’s Modulus in Ti–Nb–Zr Alloys

1
Graduate School of Pure and Applied Sciences, University of Tsukuba, Tsukuba, Ibaraki 305-8573, Japan
2
Faculty of Pure and Applied Sciences, University of Tsukuba, Tsukuba, Ibaraki 305-8573, Japan
3
Foundation for Advancement of International Science, Tsukuba, Ibaraki 305-0821, Japan
4
Center of Advanced Innovation Technologies-VŠB-Technical University of Ostrava, 17. listopadu 15, 708 00 Ostrava-Poruba, Czech Republic
*
Authors to whom correspondence should be addressed.
Materials 2020, 13(2), 476; https://doi.org/10.3390/ma13020476
Submission received: 29 November 2019 / Revised: 8 January 2020 / Accepted: 14 January 2020 / Published: 19 January 2020
(This article belongs to the Section Biomaterials)

Abstract

:
Ti alloys have attracted continuing research attention as promising biomaterials due to their superior corrosion resistance and biocompatibility and excellent mechanical properties. Metastable β-type Ti alloys also provide several unique properties such as low Young’s modulus, shape memory effect, and superelasticity. Such unique properties are predominantly attributed to the phase stability and reversible martensitic transformation. In this study, the effects of the Nb and Zr contents on phase constitution, transformation temperature, deformation behavior, and Young’s modulus were investigated. Ti–Nb and Ti–Nb–Zr alloys over a wide composition range, i.e., Ti–(18–40)Nb, Ti–(15–40)Nb–4Zr, Ti–(16–40)Nb–8Zr, Ti–(15–40)Nb–12Zr, Ti–(12–17)Nb–18Zr, were fabricated and their properties were characterized. The phase boundary between the β phase and the α′′ martensite phase was clarified. The lower limit content of Nb to suppress the martensitic transformation and to obtain a single β phase at room temperature decreased with increasing Zr content. The Ti–25Nb, Ti–22Nb–4Zr, Ti–19Nb–8Zr, Ti–17Nb–12Zr and Ti–14Nb–18Zr alloys exhibit the lowest Young’s modulus among Ti–Nb–Zr alloys with Zr content of 0, 4, 8, 12, and 18 at.%, respectively. Particularly, the Ti–14Nb–18Zr alloy exhibits a very low Young’s modulus less than 40 GPa. Correlation among alloy composition, phase stability, and Young’s modulus was discussed.

1. Introduction

Metallic materials such as Ti alloys, cobalt-chromium based alloys and stainless steels have been extensively used as structural biomaterial. One of the critical issues associated with metallic biomaterials is their high Young’s modulus because the large difference of the elastic modulus between metallic implants and adjacent bone tissues can lead to stress shielding, causing bone resorption and osteoporosis [1,2]. Among metallic biomaterials, Ti and its alloys have explicitly received more attention due to not only their balanced combination of excellent mechanical properties and biocompatibility, but also relatively lower Young’s modulus than stainless steels and cobalt-chromium based alloys [3,4,5]. However, when compared with the Young’s modulus of bone tissues (10–30 GPa), commercially pure Ti (CP-Ti) and Ti–6Al–4V, which are the most commonly used Ti based alloys for biomedical applications, possess a considerably higher Young’s modulus of about 110 GPa.
Over the last decades, there have been extensive studies to reduce Young’s modulus of Ti alloys as much closer to those of bone tissues [6,7,8,9,10,11,12,13,14,15,16,17]. Ti alloys have two stable phases, α phase with a hexagonal close-packed (hcp) crystal structure and β phase with a body centered cubic (bcc) structure and they are classified into three main categories according to major constituent phases: α-type, (α + β)-type, and β-type Ti alloys. Among them, β-type Ti alloys have been confirmed to have the lowest Young’s modulus, and thus they have attracted increasing research attention in recent years. Up to date, many β-type Ti alloys have been developed, such as Gum metal [18], Ti–Nb–Ta–Zr [7,11,19,20], Ti–Nb–Sn [21,22,23,24], Ti–Nb–Zr [9,25,26,27,28,29,30], Ti–Nb–Hf [31] and Ti–Nb–Zr–Sn [32,33]. It is noted that most β-type Ti alloys exhibiting low Young’s modulus contain Nb as a β stabilizing alloying element due to the moderate β phase stabilizing ability and biocompatibility.
It has been confirmed that the Young’s modulus of β-type Ti alloys is strongly dependent on the stability of the β phase [6,9,20,33,34,35,36,37,38]. Generally, Young’s modulus decreases as the β phase becomes unstable. However, the decrease in the stability of the β phase stimulates the formation of α′′ martensite phase and ω phase, leading to the increase in Young’s modulus. In order to assess the stability of the β phase and to optimize the alloy composition, various approaches have been proposed, including Mo equivalent (Moeq), electron to atom ratio (e/a), and d-electron alloy design theory. The Mo equivalent is an empirical parameter representing the contribution of alloying elements on the stability of β phase in comparison to that of Mo. Although Moeq has been widely used as a guideline to design β-type Ti alloys, there have been some controversial issues concerning the effect of alloying elements on the stability of β phase and modification has been continued [39]. The average number of valence electrons per atom or electron to atom ratio (e/a) is also a representative measure of the elastic constants of bcc crystals. It has been reported that as a decrease in the value of e/a, the shear modulus c′ = (c11c12)/2 and bulk modulus B of a bcc crystal decrease, causing the β phase to become unstable [6,9,20,33,34,35,36,37,38]. The d-electron alloy design theory is based on molecular orbital calculations. Two key parameters of this theory are the bond order (Bo) and the d-orbital energy level (Md) which are calculated for each alloying element. Bo is parameter to show the overlapping of the electron clouds of adjacent two atoms, which is a measure of the covalent bond strength between Ti and alloying element. Md is found to be closely related with electronegativity and atomic radius of each alloying element. The average values of Bo and Md, calculated by taking the compositional averages, have been utilized to predict phase boundaries and the stability of the β phase. Experimental results have validated that the β phase becomes unstable with decreasing Bo or with increasing Md [40,41,42,43]. However, it has been pointed out that the phase boundary line in the Bo-Md map shifts as the change of constituent alloying elements [42,44].
β-type Ti alloys have also attracted attention as biomedical shape memory alloys [38,45,46,47,48,49,50,51,52]. The phase stability of the β phase is a key factor governing shape memory effect and superelasticity in β-type Ti alloys because they are related to martensitic transformation from the β phase to the orthorhombic α′′ martensite phase. It has been also reported that the Bo-Md map for Ti alloys is useful to predict the martensitic transformation temperature and deformation mechanism [53,54,55,56,57]. Despite such extensive research, much uncertainty still exists on the relations among Young’s modulus, martensitic transformation behavior, and the values of e/a, Bo, and Md, and the experimental data are still insufficient to understand the mechanisms involved. This study focuses on the effect of the Zr addition on the phase stability and Young’s modulus in Ti–Nb alloys because Zr has been used as a major alloying element in β-type Ti alloys for biomedical applications due to its superior biocompatibility [2,9,11,25,26,27,28,29,30,32,33]. It has been demonstrated that Zr suppresses the martensitic transformation from the β phase to the α′′ phase and enhances the stability of the β phase of Ti–Nb alloys [32,38,58]. Furthermore, the addition of Zr in Ti–Nb alloys can modify the values of Bo and Md without changing e/a. Ti–Nb–Zr alloys with various Nb and Zr contents were fabricated and the composition dependence of phase constitution and deformation behavior was investigated. The phase boundary between the β phase and the α′′ martensite phase in Ti–Nb–Zr alloys was clarified. The relations among phase stability, martensitic transformation behavior, and Young’s modulus were analyzed. Finally, a novel guideline to design β-type Ti alloys with low Young’s modulus was proposed.

2. Materials and Methods

A total of 44 alloys were investigated in this study. The alloys are named in their Nb content and Zr content. For binary Ti–Nb alloys, ten compositions with different Nb content from 18 to 40 at.%, which are denoted as Ti–(18–40)Nb, were investigated. For Ti–Nb–Zr ternary alloys, 4 different series of alloys containing 4 at.% Zr, 8 at.% Zr, 12 at.% Zr or 18 at.% Zr were investigated where the range of Nb content is indicated in parenthesis. All the alloy compositions investigated in this study are indicated in the isothermal sections of the Ti–Nb–Zr phase diagram at 1173 K (Figure 1). Ti–(18–40)Nb, Ti–(15–40)Nb–4Zr, Ti–(16–40)Nb–8Zr, Ti–(15–40)Nb–12Zr, Ti–(12–17)Nb–18Zr alloys were fabricated by the arc melting method. Unless specified otherwise, values of alloy content are in atomic percent (at.%) hereafter. The alloy ingots were melted on a water-cooled Cu hearth in an argon atmosphere in the form of small button weighing about 20 grams which was approximately 25 mm in diameter and 10 mm in height. The ingots were sealed in a quartz tube under vacuum and were subjected to a homogenization treatment at 1273 K for 7.2 ks. Then, the ingots were cold rolled into plates of approximately 0.5 mm in thickness with a final reduction ratio of 95%. Specimens for X-ray diffraction (XRD), microstructure analysis, and tensile tests were cut from the cold rolled sheets by an electrical discharge machine. These specimens were annealed at 1173 K for 0.3 ks in Ar-filled quartz tubes and quenched in ice water by breaking the quartz tubes. After annealing, the surface contamination of specimens was cleaned using methanol and acidic solution.
XRD analysis was performed using a Rigaku Smartlab instrument (Tokyo, Japan) with Cu Kα radiation (40 kV, 30 mA). Microstructural characterization was performed using a scanning electron microscope (JSM-IT300; JEOL, Tokyo, Japan). Tensile tests were carried out along the rolling direction using dog-bone specimens with a 20-mm gauge length and 1.5-mm width at a strain rate of 0.005 mm/s at room temperature. The strain of the specimens was measured using a non-contacting video extensometer (TRViewX; Shimadzu, Kyoto, Japan) with two targets. Transformation temperatures were evaluated from differential scanning calorimetry (DSC) curves. The DSC measurements were performed at heating rate of 10 K/min in the Shimadzu DSC-60 (Kyoto, Japan).

3. Results and Discussion

3.1. Phase Constitutions

Phase constitutions of Ti–Nb–Zr alloys annealed at 1173 K for 0.3 ks were investigated by XRD at room temperature. Figure 2 shows XRD profiles of selected alloys to identify the critical concentration of Nb to obtain a single β phase for binary Ti–Nb and ternary Ti–Nb–(4, 8, 12, 18) Zr alloys. For the binary Ti–Nb alloys (Figure 2a), the peaks from both α′′ martensite phase with an orthorhombic structure and β phase were observed in the alloys with lower Nb content, such as Ti–24Nb and Ti–25Nb alloys. On the other hand, Ti–26Nb and Ti–27Nb alloys exhibited a single β phase, implying that the martensitic transformation start temperature (Ms) decreases with increasing Nb content and becomes below room temperature when the Nb content is 26 at.%. In consequence, it is clear that the lower limit content of Nb to suppress the martensitic transformation and to obtain a single β phase is 26 at.% in the Ti–Nb binary alloys, which is consistent with previous reports [45,60]. For the Ti–Nb–4Zr alloys (Figure 2b), peaks from both the α” martensite phase and the β phase were detected in Ti–20Nb–4Zr and Ti–21Nb–4Zr alloys while there are only peaks from the β phase in XRD profiles of Ti–22Nb–4Zr and Ti–23Nb–4Zr alloys, indicating that the lower limit content of Nb to obtain a single β phase decreased to 22 at.% by the addition of 4 at.% Zr. As seen in Figure 2, as the increased in Zr content from 4 at.% to 8 at.% to 12 at.% and to 18 at.%, the critical Nb content to reduce the Ms below room temperature, i.e., to obtain a single β phase at room temperature, further decreased from 22 at.% to 19 at.%, 17 at.% and 14 at.%, respectively. Figure 3 shows scanning electron microscopy (SEM) micrographs of Ti–(15–18)Nb–12Zr alloys as representative examples. The SEM micrographs are well consistent with XRD results shown in Figure 2d. Martensite plates are clearly seen in Ti–15Nb–12Zr and Ti–16Nb–12Zr alloys, on the other hand, a single-phase structure of the β phase is seen in Ti–17Nb–12Zr and Ti–18Nb–12Zr alloys. These results are consistent with the previous reports that Zr decreases Ms and plays a role to stabilize the β phase [15,48,59]. Within the range of alloy compositions investigated, it is noted that Zr has an impact on the decrease in Ms of Ti–Nb alloys, which is equivalent to about two thirds of Nb.

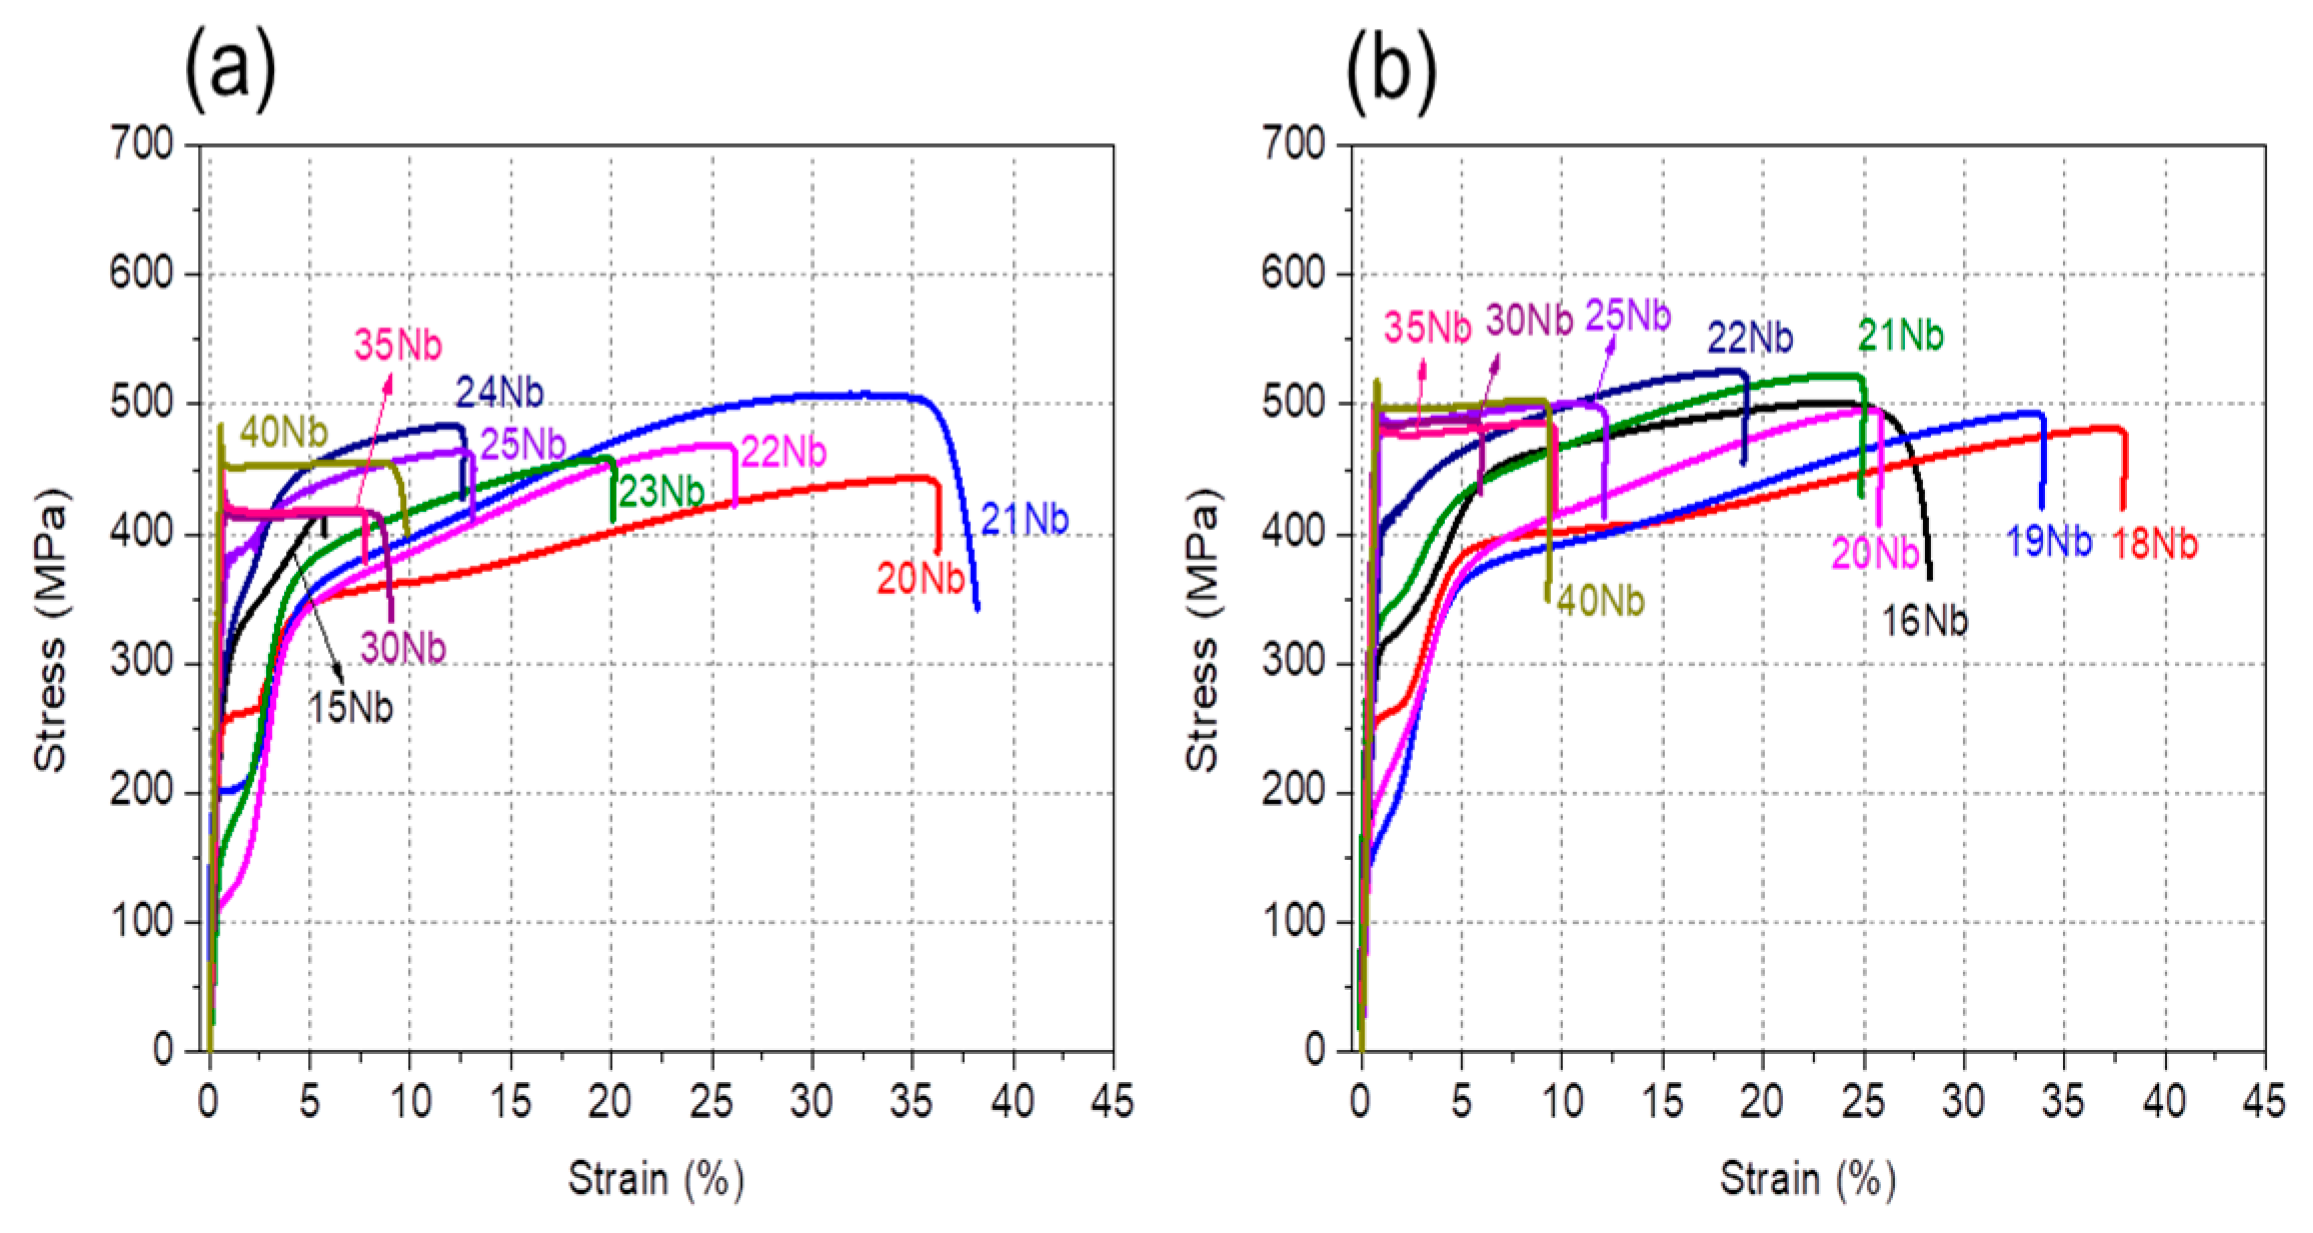
3.2. Mechanical Properties

Mechanical properties and deformation behavior are also strongly dependent on Nb and Zr contents. Figure 4 shows examples of tensile stress-strain curves for (a) Ti–Nb–4Zr and (b) Ti–Nb–8Zr alloys obtained at room temperature. The yield strength, ultimate tensile strength and elongation of all alloys are listed in Table S1. For Ti–Nb–4Zr alloys, the alloys with low Nb content (Ti–(15–25)Nb–4Zr) exhibited double yielding while the alloys with more than 25 at.% Nb revealed single yielding. As shown in Figure 2b, the Ti–Nb–4Zr alloys containing 22 at.% Nb and more consisted of a single β phase, therefore the first yielding in the Ti–(22–25)Nb–4Zr alloys is due to the stress induced martensitic transformation. On the other hand, the first yielding in the Ti–(15–21)Nb–4Zr alloys is believed to be due to the reorientation of α” martensite variants. It is noted that the critical stress for the first yielding decreases with increasing Nb content, reaching a minimum of 110 MPa at 22 at.% Nb and then increases again with further increasing Nb content. It is also noted that elongation shows a decreasing tendency with increasing Nb content. A large elongation in the alloys with low Nb content is supposed to be due to transformation-induced plasticity (TRIP) and twinning-induced plasticity (TWIP) effects [53,54,55,56,61]. As shown in Figure 4b, stress-strain curves of Ti–Nb–8Zr alloys exhibits a similar dependence on Nb content as that shown for the Ti–Nb–8Zr alloys. Figure 5 shows the Nb content dependence of the critical stress for the first yielding for the Ti–Nb–Zr alloys with various Zr content. It is also noted that the yield stress takes a minimum value at the compositions locate near the phase boundary of (β + α′′)/β, which is reasonable to consider that the stress for inducing martensitic transformation decreases with decreasing stability of the β phase and takes a minimum value at the phase boundary.
The stress–strain curves of Ti–40Nb and Ti–40Nb–(4, 8, 12) Zr alloys which have fully stabilized β phase are compared in Figure 6 to assess the strengthening effect of Zr. The yield strength increased almost linearly with increasing Zr content: from 375 MPa for the Ti–40Nb alloy to 525 MPa for the Ti–40Nb–8Zr alloy, and to 590 MPa for the Ti–40Nb–12Zr alloy, respectively. Accordingly, it is evident that, although the effect is not very strong, Zr has a strengthening effect in Ti-Nb alloys.

3.3. Deformation Behavior and Martensitic Transformation Temperature

Figure 7 shows stress-strain curves obtained during a loading-unloading cycle for Ti–Nb and Ti–Nb–Zr alloys with the compositions near phase boundary of (β + α′′)/β. After unloading the specimens were heated to investigate reverse transformation and shape recovery. In Ti–Nb alloys, shape memory effect was observed in the Ti–(23–25)Nb alloys; most of strain was recovered by heating the unloaded specimen. The Ti–26Nb alloy exhibited partial superelasticity and partial shape memory effect. Clear superelasticity was observed in the Ti–23Nb–4Zr, Ti–20Nb–8Zr, Ti–18Nb–12Zr, Ti–15Nb–18Zr alloys. The decrease in the Nb content exhibiting superelasticity with the increase in Zr content is reasonable considering that Zr acts as the β phase stabilizing element in Ti–Nb alloys and decreases the martensitic transformation temperature. The results of Zr and Nb content dependences of shape memory properties are consistent with previous reports [48,51,59].
In order to clarify the effect of Nb and Zr content on the reverse transformation temperature, DSC measurements were performed by heating samples taken from the specimens that had been loading–unloading tested, and the results are shown in Figure 8. No peak was detected in the alloys that showed superelasticity upon loading–unloading tests, i.e., Ti–26Nb, Ti–23Nb–4Zr, Ti–20Nb–8Zr, Ti–18Nb–12Zr, and Ti–15Nb–18Zr. This is reasonable by considering that superelasticity occurs at temperature higher than the reverse transformation temperature and thus the reverse transformation occurs upon unloading at room temperature. On the other hand, all the alloys that showed shape memory effect exhibited a distinct endothermic peak upon heating, which is associated with the reverse transformation from the α′′ phase to the β phase. The reverse transformation start temperature (As) for the Ti–Nb–Zr alloys with various Zr content is plotted as a function of the Nb content in Figure 9. It is seen that the As temperature decreases with increasing Nb content with a slope of −28 K/1 at.% Nb for the binary Ti–Nb alloys. The slope became steeper with increasing Zr content, namely from −43 K/1 at.% Nb for the Ti–Nb–4Zr alloys to −66 K/1 at.% Nb for the Ti–Nb–18Zr alloys. It is also noted that the Ti–24Nb, Ti–18Nb–8Zr, Ti–16Nb–12Zr, and Ti–13Nb–18Zr alloys have almost similar values of 400 K, indicating that the impact of Zr on decreasing As temperature is equivalent to about two thirds times that of Nb. This result is in good agreement with microstructural observation and the composition dependence of deformation behavior.

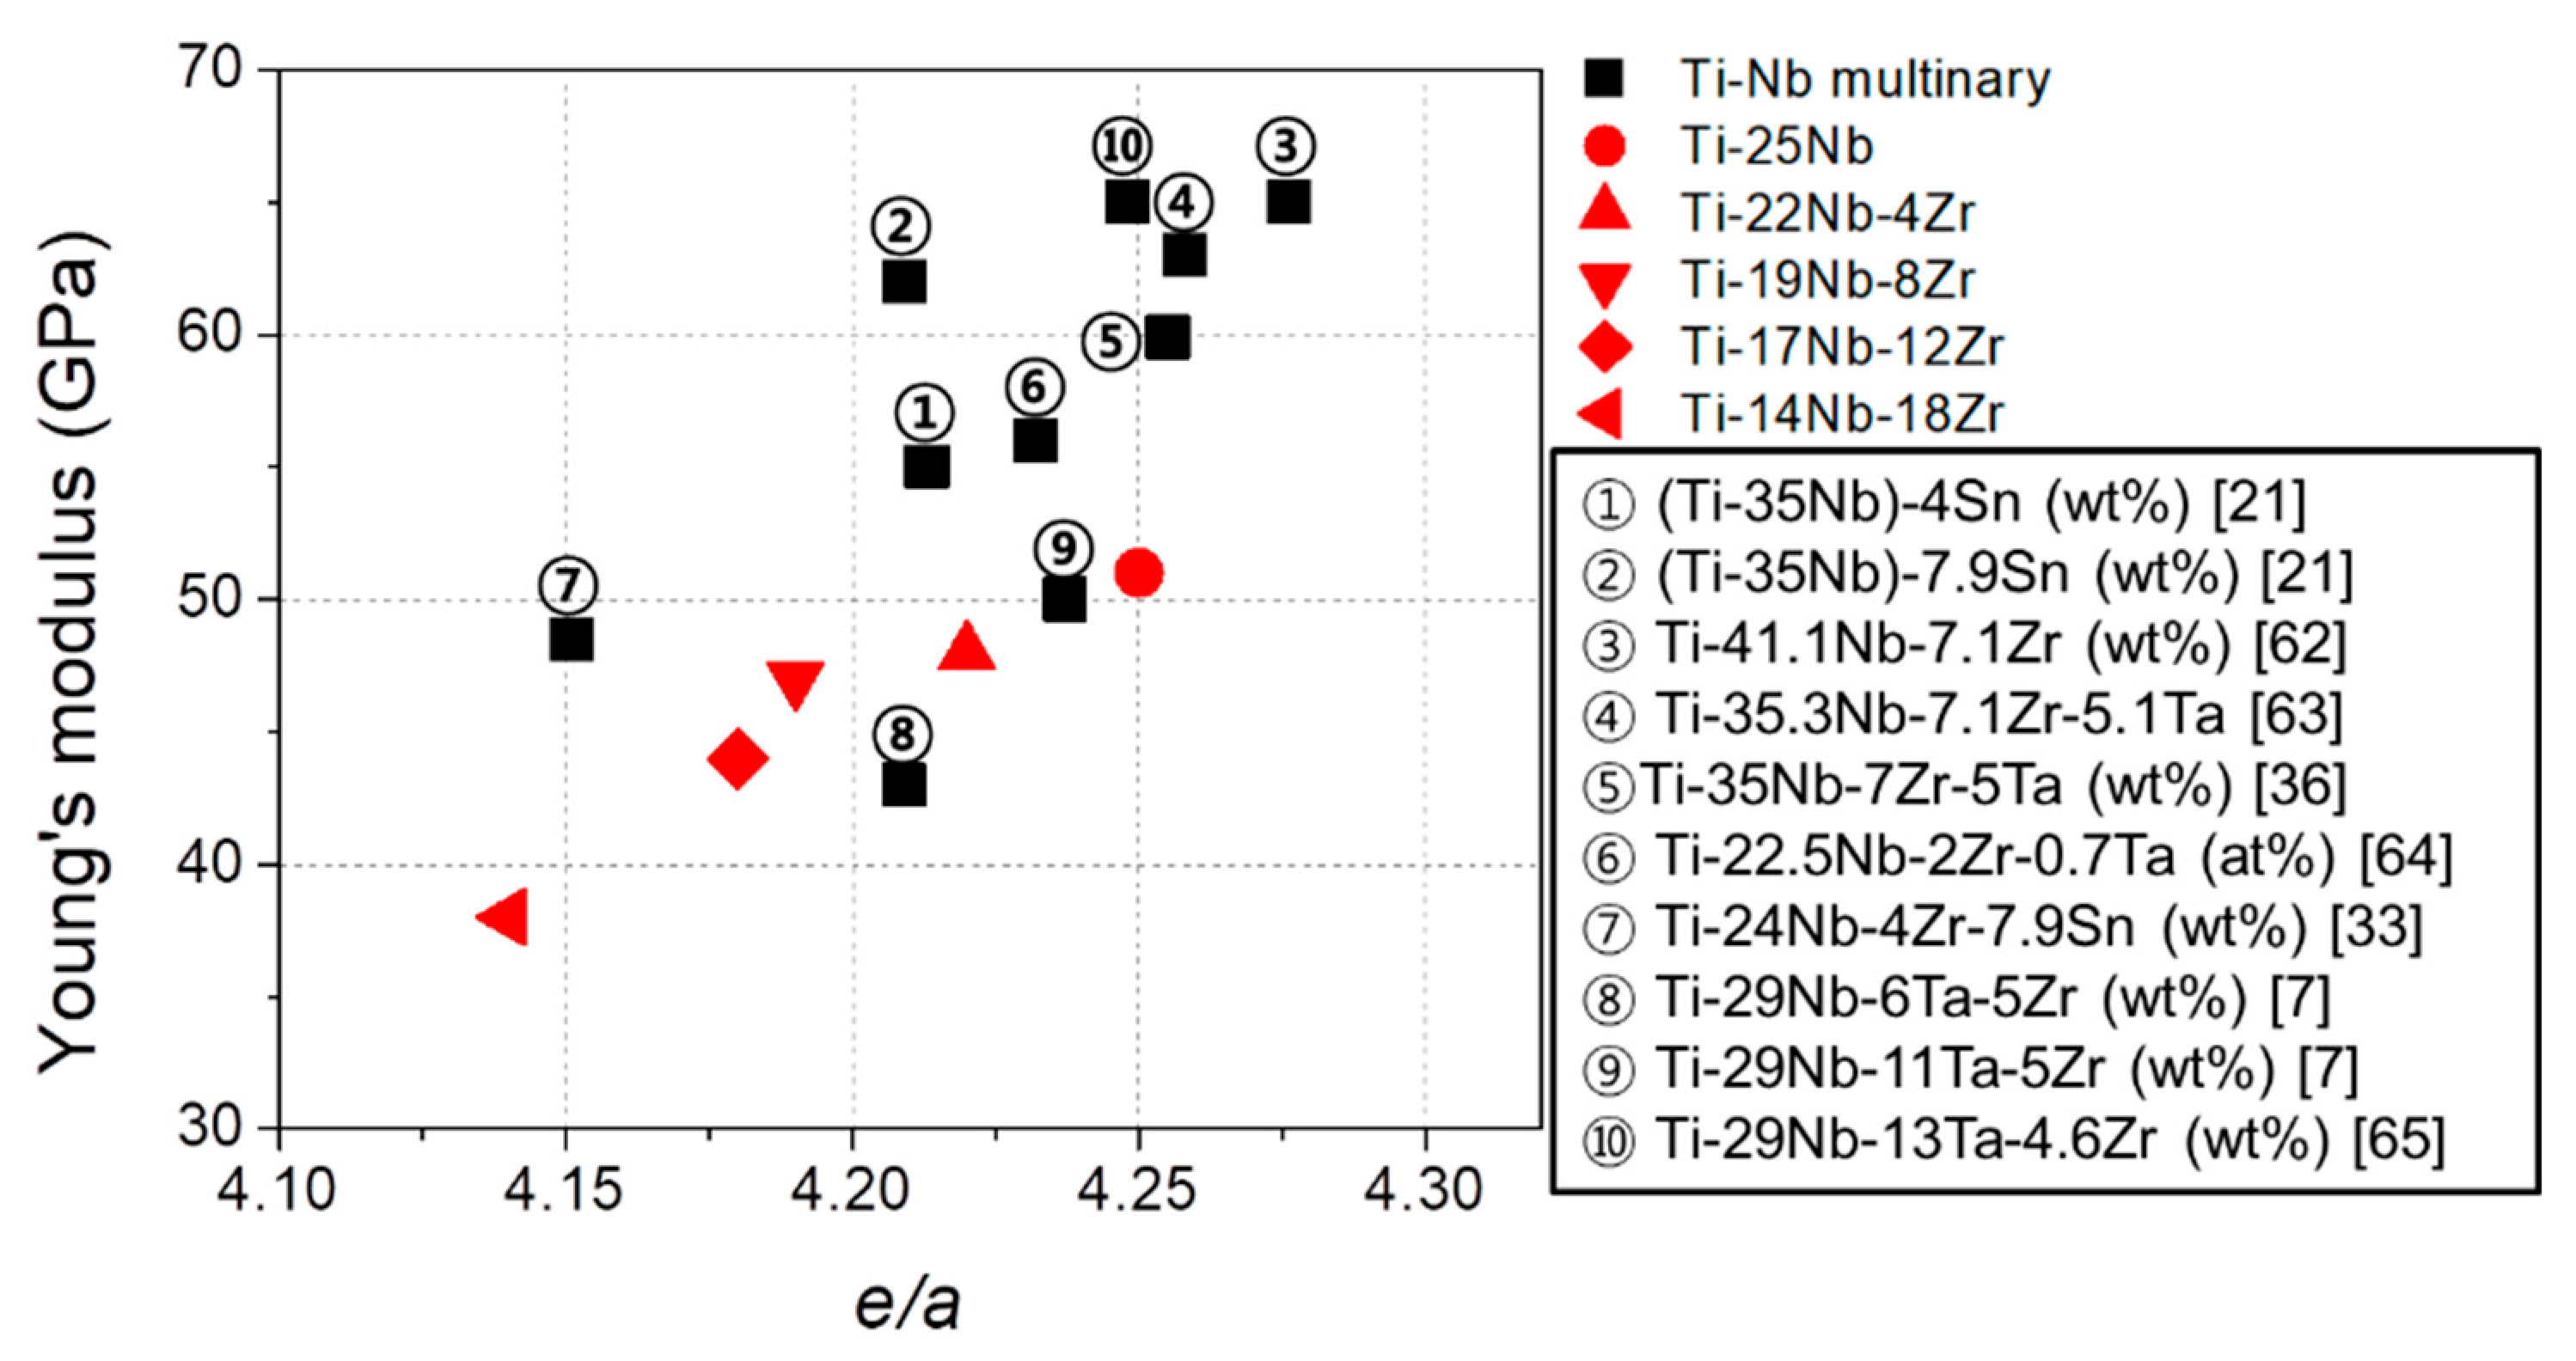
3.4. Young’s Modulus

Young’s moduli of the Ti–Nb and Ti–Nb–Zr alloys were evaluated using the stress-strain curves and they are plotted as a function of Nb content in Figure 10a. For the Ti–Nb alloys, Young’s modulus gradually decreased with decreasing Nb content, reaching a minimum Young’s modulus of 51 GPa at 25Nb and then increased again with further decreasing Nb content. The Ti–Nb–Zr alloys exhibited similar trends of the Nb content dependence on Young’s modulus; but the Nb content taking the minimum value of Young’s modulus was shifted to lower values as the increase in the Zr content. It is noted that Young’s moduli of Ti–Nb–Zr alloys with Zr contents 4, 8, 12, and 18 at.% take minimum values at Nb contents of 22, 19, 17, and 14 at.%, respectively, which locate near the phase boundary of (β + α′′)/β in a way similar to the dependence of the critical stress for the first yielding on the Nb content as shown in Figure 5. It is also worth noting that, when compared the minimum Young’s modulus of the series of alloys with different Zr content, Young’s modulus decreased with increasing Zr content to a very low value of 39 GPa for the Ti–14Nb–18Zr alloy. As shown in Figure 10b, the Ti–14Nb–18Zr alloy exhibited the stress induced martensitic transformation at a low stress level less than 100 MPa which is due to the low stability of the β phase.
Previous studies have demonstrated that e/a is a dominant factor governing the elastic constants and Young’s modulus of bcc transition metals including β-type Ti alloys [20,33,35]. In order to understand the effect of Zr content on the lowest Young’s modulus for each series of alloys with different Zr content, the Young’s moduli of the Ti–25Nb, Ti–22Nb–4Zr, Ti–19Nb–8Zr, Ti–17Nb–12Zr and Ti–14Nb–18Zr alloys are plotted in Figure 11 as a function of e/a. For comparison purposes, the results of some β-type Ti alloys [7,21,33,36,62,63,64,65] developed for low Young’s modulus alloys are included in Figure 11. Note that e/a of the alloys investigated in this study decreased with increasing Zr content as follows: Ti–25Nb, 4.25; Ti–22Nb–4Zr, 4.22; Ti–19Nb–8Zr, 4.19; Ti–17Nb–12Zr, 4.17; and Ti–14Nb–18Zr, 4.14. The decrease is attributed to the fact that Zr decreases Ms of the alloys, and the addition of Zr shifts the phase boundary of (β + α′′)/β toward lower Nb content. Although the data were somewhat scattered, there is a clear tendency of decreasing Young’s modulus with decreasing e/a in accordance with the previous reports [20,33,35,66]. As a result, it is suggested that Zr is an effective alloying element in reducing Young’s modulus because it decreases the lower limit of e/a to maintain the β phase. Similarly, Sn is considered as a useful alloying element because it also decreases the Ms of the alloys while keeping e/a. These results may have important implications for developing useful guidelines for alloy design.
It has been demonstrated that Young’s modulus of the β phase is governed by elastic constants of c′ and c44 [35]. Very recently, Kwasniak et al. [67] reported that the elastic constants of c′ and c44 and lower limit of Young’s of Ti–Nb based alloys are dependent on electronic hybridization of electronic structures. They also proposed that the addition of a second transition metallic element can be useful for reducing Young’s modulus by tuning atomic bonding structure and elastic constants. It is suggested that Zr is a promising alloying element to control atomic bonding structure without increasing e/a. Further studies are required to evaluate the impact of Zr on the electronic structure of multicomponent β-Ti alloys and its effect on the elastic constants and Young’s modulus.

3.5. Phase Boundary of Ti–Nb–Zr Alloys in the Bo-Md Map

As was mentioned in the introduction, Bo-Md maps have been used successfully as guideline for alloy design of Ti alloys. Figure 12a shows a Bo-Md map representing phase boundaries, where Ms = RT line corresponds to the phase boundary of (β + α′′)/β. The alloys investigated in this study, i.e., Ti–(24–27)Nb, Ti–(20–23)Nb–4Zr, Ti–(16–20)Nb–8Zr, Ti–(14–19)Nb–12Zr, and Ti–(13–16)Nb–18Zr alloys, are represented in Figure 12b, where the alloys consisting of only single β phase are indicated by solid symbols and the alloys consisting of both α′′ and β phases are denoted by hollow symbols. It is seen that the phase boundary of (β + α′′)/β for the Ti–Nb–Zr alloys is displaced toward a higher Md region from the line suggested by Morinaga et al. [40] and Abdel-Hady et al. [41]. These results are in agreement with previous studies which showed that Zr shifts the phase boundary downward in the Bo-Md map [9,41,42]. It is also worth mentioning that Young’s modulus of the alloys located on the phase boundary of (β + α′′)/β decreased as the Md increased.

4. Conclusions

In this study, the effects of the Nb and Zr contents on phase constitution, transformation temperature, deformation behavior, and Young’s modulus in Ti–(12–40)Nb–(0–18)Zr alloys were investigated. The main conclusions are as follows:
(1)
The addition of Zr decreases the martensitic and reverse transformation temperatures of Ti–Nb alloys. The influence of Zr on decreasing the transformation temperatures is weaker, i.e., about two thirds that of Nb. The minimum Nb content to maintain the β phase at room temperature continuously decreases with increasing Zr content.
(2)
Mechanical properties and deformation behavior strongly depend on Nb and Zr contents. Deformation behavior changes from double yielding to single yielding with increasing Nb or Zr content. The critical stress for the first yielding takes a minimum value at the composition locating near the phase boundary of (β + α′′)/β. For Ti–Nb–Zr alloys with fully stabilized β phase, the yield stress increased with increasing Zr content.
(3)
Young’s modulus gradually decreases with decreasing Nb content, reaching a minimum value, and then increases again with further decreasing Nb content. The Nb content taking the minimum value of Young’s modulus was shifted to lower values as the increase in the Zr content. The Ti–25Nb, Ti–22Nb–4Zr, Ti–19Nb–8Zr, Ti–17Nb–12Zr and Ti–14Nb–18Zr alloys exhibit the lowest Young’s moduli among Ti–Nb–Zr alloys with Zr contents of 0, 4, 8, 12, and 18 at.%, respectively. The minimum Young’s modulus decreases with increasing Zr content. Particularly, the Ti–14Nb–18Zr alloy exhibits a very low value of 39 GPa.
(4)
The addition of Zr in Ti–Nb alloys reduces the lower limit of e/a to maintain the β phase. The addition of Zr shifts the phase boundary of (β + α′′)/β downward in the Bo-Md map. Young’s modulus of Ti–Nb–Zr alloys located on the phase boundary of (β + α′′)/β decreases as the Md increases.

Supplementary Materials

The following are available online at https://www.mdpi.com/1996-1944/13/2/476/s1, Table S1: Yield strength (YS), ultimate tensile strength (UTS) and elongation (EL) of Ti-Nb-Zr alloys.

Author Contributions

Research conceptualization and methodology, H.Y.K. and S.M.; material preparation, experiment, K.M.K.; analysis and discussion, K.M.K., H.Y.K. and S.M.; writing—original draft preparation, K.M.K.; writing—review and editing, H.Y.K. and S.M. All authors have read and agreed to the published version of the manuscript.

Funding

This research was partially funded by JSPS KAKENHI Grant Numbers JP26249104, JP19H05167.

Acknowledgments

This research was supported by the Chemical Analysis Division and Cryogenics Division, University of Tsukuba.

Conflicts of Interest

The authors declare no conflict of interest.

References

  1. Niinomi, M.; Nakai, M.; Hieda, J. Development of new metallic alloys for biomedical applications. Acta Biomater. 2012, 8, 3888–3903. [Google Scholar] [CrossRef] [PubMed]
  2. Chen, Q.; Thouas, G.A. Metallic implant biomaterials. Mater. Sci. Eng. R. 2015, 87, 1–57. [Google Scholar] [CrossRef]
  3. Geetha, M.; Singh, A.K.; Asokamani, R.; Gogia, A.K. Ti based biomaterials, the ultimate choice for orthopaedic implants—A review. Prog. Mater. Sci. 2009, 54, 397–425. [Google Scholar] [CrossRef]
  4. Li, Y.; Yang, C.; Zhao, H.; Qu, S.; Li, X.; Li, Y. New Developments of Ti-Based Alloys for Biomedical Applications. Materials 2014, 7, 1709–1800. [Google Scholar] [CrossRef] [Green Version]
  5. Niinomi, M. Mechanical biocompatibilities of titanium alloys for biomedical applications. J. Mech. Behav. Biomed. Mater. 2008, 1, 30–42. [Google Scholar] [CrossRef]
  6. Ozaki, T.; Matsumoto, H.; Watanabe, S.; Hanada, S. Beta Ti alloys with low Young’s modulus. Mater. Trans. 2004, 45, 2776–2779. [Google Scholar] [CrossRef] [Green Version]
  7. Laheurte, P.; Prima, F.; Eberhardt, A.; Gloriant, T.; Wary, M.; Patoor, E. Mechanical properties of low modulus β titanium alloys designed from the electronic approach. J. Mech. Behav. Biomed. Mater. 2010, 3, 565–573. [Google Scholar] [CrossRef]
  8. Zhao, X.; Niinomi, M.; Nakai, M.; Ishimoto, T.; Nakano, T. Development of high Zr-containing Ti-based alloys with low Young’s modulus for use in removable implants. Mater. Sci. Eng. C 2011, 31, 1436–1444. [Google Scholar] [CrossRef]
  9. You, L.; Song, X. A study of low Young’s modulus Ti-Nb-Zr alloys using d electrons alloy theory. Scr. Mater. 2012, 67, 57–60. [Google Scholar] [CrossRef]
  10. Friák, M.; Counts, W.A.; Ma, D.; Sander, B.; Holec, D.; Raabe, D.; Neugebauer, J. Theory-Guided Materials Design of Multi-Phase Ti-Nb Alloys with Bone-Matching Elastic Properties. Materials 2012, 5, 1853–1872. [Google Scholar] [CrossRef] [Green Version]
  11. Nakai, M.; Niinomi, M.; Oneda, T. Improvement in fatigue strength of biomedical β-type Ti–Nb–Ta–Zr alloy while maintaining low Young’s modulus through optimizing ω-phase precipitation. Metall. Mater. Trans. A 2012, 43, 294–302. [Google Scholar] [CrossRef]
  12. Hu, L.; Guo, S.; Meng, Q.; Zhao, X. Metastable β-type Ti-30Nb-1Mo-4Sn alloy with ultralow Young’s modulus and high Strength. Metall. Mater. Trans. A 2014, 45, 547–550. [Google Scholar] [CrossRef]
  13. Guo, S.; Meng, Q.; Zhao, X.; Wei, Q.; Xu, H. Design and fabrication of a metastable β-type titanium alloy with ultralow elastic modulus and high strength. Sci. Rep. 2015, 5, 14688. [Google Scholar] [CrossRef] [PubMed]
  14. Liang, S.; Feng, X.; Yin, L.; Liu, X.; Ma, M.; Liu, R. Development of a new β Ti alloy with low modulus and favorable plasticity for implant material. Mater. Sci. Eng. C 2016, 61, 338–343. [Google Scholar] [CrossRef] [PubMed]
  15. Niinomi, M.; Liu, Y.; Nakai, M.; Liu, H.; Li, H. Biomedical titanium alloys with Young’s moduli close to that of cortical bone. Regen. Biomater. 2016, 3, 173–185. [Google Scholar] [CrossRef] [Green Version]
  16. Park, C.H.; Hong, J.K.; Lee, S.W.; Yeom, J.T. Multifunctional Beta Ti Alloy with Improved Specific Strength. Shape Mem. Superelast. 2017, 3, 373–380. [Google Scholar] [CrossRef]
  17. Shinohara, Y.; Matsumoto, Y.; Tahara, M.; Hosoda, H.; Inamura, T. Development of <001>-fiber texture in cold-groove-rolled Ti-Mo-Al-Zr biomedical alloy. Materialia 2018, 1, 52–61. [Google Scholar] [CrossRef]
  18. Saito, T.; Furuta, T.; Hwang, J.H.; Kuramoto, S.; Nishino, K.; Suzuki, N.; Chen, R.; Yamada, A.; Ito, K.; Seno, Y.; et al. Multifunctional alloys obtained via a dislocation-free plastic deformation mechanism. Science 2003, 300, 464–467. [Google Scholar] [CrossRef] [Green Version]
  19. Sakaguch, N.; Niinomi, M.; Akahori, T. Tensile deformation behavior of Ti–Nb–Ta–Zr biomedical alloys. Mater. Trans. 2004, 45, 1113–1119. [Google Scholar] [CrossRef] [Green Version]
  20. Tane, M.; Akita, S.; Nakano, T.; Hagihara, K.; Umakoshi, Y.; Niinomi, M.; Mori, H.; Nakajima, H. Low Young’s modulus of Ti–Nb–Ta–Zr alloys caused by softening in shear moduli c′ and c44 near lower limit of body-centered cubic phase stability. Acta Mater. 2010, 58, 6790–6798. [Google Scholar] [CrossRef]
  21. Matsumoto, H.; Watanabe, S.; Hanada, S. Beta TiNbSn alloys with low Young’s modulus and high strength. Mater. Trans. 2005, 46, 1070–1078. [Google Scholar] [CrossRef] [Green Version]
  22. Matsumoto, H.; Watanabe, S.; Hanada, S. Microstructures and mechanical properties of metastable β TiNbSn alloys cold rolled and heat treated. J. Alloy Compd. 2007, 439, 146–155. [Google Scholar] [CrossRef]
  23. Miura, K.; Yamada, N.; Hanada, S.; Jung, T.K.; Itoi, E. The bone tissue compatibility of new Ti-Nb-Sn alloy with a low Young’s modulus. Acta Biomater. 2011, 7, 2320–2326. [Google Scholar] [CrossRef] [PubMed]
  24. Hou, Y.P.; Guoa, S.; Qiao, X.L.; Tian, T.; Meng, Q.K.; Cheng, X.N.; Zhao, X.Q. Origin of ultralow Young’s modulus in a metastable β-type Ti–33Nb–4Sn alloy. J. Mech. Behav. Biomed. Mater. 2016, 59, 220–225. [Google Scholar] [CrossRef] [Green Version]
  25. Málek, J.; Hnilica, F.; Veselý, J.; Smola, B.; Kolařík, K.; Fojt, J.; Vlach, M.; Kodetová, V. The effect of Zr on the microstructure and properties of Ti-35Nb-XZr alloy. Mater. Sci. Eng. A 2016, 675, 1–10. [Google Scholar] [CrossRef]
  26. Karre, R.; Niranjan, M.K.; Dey, S.R. First principles theoretical investigations of low Young’s modulus beta Ti–Nb and Ti–Nb–Zr alloys compositions for biomedical applications. Mater. Sci. Eng. C 2015, 50, 52–58. [Google Scholar] [CrossRef]
  27. Ozan, S.; Lin, J.; Ma, J.; Li, Y.; Ipek, R.; Wen, C. Development of Ti–Nb–Zr alloys with high elastic admissible strain for temporary orthopedic devices. Acta Biomater. 2015, 20, 176–187. [Google Scholar] [CrossRef]
  28. Tan, M.H.C.; Baghi, A.D.; Ghomashchi, R.; Xiao, W.; Oskouei, R.H. Effect of niobium content on the microstructure and Young’s modulus of Ti-xNb-7Zr alloys for medical implants. J. Mech. Behav. Biomed. Mater. 2019, 99, 78–85. [Google Scholar] [CrossRef]
  29. Brailovski, V.; Prokoshkin, S.; Gauthier, M.; Inaekyan, K.; Dubinskiy, S. Mechanical properties of porous metastable beta Ti-Nb-Zr alloys for biomedical applications. J. Alloys Compd. 2013, 577, S413–S417. [Google Scholar] [CrossRef] [Green Version]
  30. Ning, C.; Ding, D.; Dai, K.; Zhai, W.; Chen, L. The effect of Zr content on the microstructure, mechanical properties and cell attachment of Ti-35Nb-xZr alloys. Biomed. Mater. 2010, 5, 045006. [Google Scholar] [CrossRef]
  31. González, M.; Peña, J.; Gil, F.J.; Manero, J.M. Low modulus Ti–Nb–Hf alloy for biomedical applications. Mater. Sci. Eng. C 2014, 42, 691–695. [Google Scholar] [CrossRef] [PubMed]
  32. Hao, Y.L.; Li, S.J.; Sun, S.Y.; Yang, R. Effect of Zr and Sn on Young’s modulus and superelasticity of Ti-Nb-based alloys. Mater. Sci. Eng. A 2006, 441, 112–118. [Google Scholar] [CrossRef]
  33. Hao, Y.L.; Li, S.J.; Sun, S.Y.; Zheng, C.Y.; Yang, R. Elastic deformation behavior of Ti–24Nb–4Zr–7.9Sn for biomedical applications. Acta Biomater. 2007, 3, 277–286. [Google Scholar] [CrossRef] [PubMed]
  34. Fisher, E.S.; Dever, D. Relation of the c′ elastic modulus to stability of b.c.c. transition metals. Acta Metall. 1970, 18, 265–269. [Google Scholar] [CrossRef]
  35. Tane, M.; Akita, S.; Nakano, T.; Hagihara, K.; Umakoshi, Y.; Niinomi, M.; Nakajima, H. Peculiar elastic behavior of Ti–Nb–Ta–Zr single crystals. Acta Mater. 2008, 56, 2856–2863. [Google Scholar] [CrossRef]
  36. Raabe, D.; Sander, B.; Friak, M.; Ma, D.; Neugebauer, J. Theory-guided bottom-up design of β-titanium alloys as biomaterials based on first principles calculations: Theory and experiments. Acta Mater. 2007, 55, 4475–4487. [Google Scholar] [CrossRef]
  37. Wang, X.; Zhang, L.; Guo, Z.; Jiang, Y.; Tao, X.; Liu, L. Study of low-modulus biomedical β Ti–Nb–Zr alloys based on single-crystal elastic constants modeling. J. Mech. Behav. Biomed. Mater. 2016, 62, 310–318. [Google Scholar] [CrossRef]
  38. Kim, H.Y.; Miyazaki, S. Ni-Free Ti-Based Shape Memory Alloys, 1st ed.; Butterworth-Heinemann: Oxford, UK, 2018. [Google Scholar]
  39. Wang, Q.; Dong, C.; Liaw, P.K. Structural stabilities of β-Ti alloys studied using a new Mo equivalent derived from [β/(α + β)] phase-boundary slope. Metall. Mater. Trans. A 2015, 46, 3440–3447. [Google Scholar] [CrossRef]
  40. Morinaga, M.; Yukawa, N.; Maya, T.; Sone, K.; Adach, H. Theoretical design of titanium alloys. In Proceedings of the Sixth World Conference on Titanium, Cannes, France, 6–9 June 1988; pp. 1601–1606. [Google Scholar]
  41. Abdel-hady, M.; Hinoshita, K.; Morinaga, M. General approach to phase stability and elastic properties of β-type Ti-alloys using electronic parameters. Scr. Mater. 2006, 55, 477–480. [Google Scholar] [CrossRef]
  42. Abdel-hady, M.; Fuwa, H.; Hinoshita, K.; Kimura, H.; Shinzato, Y.; Morinaga, M. Phase stability change with Zr content in β-type Ti-Nb alloys. Scr. Mater. 2007, 57, 1000–1003. [Google Scholar] [CrossRef]
  43. Sadeghpour, S.; Abbasi, S.M.; Morakabati, M.; Kisko, A.; Karjalainen, L.P.; Porter, D.A. On the compressive deformation behavior of new beta titanium alloys designed by d-electron method. J. Alloys Compd. 2018, 746, 206–217. [Google Scholar] [CrossRef]
  44. Mehjabeen, A.; Xu, W.; Qiu, D.; Qian, M. Redefining the β-phase stability in Ti-Nb-Zr alloys for alloy design and microstructural prediction. JOM 2018, 70, 2254–2259. [Google Scholar] [CrossRef] [Green Version]
  45. Kim, H.Y.; Ikehara, Y.; Kim, J.I.; Hosoda, H.; Miyazaki, S. Martensitic transformation, shape memory effect and superelasticity of Ti–Nb binary alloys. Acta Mater. 2006, 54, 2419–2429. [Google Scholar] [CrossRef]
  46. Fu, J.; Yamamoto, A.; Kim, H.Y.; Hosoda, H.; Miyazaki, S. Novel Ti-base superelastic alloys with large recovery strain and excellent biocompatibility. Acta Biomater. 2015, 17, 56–67. [Google Scholar] [CrossRef]
  47. Pavon, L.L.; Kim, H.Y.; Hosoda, H.; Miyazaki, S. Effect of Nb content and heat treatment temperature on superelastic properties of Ti-24Zr-(8-12)Nb-2Sn alloys. Scr. Mater. 2015, 95, 46–49. [Google Scholar] [CrossRef]
  48. Kim, H.Y.; Fu, J.; Tobe, H.; Kim, J.I.; Miyazaki, S. Crystal structure, transformation strain, and superelastic property of Ti–Nb–Zr and Ti–Nb–Ta alloys. Shape Mem. Superelast. 2015, 1, 107–116. [Google Scholar] [CrossRef] [Green Version]
  49. Kim, H.Y.; Miyazaki, S. Martensitic transformation and superelastic properties of Ti-Nb base alloys. Mater. Trans. 2015, 56, 625–634. [Google Scholar] [CrossRef] [Green Version]
  50. Cui, Y.; Li, Y.; Luo, K.; Xu, H. Microstructure and shape memory effect of Ti–20Zr–10Nb alloy. Mater. Sci. Eng. A 2010, 527, 652–656. [Google Scholar] [CrossRef]
  51. Sun, F.; Hao, Y.L.; Nowak, S.; Gloriant, T.; Laheurte, P.; Prima, F. A thermal-mechanical treatment to improve the superelastic performances of biomedical Ti–26Nb and Ti–20Nb–6Zr (at.%) alloys. J. Mech. Behav. Biomed. Mater. 2011, 4, 1864–1872. [Google Scholar] [CrossRef]
  52. Li, S.; Kim, Y.W.; Choi, M.S.; Nam, T.H. Superelastic Ti-18Zr-12.5Nb-2Sn (at.%) alloy scaffolds with high porosity fabricated by fiber metallurgy for biomedical applications. Intermetallics 2019, 115, 106631. [Google Scholar] [CrossRef]
  53. Brozek, C.; Sun, F.; Vermaut, P.; Millet, Y.; Lenain, A.; Embury, D.; Jacques, P.J.; Prima, F. A β-titanium alloy with extra high strain-hardening rate: Design and mechanical properties. Scr. Mater. 2016, 114, 60–64. [Google Scholar] [CrossRef]
  54. Zhao, G.H.; Xu, X.; Dye, D.; Rivera-Díaz-del-Castillo, P.E.J. Microstructural evolution and strain-hardening in TWIP Ti alloys. Acta Mater. 2020, 183, 155–164. [Google Scholar] [CrossRef]
  55. Bignon, M.; Bertrand, E.; Tancret, F.; Rivera-Díaz-del-Castillo, P.E.J. Modelling martensitic transformation in titanium alloys: The influence of temperature and deformation. Materialia 2019, 7, 100382. [Google Scholar] [CrossRef]
  56. Gao, J.; Huang, Y.; Guan, D.; Knowles, A.J.; Ma, L.; Dye, D.; Rainforth, W.M. Deformation mechanisms in a metastable beta titanium twinning induced plasticity alloy with high yield strength and high strain hardening rate. Acta Mater. 2018, 152, 301–314. [Google Scholar] [CrossRef]
  57. Ahmed, M.; Wexler, D.; Casillas, G.; Ivasihin, O.M.; Pereloma, E.V. The influence of β phase stability on deformation mode and compressive mechanical properties of Ti–10V–3Fe–3Al alloy. Acta Mater. 2015, 84, 124–135. [Google Scholar] [CrossRef]
  58. Kim, J.I.; Kim, H.Y.; Inamura, T.; Hosoda, H.; Miyazaki, S. Shape memory characteristics of Ti–22Nb–(2–8)Zr(at.%) biomedical alloys. Mater. Sci. Eng. A 2005, 403, 334–339. [Google Scholar] [CrossRef]
  59. Kumar, K.C.H.; Wollants, P.; Delaey, L. Thermodynamic assessment of the Ti–Zr system and calculation of Nb–Ti–Zr phase diagram. J. Alloys Compd. 1994, 206, 121–127. [Google Scholar] [CrossRef]
  60. Al-Zain, Y.; Kim, H.Y.; Hosoda, H.; Nam, T.H.; Miyazaki, S. Shape memory properties of Ti–Nb–Mo biomedical alloys. Acta Mater. 2010, 58, 4212–4223. [Google Scholar] [CrossRef]
  61. Zhang, J.Y.; Li, J.S.; Chen, Z.; Meng, Q.K.; Sun, F.; Shen, G.L. Microstructural evolution of a ductile metastable β titanium alloy with combined TRIP/TWIP effects. J. Alloys Compd. 2017, 699, 775–782. [Google Scholar] [CrossRef]
  62. Schneider, S.; Schneider, S.G.; Silva, H.M.; Neto, C.M. Study of the non-linear stress–strain behavior in Ti–Nb–Zr alloys. Mater. Res. 2005, 8, 435–438. [Google Scholar] [CrossRef] [Green Version]
  63. Elias, L.M.; Schneider, S.G.; Schneider, S.; Silva, H.M.; Malvisi, F. Microstructural and mechanical characterization of biomedical Ti–Nb–Zr(–Ta) alloys. Mater. Sci. Eng. A 2006, 432, 108–112. [Google Scholar] [CrossRef]
  64. Wei, Q.; Wang, L.; Fu, Y.; Qin, J.; Lu, W.; Zhang, D. Influence of oxygen content on microstructure and mechanical properties of Ti–Nb–Ta–Zr alloy. Mater. Des. 2011, 32, 2934–2939. [Google Scholar] [CrossRef]
  65. Niinomi, M.; Akahori, T.; Katsura, S.; Yamauchi, K.; Ogawa, M. Mechanical characteristics and microstructure of drawn wire of Ti–29Nb–13Ta–4.6Zr for biomedical applications. Mater. Sci. Eng. C 2007, 27, 154–161. [Google Scholar] [CrossRef]
  66. Bönisch, M.; Călin, M.; Humbeeck, J.V.; Skrotzki, W.; Eckert, J. Factors influencing the elastic moduli, reversible strains and hysteresis loops in martensitic Ti-Nb alloys. Mater. Sci. Eng. C 2015, 48, 511–520. [Google Scholar] [CrossRef]
  67. Kwasniak, P.; Wróbel, J.S.; Garbacz, H. Origin of low Young modulus of multicomponent, biomedical Ti alloys-Seeking optimal elastic properties through a first principles investigation. J. Mech. Behav. Biomed. Mater. 2018, 88, 352–361. [Google Scholar] [CrossRef]
Figure 1. Alloy compositions investigated in this study in the isothermal sections of the Ti–Nb–Zr phase diagram at 1173 K [59].
Materials 13 00476 g001
Figure 2. XRD profiles of Ti–Nb–Zr alloys obtained at room temperature: (a) Ti–(24–27)Nb; (b) Ti–(20–23)Nb–4Zr; (c) Ti–(17–20)Nb–8Zr; (d) Ti–(15–18)Nb–12Zr; (e) Ti–(13–16)Nb–18Zr alloys.
Materials 13 00476 g002
Figure 3. SEM micrographs of Ti–Nb–12Zr alloys: (a) Ti–15Nb–12Zr; (b) Ti–16Nb–12Zr; (c) Ti–17Nb–12Zr; (d) Ti–18Nb–12Zr alloys.
Materials 13 00476 g003
Figure 4. Stress-strain curves of Ti–Nb–Zr alloys obtained at room temperature: (a) Ti–Nb–4Zr alloys; (b) Ti–Nb–8Zr alloys.
Materials 13 00476 g004
Figure 5. Nb content dependence of the critical stress for the first yielding for Ti–Nb and Ti–Nb–Zr alloys with various Zr content.
Materials 13 00476 g005
Figure 6. Stress-strain curves of Ti–40Nb and Ti–40Nb–(4, 8, 12) Zr alloys obtained at room temperature.
Materials 13 00476 g006
Figure 7. Stress-strain curves of Ti–40Nb and Ti–40Nb–(4, 8, 12) Zr alloys obtained at room temperature.
Materials 13 00476 g007
Figure 8. DSC curves of the Ti–Nb and Ti–Nb–Zr alloys upon heating: (a) Ti–(23–26)Nb; (b) Ti–(20–23)Nb–4Zr; (c) Ti–(17–20)Nb–8Zr; (d) Ti–(15–18)Nb–12Zr; (e) Ti–(12–15)Nb–18Zr alloys.
Materials 13 00476 g008
Figure 9. Nb content dependence of the As temperature for Ti–Nb and Ti–Nb–Zr alloys.
Materials 13 00476 g009
Figure 10. (a) Nb content dependence of the Young’s modulus for Ti–Nb and Ti–Nb–Zr alloys, and (b) stress-strain curve of Ti–14Nb–18Zr.
Materials 13 00476 g010
Figure 11. Comparison of Young’s modulus of the Ti–Nb based alloys as a function of e/a.
Materials 13 00476 g011
Figure 12. (a) Bo-Md map taken from Reference [41], and (b) newly constructed Ms line in this study.
Materials 13 00476 g012

