Article

Theoretical Study of As2O3 Adsorption Mechanisms on CaO surface

1
Research Institute of Petroleum Processing, SINOPEC, Beijing 100083, China
2
Key Laboratory for Thermal Science and Power Engineering of the Ministry of Education, Department of Energy and Power Engineering, Tsinghua University, Beijing 100084, China
3
Tsinghua University-University of Waterloo Joint Research Center for Micro/Nano Energy and Environment Technology, Tsinghua University, Beijing 100084, China
4
Beijing Engineering Research Center for Ecological Restoration and Carbon Fixation of Saline–alkaline and Desert Land, Tsinghua University, Beijing 100084, China
*
Author to whom correspondence should be addressed.
These authors contributed equally to this work.
Materials 2019, 12(4), 677; https://doi.org/10.3390/ma12040677
Submission received: 23 January 2019 / Revised: 16 February 2019 / Accepted: 18 February 2019 / Published: 25 February 2019
(This article belongs to the Special Issue Micro/Nano Materials for Clean Energy and Environment)

Abstract

:
Emission of hazardous trace elements, especially arsenic from fossil fuel combustion, have become a major concern. Under an oxidizing atmosphere, most of the arsenic converts to gaseous As2O3. CaO has been proven effective in capturing As2O3. In this study, the mechanisms of As2O3 adsorption on CaO surface under O2 atmosphere were investigated by density functional theory (DFT) calculation. Stable physisorption and chemisorption structures and related reaction paths are determined; arsenite (AsO33−) is proven to be the form of adsorption products. Under the O2 atmosphere, the adsorption product is arsenate (AsO43−), while tricalcium orthoarsenate (Ca3As2O8) and dicalcium pyroarsenate (Ca2As2O7) are formed according to different adsorption structures.
Keywords:
CaO; As2O3; DFT; adsorption

1. Introduction

Arsenic is a hazardous element existing in fossil fuels such as coal and petroleum [1]. According to the properties of arsenic and its compounds, it has been classified as volatile trace element by Clark and Sloss [2]. During combustion or chemical industry processes, gaseous arsenic is released into the environment. Excess amounts of arsenic can pollute water and soil. The exposure of arsenic to human may lead to hyperpigmentation, keratosis, skin and lung cancers with high possibility [3,4]. Arsenic compounds (including inorganic arsine) have been identified as hazardous air pollutants by the US government since 1990 [5]. The concentration of atmospheric arsenic in China is 51.0 ng/m3, which is much higher than the limit of NAAQS (6.0 ng/m3, GB 3095-2012) and the limit of WHO (6.6 ng/m3, WHO) [6].
Combustion of fossil fuels, especially coal, is one of the main sources for anthropogenic emission of atmospheric arsenic [7]. It was estimated that 335.5 tons of atmospheric arsenic were emitted from Chinese coal-fired plants in 2010 [8]. In 2011, the US Environmental Protection Agency issued the Mercury and Air Toxics Standards (US, MATS, updated in 2016). An arsenic emission limit of 3.0 × 10⁻³ lb/MWh (approximately 0.41 μg/m3) was set for coal-fired power plants [9]. In Chinese coal-fired power plants, the control of arsenic still remains scarce, but there are increasing interests in understanding its transformation in flue gas and developing emission reduction techniques.
Under an oxidizing atmosphere, gaseous As2O3 should be the main form of arsenic combustion products [10]. It has been proven that CaO could adsorb As2O3 in the coal-fired flue gas, and the dominating products were arsenate (AsO43−) [11,12,13,14]. CaO component in fly ash leads to the enrichment of arsenic [15,16,17,18]. R.O. Sterling [11] found that CaO could effectively adsorb As2O3 at 600 °C and 1000 °C; the adsorption products were Ca3As2O8 when O2 existed. Jadhav [12] studied the adsorption products of As2O3 on a CaO surface under O2 atmosphere between 300 °C and 1000 °C. X-ray photoelectron spectroscopy (XPS) and X-ray Diffraction (XRD) reflected that, when temperature was lower than 600 °C, the adsorption product was Ca3As2O8; when temperature was between 700 °C and 900 °C, the adsorption products was Ca2As2O7; and when temperature was as high as 1000 °C, the adsorption product was Ca3As2O8. He also revealed that SO2 and HCl played a weak role in adsorption. Li [13,14] studied the influence of CO2 and SO2 on the capture of As2O3 by CaO. The existence of SO2 and CO2 did not change the form of arsenic in adsorption products. The previous study certified the strong adsorption of As2O3 on CaO surface and the important role O2 played in the reaction. However, the acute toxicity and low concentration of arsenic significantly limit the experimental research of As2O3 adsorption. The adsorption mechanisms still remain unclear, especially the composition of adsorption active sites and product structures.
Quantum chemistry calculation based on density functional theory (DFT) has become an effective method to simulate structures [19] and surface reaction of volatile trace elements [20]. For example, the adsorption of As0 on a CaO (001) surface has been effectively studied by Zhang [21]. In this study, the adsorption structures and the detailed adsorption steps between the CaO surface and As2O3 (under O2 atmosphere) have been studied by advanced DFT calculation, with the aim to offer microscopic information about critical reactions, and thus, to provide guidance to develop more efficient adsorbents and related control technologies.

2. Methods and Modeling

2.1. Methods

The material studio CASTEP [22,23] module was applied in the DFT calculation. The GGA (Generalized Gradient Approximation) and PBE [24] (Perdew-Burke-Ernzerhof) were chosen to describe the exchange and correlation interactions. The electronic wave functions were expanded on a plane wave basis with cut-off energy of 380 eV. The ultra-soft pseudo potential was referred to describe the interactions between electrons and the ionic cores [25]. ‘The spin-polarized’ option was selected for ‘spin-unrestricted’ calculations [26]. The BFGS (Broyden-Flechter-Goldfarb-Shanno) optimization algorithm was chosen for geometry optimization [27]. The transition state and reaction path (intermediate states) was determined by using the complete Linear Synchronous Transit/Quadratic Synchronous Transit (LST/QST) method [28] and confirmed by the Nudged-Elastic Band (NEB) method [29].
The convergence criteria of geometry optimization included: (a) self-consistent field (SCF) of 5.0 × 10⁻⁷ eV/atom; (b) energy of 5 × 10⁻⁶ eV/atom; (c) displacement of 5 × 10⁻⁴ Å; (d) force of 0.01 eV/Å; and (e) stress of 0.02 GPa. The convergence of complete LST/QST method (RMS, Root Mean Square) was set to 0.05 eV/Å. The convergence criteria of NEB included: (a) energy of 1.0 × 10⁻⁵ eV/atom; (b) max force of 0.05 eV/Å; and (c) max displacement of 0.004 Å.
The adsorption energy (Eads) was defined as follows:
Eads = Epro − (Eslab + Eadsorbate)
where Epro was the total energy of adsorption product, Eslab was the total energy of the slab model, and Eadsorbate was the total energy of isolated adsorbate As2O3 or O2 at its equilibrium geometry. A negative Eads value represented a stable adsorption system.

2.2. Modeling

The energy of CaO crystal cell was converged with 6 × 6 × 6 k points in the Monhorst-pack grid [30]. The equilibrium geometry of As2O3 and O2 was examined in a cell of 20 × 20 × 20 Å3 periodic box. As shown in Table 1, the values of the calculated bond lengths, angles, and lattice parameters are consistent with the data reported from the previous study, indicating the reliability of the calculation.
In our previous study, the CaO(001) slab model has been widely used for CO2 [35], Se0 [36] and SeO2 [37] heterogeneous adsorption reaction, in which the good consistency with experimental work has been proven. Similarly, a 4-layer 3 × 3-surface CaO (001) slab was modeled to describe the CaO surface between CaO and As2O3 in this study. The superficial two layers of atoms were relaxed while the rest layers were fixed [38]. The vacuum region between slabs was set to 10 Å to avoid interactions among periodic images [39]. The energy of slab models and related adsorption structures were converged with 2 × 2 × 1 k points in the Monhorst-pack grid. The detailed modeling process was put in the Supplementary Materials (Optimization of slab model section: Tables S1 and S2).

3. Results and Discussions

According to the spatial position of As2O3 and surface atoms distribution, three groups, including twenty-one possible As2O3 structures, were first modeled as the initial structures for optimization (provided in Figure S1). After the geometric optimization of the initial structures, plenty of adsorption structures were validated, then the possible reaction paths were calculated. Based on the minimal point of the reaction paths, additional stable structures were acquired. Most of the physisorption structures were similar in terms of structural pattern and close in terms of energy level; thus, three representative physisorption structures (adsorption energy higher than −100 kJ/mol [40]) were determined. Additionally, ten chemisorption structures (adsorption energy lower than −100 kJ/mol [40]) were identified. Based on these structures, various adsorption paths were finally confirmed. For briefness, the nth physisorption structure was abbreviated as Pn, while the nth chemisorption structure was abbreviated as Cn.

3.1. Stable Sorption Structures

3.1.1. Stable Physisorption Structures

Three representative physisorption structures have been shown in Table 2. The dominating differences are the number of As2O3’s O bonded with superficial Ca and the distribution of the superficial Ca occupied by As2O3’s O. Three types of physisorption follow the crystal orientation <100>, <110> and <110>, respectively. Two or three superficial Ca is close to As2O3’s O, and the bond length is about 2.380 Å to 2.876 Å. The corresponding adsorption energy ranges from −65.8 kJ/mol to −58.4 kJ/mol. Based on electron density cloud, physisorption active sites are composed of superficial Ca atoms that interact with O of As2O3.

3.1.2. Stable Chemisorption Structures

Ten chemisorption structures were obtained, with Eads ranging from −198.5 kJ/mol to −391.4 kJ/mol, which implies strong chemisorption. Superficial Ca is close to As2O3’s O, the bond length is about 2.269 Å to 2.528 Å, while superficial O is close to As2O3’s O, the bond length is 1.788 Å to 2.086 Å. According to electron density cloud and bong length, chemisorption active sites are superficial O atoms that interact with As of As2O3. According to the adsorption energy and structure (i.e., the positions of As and O), four categories were classified in Table 3:
  • Category I: As2O3’s As is located on the hollow site
  • Category II: All of As2O3’s O is located on or close to superficial Ca top site
  • Category III: As2O3 transforms into a spoon-shaped structure
  • Category IV: All of As2O3’s As is located on two neighboring superficial O top site

3.2. Adsorption Process

Due to the continuity of energy, the adsorption process can be characterized as an energy-drop process, including both physisorption and chemisorption.

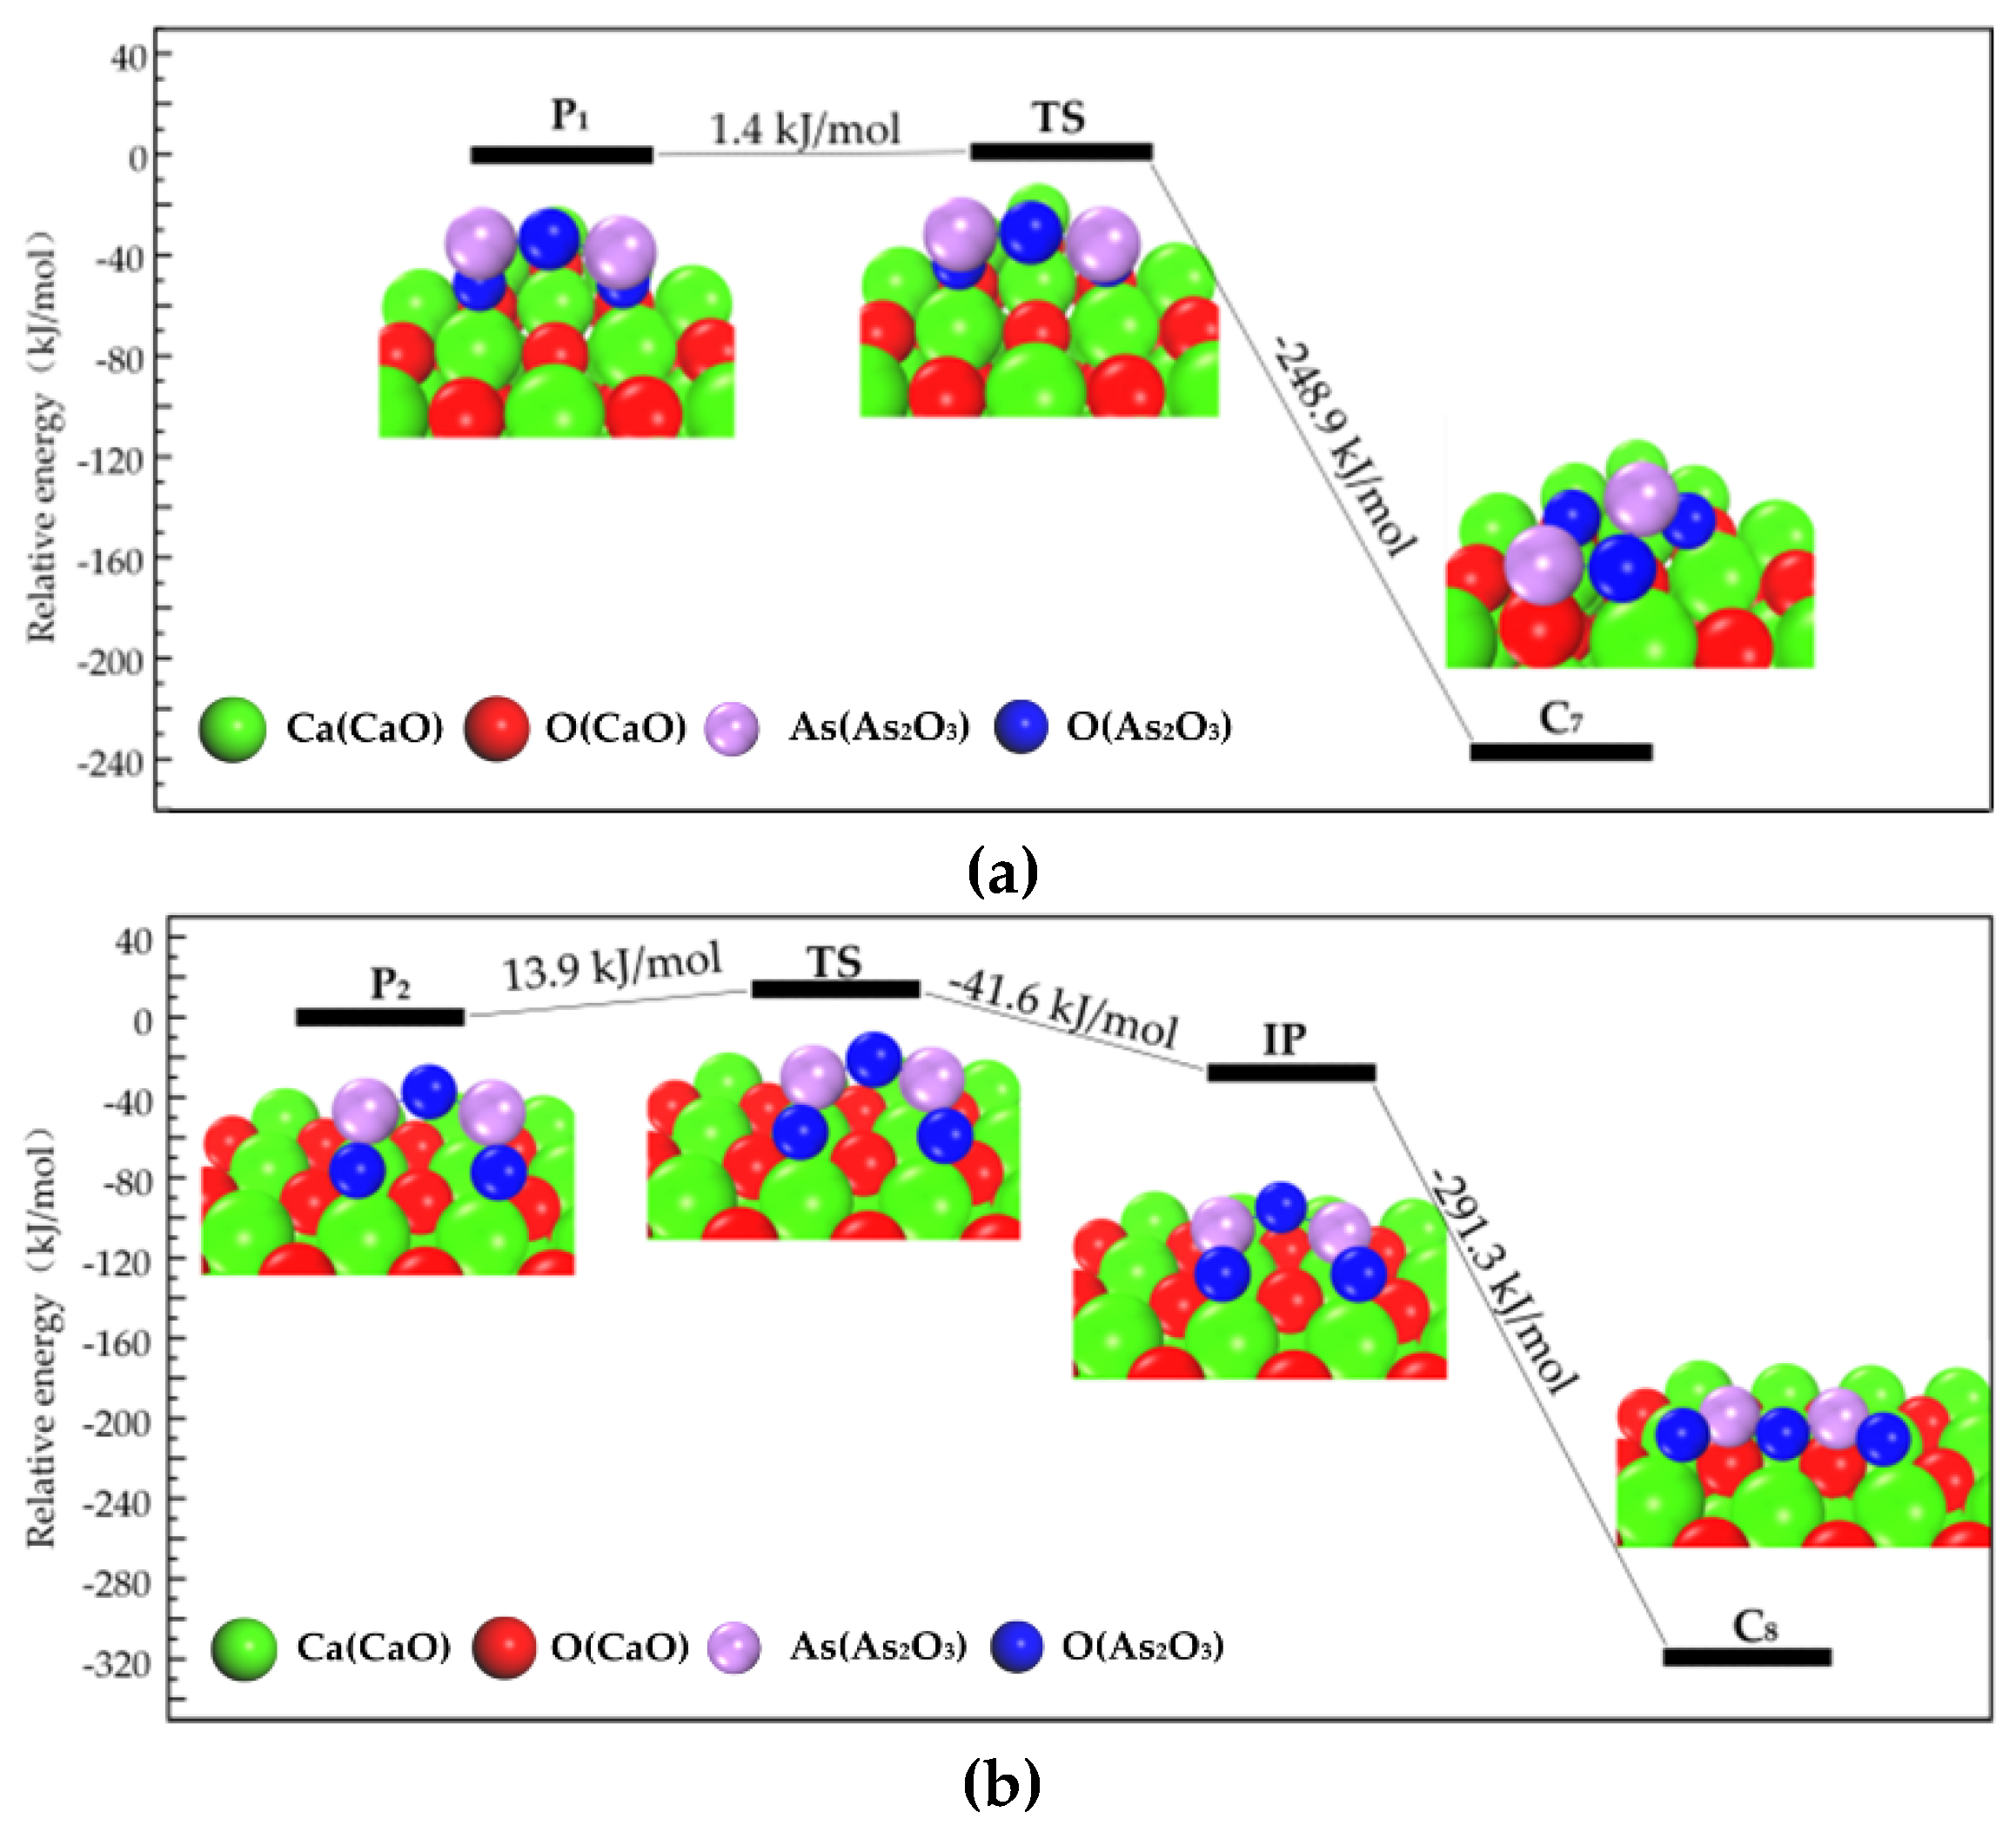
3.2.1. Transformation Process of Physisorption Structures to Chemisorption Structures

In the following part, the transition state number n is abbreviated as TSn, and the intermediate position number n is abbreviated as IPn, for short.
As shown in Figure 1, when As2O3 approaches the surface with vibration along the surface, the physisorption structure transforms into a chemisorption structure during one or two transition state. For instance, P1 to C7 (Figure 1a), P2 to C8 (Figure 1b) and P3 to C8 (Figure 1c). The energy barrier is low, from 1.4 kJ/mol to 13.9 kJ/mol, suggesting that the physisorbed As2O3 is not stable enough and could be easily transformed into chemisorption structures by thermal vibration.

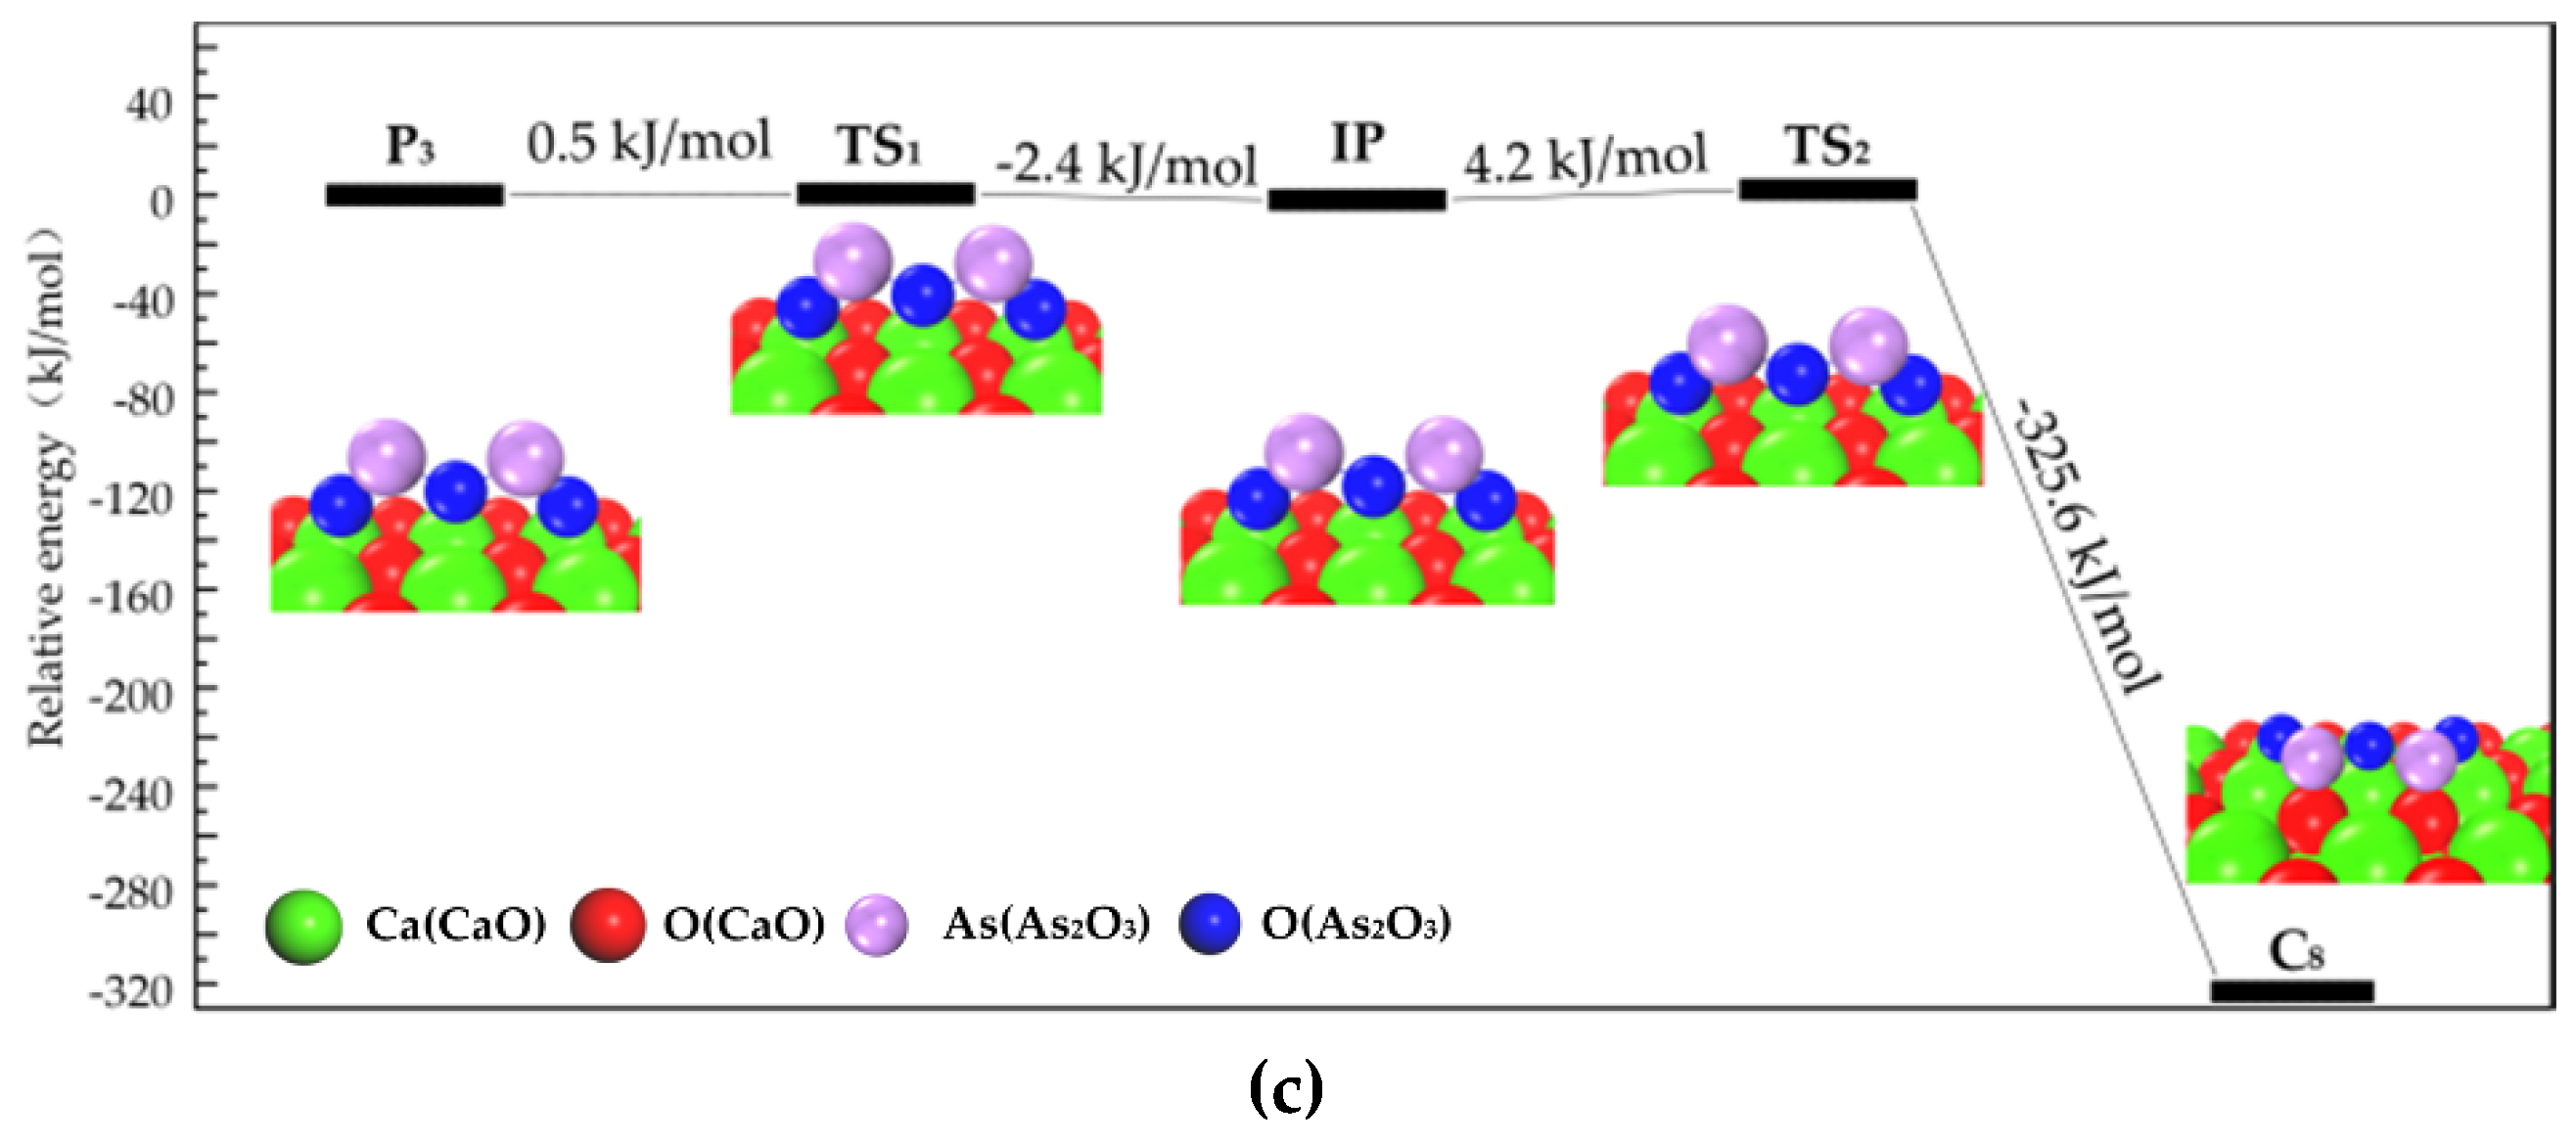
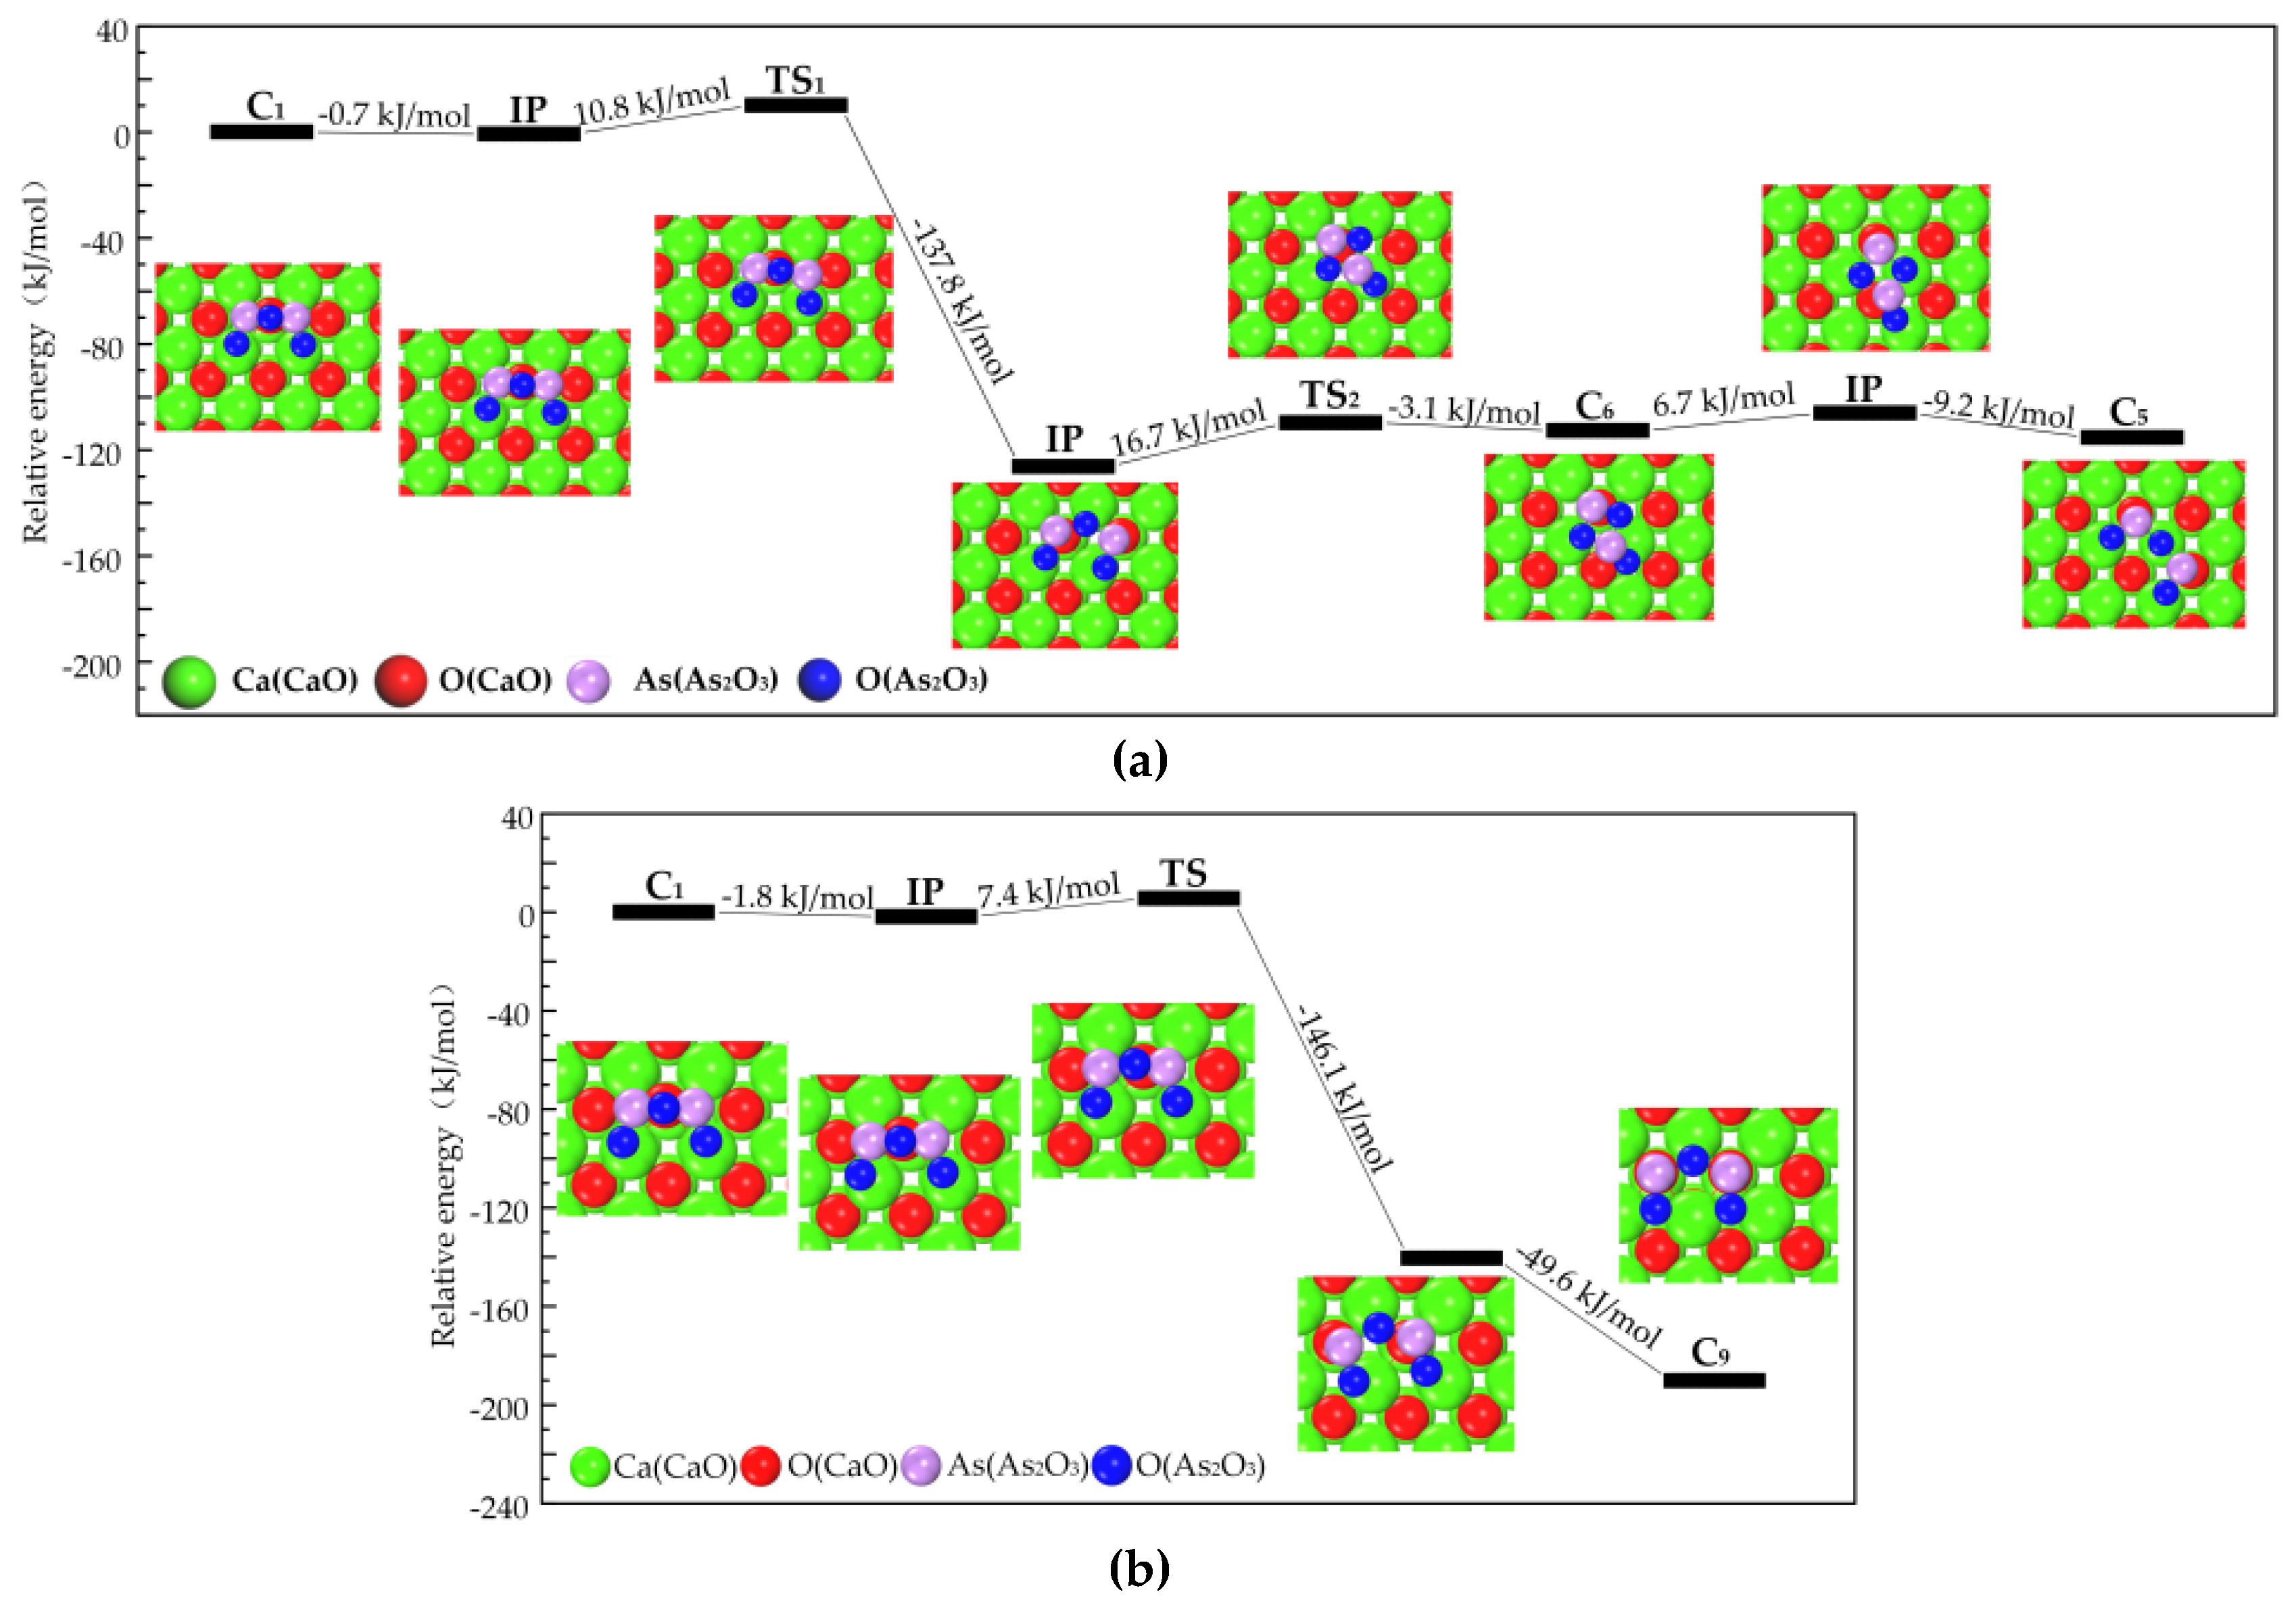
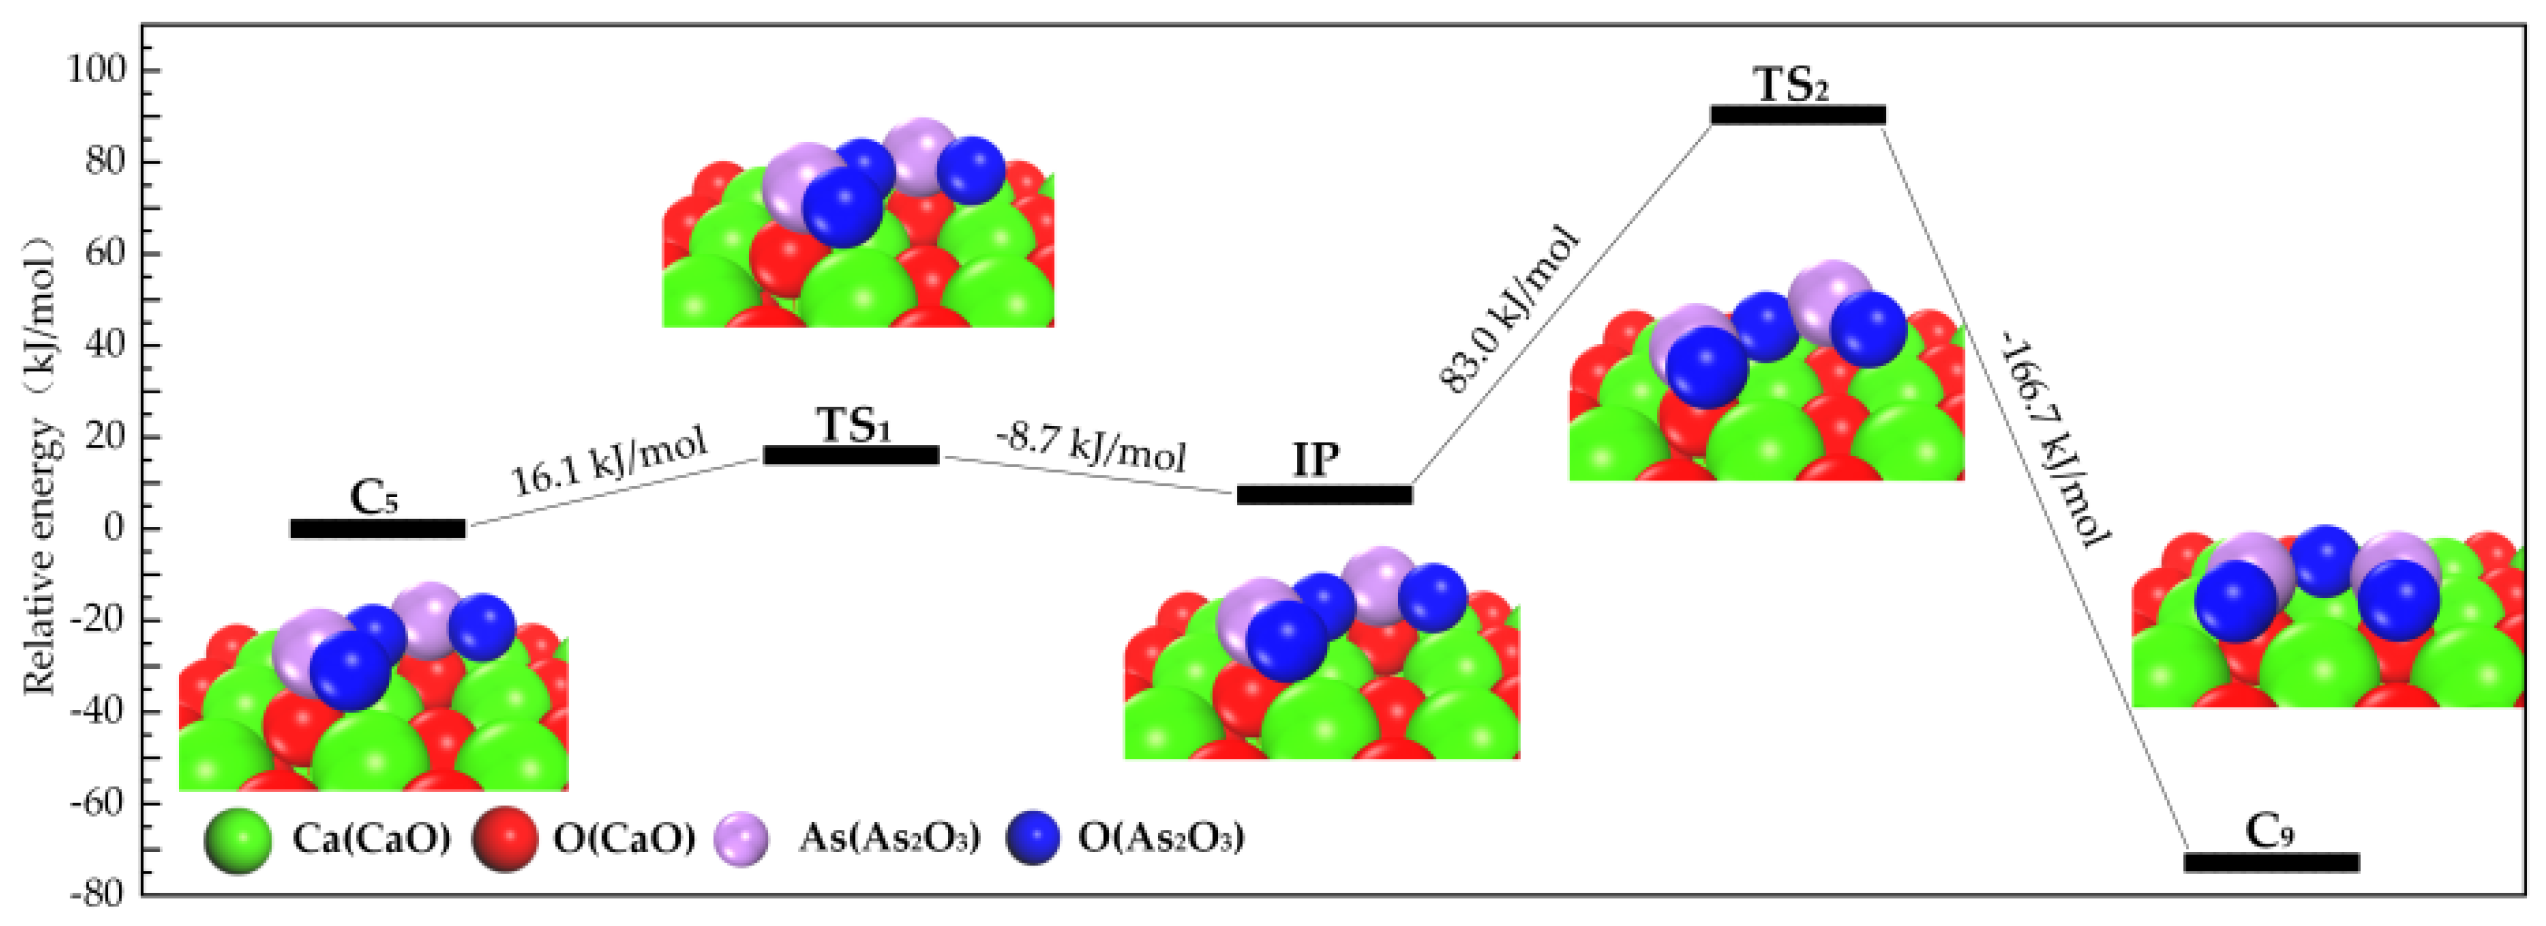
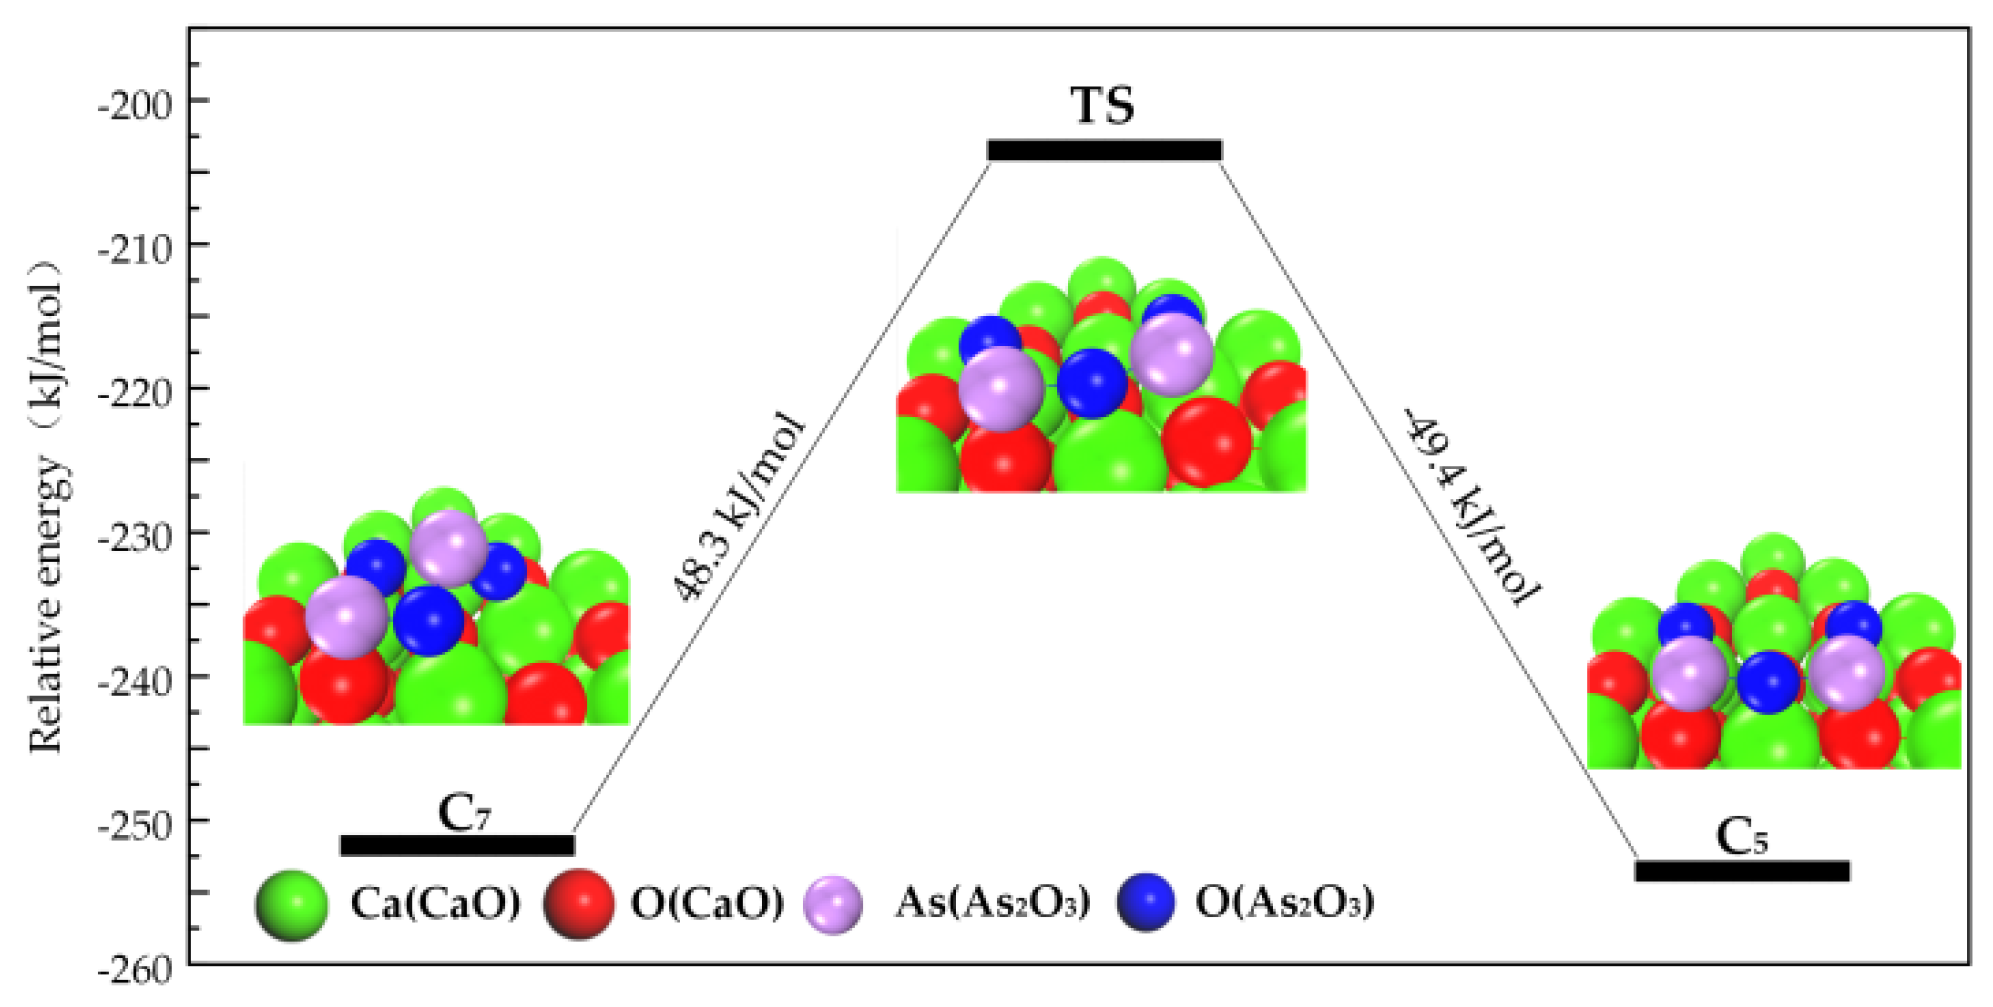
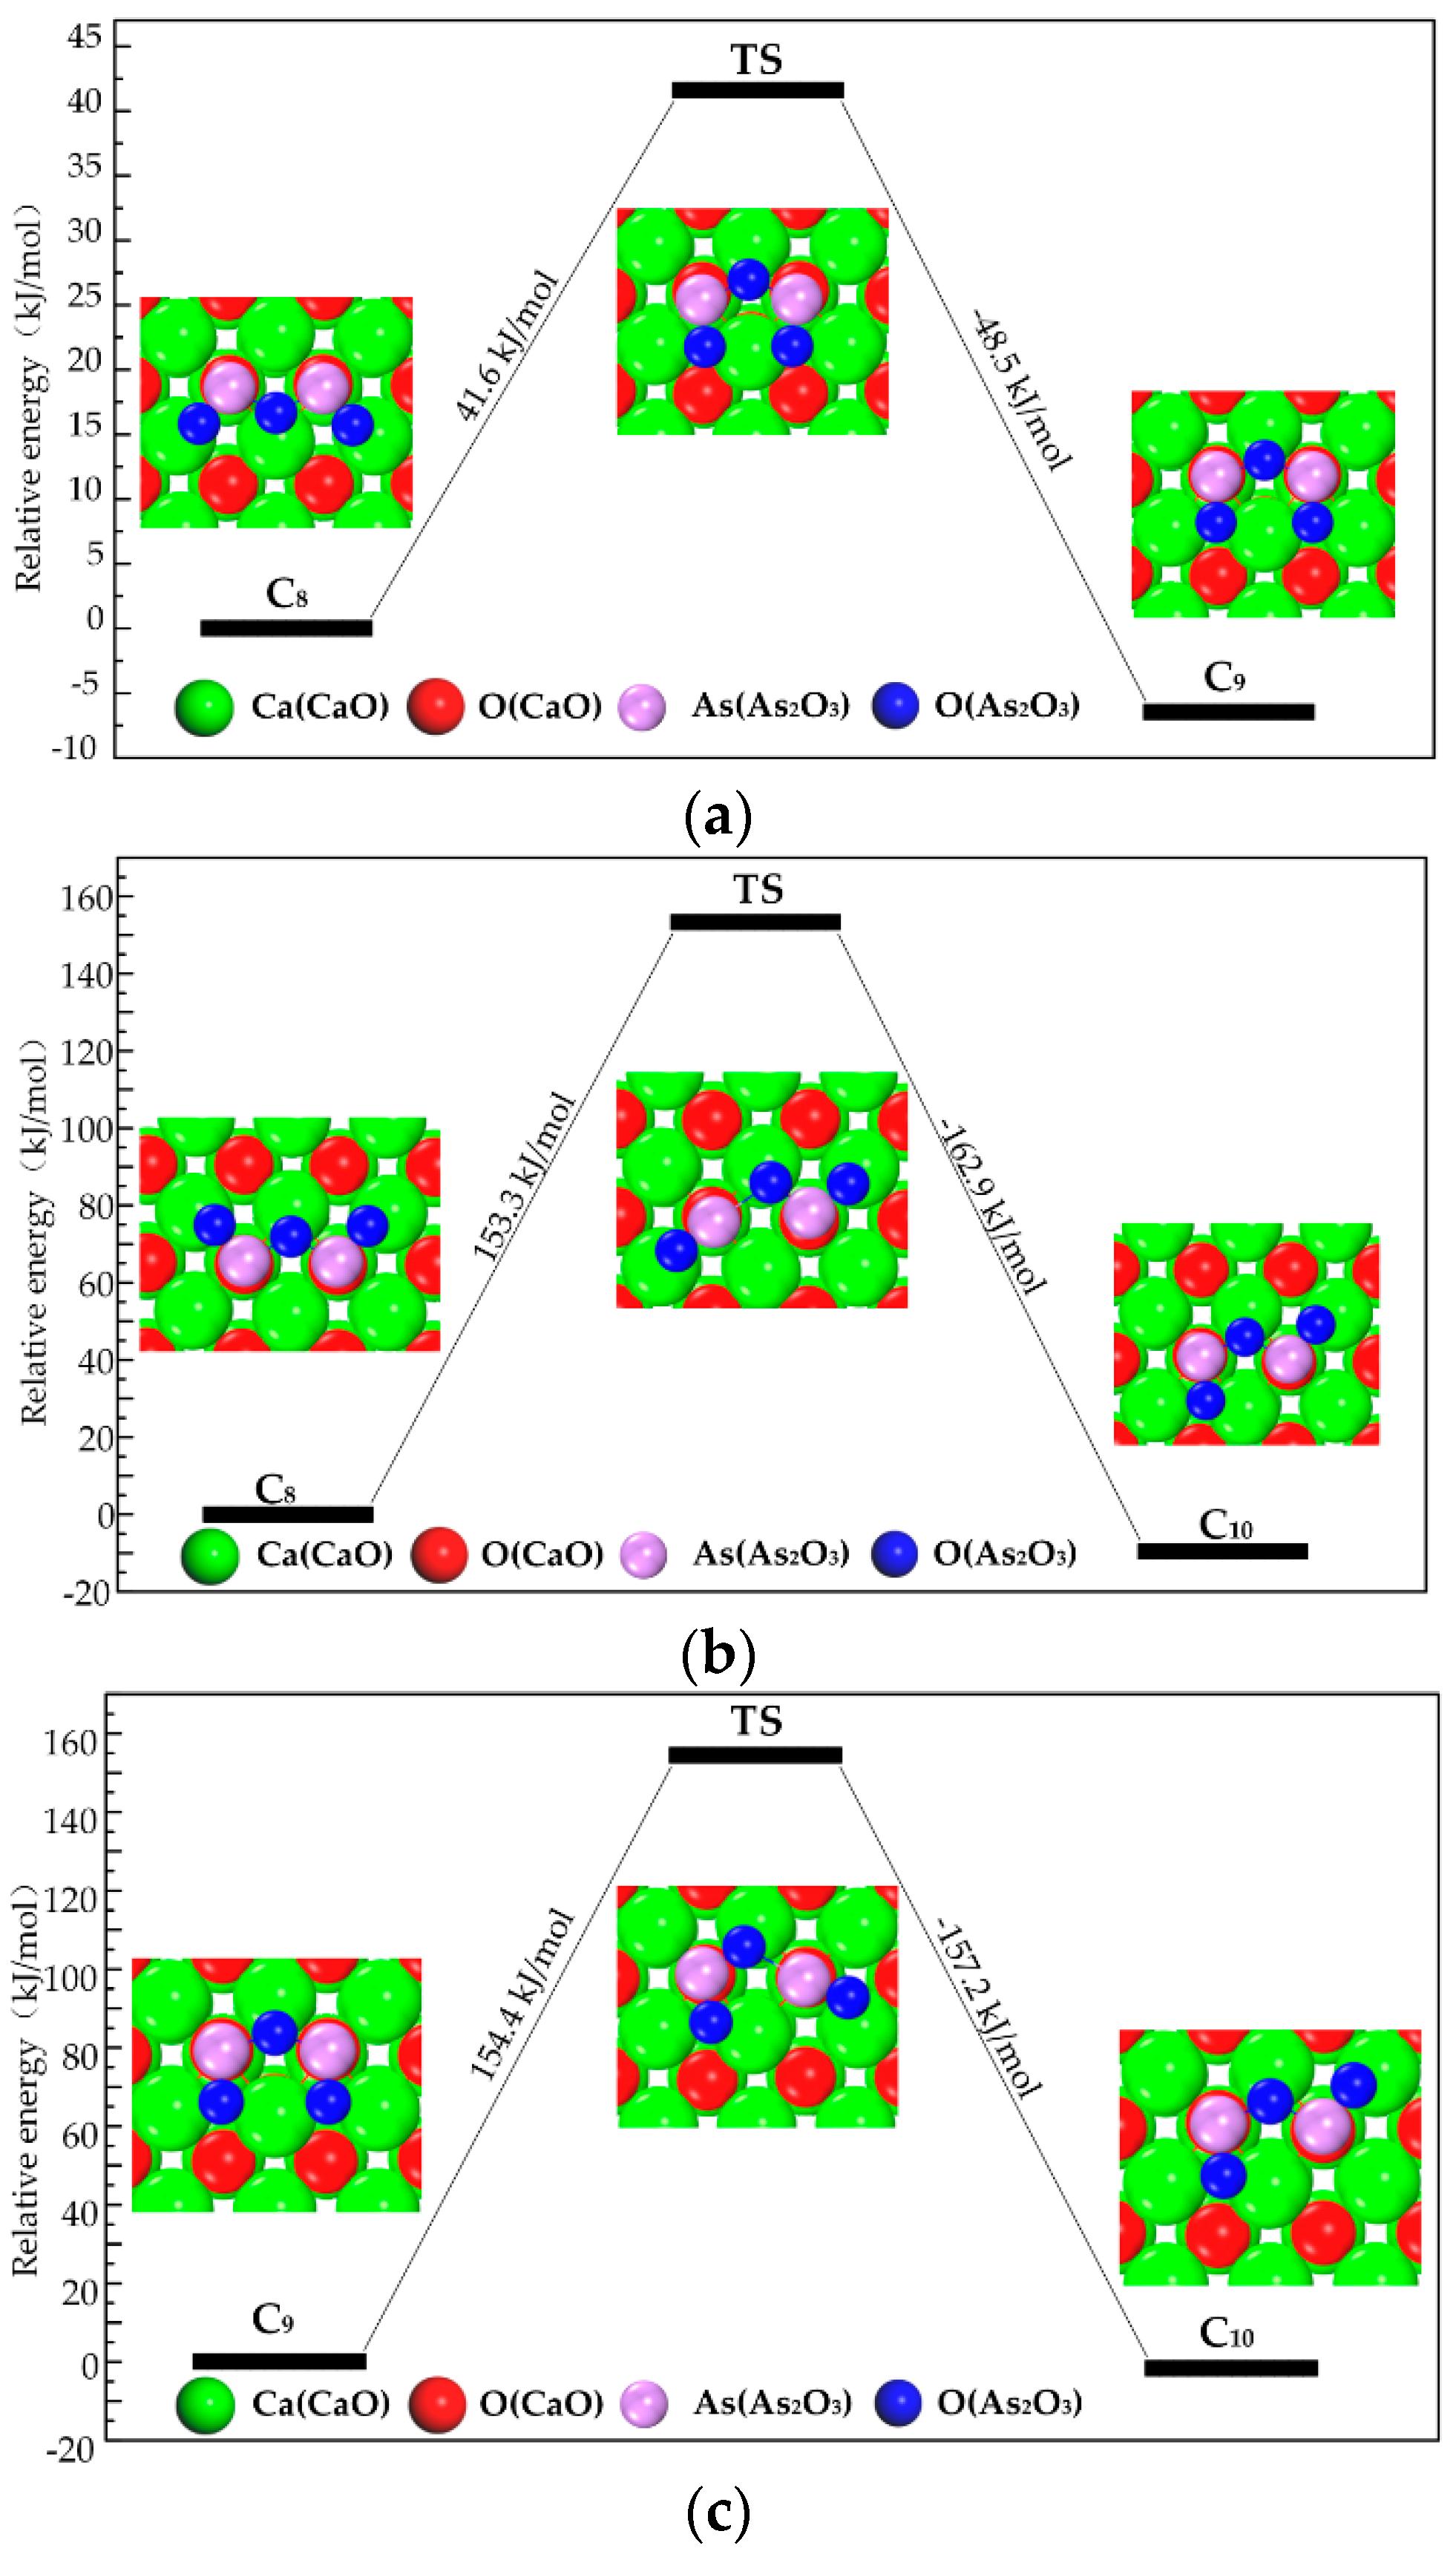
3.2.2. Transformation Process of Chemisorption Structures

Chemisorbed As2O3 gradually transforms into more stable structures. Different possible reaction paths were calculated. The four categories of chemisorption structures can be sorted by the Eads of each as Category IV < Category III ≈ Category II < Category I.
Category I has relatively high energy, i.e., relatively low stability, its transformation to Category II, III and IV could be triggered by molecular thermal vibration.
The pathway that Category I transforms to Category II is shown in Figure 2. Firstly, C1 transforms into C6 (Category II) and then C5 (Category III), with the energy barrier of 10.8 kJ/mol, 16.7 kJ/mol, and 6.7 kJ/mol, respectively. As shown in Figure 2, Category I transforms into Category IV along with another reaction path, the related energy barrier is 7.4 kJ/mol. The relatively low energy barrier suggests that Category I is not stable enough, and could easily transform to Category II, III and IV.
The reaction path of Category II is shown in Figure 3. C3 firstly transforms into intermediate and then converts to C9. The corresponding energy barrier is 16.1 kJ/mol and 83.0 kJ/mol, proving that Category II transforms to Category IV with the special direction of thermal vibration.
Structures of Category III can transform into Category II, as shown in Figure 4. The spoon-shaped structure of As2O3 in C7 disappears and then overcomes a 48.3 kJ/mol energy barrier to transform to C5, indicating the conversion of Category III to Category II.
Category IV is the most stable category. C8, C9, and C10 can transform into each other (shown in Figure 5). As2O3’s As does not move during the transformation. When all of As2O3’s O in C8 vibrate, C8 converts to C9, and the energy barrier is 41.6 kJ/mol (Figure 5a). When one of As2O3’s O in C8 vibrates, C8 converts to C10, and the energy barrier is 153.3 kJ/mol (Figure 5b). When one of the oxygen atoms of As2O3 in C9 vibrates, C9 converts to C10, and the energy barrier is 154.4 kJ/mol (Figure 5c). The difference in energy barrier is caused by the movement distance of As2O3’s O being motivated by thermal vibration. In the first reaction, the movement distance of As2O3’s O is shorter than that in the second and third reactions, which demands relatively lower energy to overcome the energy barrier.

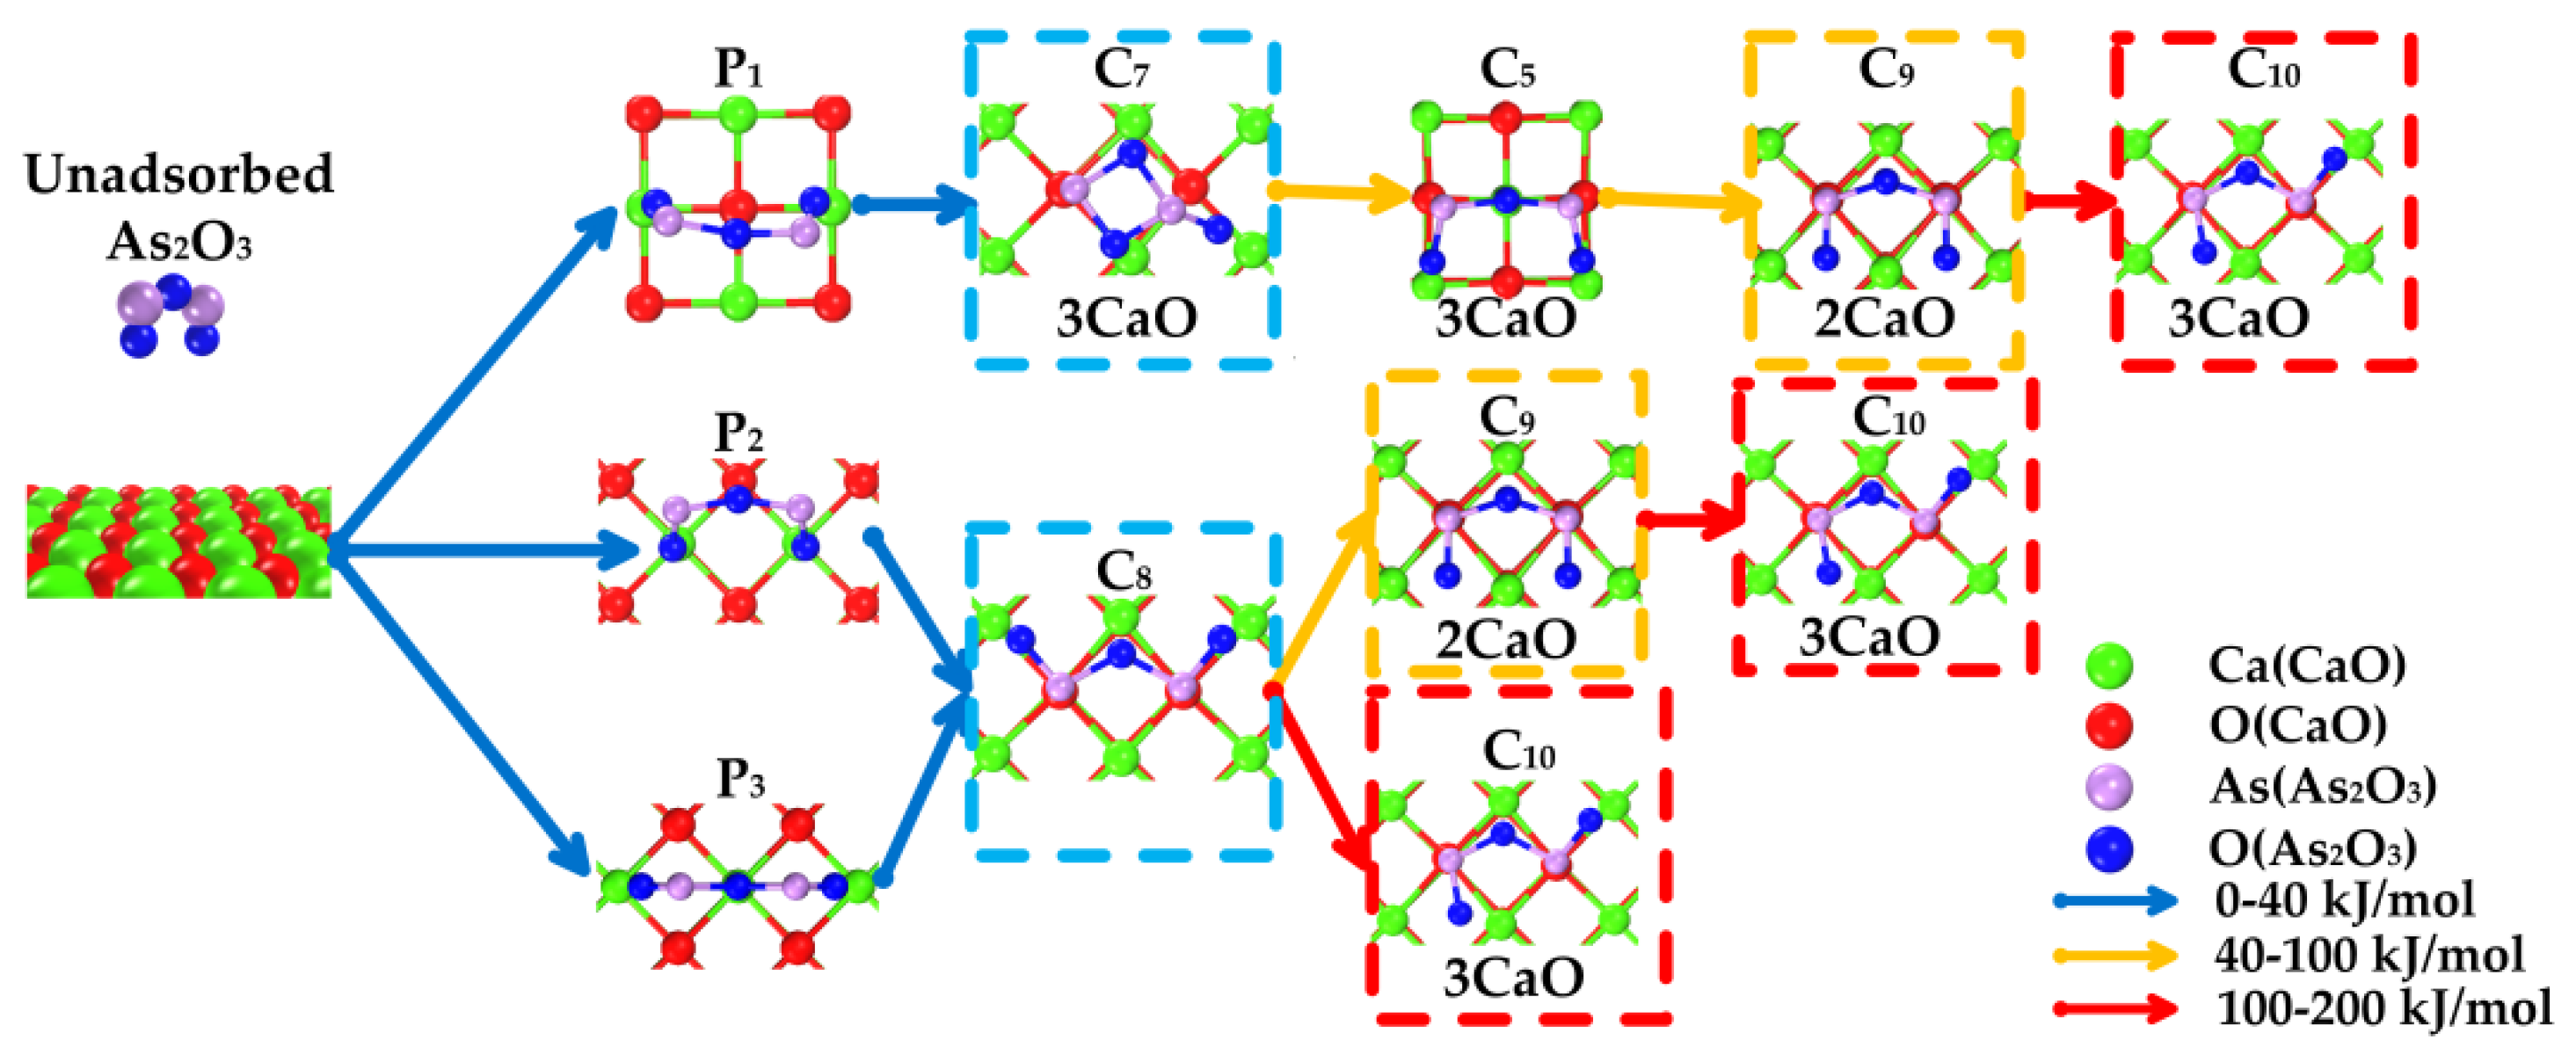
3.3. Path of the Reaction

According to above-mentioned processes, the reaction paths can be concluded as follows; firstly, the isolated As2O3 is physisorbed on a CaO surface (As2O3’s O weakly interacts with superficial Ca); secondly, the physisorbed As2O3 transforms to chemisorbed As2O3. (As2O3’s As interacts with superficial O); and thirdly, due to thermal vibration, the chemisorbed As2O3 transforms into more stable chemisorbed As2O3 (the position of As2O3’s O changed).
The adsorption path of As2O3 was summarized as the process shown in Figure 6. These reactions could be classified as three types according to the energy barrier with the aim to reflect the intensity of the required reaction temperature. The number of superficial CaO occupied by As2O3 is also considered in order to describe the adsorption reaction equation.
Blue arrow: energy barrier is in the range of 0–40 kJ/mol, suggesting that reaction is likely to occur under a relatively low-temperature condition.
Yellow arrow: energy barrier is in the range of 40–100 kJ/mol, suggesting that reaction is likely to occur under a relatively medium-temperature condition.
Red arrow: energy barrier is in the range of 100–200 kJ/mol, suggesting that reaction is likely to occur under a relatively high-temperature condition.
Figure 6 reveals that three main reaction paths may exist:
  • As2O3 → P1 → C7 → C9 →C10;
  • As2O3 → P2 or P3 → C8 → C9 → C10;
  • As2O3 → P2 or P3 → C8 → C10.
Under a relatively low-temperature condition (blue arrow, 0–40 kJ/mol), the main products are C7 and C8 (blue grid). Three superficial Ca and one or two superficial O are involved in the reaction, representing three CaO participates in the adsorption. The adsorption equation could be written as:
As2O3 + 3 CaO → Ca3As2O6
Under a relatively medium-temperature condition (yellow arrow, 40–100 kJ/mol), the main products are C9. Two superficial Ca and two superficial O participate in the structure. The adsorption equation could be written as:
As2O3 + 2 CaO → Ca2As2O5
Under a relatively high-temperature condition (red arrow, 100–200 kJ/mol), the main product is C10. Three superficial Ca and two superficial O are involved in the reaction (hollow Ca represents 1/2 Ca atom). The adsorption equation could be written as:
As2O3 + 3 CaO → Ca3As2O6
With the reaction temperature increases, adsorption product changes from Ca3As2O6 to Ca2As2O5 and back to Ca3As2O6 again. Different microcosmic adsorption structures lead to different macroscopic products and reaction equation.
Besides, as shown in Figure S2, the paths of C1 transforming to other structures have been also been found. However, no possible paths which isolated or physisorbed As2O3 transforms to C1 has been found, implying C1 is unstable or nonexistent.

3.4. Partial Density of States (PDOS)

The change PDOS of As2O3 and CaO was put in the Supplementary Materials (Figure S3). For As2O3, the PDOS of physisorption structure 1, 2, and 3 are similar to each other. As the physisorption structure transforms to C7, the p state orbitals near Fermi level (from −0.6 eV to 1.9 eV) drift to lower energy level, meanwhile get energy splitting and orbital reorganization, caused by the changing of As2O3 structure and the combination between As2O3’s As and superficial O. When C7 transforms to C5, s state orbital (−17.2 eV) energy level splits into two peaks of −18.0 eV and −16.9 eV, which is caused by the As-O bond breaking and the bonding between As and superficial O. When C5 transform to C8, the p state orbital (3.7 eV) and s state orbital (−17.9 eV) energy level both split slightly. This is the result of the slight change in the surface distribution of As2O3. As the adsorption products have close energies and structures, PDOS of C9 and C10 are basically similar to C8.
For CaO slab surface, when an As2O3 molecule is physisorbed on the surface, little change of PDOS is detected. When As2O3 is chemisorbed, it can be seen that the superficial p orbitals around Fermi level (from −2.7 eV to 0.4 eV) drift to a lower energy range (from −5.8 eV to 0.2 eV). Moreover, a small peak (−16.8 eV) is separated from s orbitals (peak at −14.6 eV), proving that s orbitals participate in the chemisorption to some extent. Superficial p state orbitals near Fermi level play an important role in the chemisorption of As2O3. It suggests that the CaO surface’s property of capturing As2O3 might be improved by increasing the quantities of superficial p orbitals near Fermi level.

3.5. Influence of O2 on Adsorbed As2O3

Under the flue gas atmosphere, especially O2-containing atmosphere, O2 reacts with chemisorbed As2O3; i.e., arsenite (AsO33−) is oxidized to arsenate (AsO43−). As an example, two stable chemisorption structures (C5, C9) identified previously were presented in Table 4. The distance between As2O3’s As and O2’s O is 1.763–1.764 Å, which is close to the As-O bond length of As2O3 (1.628 Å). The distance between O2’s O and superficial Ca is 2.247–2.263 Å. According to the electron density cloud, one of O2’s O overlaps with As2O3’s As. The other O of O2 overlaps slightly with the superficial Ca.
Based on Figure 6 and Table 4, the reaction equation of adsorption under O2 atmosphere can be written as Equations (5)–(7), corresponding to low-temperature, medium-temperature, and high-temperature adsorption, respectively.
3CaO + As2O3 + O2 → Ca3As2O8
2CaO + As2O3 + O2 → Ca2As2O7
3CaO + As2O3 + O2 → Ca3As2O8
With the increase of reaction temperature, adsorption product changed from Ca3As2O8 to Ca2As2O7 and then to Ca3As2O8 in an O2-containing atmosphere. According to this research, the product under low-temperature and high-temperature conditions is Ca3As2O8 with different structures, i.e., crystalline form. Under a medium-temperature condition, the main product is Ca3As2O7.
Previous experimental research consistently reflected that the adsorption product with O2 existence is AsO43−, while different opinions existed regarding the adsorption structures. The study of Jadhav [12] found that the adsorption product obtained under 500 °C was mainly Ca3As2O8 (JCPDS No.01-0933). Under 700 °C and 900 °C, the product was Ca2As2O7 (JCPDS No.17-0444). When the temperature increased to 1000 °C, the reaction product was Ca3As2O8 (JCPDS No.26-0295). Mahuli [41] (600 °C and 1000 °C) and Sterling [11] (800 °C) found that the adsorption product was Ca3As2O8 (JCPDS No. 26-0295), while the sorbent used by Mahuli was Ca(OH)2. Li [13] found that the product obtained under 600 °C mainly belonged to Ca3As2O8 crystal structure (JCPDS No. 01-0933), and another kind of Ca3As2O8 crystal (JCPDS No. 73-1928) was identified for the products obtained under 800 °C and 1000 °C.
The role of temperature on adsorption product transformation is qualitatively described. The more detailed description of the product layer development is associated with many other factors, such as the concentration and flow rate of As2O3 and O2, and the quantity and granular size of CaO. The quantitative description of the adsorption process is still a very difficult challenge. Nevertheless, the DFT calculation findings revealed by this study could directly explain the experimental results obtained by previous researchers, which might provide some meaningful insight to understand the process of As2O3 adsorption on CaO.

4. Conclusions

The mechanisms of As2O3 adsorption on a CaO surface have been studied by using DFT calculation; conclusions are as follows:
(1)
Physisorption active sites are composed of superficial Ca atoms that interact with O of As2O3. Chemisorption active sites are superficial O atoms that interact with As of As2O3;
(2)
The adsorption process can be described as follows: the isolated As2O3 molecule is firstly adsorbed on the CaO surface by physisorption, and then physisorbed As2O3 will transform to chemisorbed As2O3. Due to thermal vibration, the chemisorbed As2O3 would overcome the energy barrier and transform to a more stable chemisorbed As2O3 state. The adsorption product is AsO33−;
(3)
The adsorption products of As2O3 under an O2-containing atmosphere are AsO43−. The adsorption product’s structure is influenced by the adsorption temperature. Under relatively low-temperature, the product is Ca3As2O8; under relatively medium-temperature, the product is Ca3As2O7; and under relatively high-temperature, the product is Ca3As2O8.
The consistency between DFT calculation and the previous experiments proves high possibilities to design and optimized the CaO-based adsorbents by modifying O sites or other elements. Besides, other flue gases such as SO2 or CO2 can be involved in the following study to achieve materials design under real flue gas conditions. The optimized CaO-based adsorbents should be of high industrial value, could be applied in the injection of limestone into the furnace, CaO looping reactor, and dry desulfurization, etc.

Supplementary Materials

The following are available online at https://www.mdpi.com/1996-1944/12/4/677/s1. Table S1: Changes in physical and chemical properties of different surface size; Table S2: Changes in physical and chemical properties of different layers; Figure S1: Initial adsorbate structures; Figure S2: Paths and structures of the physisorption and chemisorption reaction from chemisorption structure 1; Figure S3: PDOS of As2O3 and CaO surface during physisorption and chemisorption (a. PDOS of As2O3 molecule; and b. PDOS of CaO surface).

Author Contributions

Research Design, Y.F. and Y.Z.; Data collection, Y.F.; Data analysis, Y.F., Q.W., S.D., P.H. and D.L.; Figures and Tables, Q.W.; Manuscript draft, Y.F., Q.W., Y.Z. and S.D.; Manuscript revise, P.H. and D.L.

Funding

This work was financially supported by the National Natural Science Foundation of China No. 51776107.

Conflicts of Interest

The authors declare no conflict of interest.

References

  1. Liu, R.; Yang, J.; Xiao, Y.; Liu, Z. Fate of Forms of arsenic in Yima coal during pyrolysis. Energy Fuels 2009, 23, 2013–2017. [Google Scholar] [CrossRef]
  2. Clarke, L.B.; Sloss, L.L. Trace Elements-Emissions from Coal Combustion and Gasification; IEA Coal Research: London, UK, 1992; Volume 8, pp. 1822–1826. [Google Scholar]
  3. Gao, J.; Yu, J.; Yang, L. Urinary arsenic metabolites of subjects exposed to elevated arsenic present in coal in Shaanxi province, China. Int. J. Environ. Res. Public Health 2011, 8, 1991–2008. [Google Scholar] [CrossRef] [PubMed]
  4. Kapaj, S.; Peterson, H.; Liber, K.; Bhattacharya, P. Human health effects from chronic arsenic poisoning—A review. J. Environ. Sci. Health Part A 2006, 41, 2399–2428. [Google Scholar] [CrossRef] [PubMed]
  5. 1990 Clean Air Act Amendment. Public Law; 1990. Available online: https://www.gpo.gov/fdsys/pkg/USCODE-2013-title42/html/USCODE-2013-title42-chap85-subchapI-partA-sec7412.htm (accessed on 11 February 2019).
  6. Duan, J.; Tan, J.; Hao, J.; Chai, F. Size distribution, characteristics and sources of heavy metals in haze episod in Beijing. J. Environ. Sci. 2014, 26, 189–196. [Google Scholar] [CrossRef]
  7. Pacyna, J.M.; Pacyna, E.G. An assessment of global and regional emissions of trace metals to the atmosphere from anthropogenic sources worldwide. Environ. Rev. 2001, 9, 269–298. [Google Scholar] [CrossRef]
  8. Tian, H.; Liu, K.; Zhou, J.; Lu, L.; Hao, J.; Qiu, P.; Gao, J.; Zhu, C.; Wang, K.; Hua, S. Atmospheric Emission Inventory of Hazardous Trace Elements from China’s Coal-Fired Power Plants Temporal Trends and Spatial Variation Characteristics. Environ. Sci. Technol. 2014, 48, 3575–3582. [Google Scholar] [CrossRef] [PubMed]
  9. Mercury and air toxics Standards (MATS). Public Law; 2013. Available online: https://www.epa.gov/mats (accessed on 11 February 2019).
  10. Helsen, L. Sampling technologies and air pollution control devices for gaseous and particulate arsenic: A review. Environ. Pollut. 2005, 137, 305–315. [Google Scholar] [CrossRef] [PubMed]
  11. Sterling, R.O.; Helble, J.J. Reaction of arsenic vapor species with fly ash compounds: Kinetics and speciation of the reaction with calcium silicates. Chemosphere 2003, 51, 1111–1119. [Google Scholar] [CrossRef]
  12. Jadhav, R.A.; Fan, L. Capture of gas-phase arsenic oxide by lime: Kinetic and mechanistic studies. Environ. Sci. Technol. 2001, 35, 794–799. [Google Scholar] [CrossRef] [PubMed]
  13. Li, Y.; Tong, H.; Zhuo, Y.; Li, Y.; Xu, X. Simultaneous removal of SO2 and trace As2O3 from flue gas: Mechanism, kinetics study, and effect of main gases on arsenic capture. Environ. Sci. Technol. 2007, 41, 2894–2900. [Google Scholar] [CrossRef] [PubMed]
  14. Li, Y. Experimental Study on Simultaneous Removal of Trace Selenium and Arsenic in Flue Gas Desulphurization within Medium Temperature Range; Tsinghua University: Beijing, China, 2006. [Google Scholar]
  15. López-Antón, M.A.; Díaz-Somoano, M.; Spears, D.A.; Martínez-Tarazona, M.R. Arsenic and selenium capture by fly ashes at low temperature. Environ. Sci. Technol. 2006, 40, 3947–3951. [Google Scholar] [CrossRef] [PubMed]
  16. Shah, P.; Strezov, V.; Stevanov, C.; Nelson, P.F. Speciation of arsenic and selenium in coal combustion products. Energy Fuels 2007, 21, 506–512. [Google Scholar] [CrossRef]
  17. Huggins, F.E.; Senior, C.L.; Chu, P.; Ladwig, K.; Huffman, G.P. Selenium and arsenic speciation in fly ash from full-scale coal-burning utility plants. Environ. Sci. Technol. 2007, 41, 3284–3289. [Google Scholar] [CrossRef] [PubMed]
  18. Tian, C.; Gupta, R.; Zhao, Y.; Zhang, J. Release Behaviors of Arsenic in Fine Particles Generated from a Typical High-Arsenic Coal at a High Temperature. Energy Fuels 2016, 30, 6201–6209. [Google Scholar] [CrossRef]
  19. Jialin, Y.; Jingjing, X.; Qinfang, Z.; Binwen, Z.; Baolin, W. First-principles studies on the structural and electronic properties of As clusters. Materials 2018, 11, 1596. [Google Scholar]
  20. Li, Z.; Yangwen, W.; Jian, H.; Qiang, L.; Yongping, Y.; Laibao, Z. Mechanism of mercury adsorption and oxidation by oxygen over the CeO2 (111) surface: A DFT study. Materials 2018, 11, 485. [Google Scholar]
  21. Zhang, S.; Hu, X.; Lu, Q.; Zhang, J. Density functional theory study of arsenic and selenium adsorption on the CaO (001) surface. Energy Fuels 2011, 25, 2932–2938. [Google Scholar] [CrossRef]
  22. Segall, M.D.; Lindan, P.J.; Probert, M.A.; Pickard, C.J.; Hasnip, P.J.; Clark, S.J.; Payne, M.C. First-principles simulation: Ideas, illustrations and the CASTEP code. J. Phys. Condens. Matter 2002, 14, 2717. [Google Scholar] [CrossRef]
  23. Clark, S.J.; Segall, M.D.; Pickard, C.J.; Hasnip, P.J.; Probert, M.I.; Refson, K.; Payne, M.C. First principles methods using CASTEP. Cryst. Mater. 2005, 220, 567–570. [Google Scholar] [CrossRef]
  24. Burke, K.; Ernzerhof, M.; Perdew, J.P. Generalized Gradient Approximation Made Simple. Phys. Rev. Lett. 1996, 77, 3865–3868. [Google Scholar]
  25. Vanderbilt, D. Soft self-consistent pseudopotentials in a generalized eigenvalue formalism. Phys. Rev. B Condens. Matter 1990, 41, 7892. [Google Scholar] [CrossRef] [PubMed]
  26. Von Barth, U.; Hedin, L. A local exchange-correlation potential for the spin polarized case. i. J. Phys. C Solid State Phys. 1972, 5, 1629. [Google Scholar] [CrossRef]
  27. Press, W.H.; Teukolsky, S.A.; Vetterling, W.T.; Flannery, B.P. Numerical Recipes in C.; Cambridge University Press: Cambridge, UK, 1996; Volume 2. [Google Scholar]
  28. Halgren, T.A.; Lipscomb, W.N. The synchronous-transit method for determining reaction pathways and locating molecular transition states. Chem. Phys. Lett. 1977, 49, 225–232. [Google Scholar] [CrossRef]
  29. Henkelman, G.; Jónsson, H. Improved tangent estimate in the nudged elastic band method for finding minimum energy paths and saddle points. J. Chem. Phys. 2000, 113, 9978–9985. [Google Scholar] [CrossRef]
  30. Monkhorst, H.J.; Pack, J.D. Special points for Brillouin-zone integrations. Phys. Rev. B Condens. Matter 1976, 13, 5188. [Google Scholar] [CrossRef]
  31. Ghebouli, M.A.; Ghebouli, B.; Bouhemadou, A.; Fatmi, M.; Bouamama, K. Structural, electronic, optical and thermodynamic properties of SrxCa1−xO, BaxSr1−xO and BaxCa1−xO alloys. J. Alloys Compd. 2011, 509, 1440–1447. [Google Scholar] [CrossRef]
  32. Verbraeken, M.C.; Suard, E.; Irvine, J.T. Order and disorder in Ca2ND0.90H0.10–A structural and thermal study. J. Solid State Chem. 2011, 184, 2088–2096. [Google Scholar] [CrossRef]
  33. Da Hora, G.C.A.; Longo, R.L.; Da Silva, J.B.P. Calculations of structures and reaction energy profiles of As2O3 and As4O6 species by quantum chemical methods. Int. J. Quantum Chem. 2012, 112, 3320–3324. [Google Scholar] [CrossRef]
  34. Liu, H.; Xiang, H.; Gong, X.G. First principles study of adsorption of O2 on Al surface with hybrid functionals. J. Chem. Phys. 2011, 135, 214702. [Google Scholar] [CrossRef] [PubMed]
  35. Fan, Y.; Yao, J.G.; Zhang, Z.; Sceats, M.; Zhuo, Y.; Li, L.; Maitland, G.C.; Fennell, P.S. Pressurized calcium looping in the presence of steam in a spout-fluidized-bed reactor with dft analysis. Fuel Process. Technol. 2018, 169, 24–41. [Google Scholar] [CrossRef]
  36. Fan, Y.; Zhuo, Y.; Zhu, Z.; Du, W.; Li, L. Zerovalent selenium adsorption mechanisms on a CaO surface: DFT calculation and experimental study. J. Phys. Chem. A 2017, 121, 7385. [Google Scholar] [CrossRef] [PubMed]
  37. Fan, Y.; Zhuo, Y.; Li, L. SeO2 adsorption on a CaO surface: DFT and experimental study on the adsorption of multiple SeO2 molecules. Appl. Surf. Sci. 2017, 420, 465–471. [Google Scholar] [CrossRef]
  38. Sun, S.; Zhang, D.; Li, C.; Wang, Y.; Yang, Q. Density functional theory study of mercury adsorption and oxidation on CuO (111) surface. Chem. Eng. J. 2014, 258, 128–135. [Google Scholar] [CrossRef]
  39. Xiang, W.; Liu, J.; Chang, M.; Zheng, C. The adsorption mechanism of elemental mercury on CuO (110) surface. Chem. Eng. J. 2012, 200, 91–96. [Google Scholar] [CrossRef]
  40. Nørskov, J.K.; Studt, F.; Abild-Pedersen, F.; Bligaard, T. Fundamental Concepts in Heterogeneous Catalysis; John Wiley & Sons: Hoboken, NJ, USA, 2014. [Google Scholar]
  41. Mahuli, S.; Agnihotri, R.; Chauk, S.; Ghosh-Dastidar, A.; Fan, L.-S. Mechanism of Arsenic Sorption by Hydrated Lime. Environ. Sci. Technol 1998, 31, 3226–3231. [Google Scholar] [CrossRef]
Figure 1. Structures and energies during transformation process of physisorption structures to chemisorption structures. (a) Reaction path of physisorption structure 1; (b) Reaction path of physisorption structure 2; (c) Reaction path of physisorption structure 3.
Materials 12 00677 g001aMaterials 12 00677 g001b
Figure 2. Transformation path of Category I. (a) Category I to Category II and III; (b) Category I to Category IV.
Materials 12 00677 g002
Figure 3. Transformation path of Category II.
Materials 12 00677 g003
Figure 4. Transformation path of Category III.
Materials 12 00677 g004
Figure 5. Transformation path of Category IV. (a) Reaction path of C8 to C9; (b) Reaction path of C8 to C10; (c) Reaction path of C9 to C10.
Materials 12 00677 g005
Figure 6. Overall adsorption paths of As2O3 on CaO.
Materials 12 00677 g006
Table 1. Calculated lattice parameters, bond lengths, and bond angles.
SubstancePrevious DataSimulated Data
CaO [31,32]4.836 Å/4.807 Å4.837 Å
As2O3 [33]As–O bond 1.794 ÅAs–O bond 1.814 Å
As–O bond 1.610 ÅAs–O bond 1.622 Å
O–As–O angle 106.3°O–As–O angle 111.2°
As–O–As angle 133.8°As–O–As angle 141.8°
O2 [34]O–O 1.210 ÅO–O 1.240 Å
Table 2. Stable physisorption structures, adsorption energy, electron density cloud, and Eads.
NameTop ViewFront ViewElectron Density CloudStructure DetailsEads
P1 Materials 12 00677 i001 Materials 12 00677 i002 Materials 12 00677 i003Bond12: 2.450 Å
Bond34: 2.469 Å
−65.8 kJ/mol
P2 Materials 12 00677 i004 Materials 12 00677 i005 Materials 12 00677 i006Bond12: 2.380 Å−62.6 kJ/mol
P3 Materials 12 00677 i007 Materials 12 00677 i008 Materials 12 00677 i009Bond12: 2.876 Å
Bond34: 2.539 Å
−58.4 kJ/mol
Materials 12 00677 i010
Table 3. Chemisorption structures, adsorption energy, electron density cloud and Eads.
CategoryNameTop ViewFront ViewElectron Density CloudStructure DetailsEads
IC1 Materials 12 00677 i011 Materials 12 00677 i012 Materials 12 00677 i013Bond12: 2.635 Å
Bond14: 2.086 Å
Bond35: 2.360 Å
−198.5 kJ/mol
IIC2 Materials 12 00677 i014 Materials 12 00677 i015 Materials 12 00677 i016Bond12: 1.858 Å
Bond34: 2.360 Å
Bond56: 2.386 Å
−222.1 kJ/mol
IIC3 Materials 12 00677 i017 Materials 12 00677 i018 Materials 12 00677 i019Bond12: 2.424 Å
Bond34: 1.815 Å
Bond56: 2.314 Å
Bond78: 2.490 Å
−274.4 kJ/mol
IIC4 Materials 12 00677 i020 Materials 12 00677 i021 Materials 12 00677 i022Bond12: 2.269 Å
Bond34: 1.949 Å
Bond56: 2.391 Å
−292.0 kJ/mol
IIC5 Materials 12 00677 i023 Materials 12 00677 i024 Materials 12 00677 i025Bond12: 2.293 Å
Bond34: 1.943 Å
Bond56: 2.298 Å
−315.1 kJ/mol
IIIC6 Materials 12 00677 i026 Materials 12 00677 i027 Materials 12 00677 i028Bond12: 1.815 Å
Bond34: 2.355 Å
−302.3 kJ/mol
IIIC7 Materials 12 00677 i029 Materials 12 00677 i030 Materials 12 00677 i031Bond12: 1.788 Å
Bond34: 2.528 Å
Bond56: 2.514 Å
Bond78: 2.422 Å
−314.0 kJ/mol
IVC8 Materials 12 00677 i032 Materials 12 00677 i033 Materials 12 00677 i034Bond12: 2.357 Å
Bond34: 1.901 Å
Bond56: 2.298 Å
−381.7 kJ/mol
IVC9 Materials 12 00677 i035 Materials 12 00677 i036 Materials 12 00677 i037Bond12: 2.472 Å
Bond34: 1.869 Å
Bond56: 2.503 Å
−388.6 kJ/mol
IVC10 Materials 12 00677 i038 Materials 12 00677 i039 Materials 12 00677 i040Bond12: 2.382 Å
Bond34: 1.894 Å
Bond56: 2.299 Å
Bond78: 2.392 Å
−391.4 kJ/mol
Materials 12 00677 i010
Table 4. Stable chemisorption structures under O2 atmosphere, adsorption energy, electron density cloud and Eads.
NameTop ViewFront ViewElectron Density CloudStructure DetailsEads
C5 under O2 Materials 12 00677 i041 Materials 12 00677 i042 Materials 12 00677 i043Bond12: 1.764 Å
Bond34: 1.452 Å
Bond56: 2.263 Å
−165.2 kJ/mol
C8 under O2 Materials 12 00677 i044 Materials 12 00677 i045 Materials 12 00677 i046Bond12: 1.763 Å
Bond34: 1.599 Å
Bond56: 2.427 Å
−174.4 kJ/mol
Materials 12 00677 i047

