An On-Line System for High Temperature Dielectric Property Measurement of Microwave-Assisted Sintering Materials


Abstract
:1. Introduction
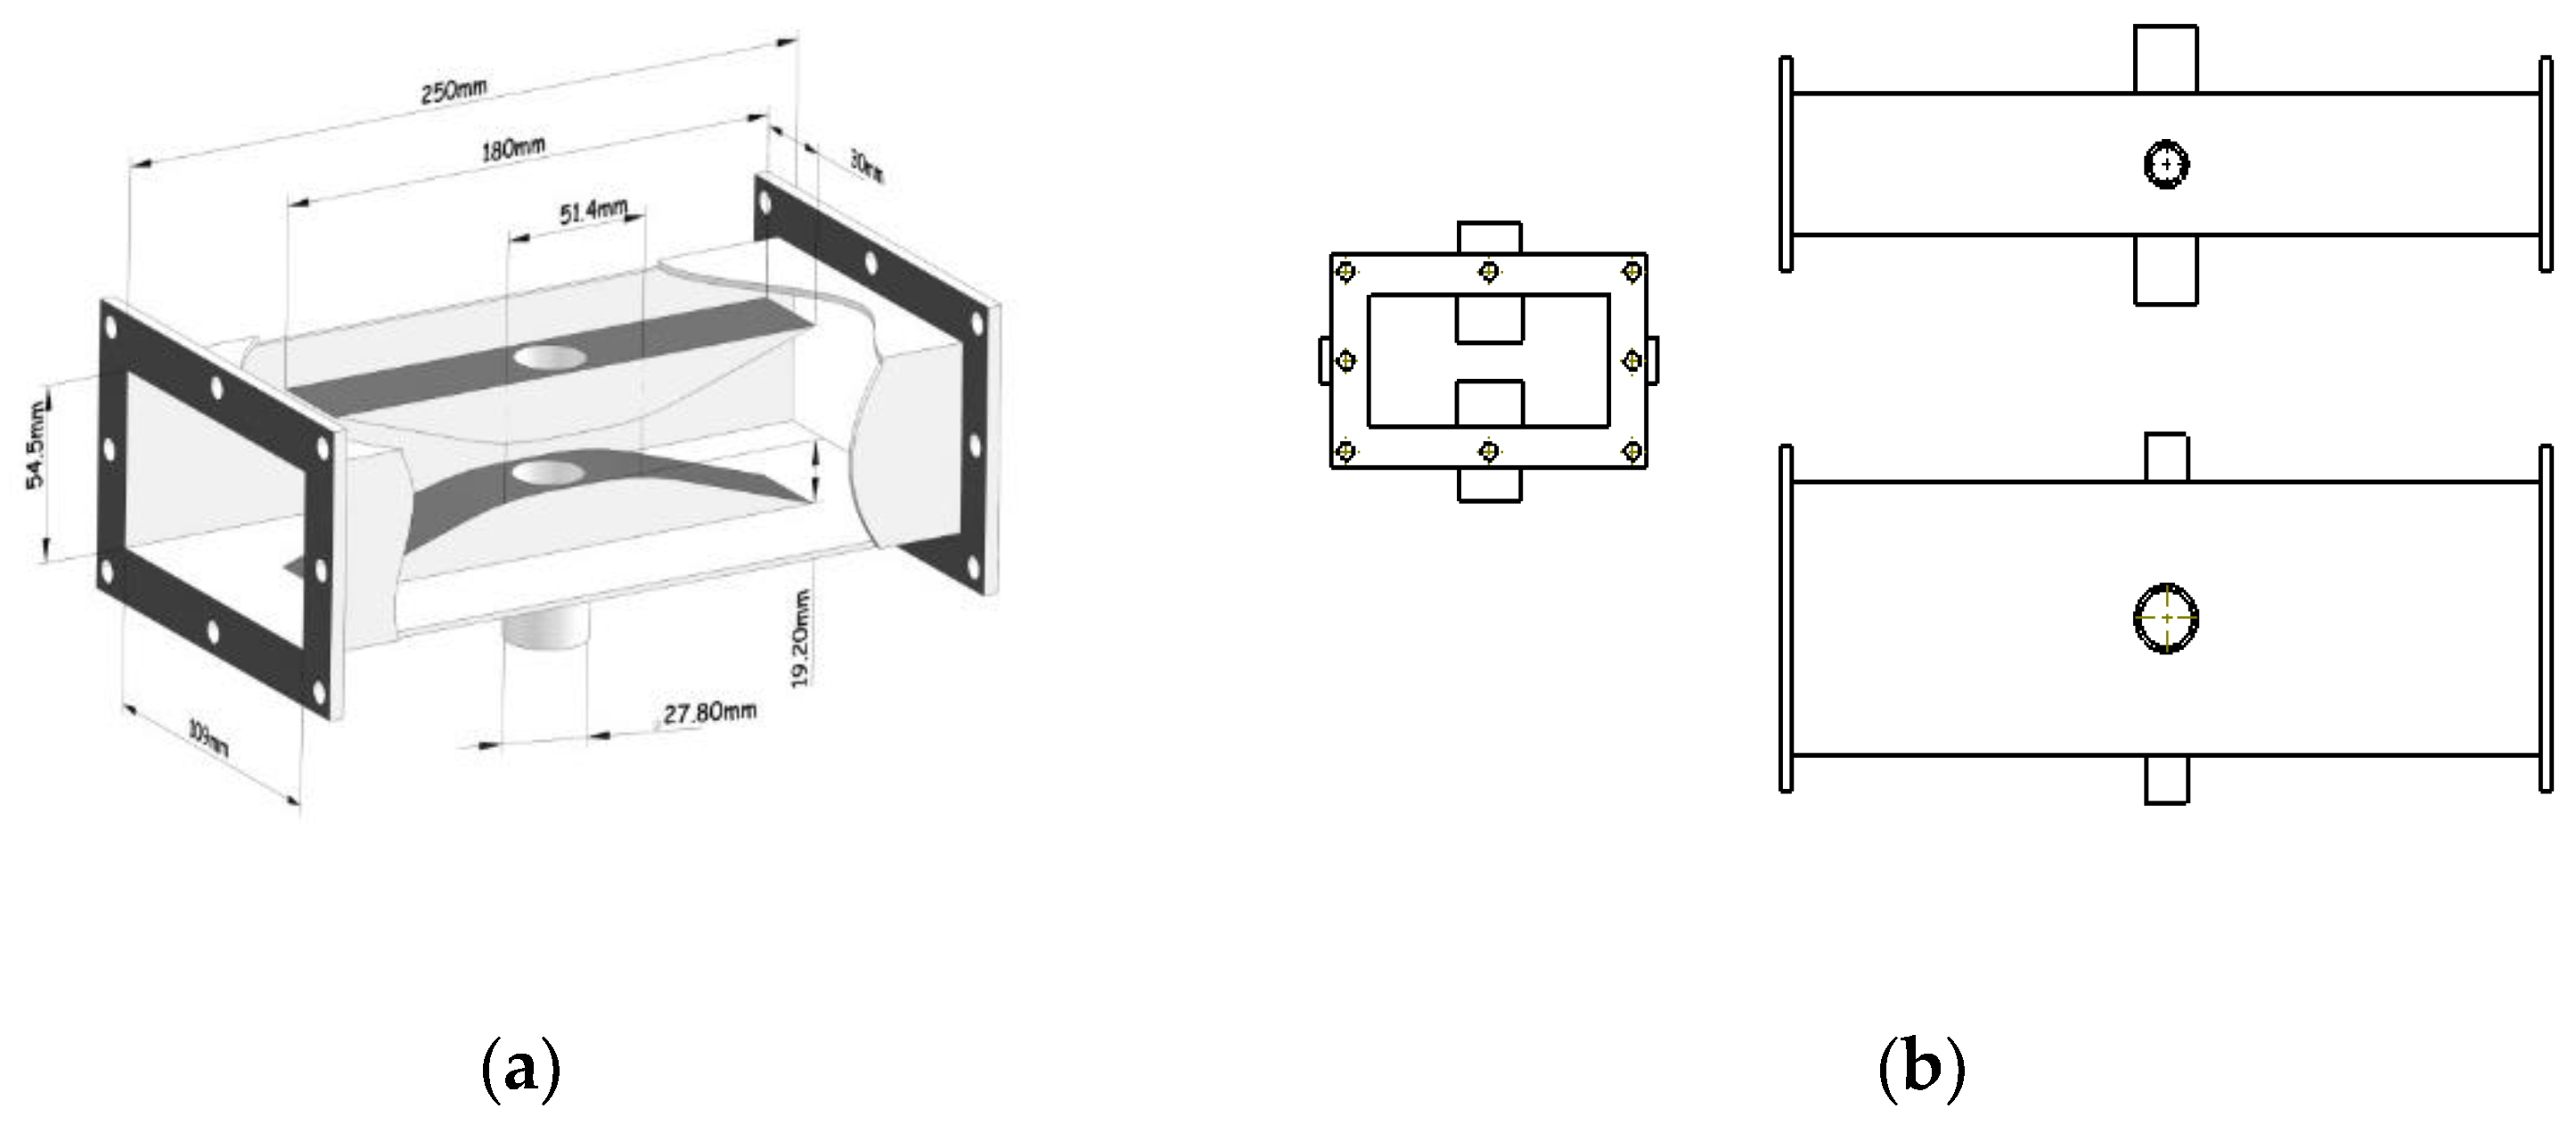
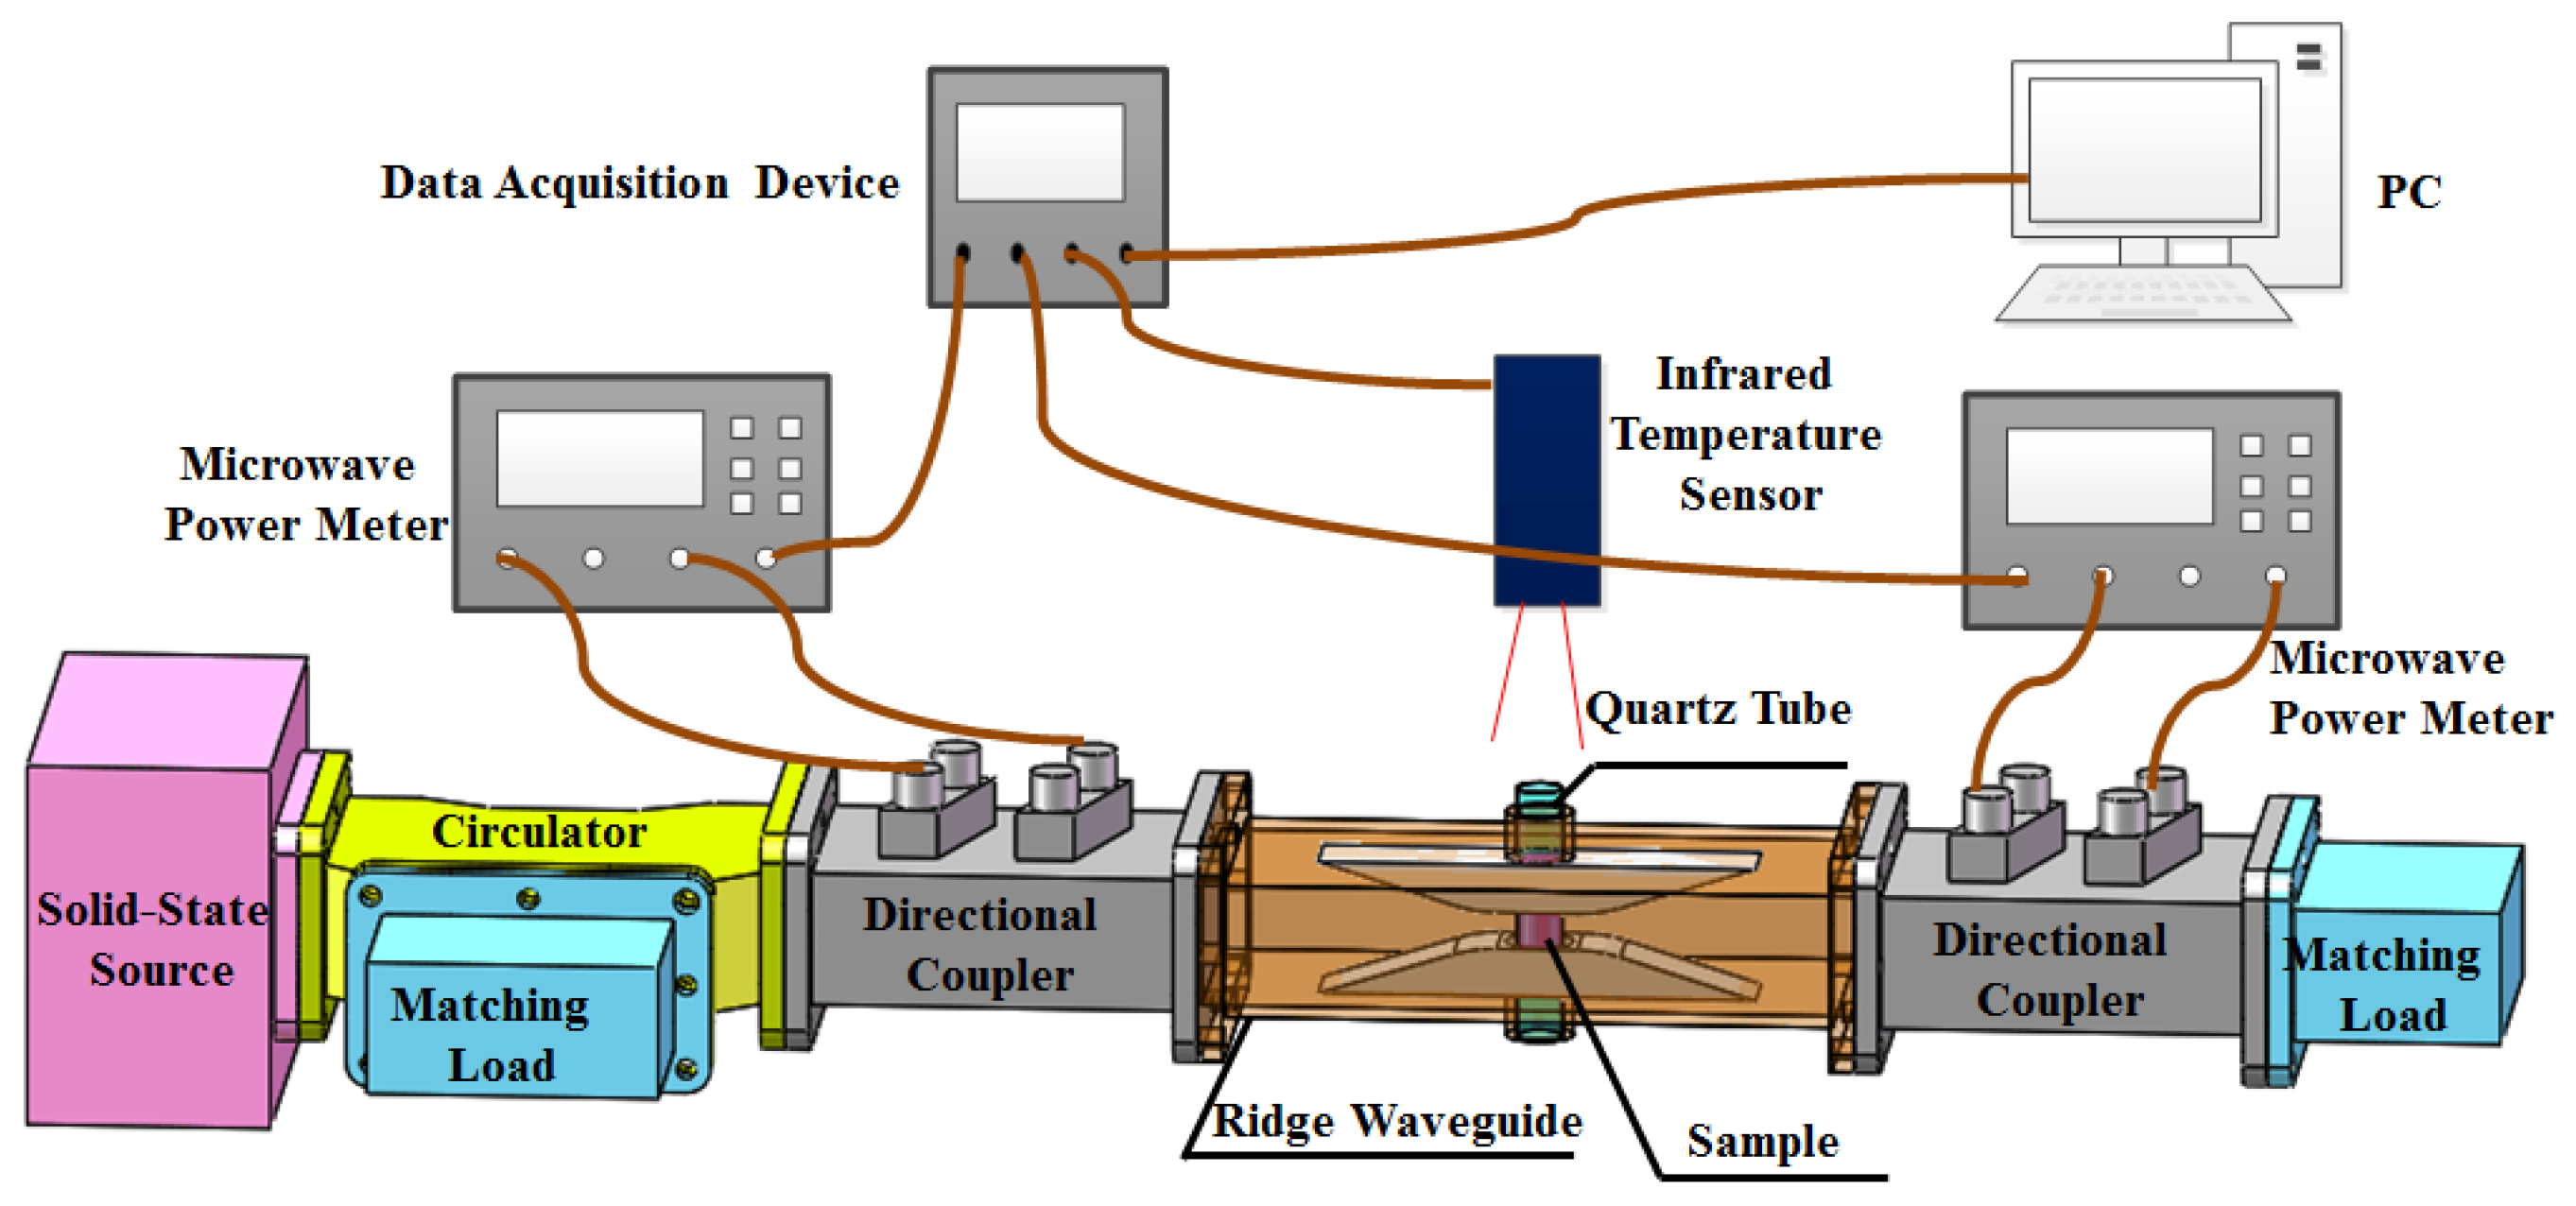
2. System Design
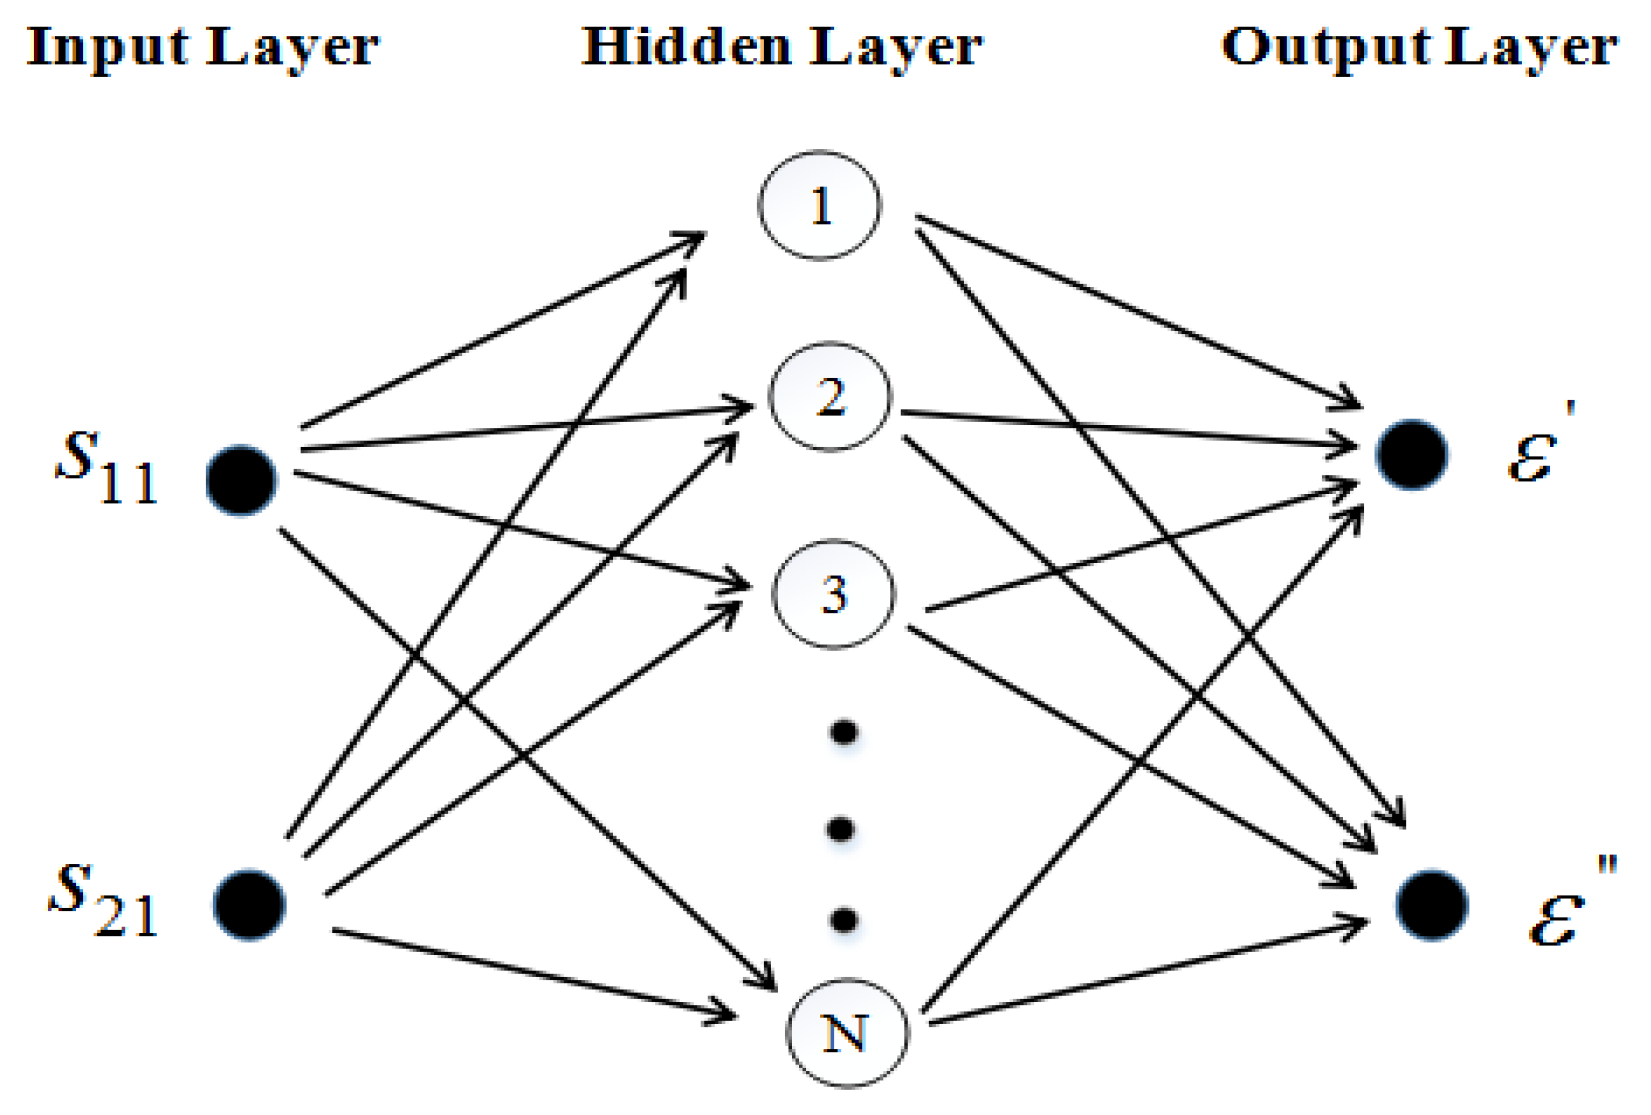
3. Methodology
4. Measured Results and Discussion
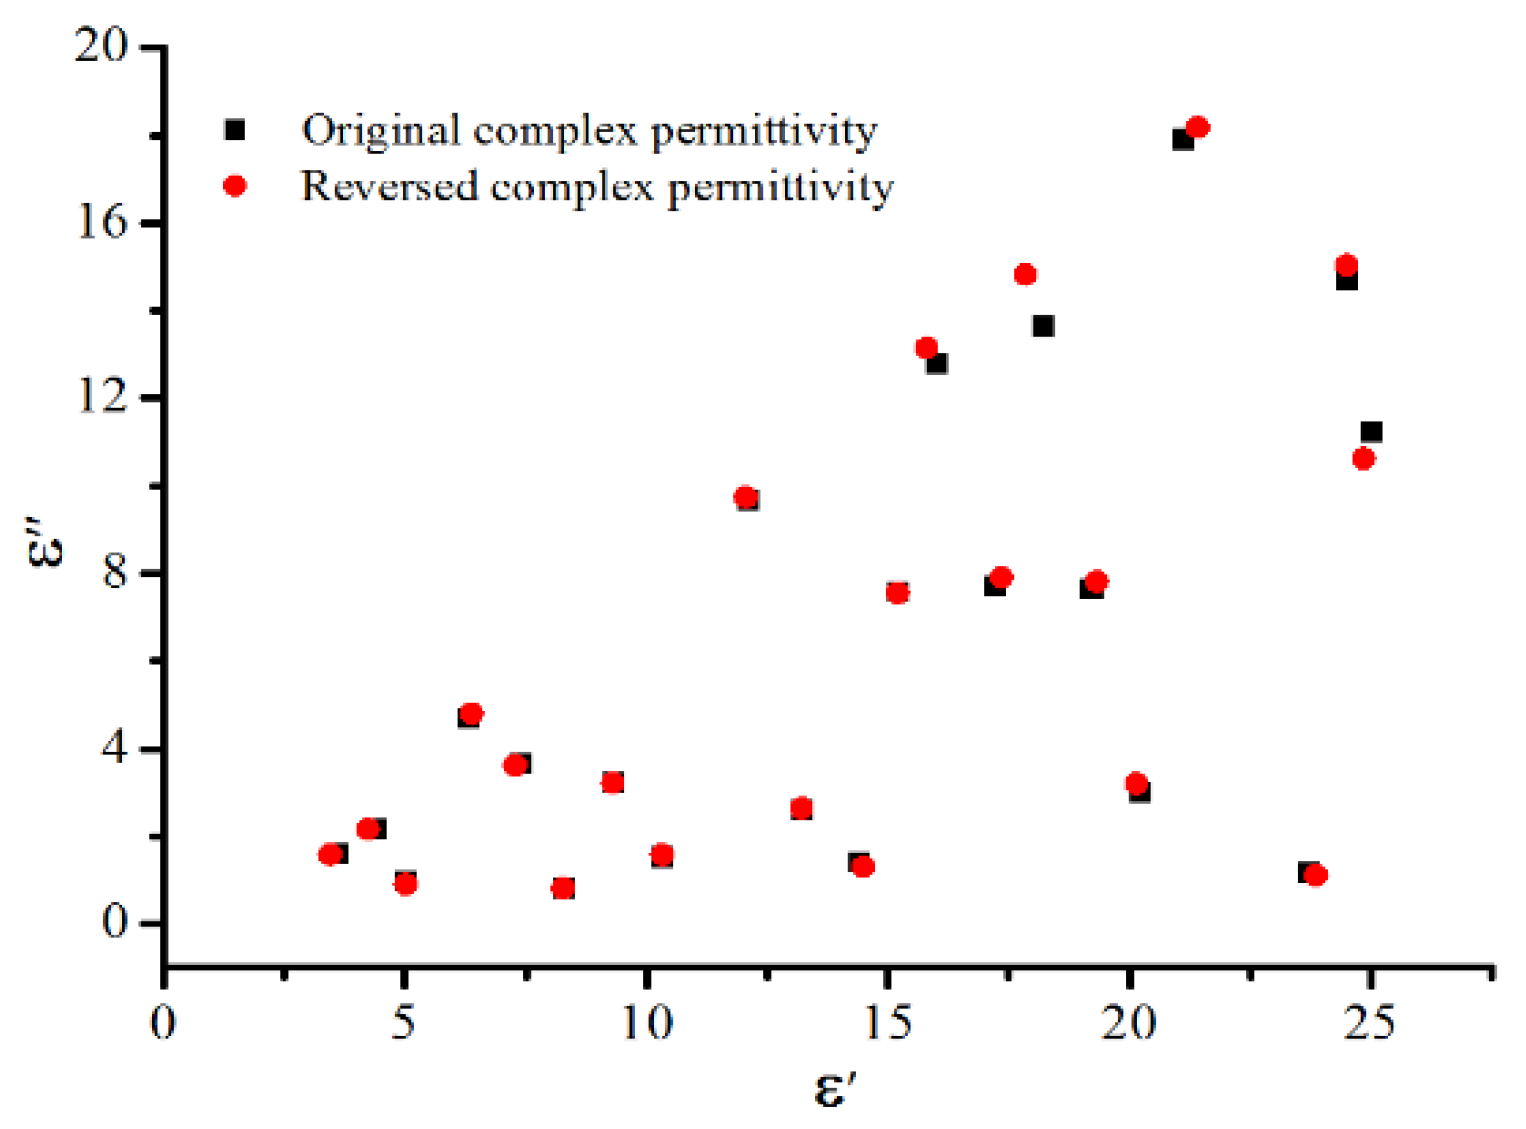
4.1. Room Temperature Measurement
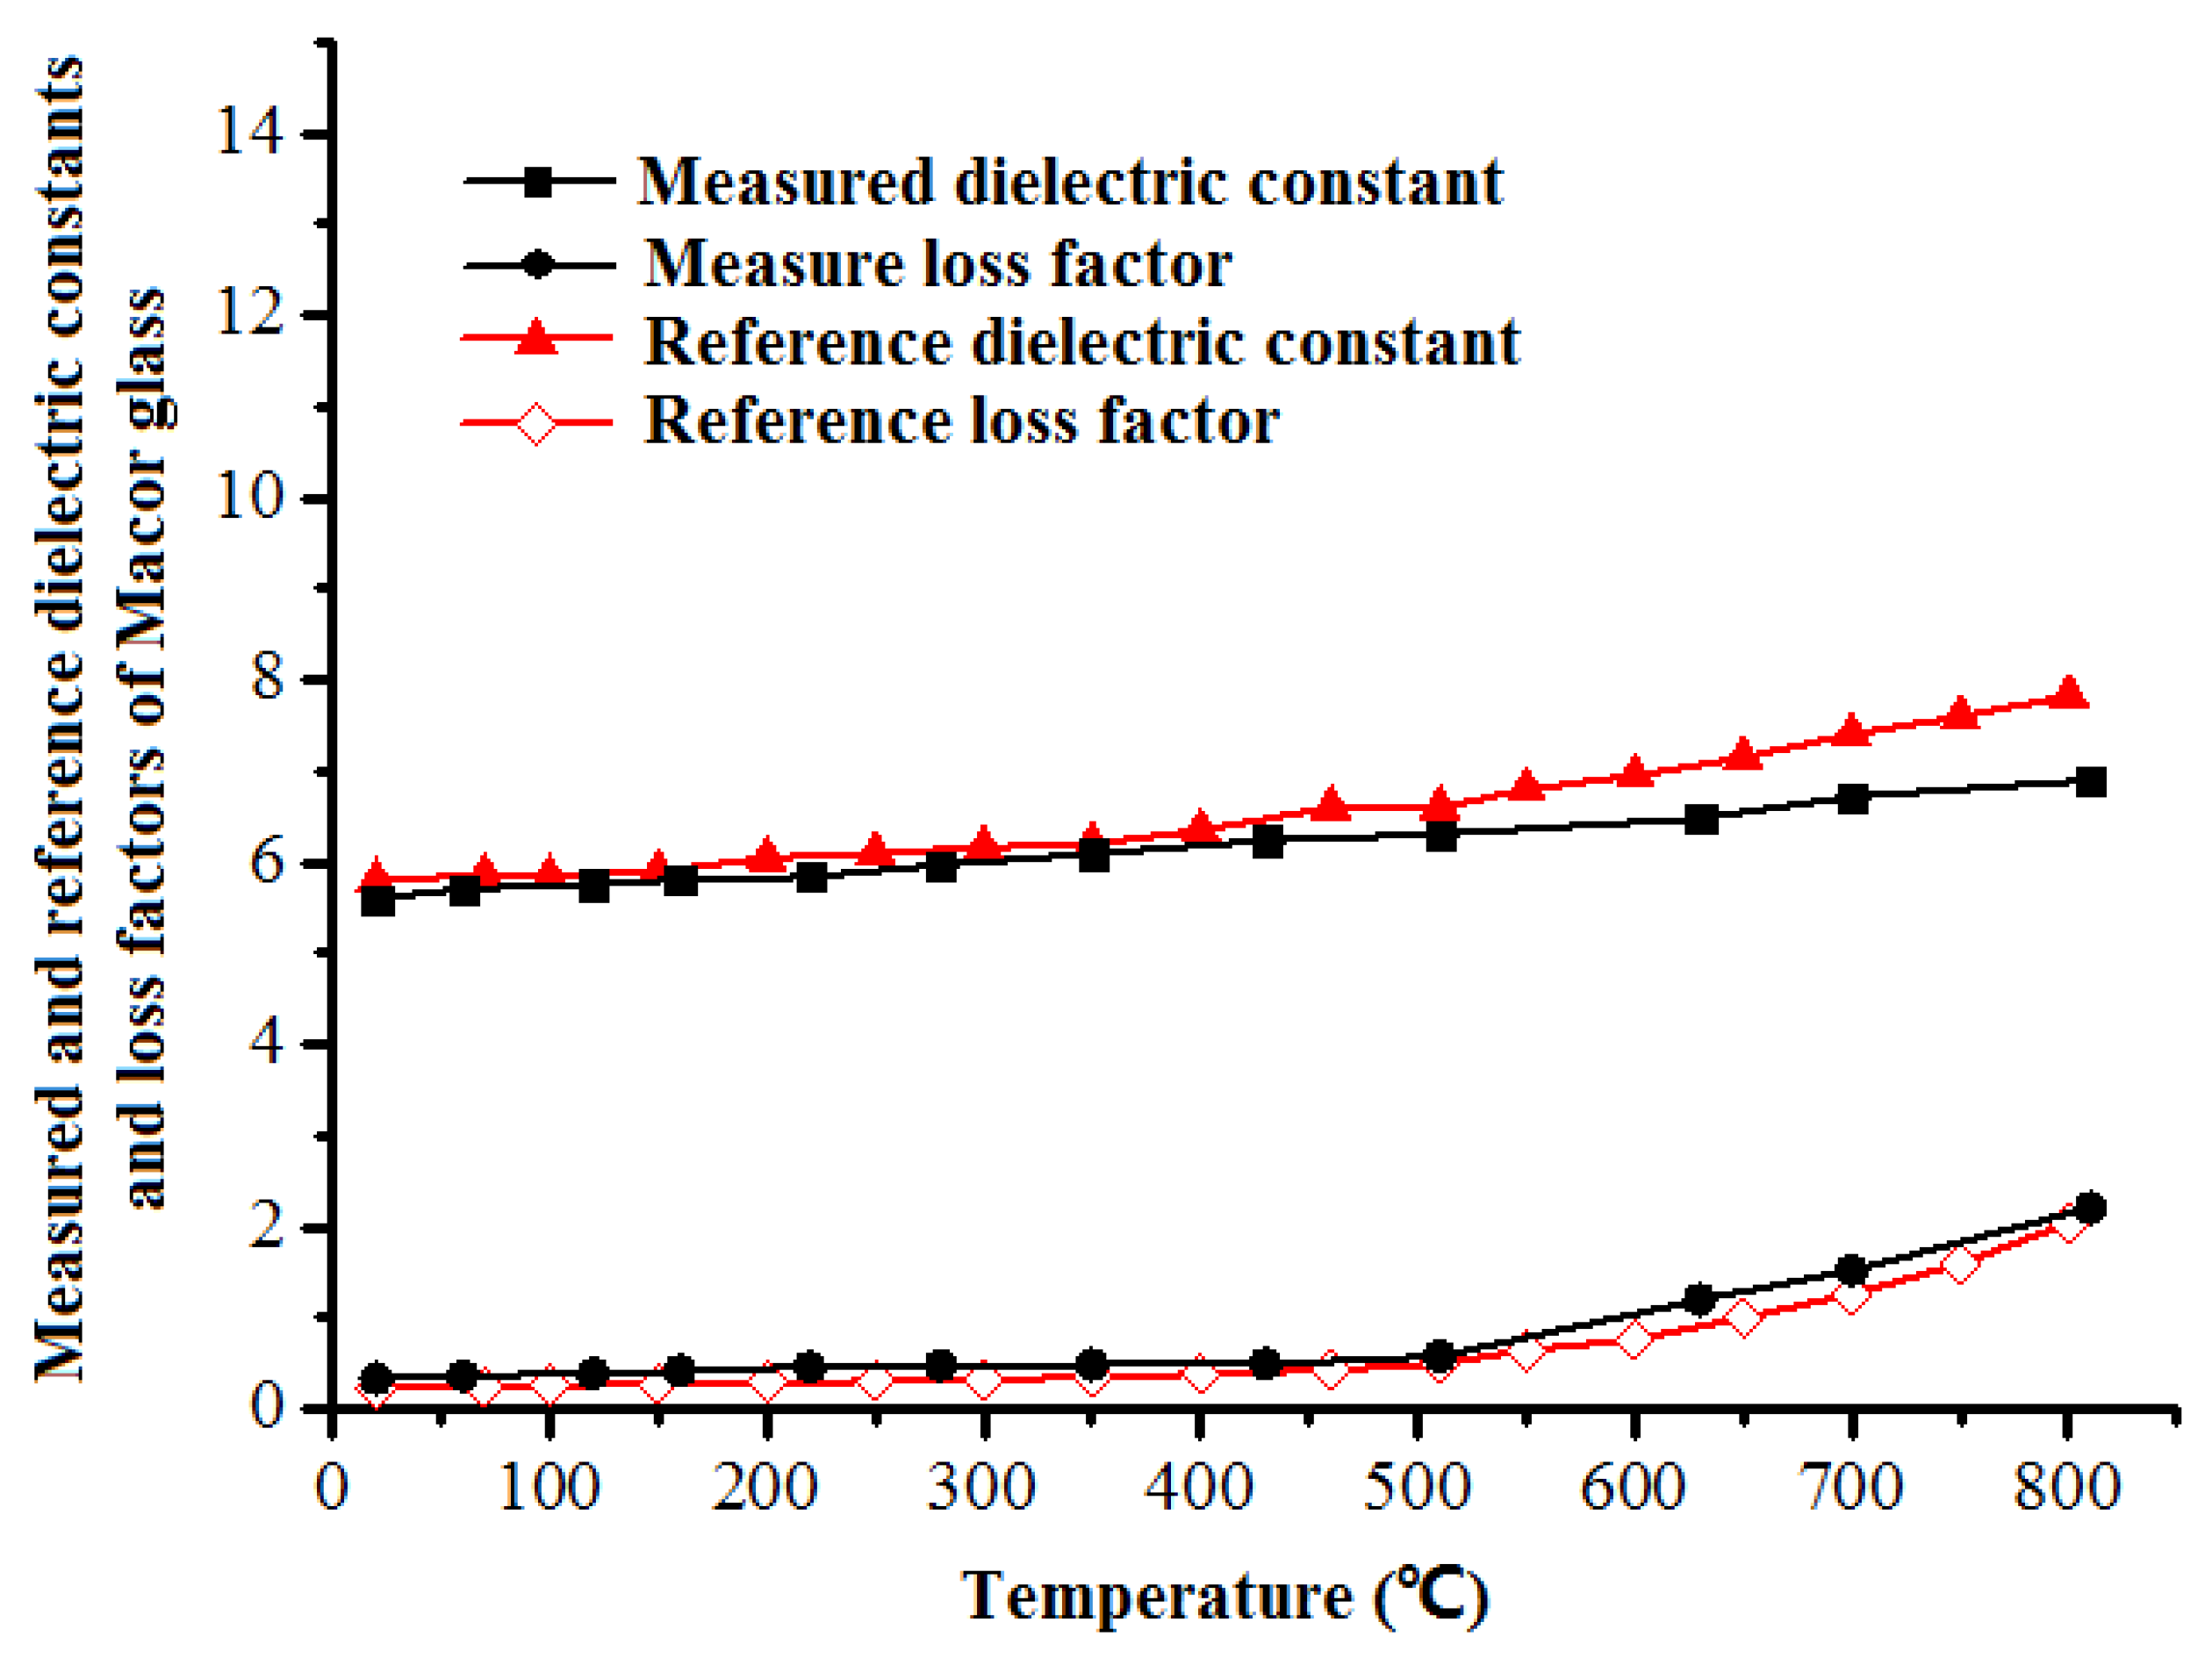
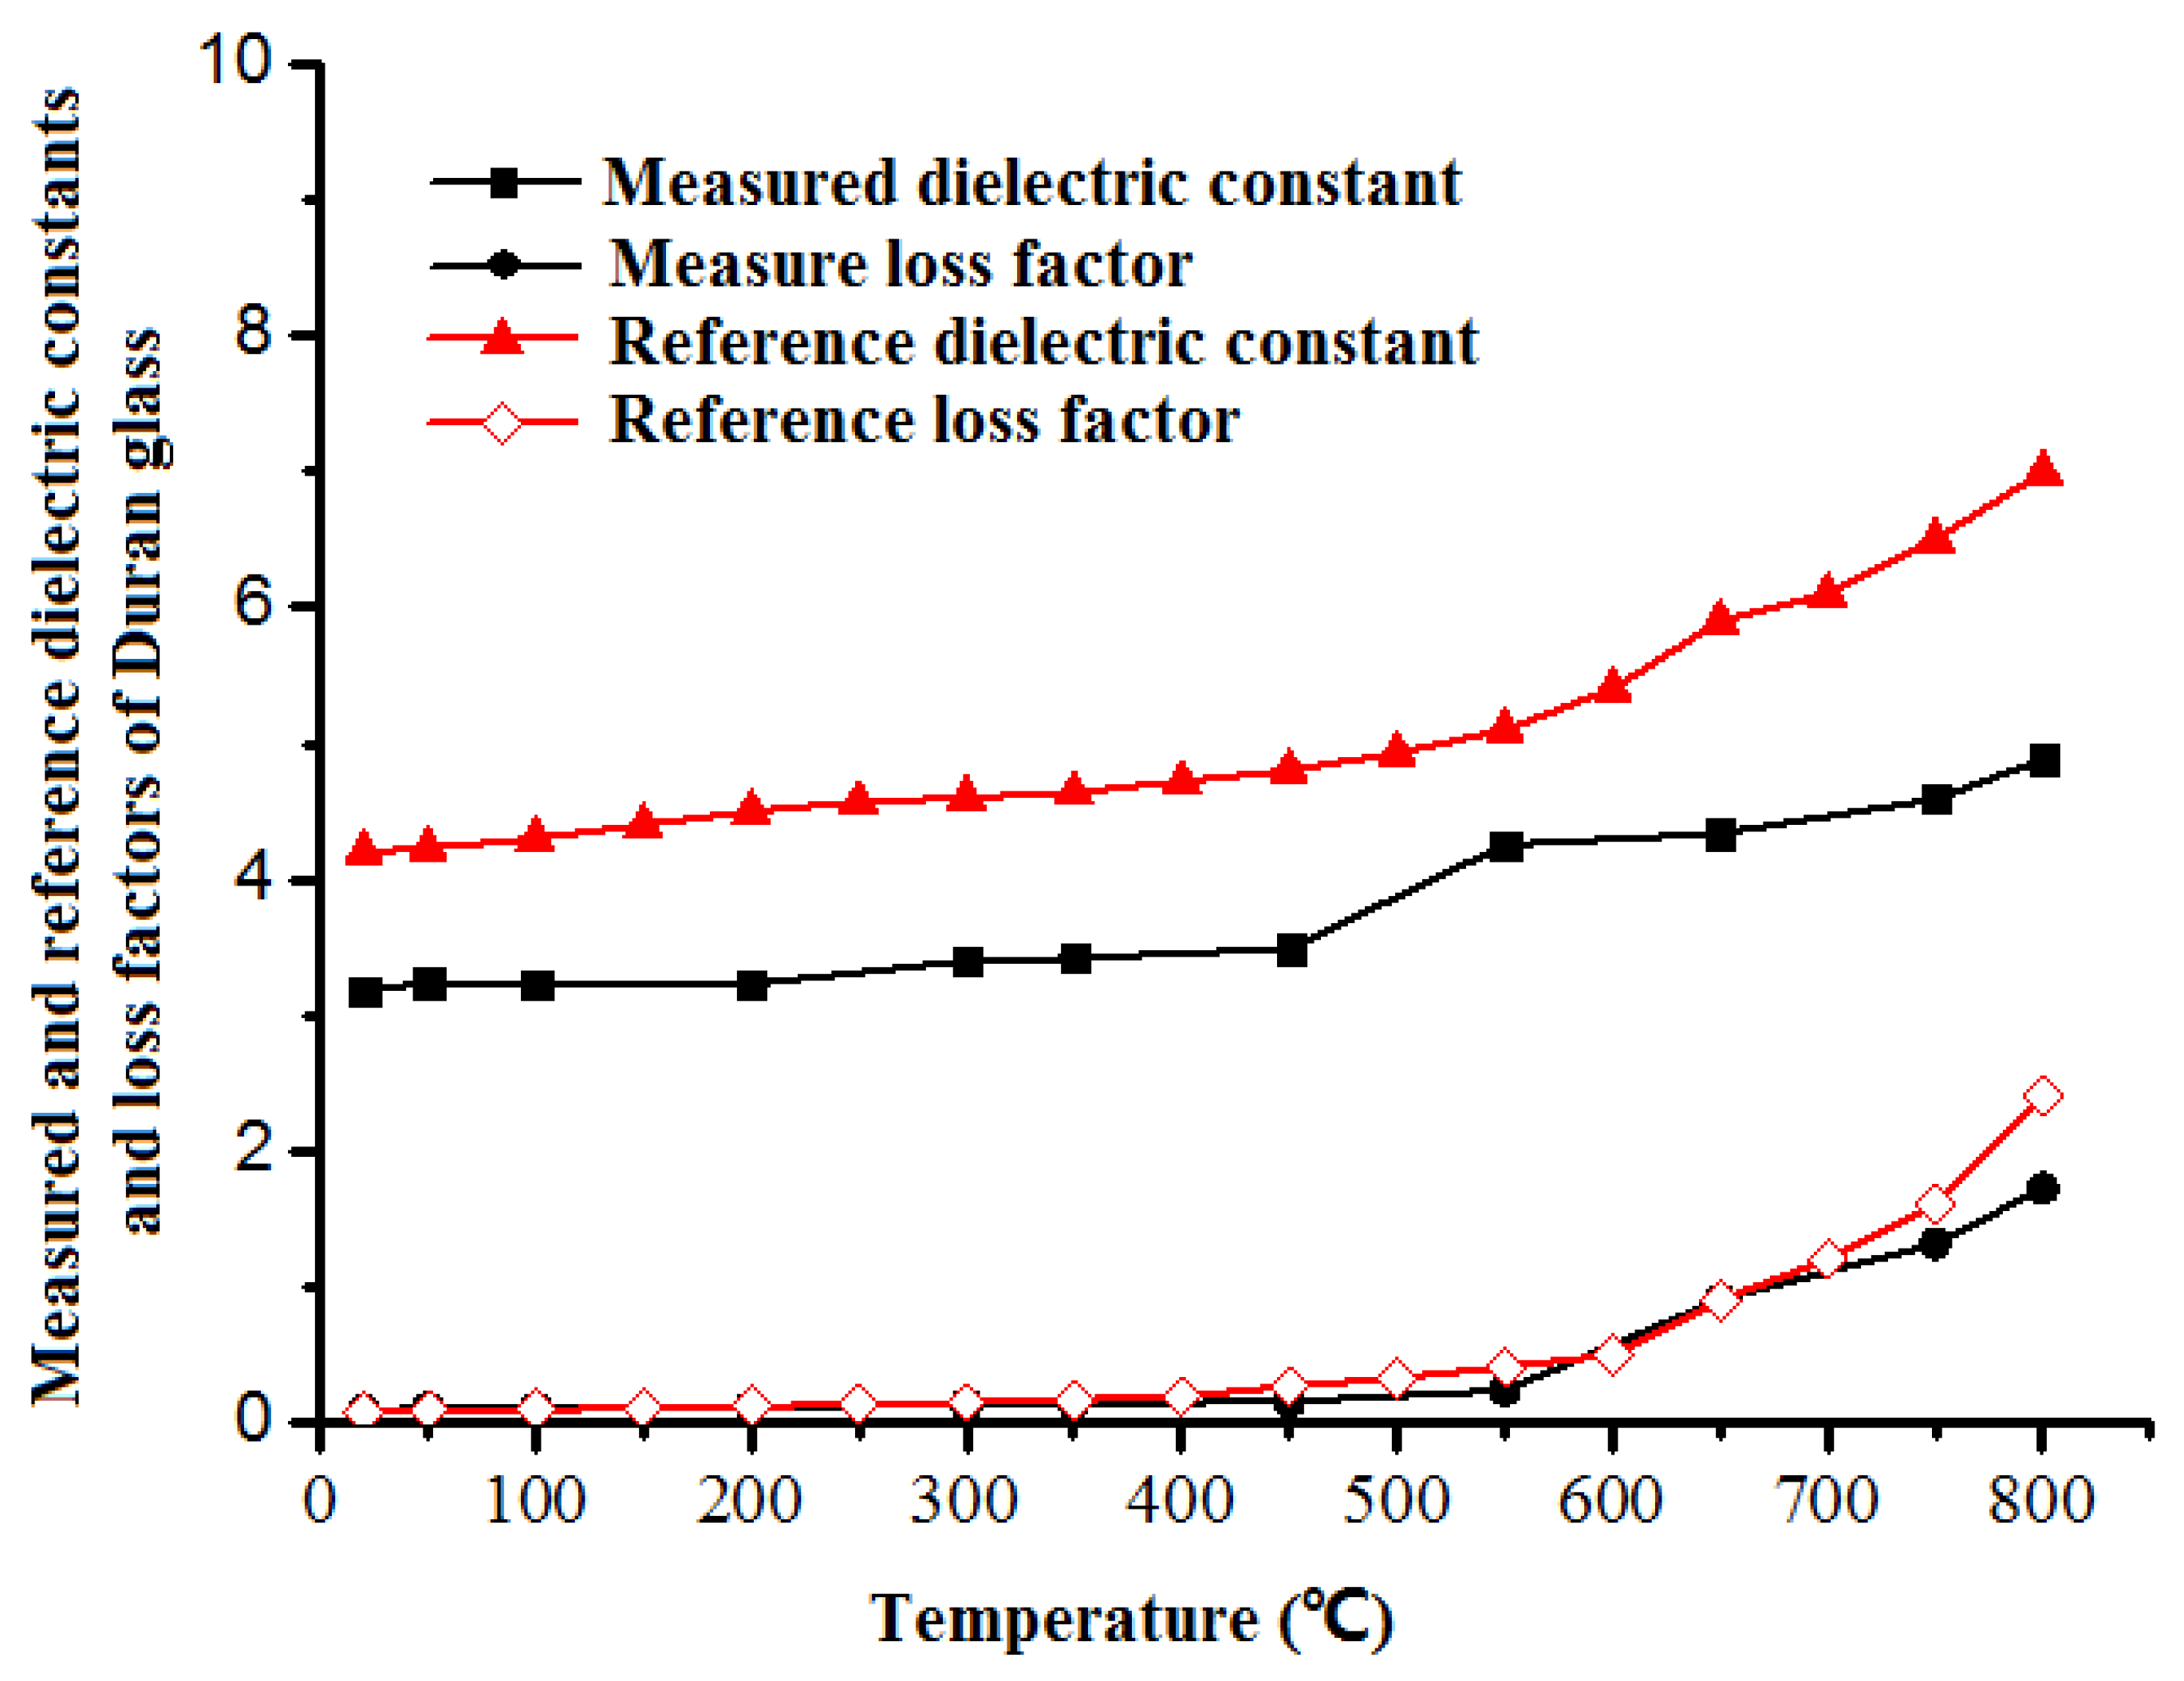
4.2. High Temperature Measurement
5. Conclusions
Author Contributions
Funding
Conflicts of Interest
References
- Bykov, V.Y.; Egorov, V.S.; Eremeev, G.A.; Kholoptsev, V.V.; Plotnikov, V.I.; Rybakov, I.K.; Sorokin, A.A. On the mechanism of microwave flash sintering of ceramics. Materials 2016, 9, 684. [Google Scholar] [CrossRef] [PubMed]
- Ghasali, E.; Fazili, A.; Alizadeh, M.; Shirvanimoghaddam, K.; Ebadzadeh, T. Evaluation of microstructure and mechanical properties of Al-TiC metal matrix composite prepared by conventional, microwave and spark plasma sintering methods. Materials 2017, 10, 1255. [Google Scholar] [CrossRef] [PubMed]
- Anoumas. Microwaving cuts sintering from 15 h to 15 min. Adv. Mater. Process. 2008, 166.9, 19, (copyright 2008 SAM International). [Google Scholar]
- Mahajana, S.; Thakur, O.P.; Bhattacharya, D.K.; Sreenivas, K. A comparative study of Ba0.95Ca0.05Zr0.25Ti0.75O3 relaxor ceramics prepared by conventional and microwave sintering techniques. Mater. Chem. Phys. 2008, 112, 858–862. [Google Scholar] [CrossRef]
- Wong, W.L.E.; Karthik, S.; Gupta, M. Development of hybrid Mg/Al2O3 composites with improved properties using microwave assisted rapid sintering route. J. Mater. Sci. 2005, 40, 3395–3402. [Google Scholar] [CrossRef]
- Wang, B.; Bi, L.; Zhao, X.S. Fabrication of one-step co-fired proton-conducting solid oxide fuel cells with the assistance of microwave sintering. J. Eur. Ceram. Soc. 2018, 38, 5620–5624. [Google Scholar] [CrossRef]
- Yang, L.; Wang, L.; Gao, J.Y.; Guo, S.H.; Ye, X.L.; Koppala, S.; Hu, T.; Hou, M.; Hu, L.T. Optimization of process parameters for preparing metallic matric diamond tool bits by microwave pressureless sintering using response surface methodology. Materials 2018, 11, 2185. [Google Scholar] [CrossRef]
- Guo, S.H.; Ye, X.L.; Wang, L.; Koppala, S.; Yang, L.; Hu, T.; Gao, J.Y.; Hou, M.; Hu, L.T. Fabrication of Cu based metallic binder for diamond tools by microwave pressureless sintering. Materials 2018, 11, 1453. [Google Scholar] [CrossRef]
- Lai, H.L.; Weng, M.-H.; Yang, R.-Y.; Chang, S.-J. Enhanced photoluminescent properties and crystalline morphology of LiBaPO4:Tm3+ phosphor through microwave sintering method. Materials 2016, 9, 356. [Google Scholar] [CrossRef]
- Leonelli, C.; Veronesi, P.; Denti, L.; Gatto, A.; Iuliano, L. Microwave assisted sintering of green metal parts. J. Mater. Process. Technol. 2008, 205, 489–496. [Google Scholar] [CrossRef]
- Roussy, G.; Bennani, A.; Thiebaut, J.M. Temperature runaway of microwave irradiated materials. J. Appl. Phys. 1987, 62, 1167–1170. [Google Scholar] [CrossRef]
- Bykov, Y.V.; Rybakov, K.I.; Semenov, V.E. High-temperature microwave processing of materials. J. Phys. D Appl. Phys. 2001, 34, 55–75. [Google Scholar] [CrossRef]
- Arai, M.; Binner, J.G.P.; Cross, T.E. Comparison of techniques for measuring high-temperature microwave complex permittivity: Measurements on an alumina/zircona system. J. Microw. Power Electromagn. Energy 1996, 31, 12–18. [Google Scholar] [CrossRef]
- Dube, D.C.; Agrawal, D.; Agrawal, S. High temperature dielectric study of Cr2O3 in microwave region. Appl. Phys. Lett. 2007, 90, 124105. [Google Scholar] [CrossRef]
- Wen, G.; Wu, G.L. Co-enhanced SiO2-BN ceramics for high-temperature dielectric applications. J. Eur. Ceram. Soc. 2000, 20, 1923–1928. [Google Scholar] [CrossRef]
- Wang, G.; Zhang, M.; Han, J. High-temperature infrared and dielectric properties of large sapphire crystal for seeker dome application. Cryst. Res. Technol. 2010, 43, 531–536. [Google Scholar] [CrossRef]
- Li, Z. Study of Microwave Dielectric Properties of Metallurgy Materials at Variable Temperature. Master’s Dissertation, University of Electronic Science and Technology of China, Chengdu, China, 2013; pp. 1–44. [Google Scholar]
- Guo, G.F.; Li, E.; Li, Z.P.; Zhang, Q.S.; He, F.M. A test system for complex permittivity measurements of low-loss materials at high temperatures up to 2000 °C. Meas. Sci. Technol. 2011, 22, 1–6. [Google Scholar] [CrossRef]
- Zhang, J. Research of Variable-Temperature Measurement Technique for Complex Permittivity Based on Cylindrical Cavity Perturbation Method. Master’s Dissertation, University of Electronic Science and Technology of China, Chengdu, China, 2013; pp. 1–15. [Google Scholar]
- Larsson, C.; Sjöberg, D.; Elmkvist, L. Waveguide measurements of the permittivity and permeability at temperatures of up to 1000 °C. IEEE Trans. Instrum. Meas. 2011, 60, 2872–2880. [Google Scholar] [CrossRef]
- Mueller, H.C.; Miranda, F.A. High temperature permittivity measurements of alumina enhanced thermal barrier (AETB-8) material for CEV antenna radomes. Antennas Propag. Soc. Int. Symp. 2010, 1–4. [Google Scholar] [CrossRef]
- Baeraky, T.A. Microwave measurements of the dielectric properties of silicon carbide at high temperature. Egypt. J. Solids 2002, 25, 75–86. [Google Scholar]
- Li, E.; Nie, Z.P.; Guo, G.; Zhang, Q.; Li, Z.; He, F. Broadband measurements of dielectric properties of low-loss materials at high temperatures using circular cavity method. Prog. Electromagn. Res. 2009, 2, 103–120. [Google Scholar] [CrossRef]
- Addamo, G.; Virone, G.; Vaccaneo, D.; Tascone, R.; Peverini, O.A.; Orta, R. An adaptive cavity setup for accurate measurements of complex dielectric permittivity. Prog. Electromagn. Res. 2010, 105, 141–155. [Google Scholar] [CrossRef]
- Couderc, D.; Giroux, M.; Bosisio, R.G. Dynamic high temperature microwave complex permittivity measurements on samples heated via microwave absorption. J. Microw. Power Electromagn. Energy 1973, 8, 69–82. [Google Scholar]
- Catalá-Civera, J.M.; Canós, A.J.; Plaza-González, P.; Gutiérrez, J.D.; García-Baños, B.; Peñaranda-Foix, F.L. Dynamic measurement of dielectric properties of materials at high temperature during microwave heating in a dual mode cylindrical cavity. IEEE. Trans. Microw. Theory Tech. 2015, 63, 2905–2914. [Google Scholar] [CrossRef]
- Batt, J.A.; Rukus, R.; Gilden, M. General purpose high temperature microwave measurement of electromagnetic properties. Mater. Res. Soc. Symp. Proc. 1992, 269, 553–559. [Google Scholar] [CrossRef]
- Hasar, U.C. A fast and accurate amplitude-only transmission-reflection method for complex permittivity determination of lossy materials. IEEE. Trans. Microw. Theory Tech. 2008, 56, 2129–2135. [Google Scholar] [CrossRef]
- Neelamegam, P. Dielectric constant measurement using an artificial neural network. Instrum. Sci. Technol. 2004, 32, 413–422. [Google Scholar]
- Jurado, A.; Escot, D.; Poyatos, D. Application of artificial neural networks to complex dielectric constant estimation from free-space measurements. In Proceedings of the International Work-Conference on the Interplay Between Natural and Artificial Computation, Santiago de Compostela, Spain, 22–26 June 2009. [Google Scholar]
- Wen, J.W.; Zhao, J.L.; Luo, S.W.; Zhen, H. The improvement of BP neural network learning algorithm. In Proceedings of the 16th World Computer Congress, Beijing, China, 21–25 August 2000; Volume 3, pp. 1647–1649. [Google Scholar]
- Eves, E.E.; Kopyt, P.; Yakovlev, V.V. Determination of complex permittivity with neural networks and FDTD modeling. Microw. Opt. Technol. Lett. 2004, 40, 183–188. [Google Scholar] [CrossRef]
- Luo, M.; Huang, K.M.; Pu, T.L.; Wang, B.; Yang, L.J. Measurement and prediction of dielectric for liquids based artificial nerve network. In Proceedings of the International Conference on Microwave and Millimeter Wave Technology, Chengdu, China, 8–11 May 2010. [Google Scholar]
- Yi, J.Q.; Wang, Q.; Zhao, D.B.; Wen, J.T. BP neural network prediction-based variable-period sampling approach for networked control systems. Appl. Math. Comput. 2007, 185, 976–988. [Google Scholar] [CrossRef]
- Ding, S.F.; Su, C.Y.; Yu, J.Z. An optimizing BP neural network algorithm based on genetic algorithm. Artif. Intell. Rev. 2011, 36, 153–162. [Google Scholar] [CrossRef]
- Hua, W.; Yang, X.Q.; Xia, Z.X.; Huang, K.M.; Lan, J. Study on the complex permittivity of common organic reagents at 2.45 GHz. Chem. Res. Appl. 2006, 18, 1232–1234. [Google Scholar]
- Nelson, S.O. Dielectric properties of agricultural products-measurements and applications. IEEE. Trans. Electr. Insul. 1991, 26, 845–869. [Google Scholar] [CrossRef]
- Wu, Z.Y.; Huang, K.M.; Kuang, X.Y. Dielectric properties of pyridine–ethanol mixtures: Density functional theory and experiments. RSC Adv. 2016, 6, 66007–66010. [Google Scholar] [CrossRef]
- Sun, H.; Huang, K. Experimental study of dielectric property changes in DMSO–primary alcohol mixtures under low-intensity microwaves. RSC Adv. 2015, 5, 61031–61034. [Google Scholar] [CrossRef]
- Arai, M.; Binner, J.P.; Carr, G.E.; Cross, T.E. High temperature dielectric measurements on ceramics. MRS Online Proc. Libr. Arch. 1992, 269, 69–72. [Google Scholar]
- Polonskii, Y.A.; Pavlova, G.A.; Savel’ev, V.N.; Milovidova, T.V.; Vinogradov, V.B. Dielectric properties of optical quartz glass in the ultra-high frequency range and at temperatures of up to 1500 °C. Glass Ceram. 1971, 28, 182–184. [Google Scholar] [CrossRef]


| Study Ratio | Maximum Iteration Times | Target Accuracy ( ) | Hidden Neuron | Hidden Layers |
|---|---|---|---|---|
| 0.01 | 1000 | 0.005 | 15 | 1 |
| Media | Measured | Reference | Errors | Measured | Reference | Errors |
|---|---|---|---|---|---|---|
| Ethanol | 9.70 | 8.94 | 8.50% | 7.57 | 7.60 | 0.39% |
| Methanol | 25.80 | 24.97 | 3.30% | 13.93 | 14.48 | 3.80% |
| 4methanol + 1ethanol | 19.95 | 21.03 | 5.10% | 13.57 | 13.04 | 4.06% |
| 2methanol + 3ethanol | 14.14 | 14.09 | 0.35% | 11.03 | 10.14 | 8.78% |
| 4methanol + 1N-butanol | 17.95 | 19.17 | 6.40% | 10.77 | 11.12 | 3.15% |
| 2methanol + 3N-butanol | 9.89 | 9.13 | 8.30% | 5.84 | 5.39 | 8.35% |
© 2019 by the authors. Licensee MDPI, Basel, Switzerland. This article is an open access article distributed under the terms and conditions of the Creative Commons Attribution (CC BY) license (http://creativecommons.org/licenses/by/4.0/).
Share and Cite
Wu, L.; Zhang, Y.; Wang, F.; Ma, W.; Xie, T.; Huang, K. An On-Line System for High Temperature Dielectric Property Measurement of Microwave-Assisted Sintering Materials. Materials 2019, 12, 665. https://doi.org/10.3390/ma12040665
Wu L, Zhang Y, Wang F, Ma W, Xie T, Huang K. An On-Line System for High Temperature Dielectric Property Measurement of Microwave-Assisted Sintering Materials. Materials. 2019; 12(4):665. https://doi.org/10.3390/ma12040665
Chicago/Turabian StyleWu, Li, Yi Zhang, Fengxia Wang, Weiquan Ma, Tian Xie, and Kama Huang. 2019. "An On-Line System for High Temperature Dielectric Property Measurement of Microwave-Assisted Sintering Materials" Materials 12, no. 4: 665. https://doi.org/10.3390/ma12040665