3.1. First Sample Set
The first sample set was prepared to study the process of the eutectoidal phase transformation due to the previous cold rolling and heat treatment. The seven rolling reductions (ε) were the following: 0%, 10.3%, 22.3%, 31.3%, 41.6%, 50.6%, and 61.9%. The rolling reductions were calculated by the Equation (1):
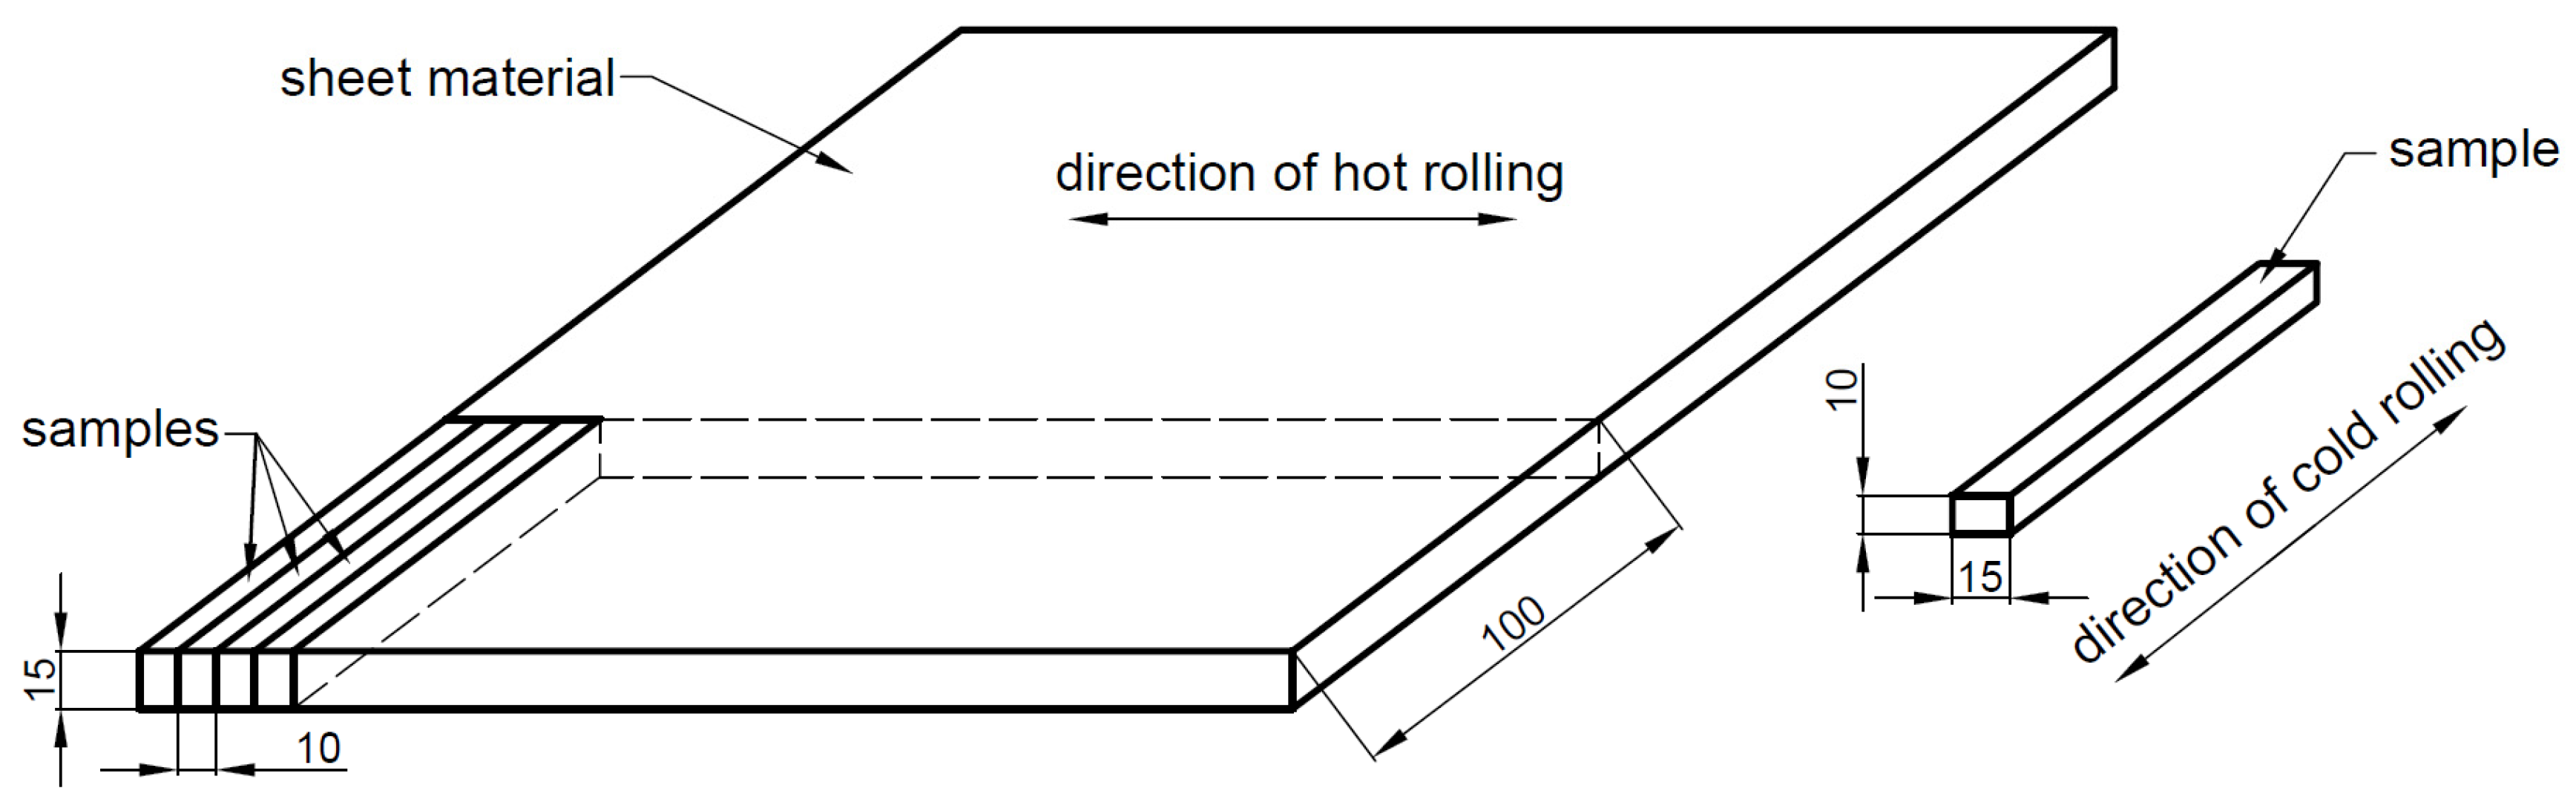
where “h” was the thickness of the rolled sample. Five samples were rolled from every rolling reduction and were heat treated at 20, 700, 750, 800, and 850 °C temperatures. The term of the heat treatment was 30 min and the samples were normalized on static normal air. Naturally, the different rolling reductions resulted in different sizes of the samples. At the end of the preparation process all samples were machined at the same size 3.4 mm × 10 mm × 100 mm (h × w × l).
3.1.1. AC Magnetometer Measurement
In the investigated DSS, the δ-ferrite is the only ferromagnetic phase which transforms to paramagnetic σ-phase and secondary austenite. Therefore, the eutectoidal decomposition influences the ferromagnetic phase ratio of the alloy. It is well known that the magnetic saturation polarization is linearly proportional to the ferromagnetic phase ratio of alloys [
19]. Consequently, the δ-ferrite ratio can be precisely determined from saturation polarization.
Firstly, the samples were measured by an AC magnetometer to determine their δ-ferrite content.
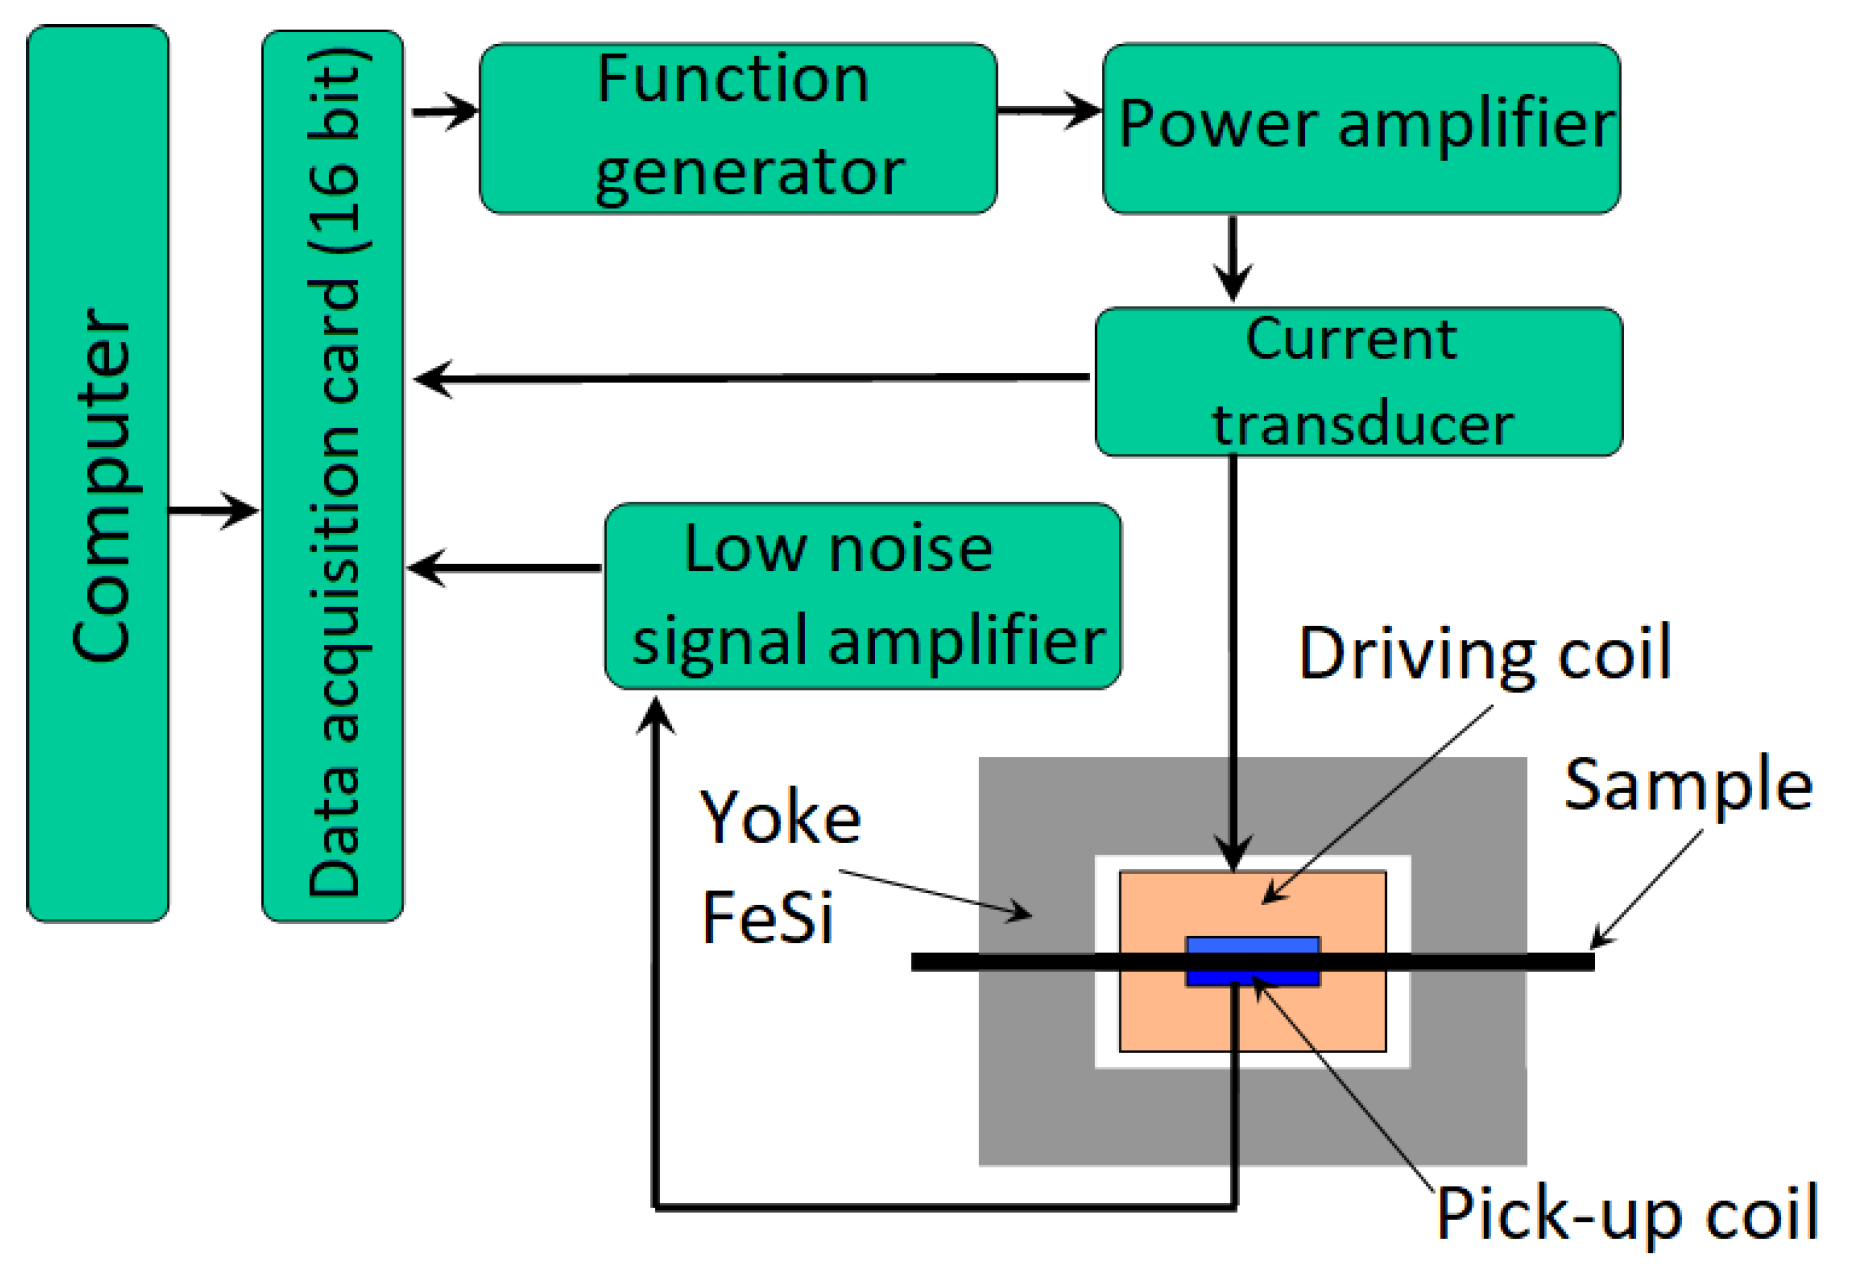
Figure 5 illustrates the set-up of the AC magnetometer [
20] which was designed and built in our laboratory. This set up is suitable only for measuring flat-stripe-shaped samples.
The instrument measures the normal magnetization curve and the hysteresis loop of the samples. The maximal polarization, coercive field, remnant induction, and initial permeability can be determined from the magnetization curves.
The yoke stands from two symmetrical U-shaped laminated Fe-Si iron cores which closes the magnetic circle. The driving and the pick-up coils close round the sample. The power amplifier and the function generator supply sinusoidal excitation current which frequency is 5 Hz. The 16-bit input–output data acquisition card accomplished the measurements. In case of each sample, 200 minor hysteresis loops were recorded. The maximum excitation field strength was about 128 A/cm which cannot saturate the samples magnetically. Because of this physical limitation, the AC magnetometer is not able to determine the value of saturation polarization. Therefore, the δ-ferrite content was calculated from the measured maximal value of polarization. The δ-ferrite content of the undeformed and non-heat-treated (initial) sample was 46.9% according to the manufacturer data sheet. Its measured maximal polarization (
was 0.31 T. The δ-ferrite content of the tested samples (
x in %) was determined using a simple proportion with the following Equation (2):
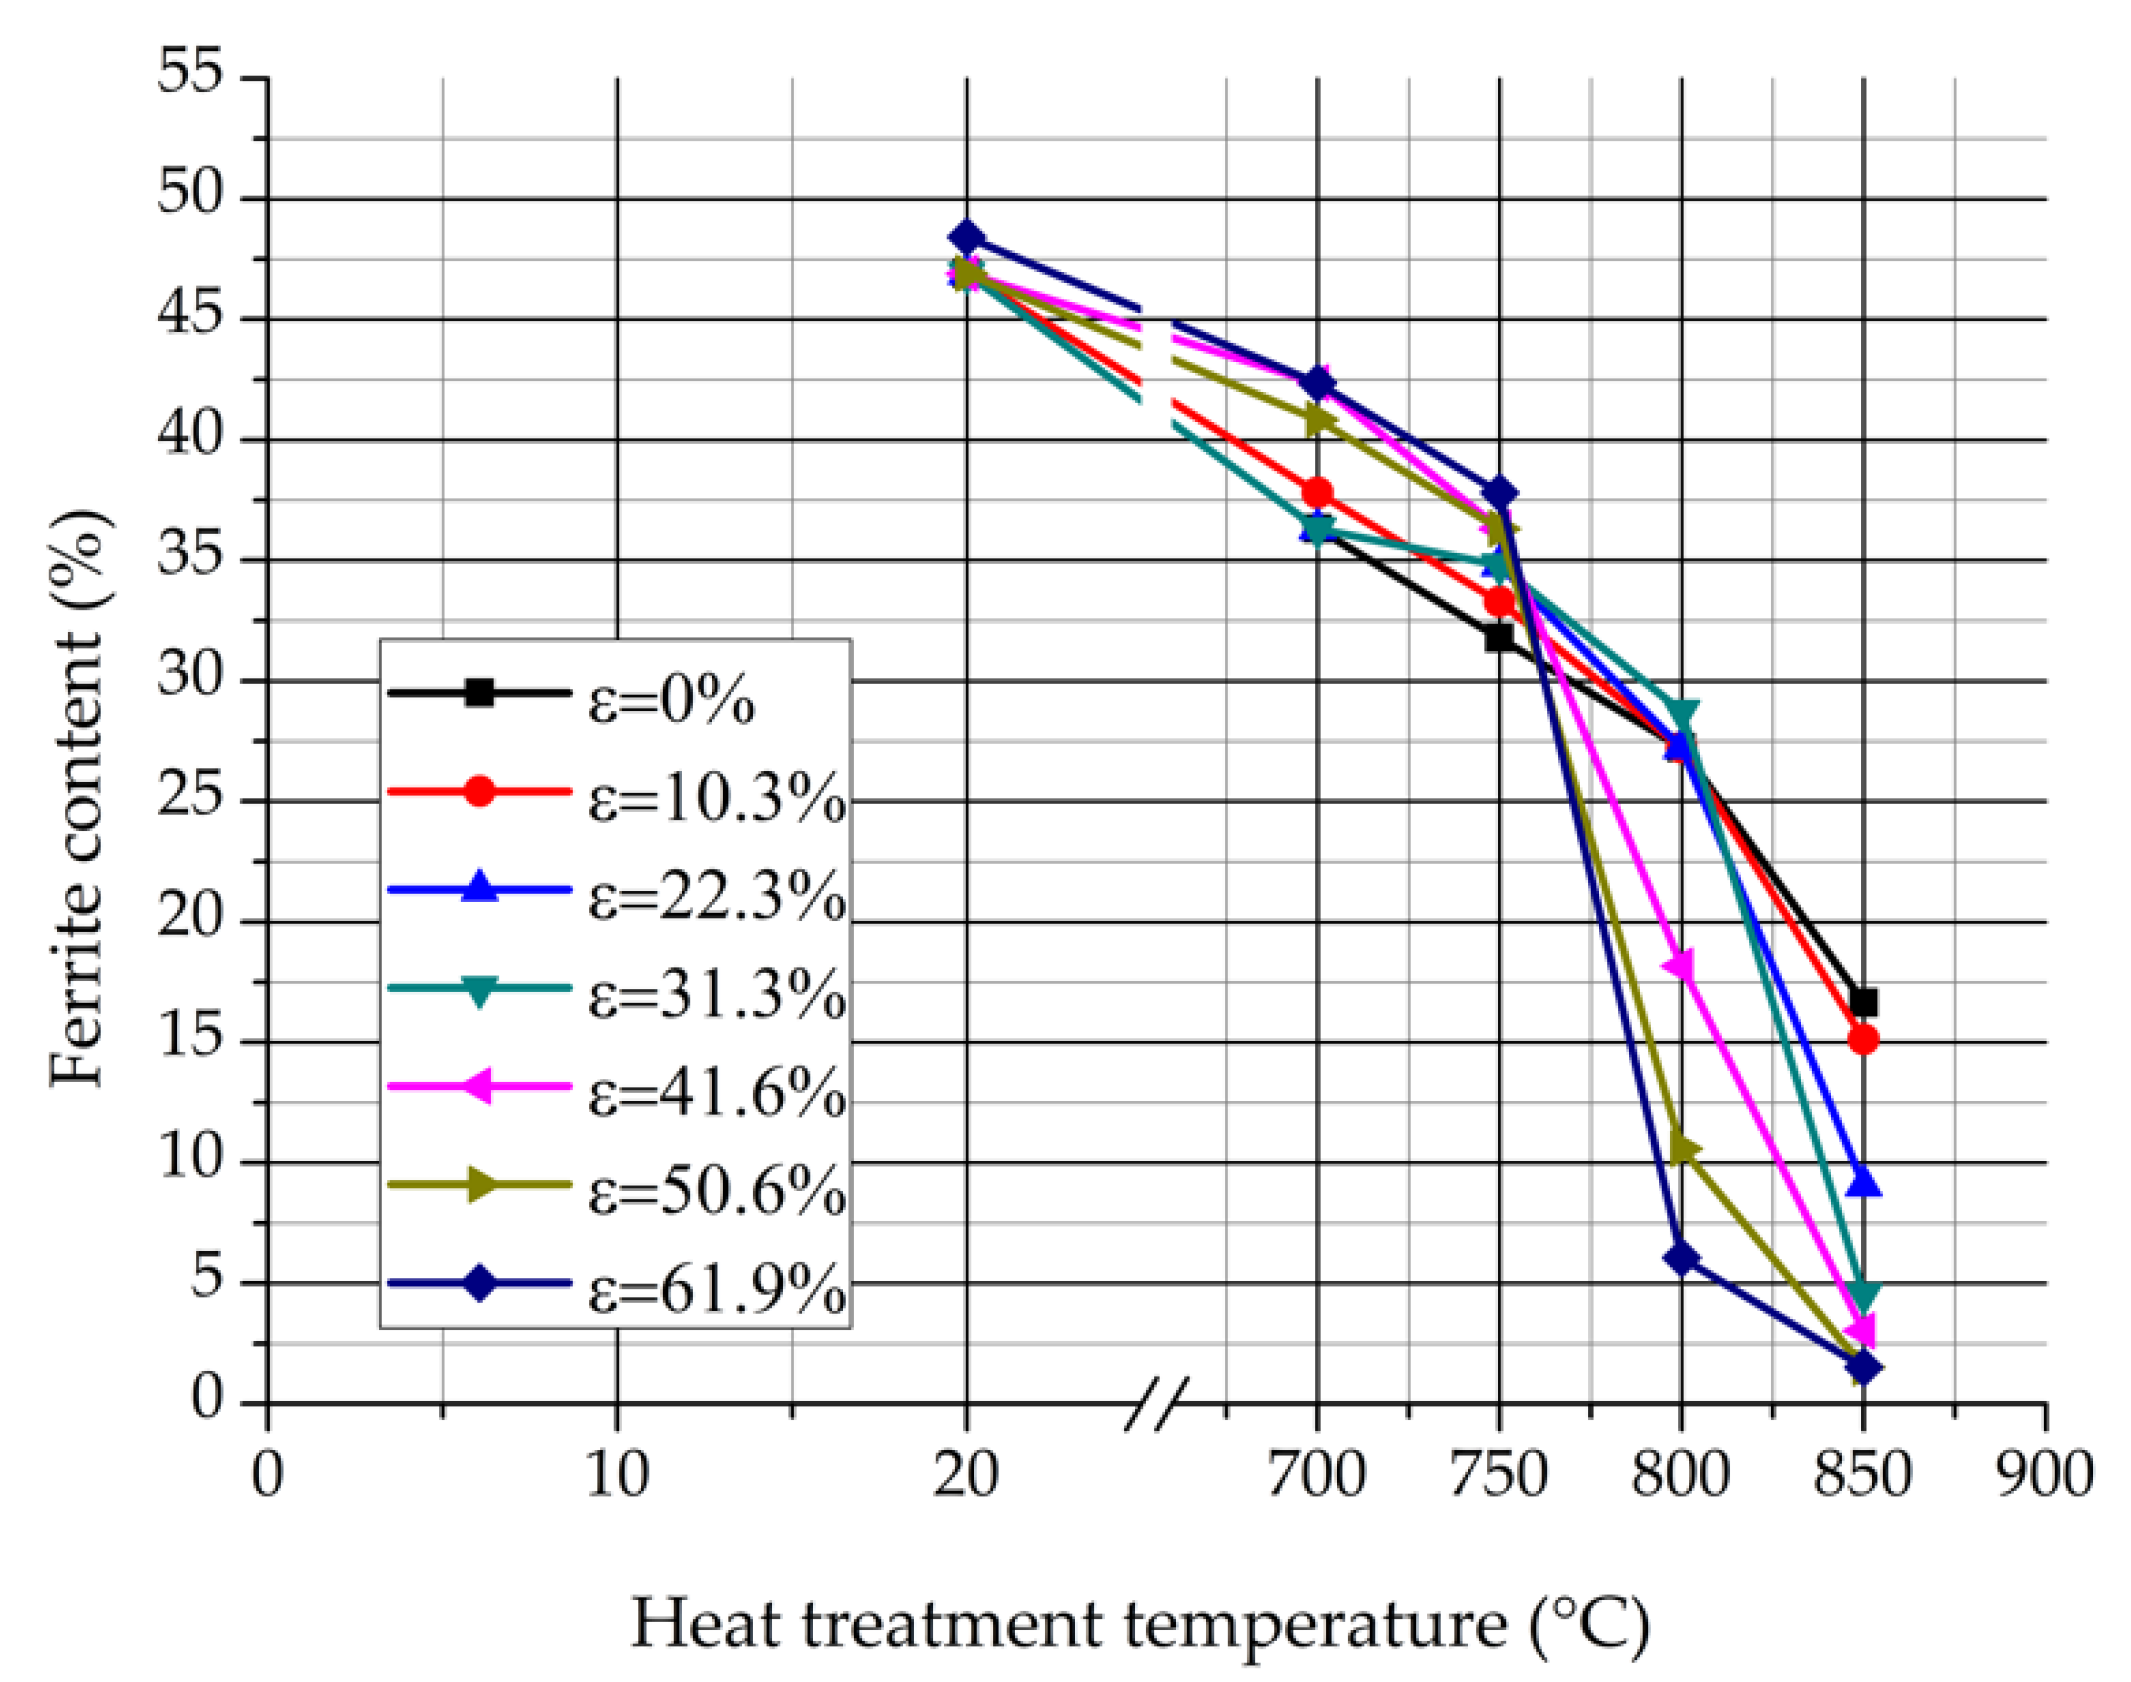
The process of the eutectoidal decomposition can be noticed particularly well in
Figure 6, which represents the calculated δ-ferrite contents in the function of the heat treatment temperature [
21].
As it can be seen, the δ-ferrite content of the deformed and non-heat-treated samples is about equal, the cold rolling itself cannot influence the δ-ferrite content. On the other hand, it can be noticed the δ-ferrite content decreases due to the heat treatment by each deformation rate because of the intensifying δ-ferrite transformation. The eutectoidal decomposition starts at about 750 °C and is more intensive in deformed samples. The stronger the extent of the previous cold rolling reduction, the more the amount of the decomposed δ-ferrite. In other words, the previous cold rolling promotes the δ-ferrite decomposition. It is supposed that the deformation stored energy improves the number of the σ-phase nuclei during the heat treatment. Due to the growing amount of the σ-phase, more δ-ferrite grains transform into secondary austenite.
3.1.2. DC Magnetometer Measurement
Secondly, the δ-ferrite content of the samples was measured by a Stablein-Steinitz type DC magnetometer (designed and made in our department) and were compared with the results of the AC magnetometer.
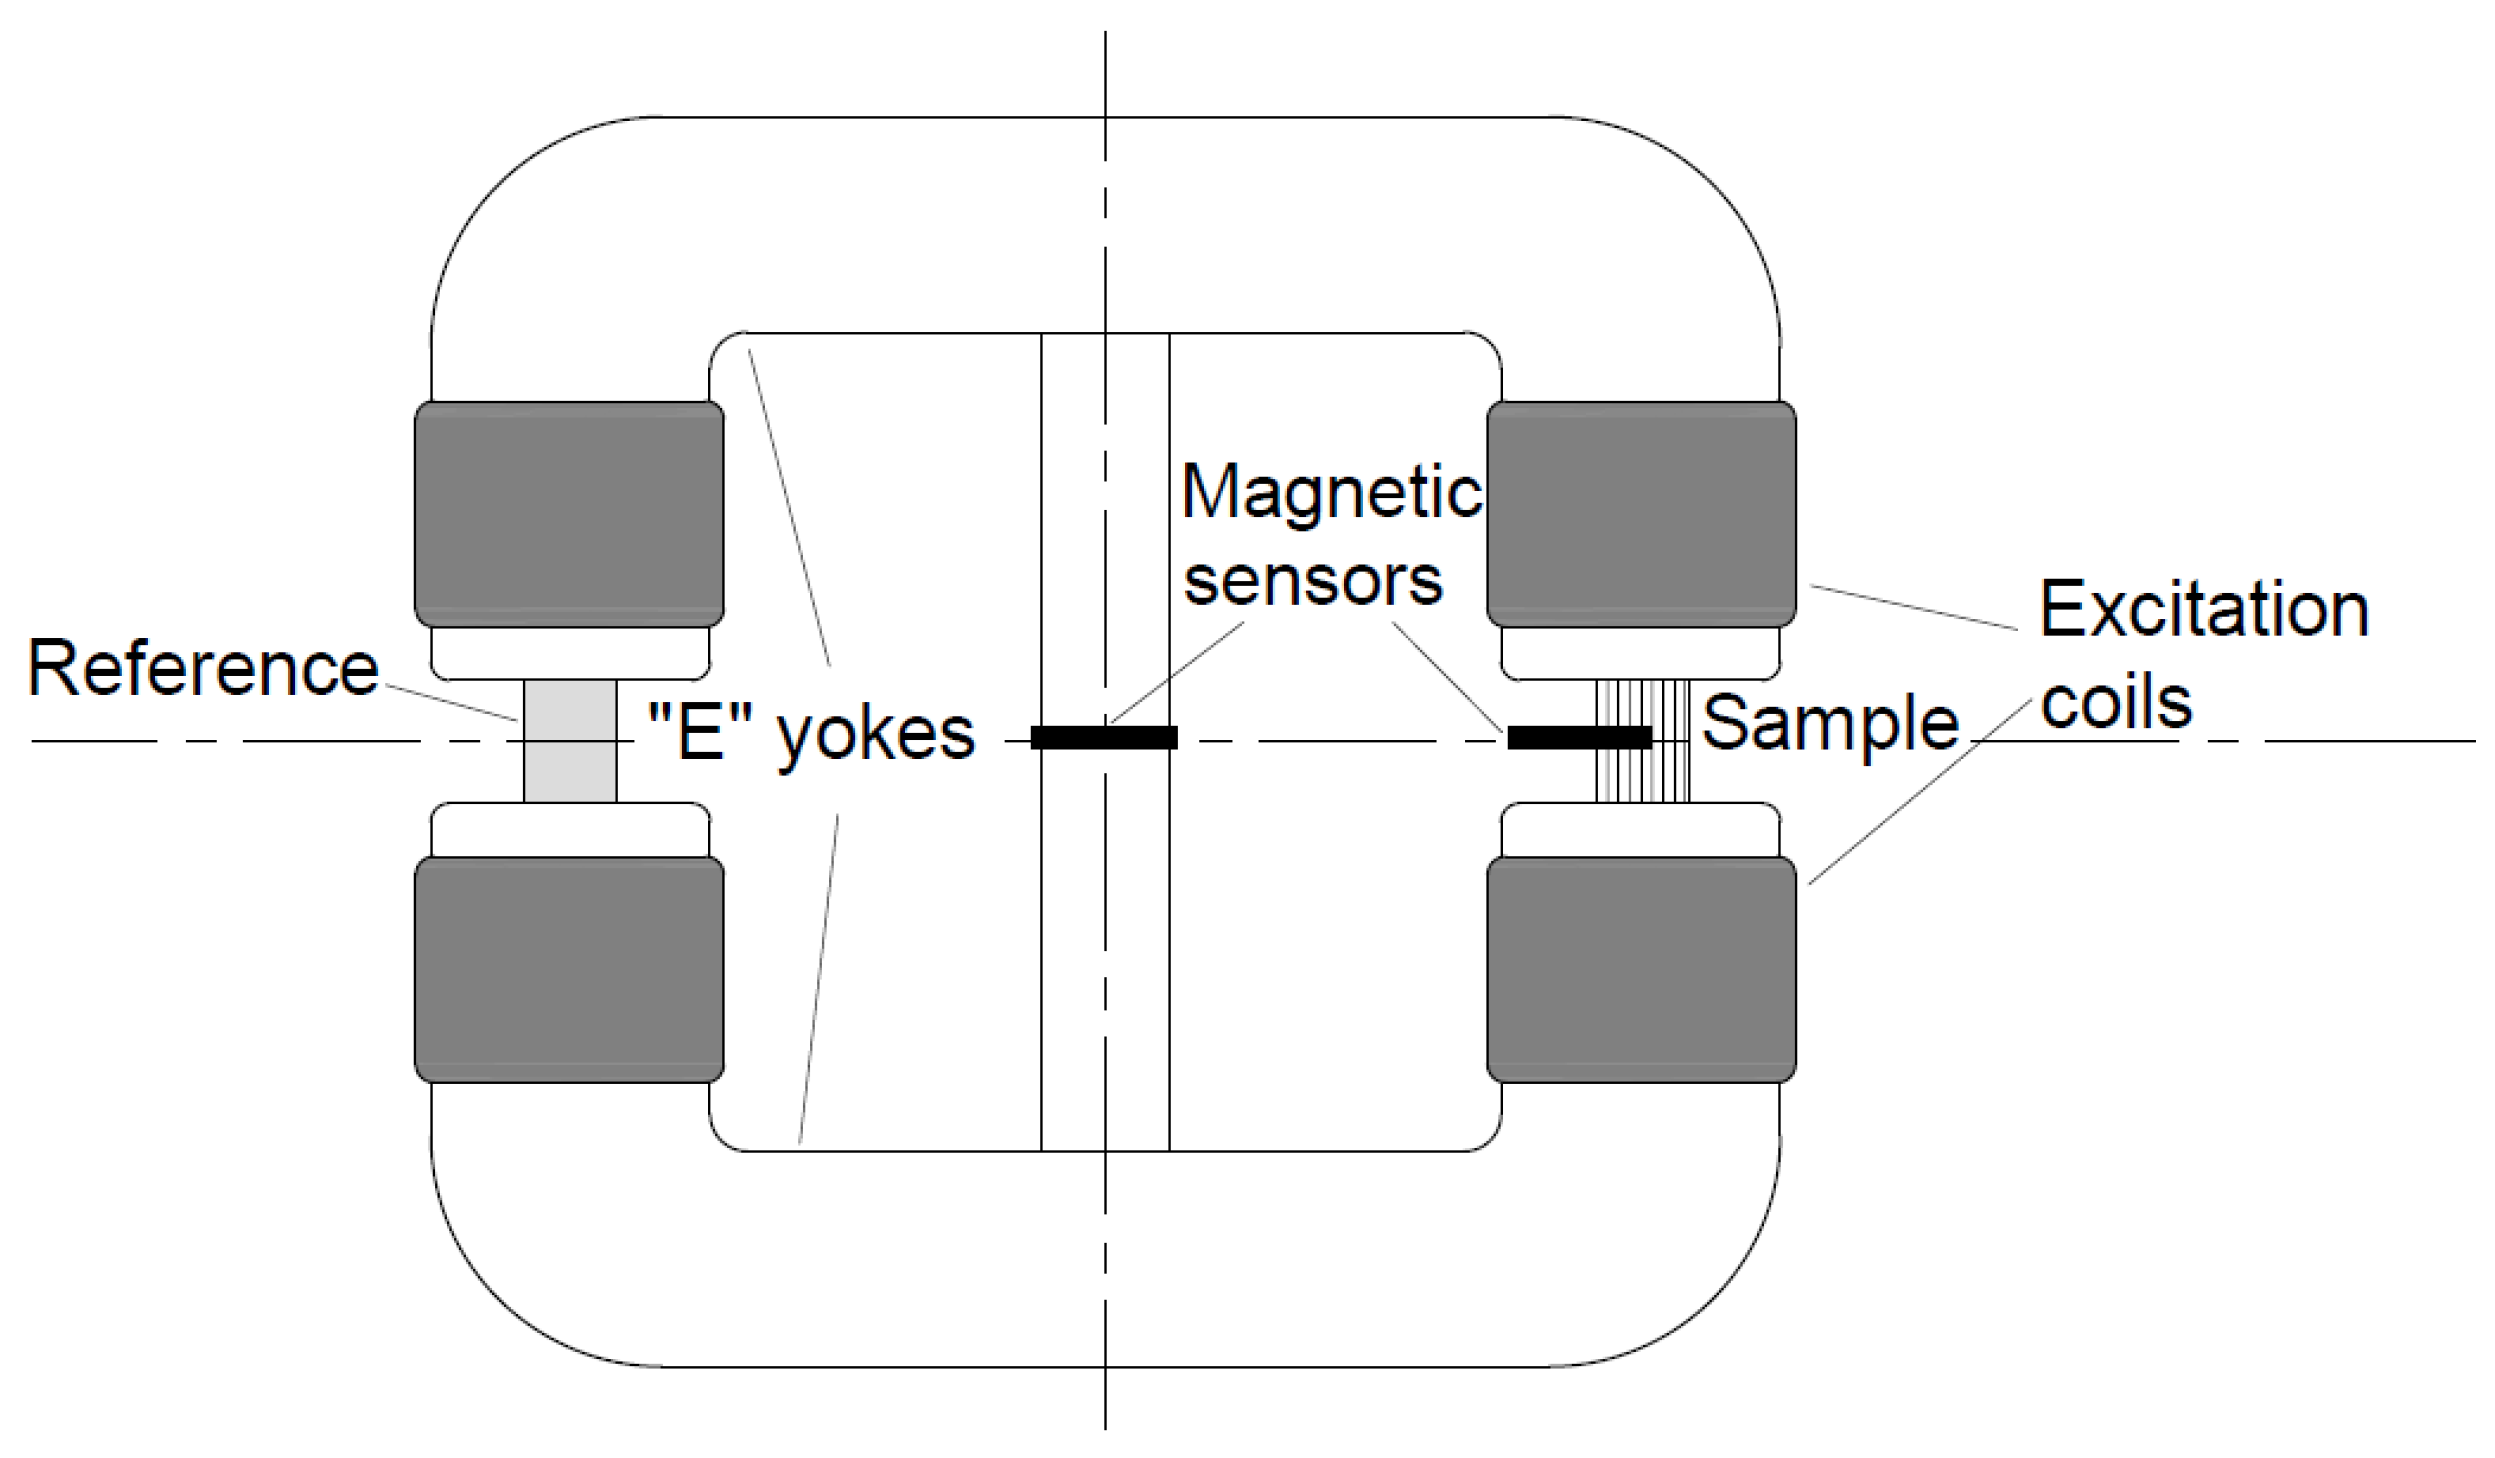
Figure 7 illustrates the set-up of the applied DC magnetometer [
22,
23]. The advantage of the DC magnetometer against the AC magnetometer is it can excite the samples into saturation. The highest excitation level was about 2700 A/cm, which was enough to reach the complete saturation of DSS samples. The DC magnetometer can measure the real saturation polarization until the AC magnetometer can determine just a maximal polarization value. Unfortunately, the DC magnetometer has disadvantages as well. It requires bulk samples and it can only be used in a laboratory because of its heavy size. The DC magnetometer was designed and built in our laboratory [
22,
23,
24].
The original version of Stablein-Steinitz type DC magnetometer was designed to record the hysteresis curve of bulk materials in the 1930s. It has symmetrical yoke which contains two U-shaped parts and a small cross-section middle bridge. The excitation is accomplished by four coils. The set-up consists of two uniform-sized air-gaps namely, the reference, and the measuring air-gaps. The arrangement is magnetically symmetrical; therefore, there is no flux in the middle bridge if the sample air-gap is empty. The symmetry of the magnetic circuit is broken by a sample taken into the sample air-gap. Therefore, some part of the flux closes through the middle bride. Our set up contained two Hall sensors and a PC-driven data acquisition unit. The sensor in the sample air-gap measures the magnetic field (H) within the sample, the signal of the sensor in the middle bridge is directly proportional to the magnetization (M) of the sample.
The signals of the Hall sensors are connected to the 16-bit data acquisition card through a double-channel amplifier. The excitation is supplied by a computer-controlled power amplifier. The LabView program allows for cyclical demagnetization and it can record, among others, the normal magnetization curve and the hysteresis loops of the sample [
22,
23,
24].
The δ-ferrite content was calculated from the saturation polarization values similarly to the method mentioned before. The measured saturation polarization (
of the initial sample was 0.563 T. The δ-ferrite content of the tested samples (
x in %) was determined with the following Equation (3):
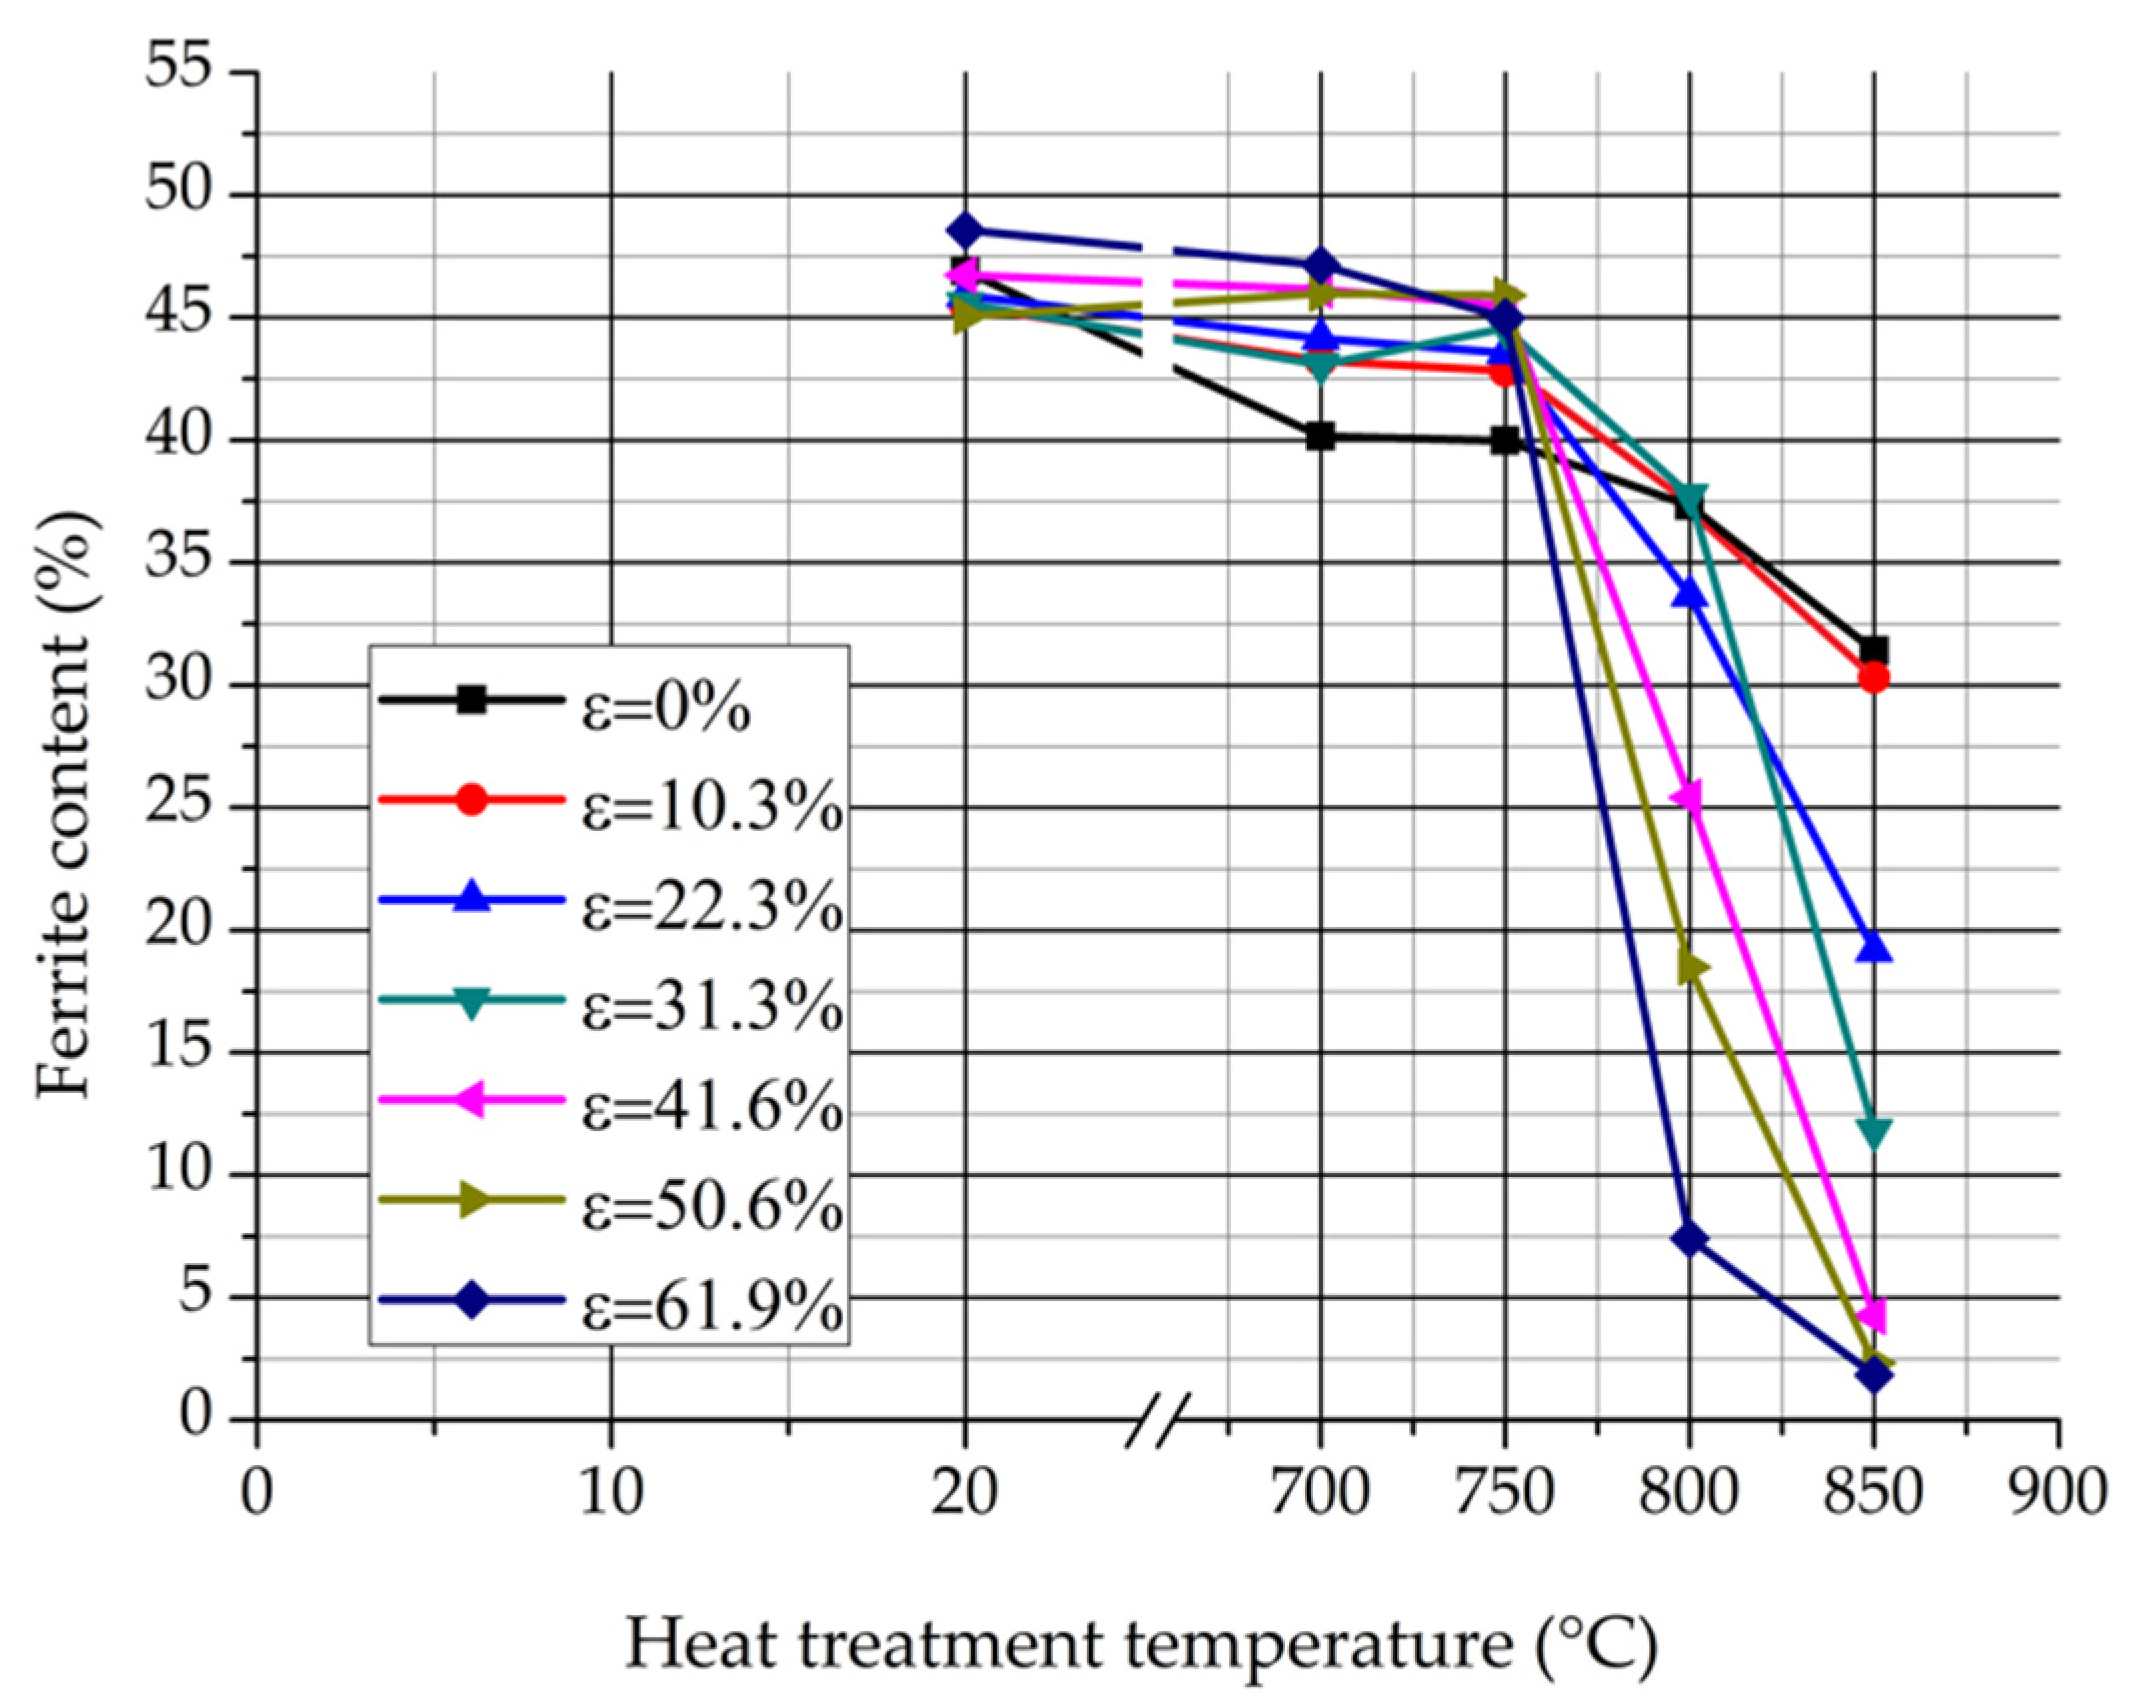
Figure 8 represents the δ-ferrite content values in function of the heat treatment temperature by the DC magnetometer measurement.
The δ-ferrite content reduces continuously in function of the heat treatment temperature by every rolling reduction. It can be noticed that the δ-ferrite content reduction below 750 °C is less intensive than it is by the AC magnetometer measurement. The DC magnetometer determines higher δ-ferrite contents than the AC magnetometer due to their different excitation levels. Naturally, the calculation which derives the δ-ferrite contents from the real saturation polarization values give more accurate results.
In the following part of this work the DC magnetometer was used as a feritscope to determine the δ-ferrite content of samples.
3.1.3. Light Microscope
All samples were examined by an Olympus PMG-3 type metallographic microscope (Olympus, Hamburg, Germany) which has a digital camera and the maximal magnification is 1000×. During the preparation, the samples were fixed in resin and were grinded on different grain size Al
2O
3 grinding papers. After the grinding, the samples were polished on a fine cloth using Al
2O
3 suspension. Buehler EcoMet 30-type manual metallographic machine (Buehler, Lake Bluff, IL, USA) was used for the grinding and polishing. The type of etching liquid was Beraha [
25].
Images were taken about all samples in the magnification of 25×, 50×, 100×, 500×, and 1000×.
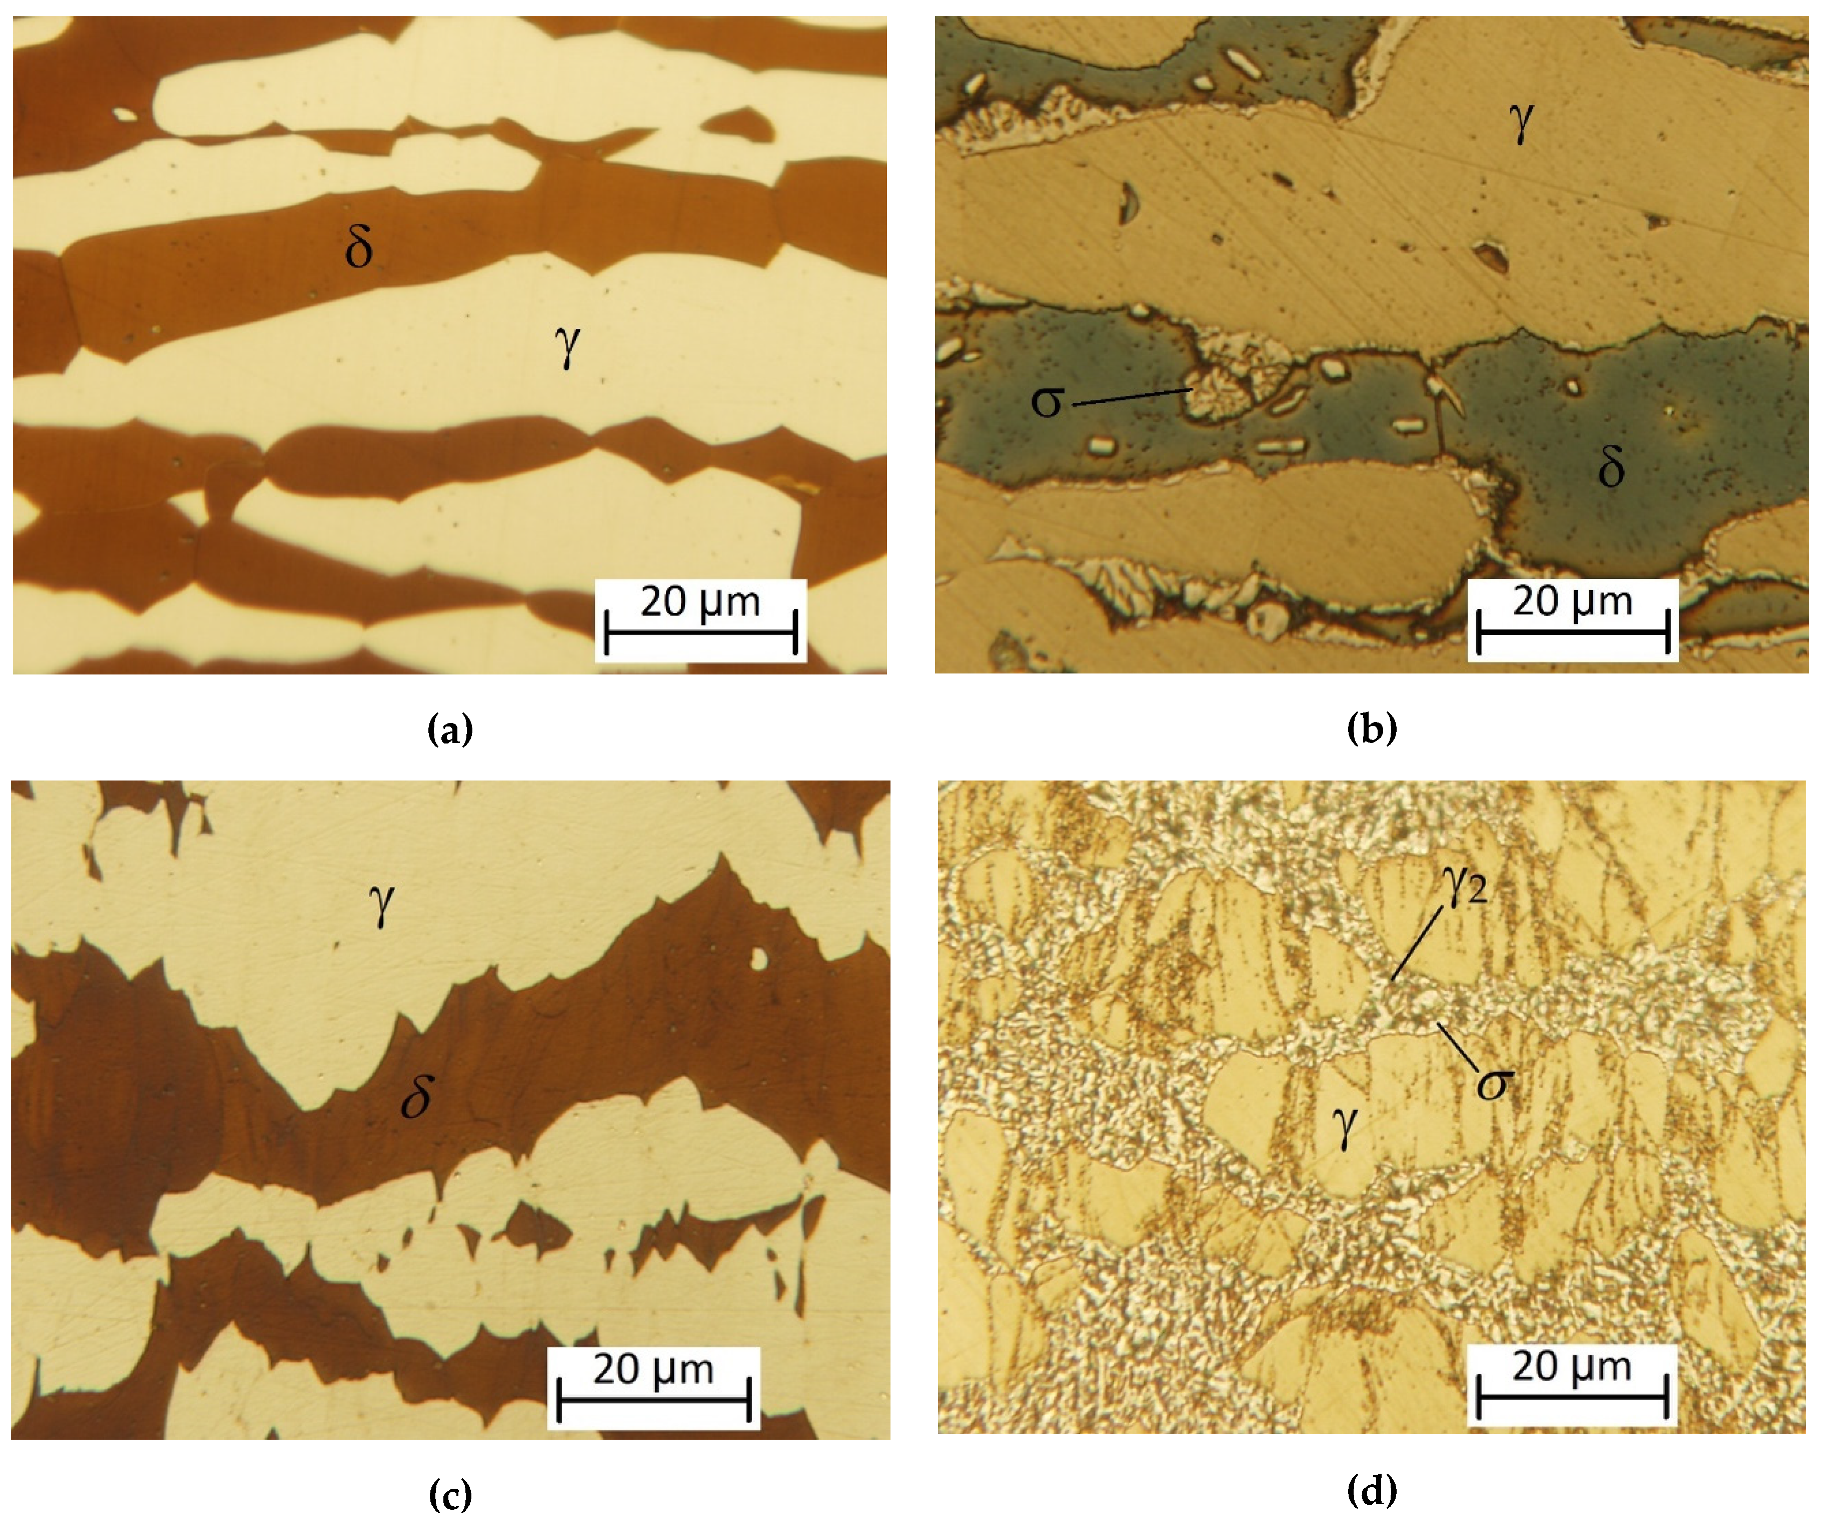
Figure 9 shows the microscope images of 2507-type SDSS in the magnification of 1000×.
Figure 9a shows the original microstructure of the 2507-type SDSS without deformation and heat treatment. The ratio of the δ-ferrite and the austenite is almost equal. The microstructure of the heat treated sample at 850 °C without cold rolling is shown in
Figure 9b. It can be noticed that the transformation of the δ-ferrite has already begun, a slight amount of σ-phase appeared at the grain boundary of the δ-ferrite and the austenite.
Figure 9c represents the ε = 61.9% deformed samples without heat treatment. It can be seen that the decomposition of the δ-ferrite cannot begin without heat treatment. Sample which was deformed in ε = 61.9% and heat treated at 850 °C is shown in
Figure 9d. When the eutectoidal decomposition is finished, the δ-ferrite transformed completely into σ-phase and secondary austenite.
3.1.4. EBSD
The samples were examined by a Philips XL30 ESEM FEG-type scanning electron microscope (SEM, Amsterdam, The Netherlands). The SEM has a point-source cathode of tungsten, which has a surface layer of zirconia (ZrO2). The high tension is continuously variable from 0.2 till 30 kV and the size of the specimen stage is 50 mm × 50 mm × 50 mm.
The type and the distribution of the phases were detected by electron back scattering diffraction (EBSD).
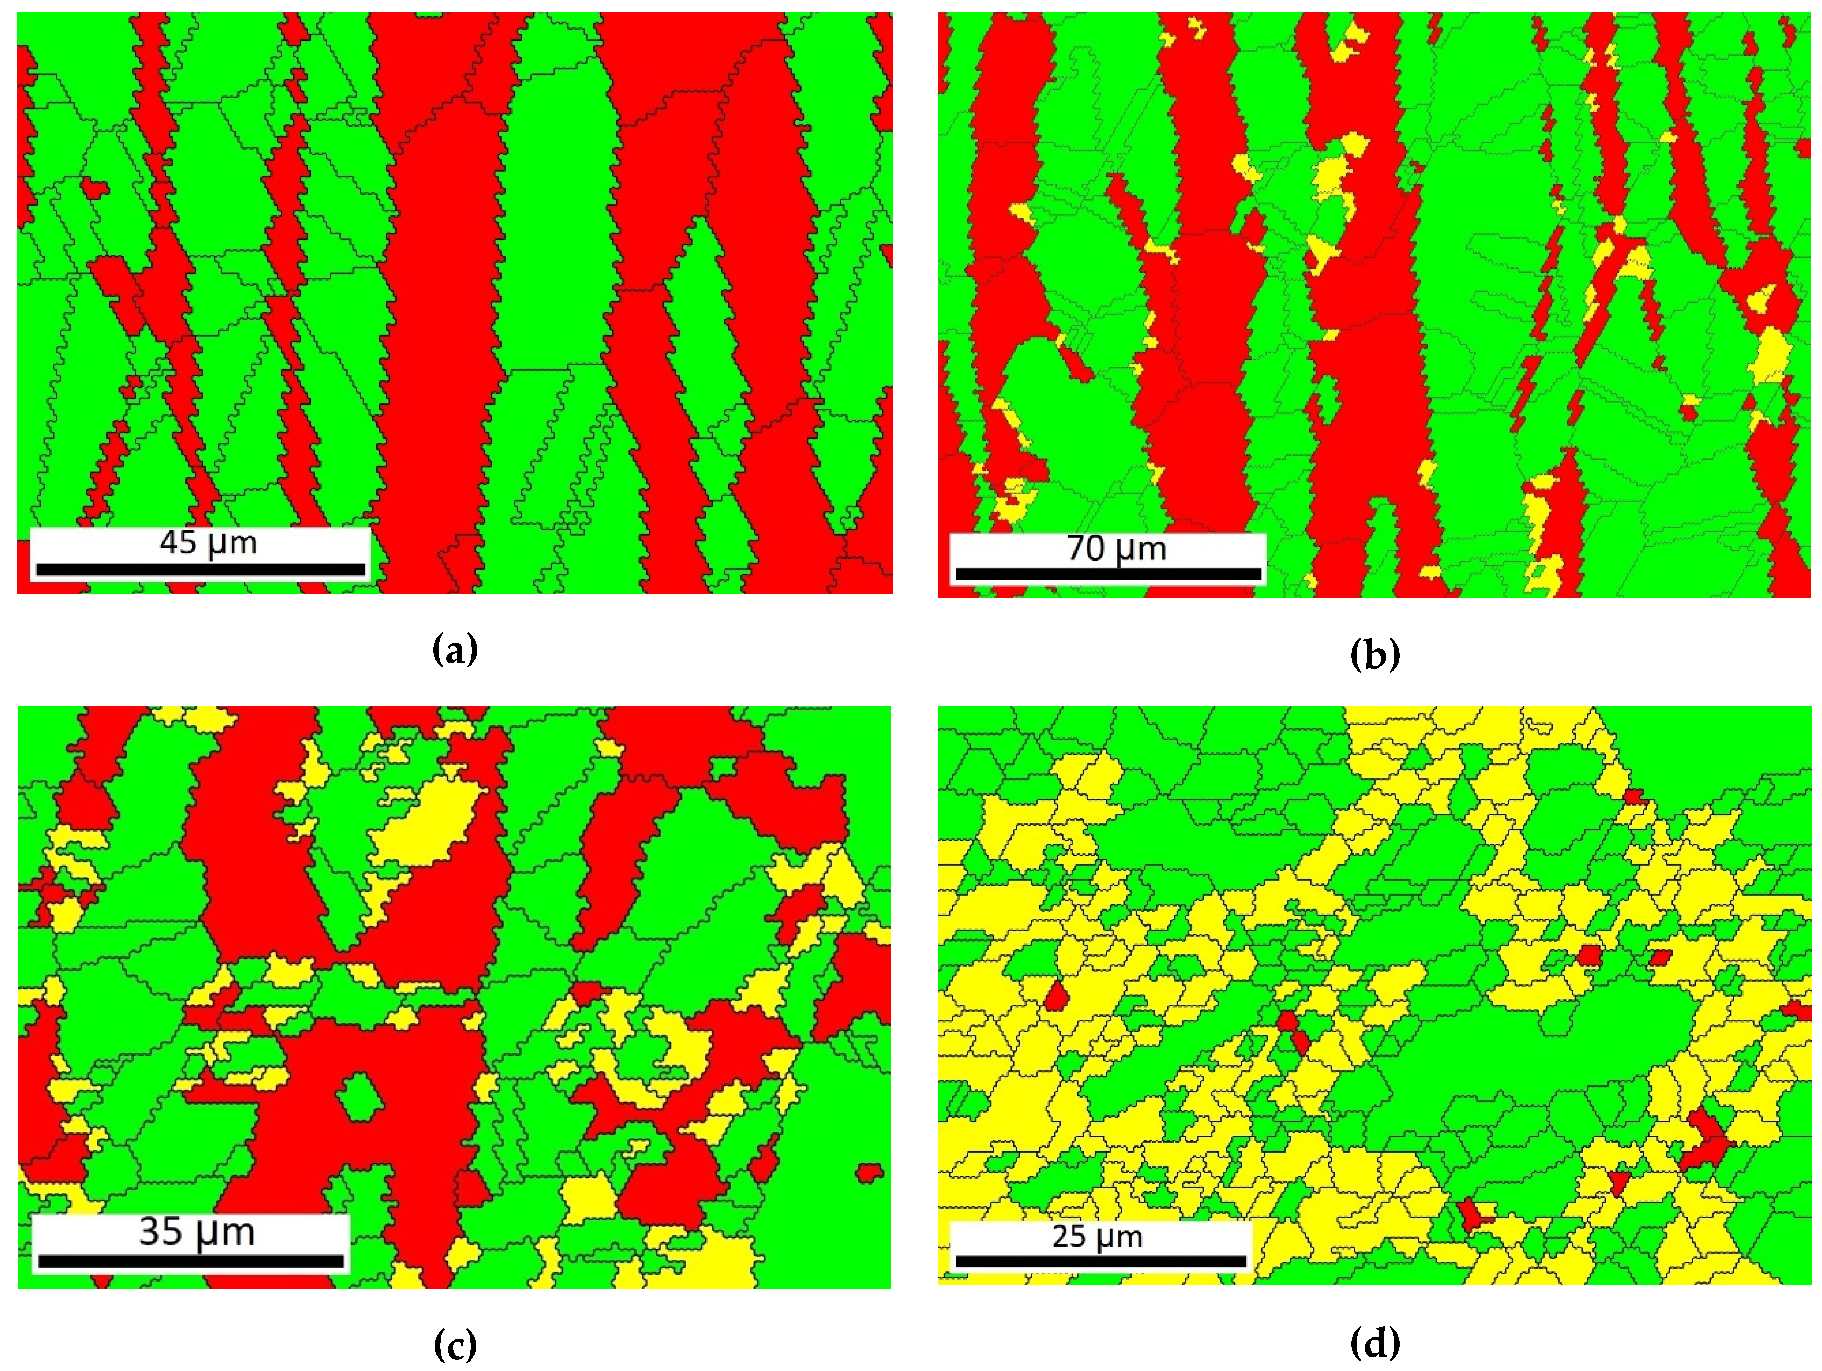
Figure 10 shows the phase maps of the 2507-type SDSS where the different phases were signed by color codes. The green color means the austenite, the red area shows the δ-ferrite, and the yellow color represents the tetragonal σ-phase [
26,
27].
The EBSD images can similarly illustrate the eutectoidal decomposition of δ-ferrite to what was presented by the optical microscope examination.
Figure 10a shows the original phase ratio: 41% δ-ferrite and 59% austenite. This result is slightly different form the value which is given on the data sheet of the 2507-type SDSS, it represents 46.9% δ-ferrite.
Figure 10b shows the phase map of the heat-treated sample at 850 °C without deformation. The ratio of the δ-ferrite decreased from 41% to 35.3% and 3% σ-phase appeared. The amount of the austenite increased from 59% to 61.6%. The decomposition of the δ-ferrite becomes more intense in
Figure 10c, in which the sample is deformed in ε = 22.3% and heat treated at 850 °C; 13% σ-phase can be detected beside the δ-ferrite and the austenite. The sample in
Figure 10d was prepared with the maximal deformation extent and heat treatment temperature. The phase transformation of the δ-ferrite has almost finished: The amount of the σ-phase increased significantly until the δ-ferrite content is just about 1%.
3.1.5. Thermoelectric Power Measurement
Thermoelectric power (TEP) was measured by a TechLab Trivolt PK120-type TEP measuring instrument (TechLab, La Tannerie, France) in order to examine if there is correlation between the eutectoidal decomposition of δ-ferrite and the TEP. The TEP instrument is operated by 220 V and its measuring accuracy is about 2 nV/K.
The basis of the TEP measurment is the Seebeck-effect. If temperature difference forms between two diverse electrical conductors or semi-conductors, voltage difference appears between the two substances. The value of the TEP is sensitive to the different material properties, especially to the chemical composition [
28,
29,
30].
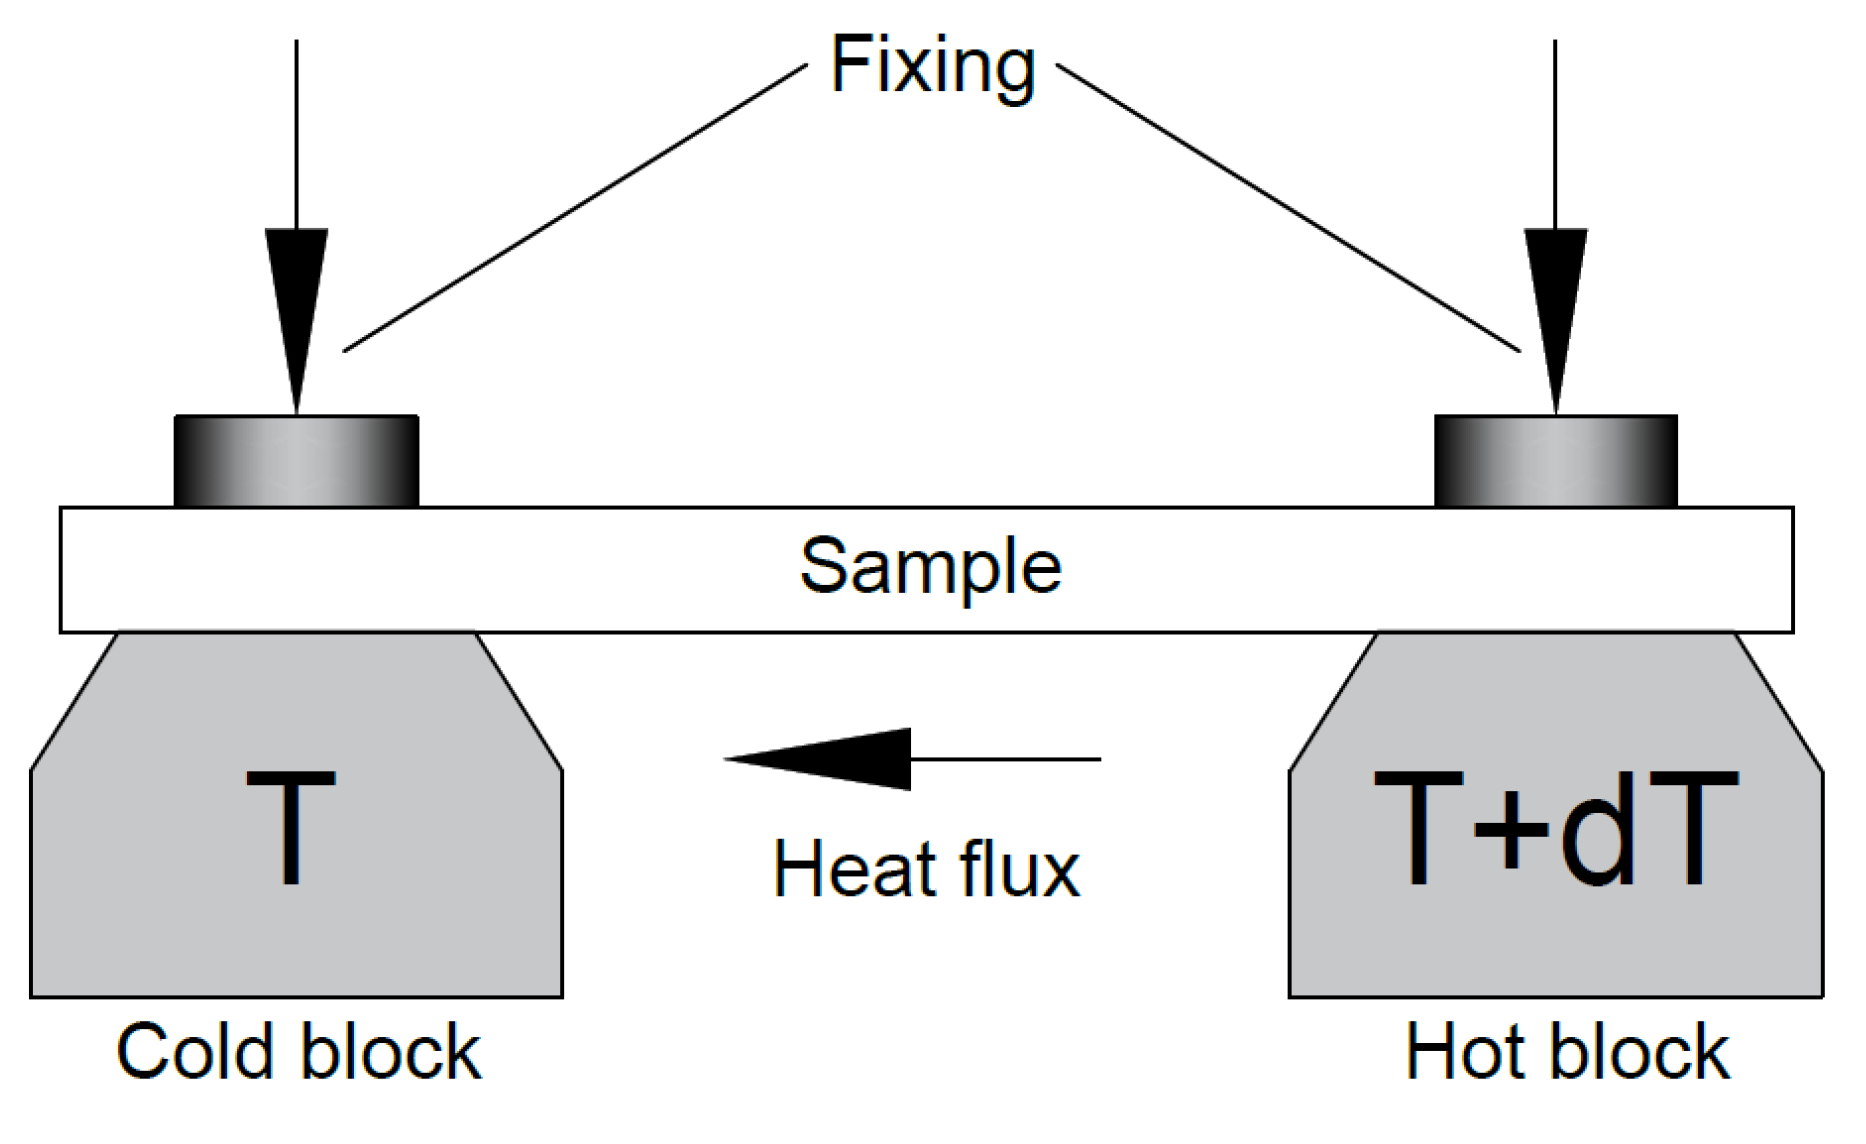
Figure 11 shows the sematic illustration of the TEP instrument [
29].
The set-up contains two copper blocks, one of them is heated electrically, while the other is cooled by circulated water. The measuring temperatures can be controlled quickly and exactly due to the thermocouples which are built in the cold and the hot blocks. The thickness of the samples was 3.4 mm. The contact surface of the samples were grinded with fine grinding paper (P1200) and then were cleaned with alcohol. Samples were put on the cold and hot blocks and were fixed with two isolated screws. Temperature of the cold block was about 15 °C until the hot block was about 25 °C. The result was read after about 90 s, when the value of the TEP stabilized. The results of the TEP measurments are presented in
Figure 12 and
Figure 13.
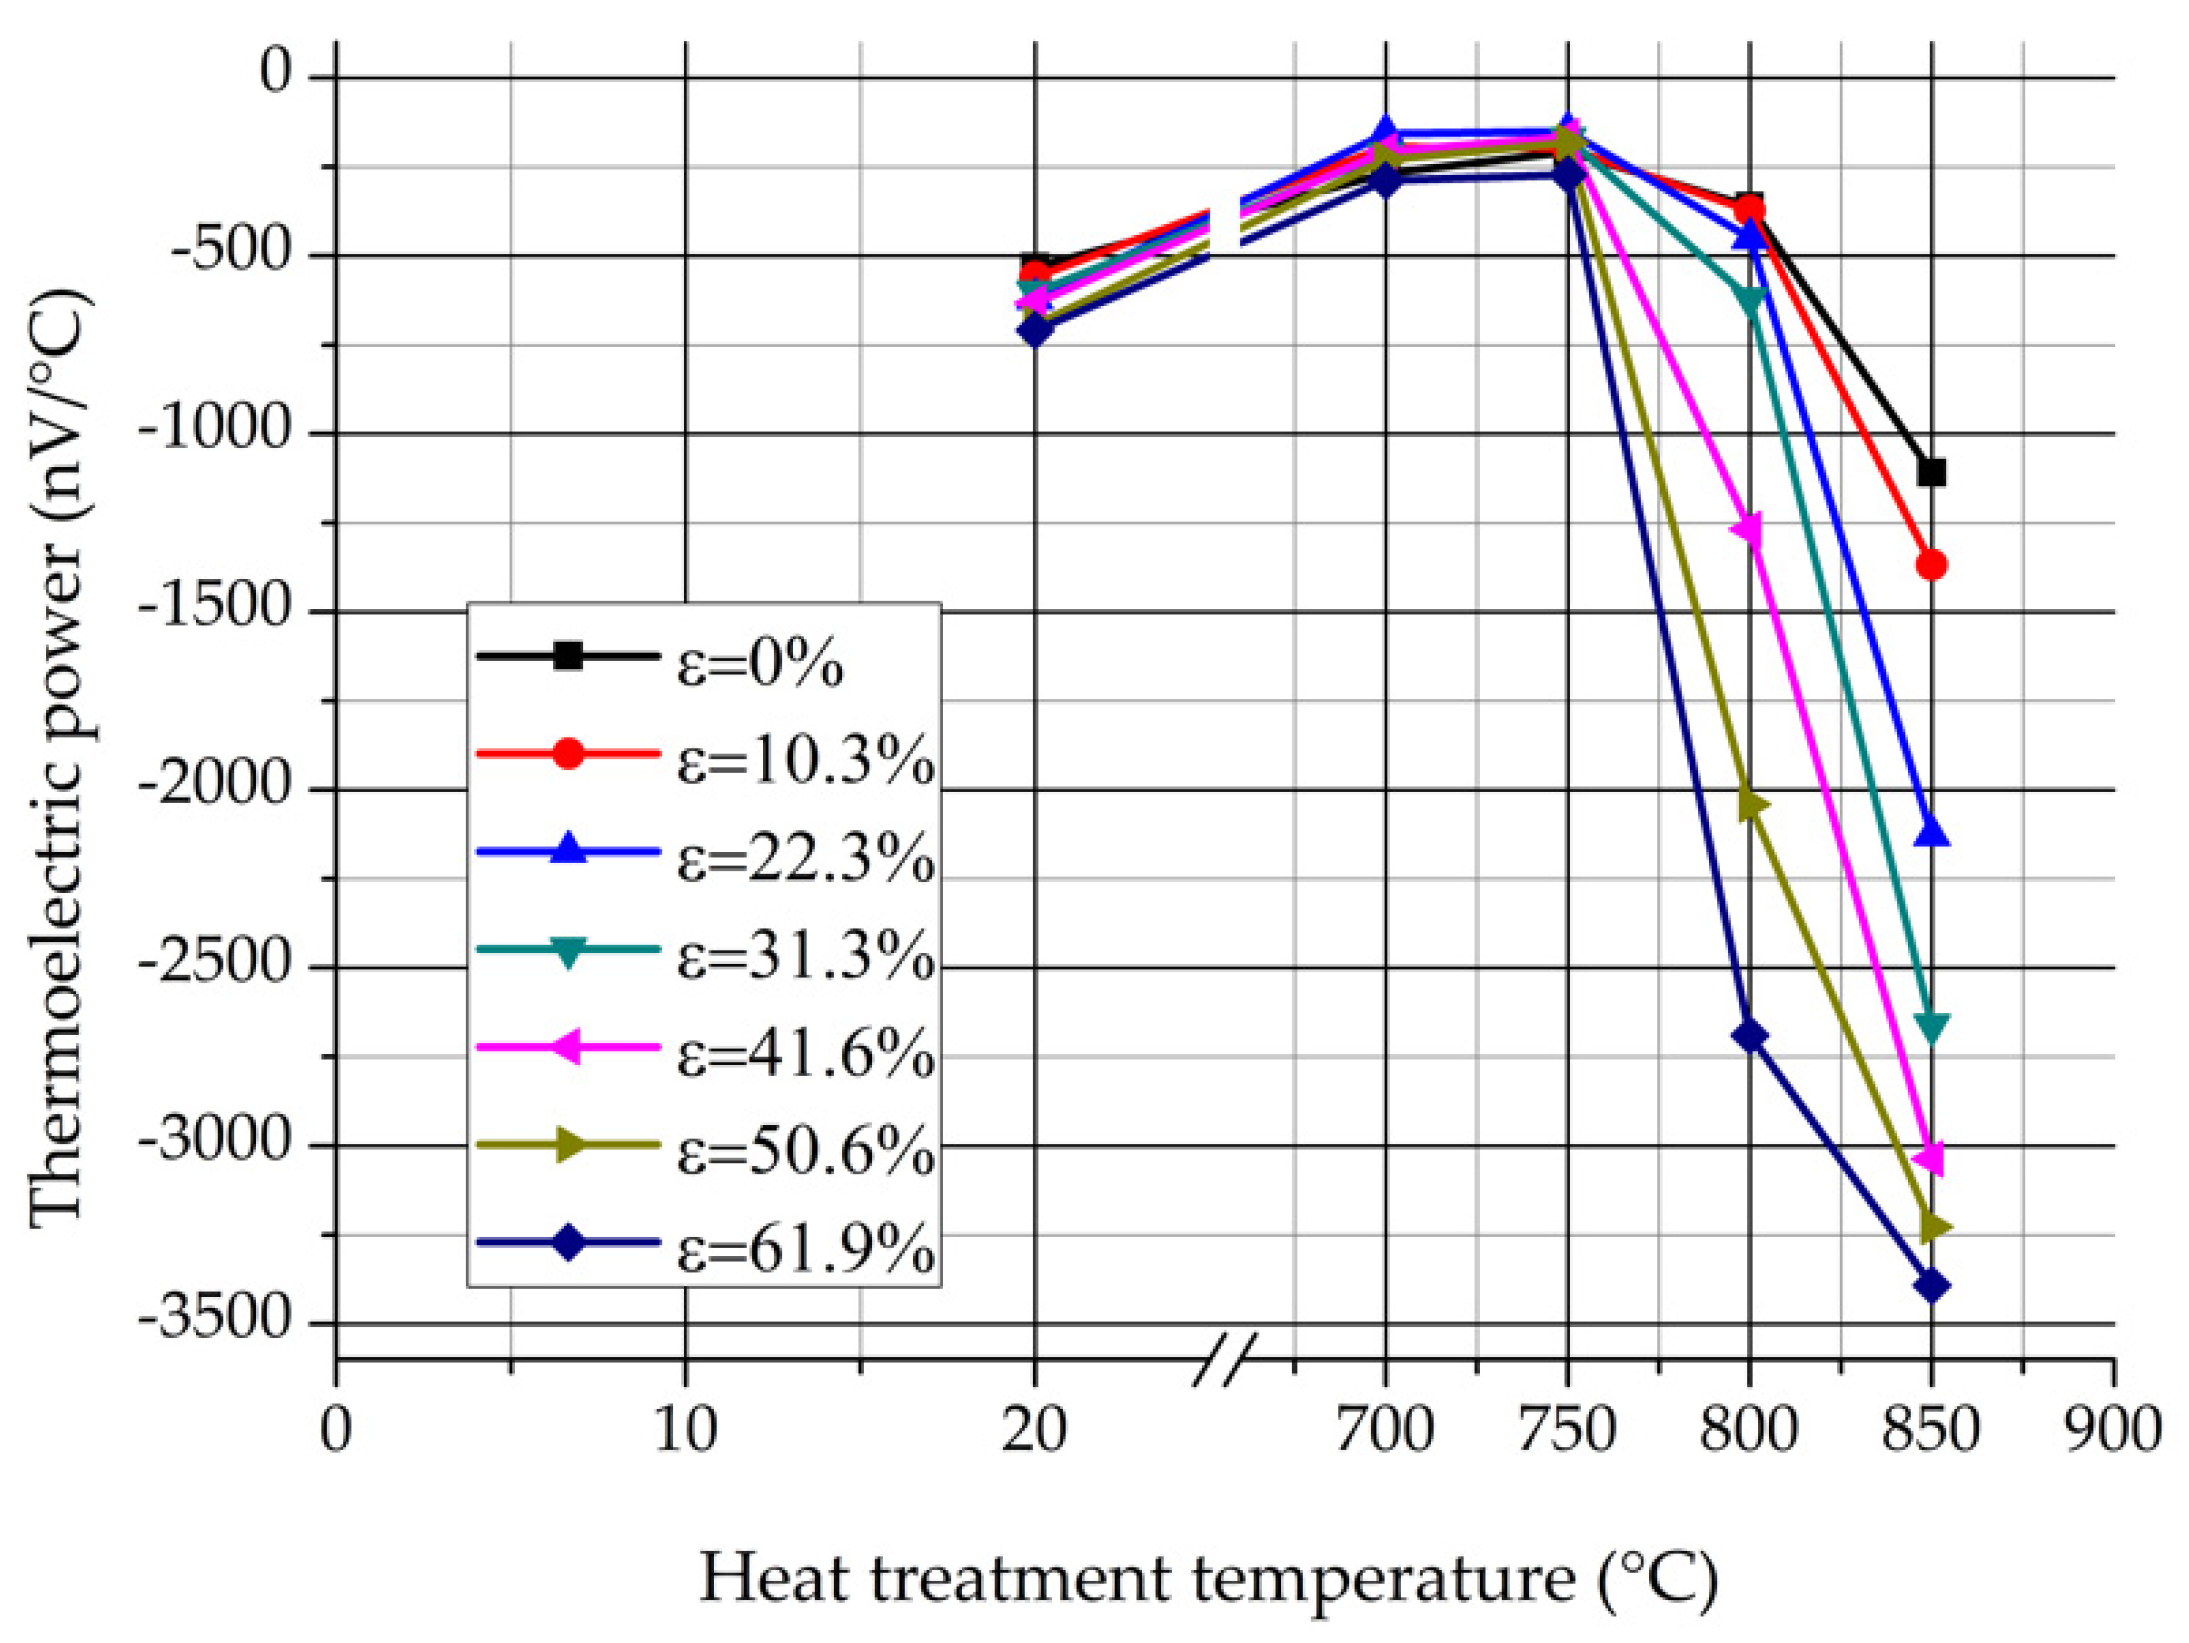
Figure 12 shows the values of the TEP in function of the heat treatment temperature. It can be seen the values of the TEP are nearly independent of the deformation rate below 750 °C. However, the previous cold rolling has an intensive effect on the TEP above 750 °C. The stronger the plastic deformation rate, the lower the values of the TEP. The changing of the TEP above 750 °C is quite similar to the changing of the δ-ferrite content, which were represented in
Figure 6 and
Figure 8.
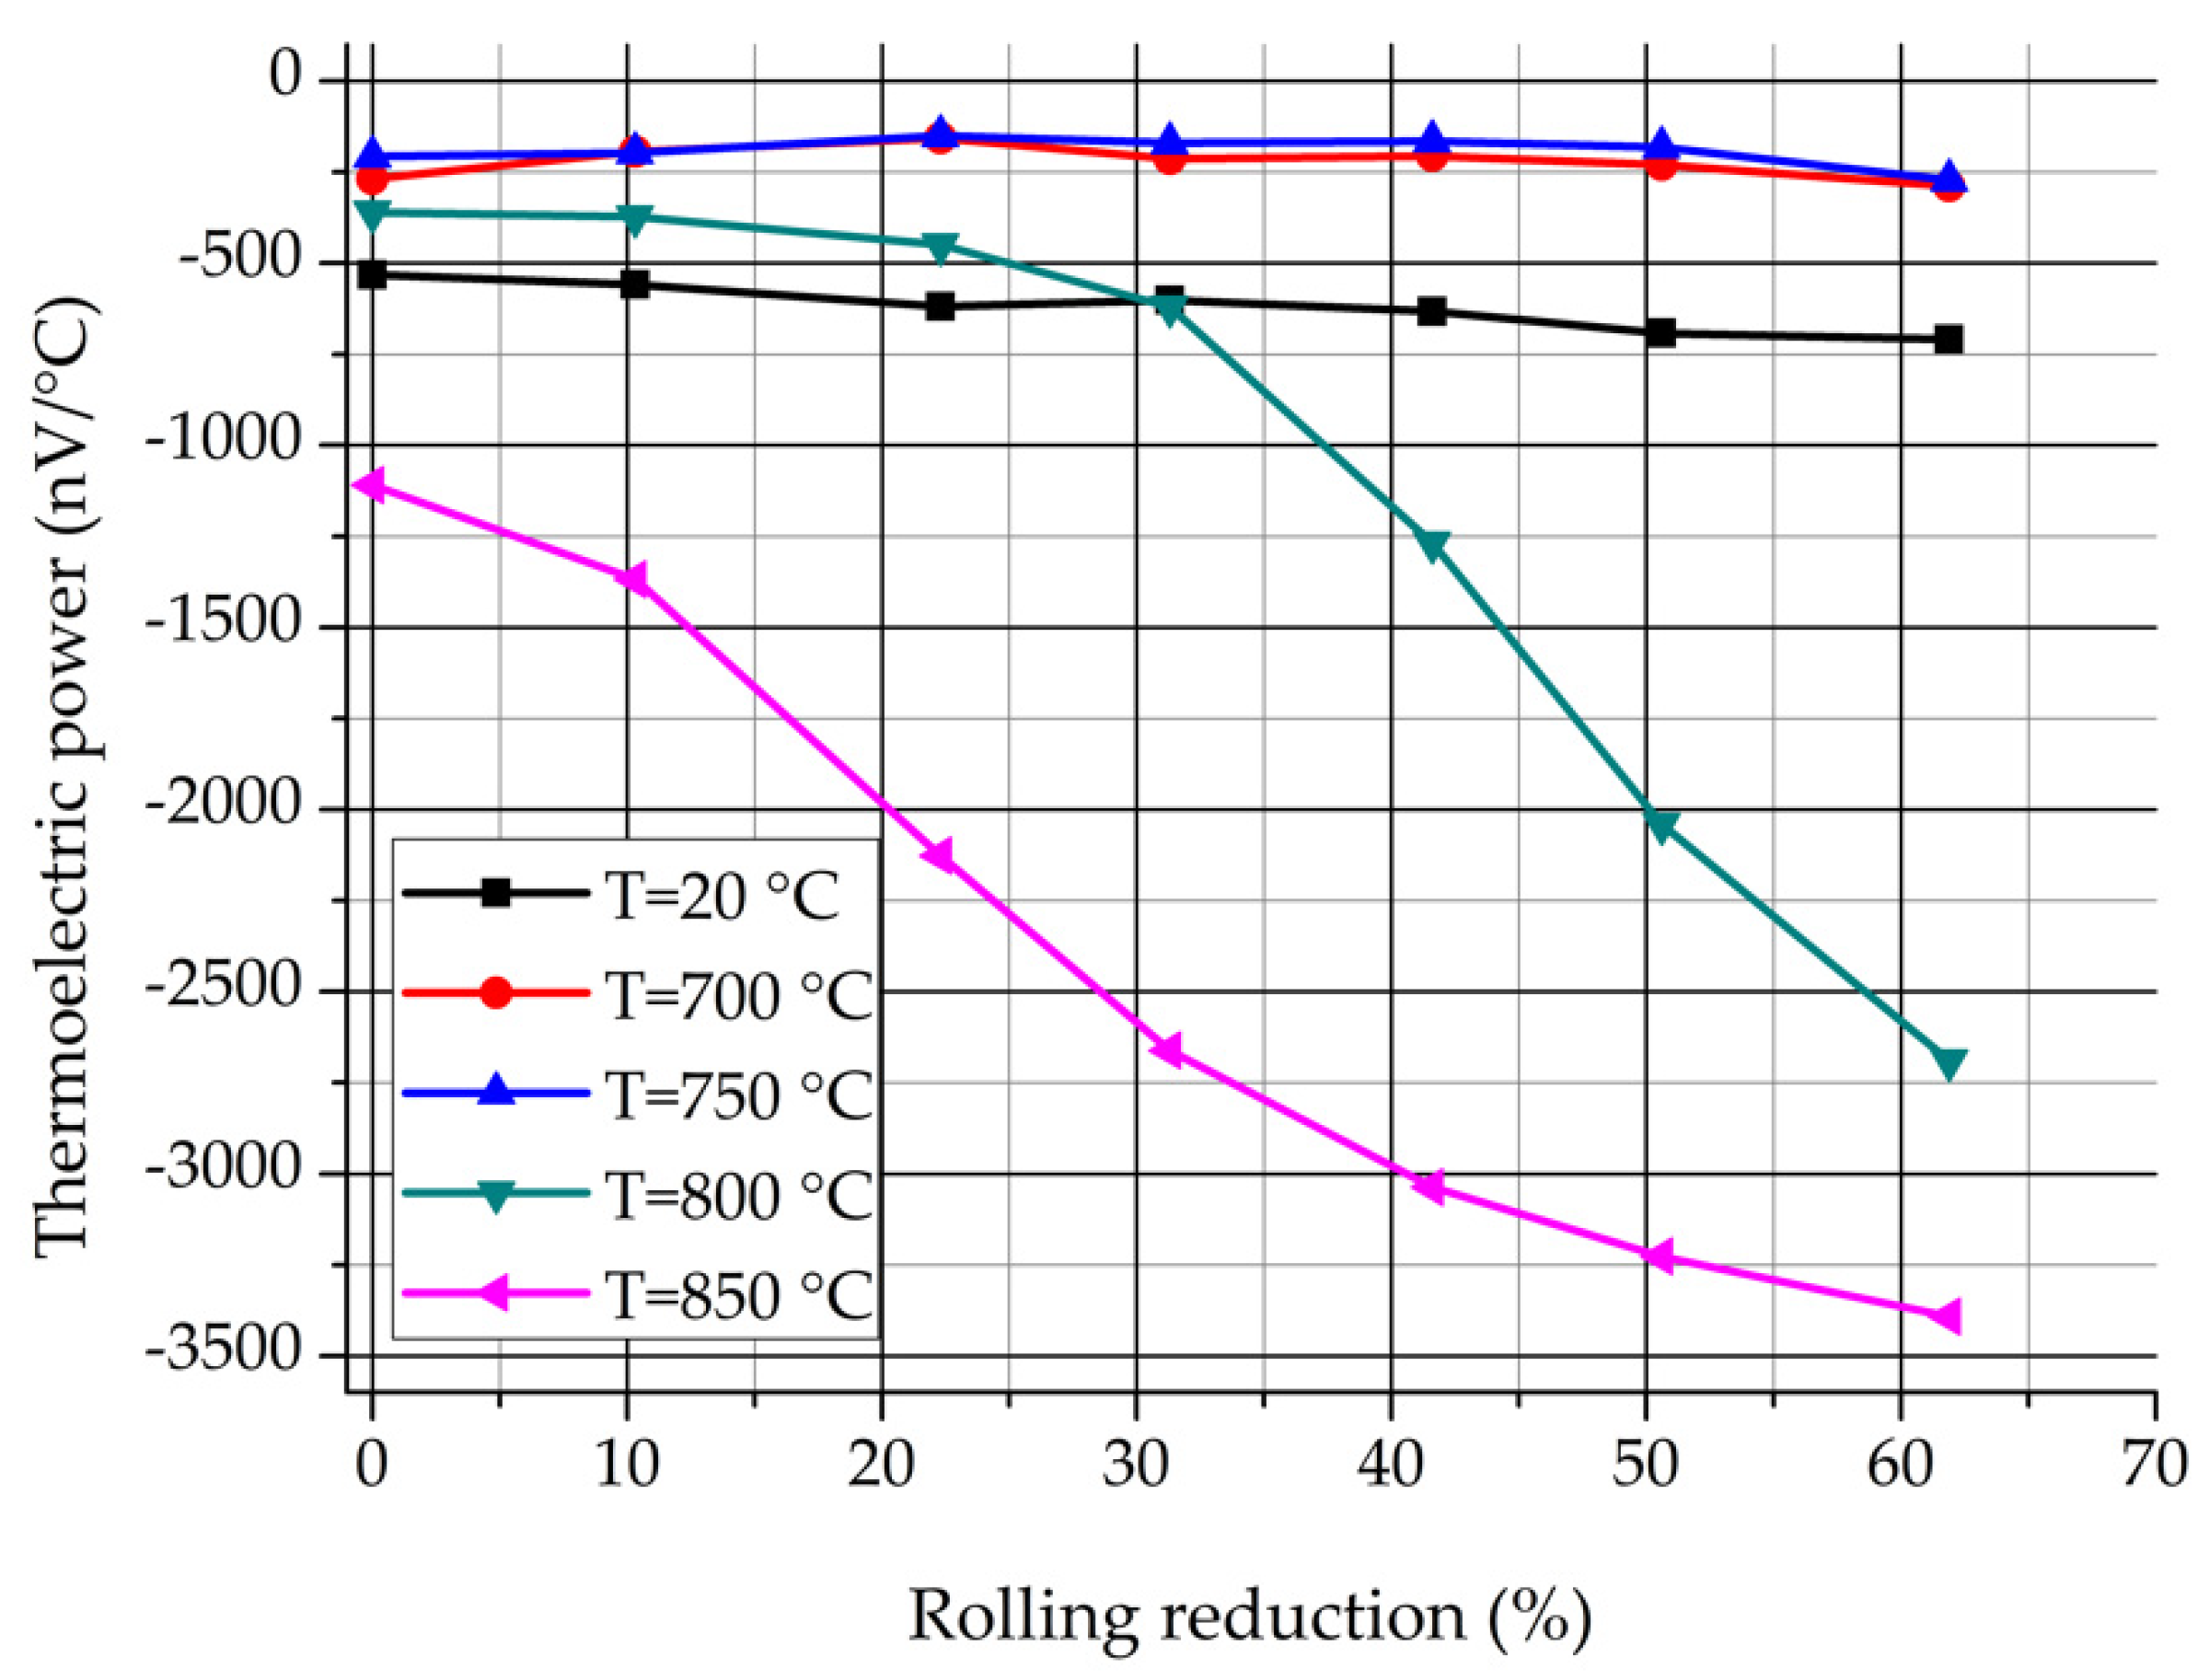
Figure 13 shows the values of the TEP in function of the rolling reduction. It is known that the TEP is sensitive to the precipitations. The progressive decrease of the TEP at 800 and 850 °C can occur due to the precipitation of the significant amount of σ-phase, which forms during the eutectoidal decomposition. It can be seen that the values of the TEP are nearly independent of the deformation rate at 700 and 750 °C, but higher than the values of the non-heat-treated samples. It is considered that the increase of the TEP is caused by those precipitations which appear previously to the σ-phase (e.g., Cr
2N, M
23C
6, or χ-phase) [
3]. Based on the above, there is a good correlation between the process of the eutectoidal decomposition and the results of the TEP measurement.
3.1.6. Foerster-Type DC Coercimeter Measurement
The accurate value of the coercive field was measured by a Foerster DC coercimeter (Institut Dr. Förster, Reutlingen 1.094 and 1.106, Reutlingen, Germany) which is an open magnetization circuit equipment.
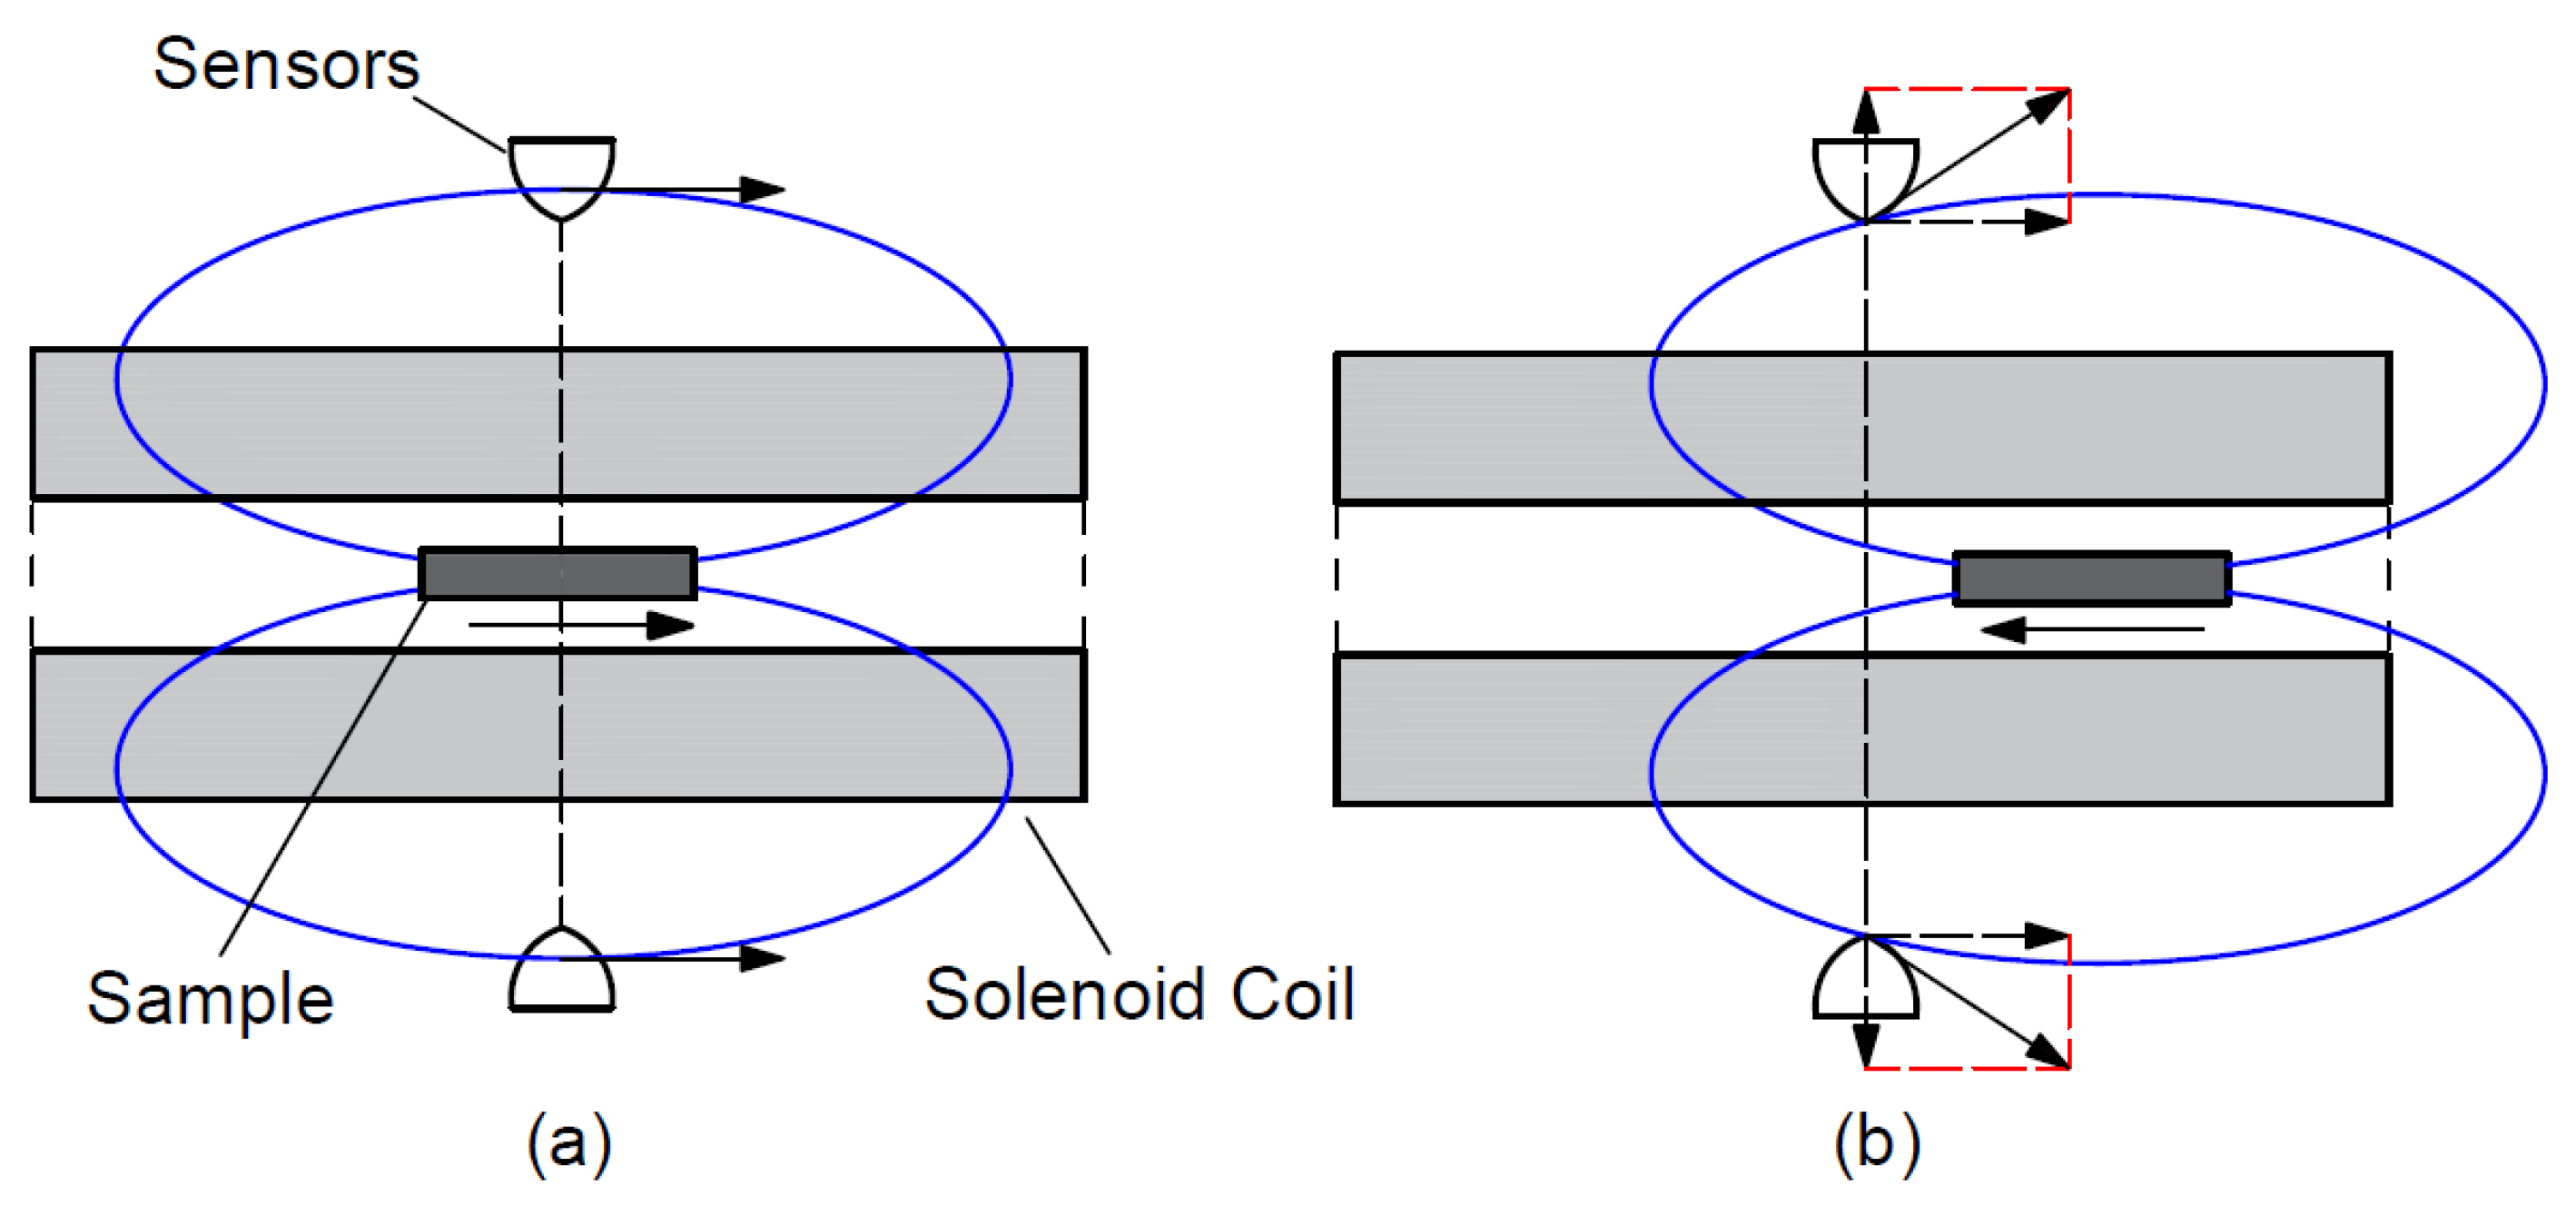
Figure 14 shows the set-up of the DC coercimeter. The equipment contains a solenoid coil and two high-sensitivity magnetic field sensors, which are exactly in the middle outside of the coil.
As a first step (
Figure 14a), the sample is put inside in the middle of the solenoid coil and magnetized into saturation. The polarization of the sample is measured by two sensors, which can measure the component of the magnetic field vector which is perpendicular to the coil. The sample creates a magnetic field outside the coil which is proportional with the magnetization of the sample. This magnetic field vector has just a horizontal component at the position of the sensors. As a second step (
Figure 14b), the sample is moved horizontally in the solenoid coil until the sensors detect the maximal perpendicular component of the magnetic field vector. A reverse magnetic field is built up with the coil and it is increased until the measured perpendicular field component becomes zero. The reverse magnetic field is equal with the coercive field of the sample. The maximum of the magnetization field was 1000 A/cm.
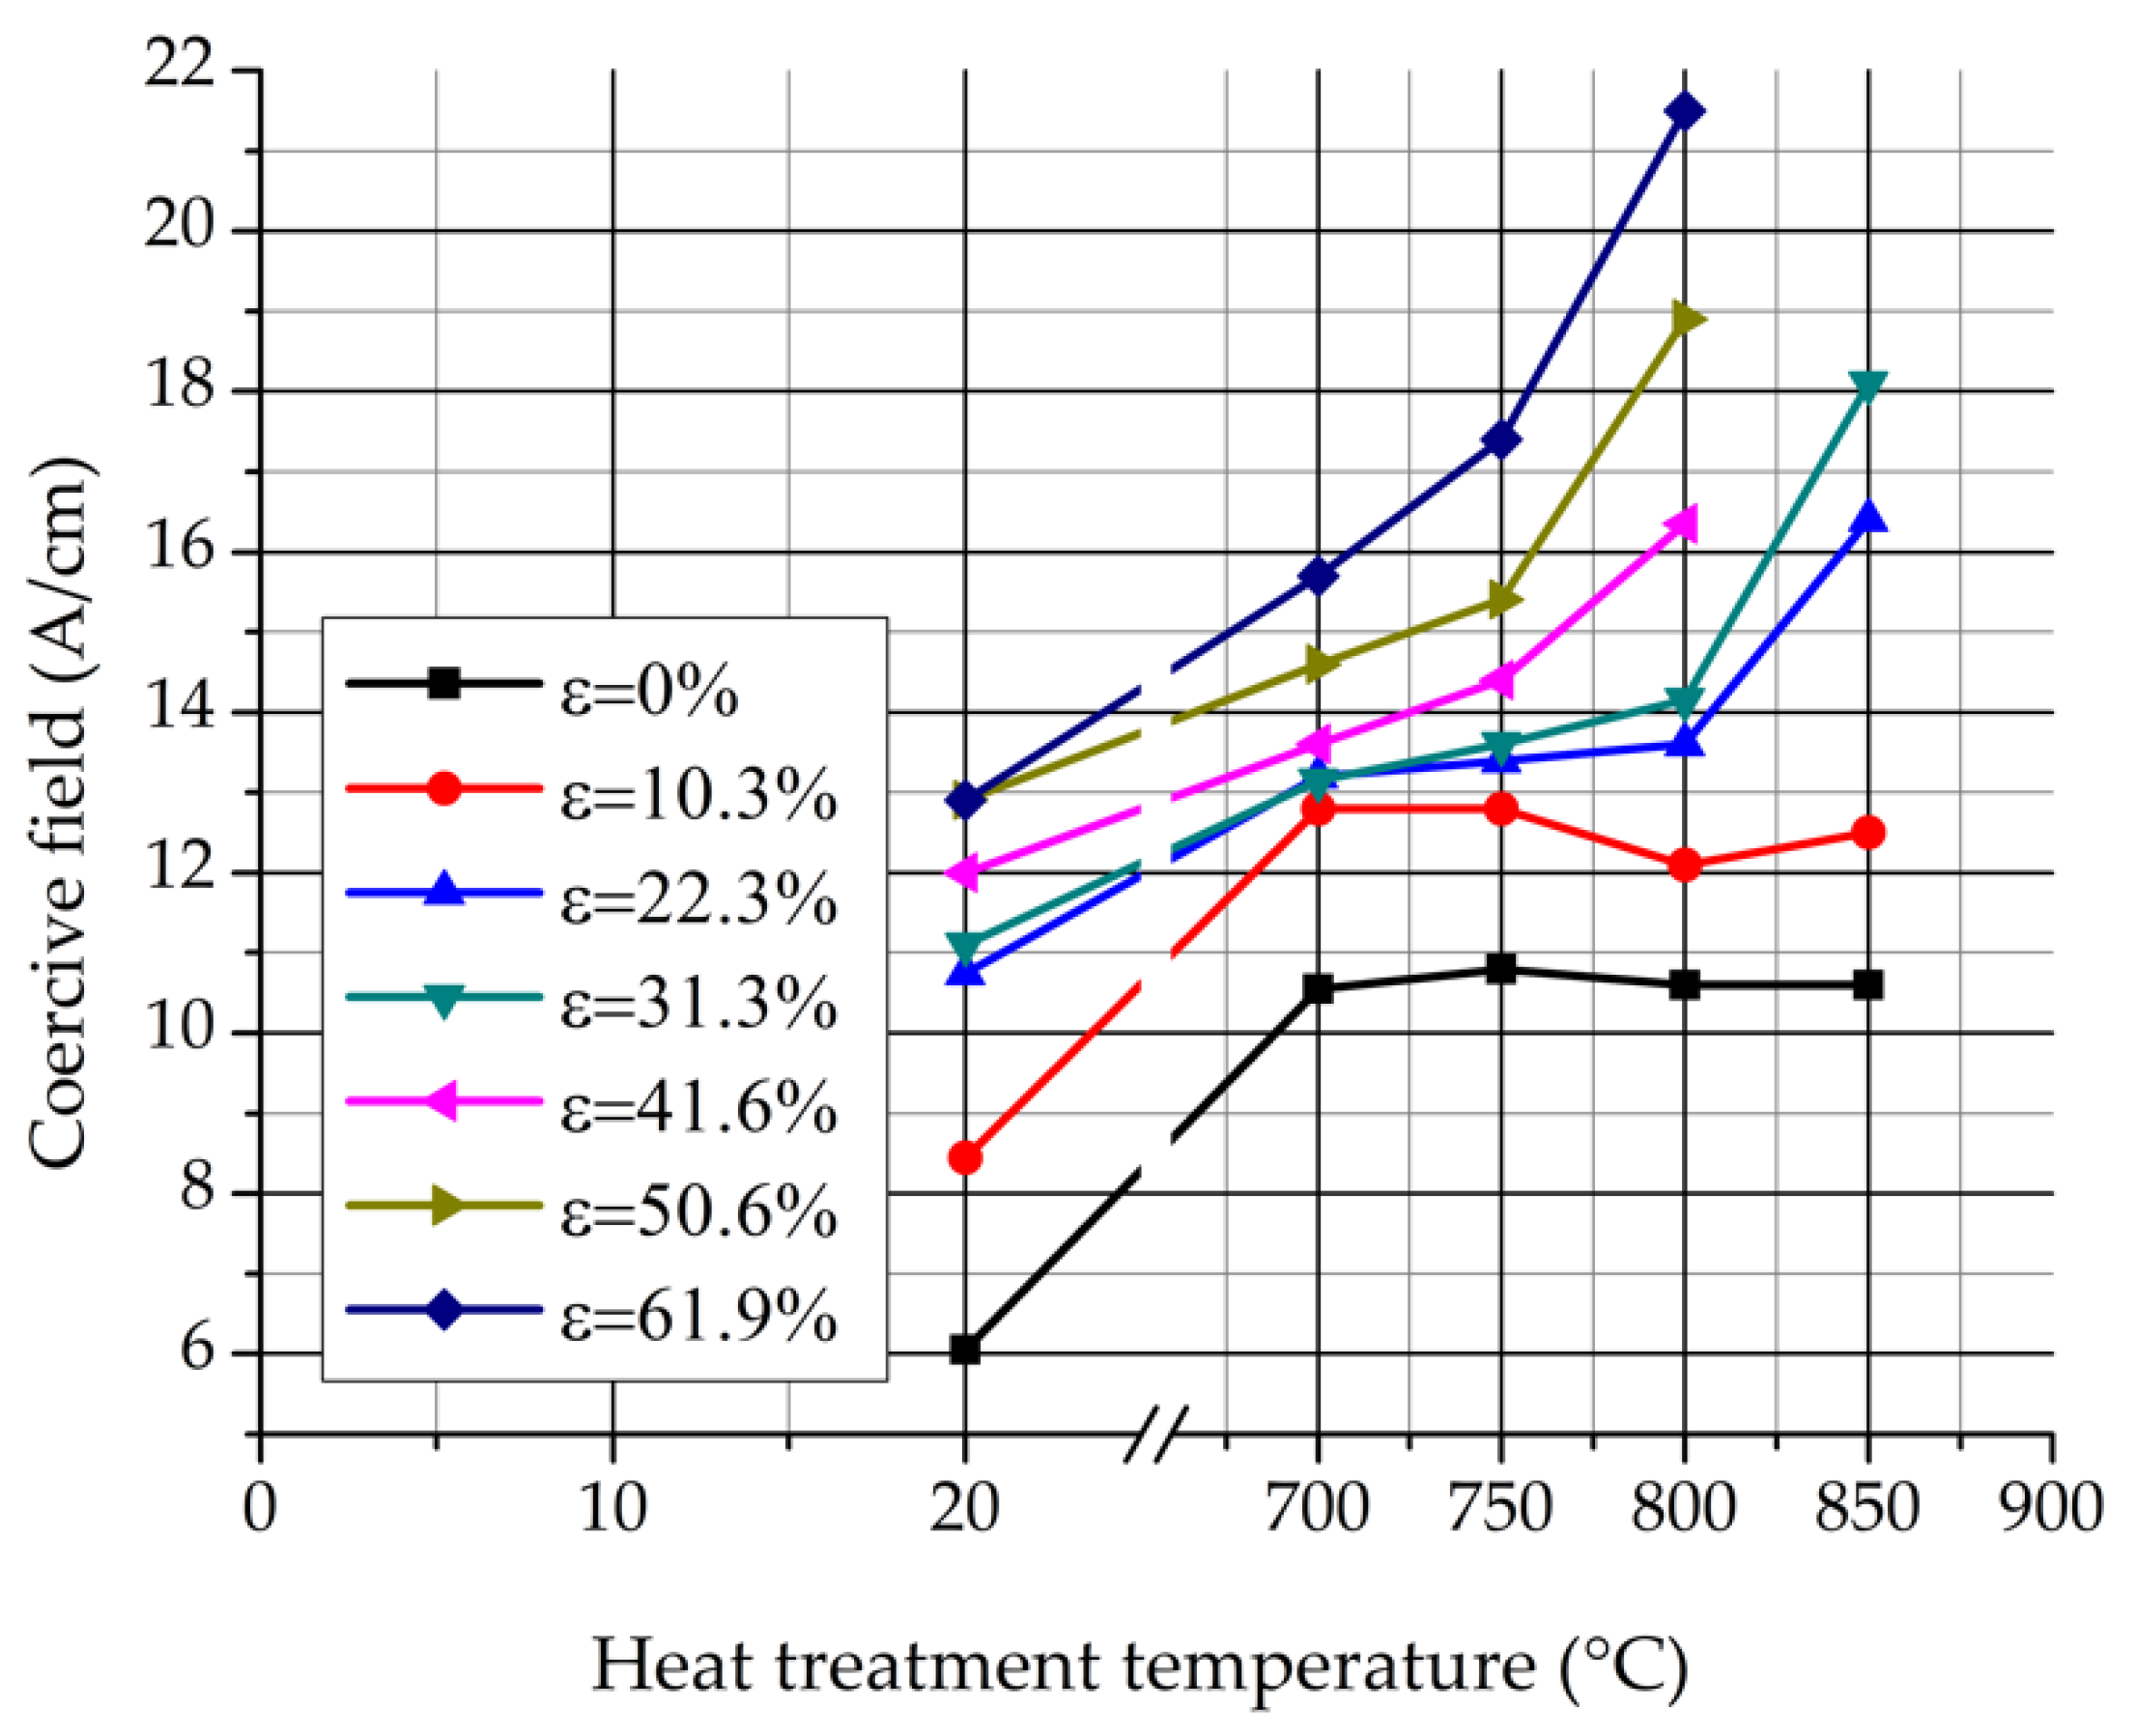
Figure 15 represents the values of the coercive field in function of the heat treatment temperature. It can be noticed that the coercive field increases progressively in function of the heat treatment temperature by every rolling reduction. The increase is caused by two reasons: the plastic deformation and the appearance of the σ-phase. The coercive field of the non-heat-treated samples rises due to the cold rolling. σ-phase precipitations cause the increment of the coercive field by the undeformed samples. The increase of the coercive field is much higher by the strongly cold rolled samples than it is by the lower-extent deformed samples. The coercive field measurement showed the effect of the plastic deformation and the appearance of the σ-phase is not simply added by the cold rolled and heat treated samples, but the deformation stored energy increases the number of the σ-phase nuclei. It is considered that the reason for the coercive field increment is that the σ-phase precipitations prohibit the movement of the domain walls. The highly deformed samples (ε = 41.6%, 50.6%, and 61.9%) after heat treatment at 850 °C became nearly paramagnetic. Their coercive field cannot be determined.
3.1.7. Hardness Measurement
The Vickers hardness (HV 10) of the samples were measured by a KB 250 BVRZ-type universal hardness testing machine, which was produced by KB Prüftechnik GmbH (Hochdorf-Assenheim, Germany). The measuring limit of the machine is 250 kg and the test room height is 320 mm.
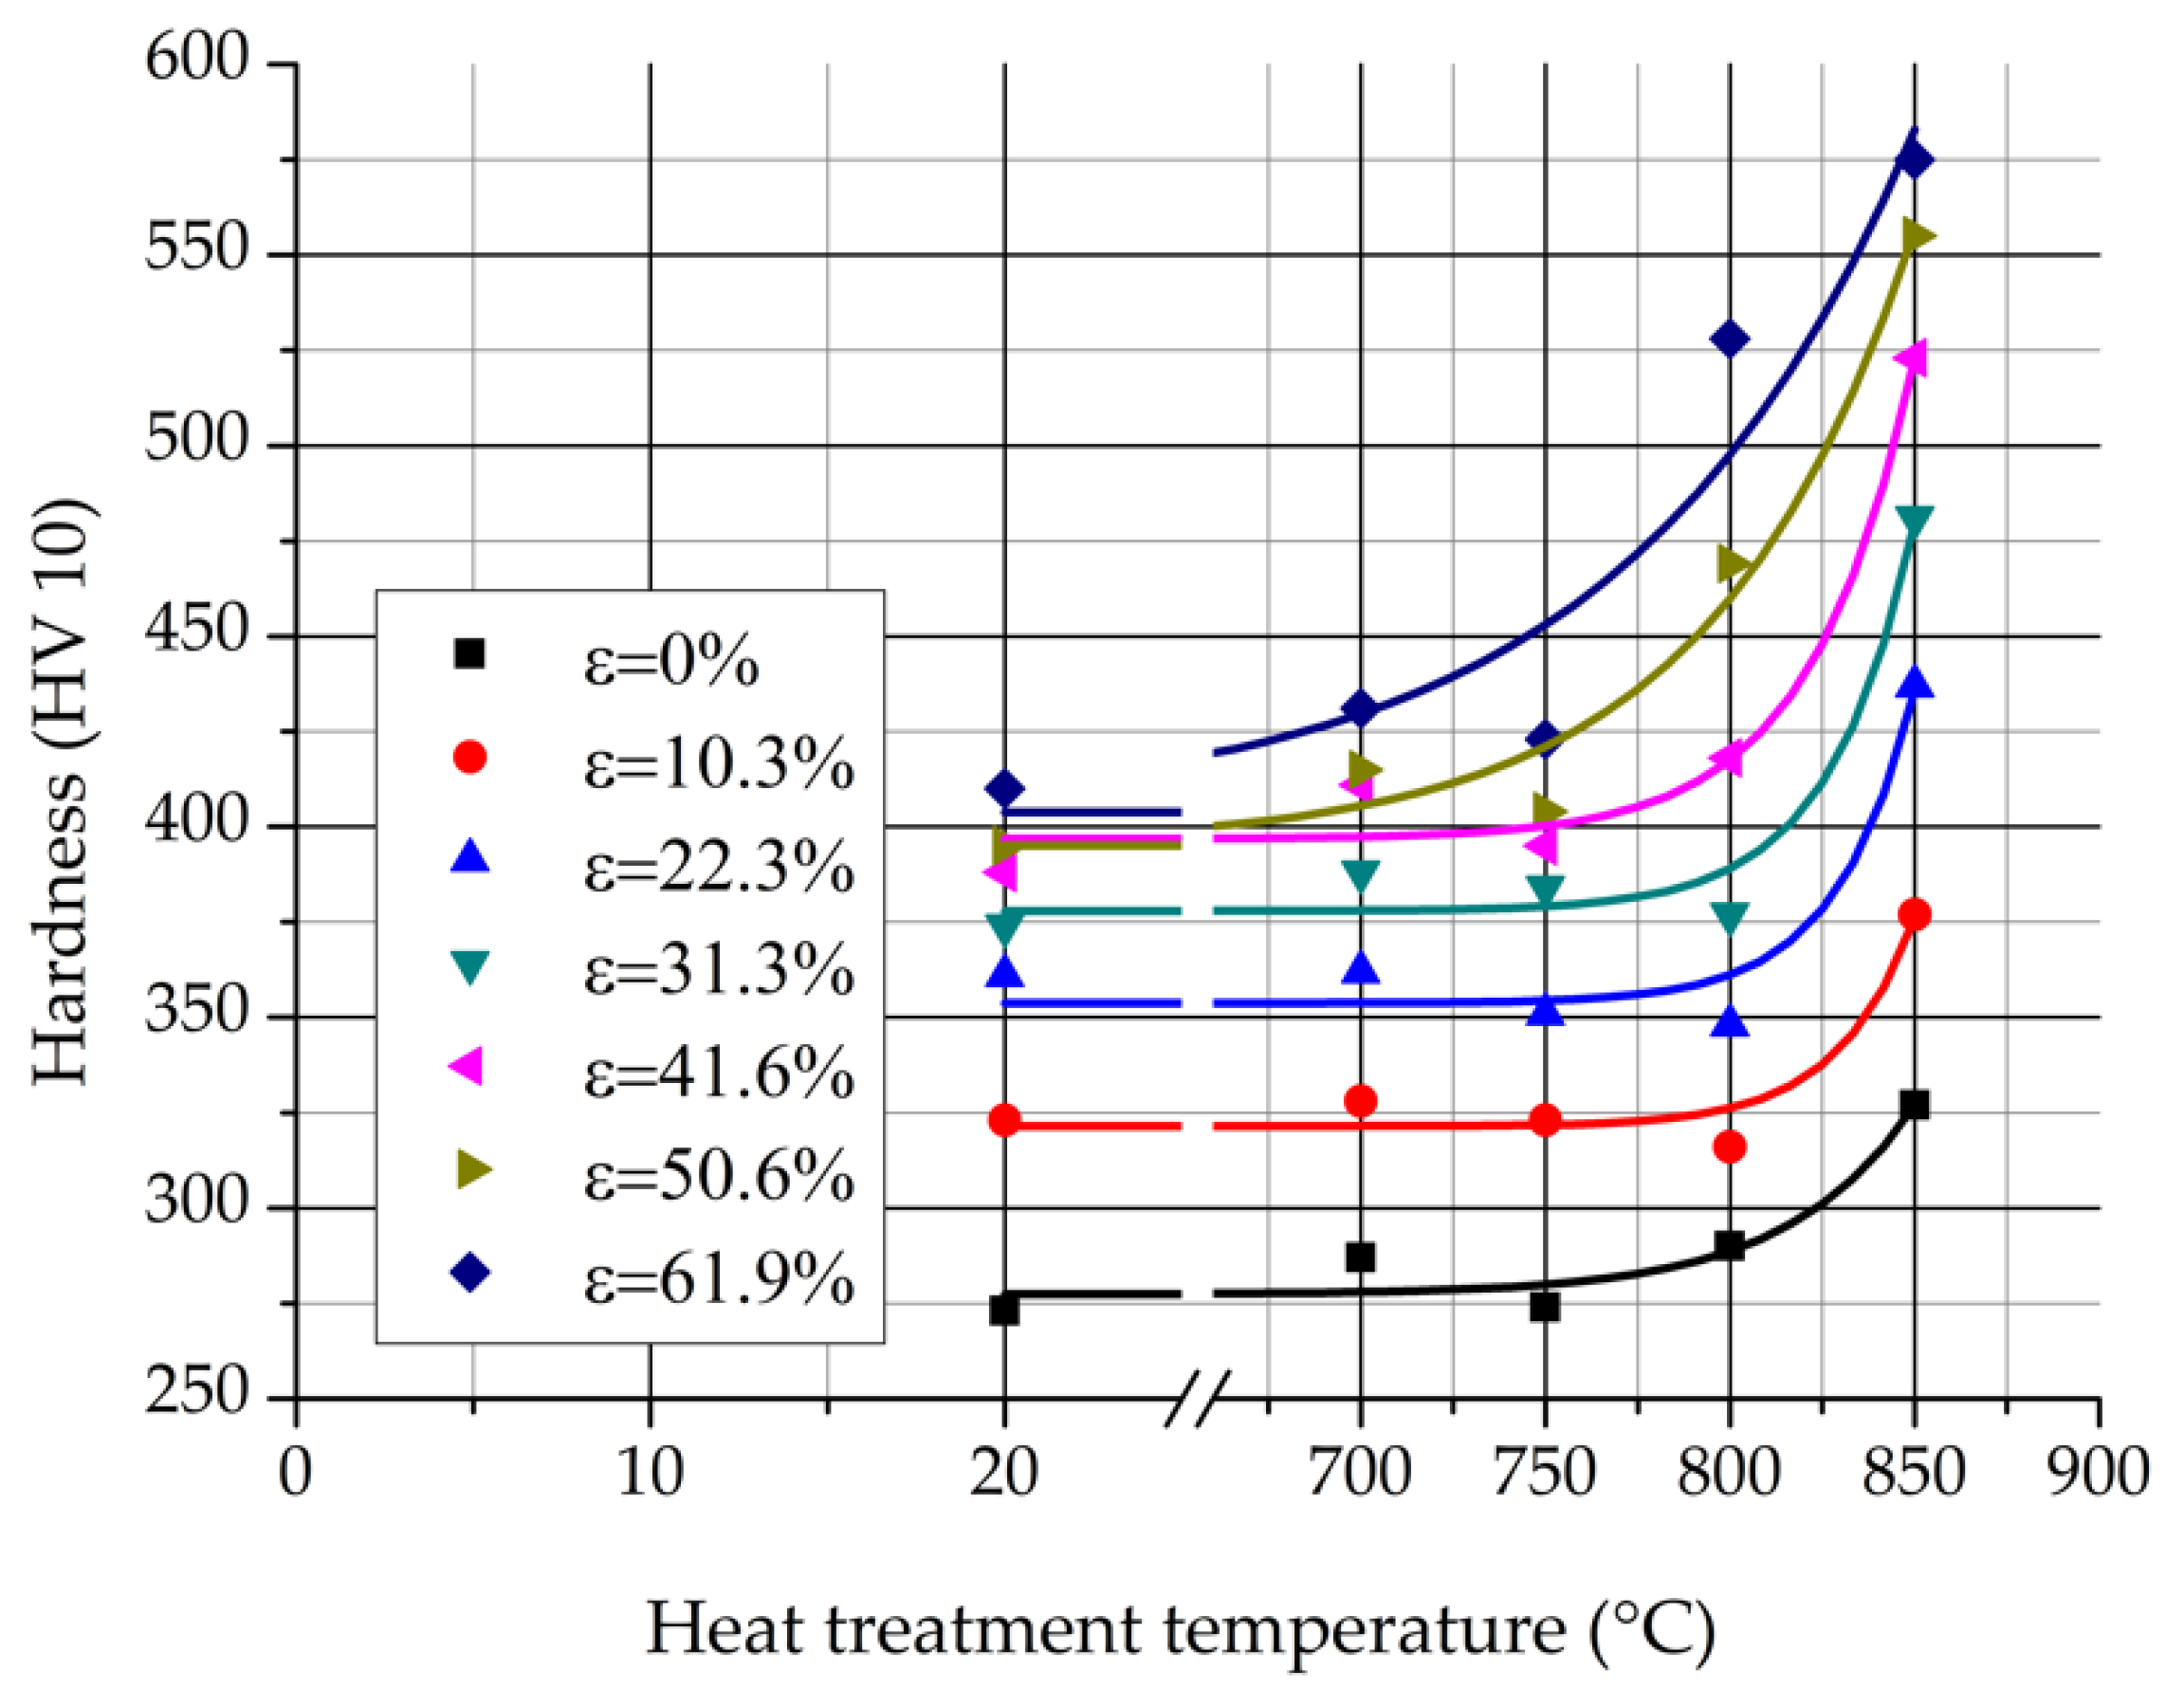
Figure 16 shows the hardness of the samples in function of the heat treatment temperature. The load was nominally 98.07 N during 12 s.
The hardness increase of the undeformed samples is 54 HV until this rise of the strongly rolled samples is three times higher (ε = 50.6% and 61.9%). The increase of the hardness is caused by the dislocation hardening and the σ-phase precipitation, as it was specified in the before chapter. The previous cold rolling before the heat treatment increases the chance of nucleation of the σ-phase along the slip lines. More σ-phases can cause a higher increase in hardness.
3.2. Second Sample Set
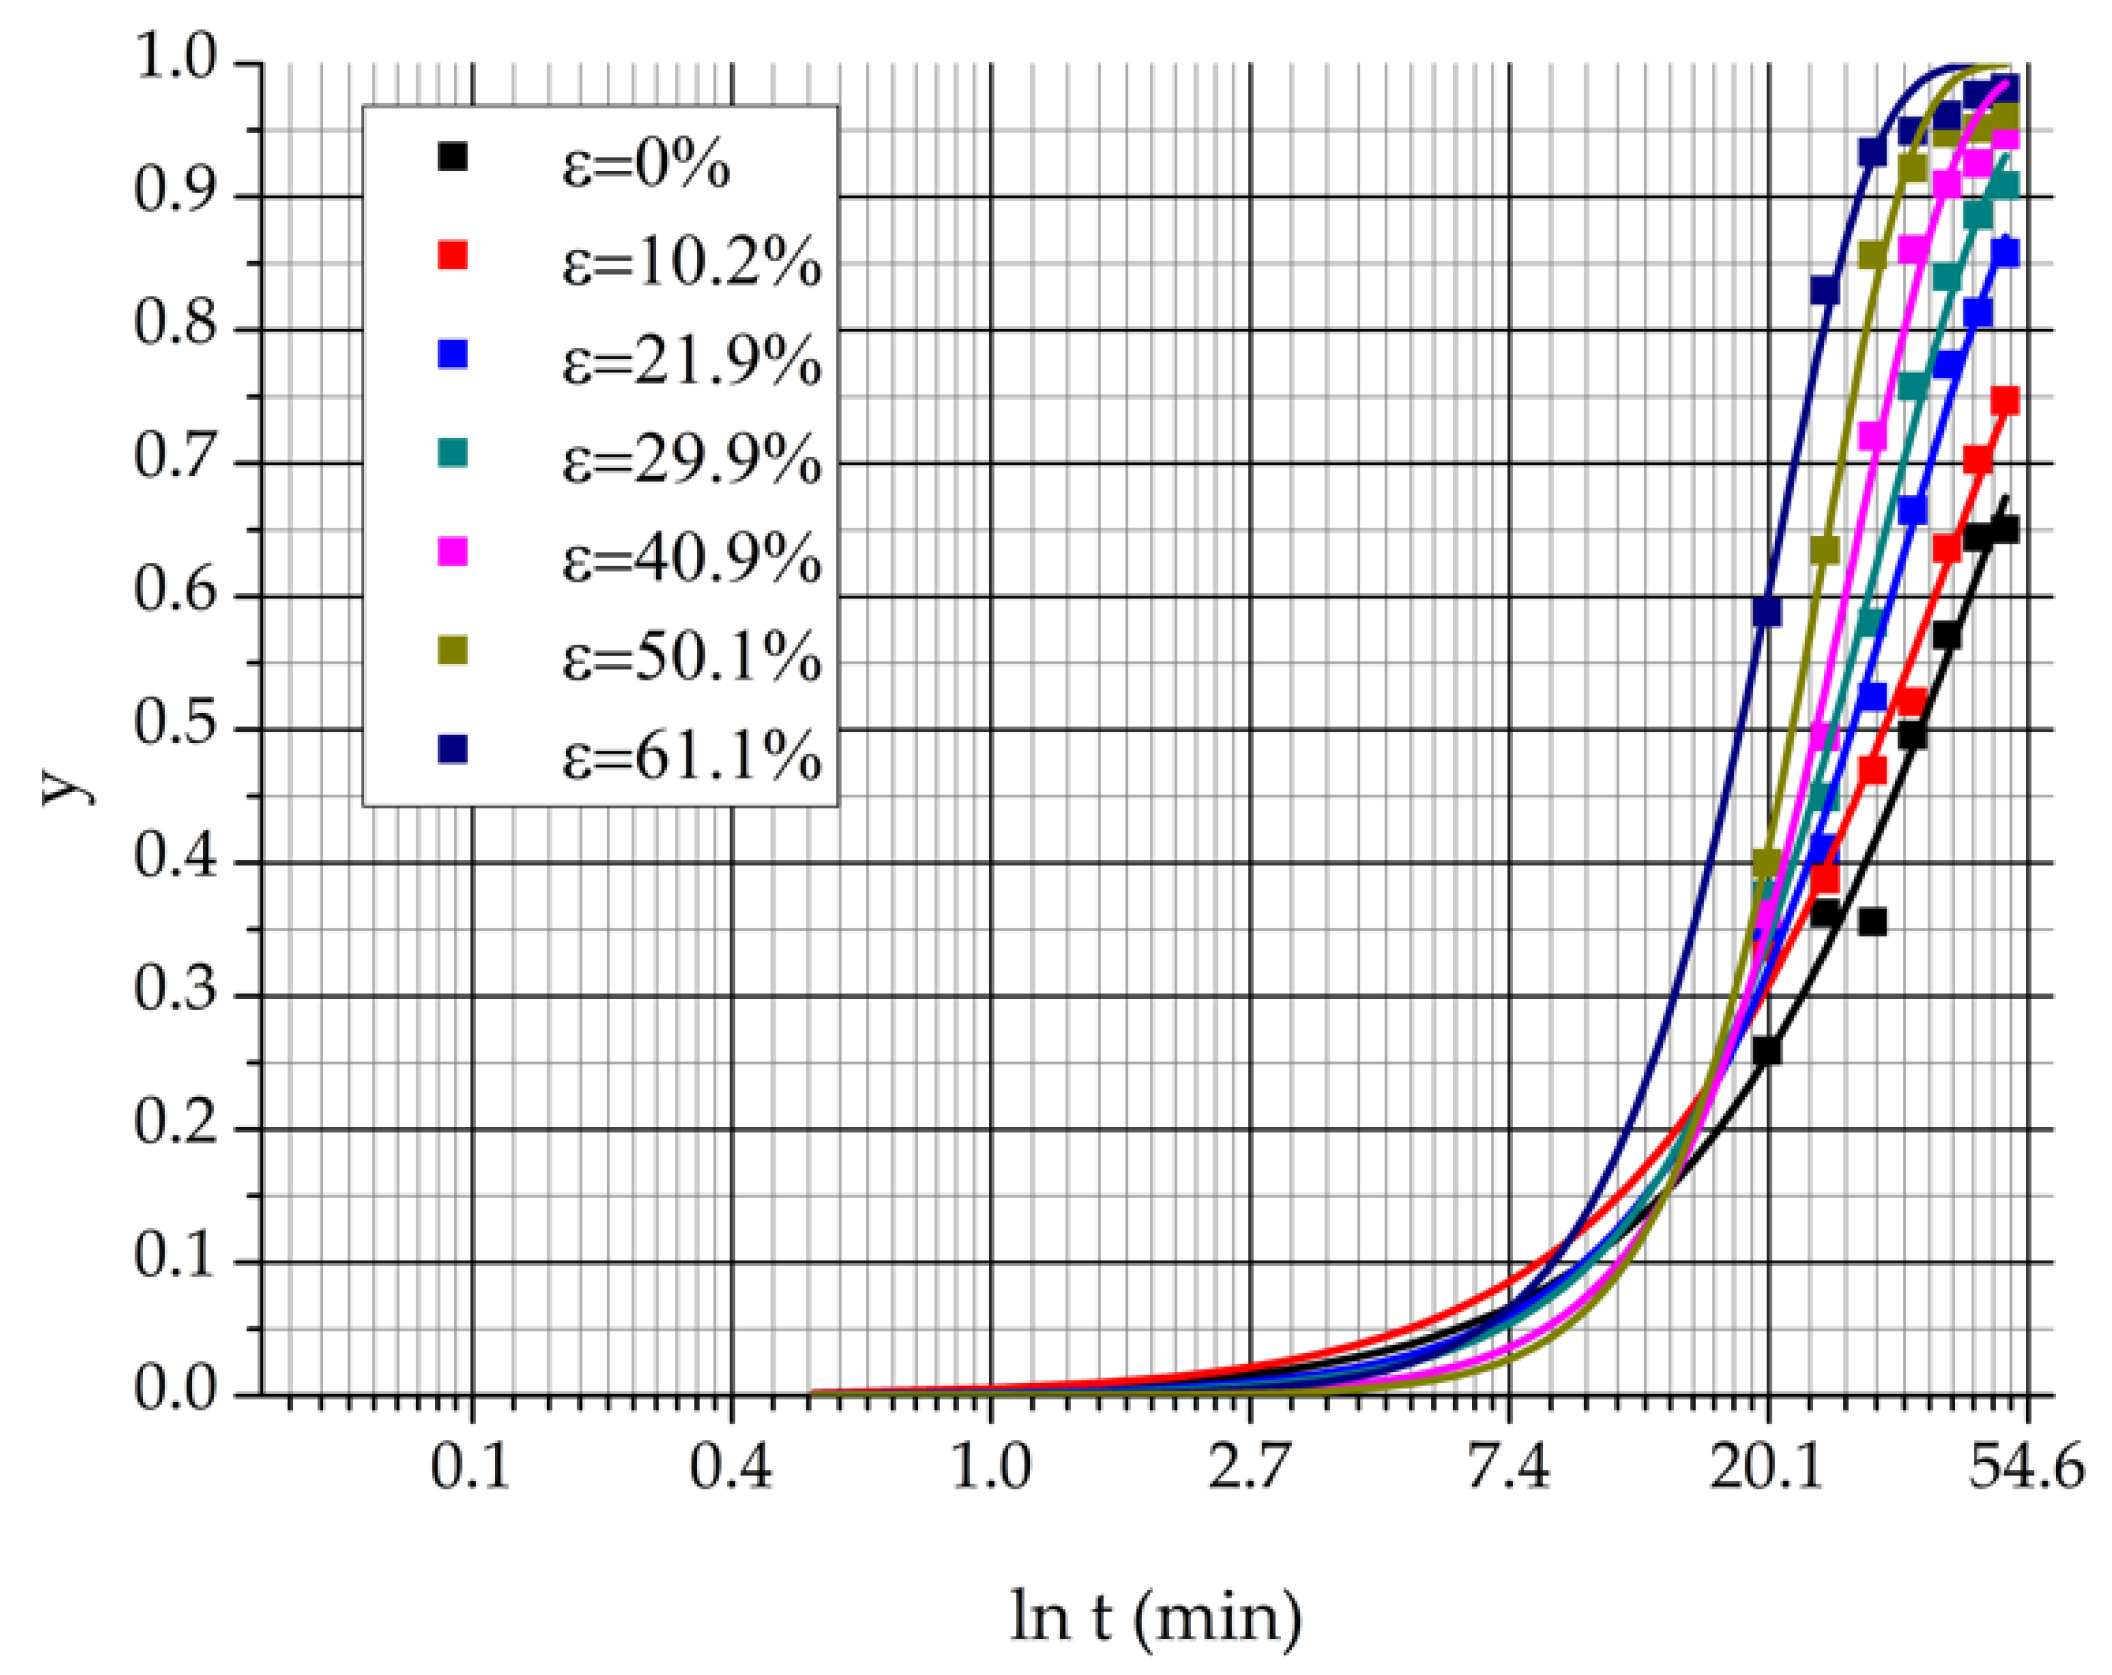
The second sample set was prepared to determine the activation energy of the eutectoidal decomposition process. The samples were cold rolled and heat treated at 850 °C during different terms. The extents of the rolling reduction were similar to the first sample set: ε = 0%, 10.2%, 21.9%, 29.9%, 40.9%, 50.1%, and 61.1%. The rolled samples were cut into eight smaller pieces and each piece was heat treated separately until the following terms: t = 0, 20, 25, 30, 35, 40, 45, and 50 min. The heat treated samples were normalized using static normal air.
Activation energy was calculated using the Avrami and Arrhenius equations. The activation energy can be considered as the minimal energy which is necessary for the beginning of a reaction or a phase transformation. This energy can describe a phase transformation numerically.
Kinetics equations are used to determine the time of a phase transformation in alloys, of which the most current is the Avrami equation. This equation gives a relationship between the transformed fraction and the time. Equation (4) shows the general form of the Avrami equation:
where “
y” is the transformed fraction, “
t” is the time, and “
n” and “
r” are the variables. The exponential connection between the rate of the chemical reaction and the temperature is given by the Arrhenius equation which is showed with Equation (5):
where “
k” is the rate of transformation, “
A” is the pre-exponential factor, “
Ea” is the activation energy, “
R” is the universal gas constant, and “
T” is the absolute temperature. The Arrhenius equation is applied for the description of the temperature dependence of thermally-activated processes [
31,
32,
33].
Figure 17 shows the Avrami curves which were determined from the decomposed δ-ferrite content. The curves were fitted by two parameters regression using the Avrami Equation (4) and the OriginPro 8 software (OriginLab, Northampton, MA, USA).
The rate of the transformation can be determined with the Avrami curves using Equation (6):
where
is the time which belongs to the
y = 0.5 transformed fraction. Taking the logarithm of Equation (5), the activation energy can be calculated as Equation (7):
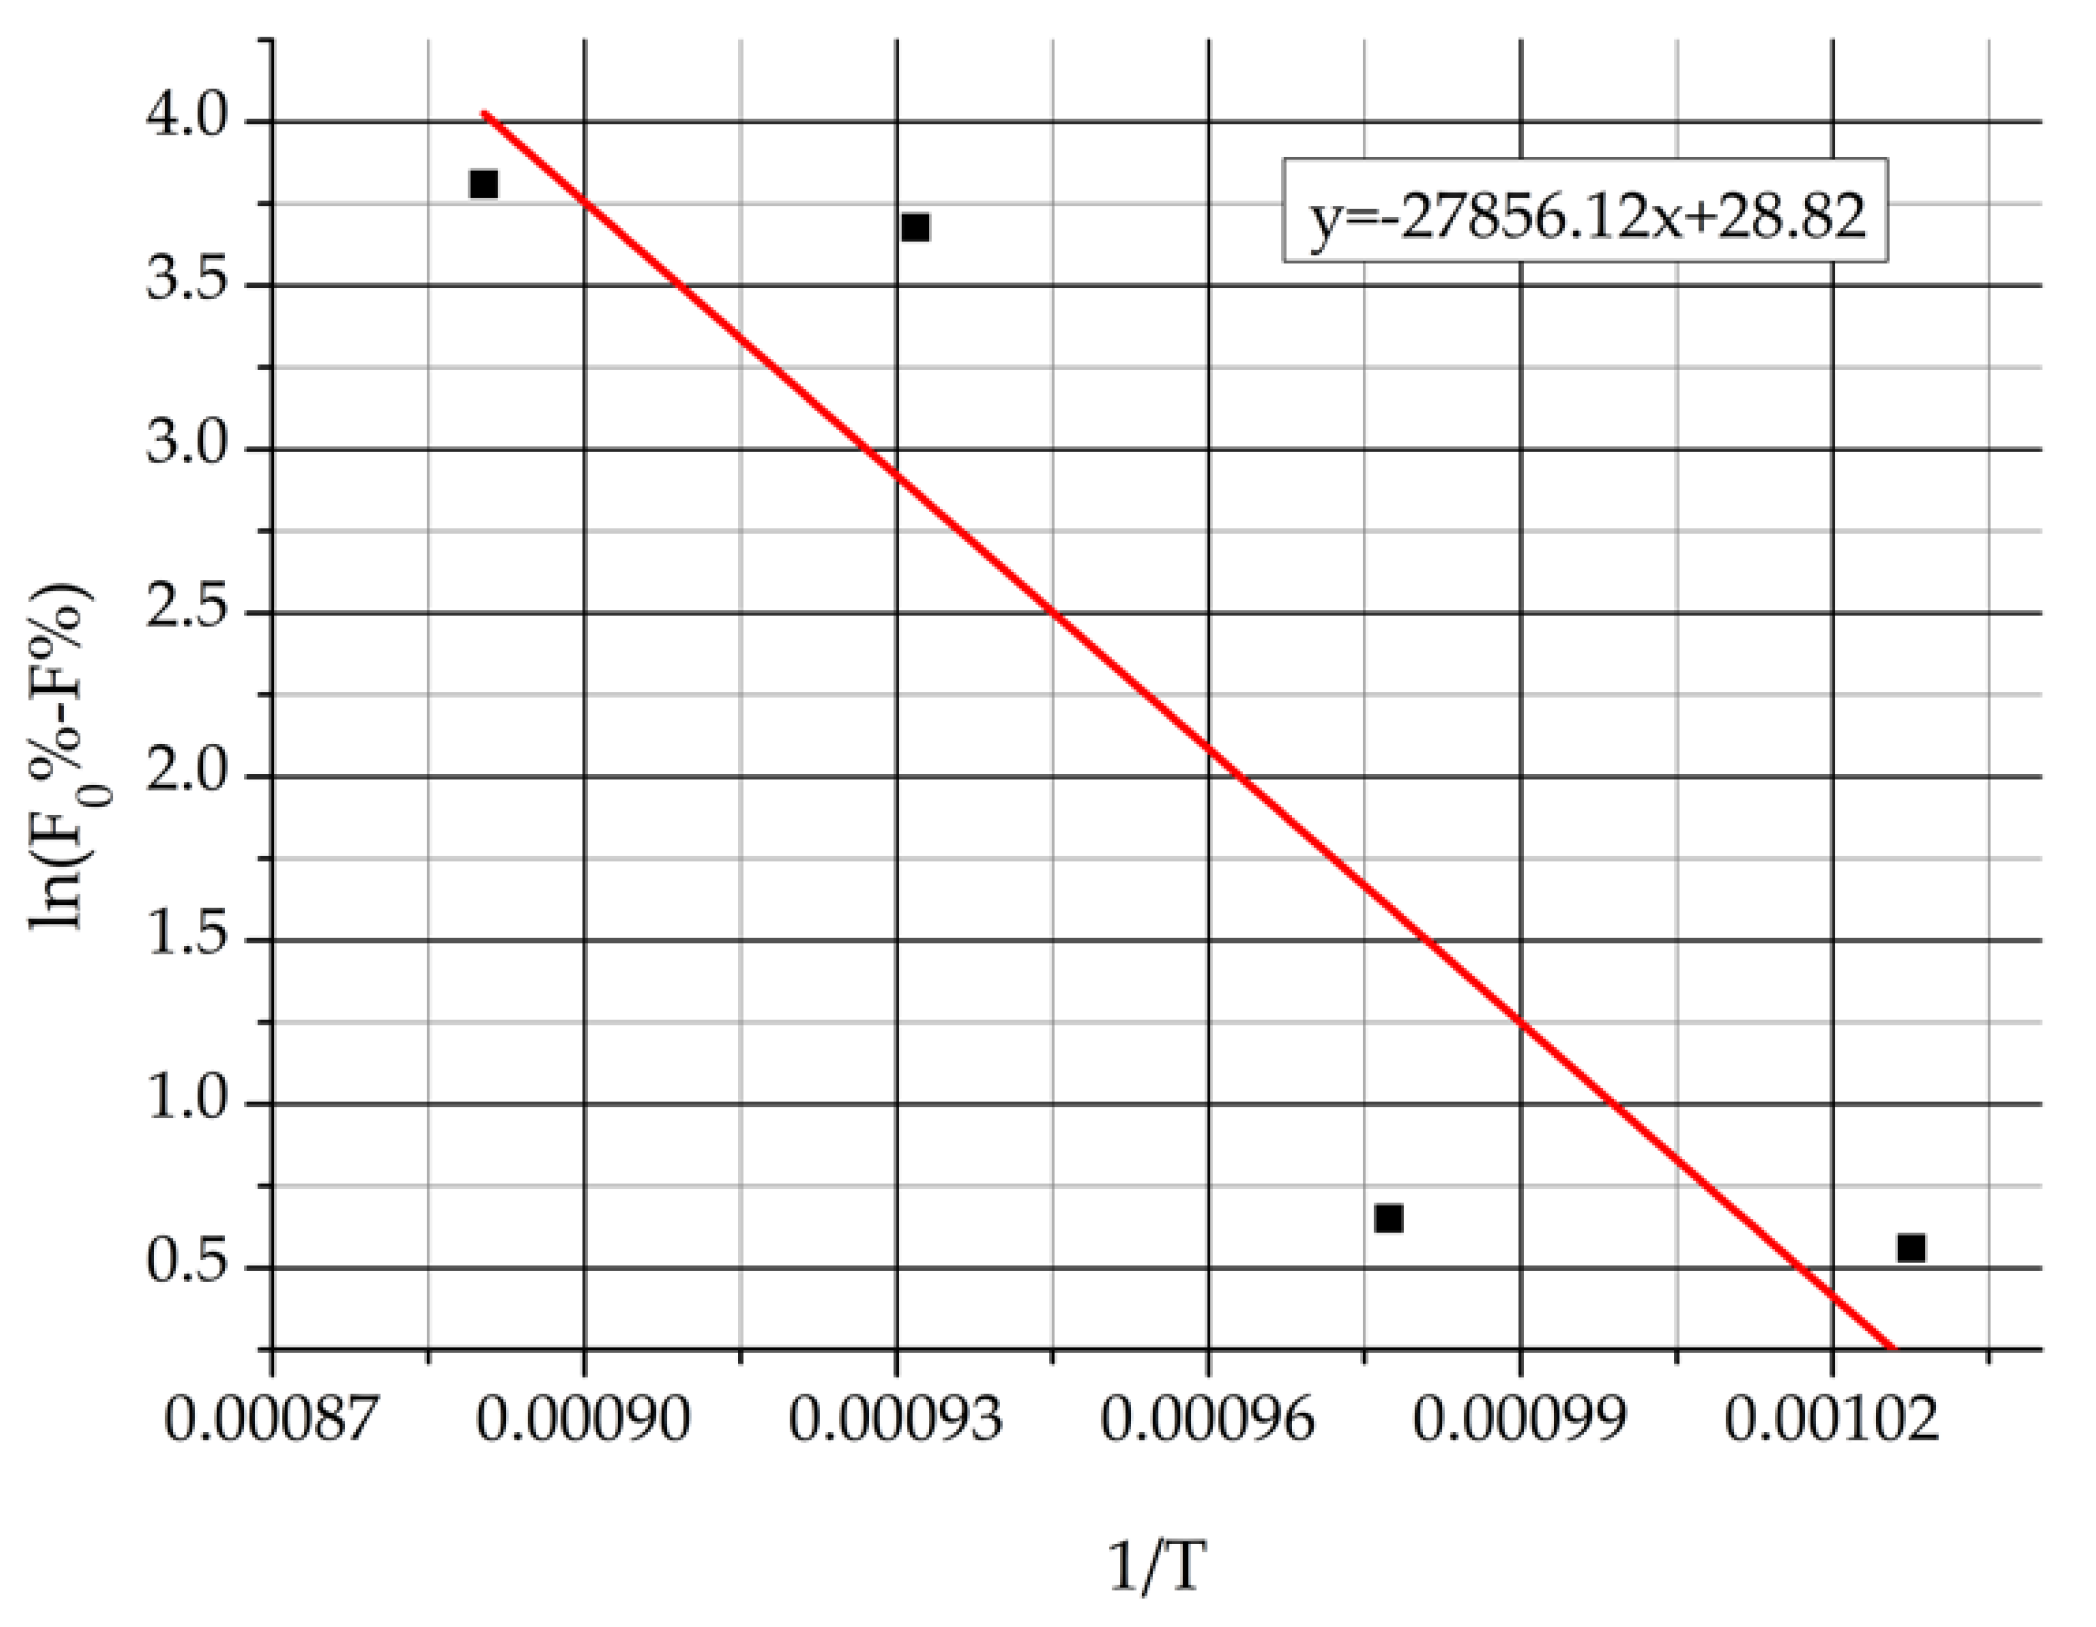
Value of the
was determined by the so-called Arrhenius plot using the data of the 61.9% deformed samples of the first sample set. It was supposed that its value is independent of deformation extent. The rate of transformation (
k) can be calculated from the amount of decomposed δ-ferrite as Equation (8) shows:
where “
F0%” is the original δ-ferrite content (46.9%) and “F%” is the calculated δ-ferrite content after the decomposition. Equation (9) shows the replacement of the “
k” in the natural logarithm of the Arrhenius equation:
If “
” is plotted in function of the “1/
T,” the intercept of the line is equal with the value of the
.
Figure 18 shows the Arrhenius plot of the ε = 61.9% deformed first sample set. The obtained value of
was 28.82, which was substituted into Equation (7) for calculating the activation energy (
E) values of the second sample set.
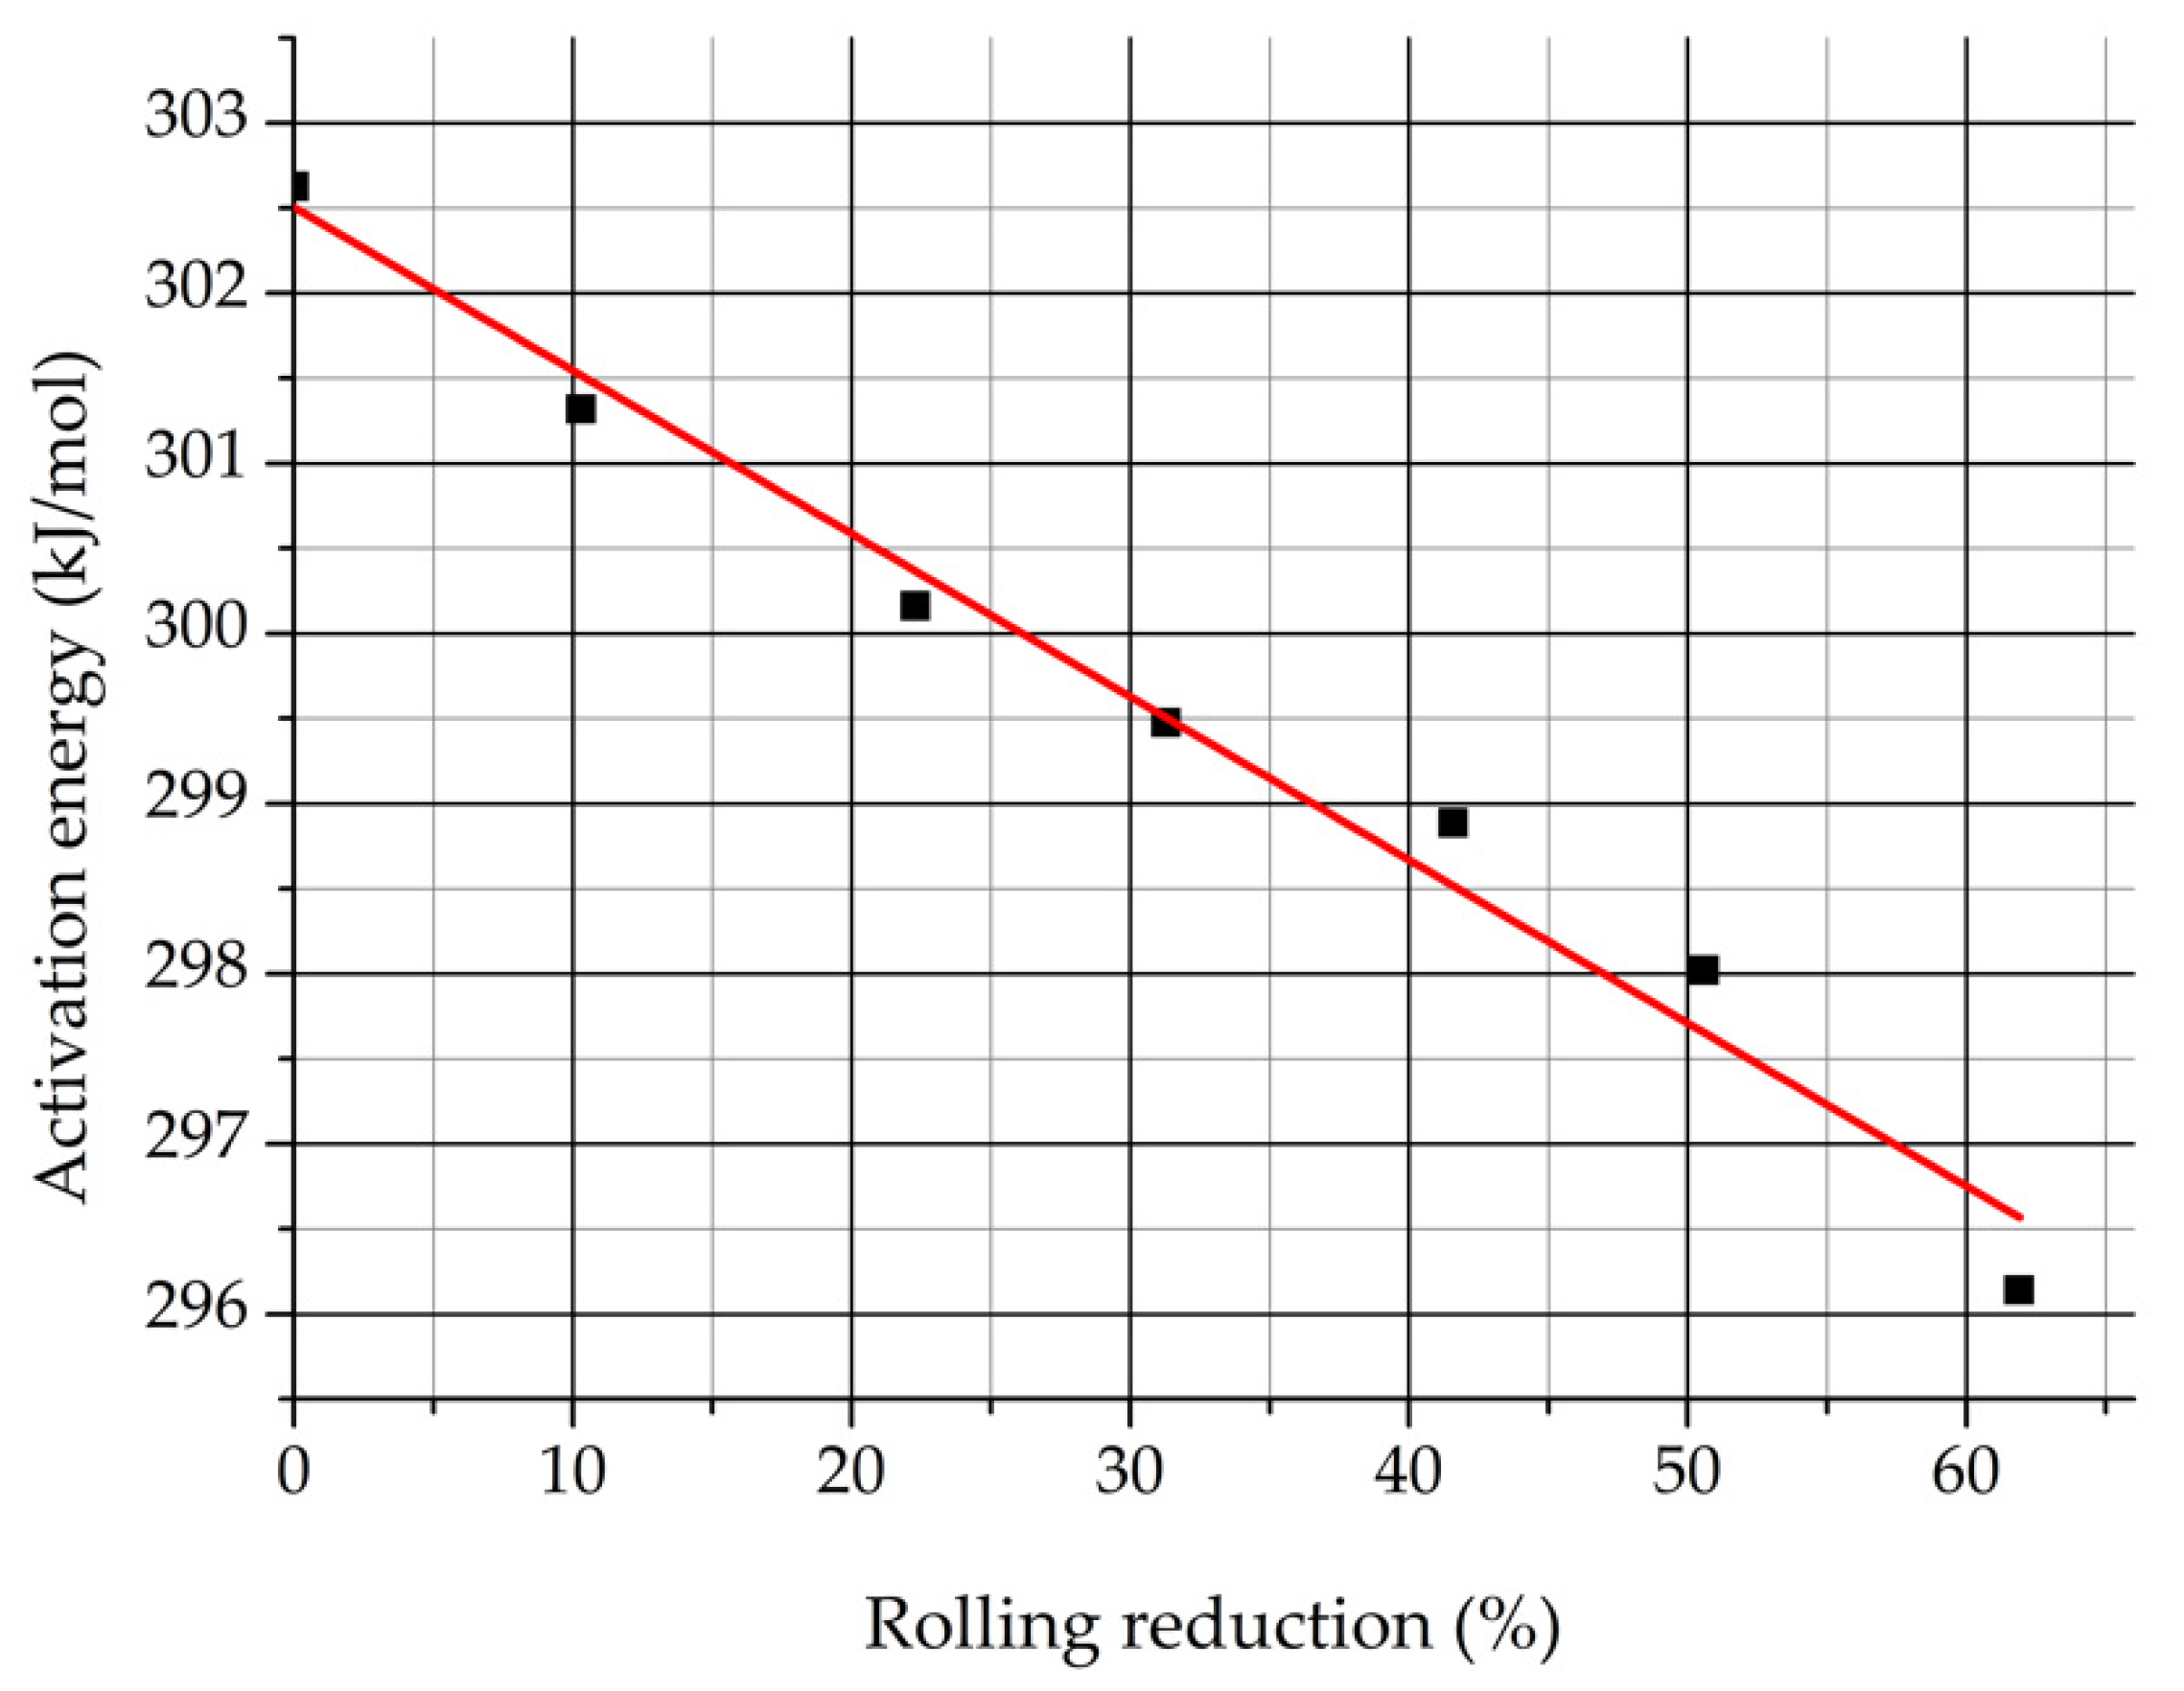
Figure 19 represents the obtained activation energy values of the second sample set in function of the rolling reduction.
It can be seen that the activation energy decreases from 302 to 296 kJ/mol in function of the rolling reduction.
It is supposed that the rate limiting process of the δ-ferrite decomposition is the diffusion of Cr and Mo in δ-ferrite according to the kinetics described before. Slightly different activation energy values of Cr and Mo diffusion in ferrite are published in scientific papers. The typical values are 267.4 kJ/mol (Cr in ferrite) and 282.6 kJ/mol (Mo in ferrite) [
34,
35,
36], which are in good agreement with the obtained data.
It should be noticed that the determination of the activation energy with the Arrhenius fitting and Avrami equation is a very sensitive calculation method. If the δ-ferrite content changed 3% by the Arrhenius fitting the calculated activation energy increased almost 30%. The more accurate determination of the activation energy would require numerous samples.
3.3. Third Sample Set
The third sample set was prepared to study how the eutectoidal phase transformation is influenced by plastic deformation technology that is different from cold rolling. Samples were elongated by single-axis tensile stress and were heat treated at 850 °C. The samples were in the furnace for 30 min and were normalized using static normal air. The effect of the cold rolling and the elongation for the eutectoidal phase transformation were compared.
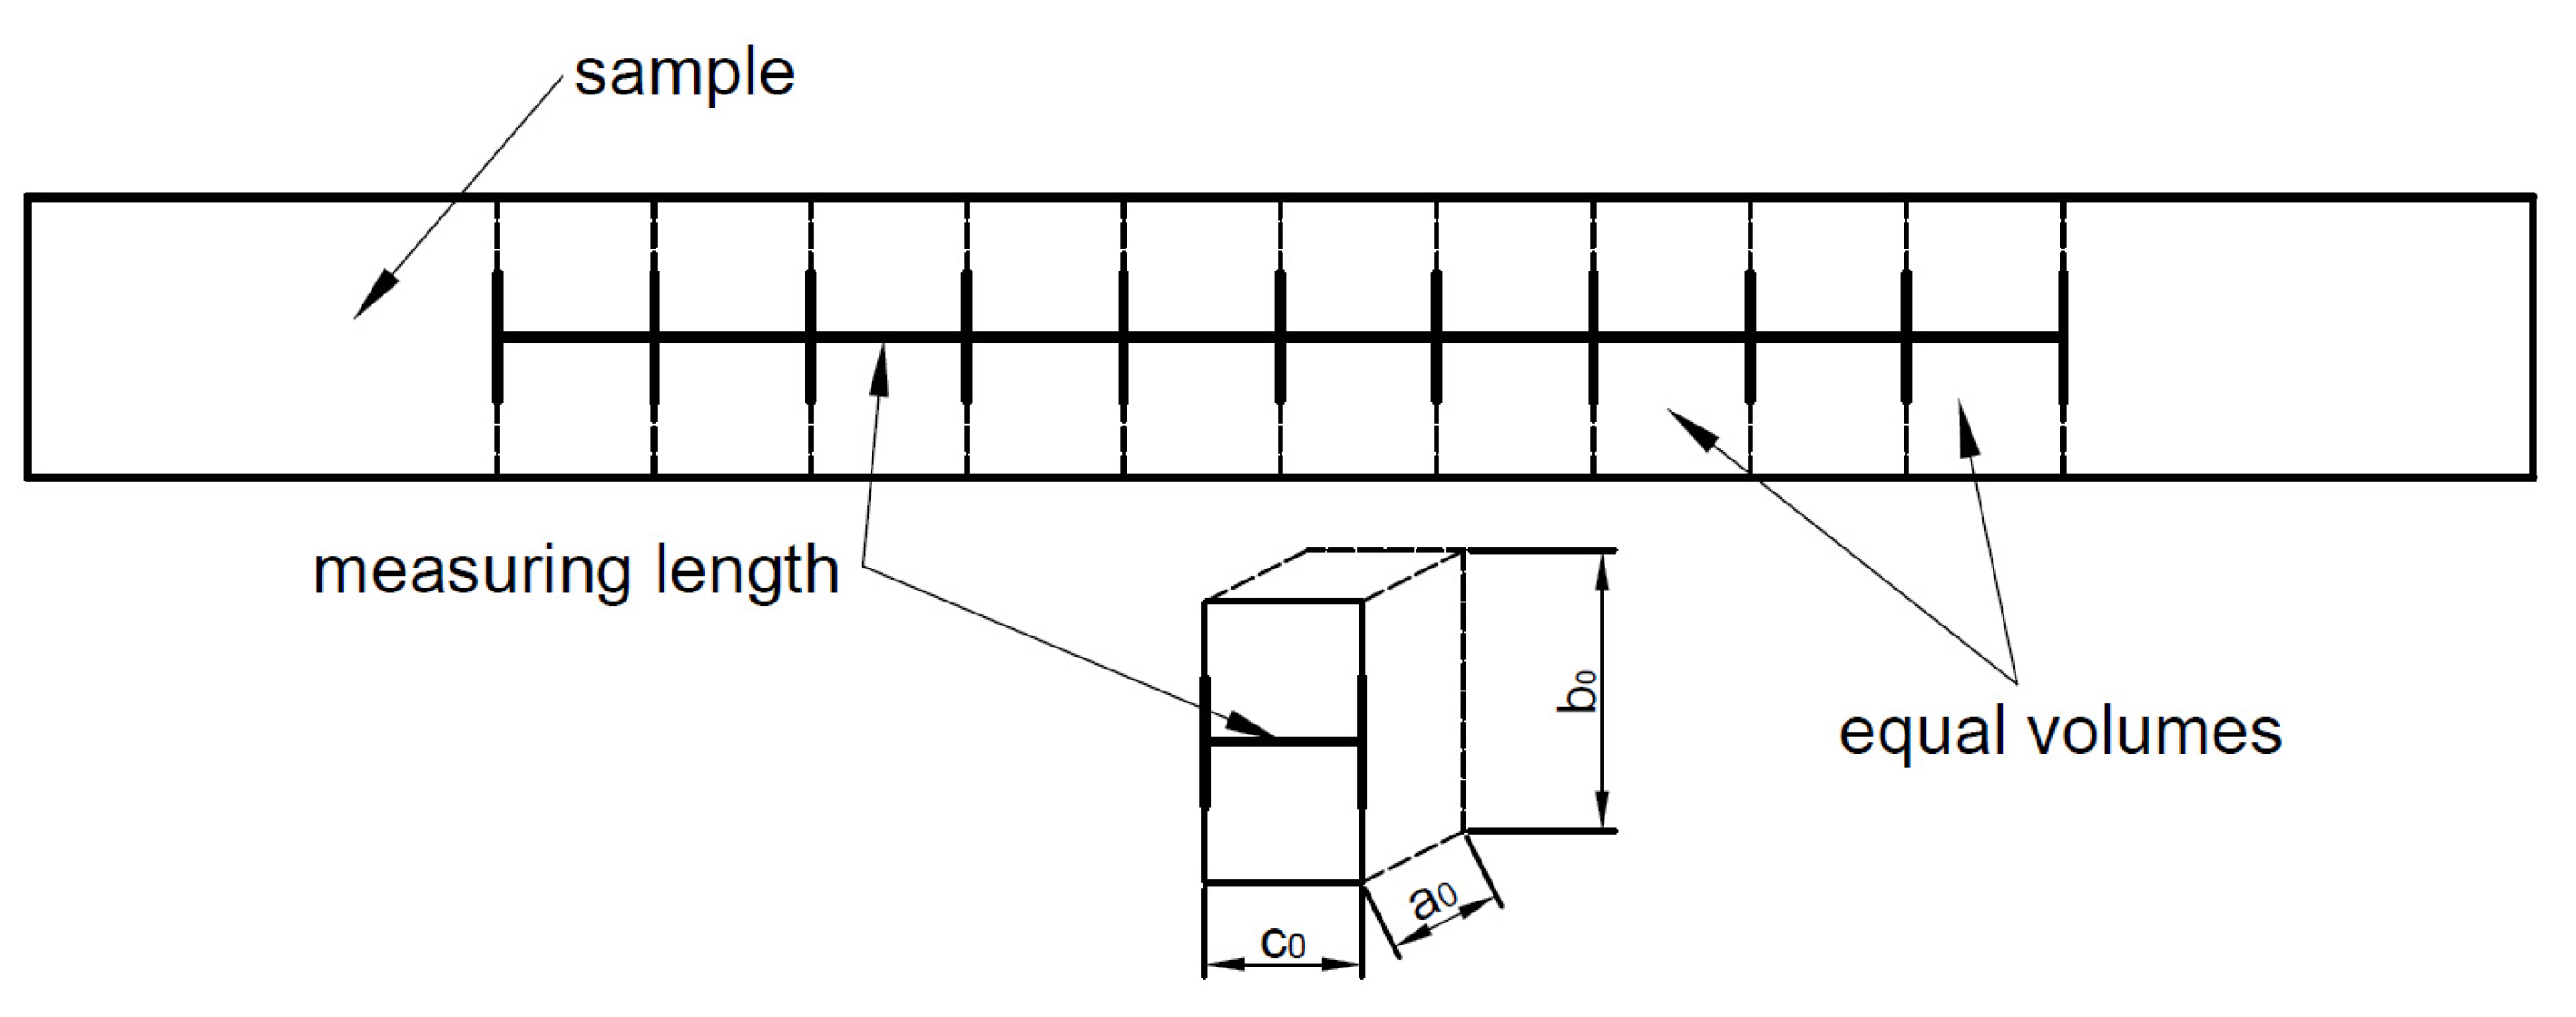
The elongation was made by a Heckert EU-40-type hydraulic tensile test machine (Mönchengladbac, Germany), which measuring limit is 400 kN. The machine has a digital data acquisition card and its stroke length is about 600 mm. The δ-ferrite contents of the cold rolled samples and the elongated samples were compared based on the equivalent deformation. Measuring lengths were used to divide the elongated sample to equal volumes before the elongation. This division was necessary for the calculation of the equivalent deformation.
Figure 20 illustrates the used volume division.
The equivalent deformation of one part can be calculated using Equations (10)–(13) [
37,
38]:
where “
a0,” “
b0”, and “
c0” are the original sizes of one part; “
a”, “
b”, and “
c” are the deformed sizes of one part measured after the elongation. The equivalent deformation of the cold rolled samples can be calculated similarly by Equation (10). After the heat treatment, the δ-ferrite content of the cold rolled samples and the elongated samples were measured.
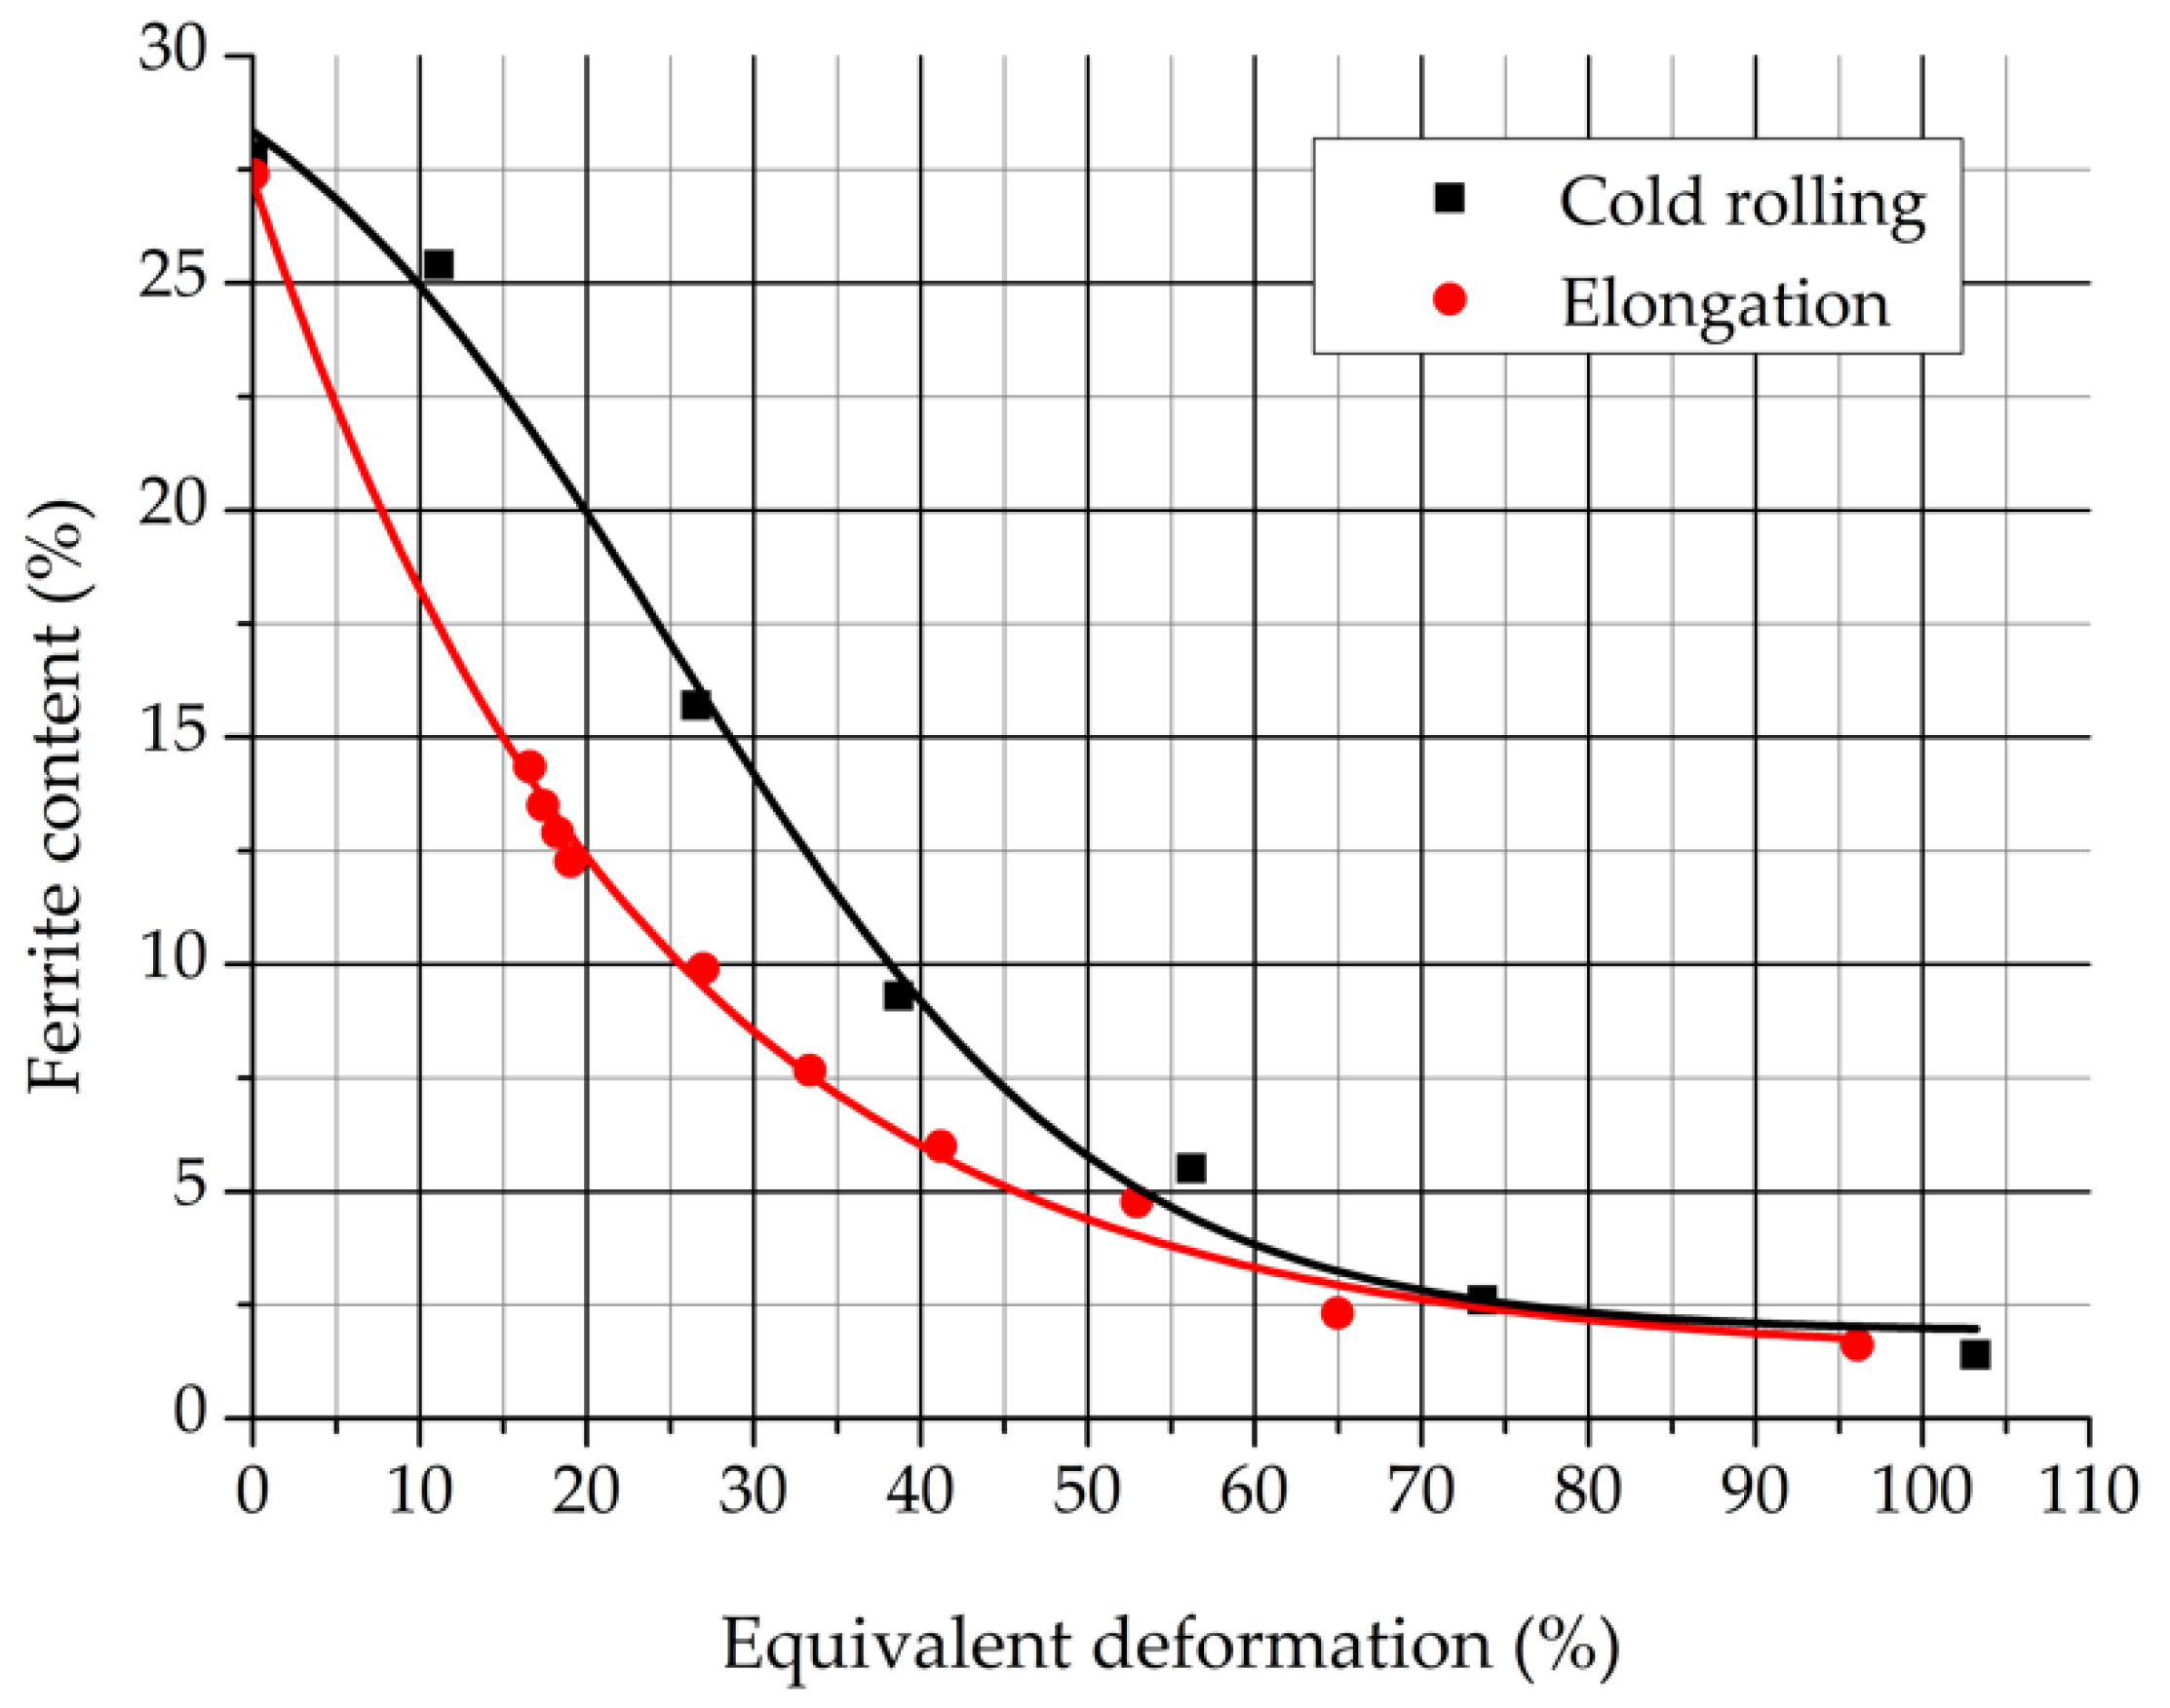
Figure 21 represent the δ-ferrite contents in function of the equivalent deformation by the two different plastic deformation technologies.
It can be seen that the δ-ferrite content reduction of the elongated samples is very similar to the results of the cold rolled samples. The stronger the previous deformation extent, the higher the amount of the decomposed δ-ferrite. The single-axis tensile stress can influence the eutectoidal phase transformation process similarly to that of the stress state that forms during the cold rolling.


