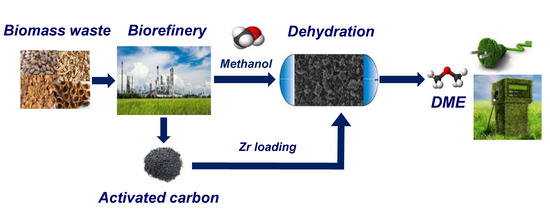
Methanol Dehydration to Dimethyl Ether on Zr-Loaded P-Containing Mesoporous Activated Carbon Catalysts

Abstract
:
1. Introduction
2. Materials and Methods
2.1. Preparation of Activated Carbon
2.2. Zr Loading over the Different Activated Carbons
2.3. Characterization of Carbon Catalysts
2.4. Methanol Dehydration Catalytic Reaction
3. Results and Discussion
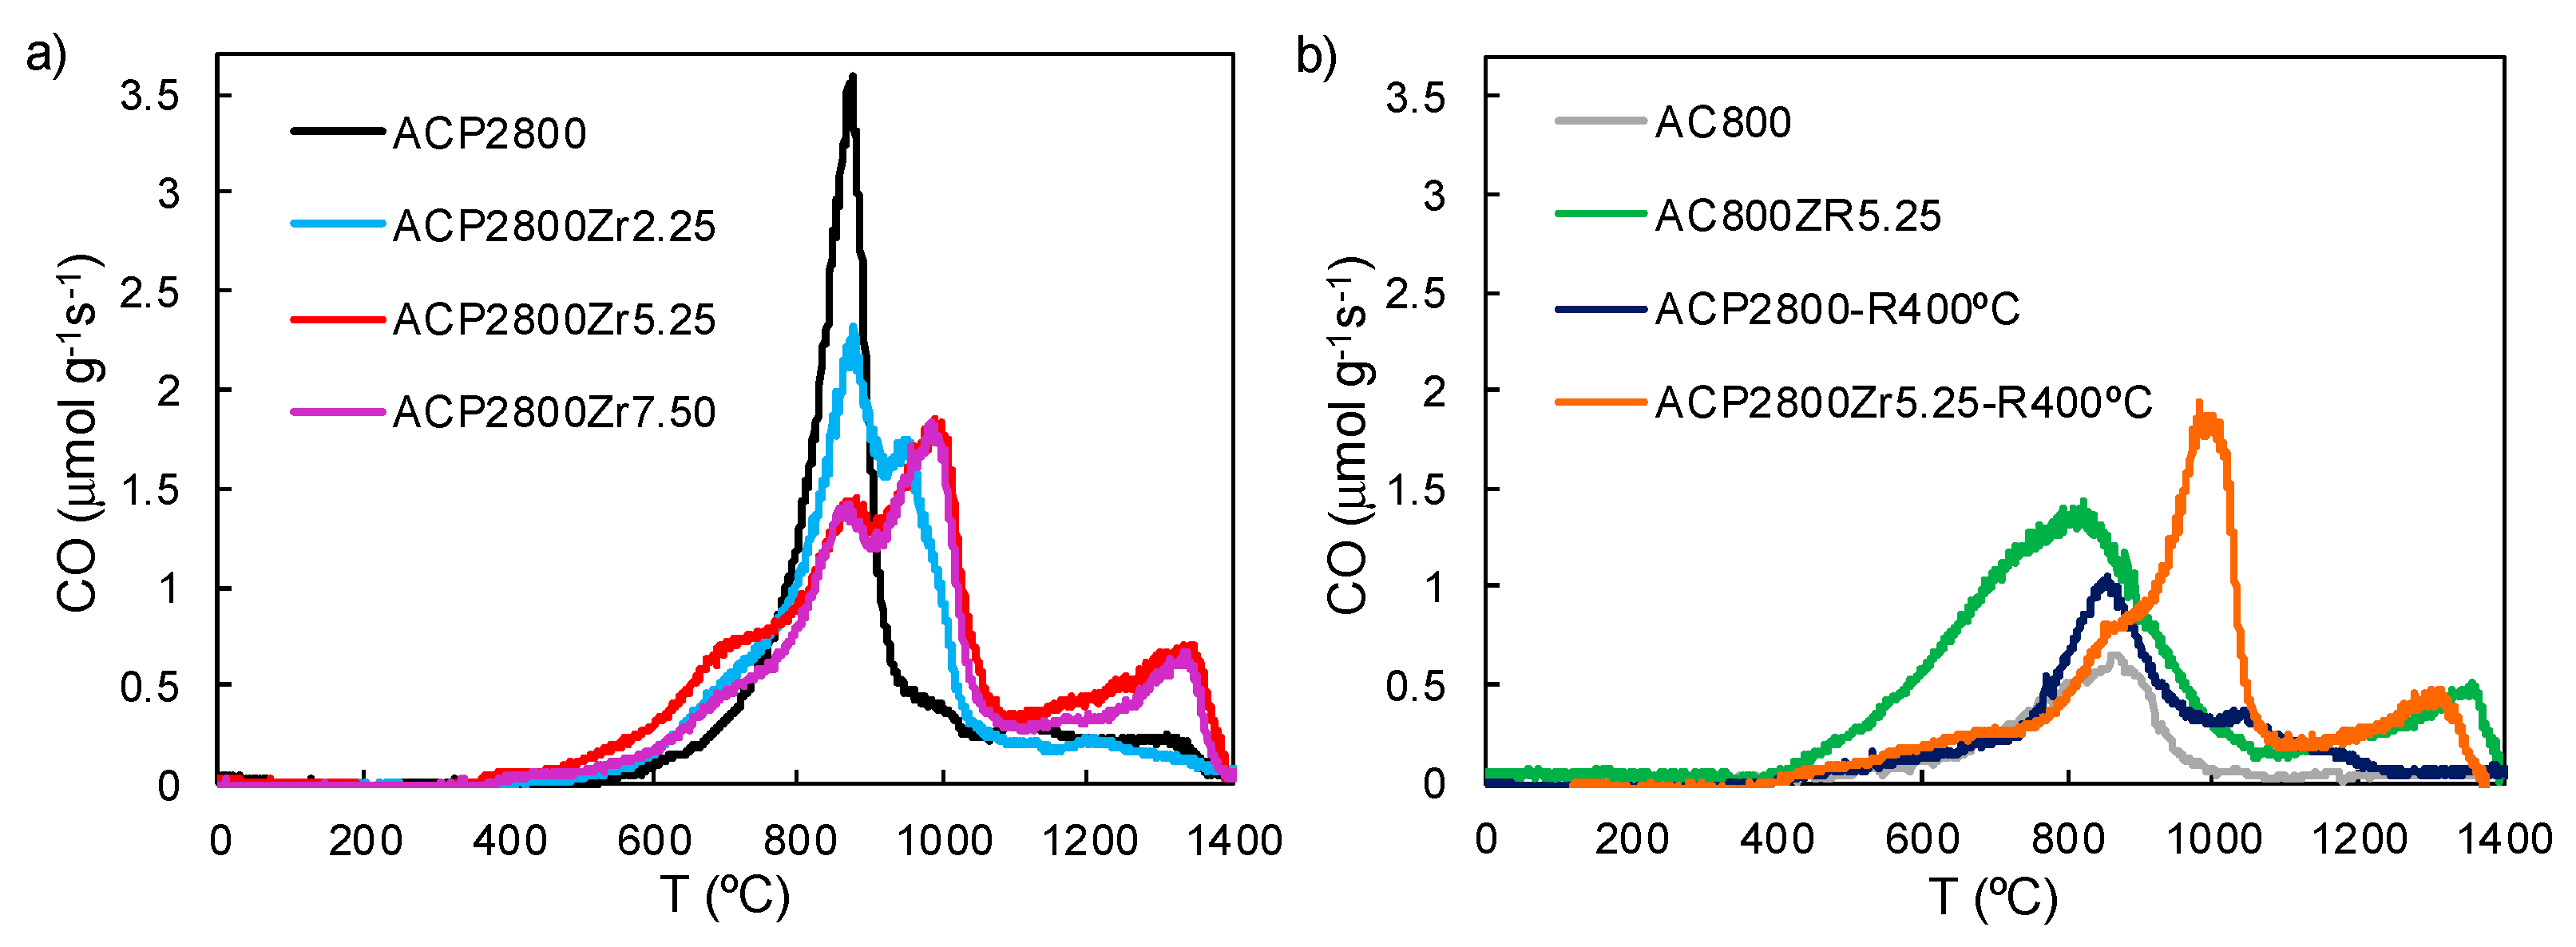
3.1. Characterization of the Carbon Catalysts
3.2. Catalytic Dehydration of Methanol
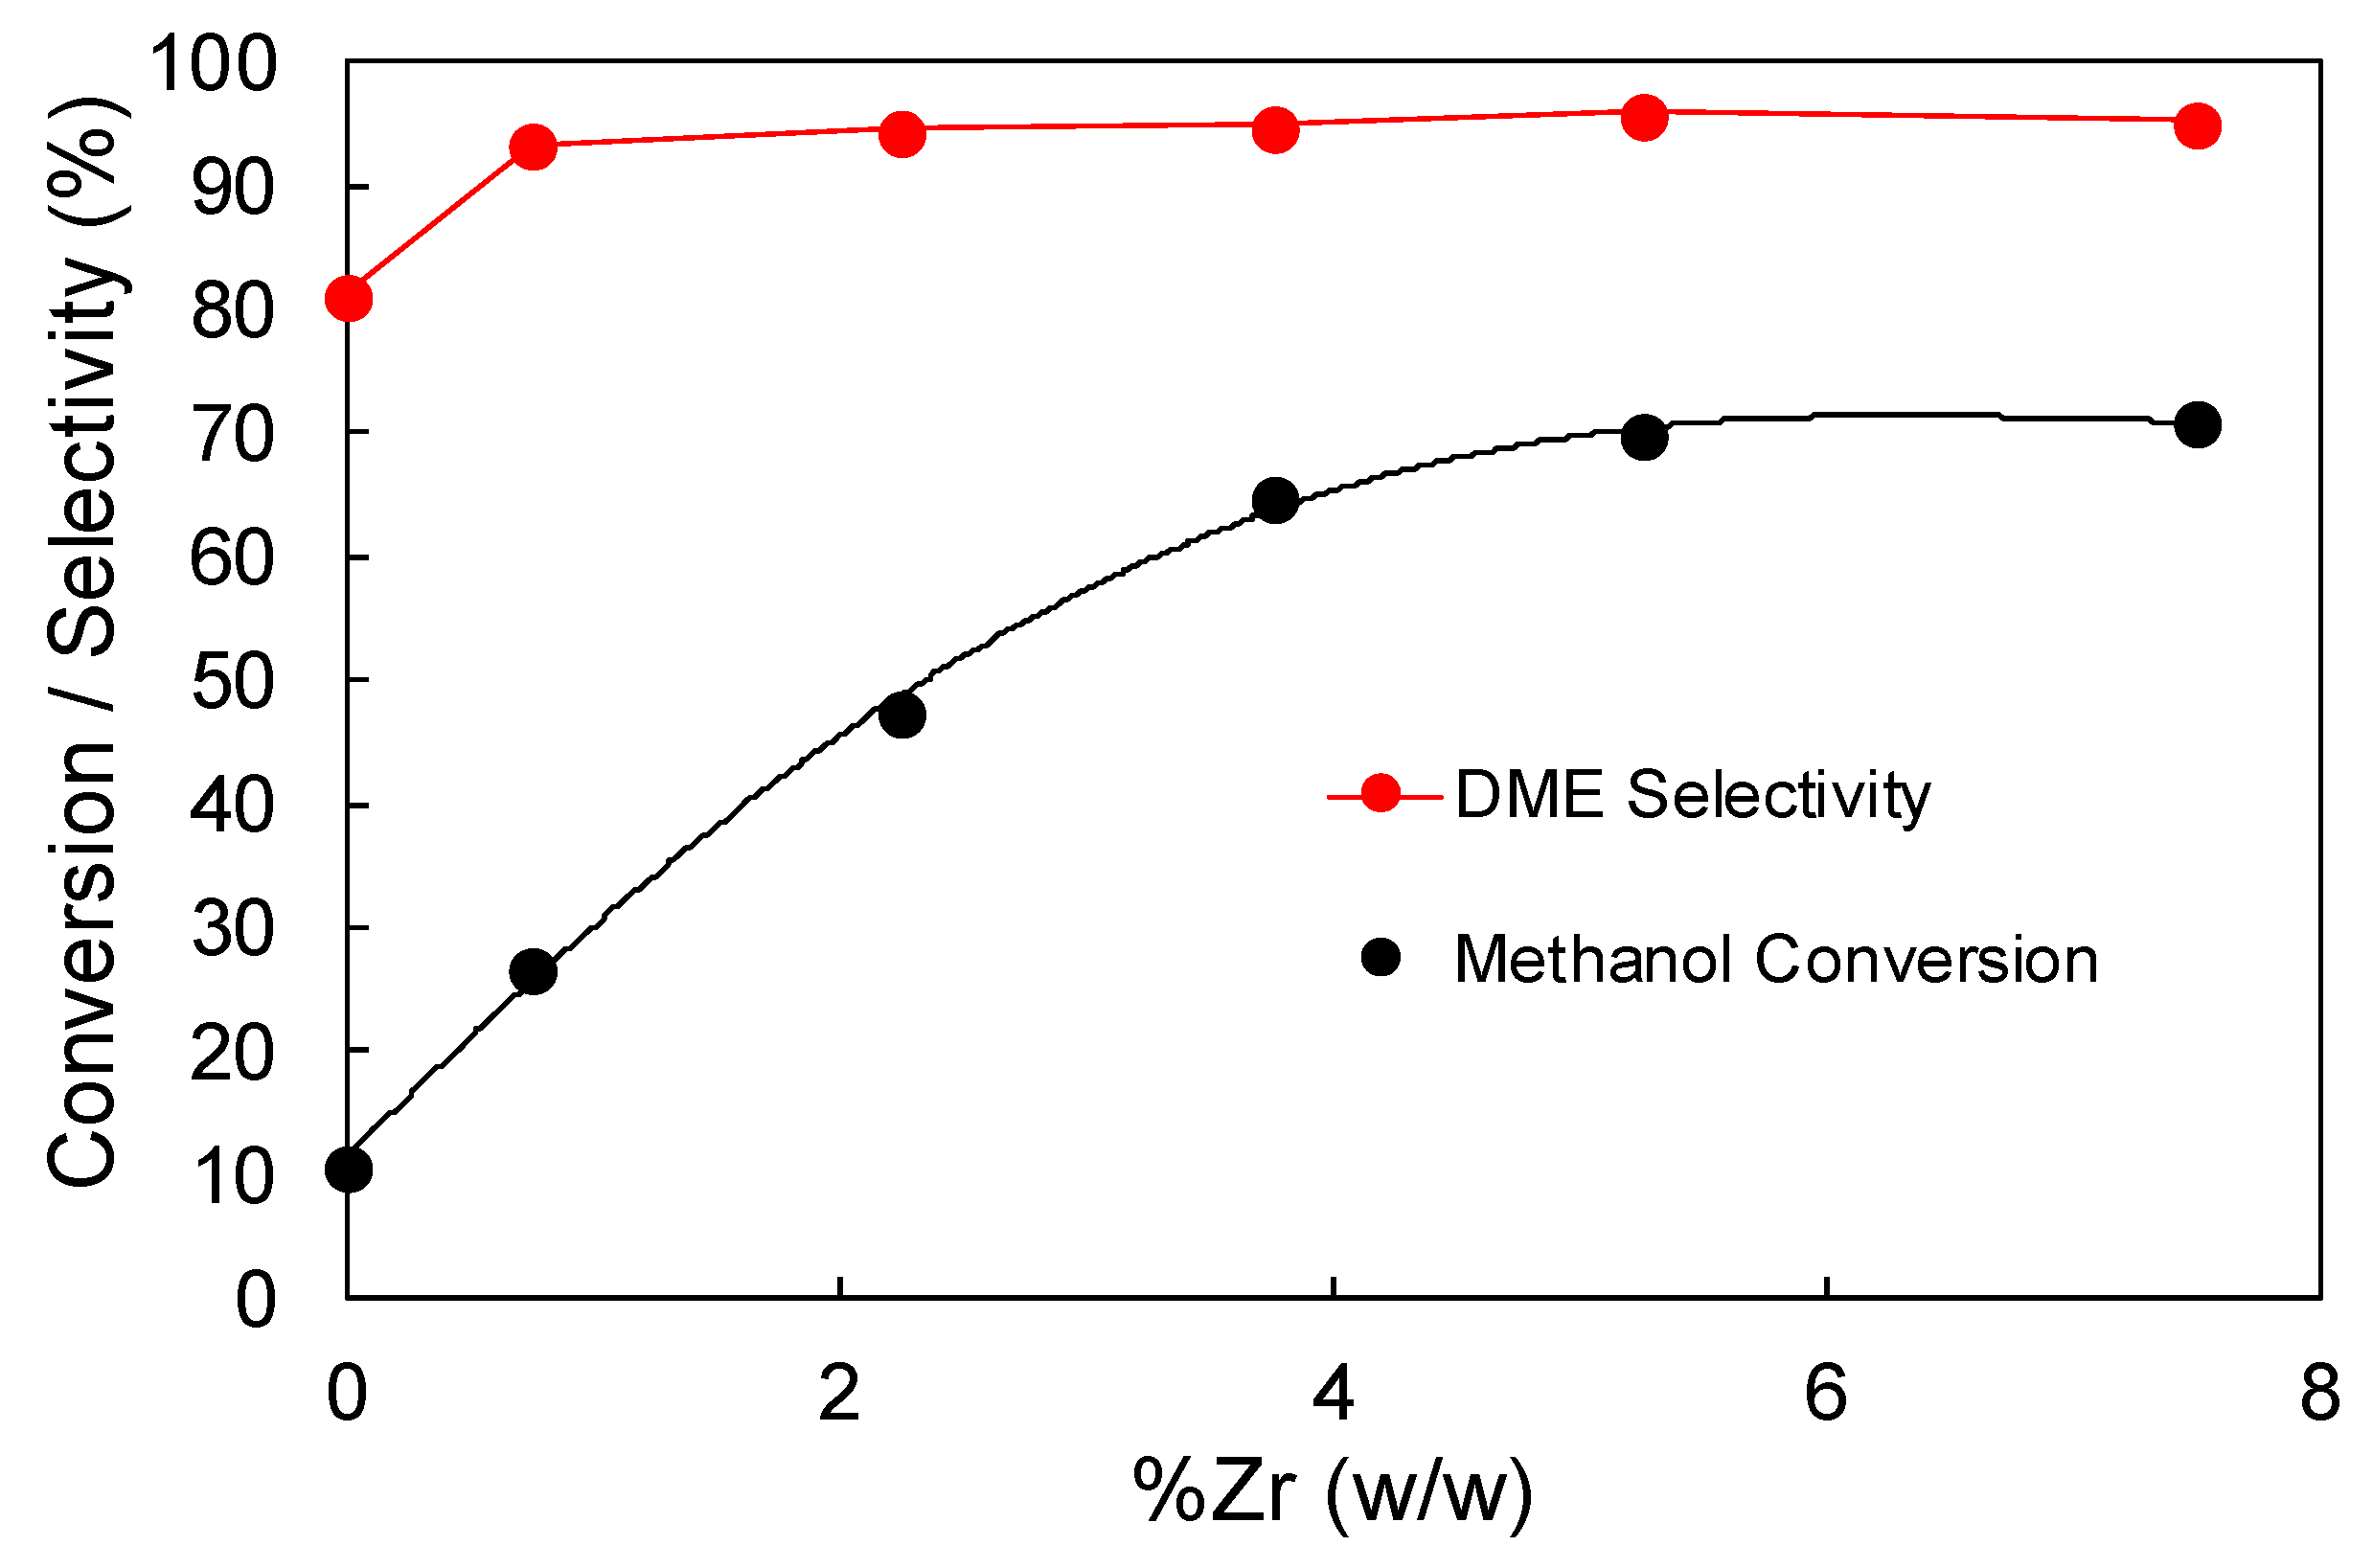
3.2.1. Effect of Zr Loading
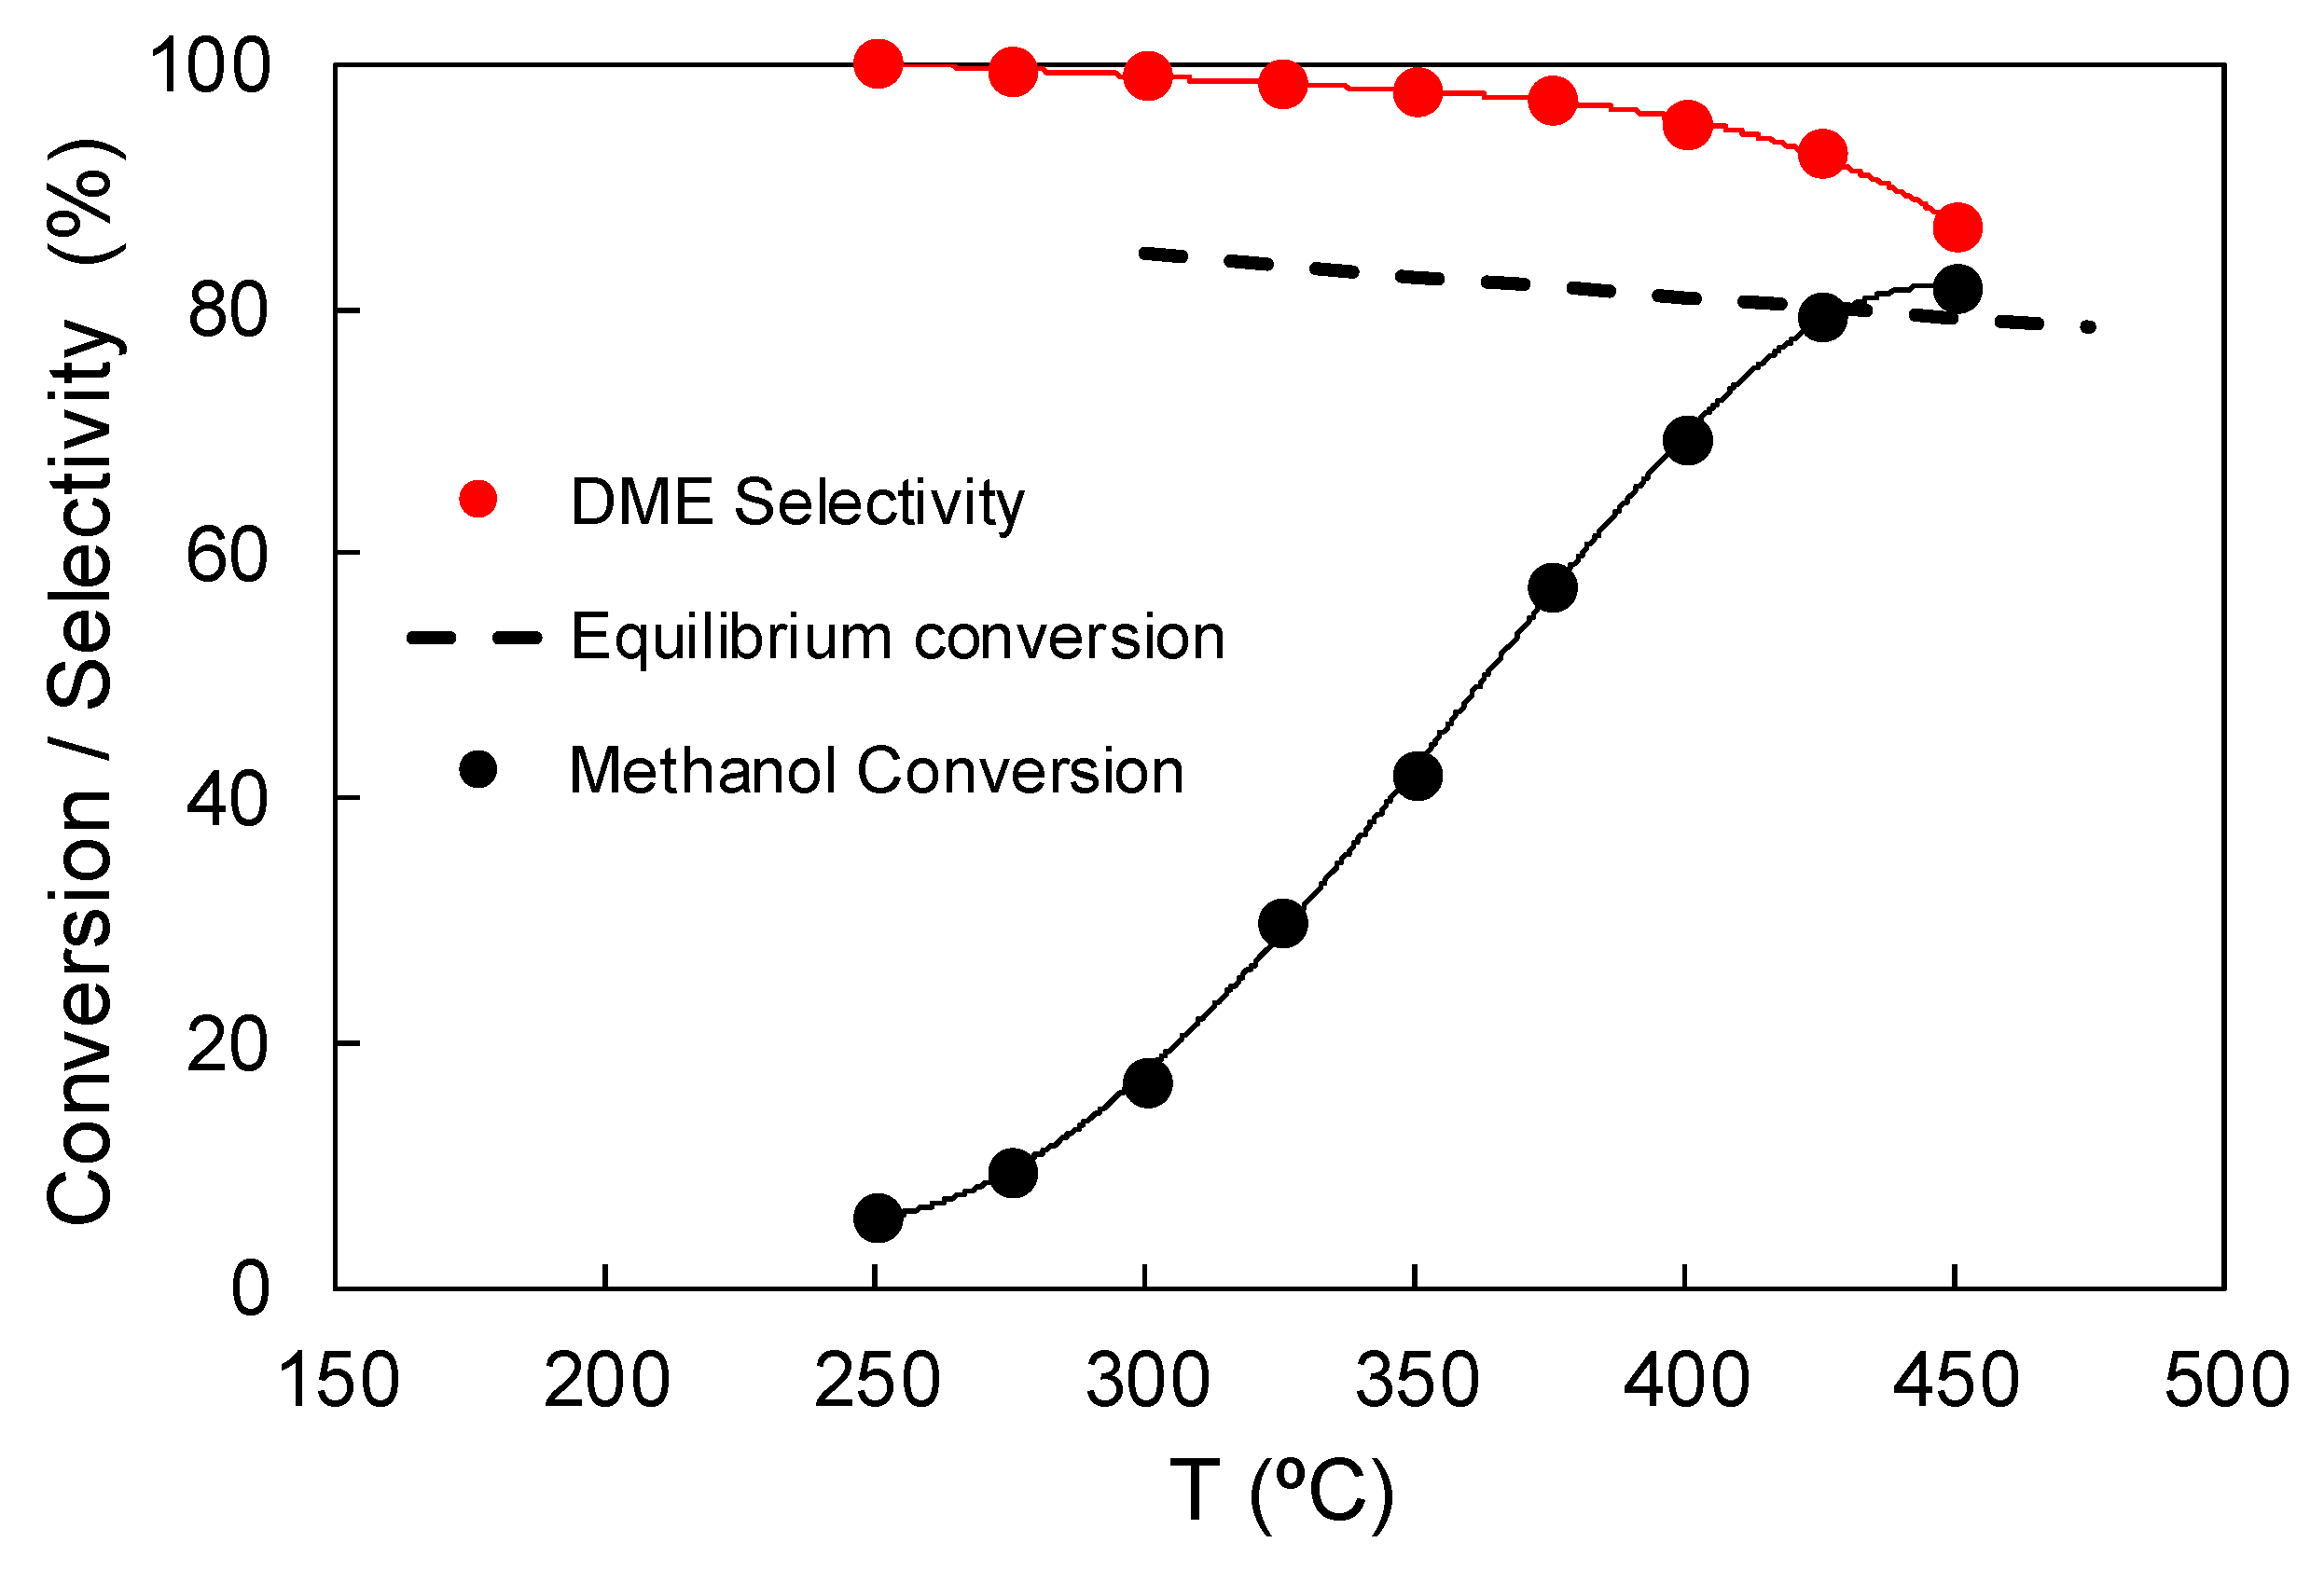
3.2.2. Effect of Temperature
3.2.3. Effect of Phosphorus on the Carbon Support
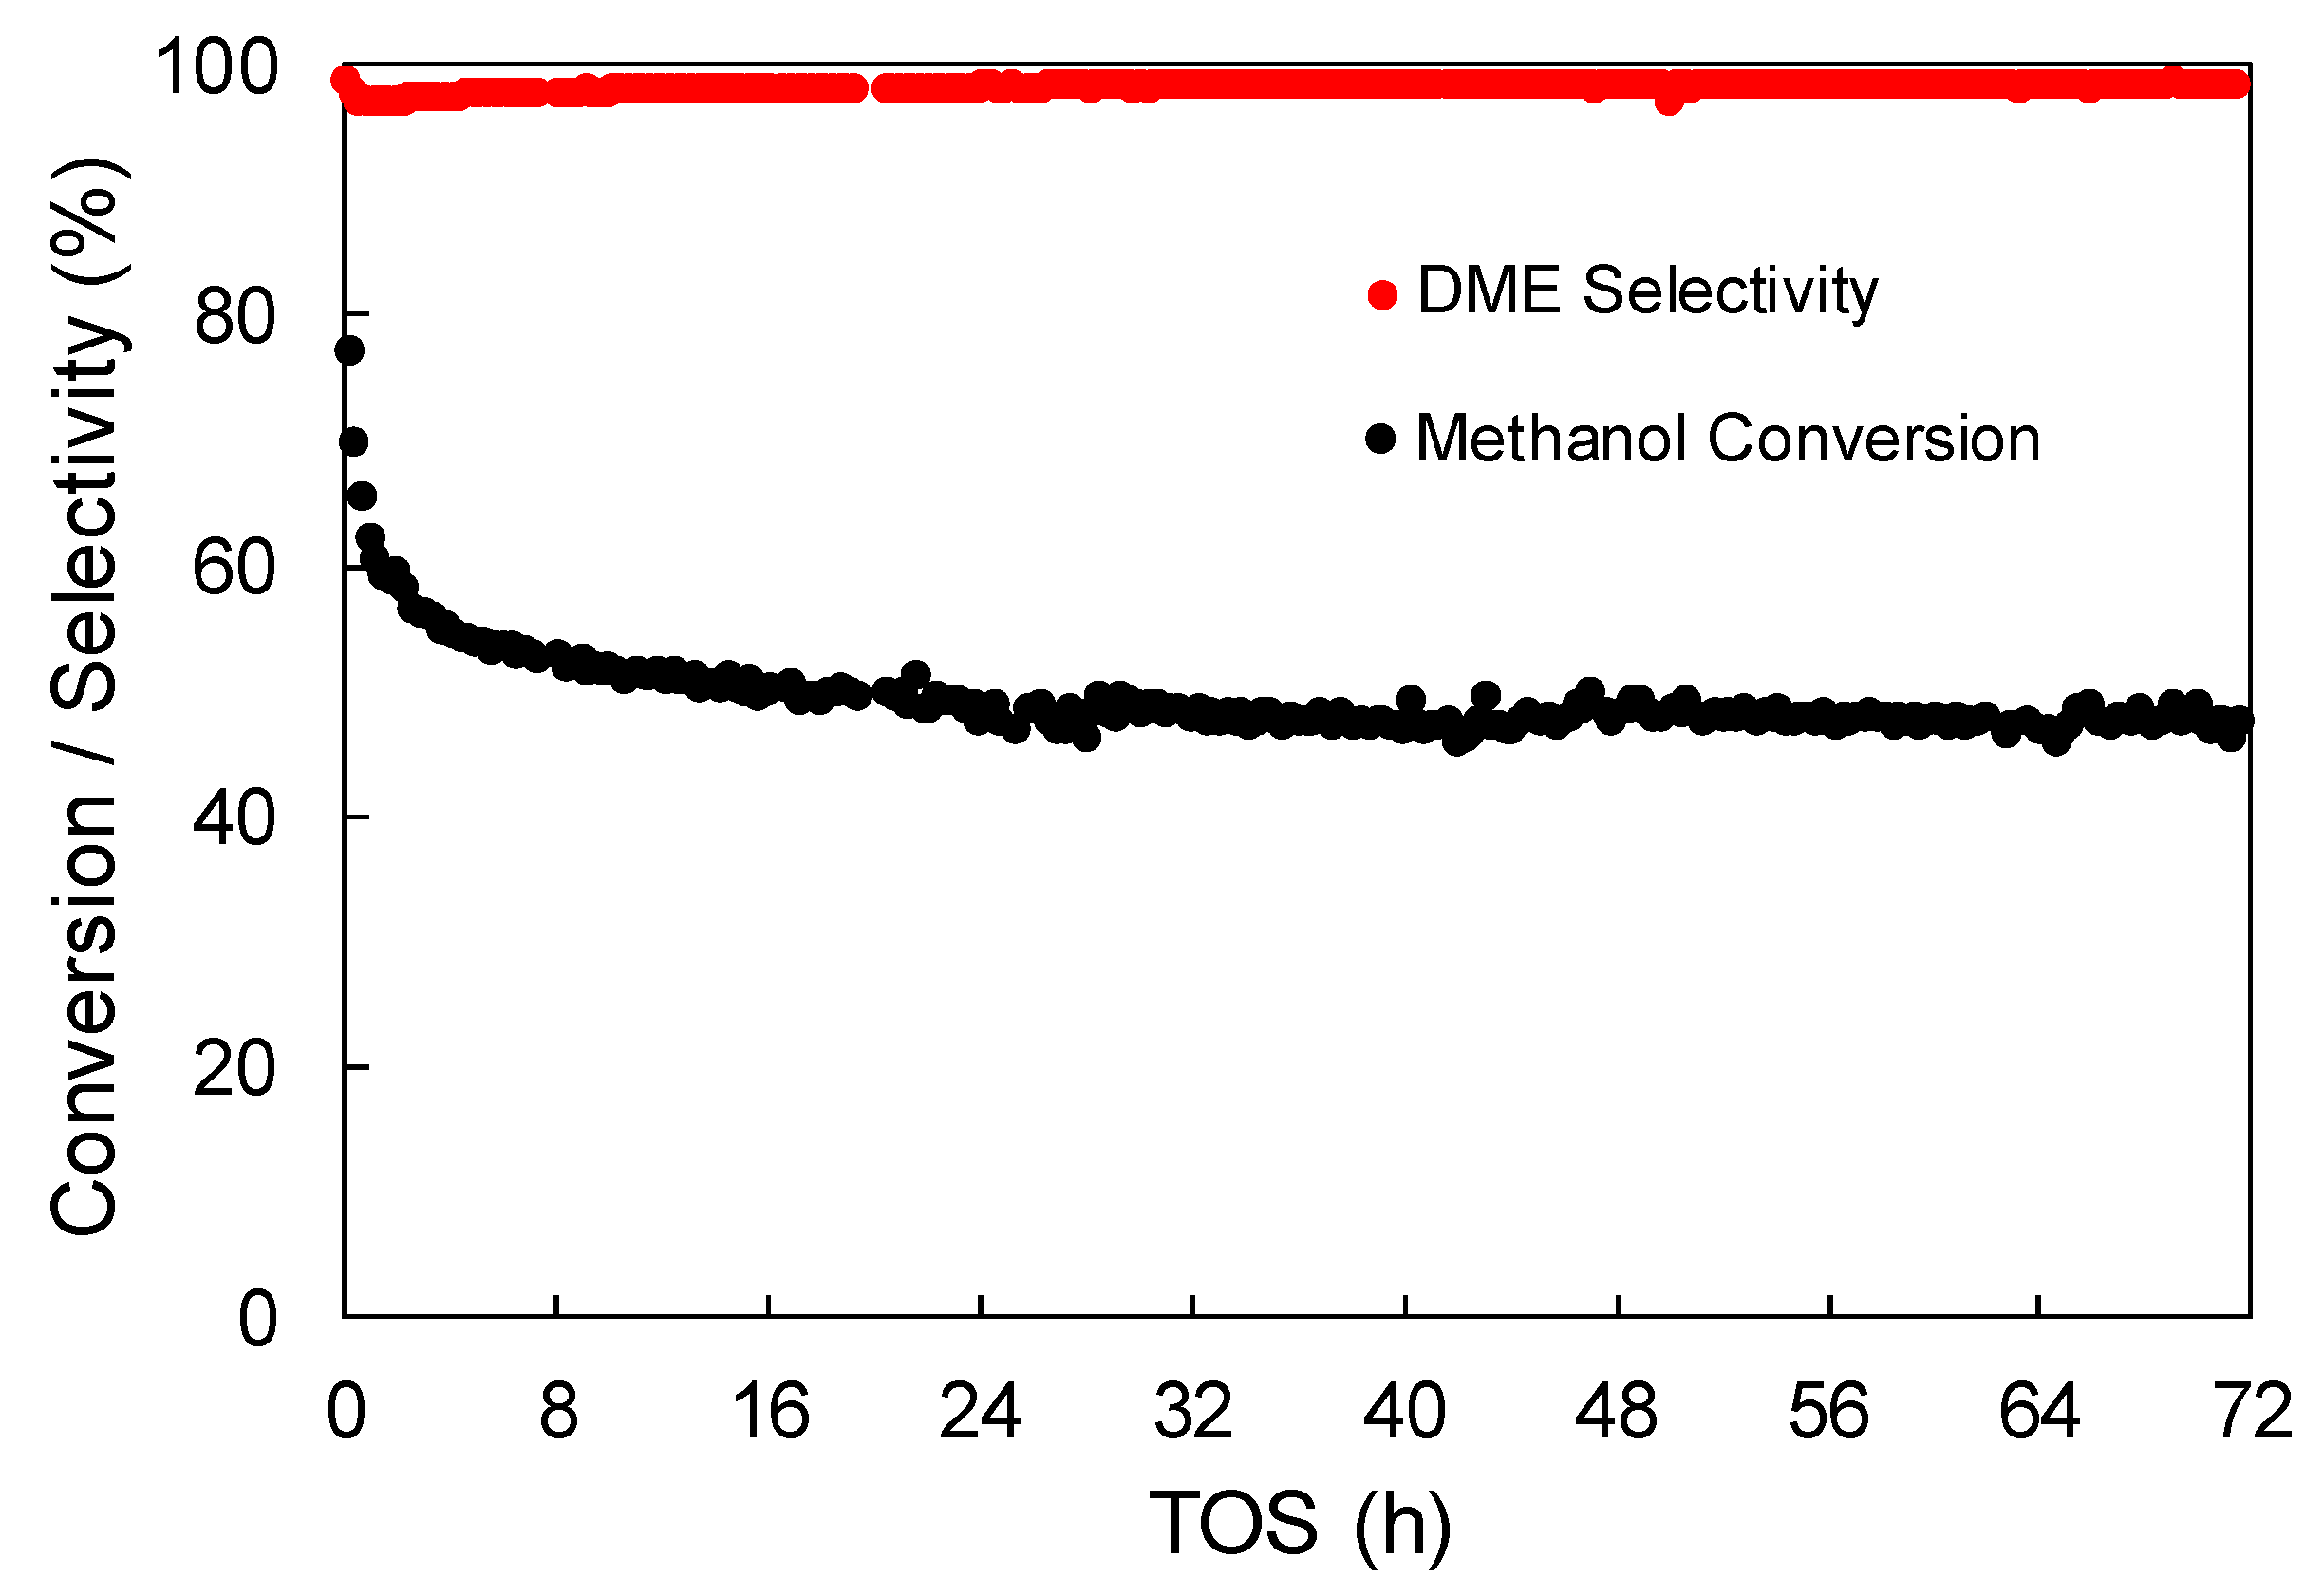
3.2.4. Effect of Water Vapor in the Feed
4. Conclusions
Supplementary Materials
Author Contributions
Funding
Conflicts of Interest
References
- Azizi, Z.; Rezaeimanesh, M.; Tohidian, T.; Rahimpour, M.R. Dimethyl ether: A review of technologies and production challenges. Chem. Eng. Process. Process Intensif. 2014, 82, 150–172. [Google Scholar] [CrossRef]
- Xu, M.; Lunsford, J.H.; Goodman, D.W.; Bhattacharyya, A. Synthesis of dimethyl ether (DME) from methanol over solid-acid catalysts. Appl. Catal. A Gen. 1997, 149, 289–301. [Google Scholar] [CrossRef]
- Cai, G.; Liu, Z.; Shi, R.; Changqing, H.; Yang, L.; Sun, C.; Chang, Y. Light alkenes from syngas via dimethyl ether. Appl. Catal. A Gen. 1995, 125, 29–38. [Google Scholar] [CrossRef]
- Shikada, T.; Fujimoto, K.; Miyauchi, M.; Tominaga, H. Vapor phase carbonylation of dimethyl ether and methyl acetate with nickel-active carbon catalysts. Appl. Catal. 1983, 7, 361–368. [Google Scholar] [CrossRef]
- Baltes, C.; Vukojević, S.; Schüth, F. Correlations between synthesis, precursor, and catalyst structure and activity of a large set of CuO/ZnO/Al2O3 catalysts for methanol synthesis. J. Catal. 2008, 258, 334–344. [Google Scholar] [CrossRef]
- Grunwaldt, J.D.; Molenbroek, A.M.; Topsoe, N.Y.; Topsoe, H.; Clausen, B.S. In situ investigations of structural changes in Cu/ZnO catalysts. J. Catal. 2000, 194, 452–460. [Google Scholar] [CrossRef]
- Chinchen, G.C.; Denny, P.J.; Jennings, J.R.; Spencer, M.S.; Waugh, K.C. Synthesis of Methanol. Part 1. Catalysts and Kinetics. Appl. Catal. 1988, 36, 1–65. [Google Scholar] [CrossRef]
- Yaripour, F.; Baghaei, F.; Schmidt, I.; Perregaard, J. Catalytic dehydration of methanol to dimethyl ether (DME) over solid-acid catalysts. Catal. Commun. 2005, 6, 147–152. [Google Scholar] [CrossRef]
- Bercic, G.; Levec, J. Catalytic dehydration of methanol to dimethyl ether. Kinetic investigation and reactor simulation. Ind. Eng. Chem. Res. 1993, 32, 2478–2484. [Google Scholar] [CrossRef]
- Seo, C.W.; Jung, K.D.; Lee, K.Y.; Yoo, K.S. Dehydration of methanol over Nordstrandite based catalysts for dimethyl ether synthesis. J. Ind. Eng. Chem. 2009, 15, 649–652. [Google Scholar] [CrossRef]
- Sofianos, A.C.; Scurrell, M.S. Conversion of synthesis gas to dimethyl ether over bifunctional catalytic systems. Ind. Eng. Chem. Res. 1991, 30, 2372–2378. [Google Scholar] [CrossRef]
- Aguayo, A.T.; Ereña, J.; Mier, D.; Arandes, J.M.; Olazar, M.; Bilbao, J. Kinetic Modeling of Dimethyl Ether Synthesis in a Single Step on a CuO−ZnO−Al2O3/γ-Al2O3 Catalyst. Ind. Eng. Chem. Res. 2007, 46, 5522–5530. [Google Scholar] [CrossRef]
- Ereña, J.; Garoña, R.; Arandes, J.M.; Aguayo, A.T.; Bilbao, J. Effect of operating conditions on the synthesis of dimethyl ether over a CuO-ZnO-Al2O3/NaHZSM-5 bifunctional catalyst. Catal. Today 2005, 107–108, 467–473. [Google Scholar] [CrossRef]
- Sánchez-Contador, M.; Ateka, A.; Aguayo, A.T.; Bilbao, J. Behavior of SAPO-11 as acid function in the direct synthesis of dimethyl ether from syngas and CO2. J. Ind. Eng. Chem. 2018, 63, 245–254. [Google Scholar] [CrossRef]
- Akarmazyan, S.S.; Panagiotopoulou, P.; Kambolis, A.; Papadopoulou, C.; Kondarides, D.I. Methanol dehydration to dimethylether over Al2O3 catalysts. Appl. Catal. B Environ. 2014, 145, 136–148. [Google Scholar] [CrossRef]
- Laugel, G.; Nitsch, X.; Ocampo, F.; Louis, B. Methanol dehydration into dimethylether over ZSM-5 type zeolites: Raise in the operational temperature range. Appl. Catal. A Gen. 2011, 402, 139–145. [Google Scholar] [CrossRef]
- Pop, G.; Bozga, G.; Ganea, R.; Natu, N. Methanol conversion to dimethyl ether over H-SAPO-34 catalyst. Ind. Eng. Chem. Res. 2009, 48, 7065–7071. [Google Scholar] [CrossRef]
- Cheng, S.; Peng, G.Z.; Clearfield, A. Decomposition of Alcohols over Zirconium and Titanium Phosphates. Ind. Eng. Chem. Prod. Res. Dev. 1984, 23, 219–225. [Google Scholar] [CrossRef]
- Alharbi, W.; Kozhevnikova, E.F.; Kozhevnikov, I.V. Dehydration of Methanol to Dimethyl Ether over Heteropoly Acid Catalysts: The Relationship between Reaction Rate and Catalyst Acid Strength. ACS Catal. 2015, 5, 7186–7193. [Google Scholar] [CrossRef]
- Hosseini, S.Y.; Khosravi Nikou, M.R. Investigation of different precipitating agents effects on performance of γ-Al2O3 nanocatalysts for methanol dehydration to dimethyl ether. J. Ind. Eng. Chem. 2014, 20, 4421–4428. [Google Scholar] [CrossRef]
- Sabour, B.; Peyrovi, M.H.; Hamoule, T.; Rashidzadeh, M. Catalytic dehydration of methanol to dimethyl ether (DME) over Al-HMS catalysts. J. Ind. Eng. Chem. 2014, 20, 222–227. [Google Scholar] [CrossRef]
- Sun, J.; Yang, G.; Yoneyama, Y.; Tsubaki, N. Catalysis Chemistry of Dimethyl Ether Synthesis. ACS Catal. 2014, 4, 3346–3356. [Google Scholar] [CrossRef]
- Jiang, S.; Hwang, J.-S.; Jin, T.; Cai, T.; Cho, W.; Baek, Y.-S.; Park, S.-E. Dehydration of Methanol to Dimethyl Ether over ZSM-5 Zeolite. Bull. Korean Chem. Soc. 2004, 25, 185–189. [Google Scholar] [Green Version]
- Vishwanathan, V.; Jun, K.W.; Kim, J.W.; Roh, H.S. Vapour phase dehydration of crude methanol to dimethyl ether over Na-modified H-ZSM-5 catalysts. Appl. Catal. A Gen. 2004, 276, 251–255. [Google Scholar] [CrossRef]
- Rosas, J.M.; Bedia, J.; Rodríguez-Mirasol, J.; Cordero, T. On the preparation and characterization of chars and activated carbons from orange skin. Fuel Process. Technol. 2010, 91, 1345–1354. [Google Scholar] [CrossRef]
- Rosas, J.M.; Bedia, J.; Rodríguez-Mirasol, J.; Cordero, T. HEMP-derived activated carbon fibers by chemical activation with phosphoric acid. Fuel 2009, 88, 19–26. [Google Scholar] [CrossRef]
- Rodríguez-Mirasol, J.; Cordero, T.; Rodríguez, J.J. Preparation and characterization of activated carbons from eucalyptus kraft lignin. Carbon 1993, 31, 87–95. [Google Scholar] [CrossRef]
- Zawadzki, J.; Azambre, B.; Heintz, O.; Krztoń, A.; Weber, J. IR study of the adsorption and decomposition of methanol on carbon surfaces and carbon-supported catalysts. Carbon 2000, 38, 509–515. [Google Scholar] [CrossRef]
- Jasińska, J.; Krzyżyńska, B.; Kozłowski, M. Influence of activated carbon modifications on their catalytic activity in methanol and ethanol conversion reactions. Cent. Eur. J. Chem. 2011, 9, 925–931. [Google Scholar] [CrossRef]
- Moreno-Castilla, C.; Carrasco-Marín, F.; Parejo-Pérez, C.; López Ramón, M.V. Dehydration of methanol to dimethyl ether catalyzed by oxidized activated carbons with varying surface acidic character. Carbon 2001, 39, 869–875. [Google Scholar] [CrossRef]
- Rosas, J.M.; Ruiz-Rosas, R.; Rodríguez-Mirasol, J.; Cordero, T. Kinetic study of the oxidation resistance of phosphorus-containing activated carbons. Carbon 2012, 50, 1523–1537. [Google Scholar] [CrossRef]
- Rosas, J.M.; Bedia, J.; Rodríguez-Mirasol, J.; Cordero, T. Preparation of Hemp-Derived Activated Carbon Monoliths. Adsorption of Water Vapor. Ind. Eng. Chem. Res. 2008, 47, 1288–1296. [Google Scholar] [CrossRef]
- Rosas, J.M.; Rodríguez-Mirasol, J.; Cordero, T. NO Reduction on Carbon-Supported Chromium Catalysts. Energy Fuels 2010, 24, 3321–3328. [Google Scholar] [CrossRef]
- Valero-Romero, M.J.; García-Mateos, F.J.; Rodríguez-Mirasol, J.; Cordero, T. Role of surface phosphorus complexes on the oxidation of porous carbons. Fuel Process. Technol. 2017, 157, 116–126. [Google Scholar] [CrossRef]
- Bedia, J.; Barrionuevo, R.; Rodríguez-Mirasol, J.; Cordero, T. Ethanol dehydration to ethylene on acid carbon catalysts. Appl. Catal. B Environ. 2011, 103, 302–310. [Google Scholar] [CrossRef]
- Bedia, J.; Rosas, J.M.; Márquez, J.; Rodríguez-Mirasol, J.; Cordero, T. Preparation and characterization of carbon based acid catalysts for the dehydration of 2-propanol. Carbon 2009, 47, 286–294. [Google Scholar] [CrossRef]
- Valero Romero, M.J.; Calvo Muñoz, E.M.; Ruíz Rosas, R.; Rodríguez-Mirasol, J.; Cordero, T. Phosphorus-containing mesoporous carbon acid catalyst for methanol dehydration to dimethyl ether. Ind. Eng. Chem. Res. 2019, 58, 4042–4053. [Google Scholar] [CrossRef]
- Gonzalez-Serrano, E.; Cordero, T.; Rodriguez-Mirasol, J.; Cotoruelo, L.; Rodriguez, J.J. Removal of water pollutants with activated carbons prepared from H3PO4 activation of lignin from kraft black liquors. Water Res. 2004, 38, 3043–3050. [Google Scholar] [CrossRef] [PubMed]
- Brunauer, S.; Emmett, P.H.; Teller, E. Adsorption of Gases in Multimolecular Layers. J. Am. Chem. Soc. 1938, 60, 309–319. [Google Scholar] [CrossRef]
- Kaneko, K.; Ishii, C. Superhigh surface area determination of microporous solids. Colloids Surf. 1992, 67, 203–212. [Google Scholar] [CrossRef]
- Gregg, S.J.; Sing, K.S.W. Adsorption, Surface Area and Porosity, 2nd ed.; Academic Press: London, UK; New York, NY, USA, 1982; ISBN 0123009561. [Google Scholar]
- Dubinin, M.M. The potential theory of adsorption of gases and vapors for adsorbents with energetically nonuniform surfaces. Chem. Rev. 1960, 60, 235–241. [Google Scholar] [CrossRef]
- Figueiredo, J.L.; Pereira, M.F.R.; Freitas, M.M.A.; Órfão, J.J.M. Modification of the surface chemistry of activated carbons. Carbon 1999, 37, 1379–1389. [Google Scholar] [CrossRef]
- Thommes, M.; Kaneko, K.; Neimark, A.V.; Olivier, J.P.; Rodriguez-Reinoso, F.; Rouquerol, J.; Sing, K.S.W. Physisorption of gases, with special reference to the evaluation of surface area and pore size distribution (IUPAC Technical Report). Pure Appl. Chem. 2015, 87. [Google Scholar] [CrossRef]
- Colón, J.L.; Thakur, D.S.; Yang, C.-Y.; Clearfield, A.; Martini, C.R. X-ray photoelectron spectroscopy and catalytic activity of α-zirconium phosphate and zirconium phosphate sulfophenylphosphonate. J. Catal. 1990, 124, 148–159. [Google Scholar] [CrossRef]
- Morant, C.; Sanz, J.M.; Galán, L.; Soriano, L.; Rueda, F. An XPS study of the interaction of oxygen with zirconium. Surf. Sci. 1989, 218, 331–345. [Google Scholar] [CrossRef]
- Kumari, L.; Li, W.Z.; Xu, J.M.; Leblanc, R.M.; Wang, D.Z.; Li, Y.; Guo, H.; Zhang, J. Controlled hydrothermal synthesis of zirconium oxide nanostructures and their optical properties. Cryst. Growth Des. 2009, 9, 3874–3880. [Google Scholar] [CrossRef]
- Alberti, G.; Costantino, U.; Marletta, G.; Puglisi, O.; Pignataro, S. ESCA investigations of amorphous and crystalline zirconium acid phosphates. J. Inorg. Nucl. Chem. 1981, 43, 3329–3334. [Google Scholar] [CrossRef]
- Wu, X.; Radovic, L.R. Inhibition of catalytic oxidation of carbon/carbon composites by phosphorus. Carbon 2006, 44, 141–151. [Google Scholar] [CrossRef]
- Ang, C.; Williams, T.; Seeber, A.; Wang, H.; Cheng, Y.B. Synthesis and evolution of zirconium carbide via Sol-Gel route: Features of nanoparticle oxide-carbon reactions. J. Am. Ceram. Soc. 2013, 96, 1099–1106. [Google Scholar] [CrossRef]
- Bedia, J.; Ruiz-Rosas, R.; Rodríguez-Mirasol, J.; Cordero, T. Kinetic study of the decomposition of 2-butanol on carbon-based acid catalyst. AIChE J. 2010, 56, 1557–1568. [Google Scholar] [CrossRef]
- Moulijn, J.A.; Tarfaoui, A.; Kapteijn, F. General aspects of catalyst testing. Catal. Today 1991, 11, 1–12. [Google Scholar] [CrossRef]
- Ruiz-Rosas, R.; Bedia, J.; Rosas, J.M.; Lallave, M.; Loscertales, I.G.; Rodríguez-Mirasol, J.; Cordero, T. Methanol decomposition on electrospun zirconia nanofibers. Catal. Today 2012, 187, 77–87. [Google Scholar] [CrossRef]
- Mollavali, M.; Yaripour, F.; Atashi, H.; Sahebdelfar, S. Intrinsic kinetics study of dimethyl ether synthesis from methanol on γ-Al2O3 catalysts. Ind. Eng. Chem. Res. 2008, 47, 3265–3273. [Google Scholar] [CrossRef]
- Vishwanathan, V.; Roh, H.S.; Kim, J.W.; Jun, K.W. Surface properties and catalytic activity of TiO2-ZrO2 mixed oxides in dehydration of methanol to dimethyl ether. Catal. Lett. 2004, 96, 23–28. [Google Scholar] [CrossRef]
- Rownaghi, A.A.; Rezaei, F.; Stante, M.; Hedlund, J. Selective dehydration of methanol to dimethyl ether on ZSM-5 nanocrystals. Appl. Catal. B Environ. 2012, 119–120, 56–61. [Google Scholar] [CrossRef]
- Catizzone, E.; Aloise, A.; Migliori, M.; Giordano, G. Dimethyl ether synthesis via methanol dehydration: Effect of zeolite structure. Appl. Catal. A Gen. 2015, 502, 215–220. [Google Scholar] [CrossRef]
- Rutkowska, M.; Macina, D.; Mirocha-Kubień, N.; Piwowarska, Z.; Chmielarz, L. Hierarchically structured ZSM-5 obtained by desilication as new catalyst for DME synthesis from methanol. Appl. Catal. B Environ. 2015, 174–175, 336–343. [Google Scholar] [CrossRef]
- Nitta, M.; Sakoh, H.; Aomura, K. The conversion of methanol into hydrocarbons over modified zirconia. Appl. Catal. 1984, 10, 215–217. [Google Scholar] [CrossRef]
- Osman, A.I.; Abu-Dahrieh, J.K.; Rooney, D.W.; Halawy, S.A.; Mohamed, M.A.; Abdelkader, A. Effect of precursor on the performance of alumina for the dehydration of methanol to dimethyl ether. Appl. Catal. B Environ. 2012, 127, 307–315. [Google Scholar] [CrossRef] [Green Version]


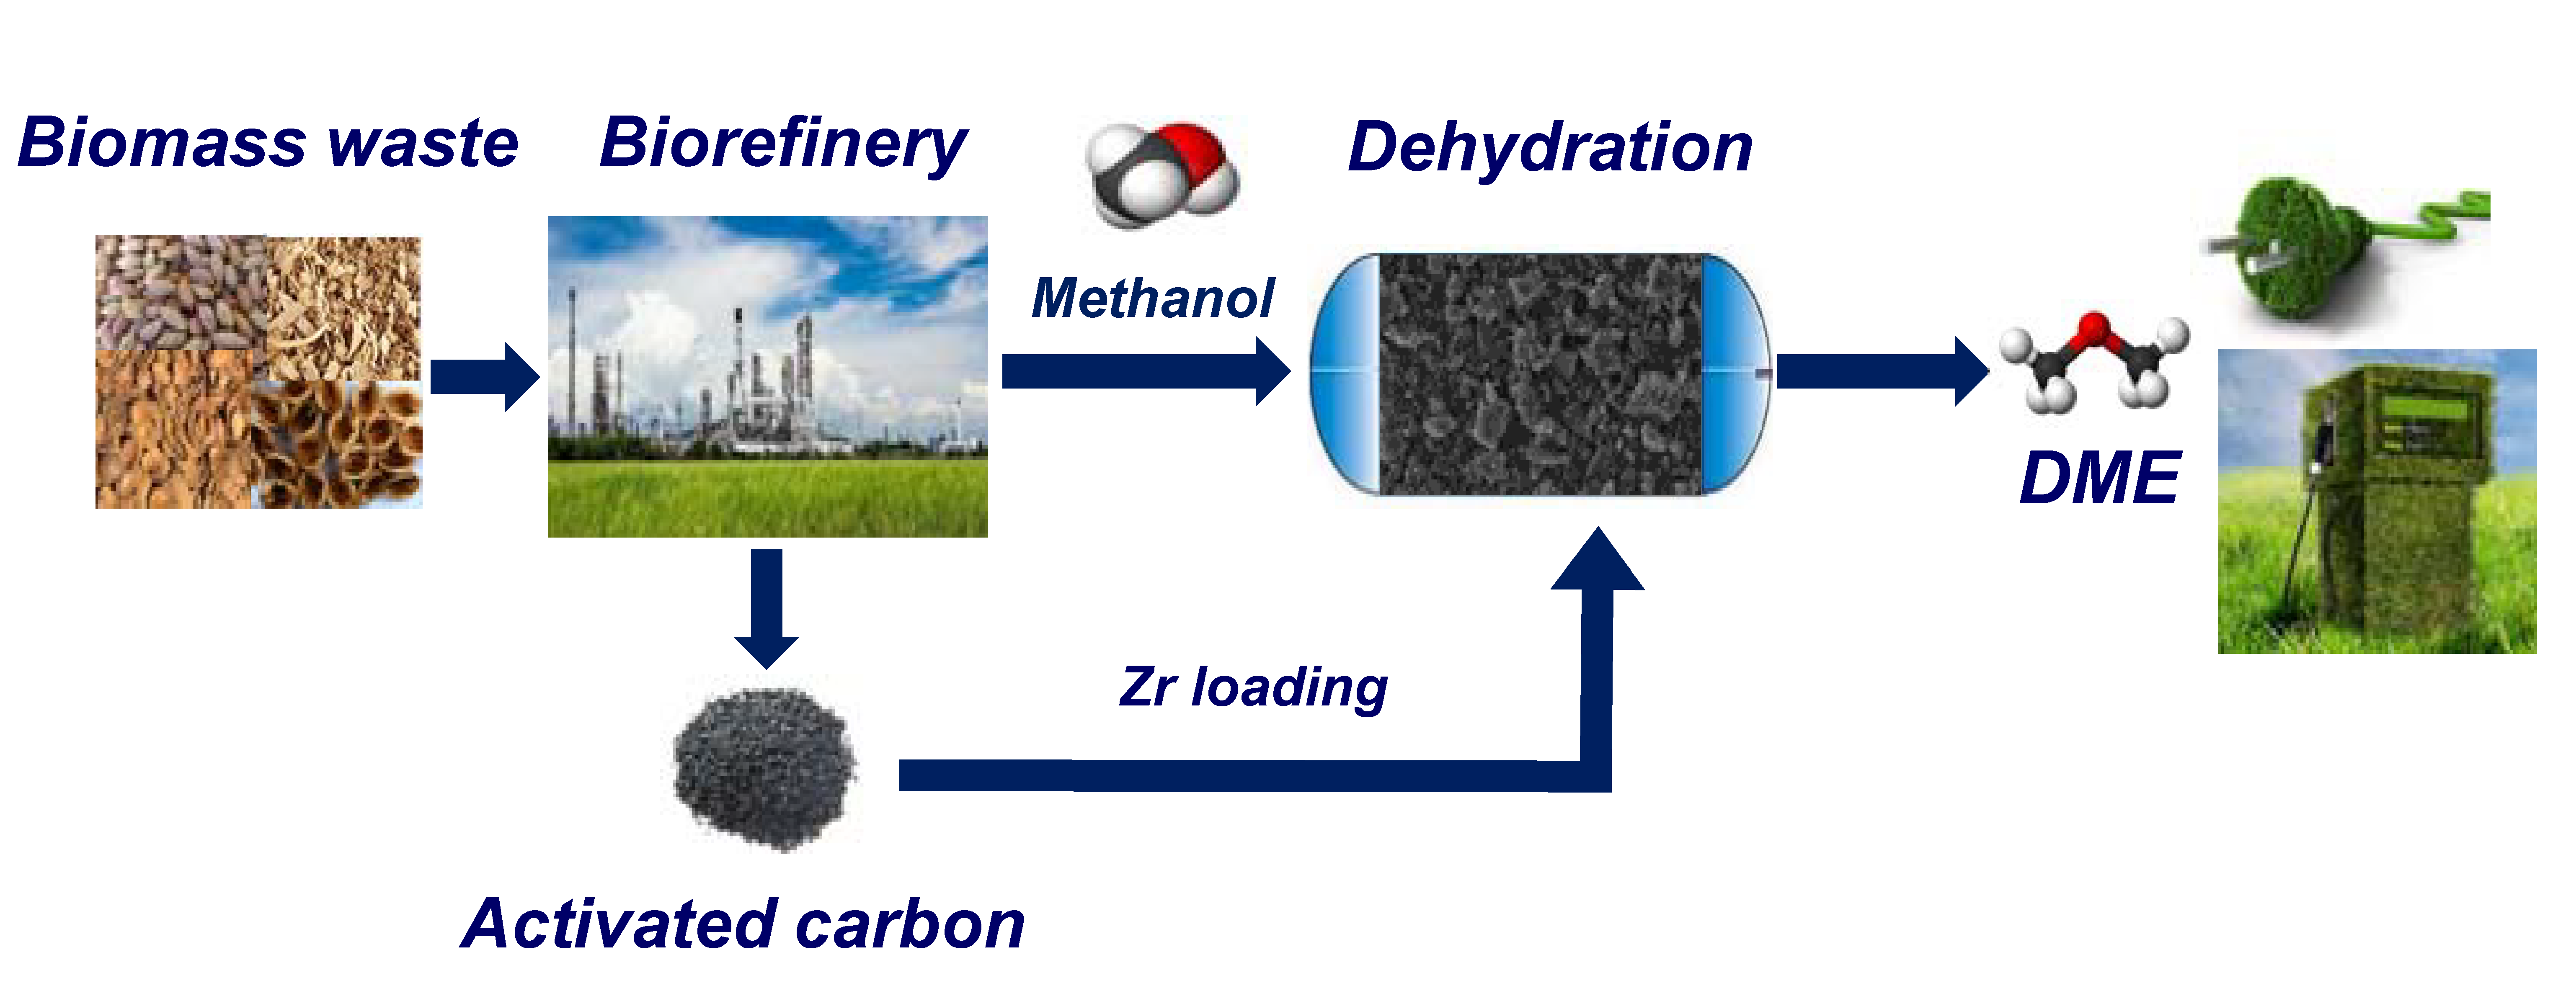
| Sample. | N2 Isotherm | CO2 Isotherm | %Zr | |||||
|---|---|---|---|---|---|---|---|---|
| ABETN2 (a) (m2/g) | VpN2 (b) (cm3/g) | VmesN2 (c) (cm3/g) | AsN2 (d) (m2/g) | VsN2 (d) (cm3/g) | ADRCO2 (e) (m2/g) | VDRCO2 (e) (cm3/g) | ||
| ACP2800 | 1280 | 0.95 | 0.44 | 310 | 0.52 | 471 | 0.19 | 0 |
| ACP2800Zr0.75 | 1273 | 0.90 | 0.41 | 308 | 0.49 | 519 | 0.21 | 0.75 |
| ACP2800Zr2.25 | 1195 | 0.94 | 0.45 | 297 | 0.50 | 511 | 0.21 | 2.25 |
| ACP2800Zr3.75 | 1148 | 0.93 | 0.44 | 281 | 0.49 | 501 | 0.20 | 3.75 |
| ACP2800Zr5.25 | 1143 | 0.88 | 0.40 | 247 | 0.48 | 497 | 0.20 | 5.25 |
| ACP2800Zr7.5 | 1132 | 0.86 | 0.40 | 242 | 0.47 | 487 | 0.20 | 7.50 |
| AC800 | 1127 | 0.55 | 0.10 | 52 | 0.44 | 865 | 0.35 | 0 |
| AC800Zr5.25 | 812 | 0.44 | 0.07 | 43 | 0.37 | 757 | 0.30 | 5.25 |
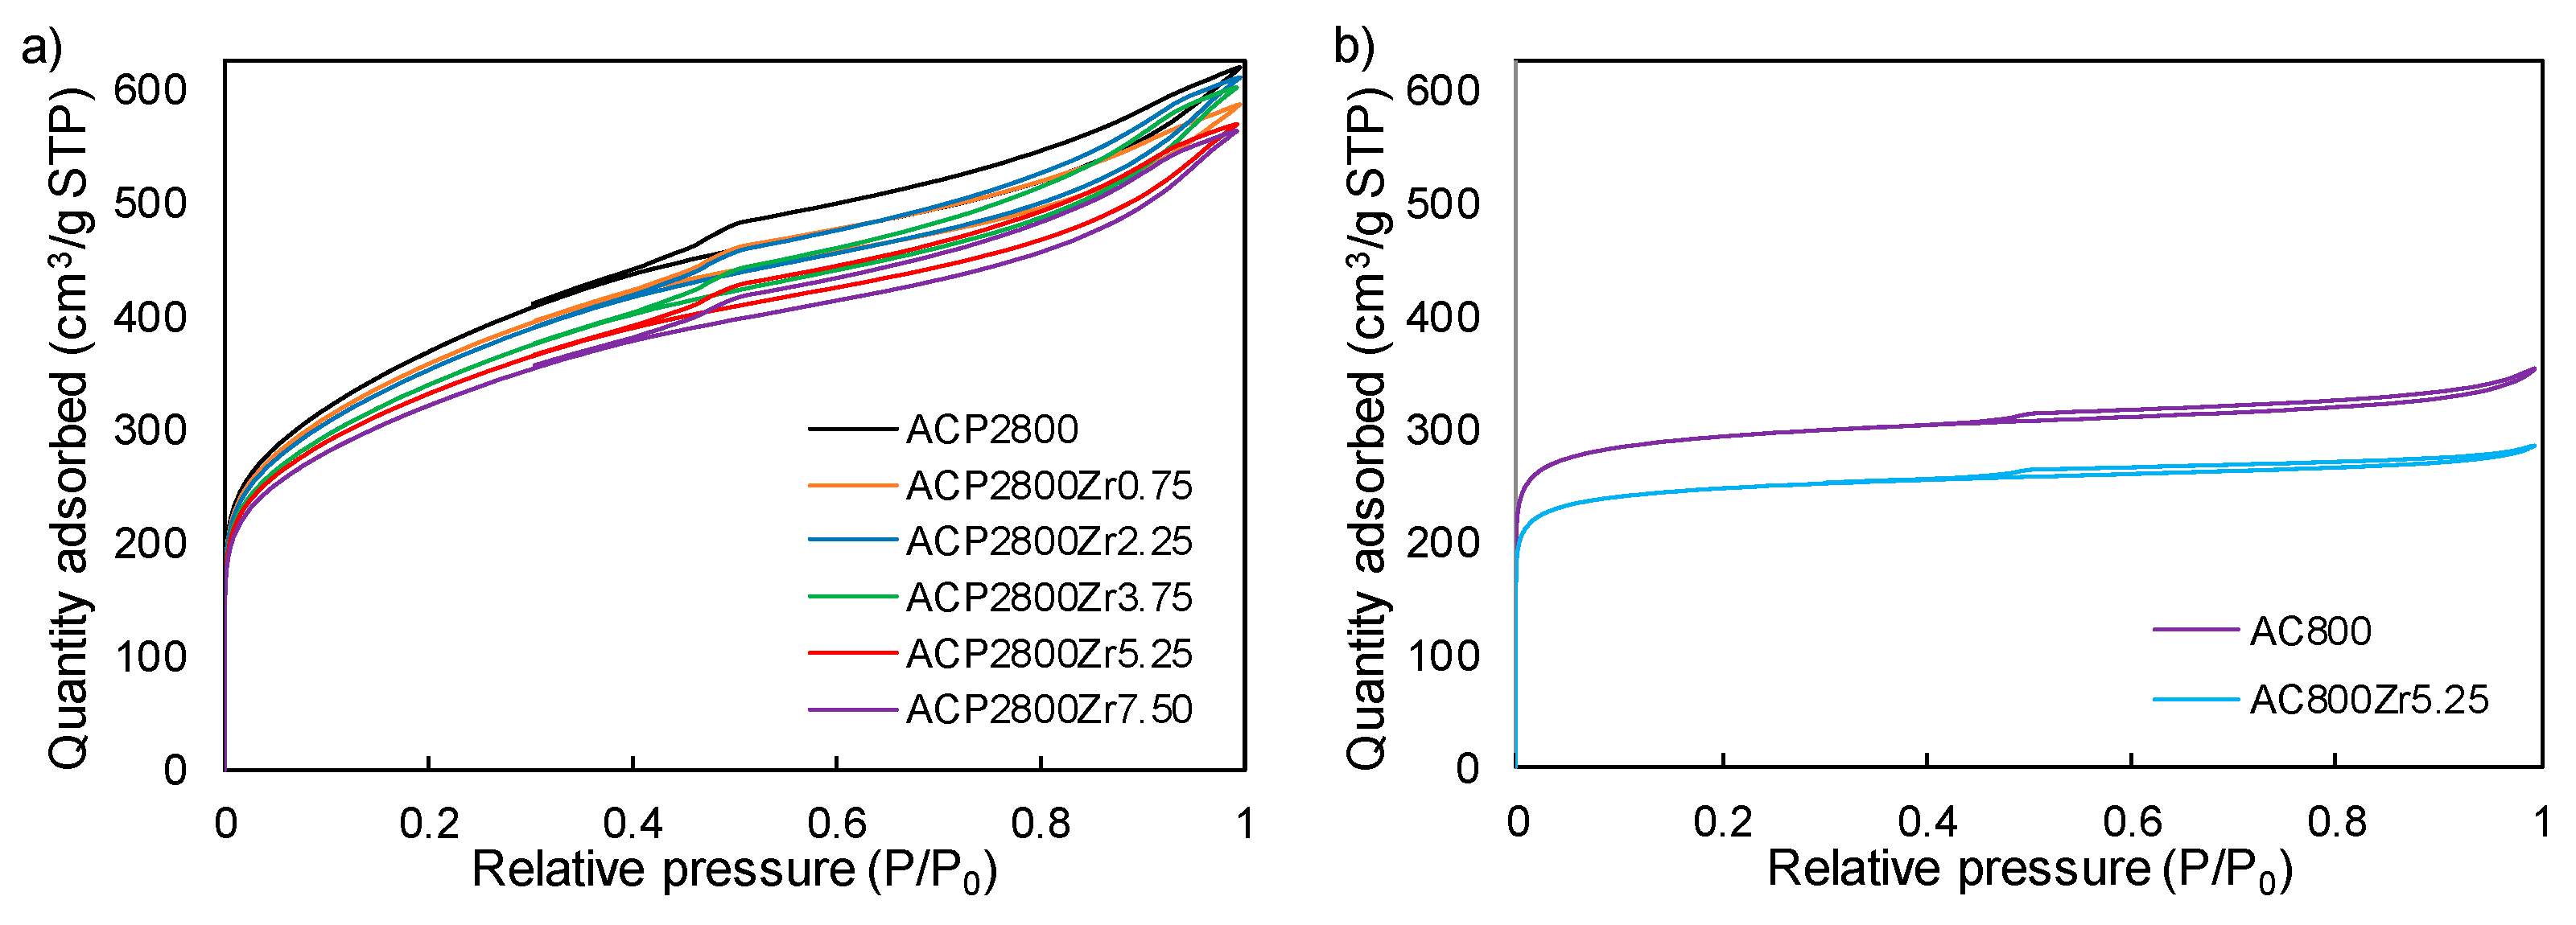
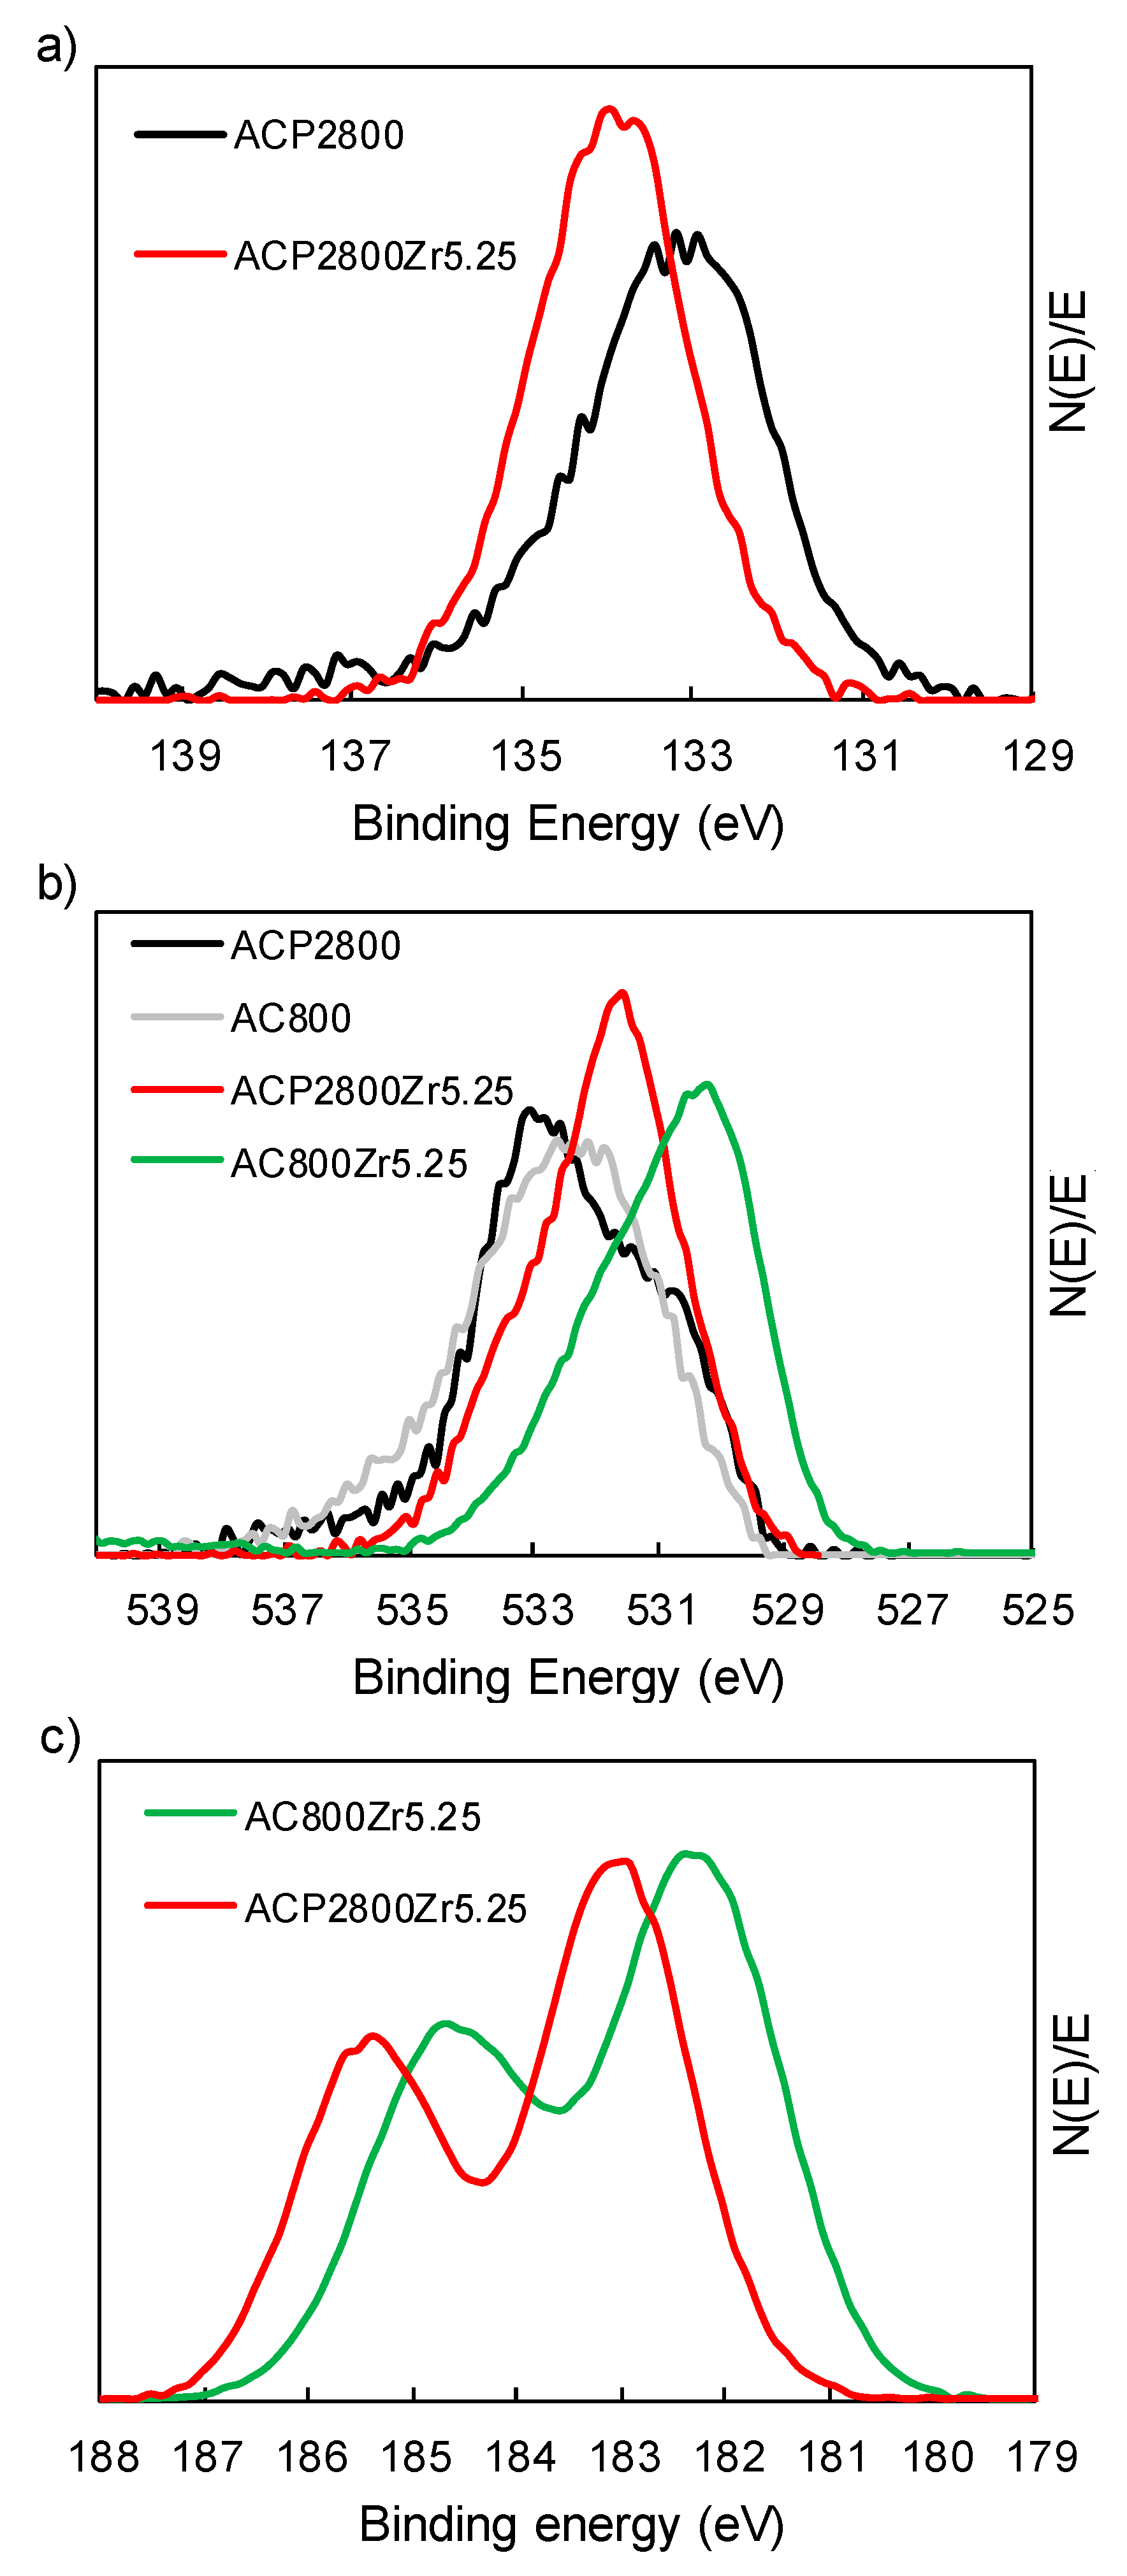
| Sample | Atomic Surface Ratios (XPS) | ||
|---|---|---|---|
| Zr/P | O/Zr | O/P | |
| ACP2800 | - | - | 4.45 |
| ACP2800Zr0.75 | 0.49 | 9.75 | 4.70 |
| ACP2800Zr2.25 | 0.50 | 9.06 | 4.57 |
| ACP2800Zr3.75 | 0.62 | 8.98 | 5.55 |
| ACP2800Zr5.25 | 0.89 | 7.52 | 6.71 |
| ACP2800Zr7.50 | 0.98 | 7.16 | 7.00 |
© 2019 by the authors. Licensee MDPI, Basel, Switzerland. This article is an open access article distributed under the terms and conditions of the Creative Commons Attribution (CC BY) license (http://creativecommons.org/licenses/by/4.0/).
Share and Cite
Palomo, J.; Rodríguez-Mirasol, J.; Cordero, T. Methanol Dehydration to Dimethyl Ether on Zr-Loaded P-Containing Mesoporous Activated Carbon Catalysts. Materials 2019, 12, 2204. https://doi.org/10.3390/ma12132204
Palomo J, Rodríguez-Mirasol J, Cordero T. Methanol Dehydration to Dimethyl Ether on Zr-Loaded P-Containing Mesoporous Activated Carbon Catalysts. Materials. 2019; 12(13):2204. https://doi.org/10.3390/ma12132204
Chicago/Turabian StylePalomo, José, José Rodríguez-Mirasol, and Tomás Cordero. 2019. "Methanol Dehydration to Dimethyl Ether on Zr-Loaded P-Containing Mesoporous Activated Carbon Catalysts" Materials 12, no. 13: 2204. https://doi.org/10.3390/ma12132204