
High Resolution Modeling of the Impacts of Exogenous Factors on Power Systems—Case Study of Germany


Abstract
:1. Introduction
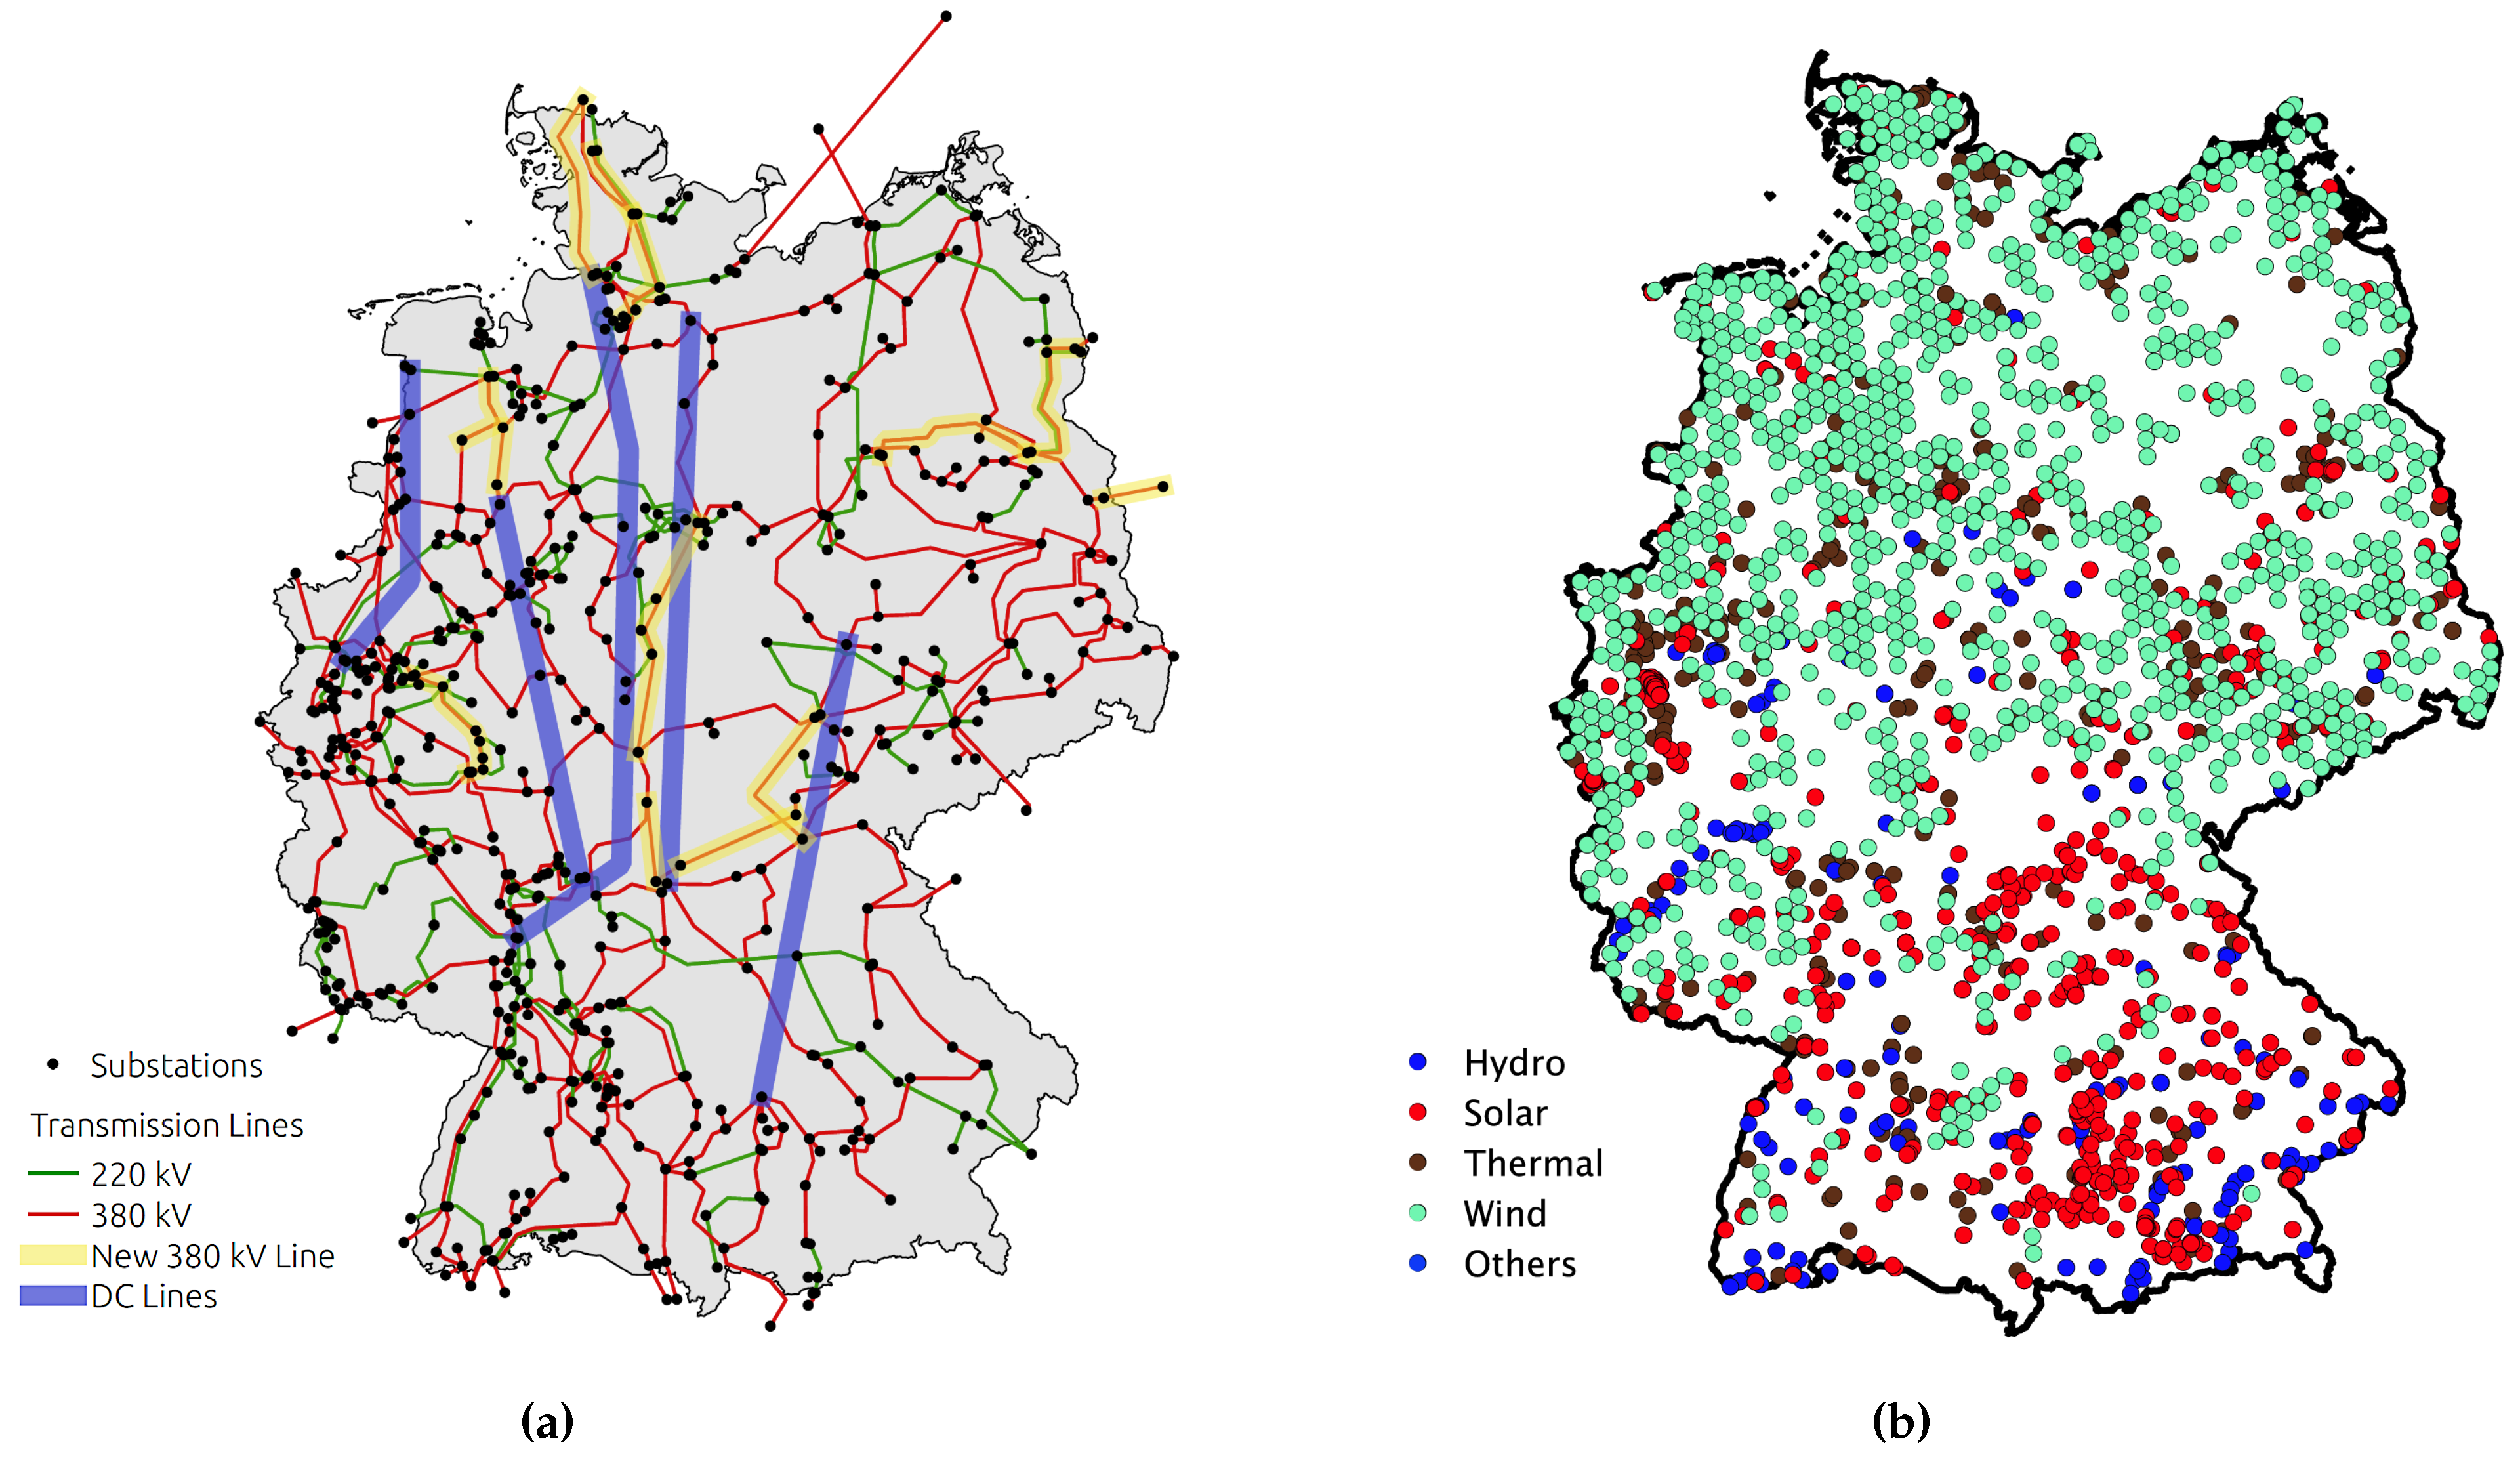
2. Methodology
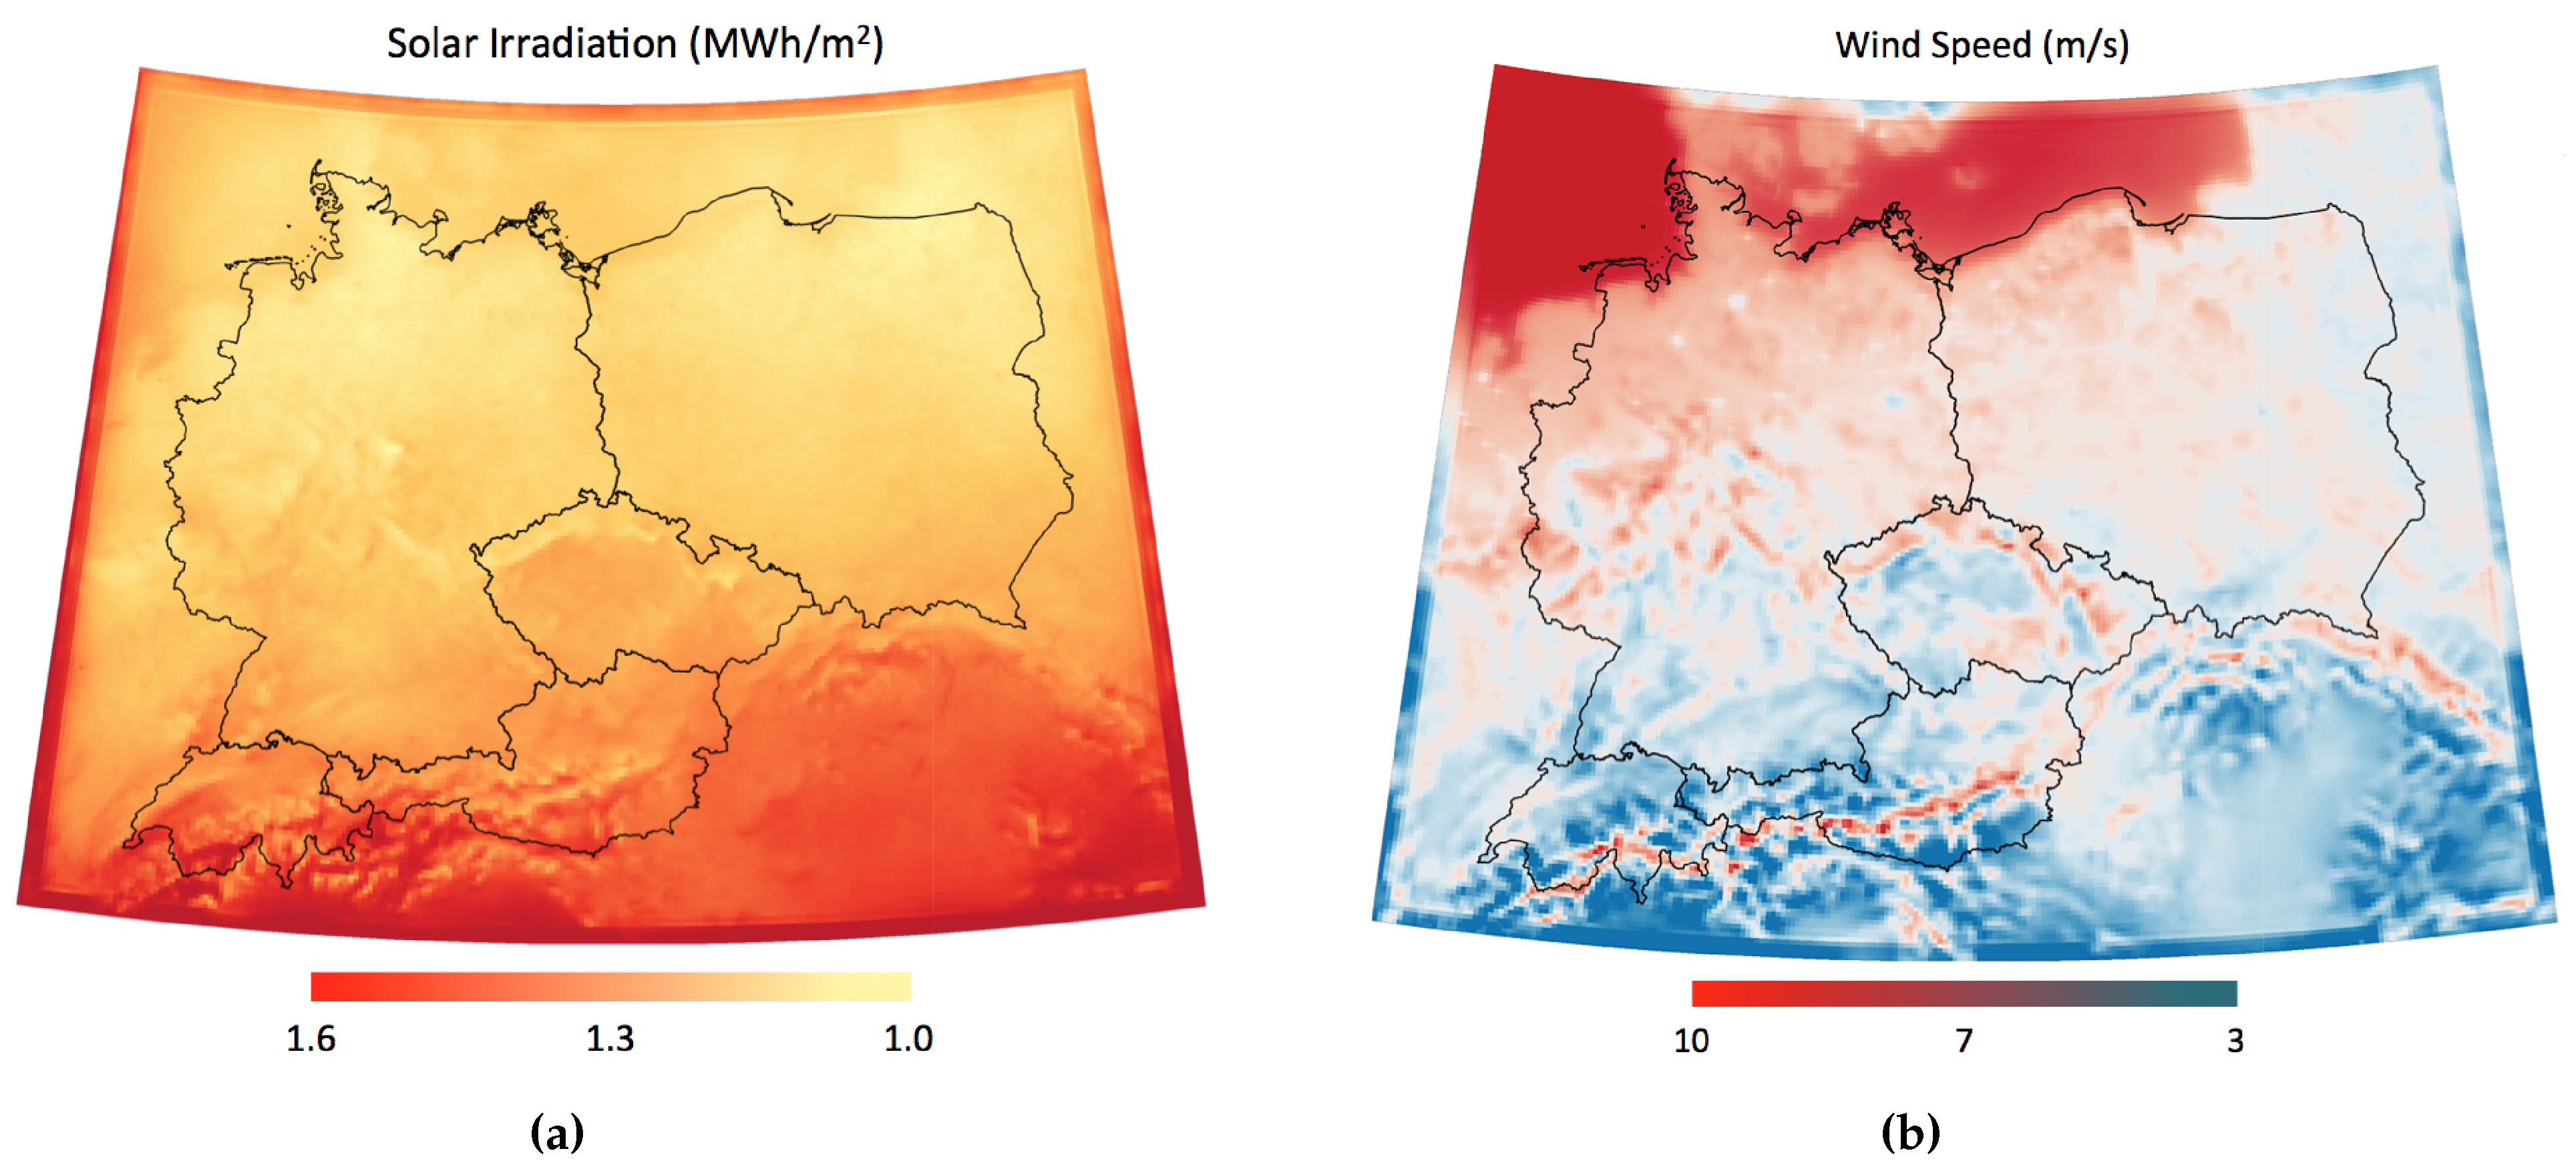
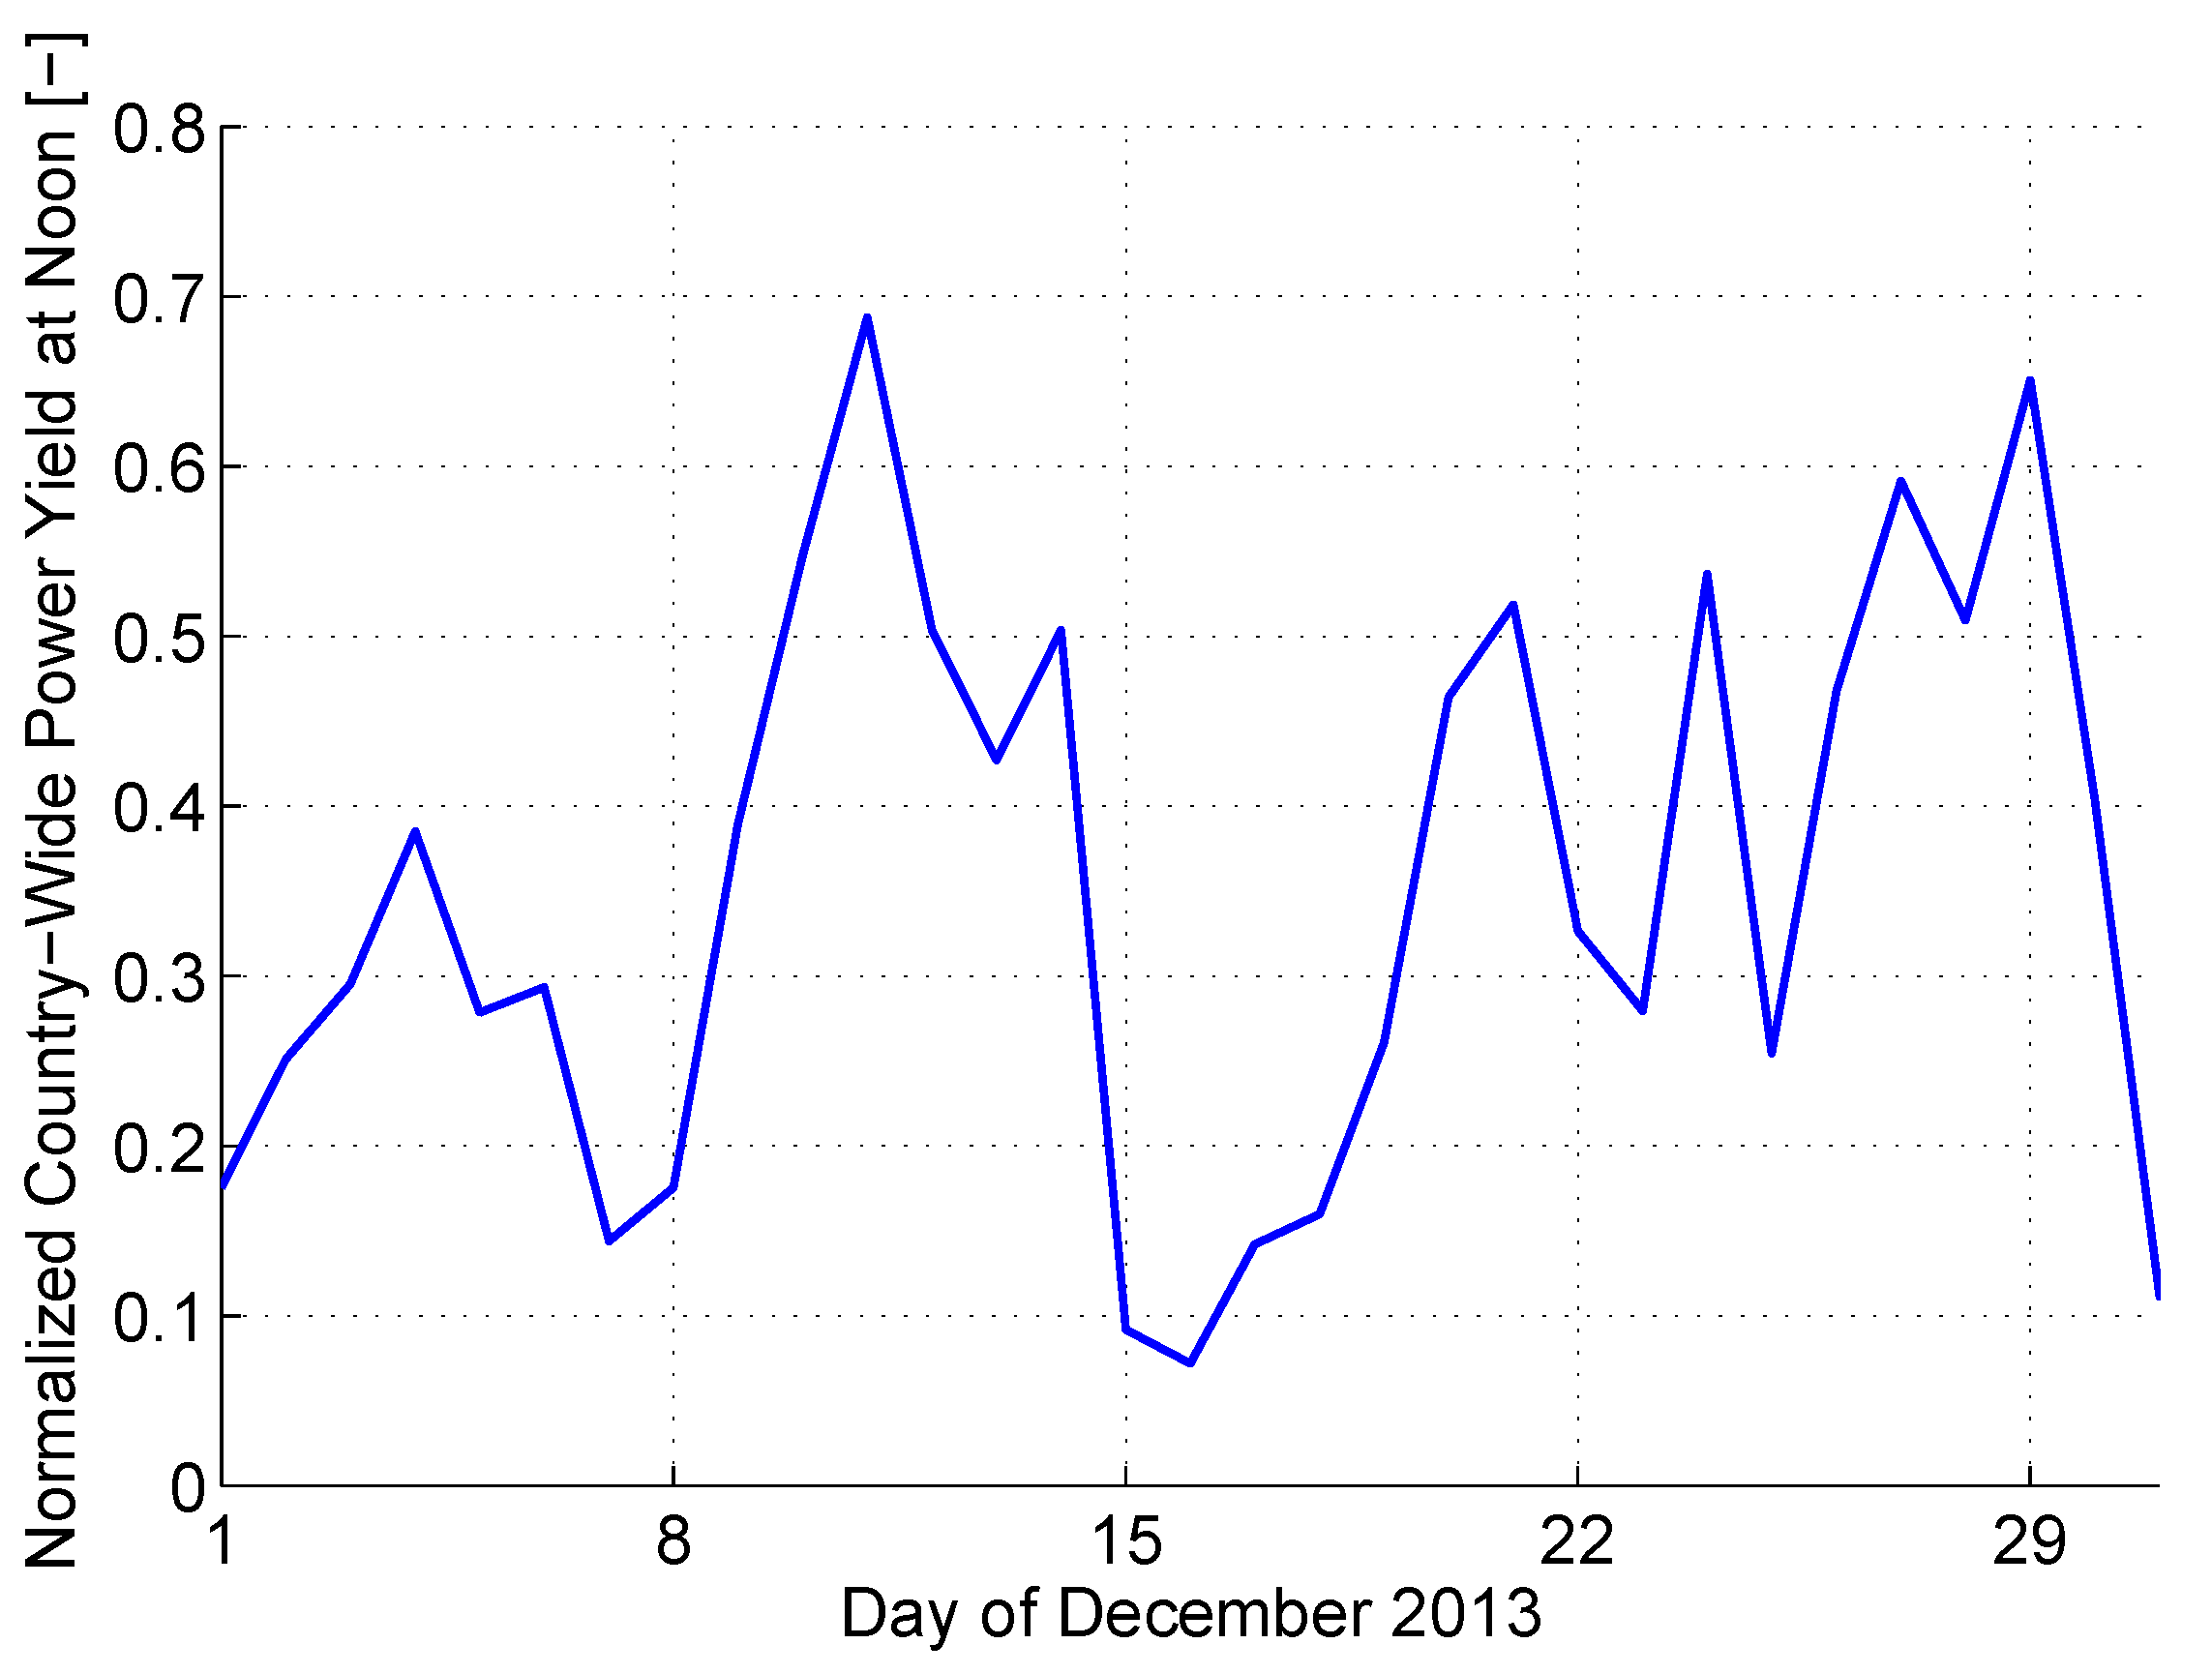
2.1. Modeling Renewables


2.2. Demand Modeling
2.3. Scenarios

| Generator | Cumulative Installed Capacity (GW) | |
|---|---|---|
| 2013 | 2020 | |
| Nuclear | 12.1 | 0.0 |
| Lignite | 19.8 | 18.6 |
| Coal | 27.2 | 30.5 |
| Gas | 26.0 | 24.0 |
| Wind | 33.6 | 49.3 |
| Photovoltaic | 30.3 | 47.8 |
| Biomass | 5.9 | 7.5 |
| Hydro | 4.4 | 4.5 |
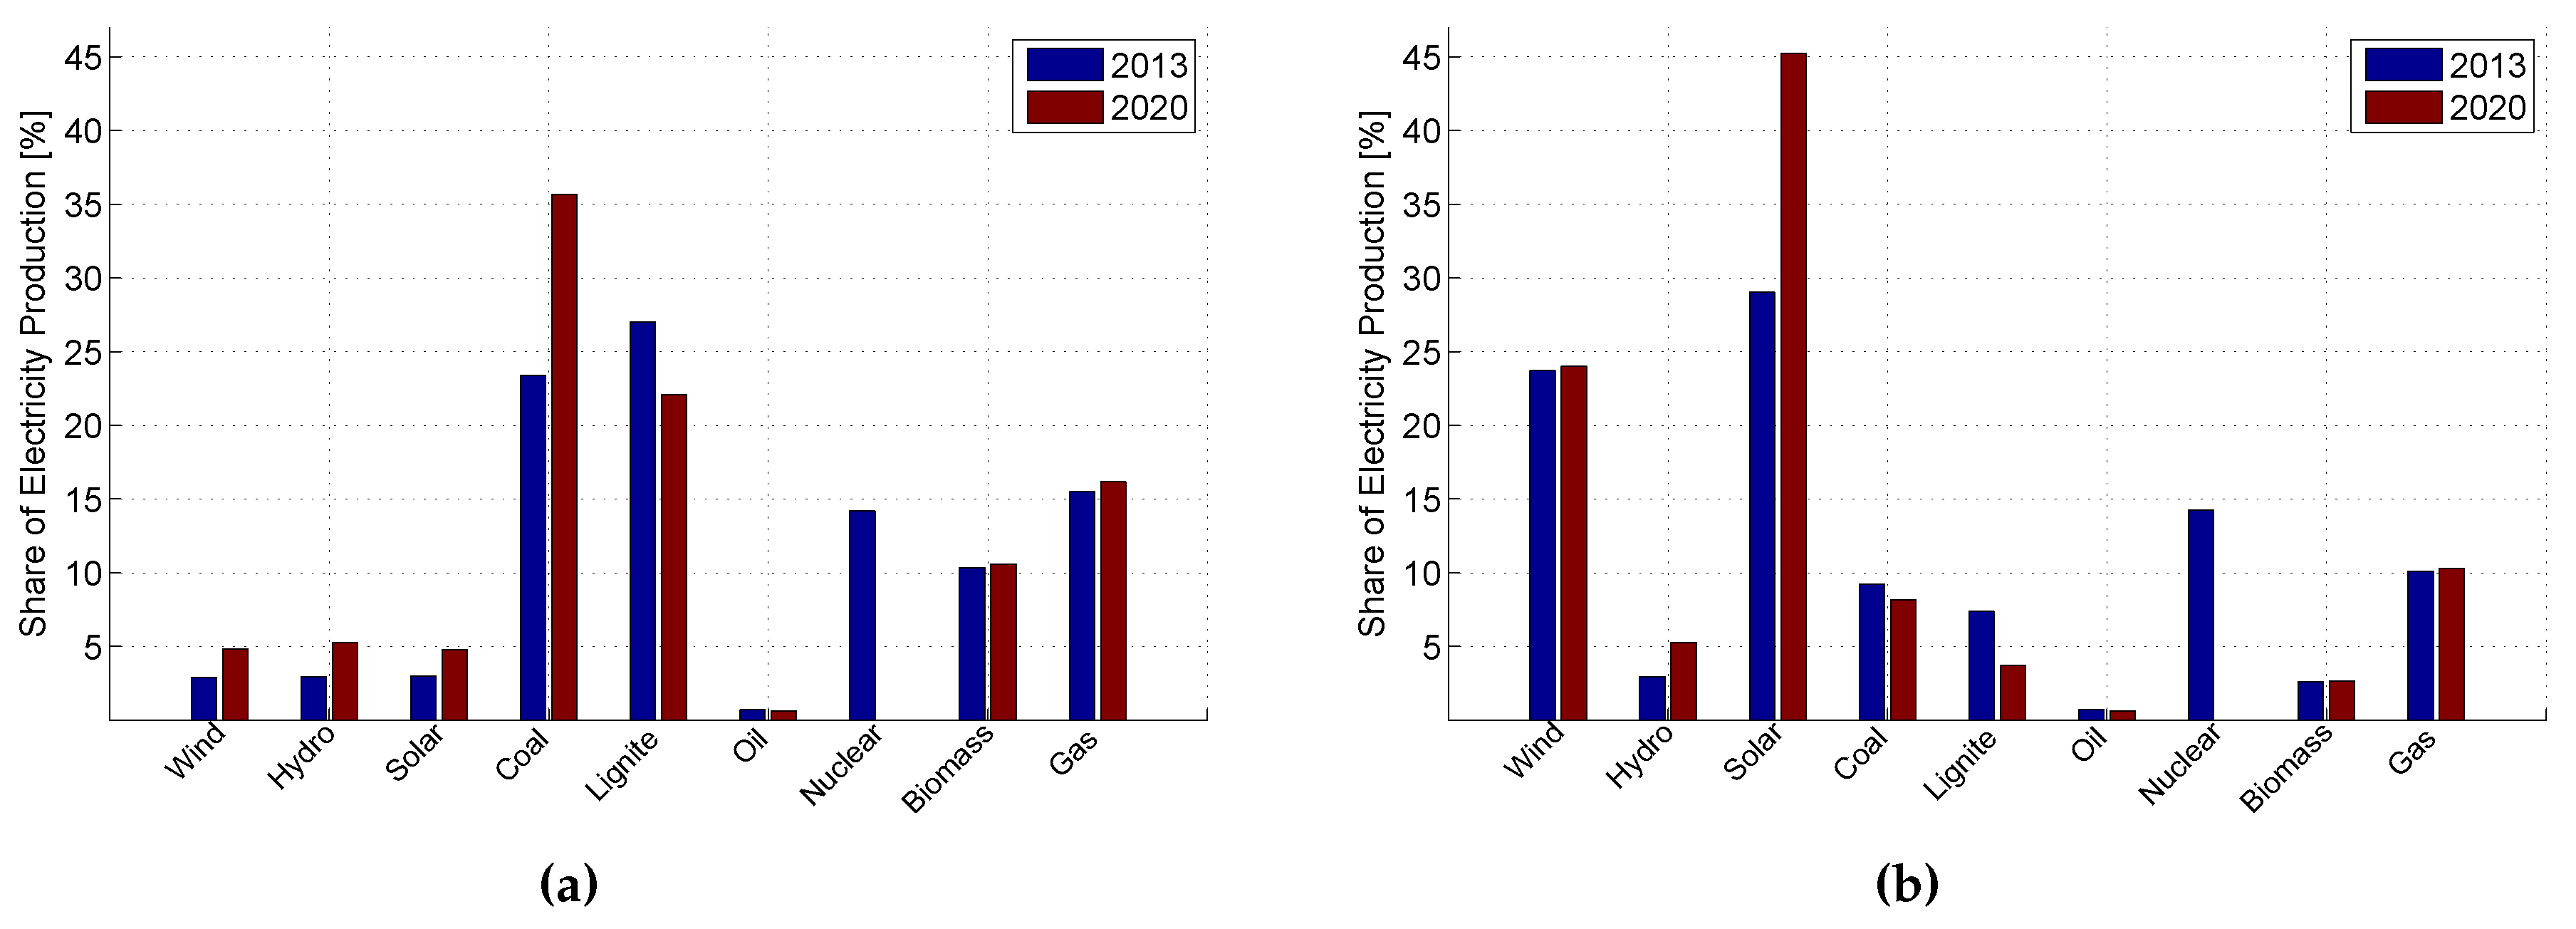
3. Results and Discussion
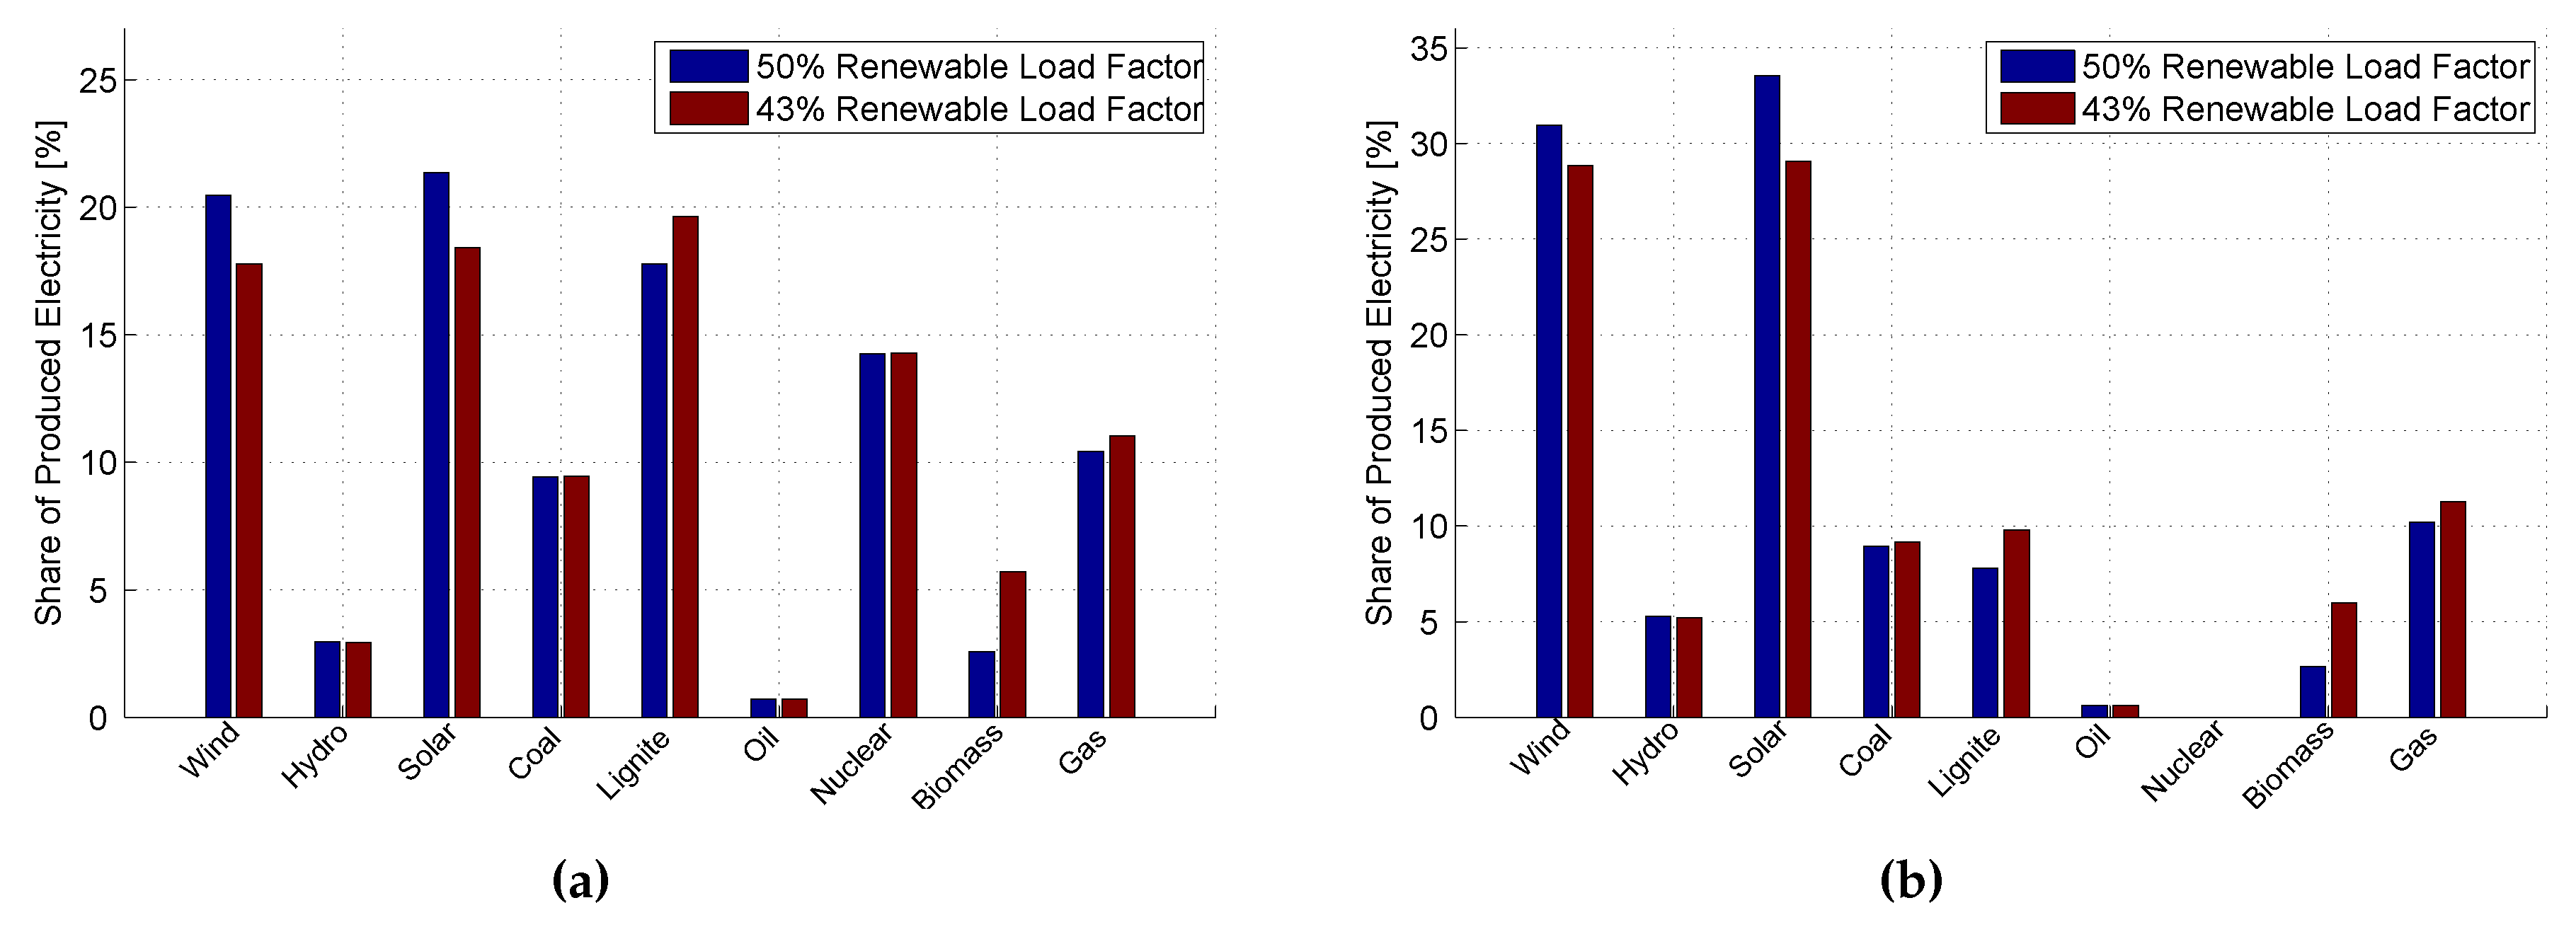
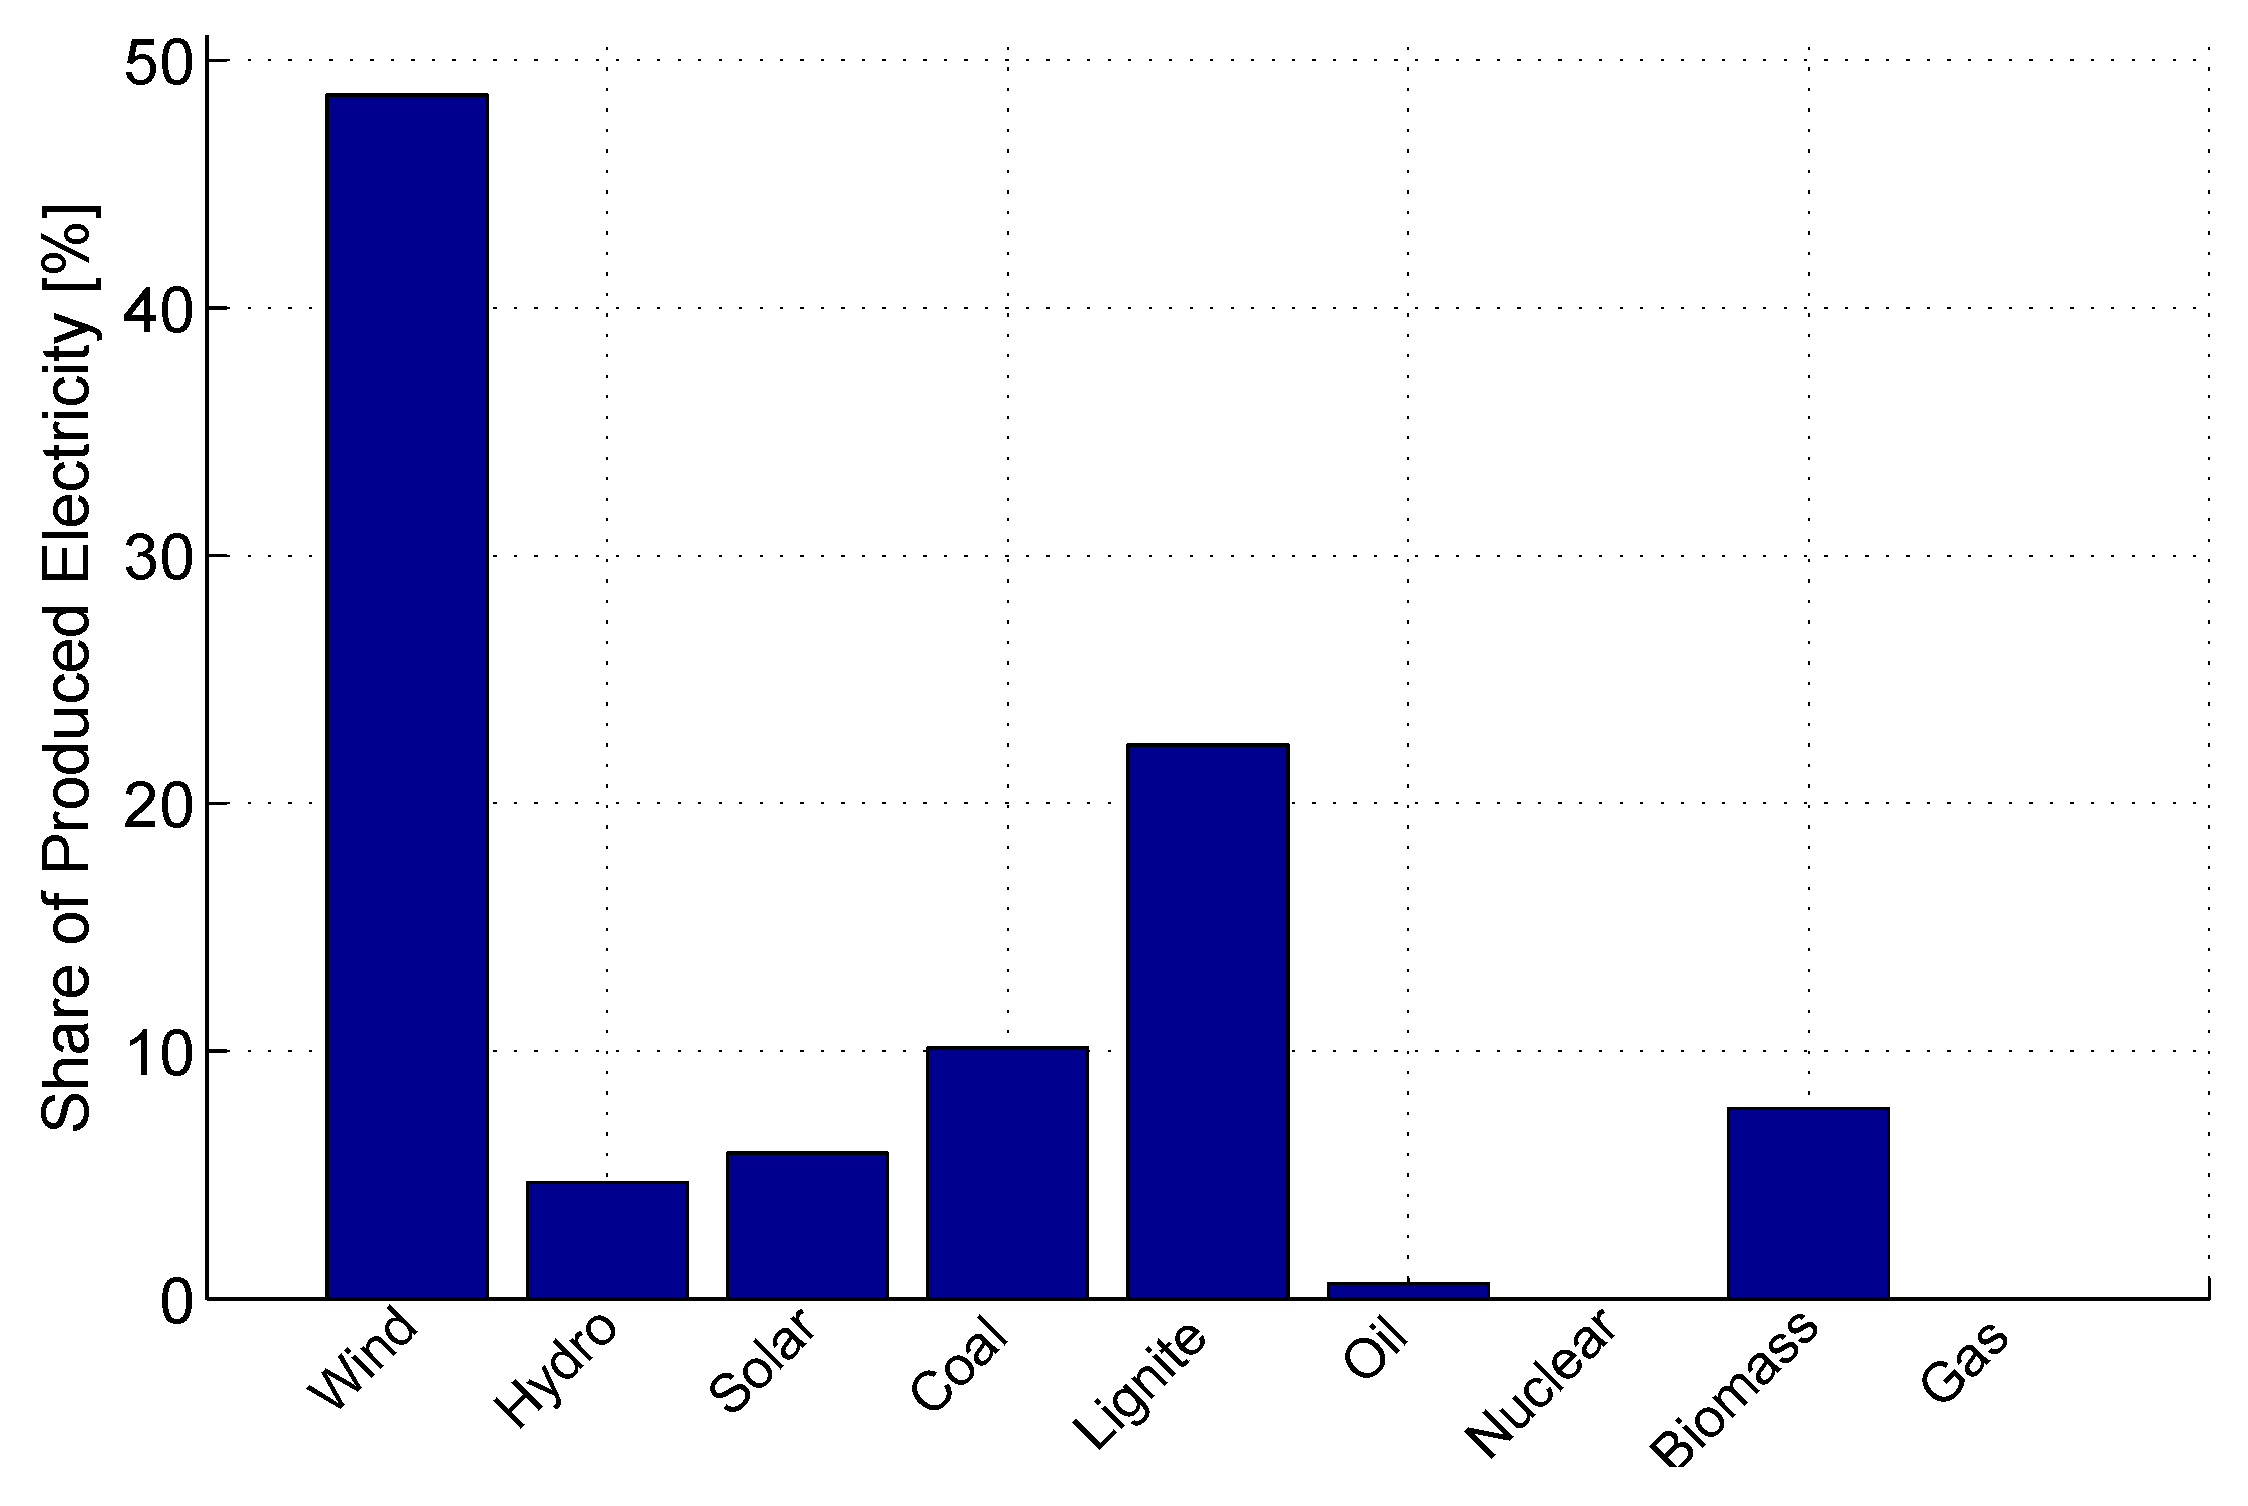
3.1. Impact of Increased Variability of Power Generators


| Scenario | Renewables | Electricity Price (% of Mean) | |||
|---|---|---|---|---|---|
| Minimum | Maximum | ||||
| 2013 | 2020 | 2013 | 2020 | ||
| 1 | 7% | 91 | 109 | ||
| 2 | 7% | 92 | 110 | ||
| 3 | 68% | 76 | 110 | ||
| 4 | 68% | 94 | 103 | ||

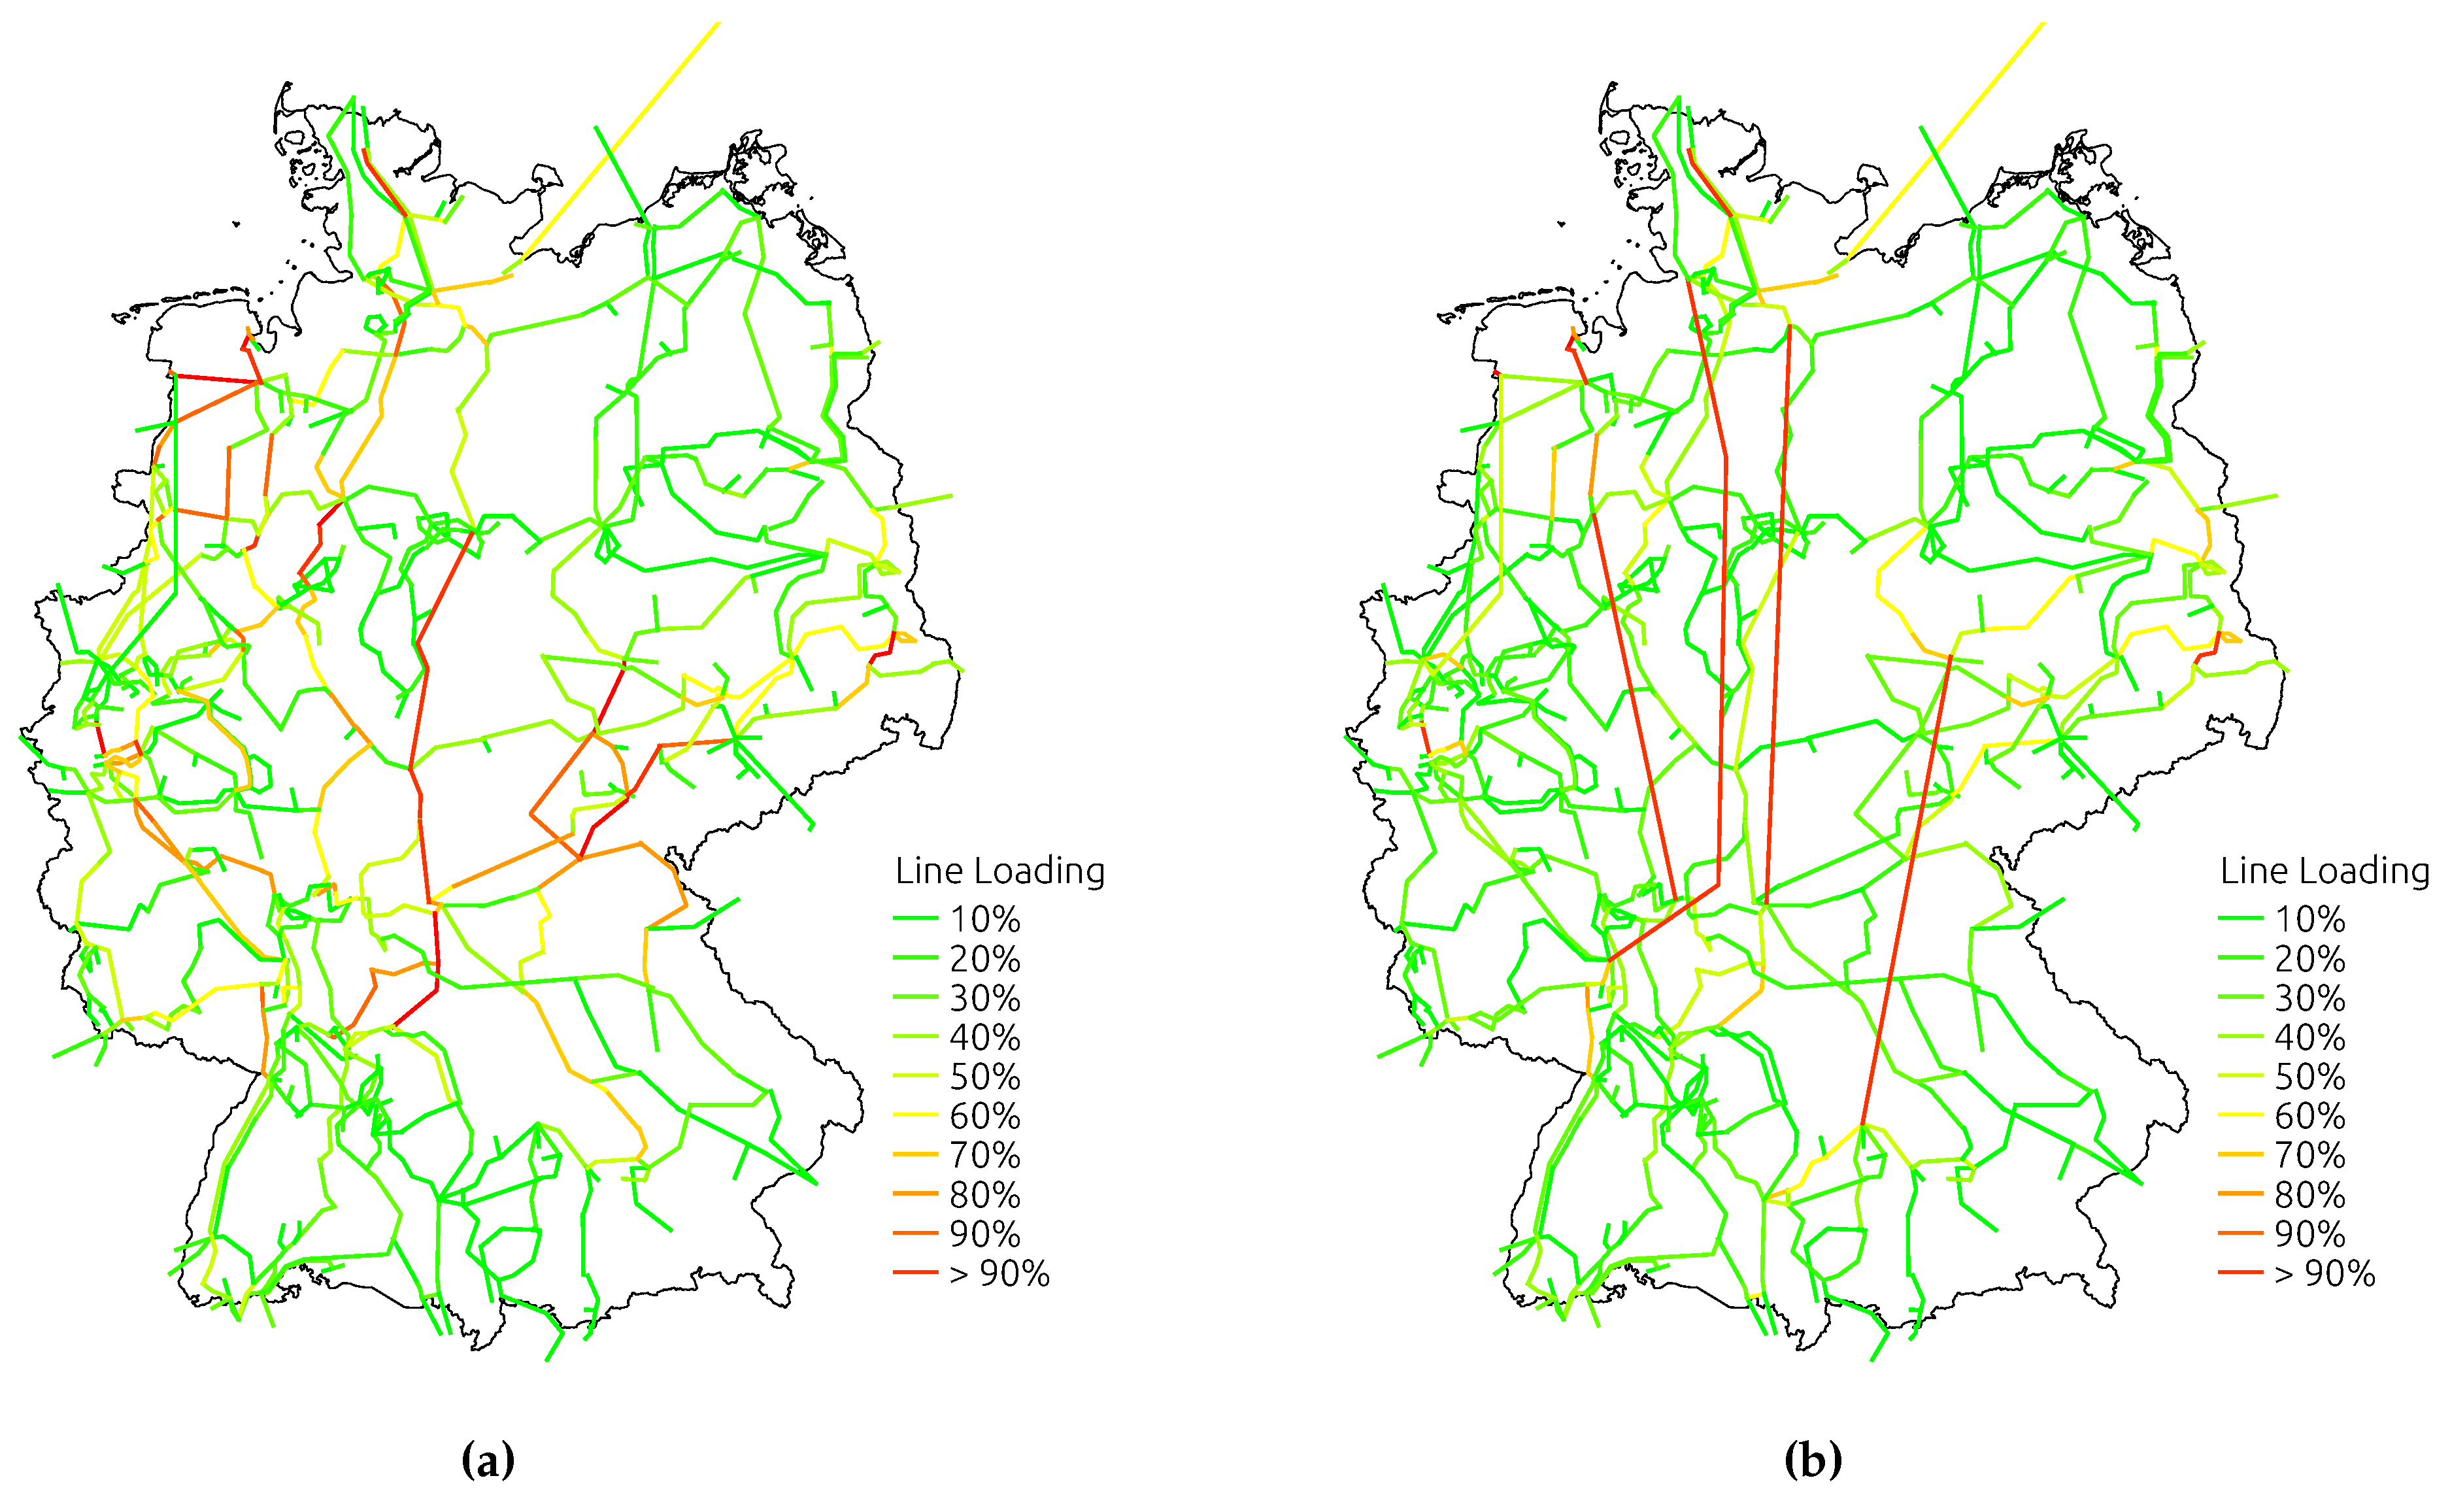
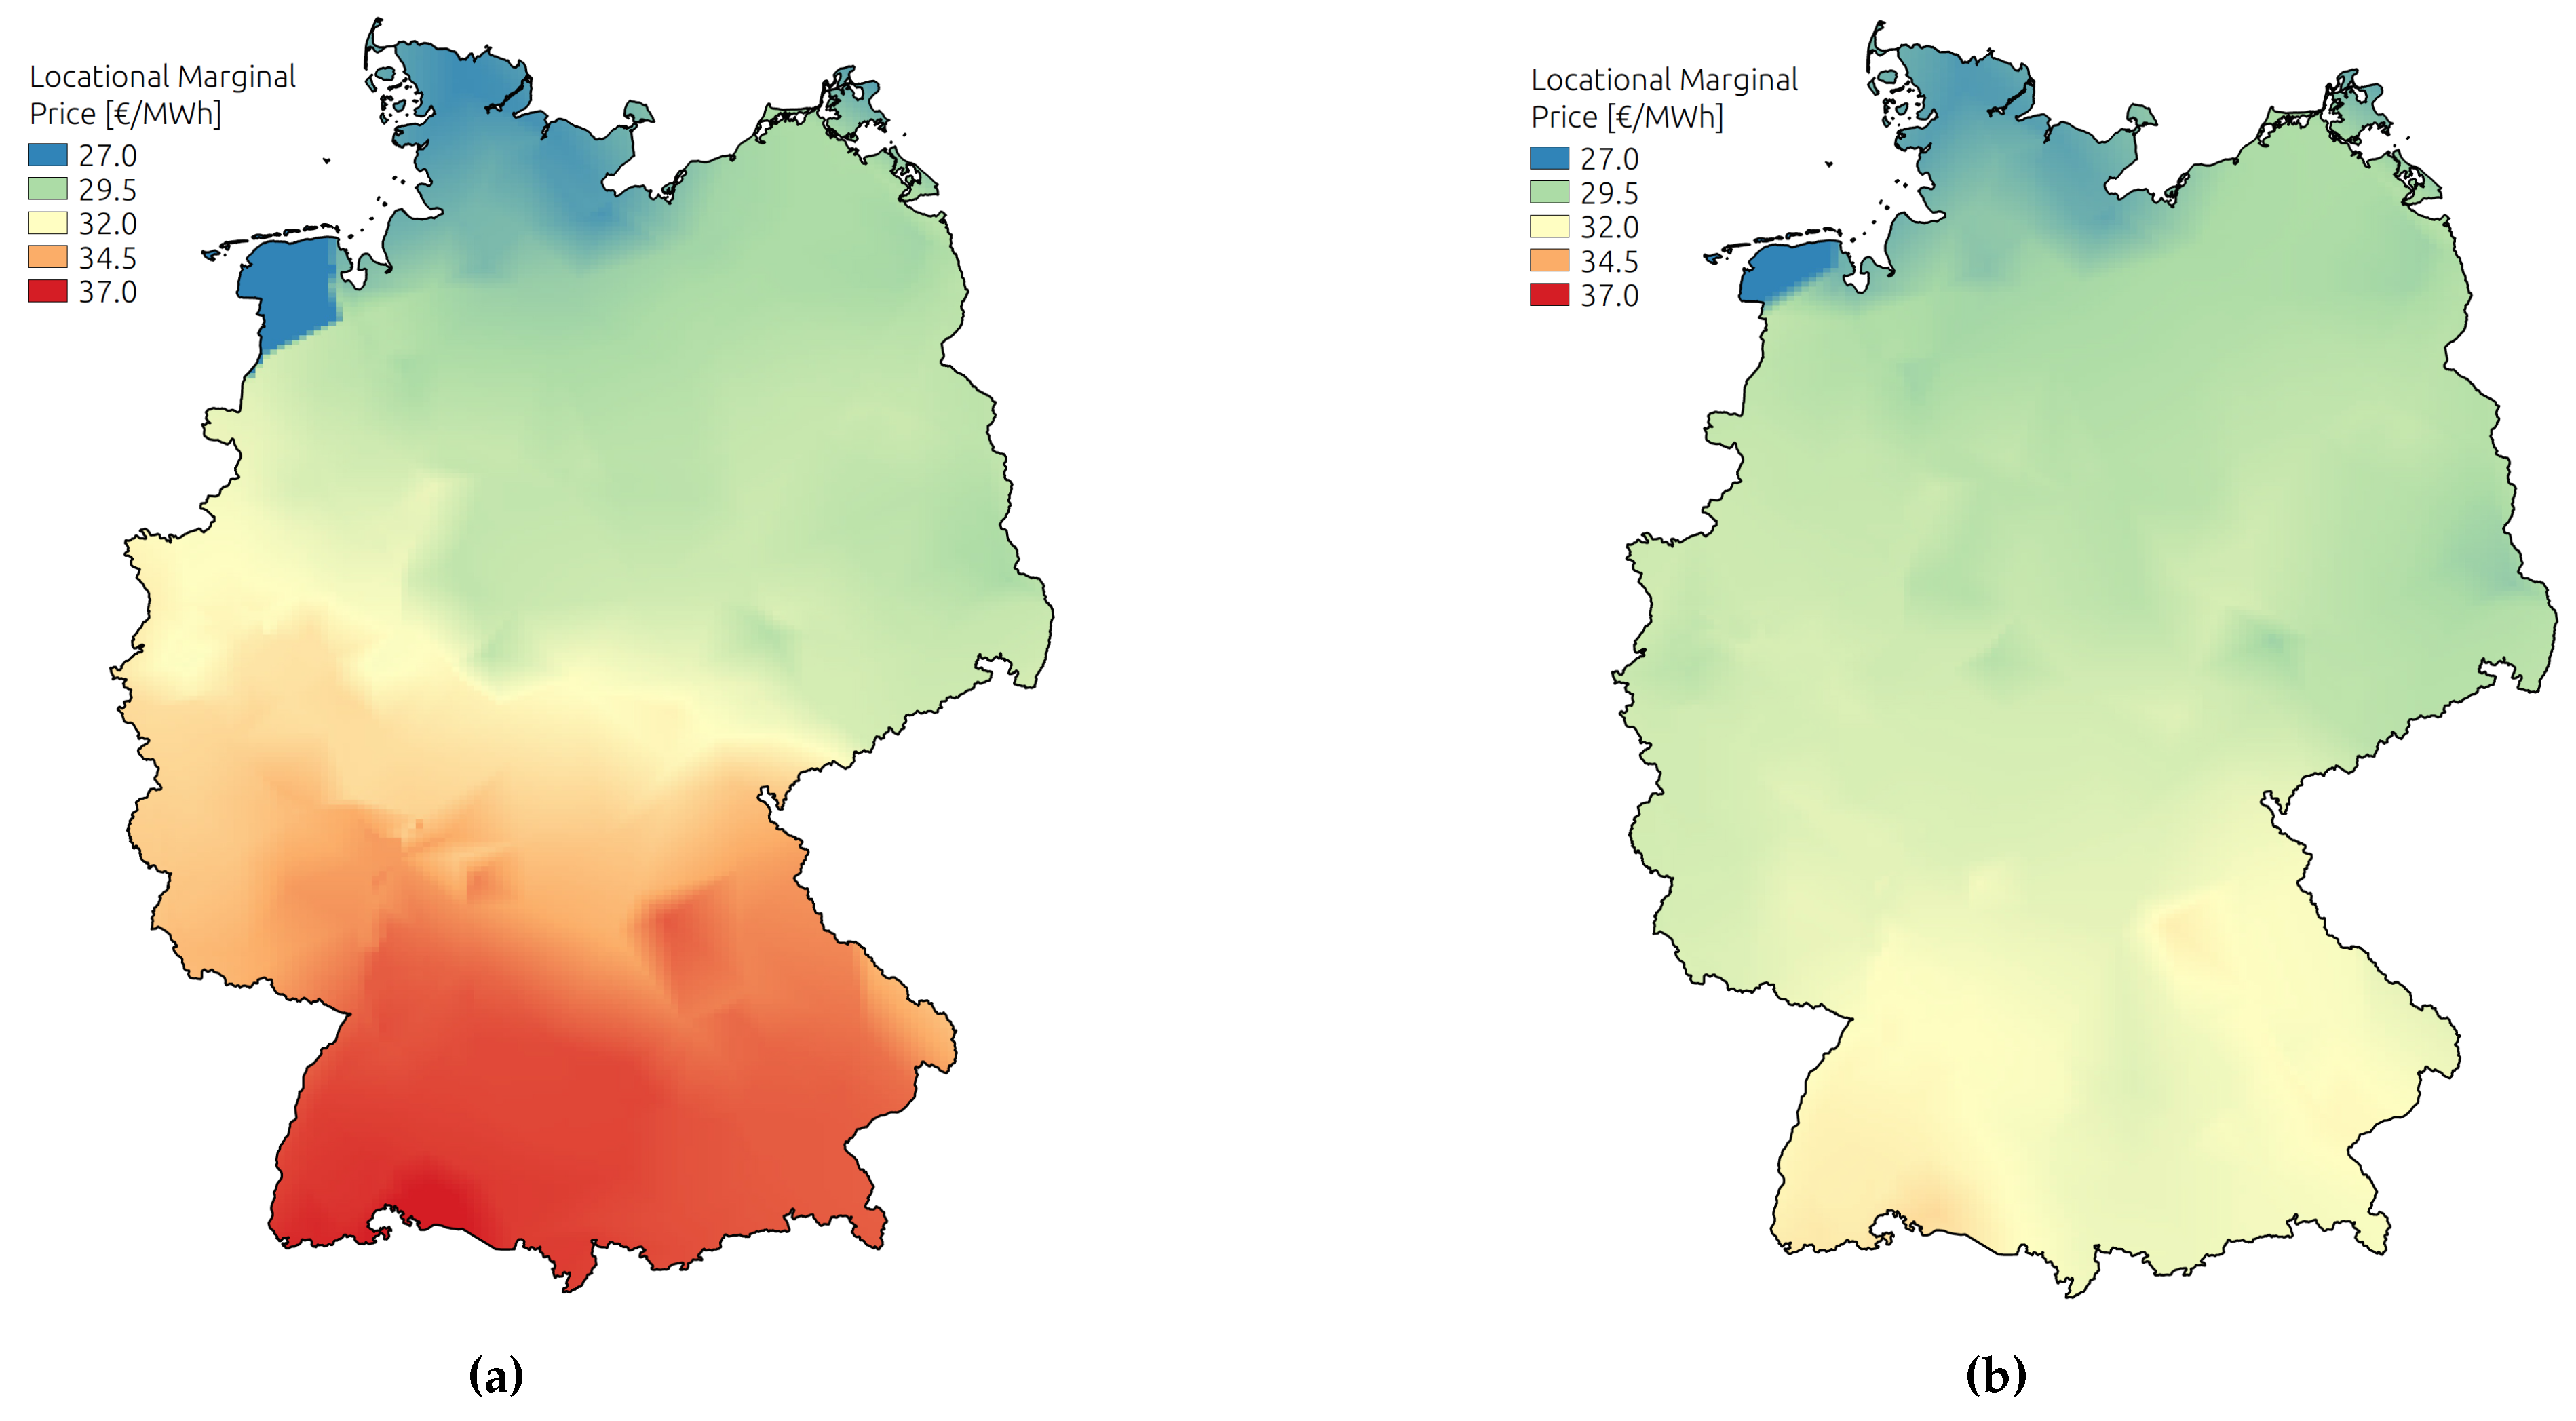
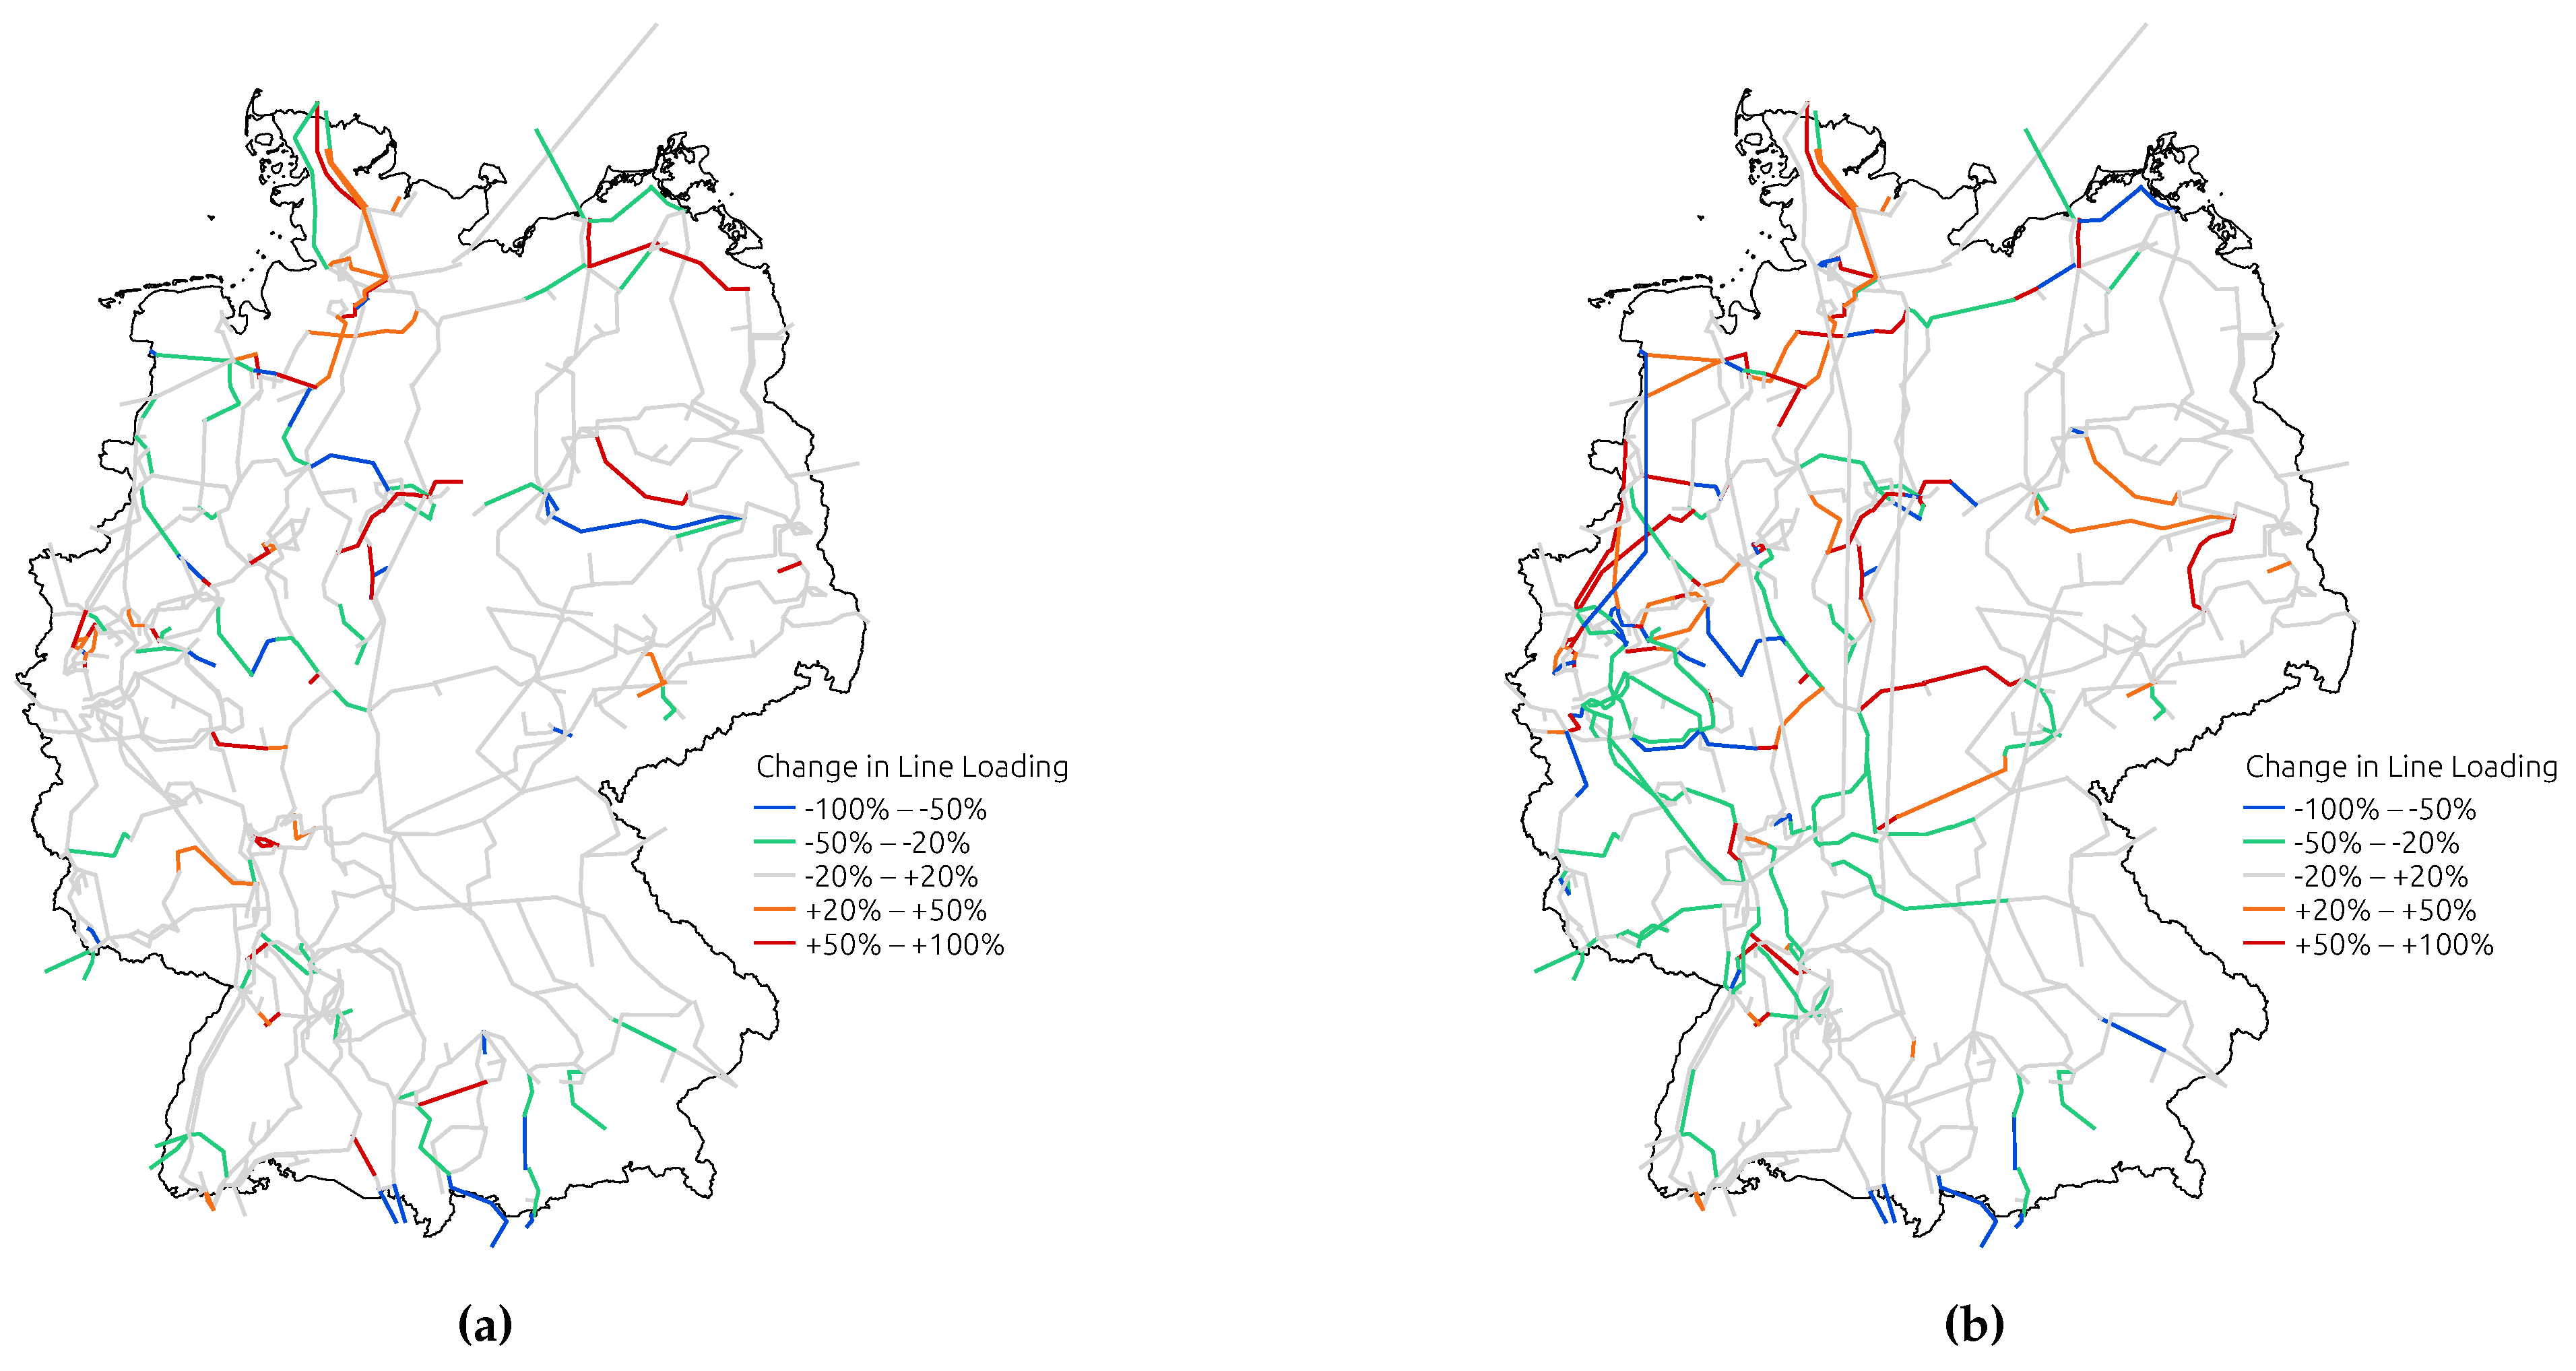
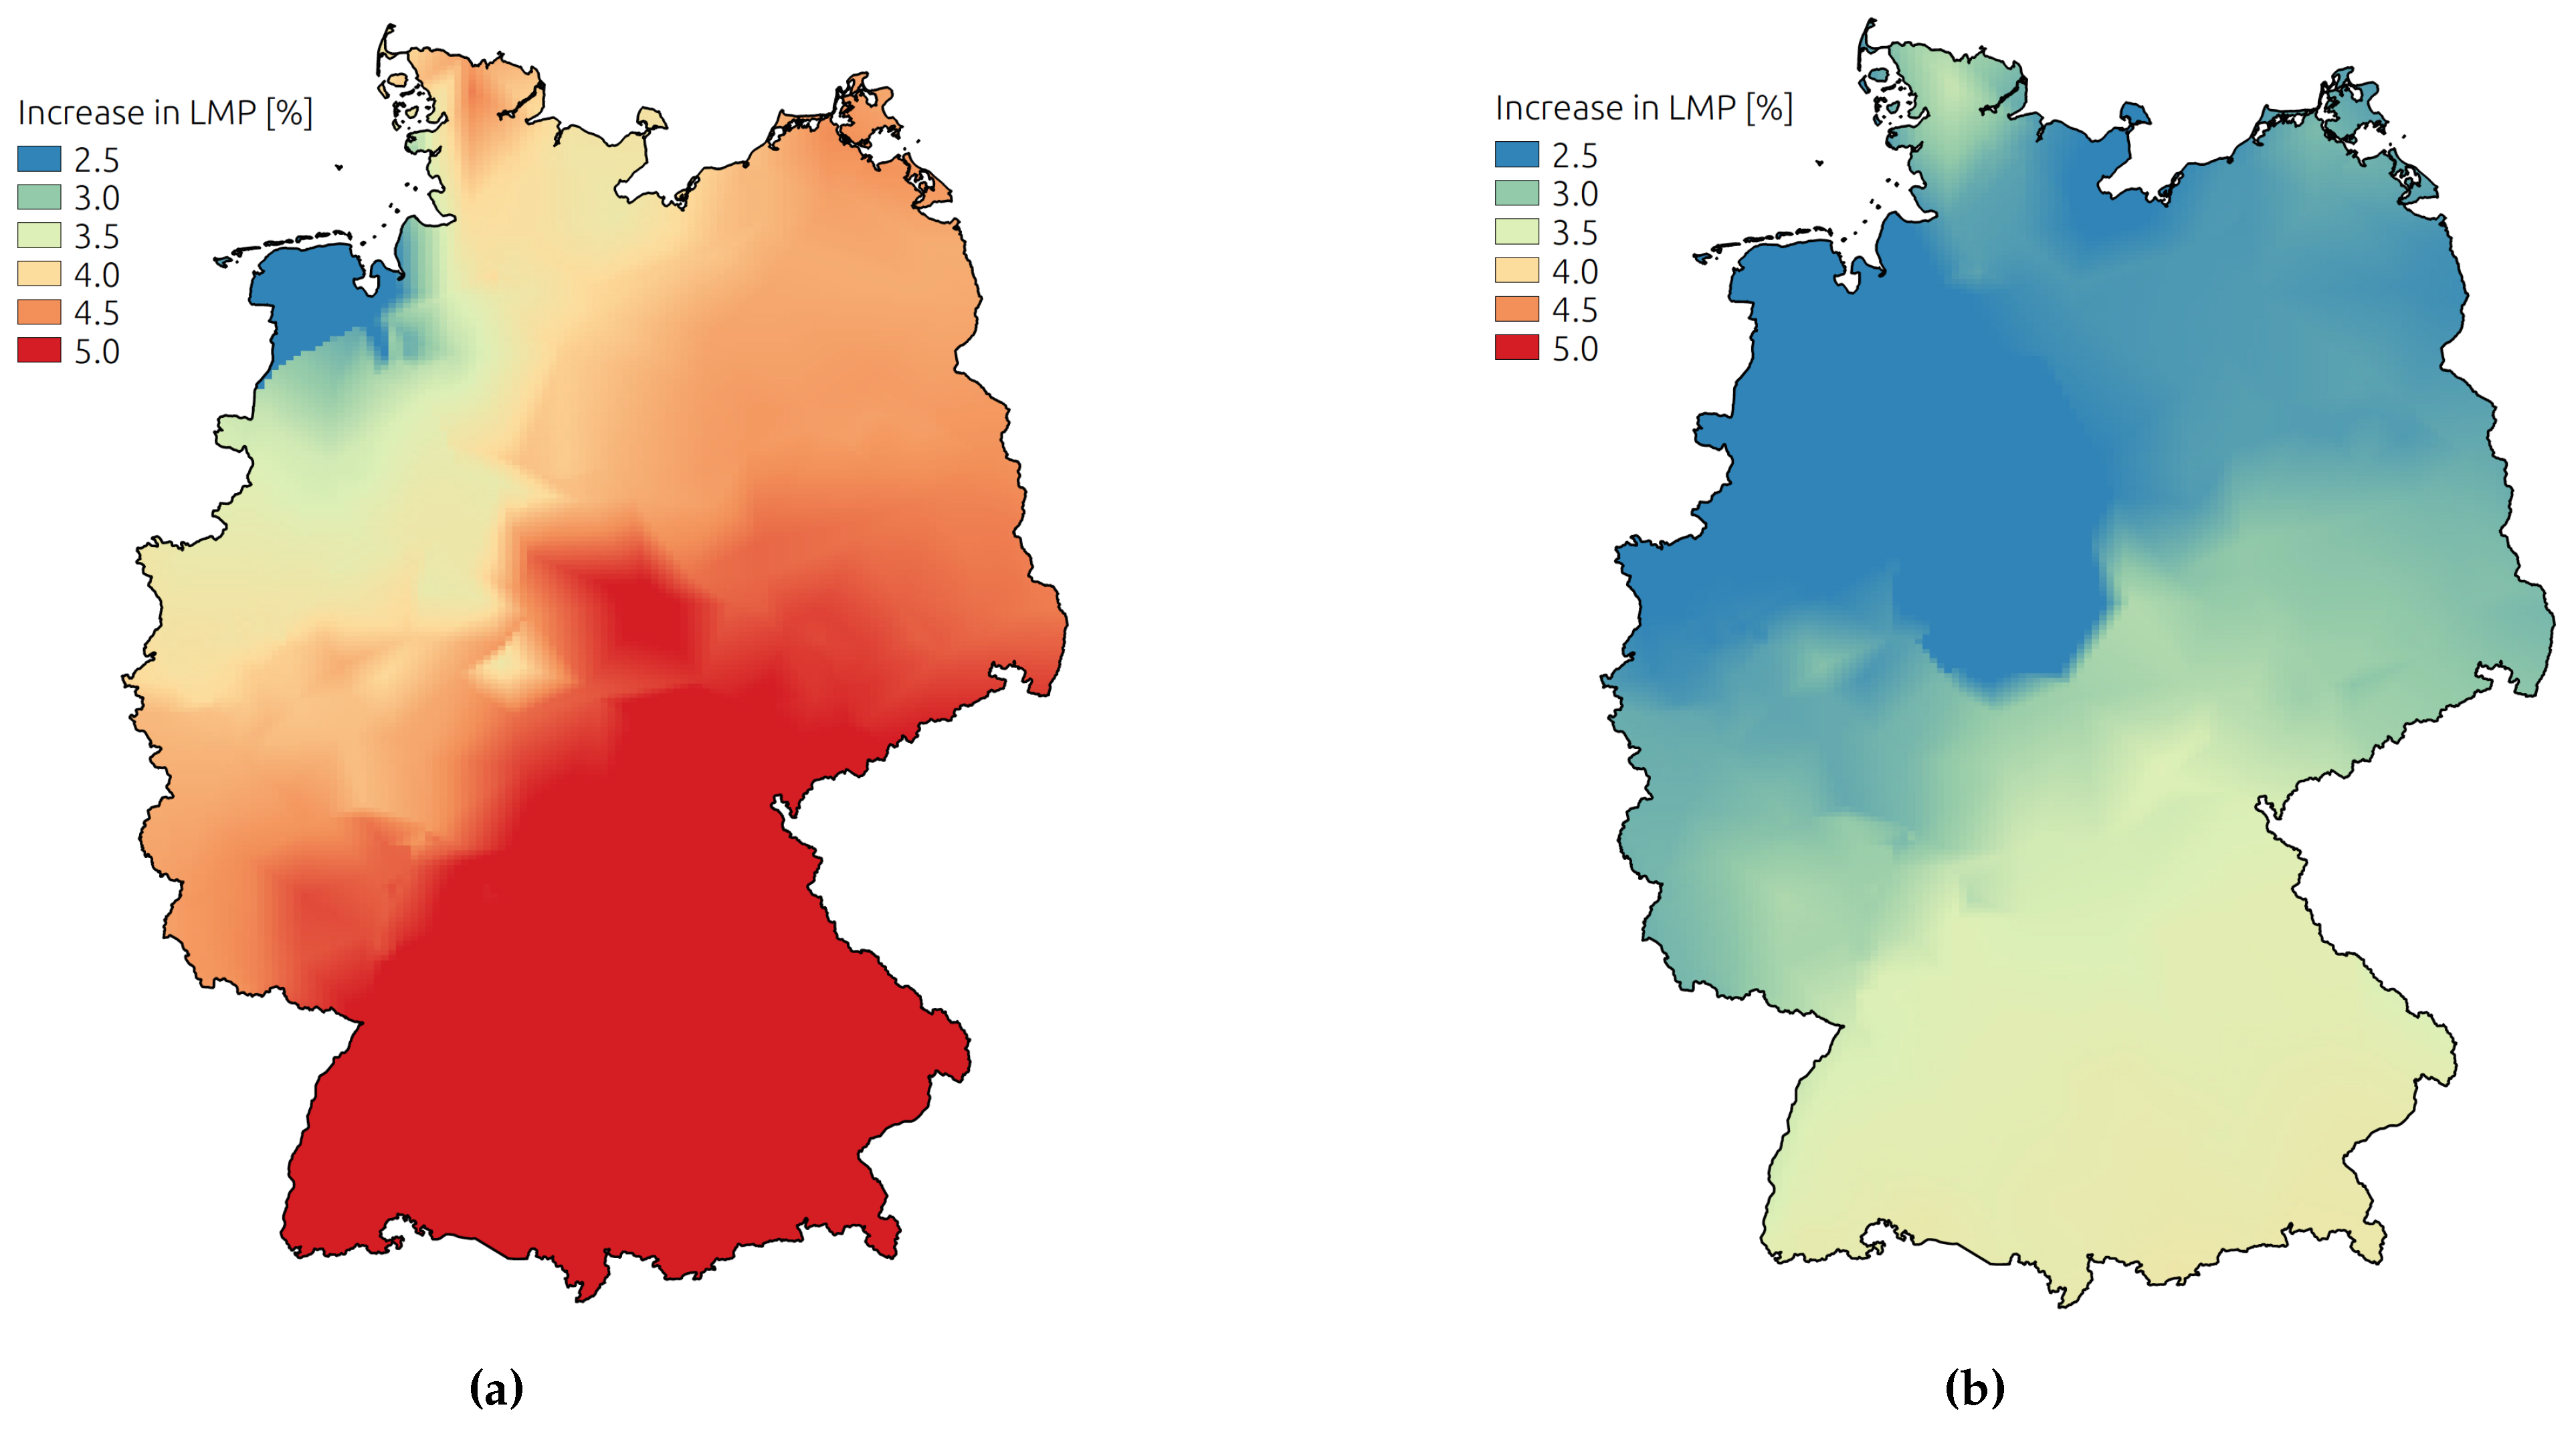
3.2. Impact of Grid Reinforcement with High Penetration of Renewables

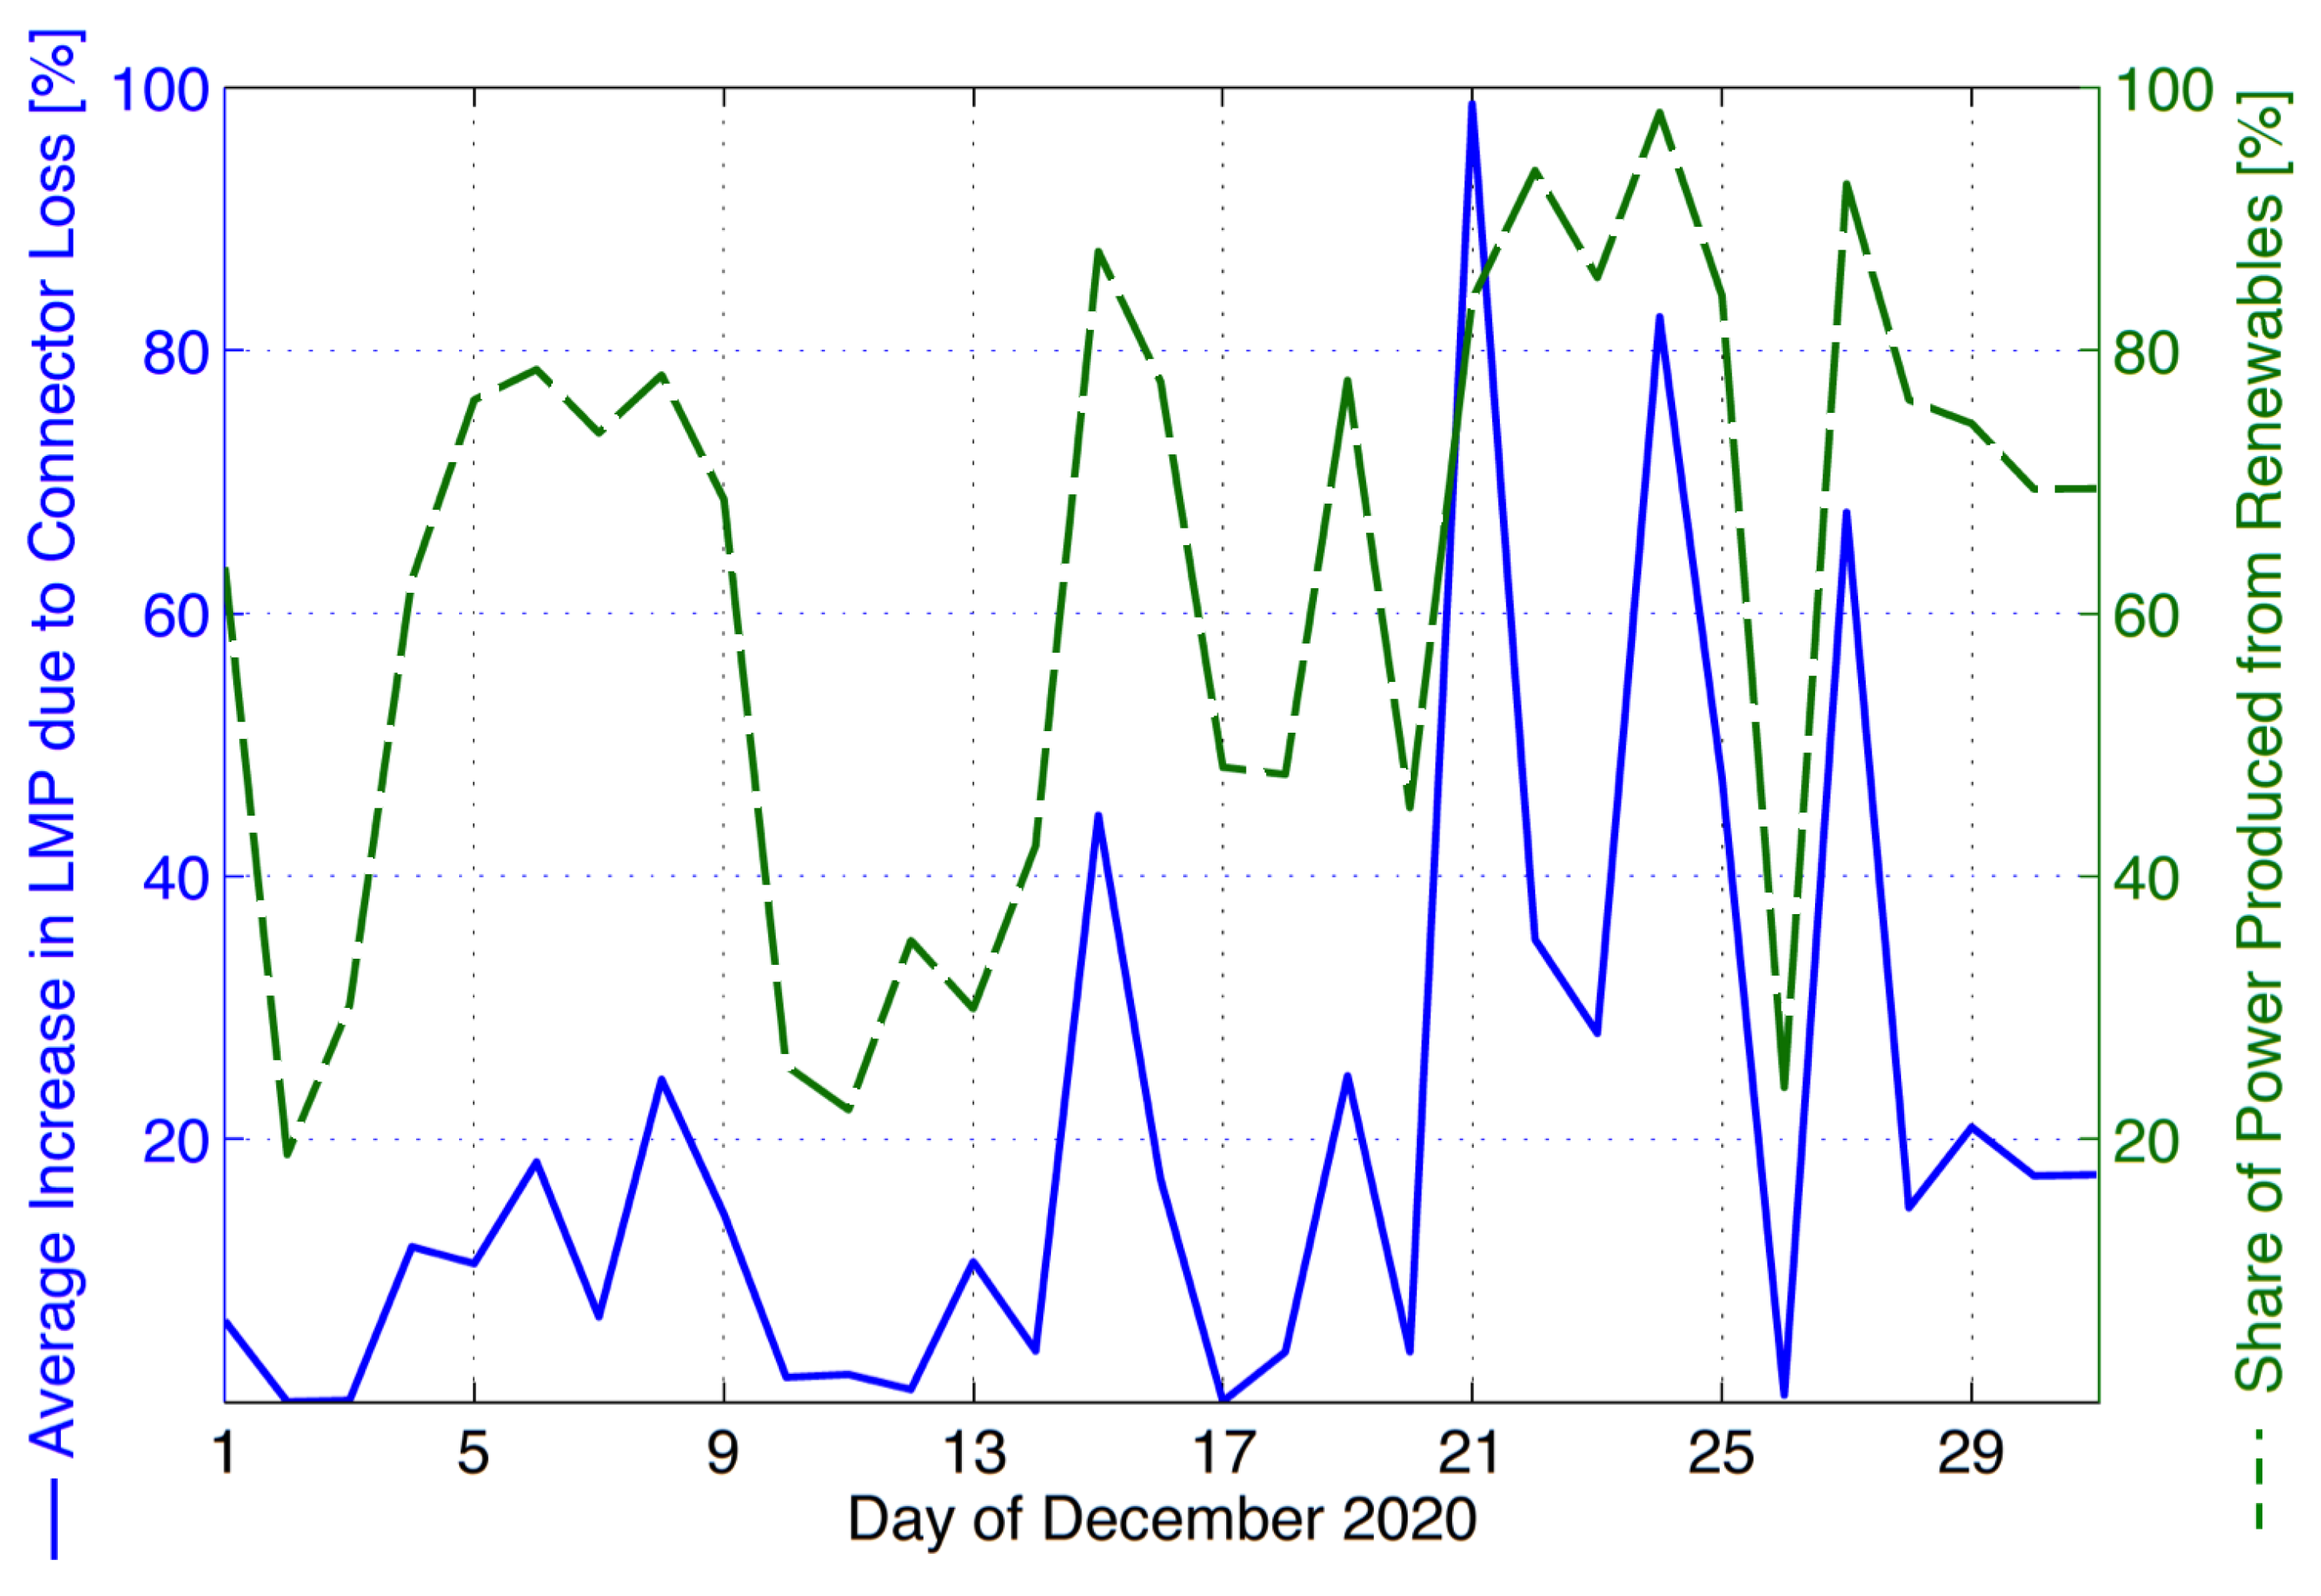
3.3. Impact of Contingency on Germany’s Transmission System


4. Conclusions
Author Contributions
Conflicts of Interest
References
- European Parliament. Directive 2009/28/EC of the European Parliament and of the Council; European Parliament: Brussels, Belgium, 2008. [Google Scholar]
- Federal Republic of Germany. German National Renewable Energy Action Plan; Federal Republic of Germany: Berlin, Germany, 2010. [Google Scholar]
- Bundesnetzagentur. Monitoringbericht. 2014. Available online: http://www.bundesnetzagentur.de/ (accessed on 10 April 2015).
- Buchan, D. The Energiewende-Germany’s Gamble; The Oxford Institute for Energy Studies, Oxford University: Oxford, UK, 2012. [Google Scholar]
- Singh, A.; Willi, D.; Chokani, N.; Abhari, R.S. Increasing on-shore wind generated electricity in germany’s transmission grid. J. Eng. Gas Turbines Power 2014, 137. [Google Scholar] [CrossRef]
- International Electrotechnical Commission. Grid Integration of Large-Capacity Renewable Energy sources and Use of Large-Capacity Electrical Energy Storage. Available online: http://www.iec.ch/whitepaper/ (accessed on 25 June 2015).
- Cochran, J.; Bird, L.; Heeter, J.; Arent, D.J. Integrating Variable Renewable Energy in Electric Power Markets: Best Practices from International Experience; National Renewable Energy Laboratory (NREL): Golden, CO, USA, 2012. [Google Scholar]
- Kumar, N.; Besuner, P.; Lefton, S.; Agan, D.; Hilleman, D. Power Plant Cycling Costs; AES12047831-2-1; National Renewable Energy Laboratory: Golden, CO, USA.
- German Energy Agency. Dena Grid Study II—Integration of Renewable Energy Sources in the German Power Supply System From 2015–2020 With an Outlook to 2025; Deutsche Energie-Agentur GmbH (dena): Berlin, Germany, 2010. [Google Scholar]
- Rodríguez, R.; Becker, S.; Andresen, G.B.; Heide, D.; Greiner, M. Transmission needs across a fully renewable european power system. Renew. Energy 2014, 63, 467–476. [Google Scholar] [CrossRef]
- Huber, M.; Hamacher, T.; Ziems, C.; Weber, C. Combining LP and MIP approaches to model the impacts of renewable energy generation on individual thermal power plant operation. In Proceedings of the IEEE Power and Energy Society General Meeting (PES) General Meeting, 21 July 2013; pp. 1–5.
- Schaber, K.; Steinke, F.; Hamacher, T. Transmission grid extensions for the integration of variable renewable energies in Europe: Who benefits where? Energy Policy 2012, 33, 127–135. [Google Scholar] [CrossRef]
- Frías, P.; Linares, P.; Olmos, L.; Banez-Chicharro, M.R.F.; Fernandes, C.; Klobasa, M.; Winkler, J.; Ortner, A.; Papaefthymiou, G. Assessment Report on the Impacts of RES Policy Design Options on Future Electricity Markets. The beyond2020 Project, D5.2 Report. Available online: http://www.res-policy-beyond2020.eu/ (accessed on 20 June 2015).
- Singh, A.; Willi, D.; Chokani, N.; Abhari, R.S. Optimal power flow analysis of Switzerland’s transmission system for long-term capacity planning. Renew. Energy Sustain. Rev. 2014, 34, 596–607. [Google Scholar] [CrossRef]
- Singh, A.; Eser, P.; Chokani, N.; Abhari, R.S. Improved modeling of demand and generation in high resolution simulations of interconnected power systems. In Proceedings of the IEEE Conference on the European Energy Markets, Lisbon, Portugal, 19–22 May 2015.
- Eser, P.; Singh, A.; Chokani, N.; Abhari, R.S. High resolution simulations of increased renewable penetration on central European transmission grid. In Proceedings of the IEEE Power and Energy Society General Meeting (PES) General Meeting, Denver, CO, USA, 26–30 July 2015.
- Zimmerman, R.D.; Murillo-Sanchez, C.E.; Thomas, R.J. MATPOWER: Steady-state operations, planning and analysis tools for power systems research and education. IEEE Trans. Power Syst. 2011, 26, 12–19. [Google Scholar] [CrossRef]
- ENTSO-E. Grid Map. Available online: https://www.entsoe.eu/publications/order-mapsandpublications/electronic-grid-maps/Pages/default.Aspx (accessed on 10 September 2014).
- Bundesnetzagentur. Kraftwerksliste. Available online: http://www.bundesnetzagentur.de/DE/Sachgebiete/ElektrizitaetundGas/Unternehmen_Institutionen/Versorgungssicherheit/ (accessed on 10 September 2014).
- Eser, P. Effect of Renewable Energy on Flexible Operation of Conventional Power Plants. Master’s Thesis, ETH Zurich, Zurich, Switzerland, 2014. [Google Scholar]
- Skamarock, W.C.; Klemp, J.B.; Dudhia, J.; Gill, D.O.; Barker, D.M.; Duda, M.G.; Huang, X.Y.; Wang, W.; Powers, J.G. A Description of the Advanced Research WRF Version 3; NCAR/TN-475+STR; Mesoscale and Microscale Meteorology Division, National Centre for Atmospheric Research: Boulder, CO, USA, 2008. [Google Scholar]
- BDEW. Standardlastprofile. Available online: https://www.bdew.de/internet.nsf/id/DE_Standartlastprofile (accessed on 15 August 2014).
- Using OpenStreetMap. OpenStreetMap Wiki. Available online: http://wiki.openstreetmap.org/w/index.php?title=Using_OpenStreetMap&oldid=1133349 (accessed on 5 July 2014).
- Singh, A.; Wolff, F.; Chokani, N.; Abhari, R.S. Optimizing synergy of utility-scale wind and pumped hydro storage. In Proceedings of the ASME Turbo Expo, San Antonio, TX, USA, 3–7 June 2013.
- Netzentwicklungsplan. Grid Development Plan 2014, Second Draft. Available online: http://www.netzentwicklungsplan.de/_NEP_file_transfer/NEP_2014_2_Entwurf_Teil1.pdf (accessed on 10 July 2014).
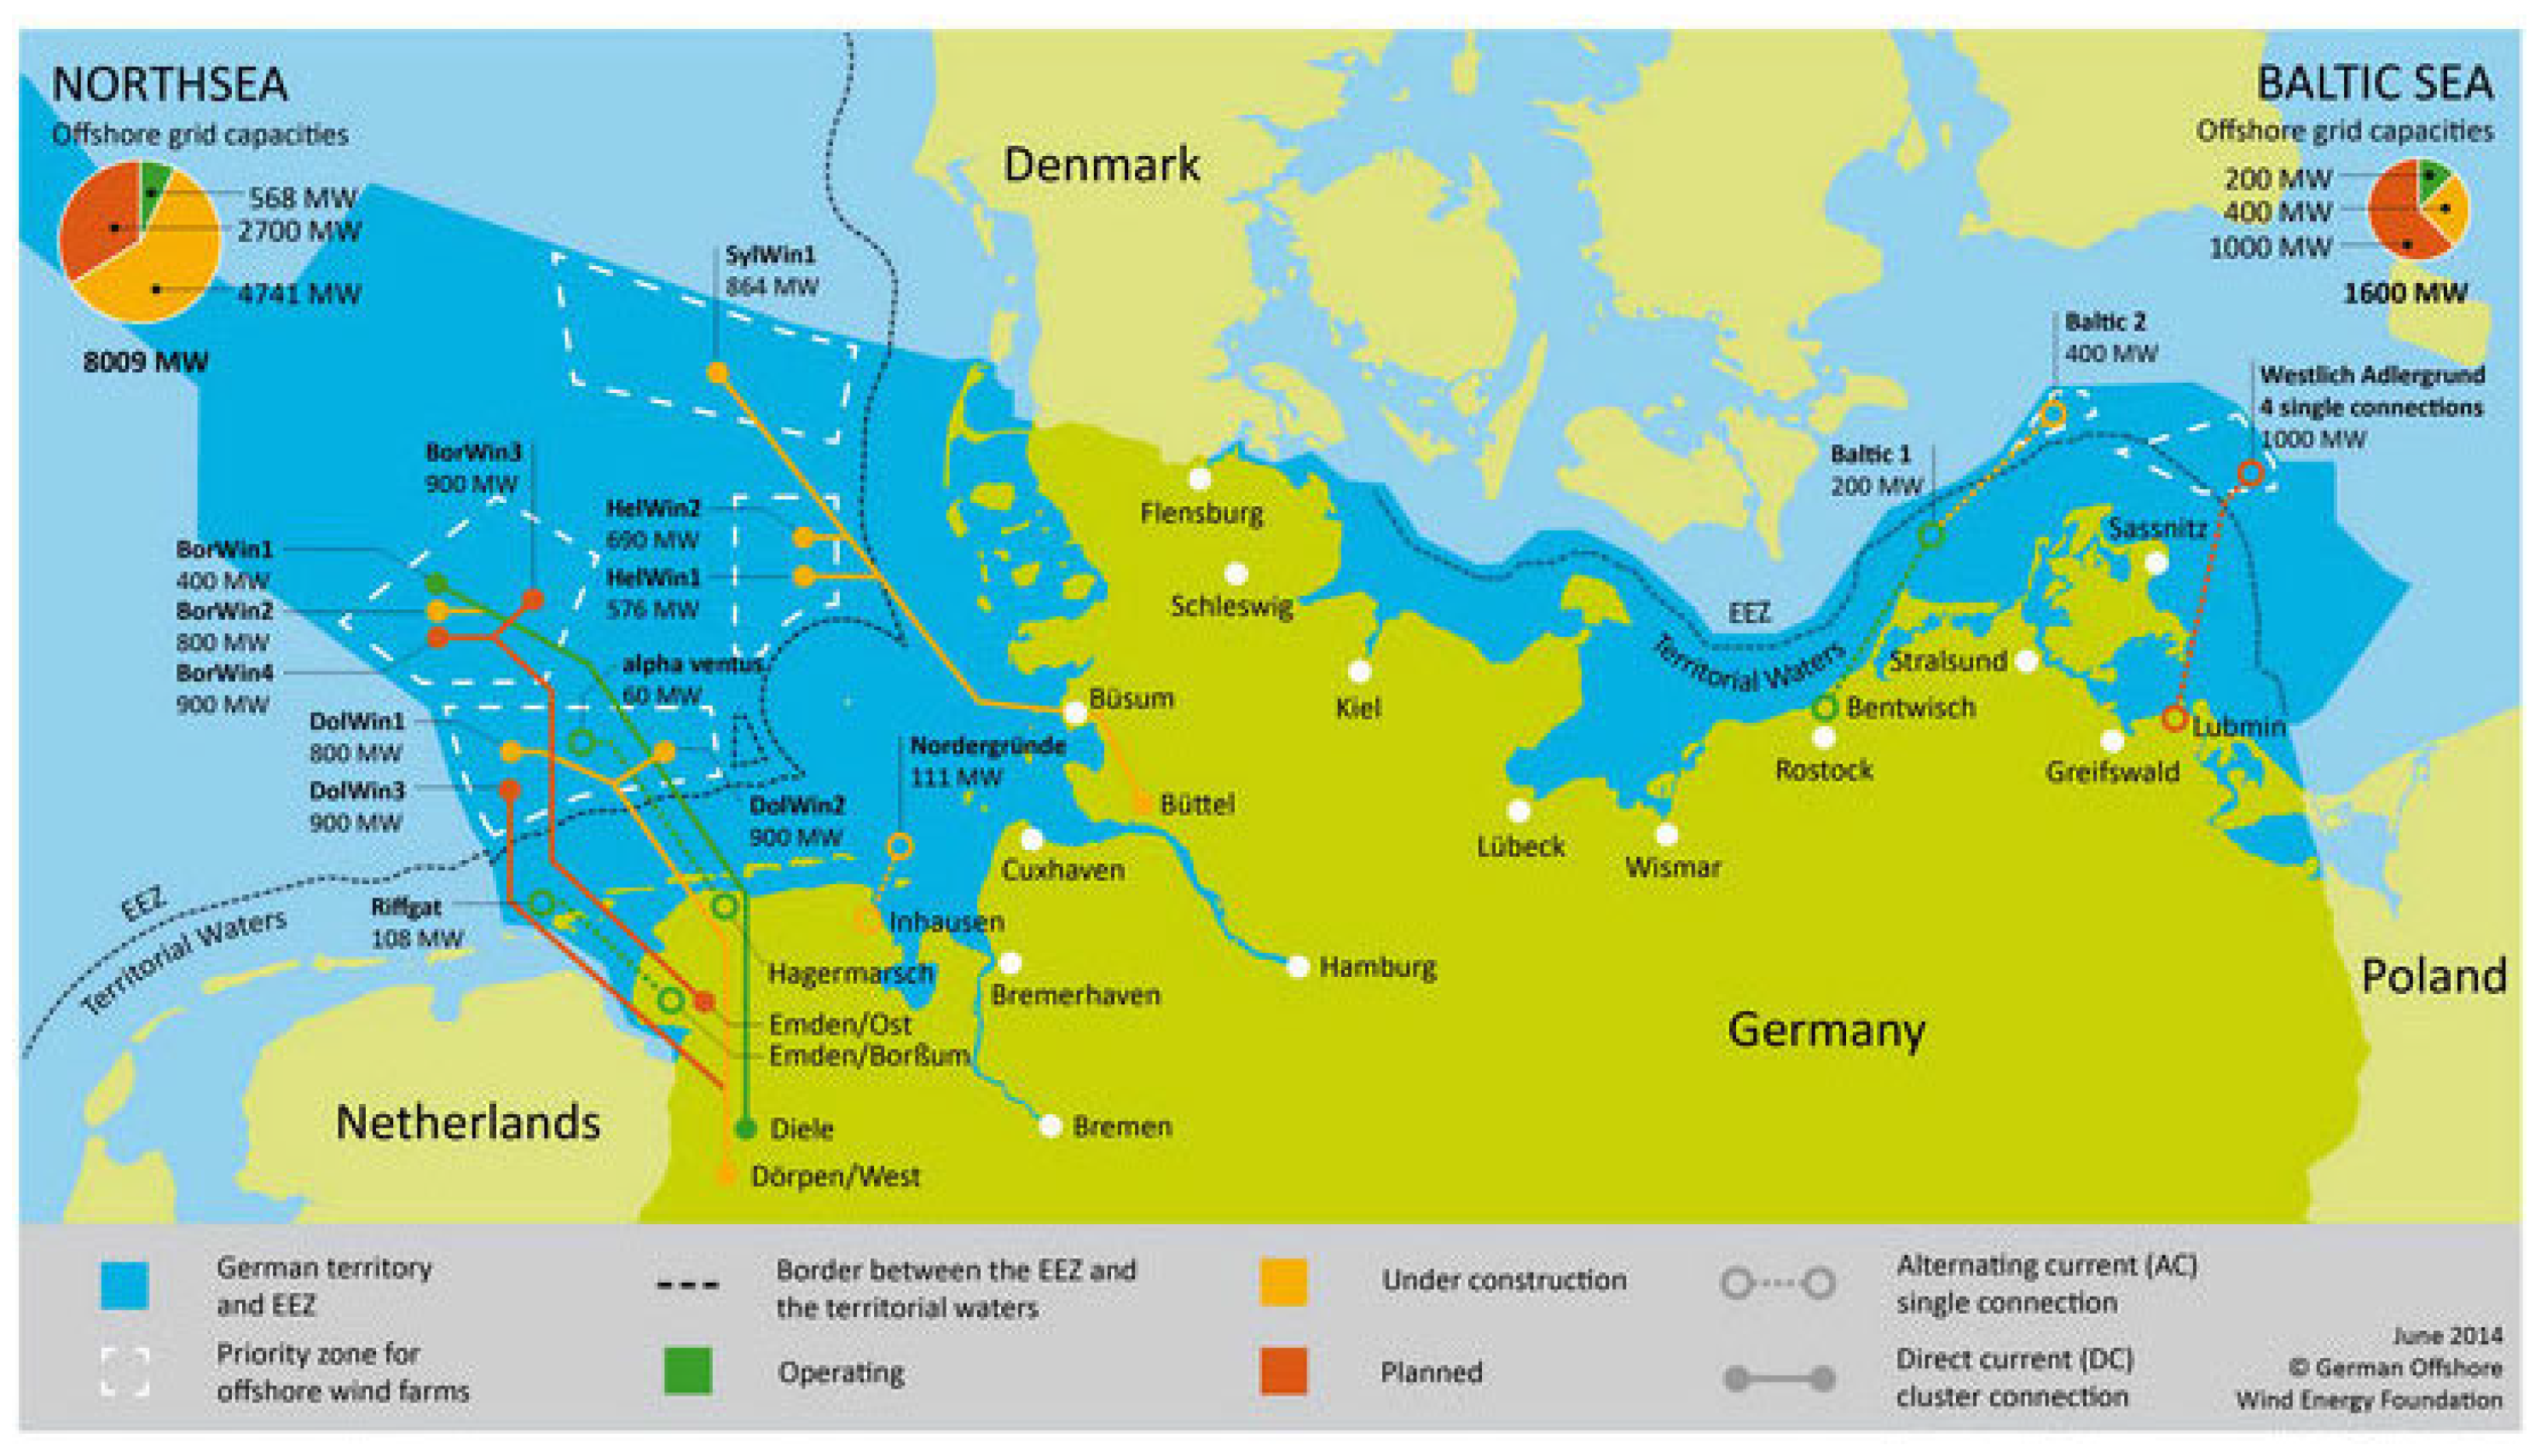
- Overview Offshore Wind Farms in Germany - June 2015. German Offshore Wind Energy Foundation. Available online: http://www.offshore-stiftung.de/mediathek (accessed on 25 June 2015).
© 2015 by the authors; licensee MDPI, Basel, Switzerland. This article is an open access article distributed under the terms and conditions of the Creative Commons by Attribution (CC-BY) license (http://creativecommons.org/licenses/by/4.0/).
Share and Cite
Singh, A.; Eser, P.; Chokani, N.; Abhari, R. High Resolution Modeling of the Impacts of Exogenous Factors on Power Systems—Case Study of Germany. Energies 2015, 8, 14168-14181. https://doi.org/10.3390/en81212424
Singh A, Eser P, Chokani N, Abhari R. High Resolution Modeling of the Impacts of Exogenous Factors on Power Systems—Case Study of Germany. Energies. 2015; 8(12):14168-14181. https://doi.org/10.3390/en81212424
Chicago/Turabian StyleSingh, Antriksh, Patrick Eser, Ndaona Chokani, and Reza Abhari. 2015. "High Resolution Modeling of the Impacts of Exogenous Factors on Power Systems—Case Study of Germany" Energies 8, no. 12: 14168-14181. https://doi.org/10.3390/en81212424