Article

Optimal Design of an Axial-Flux Permanent-Magnet Middle Motor Integrated in a Cycloidal Reducer for a Pedal Electric Cycle

Department of Mechanical Engineering, National Taiwan University, 1 Roosevelt Road, Sec. 4, Taipei 106, Taiwan
*
Author to whom correspondence should be addressed.
These authors contributed equally to this work.
Energies 2015, 8(12), 14151-14167; https://doi.org/10.3390/en81212421
Submission received: 21 September 2015 / Revised: 30 October 2015 / Accepted: 10 December 2015 / Published: 16 December 2015
(This article belongs to the Special Issue Energy Efficient Actuators and Systems)

Abstract

:
This paper proposes an optimal design of a middle motor integrated into a mid-drive unit for pedal electric cycles. This middle motor is an axial-flux permanent magnet brushless DC motor with a stator plate. Facing this plate is a rotor plate that acts as an eccentric component of a cycloidal reducer next to the stator. Both the middle motor and cycloidal reducer are easily installed on the same axle of the bike crankset. In the preliminary design, driving requirements are used to make the middle motor specifications. The numbers of stator slots and magnet poles on the rotor were chosen to achieve the best winding factor, and the winding layout was determined accordingly. A one-dimensional magnetic circuit model of the middle motor was built, and its shape was optimized utilizing a multifunctional optimization system tool. Finally, the resulting design was verified and refined by a finite element analysis. A prototype of the middle motor was fabricated with a stator made of a soft magnetic composite and integrated with a cycloidal reducer. Experimental results show that the motor has a sinusoidal back electromotive force. Additionally, it is easily controlled by sinusoidal currents with acceptable torque and speed curves.

1. Introduction

Electric bicycles (e-bikes) have gained increasing attention as a means of personal transportation and part of an urban lifestyle [1]. People choose to purchase and use e-bikes for a variety of reasons, such as affordability, light weight, ease of riding, power assistance, savings on commuting and parking costs, the requirement for a small parking space, and a more flexible trip compared to a standard bike [2,3]. The pedal electric cycle (pedelec) is a type of e-bike in which a small electric motor assists its rider with electric power while he or she is pedaling [4]. This electric power is particularly useful in many circumstances, such as hilly areas or in the presence of a strong headwind.
Most e-bike motors are mounted on the front or the rear wheel hub [4,5], or in the center of the crank [6]. Compared to a traditional hub motor, a middle motor in a mid-drive unit has a higher performance and torque. This is because the middle motor drives the crank instead of the wheel itself, allowing it to take better advantage of the bike’s existing gears. The separation of the mid-drive set and wheel results in easier maintenance and service compared to a bike with a hub motor. This is especially the case when changing a flat tire. The location of the mid-drive unit is close to the center of gravity and situated low to the ground, thereby improving the overall handling of the e-bike.
Turner [7] patented a pedelec mid-drive set that was directly connected to the sun gear of the planetary gear reducer to deliver power to the rear wheel. However, this design was bulky, and the bike frame was drastically compromised. In addition, Li and Tu [8] designed a mid-drive power unit. However, its output shaft was not coaxial with the crankshaft. Therefore, an additional longitudinal space was necessary to install a reduction gear for transmitting power to the crankshaft. Li et al. [9] proposed a mid-drive unit that was coaxially connected to the crankshaft by a harmonic reducer. The advantages of a harmonic drive are its compactness, light weight, high gear ratio, and absence of backlash. However, it suffers low endurance to impact forces, a low rigidness of the flex spline, and a limited lifespan. The radial-flux permanent-magnet (RFPM) motors were used for the three applications of middle motors described above. The cylindrical shape of the RFPM motor results in the construction of a long and bulky mid-drive unit.
The present paper proposes an optimal design of an axial-flux permanent magnet (AFPM) middle motor in a mid-drive unit on a pedelec. Specifically, the middle motor rotor was designed on the eccentric disc of a cycloidal reducer, facing the stator plate. The axial length is saved due to the integrated configuration of the motor and reducer. The study is presented as follows: (1) Section 2 introduces the configuration and specifications of the pedelec middle motor; (2) Section 3 elaborates the sensitivity analysis and optimal design of the AFPM middle motor with zero and one-dimensional (0-D/1-D) magnetic circuit models; (3) the result of the design is verified and refined by the 3-D finite element (FE) analysis presented in Section 4; (4) Section 5 provides the experimental outcome of the AFPM middle motor prototype performance; and (5) finally, conclusions are made in Section 6.

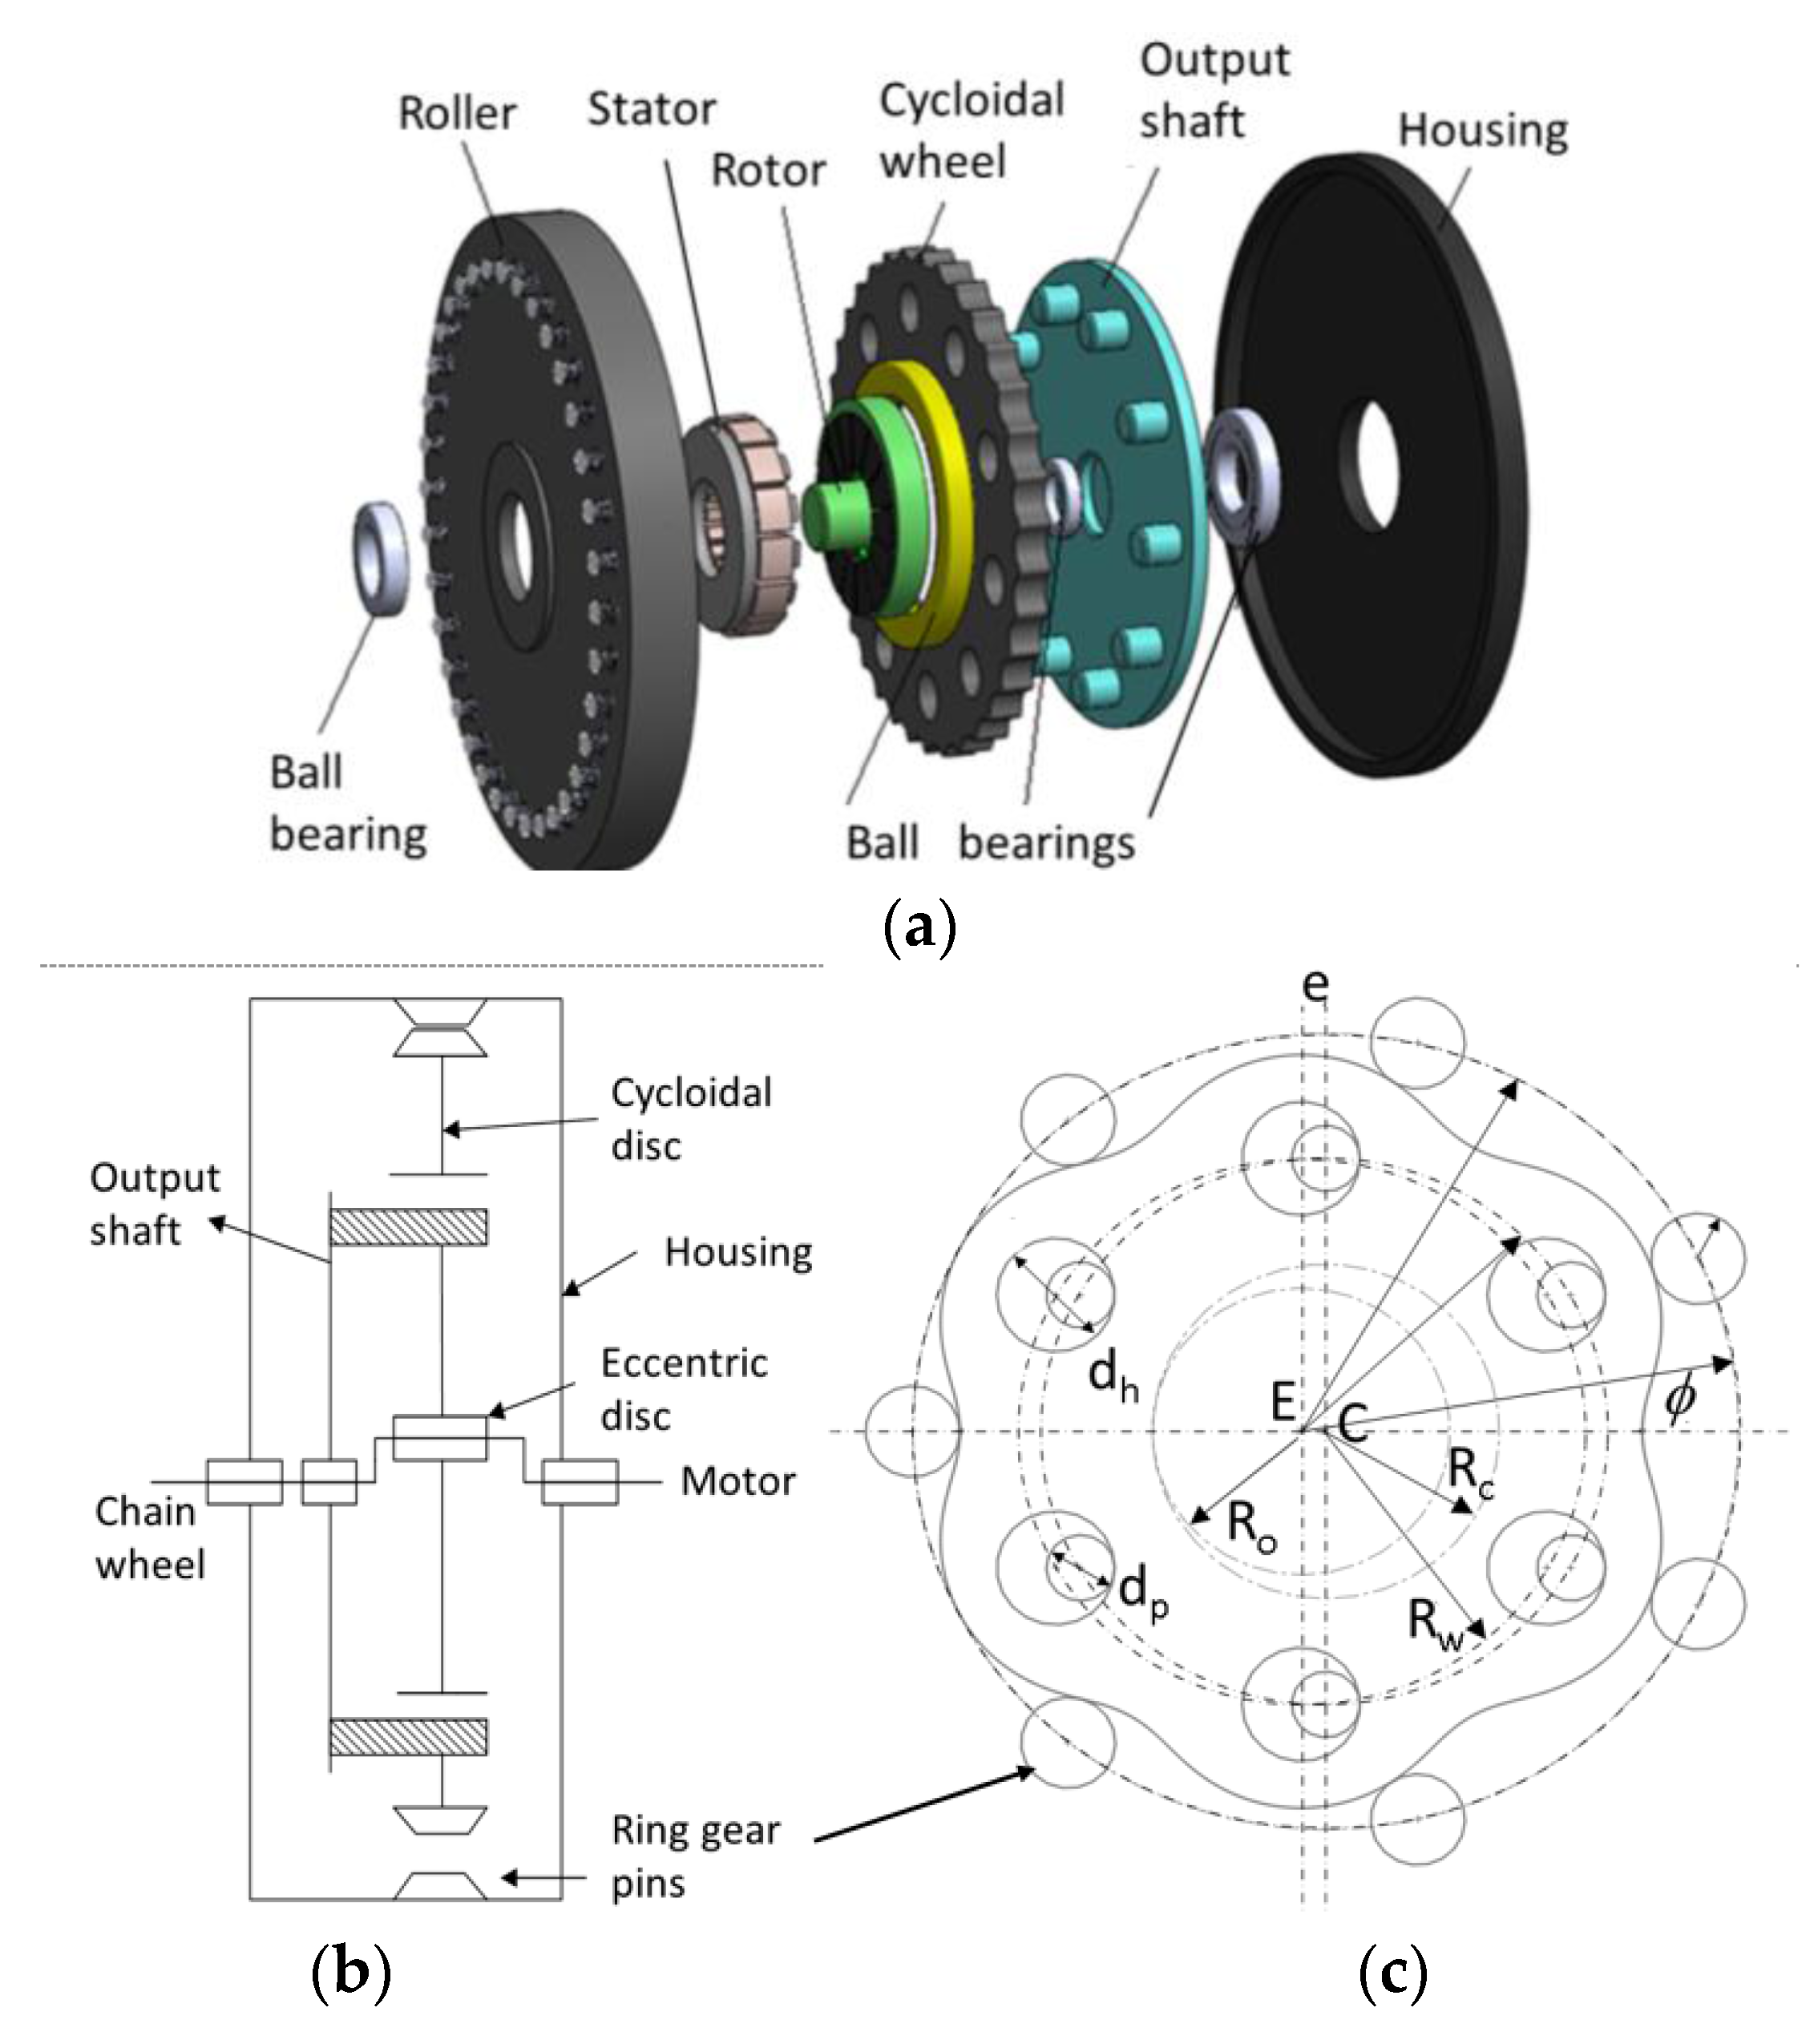
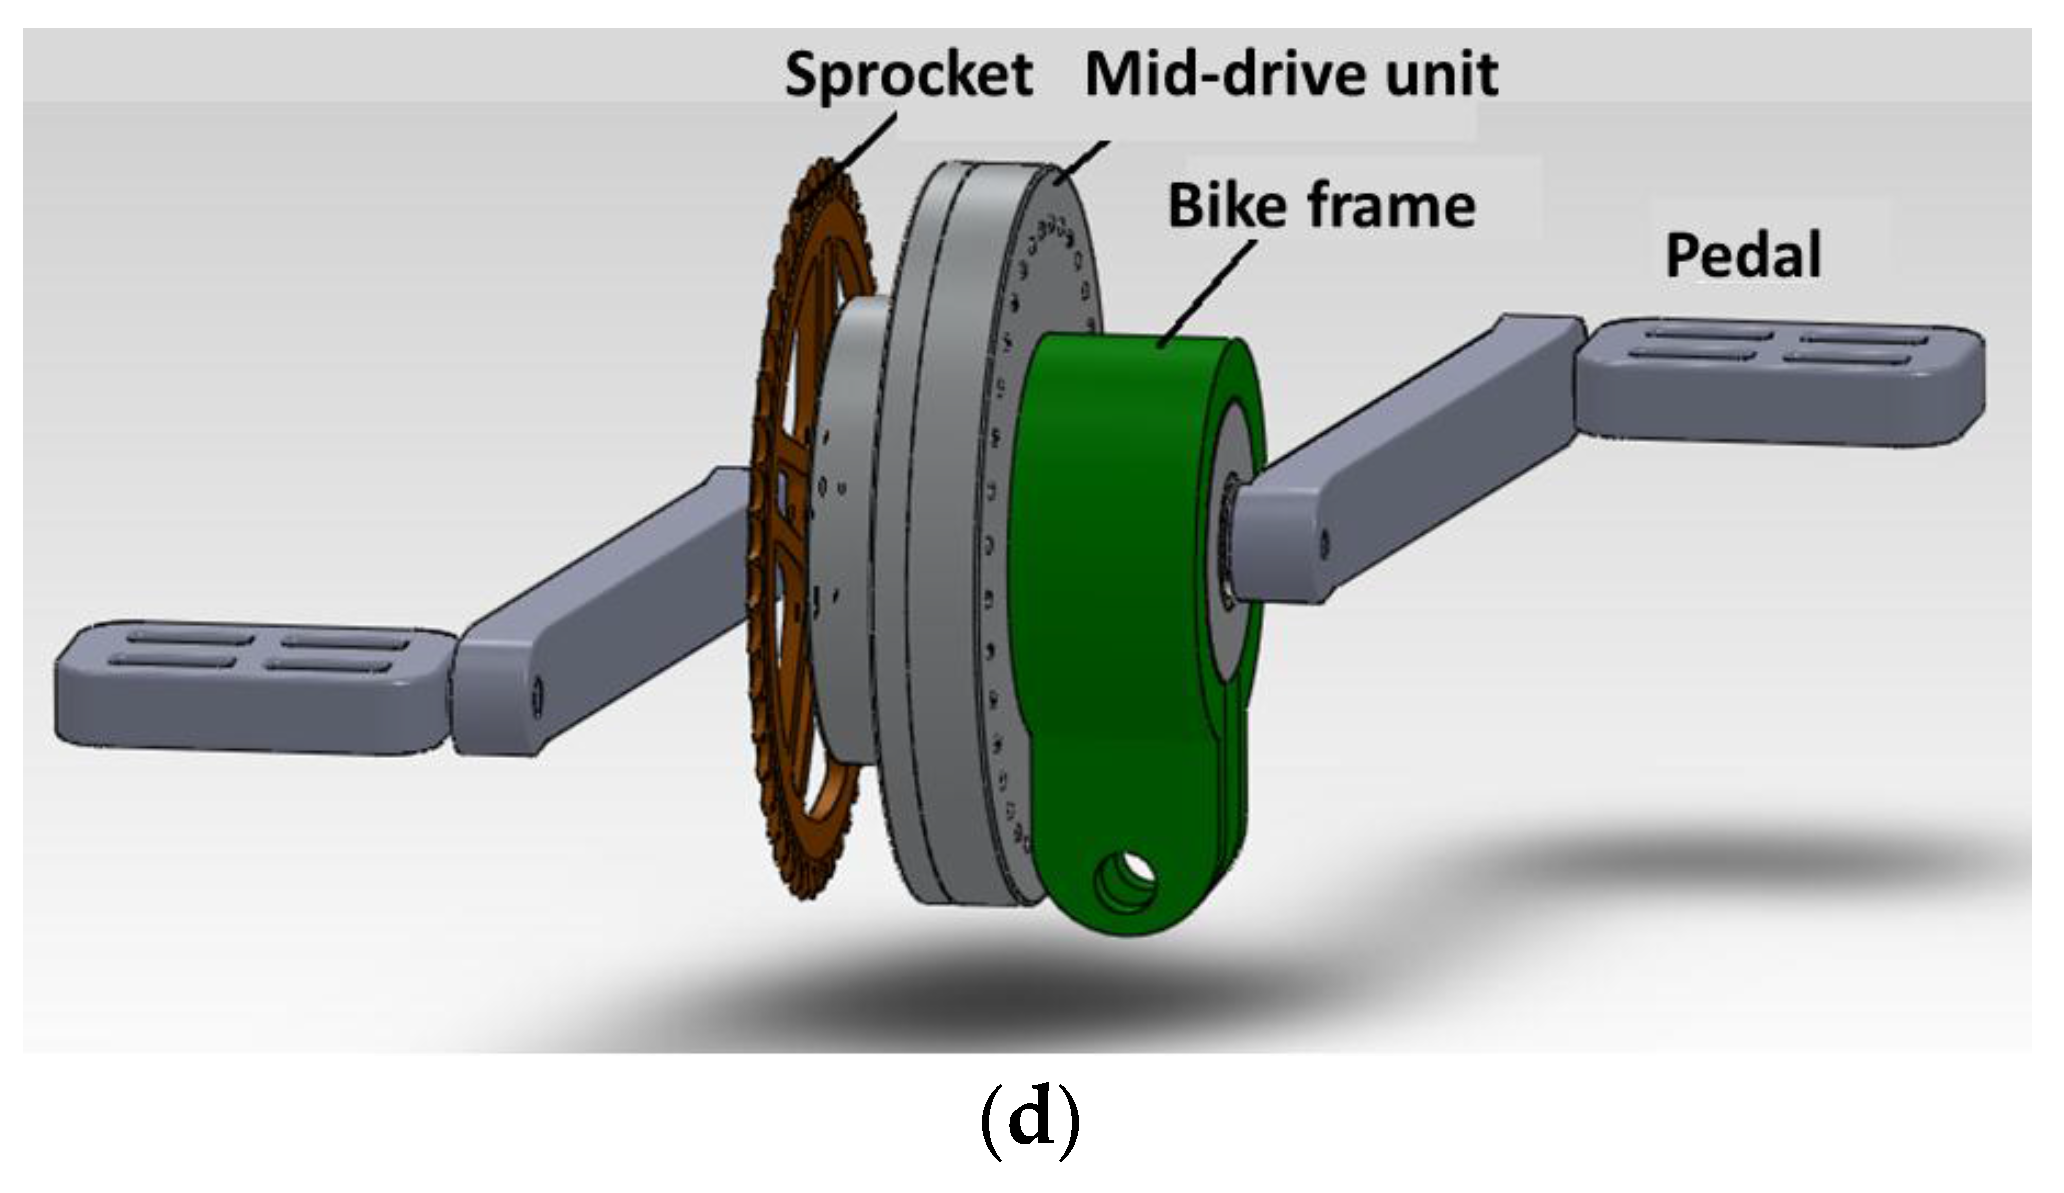
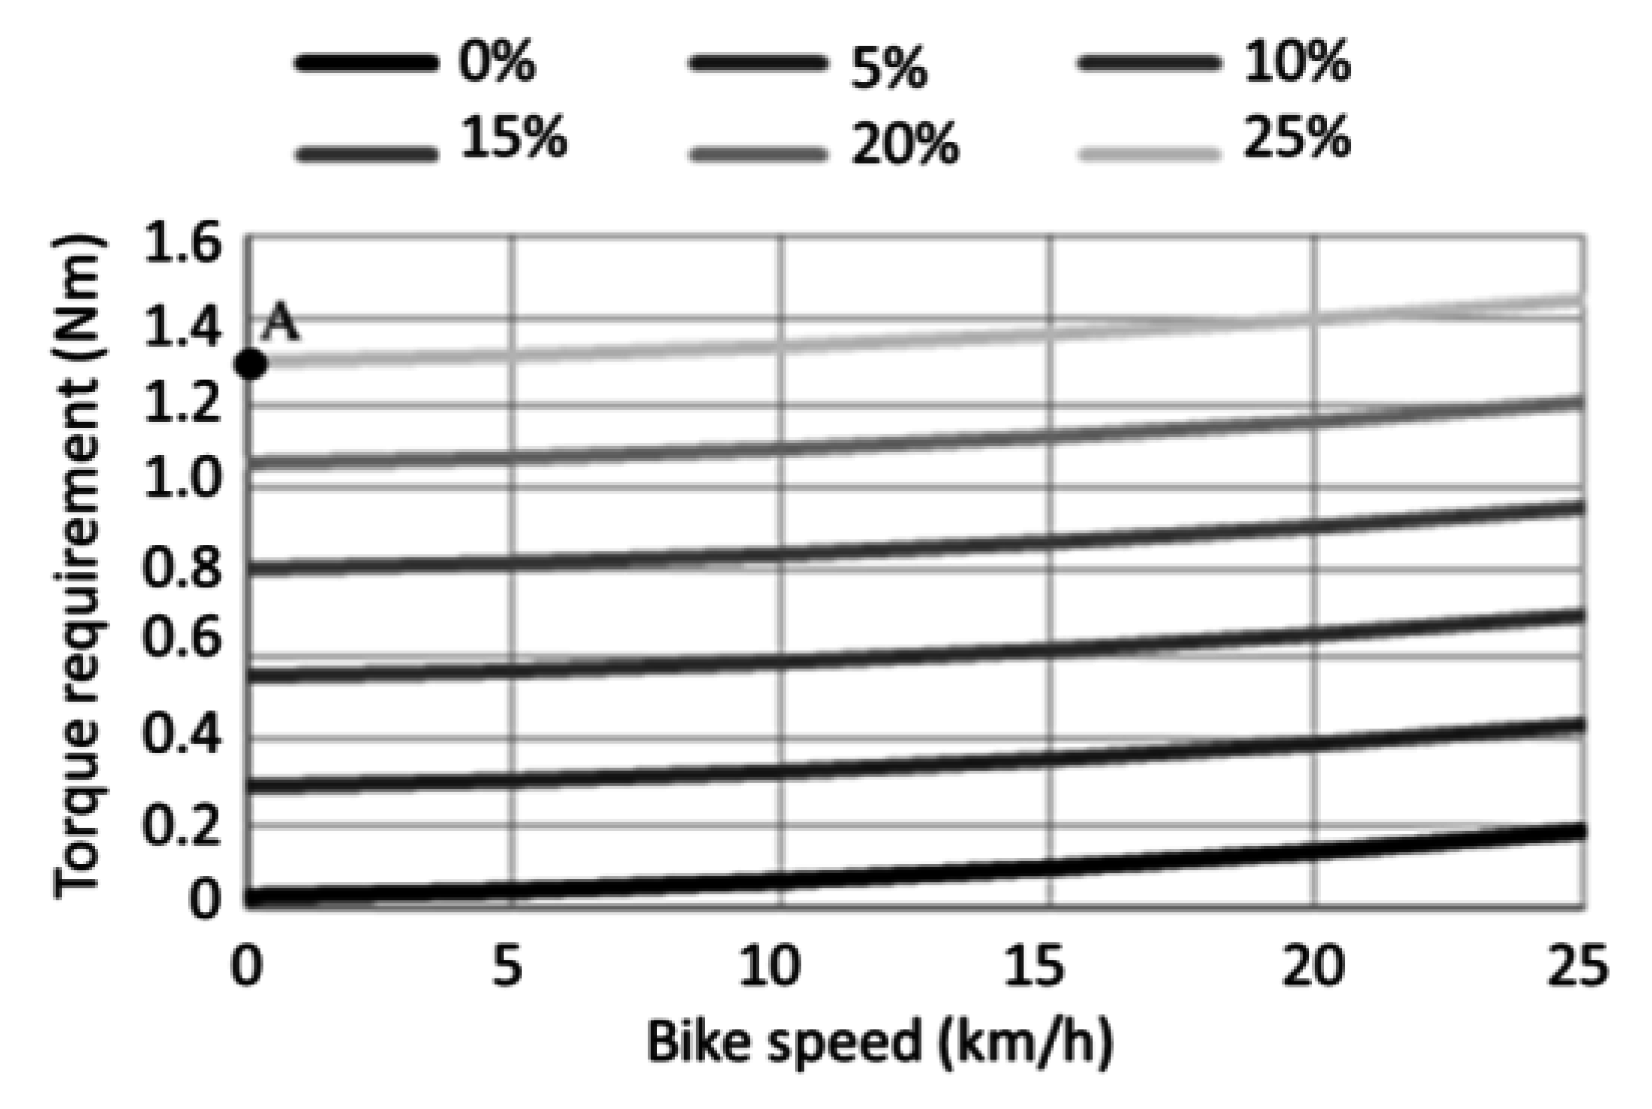
2. Specifications of the Pedelec Middle Motor

The proposed pedelec middle motor was designed to have its rotor exist as an eccentric component of a one-stage cycloidal reducer. This reducer possesses a high reduction ratio of 35:1, as shown in Figure 1. The eccentric plate is comprised of an original portion of the cycloidal reducer driven by a traditional motor attached to the input shaft. The traditional motor typically consists of a radial flux permanent magnet motor with a cylindrical configuration. However, this may result in a bulky crankset with a large axial length.
Figure 1. (a) Configuration of the middle motor in the mid-drive unit; (b) its schematic assembly with a cycloidal reducer; (c) the cycloidal and eccentric discs; and (d) the assembly of the mid-drive unit, crank, and pedals.
Energies 08 12421 g001aEnergies 08 12421 g001b
The proposed AFPM motor has a disc-type configuration. Its rotor is integrated on the eccentric disc of the cycloidal reducer facing the stator plate opposite to the air gap. This placement ensures that the axial length of the motor and reducer assembly is condensed. As shown in Figure 1c, the rotor of radius Ro is centered at point E. Outside of the rotor, a bearing of radius Rc is installed, with the center of the bearing C at a separate distance of e from the center E of the rotor. This eccentric bearing connects to a cycloidal wheel. On the radius Rw of the cycloidal wheel centered at C, a group of pin holes with radius dh drive the output shaft through a group of pins with radius dp. When the rotor on the eccentrically placed disc rotates about its center E, the cycloidal disc is driven in the opposite direction and pushes against the ring gear pins or rollers at the cycloidal disc lobes.
The reduction ratio of the cycloidal reducer is determined by:
1 N r = n p n L n L
where np is the number of ring gear pins; and nL is the number of lobes on the cycloidal wheel. In this paper, np is 36, nL is 35, and Nr equals 35. Specifications of the pedelec middle motor are determined by torque and speed under the driving requirements, as well as the constraints of battery and drive, as described in Table 1. The air temperature of 24 °C is specified for a moderate driving environment, as well as for a nominal ambient temperature for battery range tests.
Table 1. Driving requirements and constraints.
Bicycle
TypeRoadster
Wheel size26 inches
Power assist ratio1
Bicycle weight20 kg
Rider’s height175 cm
Rider’s weight80 kg
Air temperature24 °C
Max. riding slope25%
Max. speed on level road25 km/h
Middle Motor
Max. motor torque (Tmax)1.4 Nm
Min. motor power (Pmin)250 W
Battery voltage (VDC)36 V
Max. DC current (IDC-max)<14 A
Winging typeY-connection
Modulation typeSVPWM
Gear ratio35
Motor axial length<40 mm
The first step is to determine the pedelec traction power that is required to overcome the road load resistance. The rider’s power Pb is achieved by:
P b = C m v b [ C w A f ρ ( v b + v w ) 2 2 + F s ]
where Cm is the tire loss coefficient; vb is the bike speed; Cw is the aerodynamic coefficient; Af is the frontal area of the pedelec and rider; ρ is the air density; and vw is the wind speed. The rolling friction plus the slope pulling force Fs on an inclined plane is obtained by:
F s = ( M + m )   g   ( C r cos    θ + sin    θ )
where M is the mass of rider, m is the mass of bike, g is the gravitational constant, Cr is the rolling friction coefficient, and θ is the slope angle.
To determine the maximum torque, we assigned a power-assist ratio (PAR) and transmission gear ratio. The PAR is defined as the ratio between the human pedaling power and the output power of the motor, and is set to one. The transmission gear ratio was determined by dividing the number of teeth on the front chain-wheel by the number of teeth on the rear sprocket. In this paper, the maximum transmission gear ratio is set to three. The highest motor speed required for the pedelec is approximately 3000 rpm when the bike reaches a top speed of 25 km/h and the transmission gear ratio is three. The maximum motor torque required for the pedelec is approximately 1.314 Nm at point A (Figure 2) for the bike to be travelling on a maximum slope of 25% when the transmission gear ratio is one.
Figure 2. The torque required at various bike speeds and road slopes.
Energies 08 12421 g002

3. Optimal Design of the AFPM Motor

Figure 3 shows the engineering drawing and design parameters of the AFPM motor. All of the design parameters are simplified and defined based on the cross-section of the average radius of the rotor (AA) and stator (BB).
Figure 3. The (a) rotor; (b) stator; and (c) 2-D cross-sectional view of a single-sided AFPM.
Energies 08 12421 g003

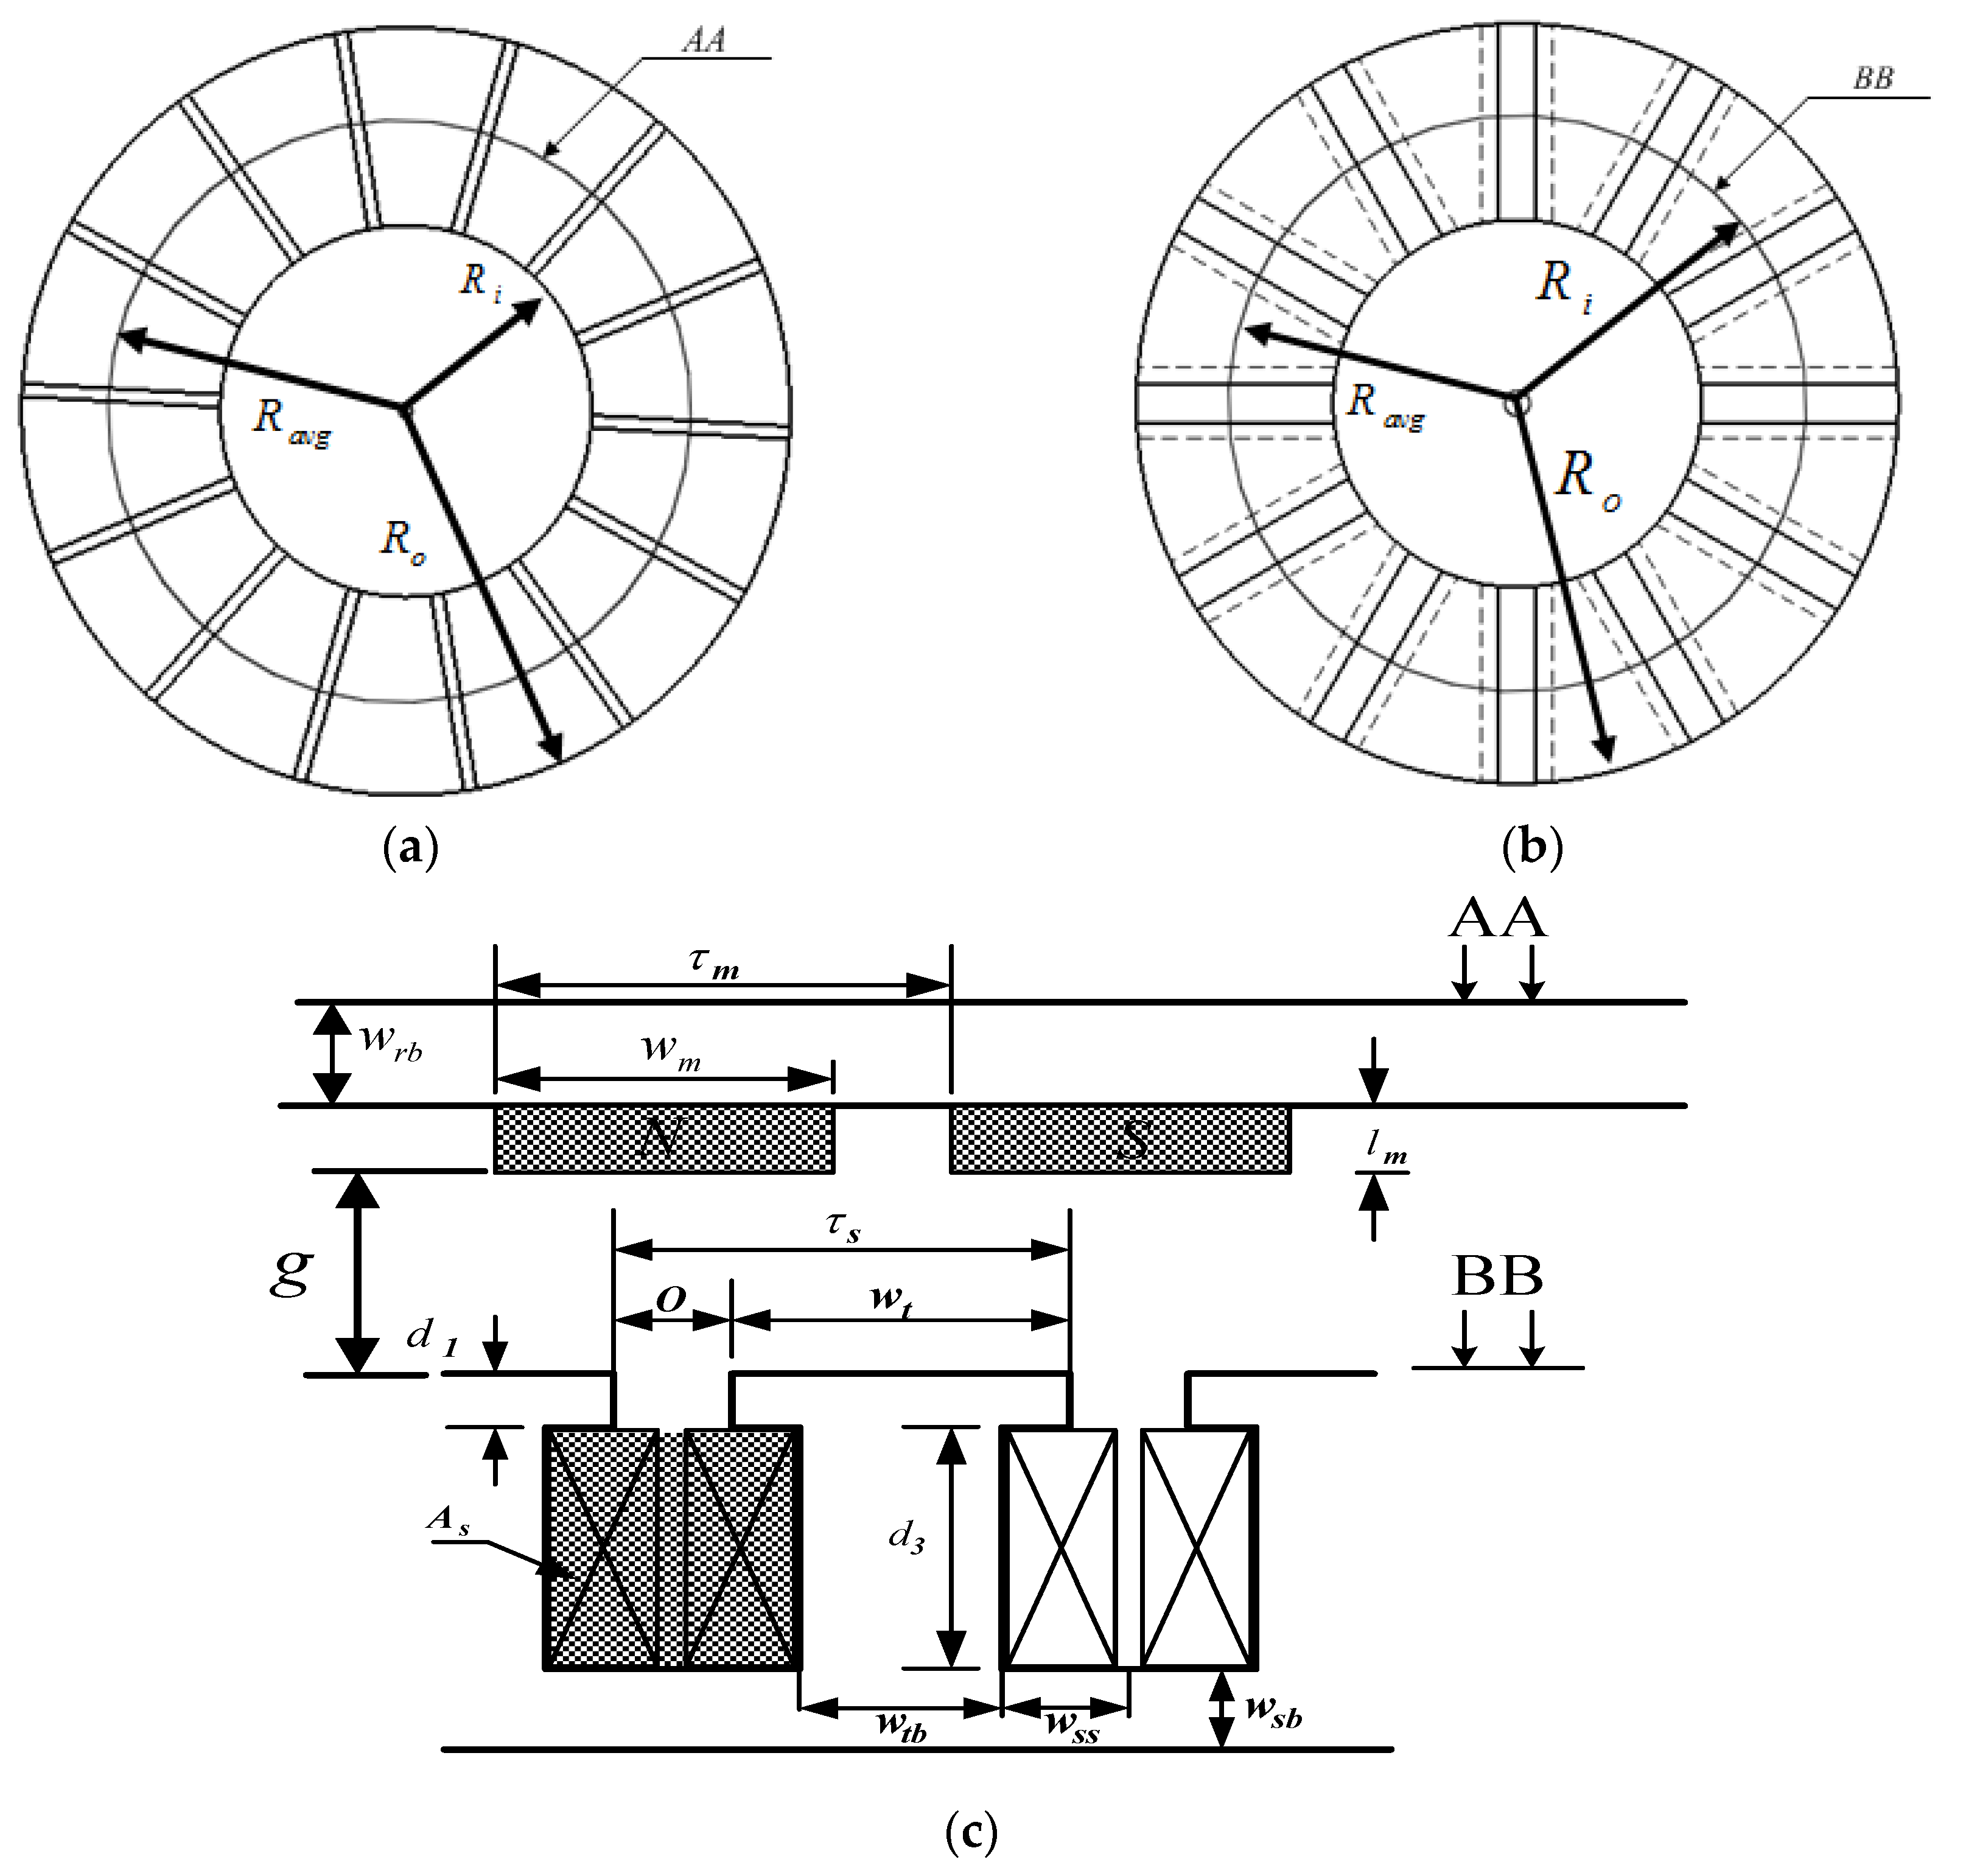
3.1. Preliminary Design (0-D)

From a 0-D magnetic circuit model [10], the output torque of a PM motor per phase is expressed as:
T = N m k w B g A g N s p p n s i = K p i
where Nm is the number of poles; kw is the winding factor; and Nspp is the number of slots per pole, per phase. The magnetomotive force (mmf) nsi is produced by a coil of ns turns per slot, each carrying a phase current of i. When the phase back electromotive force (back emf) is sinusoidal and the motor is driven by three-phase sinusoidal currents with a 120° E difference, the total torque production becomes Ttotal = (3/2)Kpi. The air gap cross-sectional area Ag between the rotor and the stators is:
A g < π ( 1 + α m ) ( R o 2 R i 2 ) / 2 N m
where Ri and Ro are the inner and outer radii, respectively. In addition, αm is the magnet with a fraction, defined as the ratio between the magnet width wm and the magnet pitch τm. The flux density of air gap Bg is presented as:
B g = C ϕ 1 + ( ( 2 μ R k m l k c g C ϕ ) / l m ) B r
where μR is the recoil permeability of the magnet; g is the minimal air gap length; kc is Carter’s coefficient; Br is the magnet remanence; and lm is the magnet length. The magnet leakage factor is determined by:
k m l = 1 + 2 l m N m π 2 μ R α m ( R o + R i ) ln ( 1 + π g τ f )
where τf = τmwm. The flux concentration factor is defined as C ϕ = 2αm/(1 + αm).
Ishak [11] found that if the number of poles Nm and the number of slots Ns satisfied Ns = Nm ± 2, the motor would provide a high torque with an extended winding factor and low torque ripple. According to the AFPM motor specification, the number of slots and poles was chosen to be 12/14 with a corresponding winding factor of 0.933.
The motor parameters obtained by the 0-D design equations were selected for the 1-D optimal design described below. To minimize the angular spread of the phase winding, Table 2 illustrates the double layer winding layout for all three phases. The phase offset is 120° E, but each phase has three coils spread by different and unsymmetrical electric angles. This unsymmetrical winding structure will cause complex d- and q-axis flux linkages so that the corresponding d- and q-axis inductances vary according to the phase current and angle.
Table 2. Winding layout and coil angles of the AFPM motor.
CoilCoil Angle (Degree)Slots of Phase ASlots of Phase BSlots of Phase C
inoutinoutinout
101256910
23032761110
3087121143
4307912145

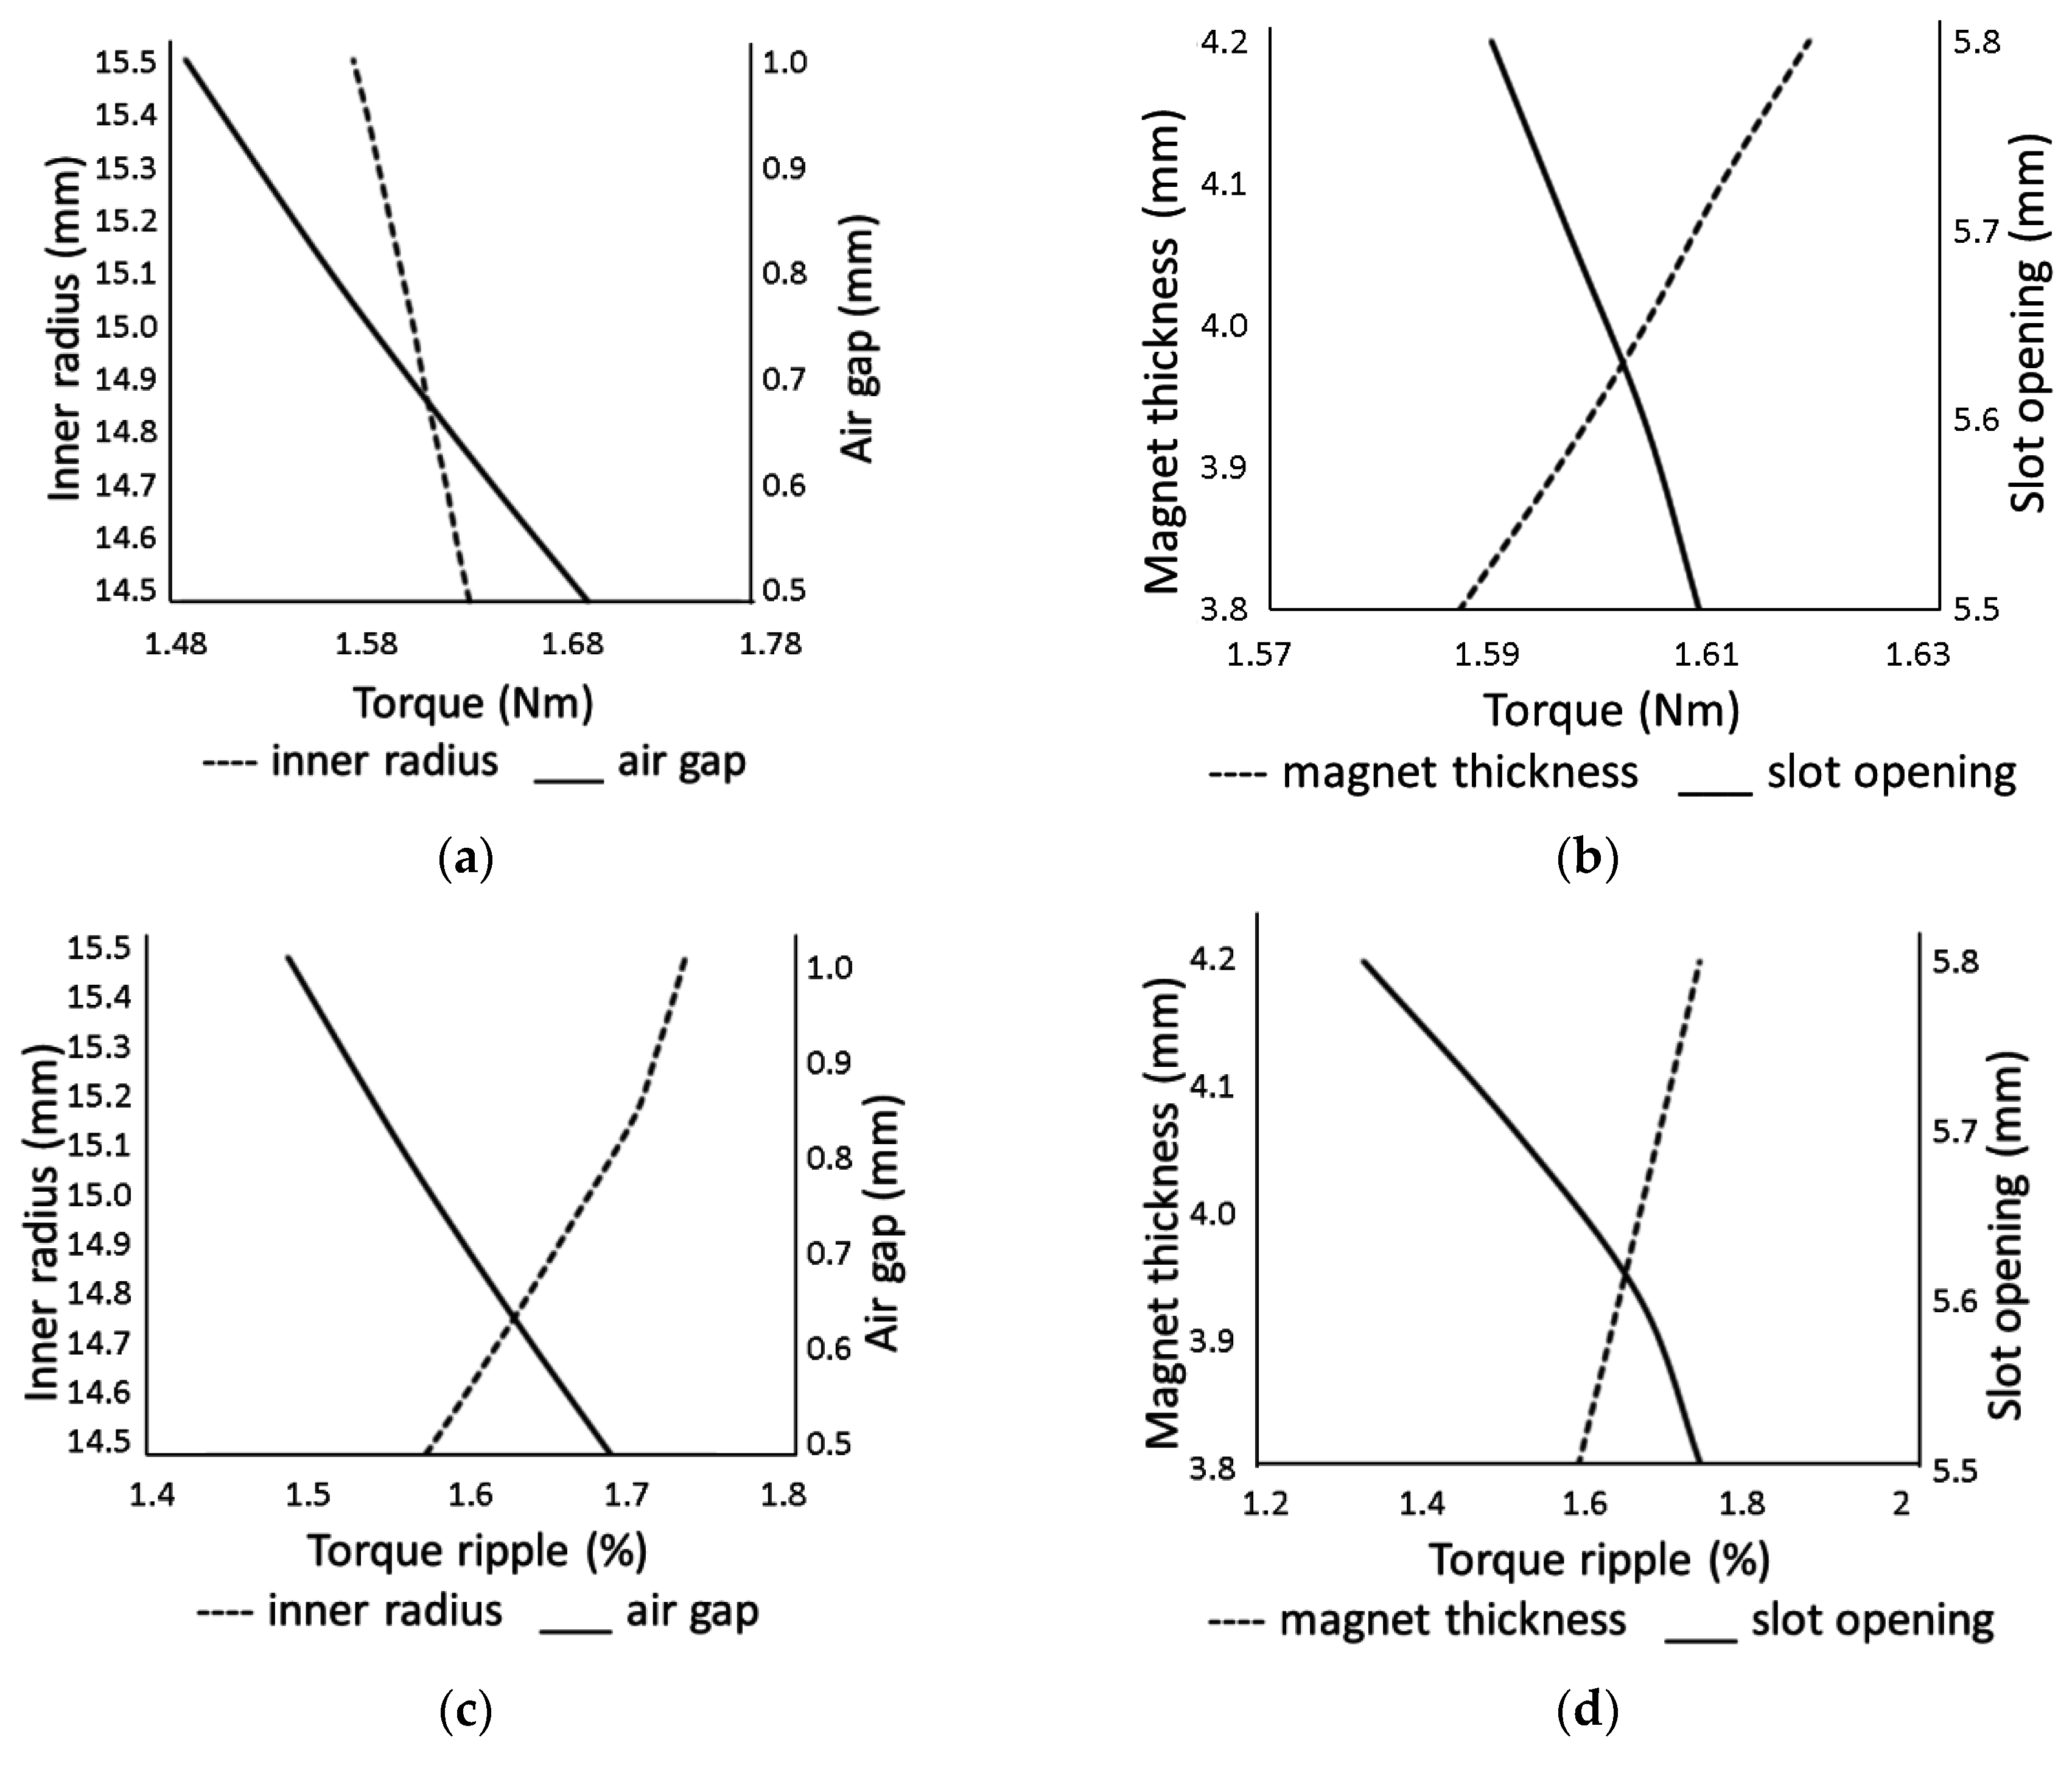
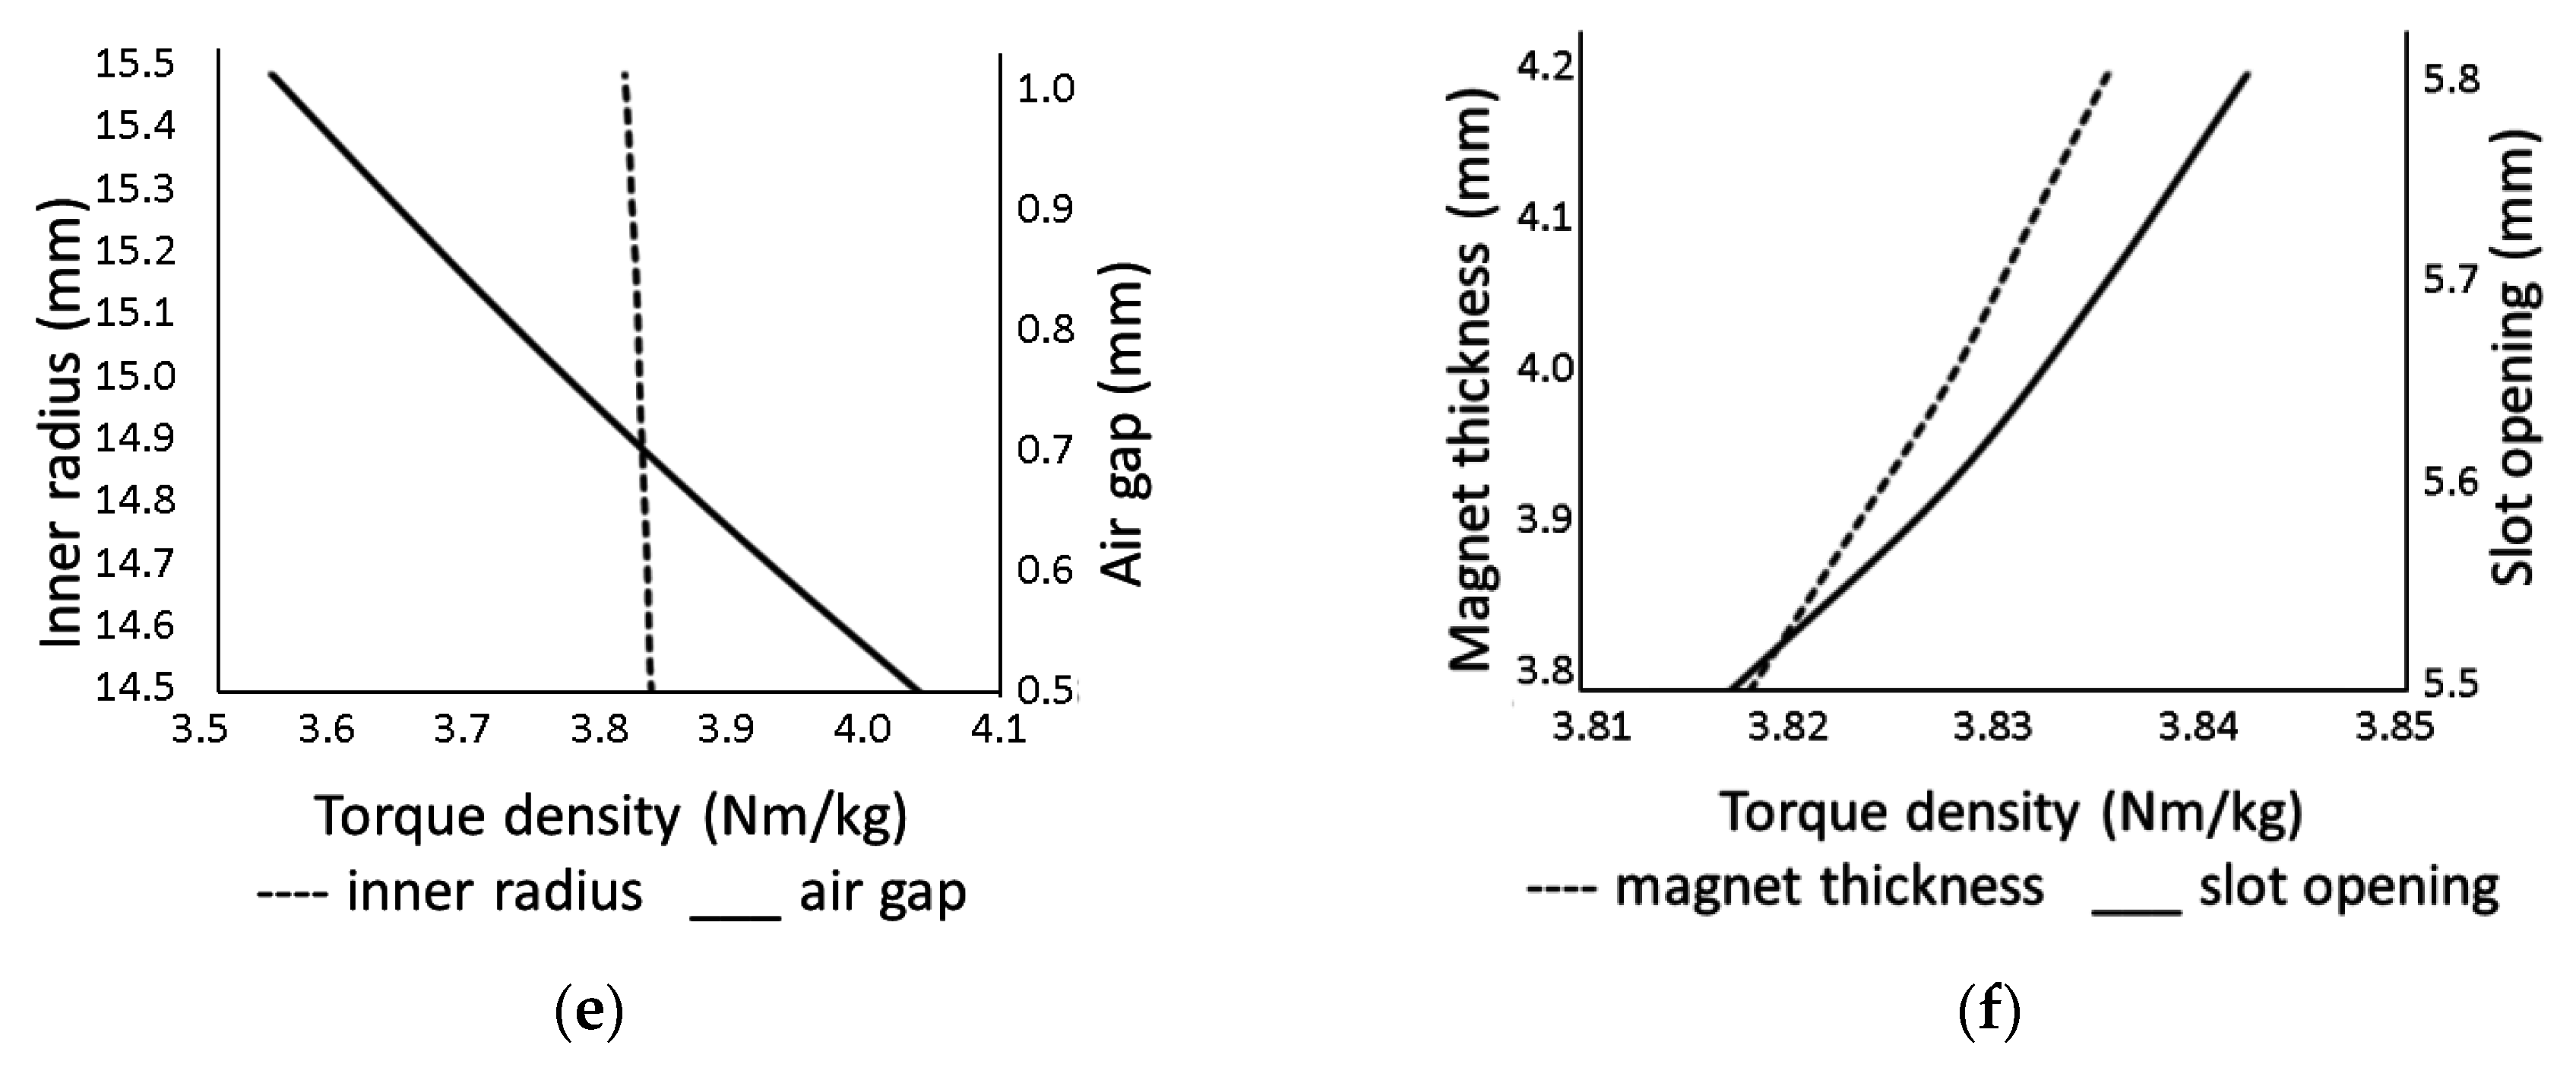
3.2. Sensitivity Analysis (1-D)

The performance of the AFPM motor is evaluated based on its output torque, torque ripple, and torque density. These parameters are also known as objective functions or performance indices that describe the mechanical and electrical dynamics in terms of motor geometries, magnetic materials, and driving conditions. The sensitivity analysis is required to determine the derivatives of the objective functions with respect to the parameters of interest. Lastly, a set of design variables was determined.
The current excited by the stator windings is combined with the magnetic flux produced by rotor magnets that generate mmfs. This results in a magnetic flux density distribution and magnetic energy that are created over the 3-dimensional (3-D) air gap region between the stator and rotor plates. The variation of magnetic energy with respect to the rotor shift produces a torque distribution. However, a one-dimensional (1-D) magnetic torque distribution at the average radius of Ravg = (Ri + Ro)/2 can be used to approximate the 3-D torque distribution for the following sensitivity analysis.
Based on the assumptions of material linearity, as well as the linear function of flux density and field intensity (i.e., the linear B-H curve), the magnetic co-energy stored in the air gap is expressed as:
W c ( s ) = μ 0 ( R o R i ) 0 2 π R a v g F 2 ( x , s ) g ( x , s ) d x
where μ0 is the permeability of the vacuum; s denotes the rotor shift; F(x, s) is the mmf distribution produced by the stator windings and rotor magnet; and x represents the peripheral coordinate along the circle of the average radius Ravg. The effective air gap distribution g(x, s) is the sum of the effective air gap length on both the stator and rotor sides.
The torque resulting from the variation of the co-energy with respect to the rotor shift is denoted by:
T ( s ) = 2 R a v g W c s | I = c o n s t
The four motor variables consisting of: (1) the inner motor radius Ri; (2) the magnet thickness lm; (3) the minimum air gap length g; and (4) the slot opening o were chosen for investigating sensitivity to the following performance indices:
Torque: max. Tavg
Torque ripple: min (TmaxTmin)/Tavg
Torque density: max Tavg/W
We can infer that the torque decreases as the inner motor radius, slot opening, and air gap length increase, as shown in Figure 4a,b. Additionally, the torque increases with a rise in magnet thickness. Figure 4c,d show that the inner radius and magnet thickness have little effect on torque ripple. However, the air gap length and slot opening are inversely proportional to the torque ripple. In Figure 4e, the inner motor radius has a minimal effect on torque density, and this density dramatically declines as the air gap length increases. Figure 4f shows that the magnet thickness and slot openings are proportional to the torque density. Therefore, the air gap length is inversely proportional to the torque, torque ripple, and torque density, and was not selected for the optimal design presented below.
Figure 4. The sensitivity of torque versus: (a) the inner radius and air gap; and (b) magnet thickness and the slot opening. The sensitivity of torque ripple versus: (c) the inner radius and air gap; and (d) magnet thickness and the slot opening. The sensitivity of torque density versus: (e) the inner radius and air gap; and (f) magnet thickness and the slot opening.
Energies 08 12421 g004aEnergies 08 12421 g004b

3.3. Multi-Objective Optimal Design (1-D)

The compromise programming method [12] in the multi-functional optimization system tool (MOST) was applied to the search for the optimal values of the design variables for optimizing performance indices Equation (10) to Equation (12). The average torque Tavg, maximum torque Tmax, and minimal torque Tmin were obtained from the 1-D magnetic circuit model. The weight of the motor W was determined from the design variables. Different weightings were assigned to the performance indices for which the relative importance was addressed for the optimization. Listed in Table 3 are the top three results based on motor performance. The torque in the case of the weighting ratio of 5:1:5 was determined to be the best of the three. The weighting ratio of 5:5:1 has the lowest torque ripple and the highest torque density of the three performance cases. Therefore, it was chosen for subsequent FE verification and refinement.
Table 3. Optimized motor parameters and performance.
T a v g : T a v g / ( T max T min ) : T a v g / W 10:1:15:5:15:1:5
Design VariableInitialRange
Motor inner radius (mm)14.514.5–15.514.514.5514.5
Magnet thickness (mm)43.8–4.23.834.1223.99
Slot opening (mm)5.65.5–5.85.65.85.6
Performance
Torque (Nm)1.6191.6251.63
Torque ripple (%)1.4991.2501.57
Torque density (Nm/kg)3.8333.8563.84
Other Design Variables
Slot/pole number12/14
back iron thickness (mm)3
Nominal DC bus voltage (V)36
# of turns/coils per phase21/4
Air-gap length (mm)0.5
Max. phase current, A at 36 V14
Stator outer diameter (mm)62
Stator inner diameter (mm)31
Air gap length (mm)0.5

4. Finite Element Analysis (3-D)

The above results were obtained from the optimization scheme based on the 1-D magnetic circuit model. This conventional magnetic model does not produce precise optimization results due to the linear assumptions and simplified motor configuration. Therefore, further investigation of motor performance and geometric refinement must be conducted by FE analysis.

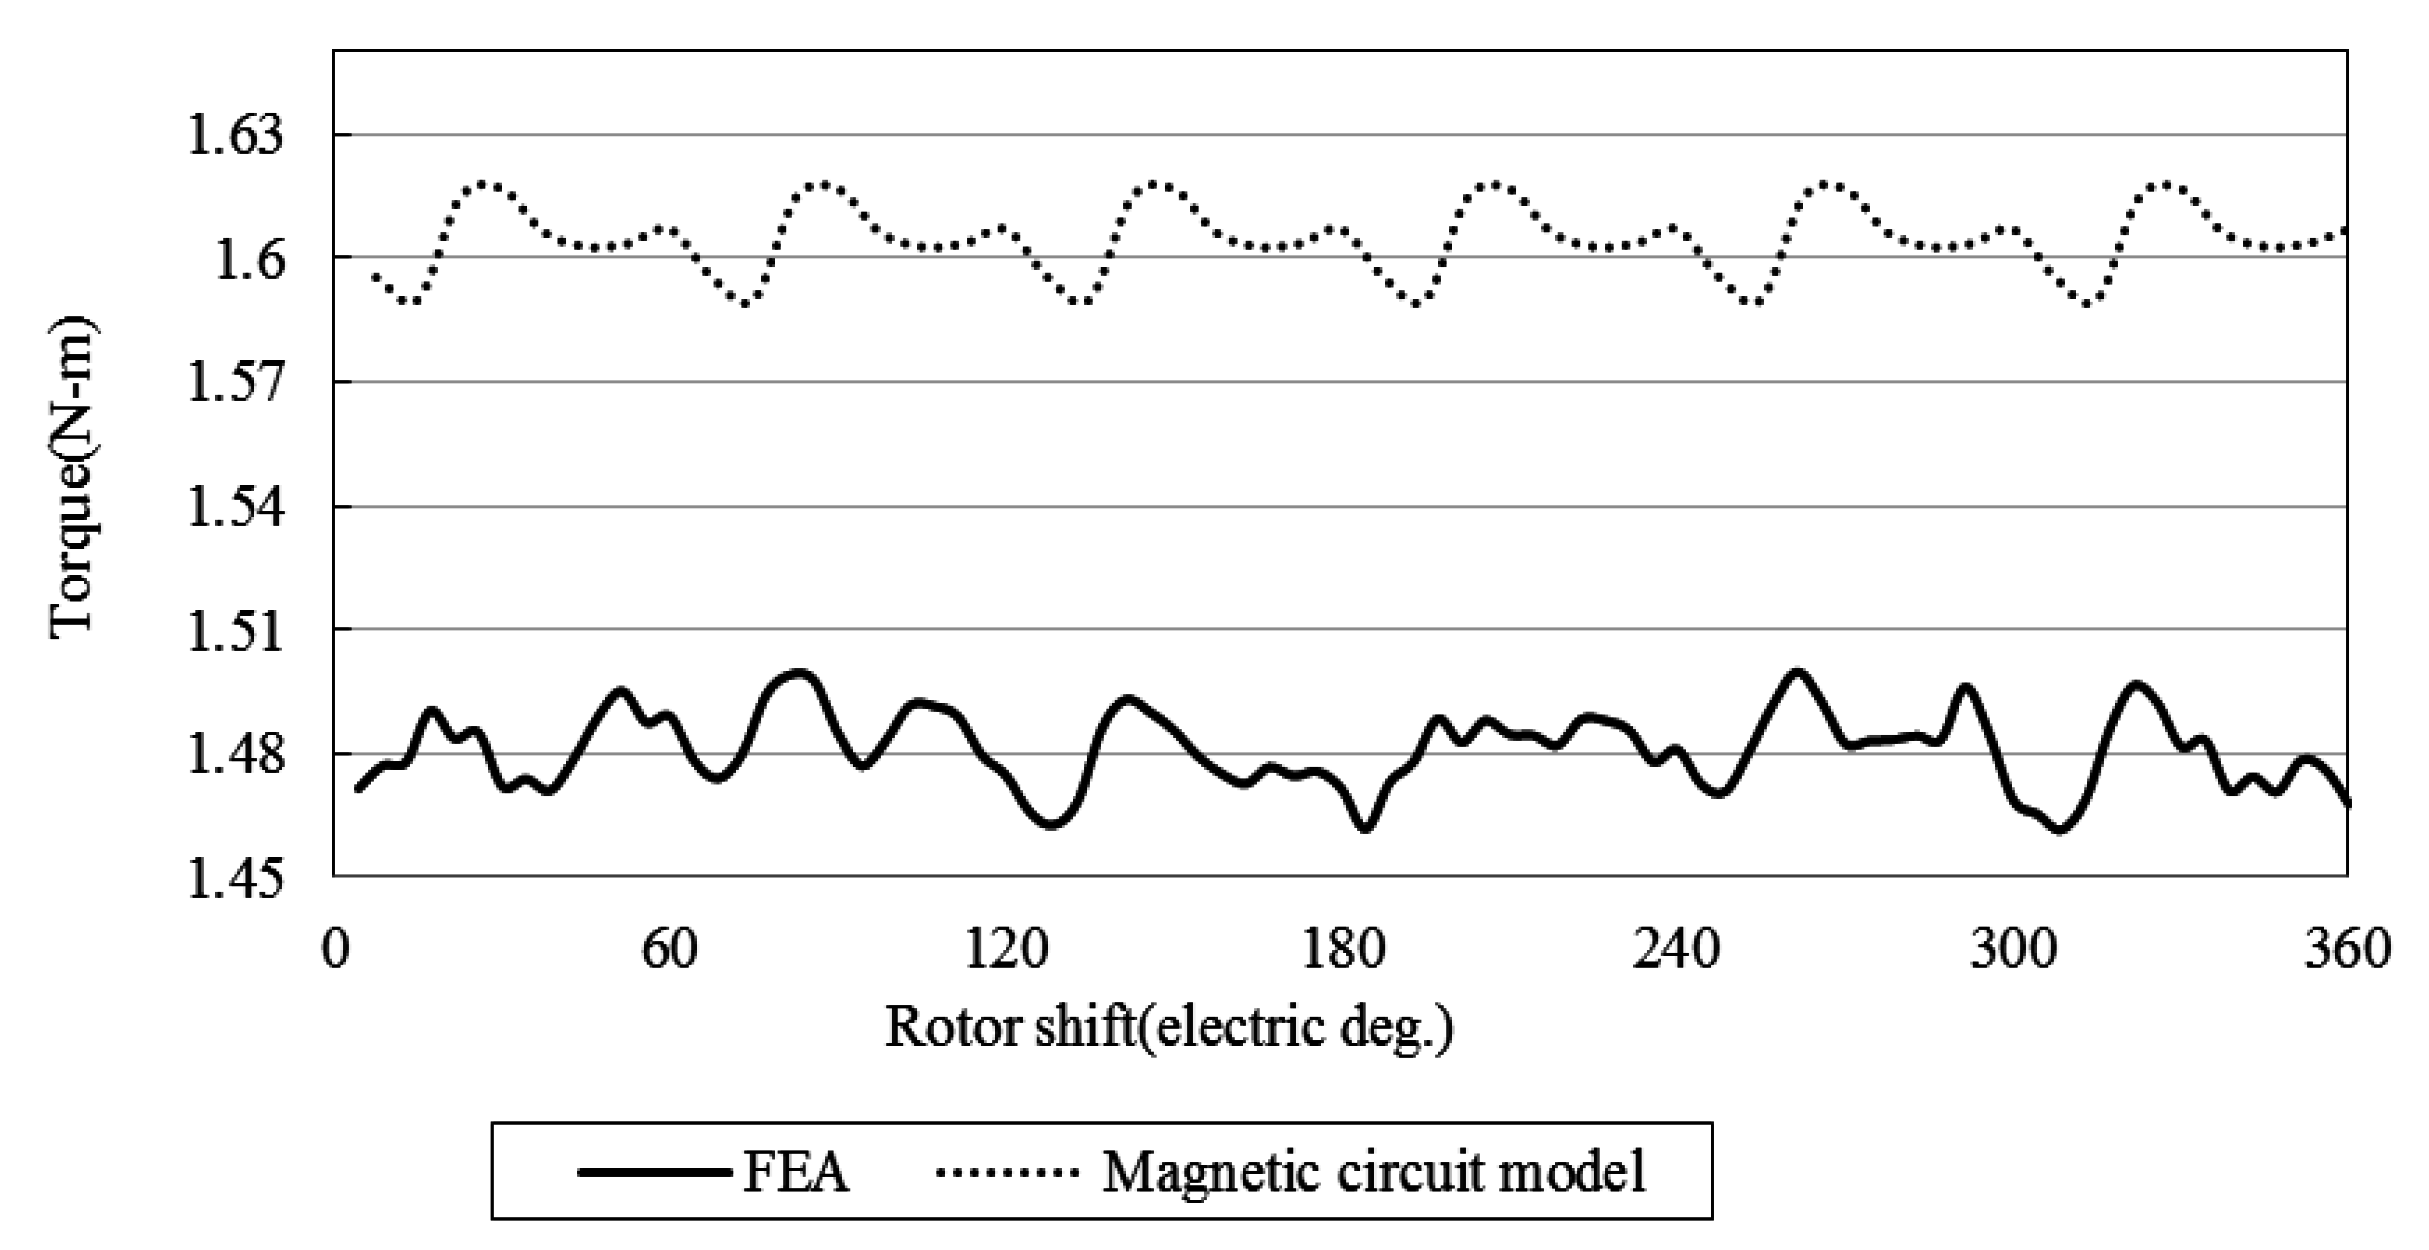
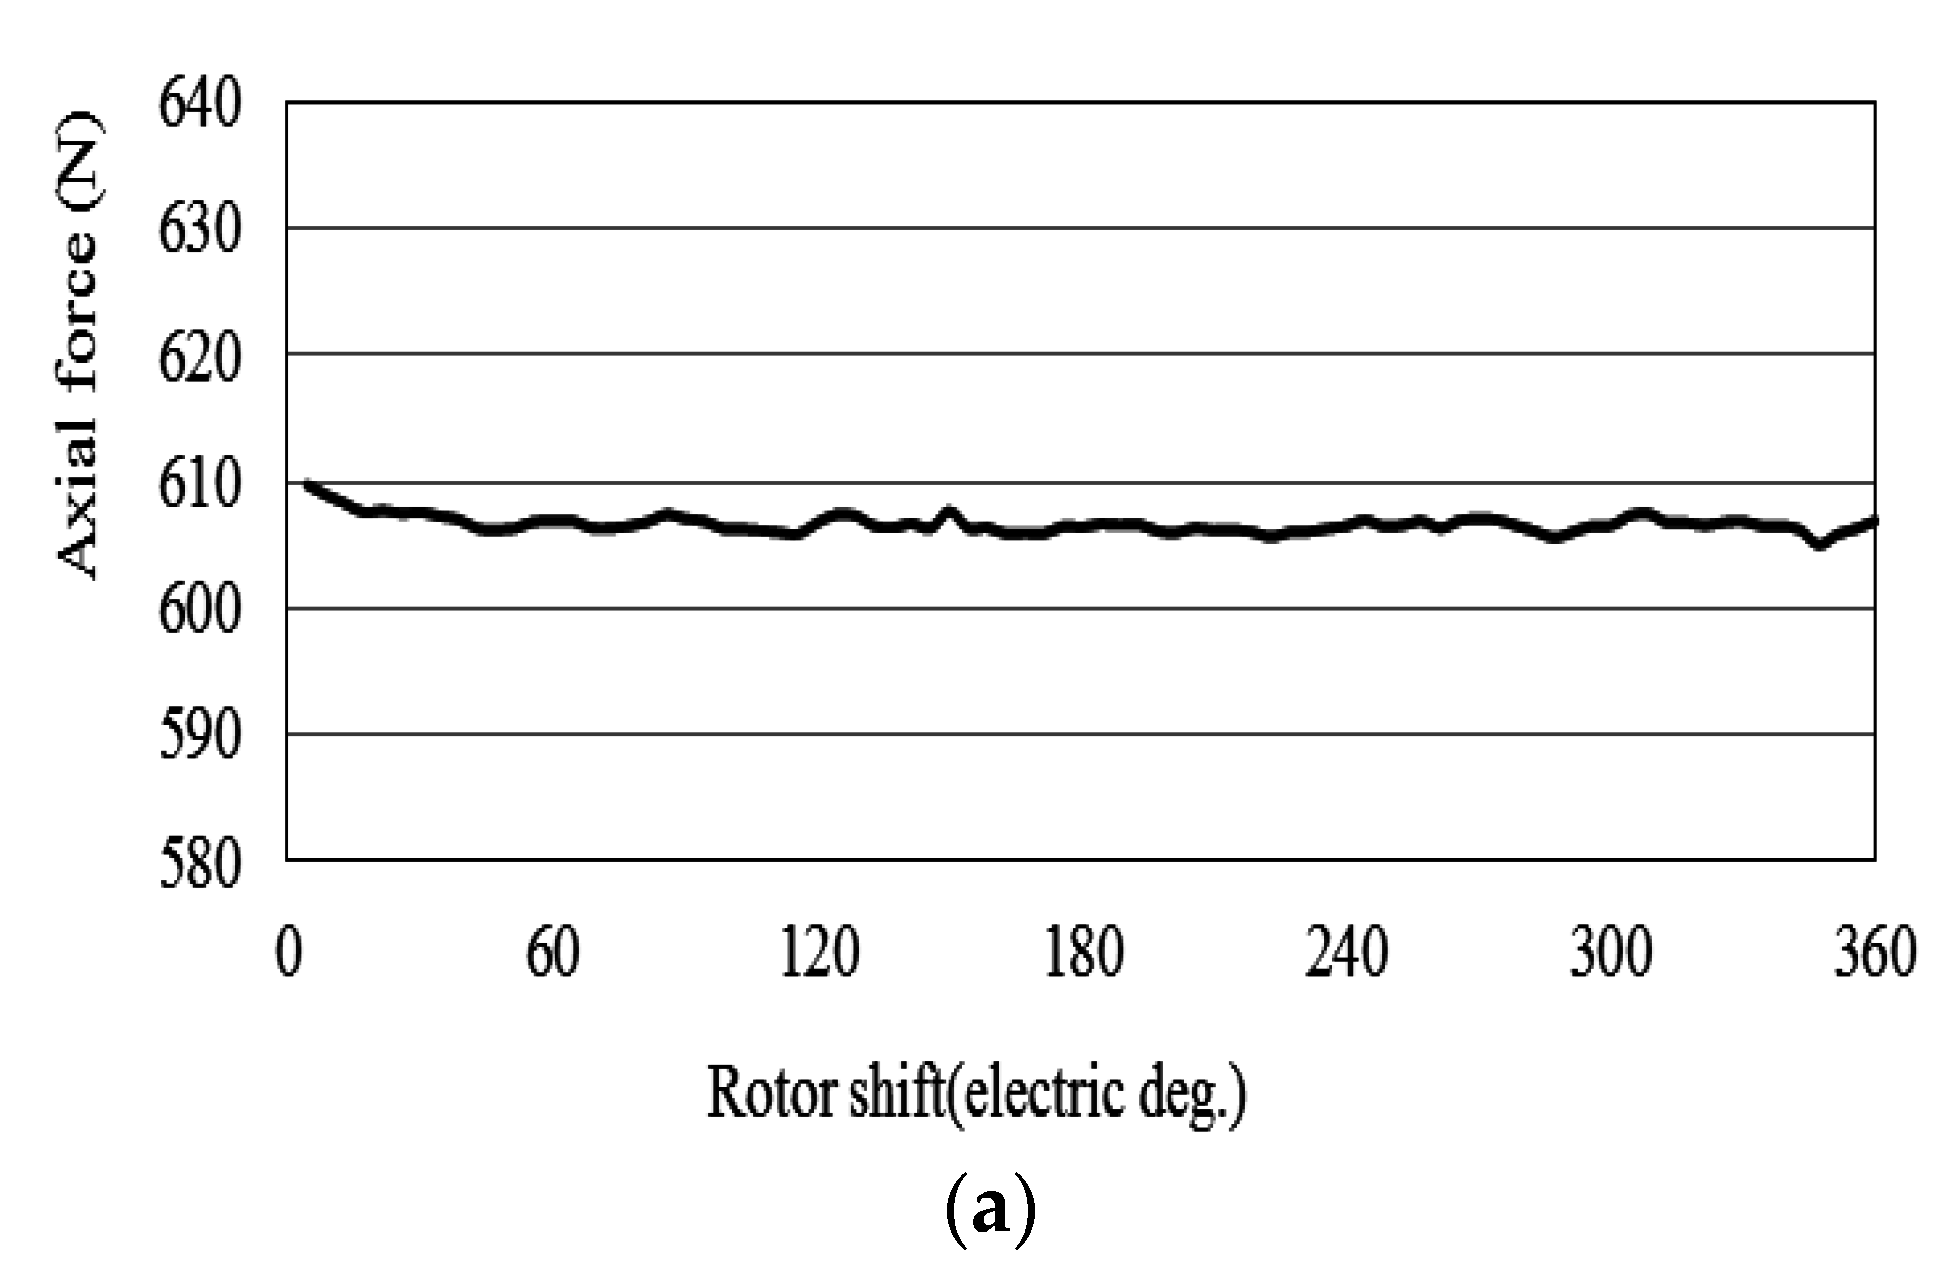
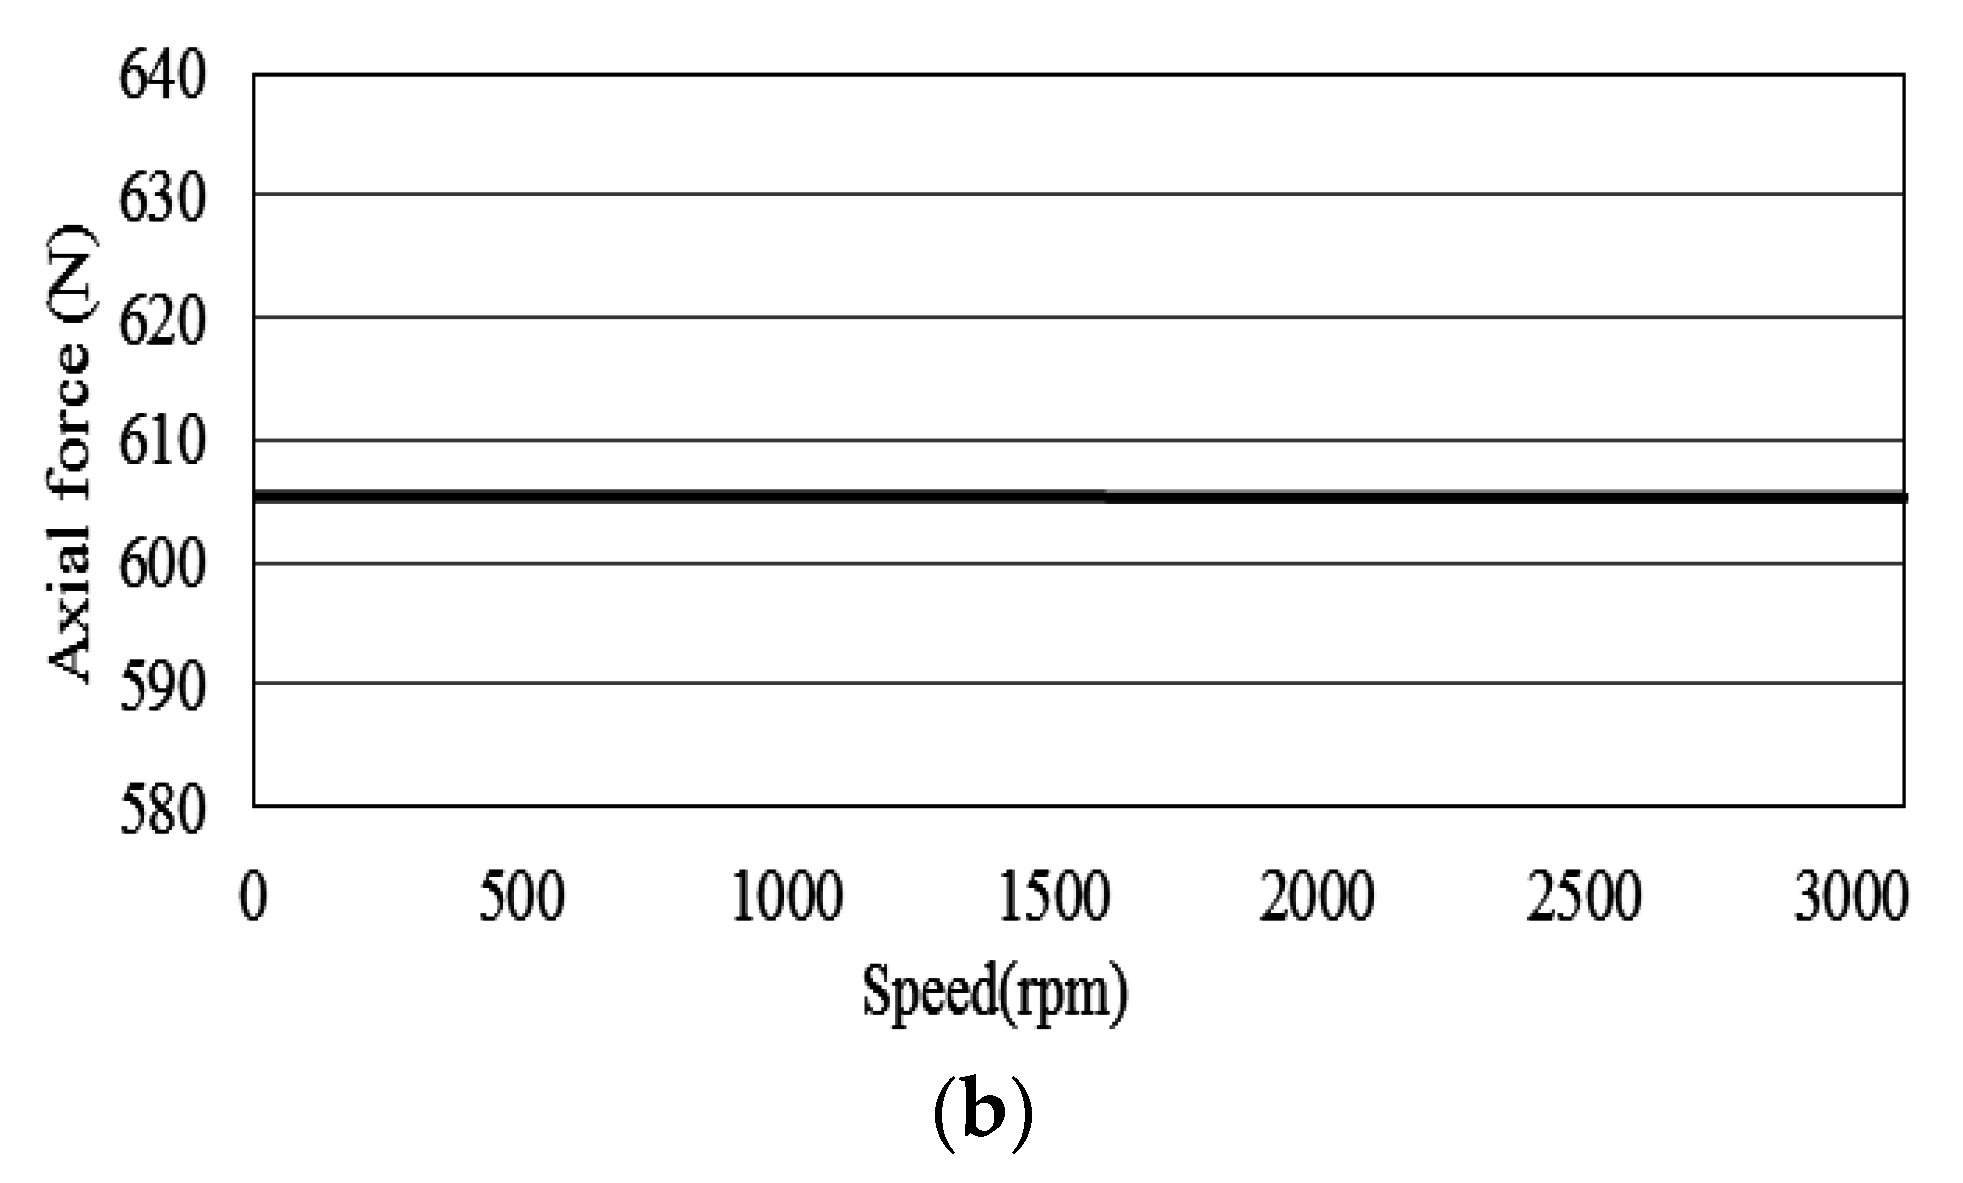
4.1. Electromagnetic Analysis

The magnetic analyzer Maxwell 3-D (ANSYS) was used to verify the motor performance and refine the motor geometries by a numerical calculation of the 3-D motor configuration. Half of the motor comprised of six slots and seven magnets is sufficient to model and simulate motor performance. The torque distributions at the maximum phase current of 14 A are compared in Figure 5. Figure 5 also reveals that the torque distribution from a 1-D magnetic circuit model is 8.2% higher than the FE results.
Figure 5. Comparison of the torque distributions between the 1-D and FE results.
Energies 08 12421 g005
Moreover, the torque ripple of the FE result is greater than the 1-D magnetic circuit model. To align the magnets to the back iron of the rotor, two 0.1-mm diameter holes were made between two adjacent magnets on the rotor. However, these holes may produce undesirable torque ripples. Figure 6a shows that an axial force is exerted between the stator and the rotor plates in the axial direction. There was little variation, with an average of about 605 N, and no apparent difference for any rotor speed, as shown in Figure 6b. However, the stator and the stator housing must be strong enough to avoid deformation under the enormous axial force.
Figure 6. Axial force: (a) over 360 degrees; and (b) its average versus the rotor speed.
Energies 08 12421 g006aEnergies 08 12421 g006b

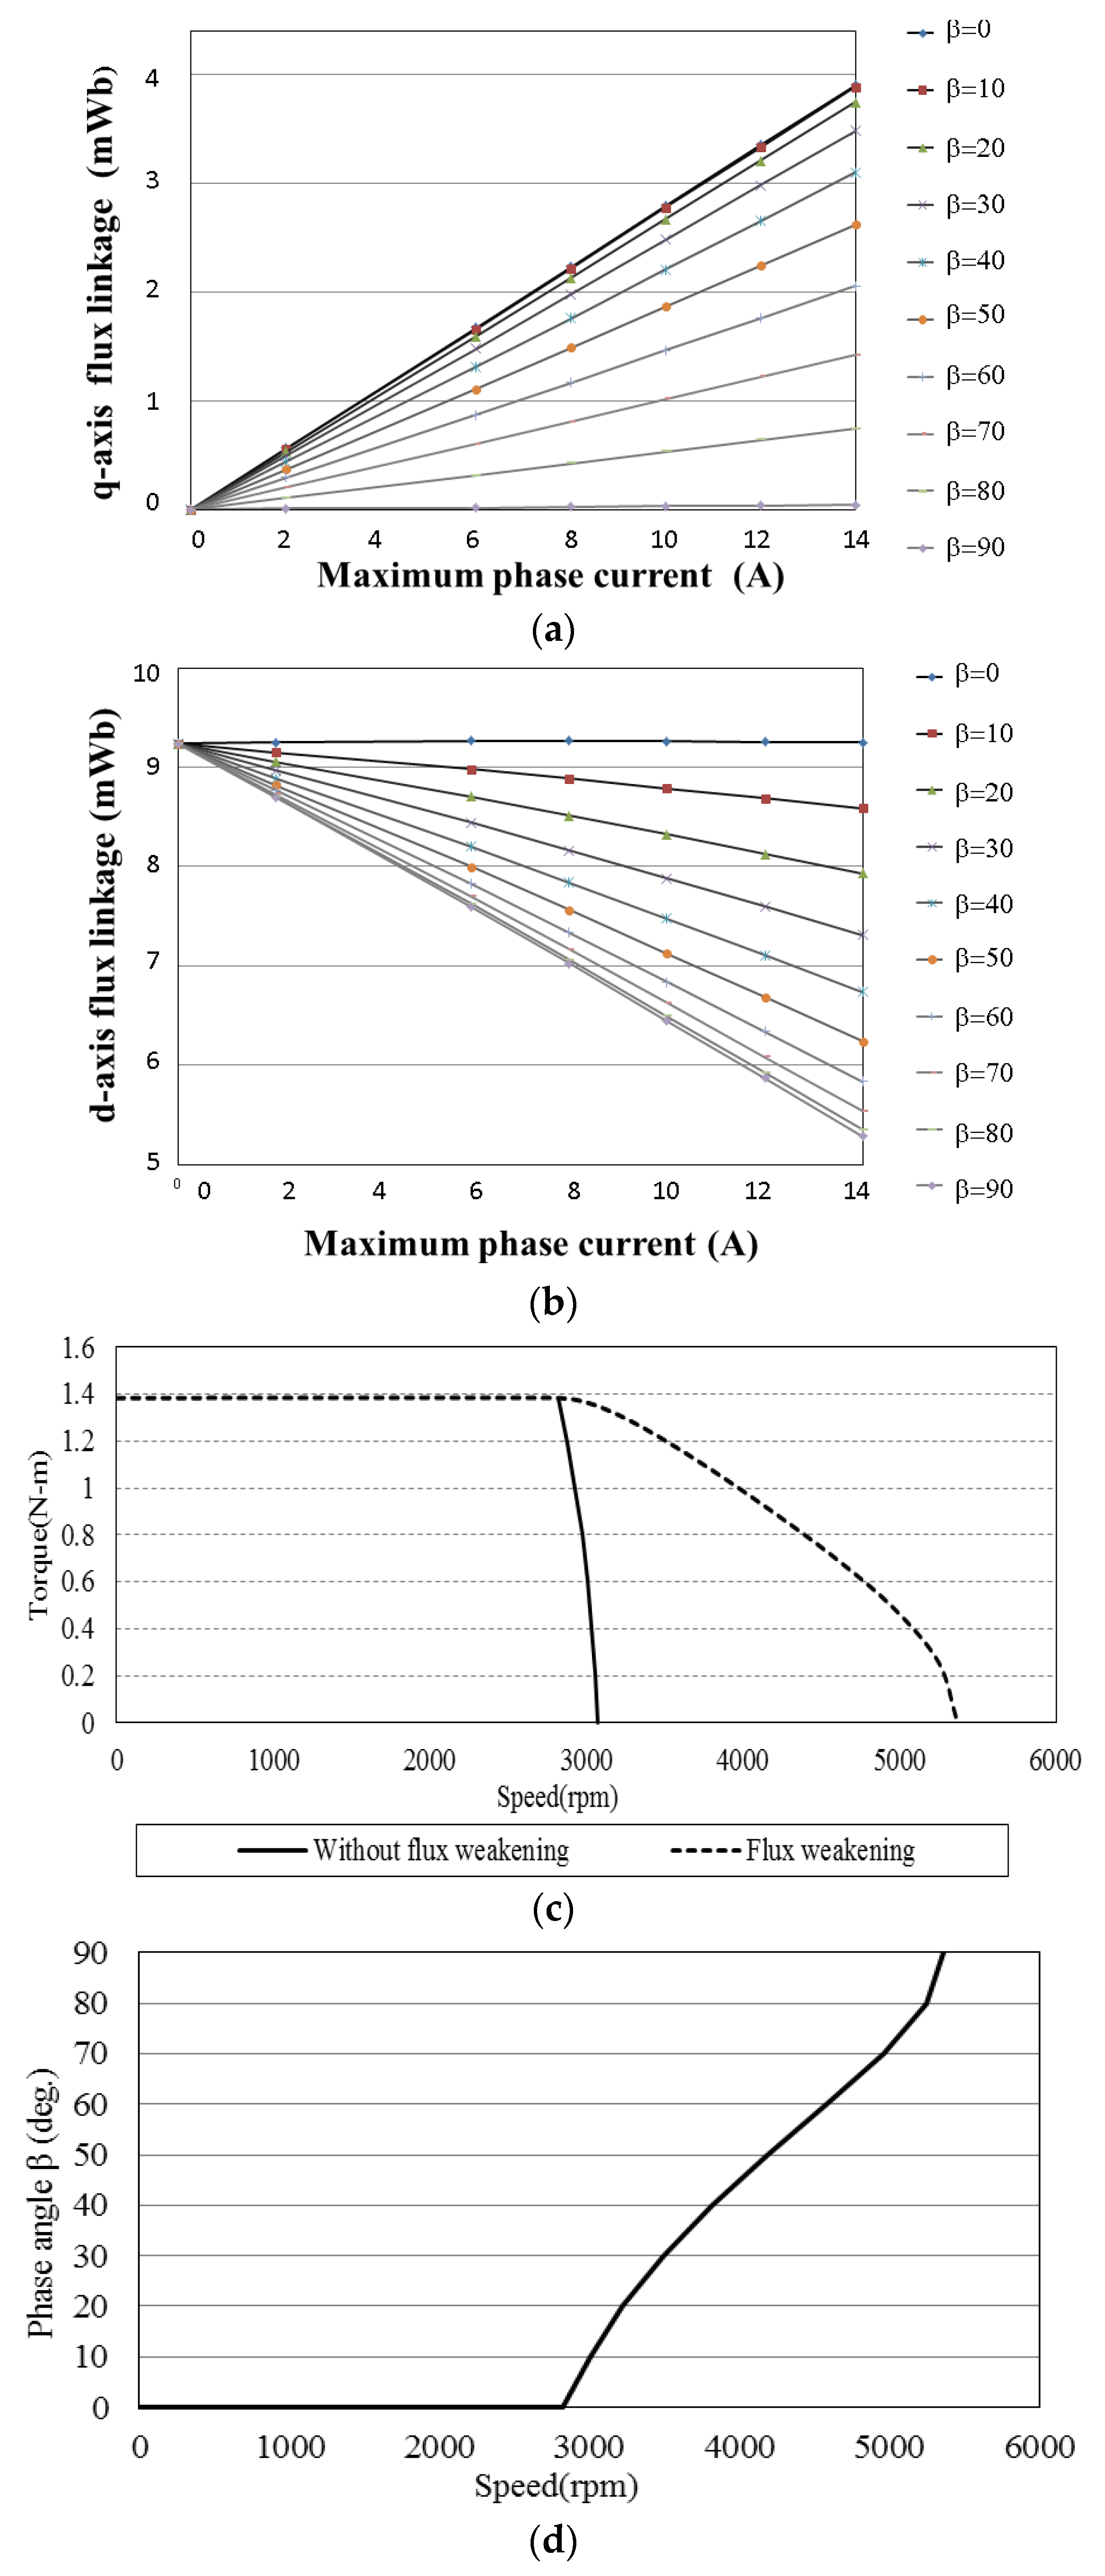
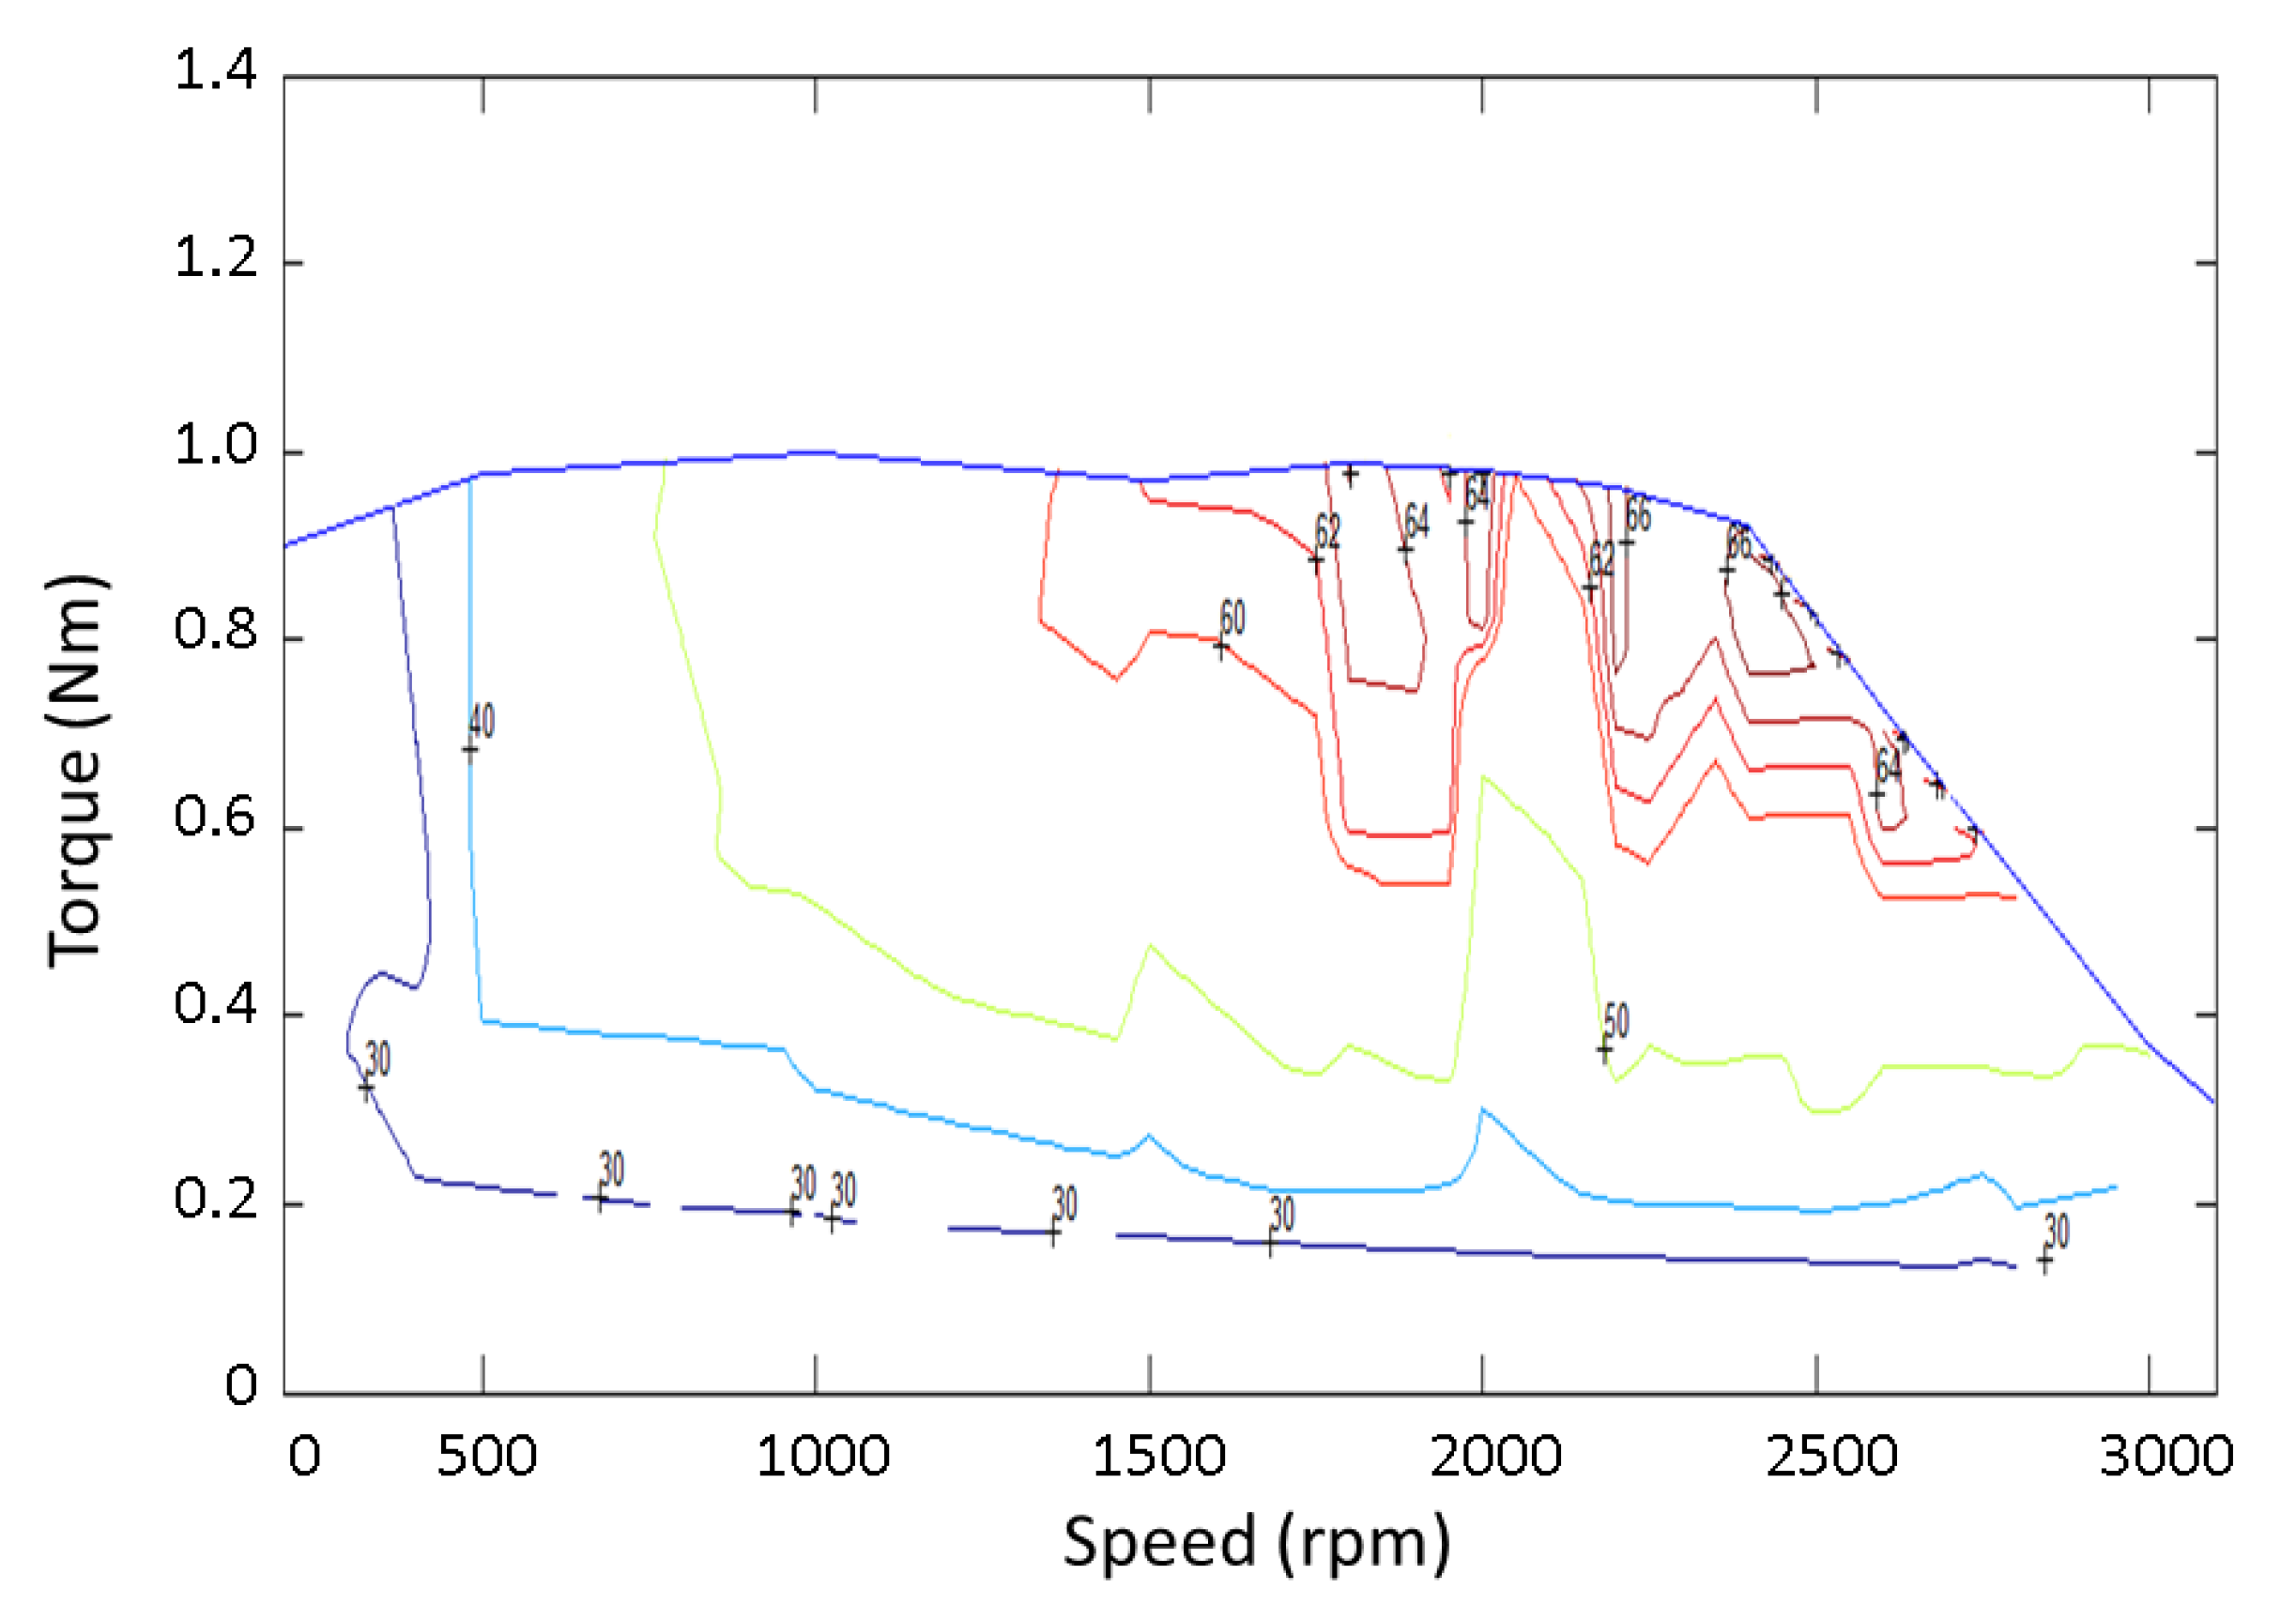
4.2. Estimation of Torque versus Speed (TN) Curve

The performance of PM motors has been improved by the wide use of the flux-weakening method to extend the motor speed range. This can be achieved by estimating the middle motor torque versus speed (TN) curve, based on the theory of maximum torque per ampere (MTPA) and the flux linkage method [13] by FE analysis. Two-axis variables, such as d- and q-axis voltages, currents, and inductances transformed from three-phase variables are used to describe the motor performance. Due to the coupling nature, the d- and q-axis flux linkages are functions of both the d-axis current id and the q-axis current iq. The torque production is expressed as:
T = 3 2 N m 2 [ ( ( λ d ( i d , i q ) i q λ q ( i d , i q ) ) i d ]
I m a x 2 I 2 = i d 2 + i q 2
where λd and λq are obtained from the FE analysis; I is the phase current; id = −Isinγ, id = Isinγ; and γ is the lead angle of the phase current. The voltages applied in the d-axis Vd, and q-axis Vq are:
V d = R p h i d ω e λ q
V q = R p h i q + ω e λ d
where Rph is the phase resistance; λd = Ldid + λm, λq = Lqiq, Ld and Lq are the d-axis and q-axis inductances, respectively; and λm is the magnet flux linkage.
Figure 7a,b show that the d- and q-axis flux linkages vary with the phase currents and lead angles. When the leading angle is zero, the input current does not have a component in the d-axis, and λd should equal λm. The cross-coupling effect is not significant in the q-axis, and the q-axis flux linkage λq is approximately linear with respect to the maximum phase current for various phase lead angles, as shown in Figure 7b. In addition, at the same phase current in which the lead angle of the phase current is reduced, the d-axis flux linkage λd increases as id is reduced in magnitude. In contrast, the q-axis flux linkage λq increases as iq rises. Here, the average d- and q-axis inductances are determined at β = 0, which are Ld = 0.276 mH and Lq = 0.279 mH, respectively.
After the maximum torque was obtained by Equation (13), the corresponding optimal currents ido and iqo were used over the constant torque operating region from Equation (14) to Equation (16). The corner speed of the TN curve is obtained as:
ω e = R p h ( i d λ q i q λ d ) + V m a x 2 ( λ q 2 + λ d 2 ) R p h 2 ( i d λ d + i q λ q ) 2 λ q 2 + λ d 2 | i d = i d o i q = i q o
Figure 7. (a) The q-axis flux linkages; (b) d-axis flux linkages; (c) TN curves with and without the flux-weakening control; and (d) the corresponding current lead angle against the speed with a flux-weakening control.
Energies 08 12421 g007
When the flux-weakening operating region, Vmax is applied, and id, as well as iq are controlled to maintain Vd2 +Vq2 = V2max, then set
i q = i q o j Δ i q
where Δiq = iqo/n is the current increment; and j is an integer from 1 to n. The id was obtained by Equation (14), and the corresponding λd and λq were found from Figure 7a,b. From the above parameters, we can determine the corresponding speed and torque by Equation (13) and (18), respectively. The resulting TN curves with and without the flux weakening control based on the MTPA theory are shown in Figure 7c, in which the maximum current is 14 A and the maximum voltage is 36 V. In the constant torque range, the best current angle was found to be zero, as expected. However, in the field-weakening region, the maximum torque is increased by applying the phase current with the top lead angle at various motor speeds, as depicted in Figure 7d. Moreover, the maximum speed of the motor with a flux-weakening control can be extended to 1.8 times of that without a flux-weakening control.

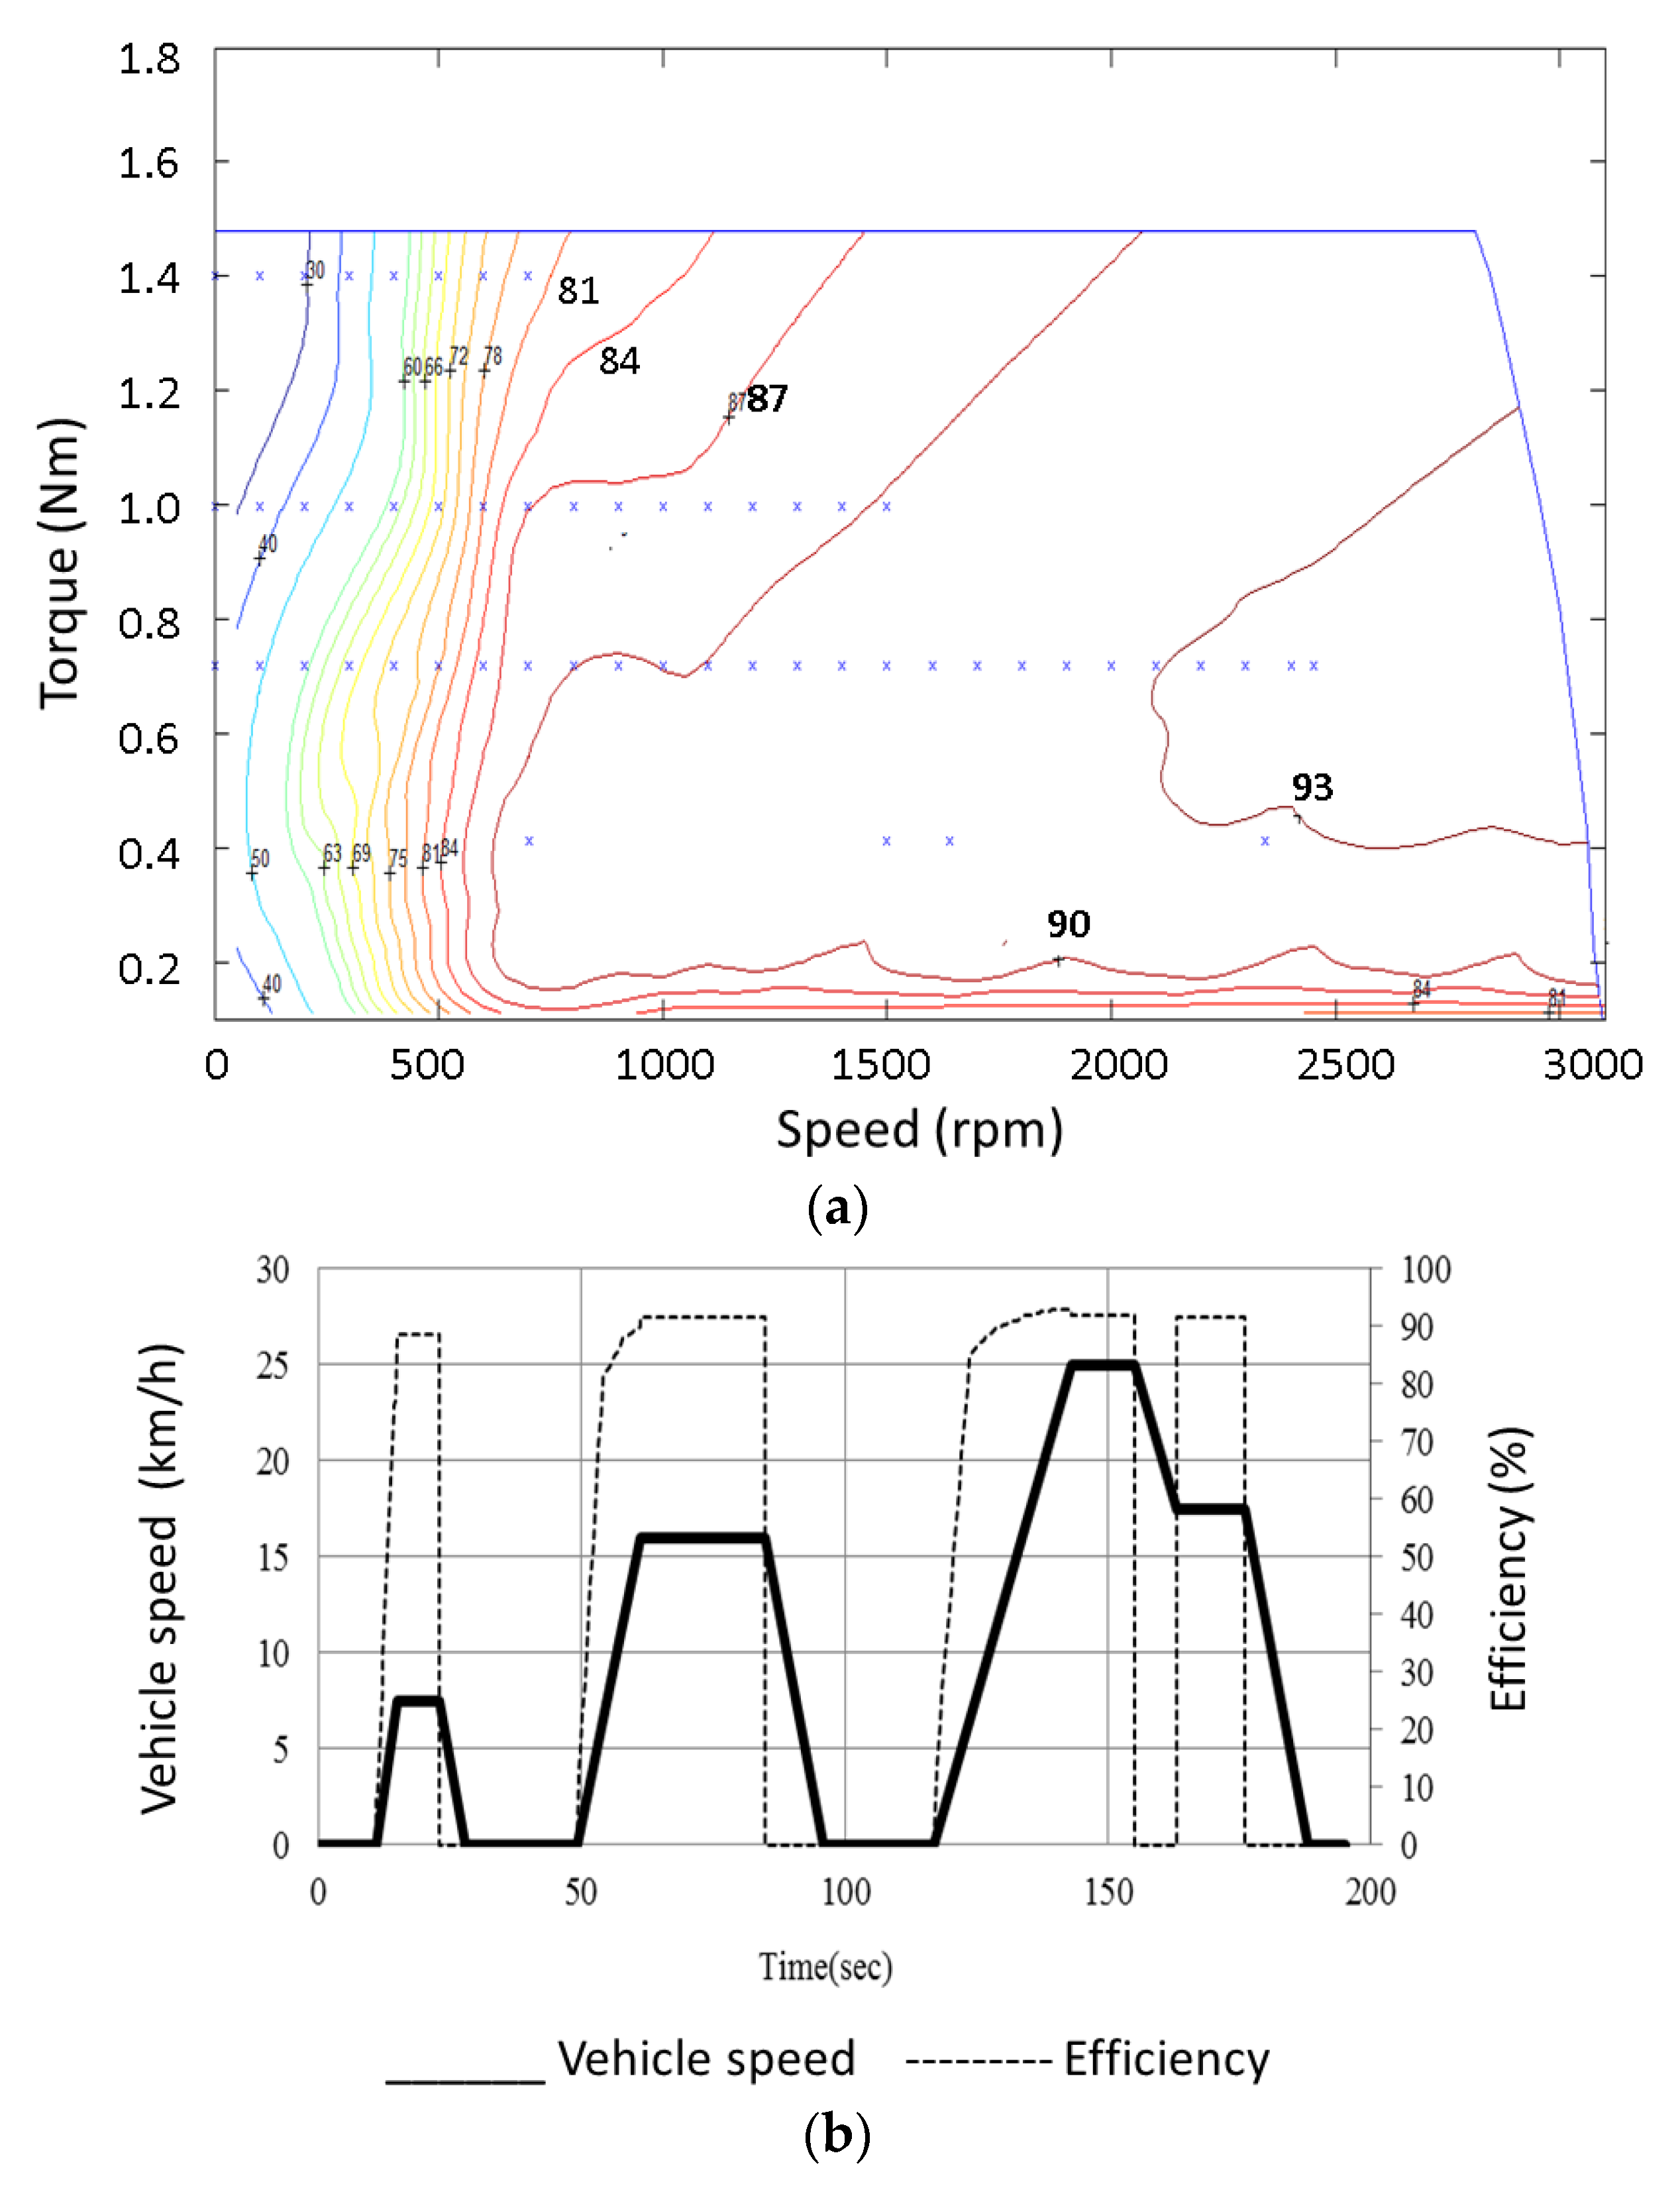
4.3. Efficiency Analysis and Driving Performance

The energy efficiency η of the AFPM motor is determined by the relationship:
η = T ω m T ω m + P r + P s + P v 100 %
where ωm is the mechanical angular speed of the motor; Pr is the copper loss; Ps is the stray loss; and Pv is the core loss. The copper loss is determined by:
P r = ( i a 2 + i b 2 + i c 2 ) R p h
where i represent the root-mean-square values of the phase currents.
The core loss Pv, including hysteresis loss Ph, eddy current loss Pc, and excess loss Pe [14], is defined as:
P v = P h + P c + P a = k h f B m 2 + k c f 2 B m 2 + k a f 2 B m 2
where Bm is the flux density in the core; f is the electric frequency; kh is the coefficient of hysteresis loss; kc is a coefficient of the eddy current loss that changes with different materials; and ka is the coefficient of excess loss related to the material thickness, cross-sectional area, conductivity, and a parameter that describes the material microstructure. In addition, we fitted the core loss curves of the soft magnetic composite (Somaloy 700 3P) used for the prototype motor, in which kh = 619.52 W/HzT2, kc = 0.15 W/Hz2T2, and ka = 9.19 W/Hz1.5T1.5. The stray loss Ps, comprised of windage and friction, is assumed to be 5% of the total loss. Since the permanent magnet on the rotor experiences very little variation of magnetic flux, the PM eddy current loss is much lower than the core loss in stator and is, therefore, negligible in the efficiency calculation. The resulting torque, speed, and efficiency (TNE) map of the middle motor was then estimated, as shown in Figure 8a.
Various driving cycles have been scheduled for emission measurement and certification of vehicles and engines in terms of vehicle speed against time. However, there has not been a specific method of driving proposed for e-bike efficiency. However, the European test cycle ECE-40 was adopted in the present study by setting the highest speed limit at 25 km/h for the e-bike driven by the proposed mid-drive unit. The driving efficiency history of the pedelec is provided in Figure 8b by searching for the corresponding operation points on the efficiency map of Figure 8a. The average efficiency is estimated to be 71.3% per driving cycle. Here, the efficiency of the cycloidal reducer, as well as the transmission gear and chain, is not identifiable and was excluded from the driving efficiency calculation. The prototype mid-drive unit provides lower, but more realistic, efficiency compared to the simulated unit.
Figure 8. (a) Driving points on the efficiency map estimated by the FE analysis; (b) The efficiency history along the ECE-40 driving cycle.
Energies 08 12421 g008

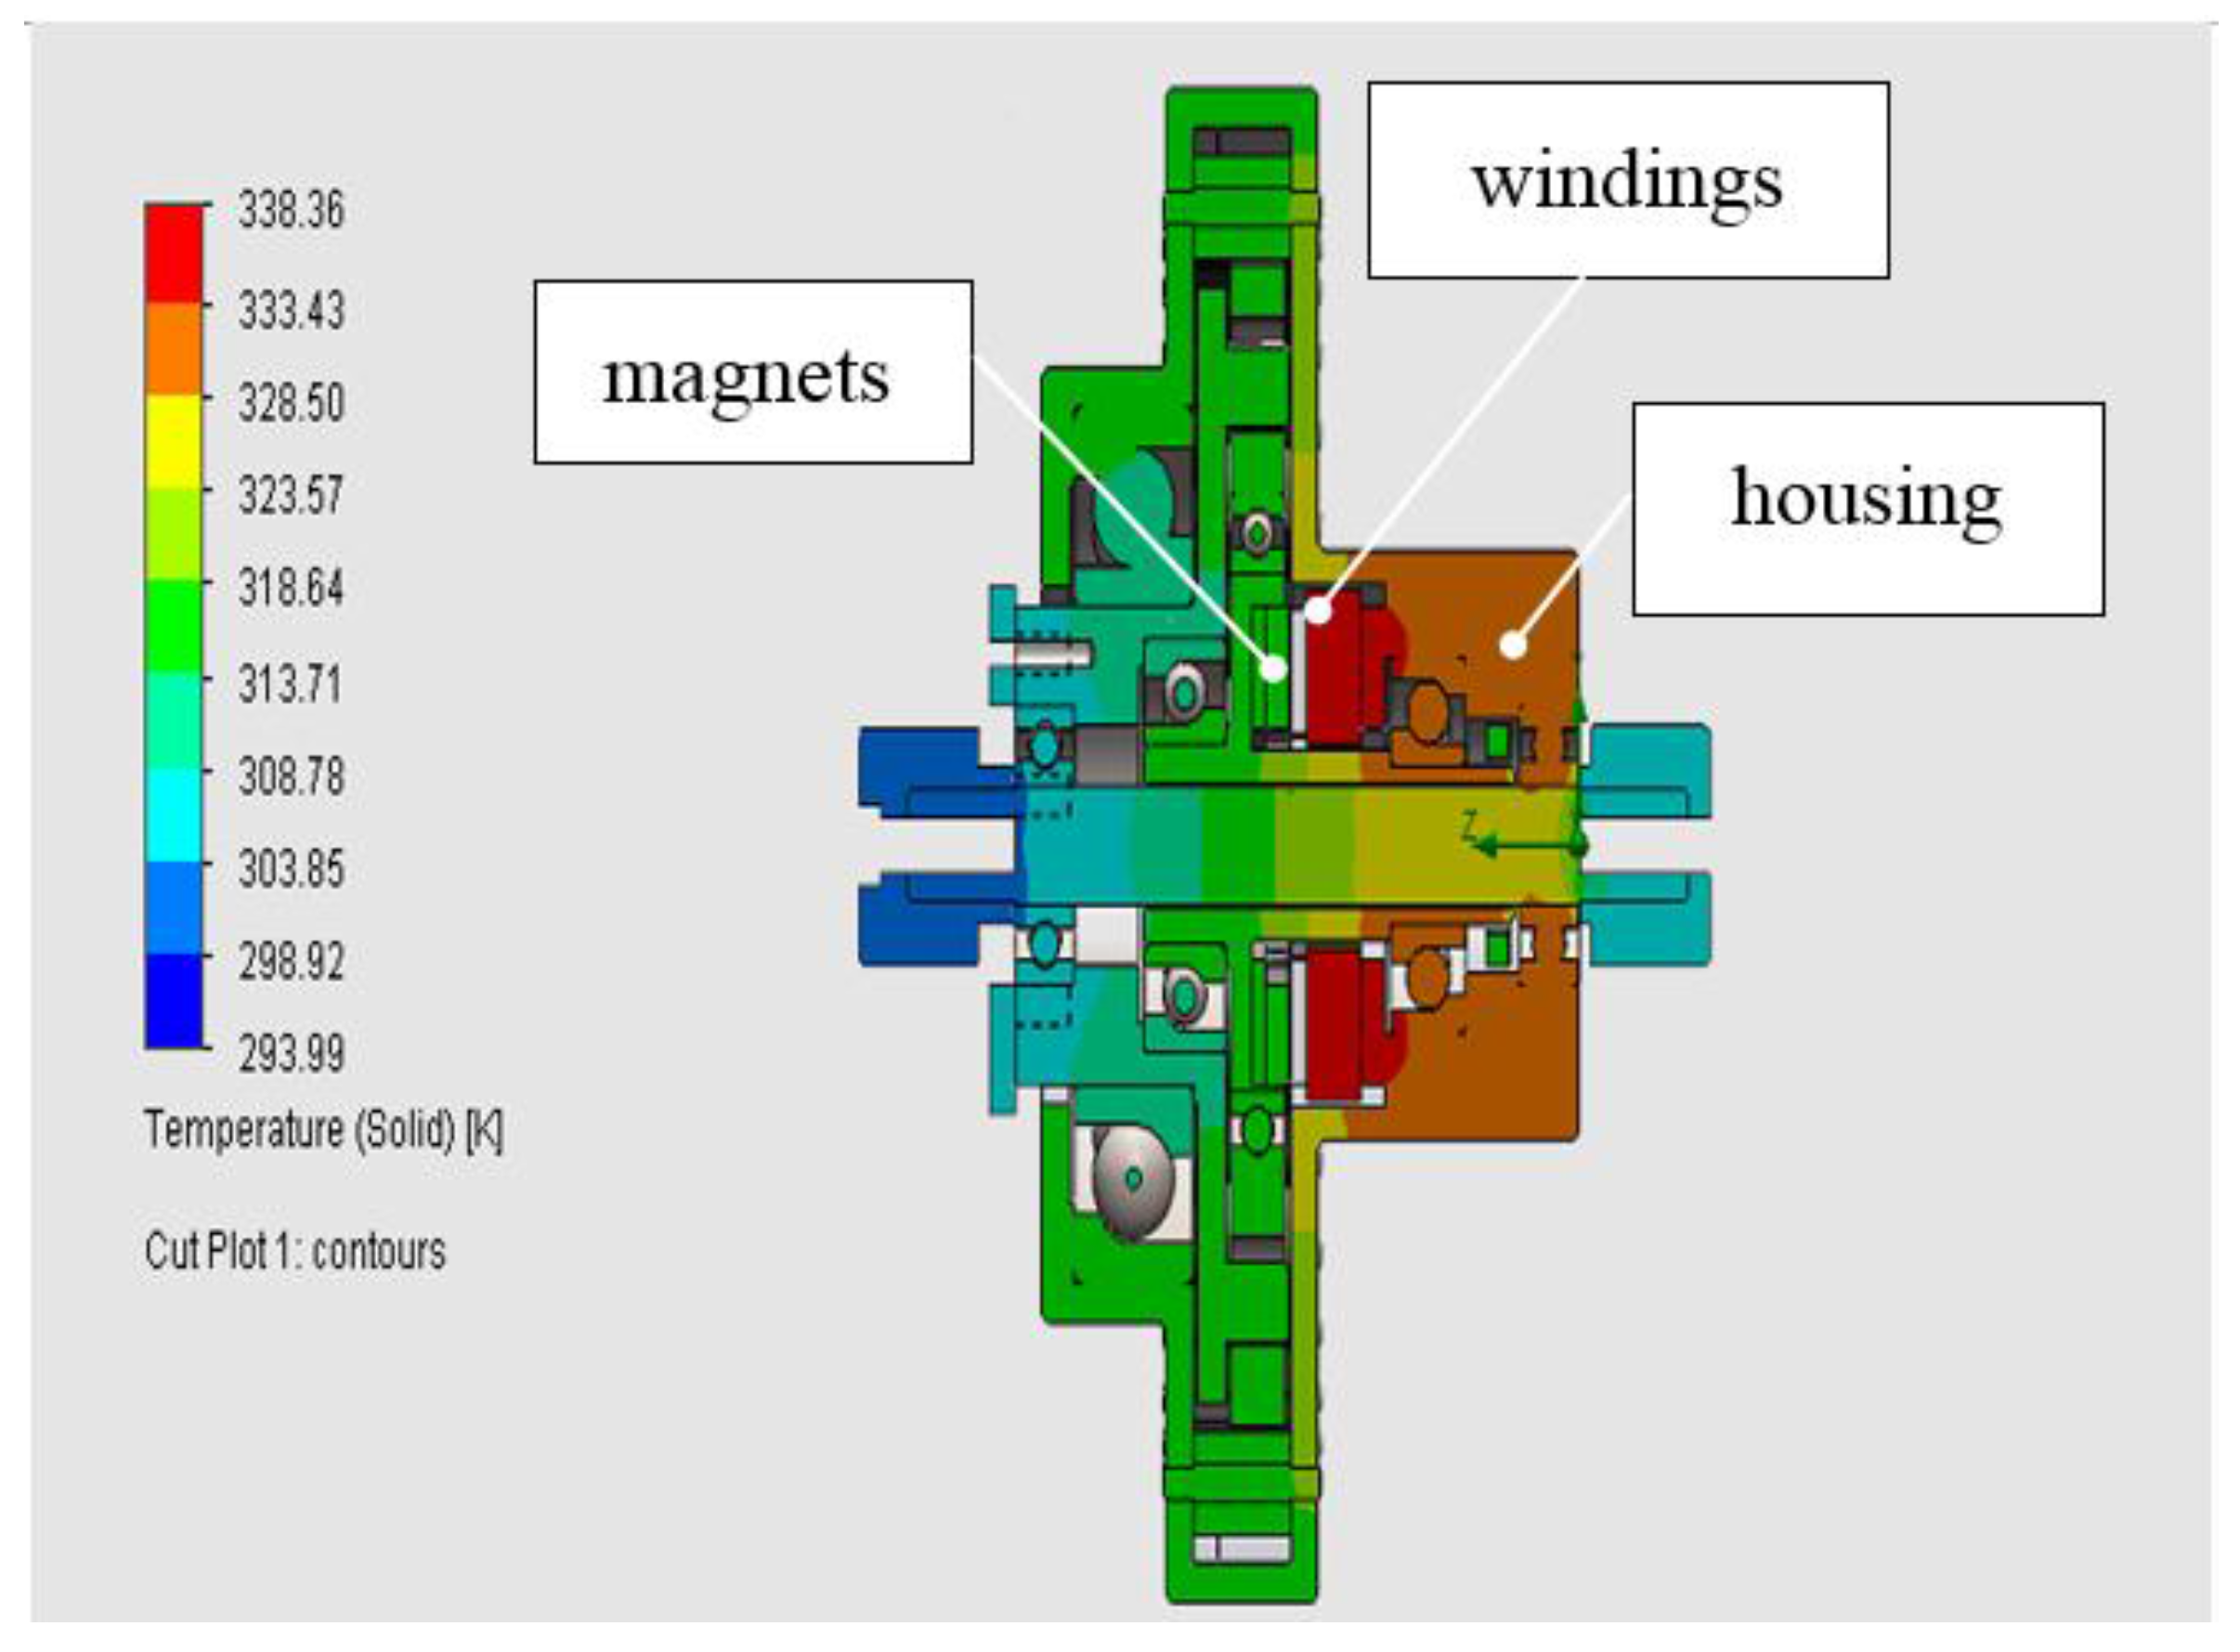
4.4. Thermal Analysis

The steady-state temperature distribution was investigated for the mid-drive unit with a middle motor driving an 80-kg rider on a 25% slope at a constant speed of 10 km/h. The gear ratio between the front and rear sprockets was set to one. The corresponding crank speed was 80.22 rpm, and the motor speed was 2811 rpm. At the maximum torque production of 1.4 Nm by the phase current of 14 A at 36 V, the stator copper loss was 41.44 W and the iron loss was 7.62 W. Figure 9 shows the steady-state temperature distribution on the mid-drive unit after 4100 s. The average stator winding temperature was 64.5 °C (337.5° K), the average magnet temperature was 45.9 °C (318.9° K), and the average housing temperature was 48.3 °C (321.3° K). Since the mid-drive unit is installed on the metal frame of the bike, more heat can be dissipated by the frame’s conduction and convection.
Figure 9. Steady-state temperature distribution (at 4100 s).
Energies 08 12421 g009

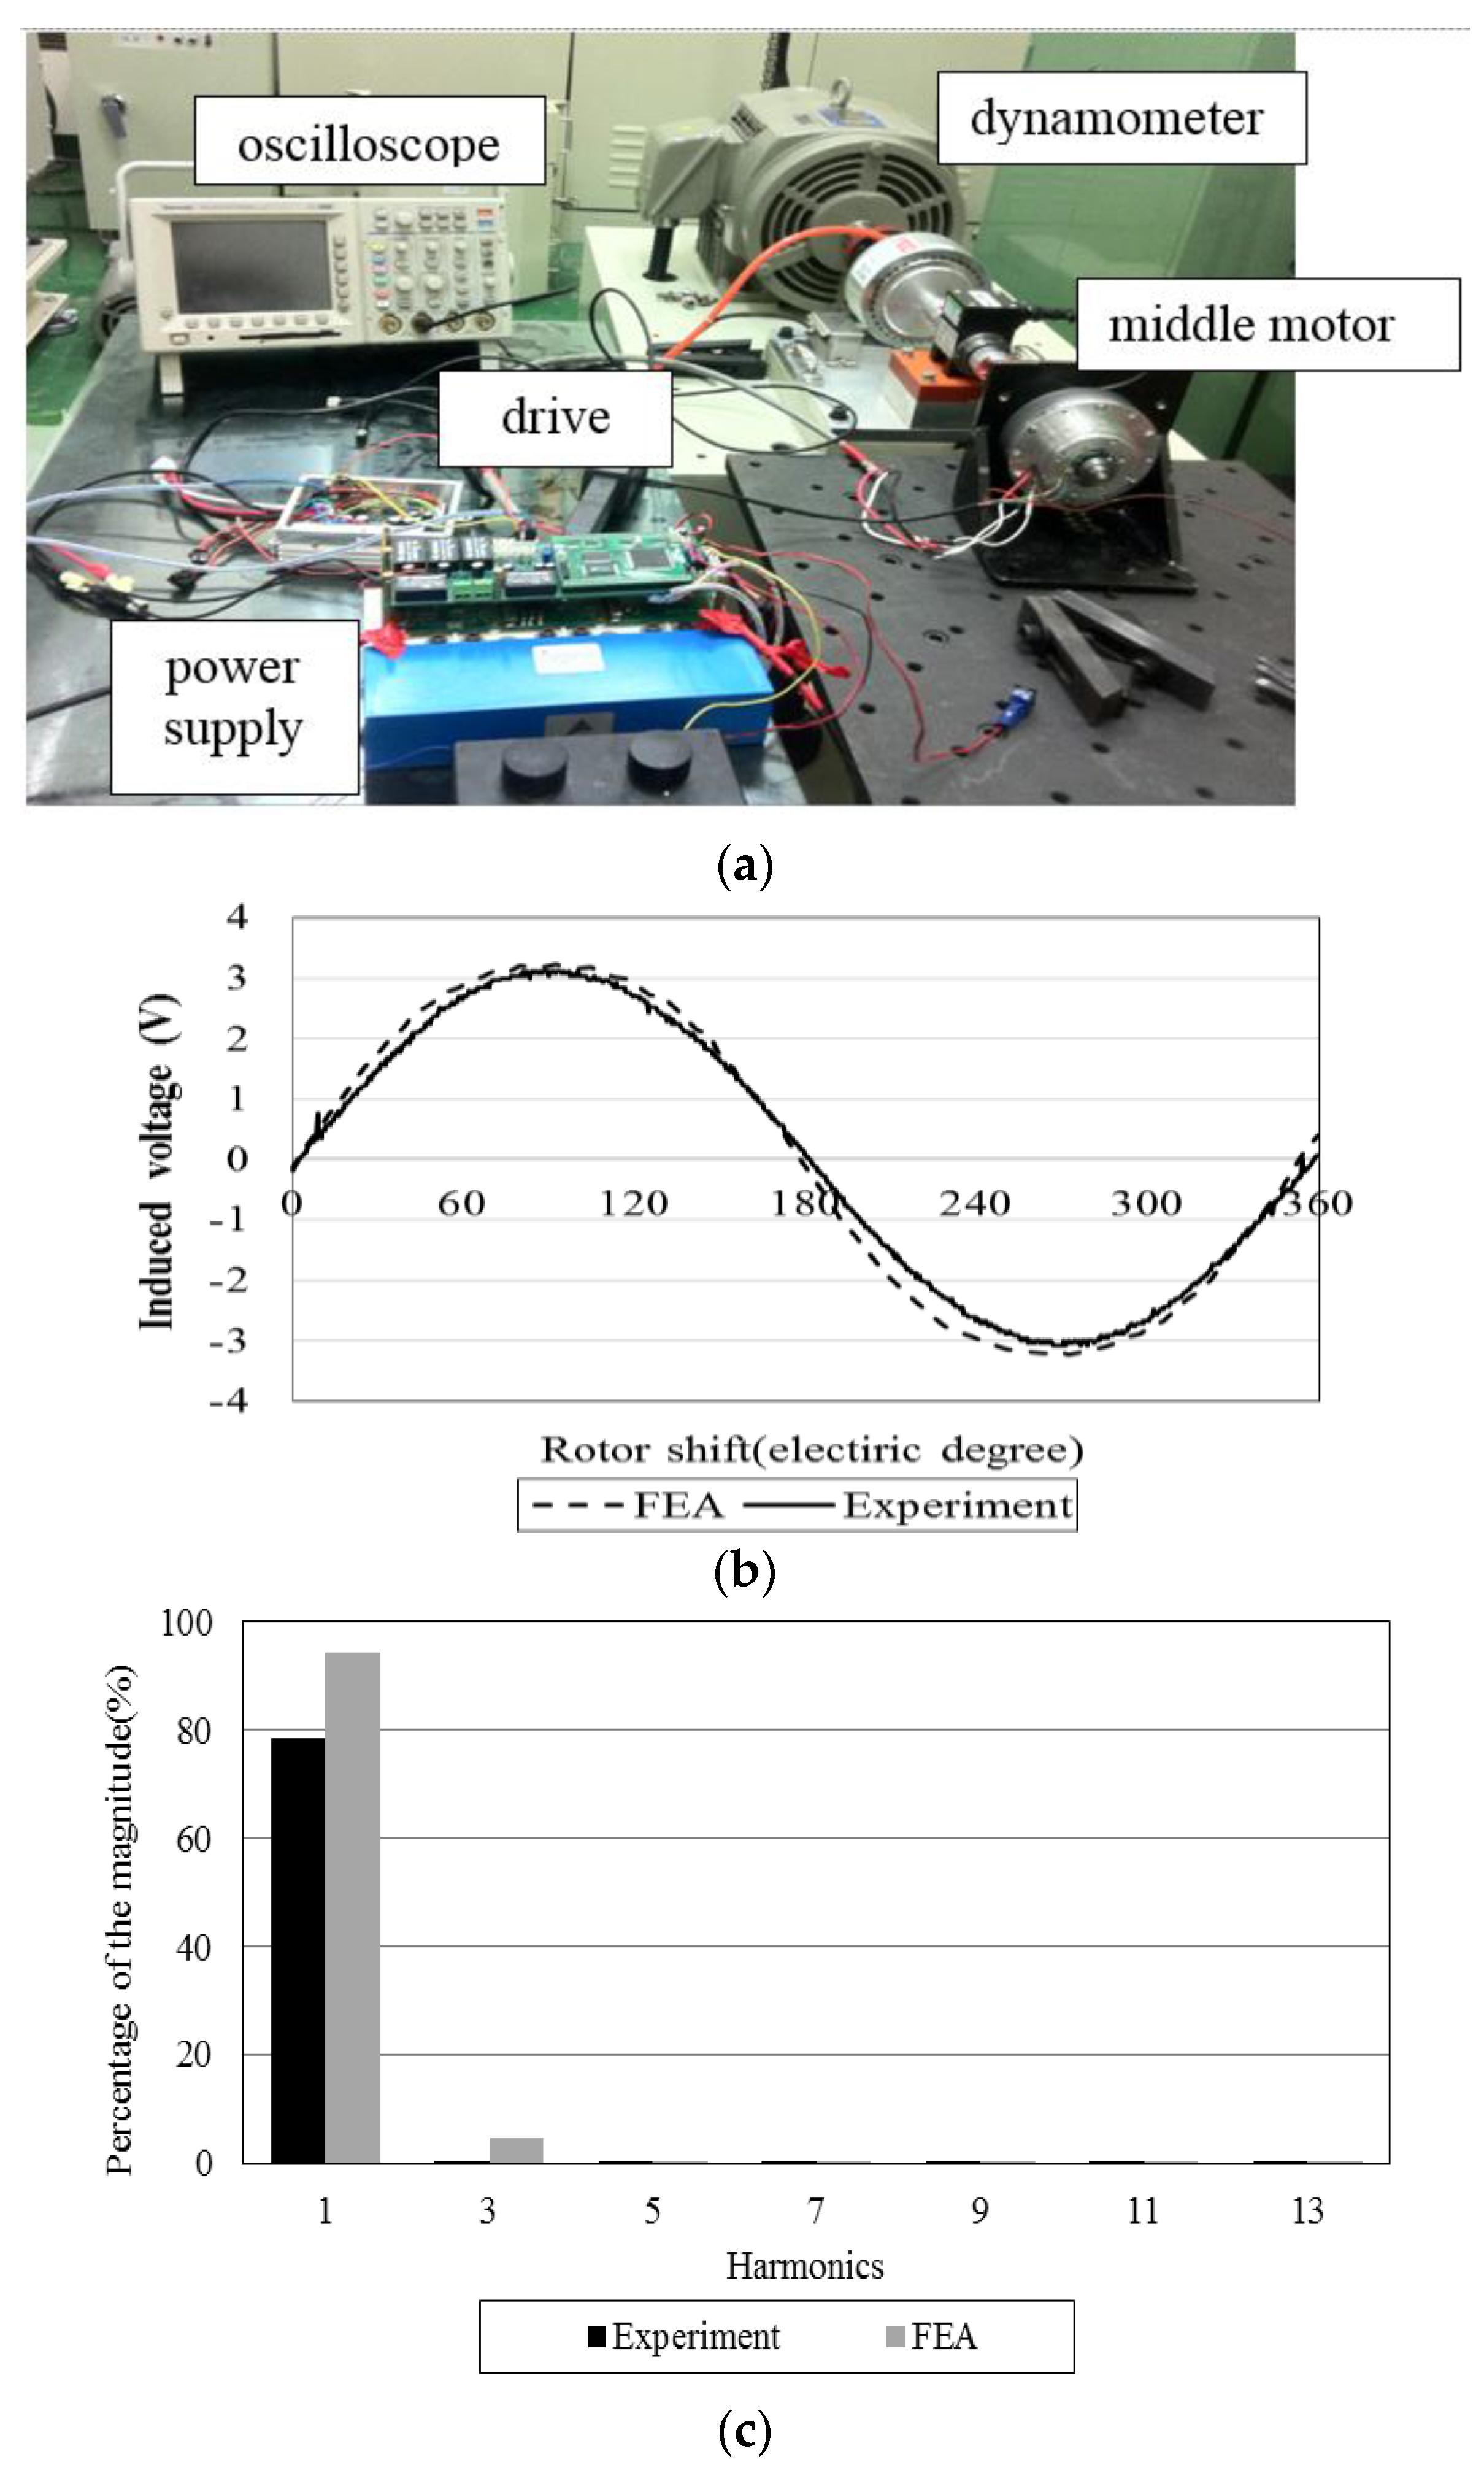
5. Prototype and Experiments

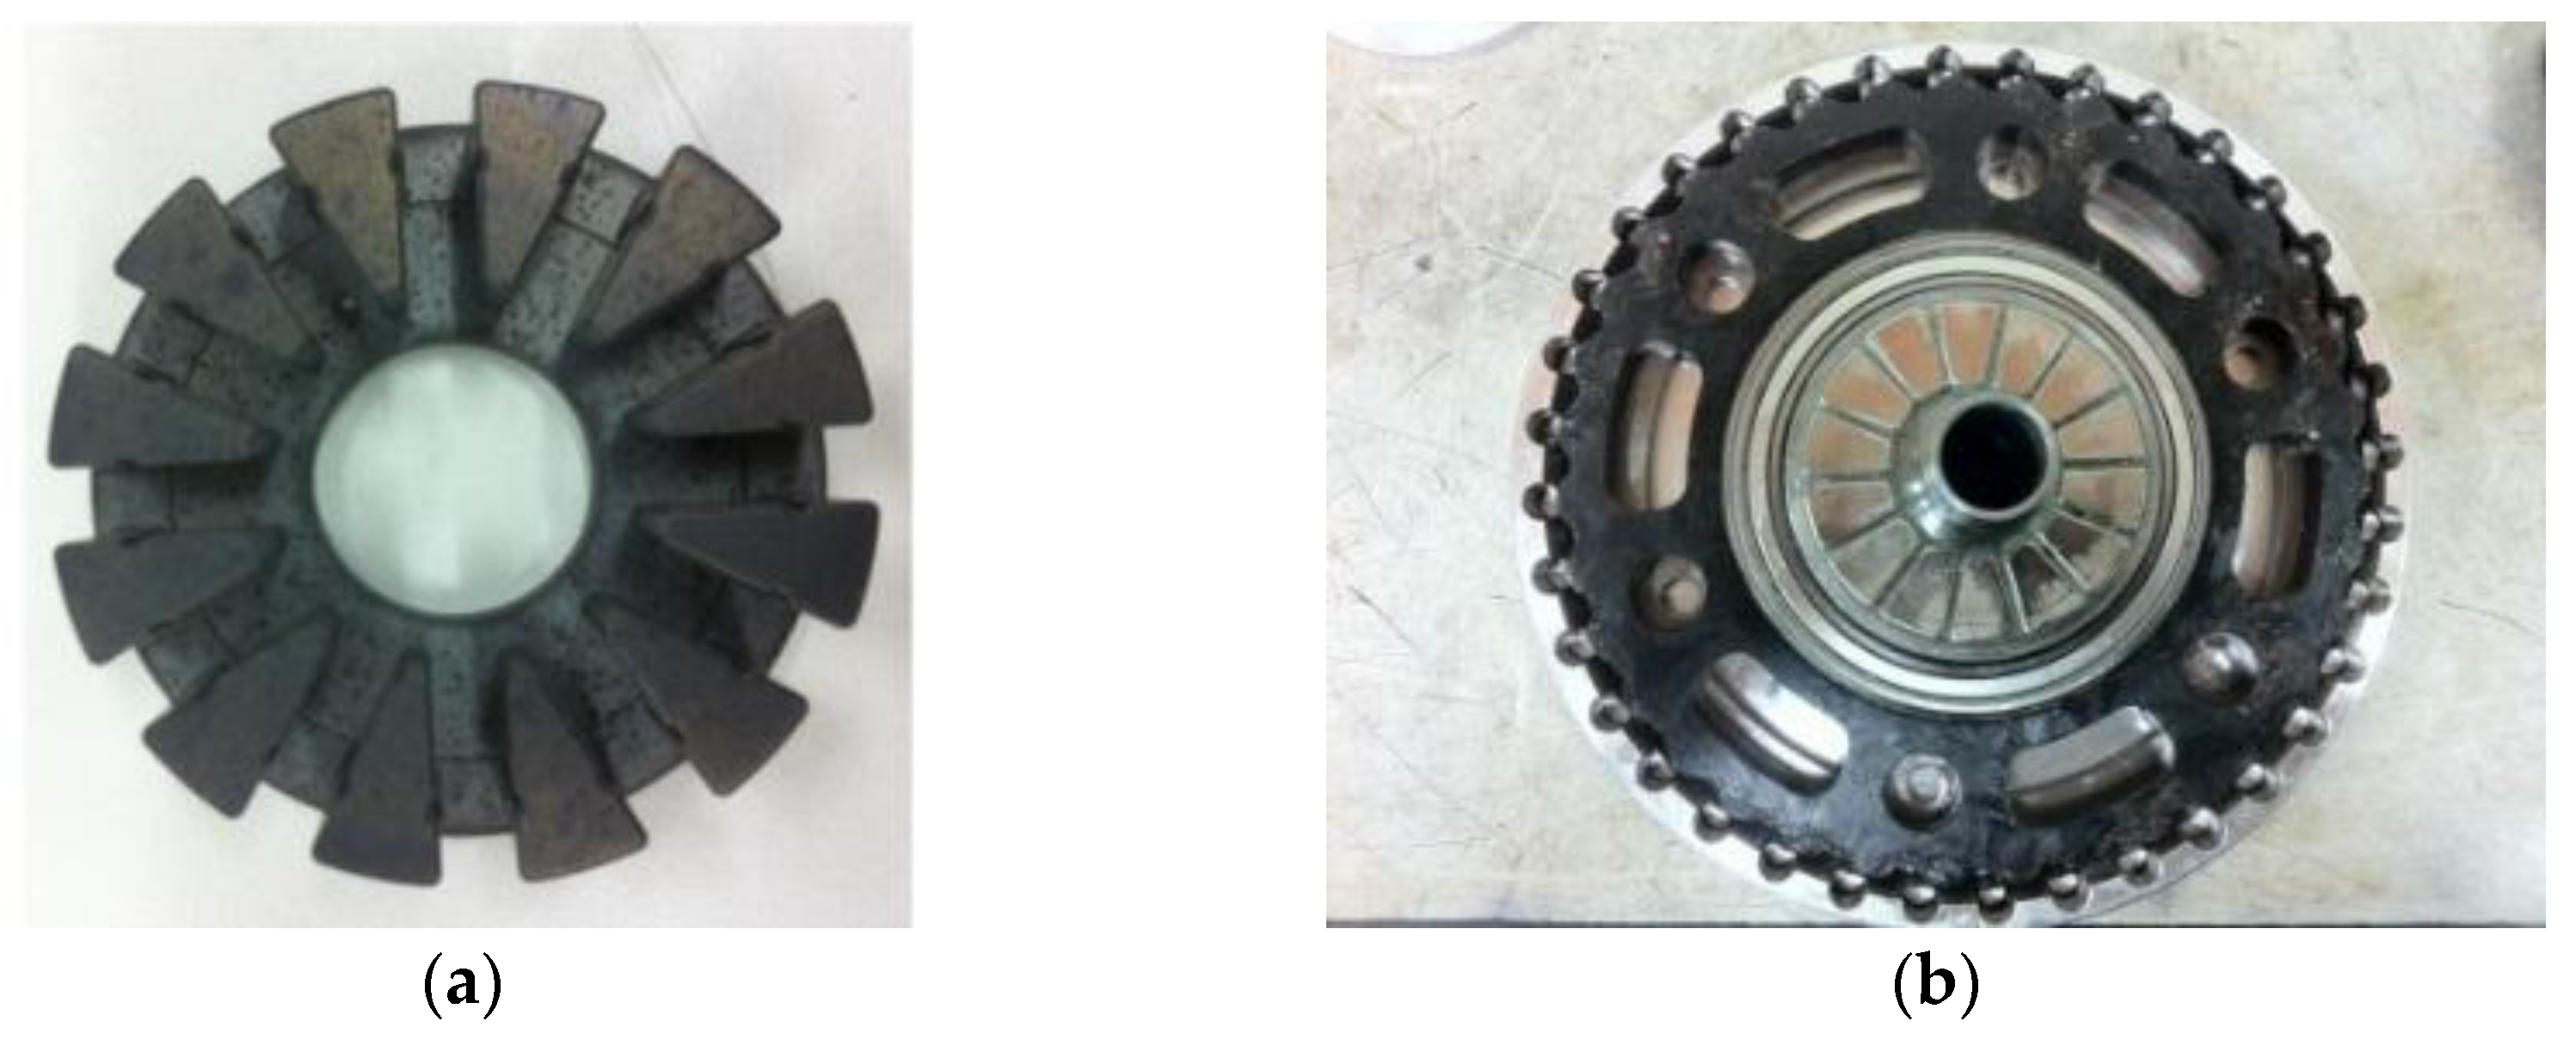
5.1. Prototype Manufacturing

We fabricated a prototype of the AFPM motor. The stator, consisting of 12 fan-shaped teeth, was made of a soft magnetic composite (Somaloy 700 3P), as shown in Figure 10a. This was achieved under a stamping pressure of 800 MPa for the desired density of 7.5 g/cm3. A wire with a diameter of 0.8 mm was chosen for the windings concentrated on each tooth. Each tooth had a coil of 21 turns of conductor (0.9-mm diameter), and four coils were connected in a series and grouped into one phase on the stator plate. Figure 10b shows that the rotor, embedded with 14 magnets, is attached to the cycloidal disc by a ball bearing.
Figure 10. (a) Stator; and (b) the rotor embedded in the cycloidal disc.
Energies 08 12421 g010
The prototype motor was tested on a platform that was equipped with a motor drive, a dynamometer, an oscilloscope, a power meter, and a power supply, as shown in Figure 11a. The back emf was measured and compared with that from the FE analysis. Figure 11b shows that the peak of the back emf from the experiment is 3.22 V at 500 rpm, which is close to 3.2 V from the FE analysis. The fundamental harmonic of the back emf from the experiment is 79%, which is lower than the value of 94% obtained by the FE analysis shown in Figure 11c. This difference may be caused by manufacturing defects, meaning that the prototype represents higher amplitudes. Although they are minor, they are on the high-order harmonics above the 5th order of those obtained by the FE analysis. However, the AFPM prototype can still be driven efficiently by sinusoidal currents for its major fundamental component.
Figure 11. (a) Experimental setup; (b) comparison of the back emf (at 500 rpm) and (c) its harmonics from the FE analysis and experiment.
Energies 08 12421 g011

5.2. Motor Performance

In the performance test, the TNE map of the prototype motor was obtained, as shown in Figure 12. Compared with the TNE map acquired by the FE analysis in Figure 8a, the maximum torque of the prototype motor is about 1 Nm, which is lower than 1.4 Nm obtained from the FE analysis. Moreover, this value was derived at a maximum current of 14 A. The corresponding torque constant was 0.07 Nm/A, which is 70% of the FE result. Accordingly, a maximum efficiency of 66% occurs near the corner speed of 2400 rpm, while the maximum efficiency obtained in the FE analysis was 93%. Nevertheless, the prototype motor is capable of driving a pedelec with an 80-kg rider on a 15% slope (Figure 2). In addition, the corner speed is about 2500 rpm, which is lower than the desired speed of 3000 rpm because of manufacturing imperfectness. The flux-weakening control provides a possible way of extending the speed range of the middle motor for a pedelec.
The causes of the differing motor performance between the FE analysis and the experiment can be attributed to the following observations:
(1) Smaller and unbalanced three-phase back emf.
The fundamental harmonic of the back emf of phase A from the experiment was 79%, which is lower than the 94% obtained by FE analysis, as shown in Figure 11c. In addition, the amplitude ratio of the three phases is 1:0.982:0.969.
(2) Inaccurate Hall-effect sensor locations.
The manufacturing error causes a 6° E delay in phase B and an 8° E advance in phase C with respect to phase A. The unbalanced sensor signal takes the input currents out of the phase of the back phase emfs. This results in a reduction of motor torque and efficiency, especially at a high rotational speed. The tolerance of the ring magnet that reads the rotor position may also affect the torque production.
(3) Friction in the eccentric bearing and reducer.
An average friction of 0.2-Nm was measured over the speed range of 2700 rpm. The power loss was estimated to be over 100 W when the motor speed reached a value greater than 3000 rpm. This power loss, caused by friction, can consume up to 30% of the total power. Thus, the maximum efficiency of the prototype was less than 70%.
(4) Imperfect sinusoidal current waves.
A perfect sinusoidal current wave was obtained using the FE simulation. Due to the imperfect switching of the electronic device, the actual sinusoidal current waves were contaminated with higher order harmonics, thus degrading the motor torque and efficiency.
Figure 12. The torque, speed, and efficiency map of the AFPM motor prototype.
Energies 08 12421 g012

6. Summary and Conclusions

This paper presents a multifunctional optimization design of an AFPM middle motor integrated with a cycloidal reducer in the mid-drive unit for a pedelec. This novel concept integrates the rotor with an eccentric disc of the cycloidal reducer so that its axial length is reduced. The systematic design procedure includes: (1) the preliminary design with a 0-D magnetic circuit model; (2) the multi-objective optimal design with a 1-D magnetic circuit model; and (3) the 3-D FE analysis. The results of the FE simulation indicate that the driving efficiency of the pedelec propelled by the proposed middle motor with an ECE-40 driving cycle at the speed of 25 km/h is estimated to be as high as 71.3%. A prototype motor was fabricated, and the torque, speed, and efficiency performance were tested. Due to various manufacturing and sensory defects, the prototype motor represents a lower torque than that obtained by the FE analysis. However, it can still provide a maximum torque of 1 Nm and is expected to deliver 36 Nm at the output shaft of the cycloidal reducer. This would enable the motor to drive a pedelec with an 80-kg rider on a 15% slope.

Acknowledgments

This work was partially supported by the National Science Council of Taiwan, under Contract MOST 103-2218-E- 002-008, and the Industrial Technology Research Center, Hsinchu, Taiwan, ROC.

Conflicts of Interest

The authors declare no conflict of interest.

References

  1. Rose, G. E-bikes and urban transportation: Emerging issues and unresolved questions. Transportation 2012, 39, 81–96. [Google Scholar] [CrossRef]
  2. Johnson, M.; Rose, G. Electric bikes—Cycling in the new world city: An investigation of Australian electric bicycle owners and the decision making process for purchase. In Proceedings of the 36th Australasian Transport Research Forum, Brisbane, Australia, 2–4 October 2013; pp. 1–10.
  3. Mcleod, K. Electric Bicycle: Public Perceptions & Policy; The League of American Bicyclists: Newport, RI, USA, 2015. [Google Scholar]
  4. Yang, Y.P.; Ding, F.X. Driving-scenario oriented design of an axial-flux permanent-magnet synchronous motor for a pedal electric cycle. IET Electr. Power App. 2015, 9, 420–428. [Google Scholar] [CrossRef]
  5. Muetze, A.; Tan, Y.C. Electric bicycles—A performance evaluation. IEEE Ind. Appl. Mag. 2007, 13, 12–21. [Google Scholar] [CrossRef]
  6. 17 Factory Mid Drive Electric Bikes. Available online: https://www.electricbike.com/2014-mid-drive/ (accessed on 21 January 2014).
  7. Turner, J.R. Electric Bicycle and Methods. U.S. Patent 6,629,574, 17 August 2001. [Google Scholar]
  8. Li, P.; Tu, Q. Middle Electric Motor Drive Unit for Electric Bicycle. U.S. Patent 8,205,705, 26 June 2012. [Google Scholar]
  9. Li, K.M.; Wang, W.S.; Li, B.; Zhu, Q. Electric Power-Assisted Bicycle. U.S. Patent 6,152,249, 25 November 1998. [Google Scholar]
  10. Hanselman, D.C. Brushless Permanent-Magnet Motor Design, 2nd ed.; McGraw-Hill, Inc.: New York, NY, USA, 2003. [Google Scholar]
  11. Ishak, D.; Zhu, Z.Q.; Howe, D. Permanent-magnet brushless machines with unequal tooth widths and similar slot and pole numbers. IEEE Trans. Ind. Appl. 2005, 41, 584–590. [Google Scholar] [CrossRef]
  12. Yang, Y.P.; Chuang, D.S. Optimal design and control of a wheel motor for electric passenger cars. IEEE Trans. Magn. 2007, 43, 51–61. [Google Scholar] [CrossRef]
  13. Qi, G.; Chen, J.T.; Zhu, Z.Q.; Howe, D.; Zhou, L.B.; Gu, C.L. Influence of skew and cross-coupling on flux-weakening performance of permanent-magnet brushless AC machines. IEEE Trans. Magn. 2009, 45, 2110–2117. [Google Scholar] [CrossRef]
  14. Chen, Y.; Pillay, P. An improved formula for lamination core loss calculations in machines operating with high frequency and high flux density excitation. In Proceedings of the 37th IAS Conference Record of the Industry Applications, Pittsburgh, PA, USA, 13–18 October 2002; pp. 759–766.

