1. Introduction
Prior to the introduction of market mechanisms in electric power systems, the system operator treated demand as fixed, and scheduled dispatch plans with generators. The main purposes of a vertically integrated company were to minimize the total generation cost and achieve power balance. Power balance is the most critical task in power system operation. Expensive generators are typically obliged to commit during peak periods to fulfill the balance, even if it is not economically beneficial.
As the demand becomes increasingly diversified and the peak loads have increased steeply, additional pivotal generators have been constructed even though they may only be committed for short peak periods. To overcome this inefficient mode of generator expansion, the operators may attempt to decrease demand, rather than increasing generation. Thus, in the 1970s, demand side management (DSM) became used to control the load profile, rather than additional generation; the operators request curtailment, and a reward is given to consumers who acquiesce. DSM therefore became an important tool to manage the peak loads.
A market system, however, changes the nature of load participation in the electricity industry. Over the past 20 years, market mechanisms were introduced to improve the economic efficiency of electric power systems, which have moved from vertically integrated structures toward decentralized structures. A market-clearing price is determined based on the marginal supply curve and the demand curve to maximize the social welfare that is composed of supplier and consumer surpluses. The power generation company (GENCO) bids in a pool, and the lowest bid offered by the generators are chosen to satisfy the balance of supply and demand. Demand parties can also bid into the pool, and respond to the market price to adjust their power usage.
The participation of consumers in the electricity market has not been as active, due to the low penetration of the necessary infrastructure, which dispenses the wholesale market price information to consumers. Therefore, a pre-determined flat retail tariff (or simple time-of-use program) has been applied to retail consumers, who cannot respond to real-time pricing and do not have sufficient motivation to adjust their load profile. It follows that the demand curve representing consumers is not reflected in the clearing sequence, and this results in suboptimal social welfare.
As advanced metering infrastructure (AMI) technology has matured and penetrated further toward consumers, the conditions for direct participation in wholesale markets become more feasible. The willingness of small consumers can be reflected in market decisions through a load serving entity (LSE). In addition, demand can be reduced in response to unexpected high wholesale market prices. The advent of such price responsive demand (PRD) may enable the development of a retail tariff that reflects the wholesale market prices. With such programs, the name demand response (DR) is widely used to indicate both conventional curtailment methods of DSM and price responsive behavior. Therefore, DR is now defined as incentives designed to influence demand in response to wholesale market prices or system reliability concerns [
1]. DR programs can be classified into two groups: incentive-based and price-based programs [
2]. Once a predetermined triggering condition is satisfied, an incentive-based program is activated by DR operator, typically an independent system operator (ISO) or curtailment service provider (CSP). Participants who are contracted with the DR operator beforehand can curtail their demand when requested. The DR participants have two choices, one as receiving an incentive as they reduce their load and another as making use of electricity as they desire. They decide one of these options by comparing the two utilities. Programs include interruptible and curtailable loads, direct load control (DLC), ancillary service programs, emergency DR programs and capacity programs. Price-based programs are essentially voluntary reduction, so that the decision is the consumer’s. Consumers obtain time-varying electricity prices, and schedule their loads accordingly to maximize their utility. Such programs include time-of-use (TOU), critical peak pricing (CPP) and real-time pricing (RTP).
There have been a number of reports of methods to implement PRD in conventional scheduling problems. In [
3], the authors proposed a scheduling method to model demand, which considers self-elasticity and cross-elasticity in a competitive electricity market. As a result, they were able to examine the effects of demand-side bidding on the generation cost, market-clearing prices, and benefit allocation between producers and consumers. Relative studies also consider self- and cross-elasticity to model consumers, and attempt to merge the generation scheduling and demand behavior [
4,
5]. Models of consumers typically focus on studies that illustrate behavior using DR programs [
6,
7,
8,
9]. In [
10], the practical application of PRD in Pennsylvania New Jersey Maryland Interconnection (PJM), California independent system operator (CAISO), ISO New England (ISO-NE) and New York ISO (NYISO) was analyzed, and the market efficiency of DR implementations was discussed.
The application of PRD in demand side may increase social welfare as it reflects the consumer’s willingness; On the other hand, in the generation side, a market power problem occurs because of the way in which the market system has been implemented. A small change in generation during peak periods may lead to large fluctuations in the market-clearing price, to achieve a balance of supply and demand [
11,
12]. Companies can exploit this market power to increase their prices and make additional profits via capacity withholding. To resolve this market power problem, measures to use demand side resources have been widely investigated. Bompard
et al. [
13,
14] carried out in-depth studies into the effects of demand elasticity on the strategic behavior of GENCOs. They considered the demand curve in response to market-clearing prices, and showed that price-responsive loads can reduce the strategic increasing of prices. In [
15], a distributed resource containing DR was defined, and a solution to problems of re-regulation was proposed, which considered DR. PJM was used to show that market power with a small withholding capacity can be mitigated by using DR. Jalili
et al. [
16] proposed using DR to mitigate market power via considerations of the network topology. They used a must-run capacity index to measure market power, and investigated the changes therein with and without DR.
These studies support the use of a competitive power market, and support the use of DR as a market power mitigation tool; however, the usages of incentive-based DR considering PRD have not been studied in depth [
17,
18]. Furthermore, the studies of incentive-based DR did not consider market power mitigation in a competitive market. For these reasons, in this paper we investigate maximization of social welfare using DR to mitigate market power in competitive circumstances. We determine the optimal incentive DR to prevent the market power from being exercised and to maximize social welfare. A formulation of the conditions for players is described, and this is used to model the related scheduling structure. The aims are prevention of the anomalous price increases via the strategic behavior of GENCOs, and the prevention of excessive use of interruptible and curtailable load (I/C—the DSM contains various types of incentive DR programs, however, in this paper, we focus on interruptible and curtailable loads to analyze the effect of proposed method. Therefore, I/C rather than incentive DR is used to compare with PRD), which can lead to unfair surplus allocation.
The remainder of the paper is organized as follows:
Section 2 describes the market model and the operating procedure, and the profit of a dominant player who attempts to withhold capacity in a competitive market condition is formulated. The limits of price decreases due to demand resource are also discussed.
Section 3 introduces the proposed method to mitigate market power using I/C.
Section 4 describes indices to assess the efficacy of method.
Section 5 details numerical results using the modified generation data in [
13] in a large electric power system.
Section 6 concludes the paper.
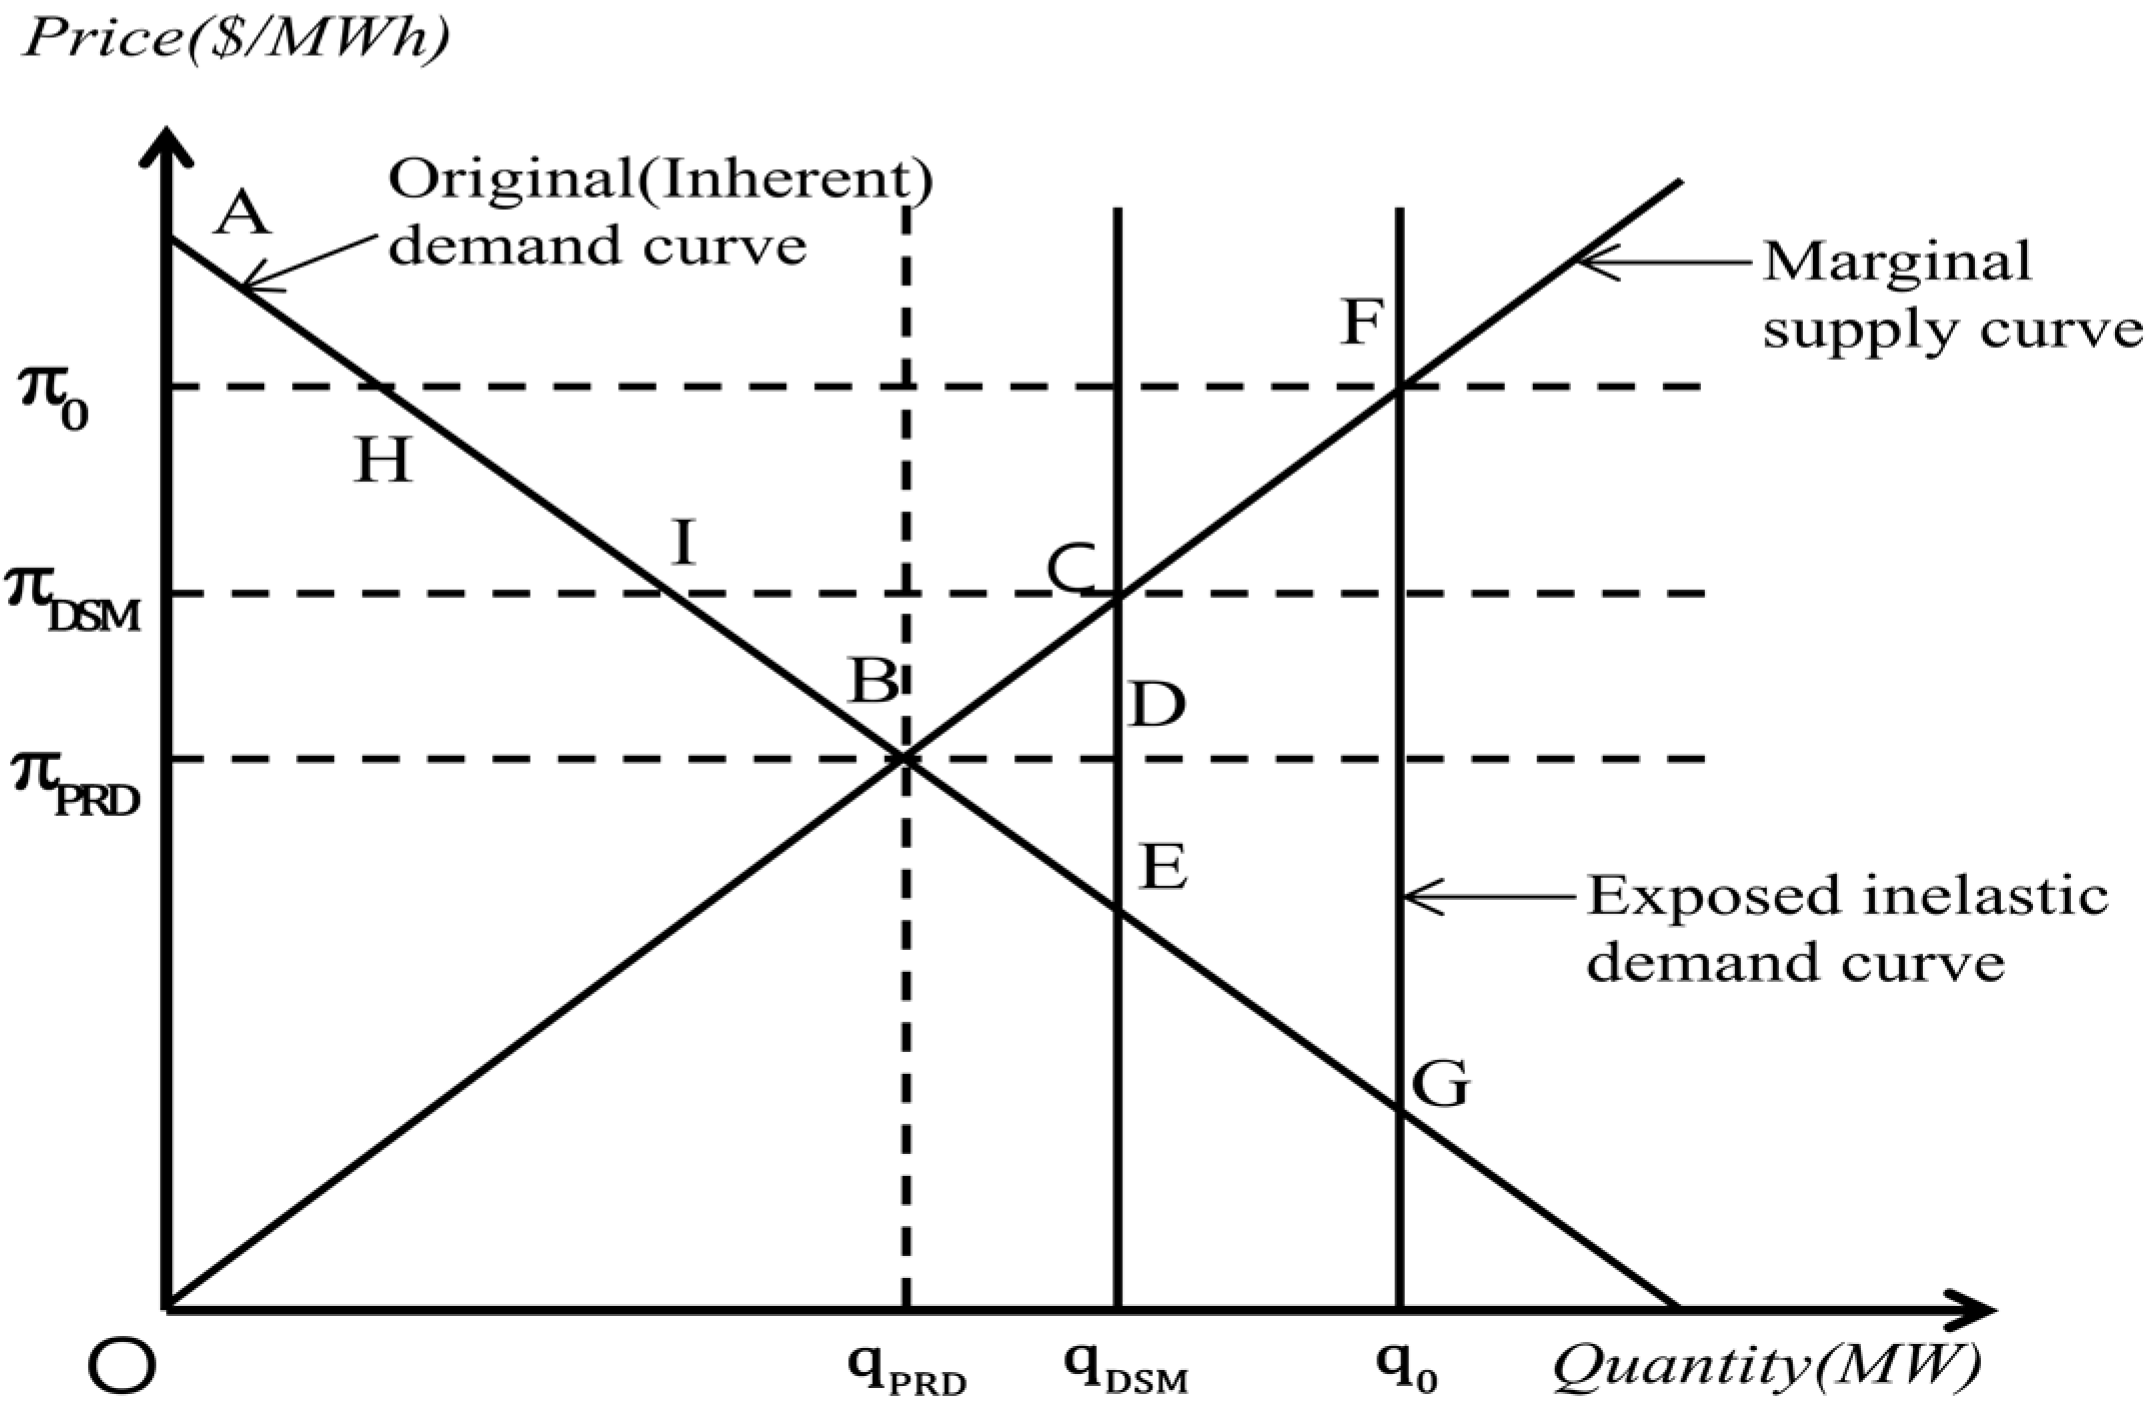
3. Maximization of Social Welfare via Inhibiting the Exercising of Market Power through Demand Response
As discussed in
Section 2, if the demand function is the original demand curve, which reflects the load of consumers without any anomalous strategic behavior, external demand reduction (
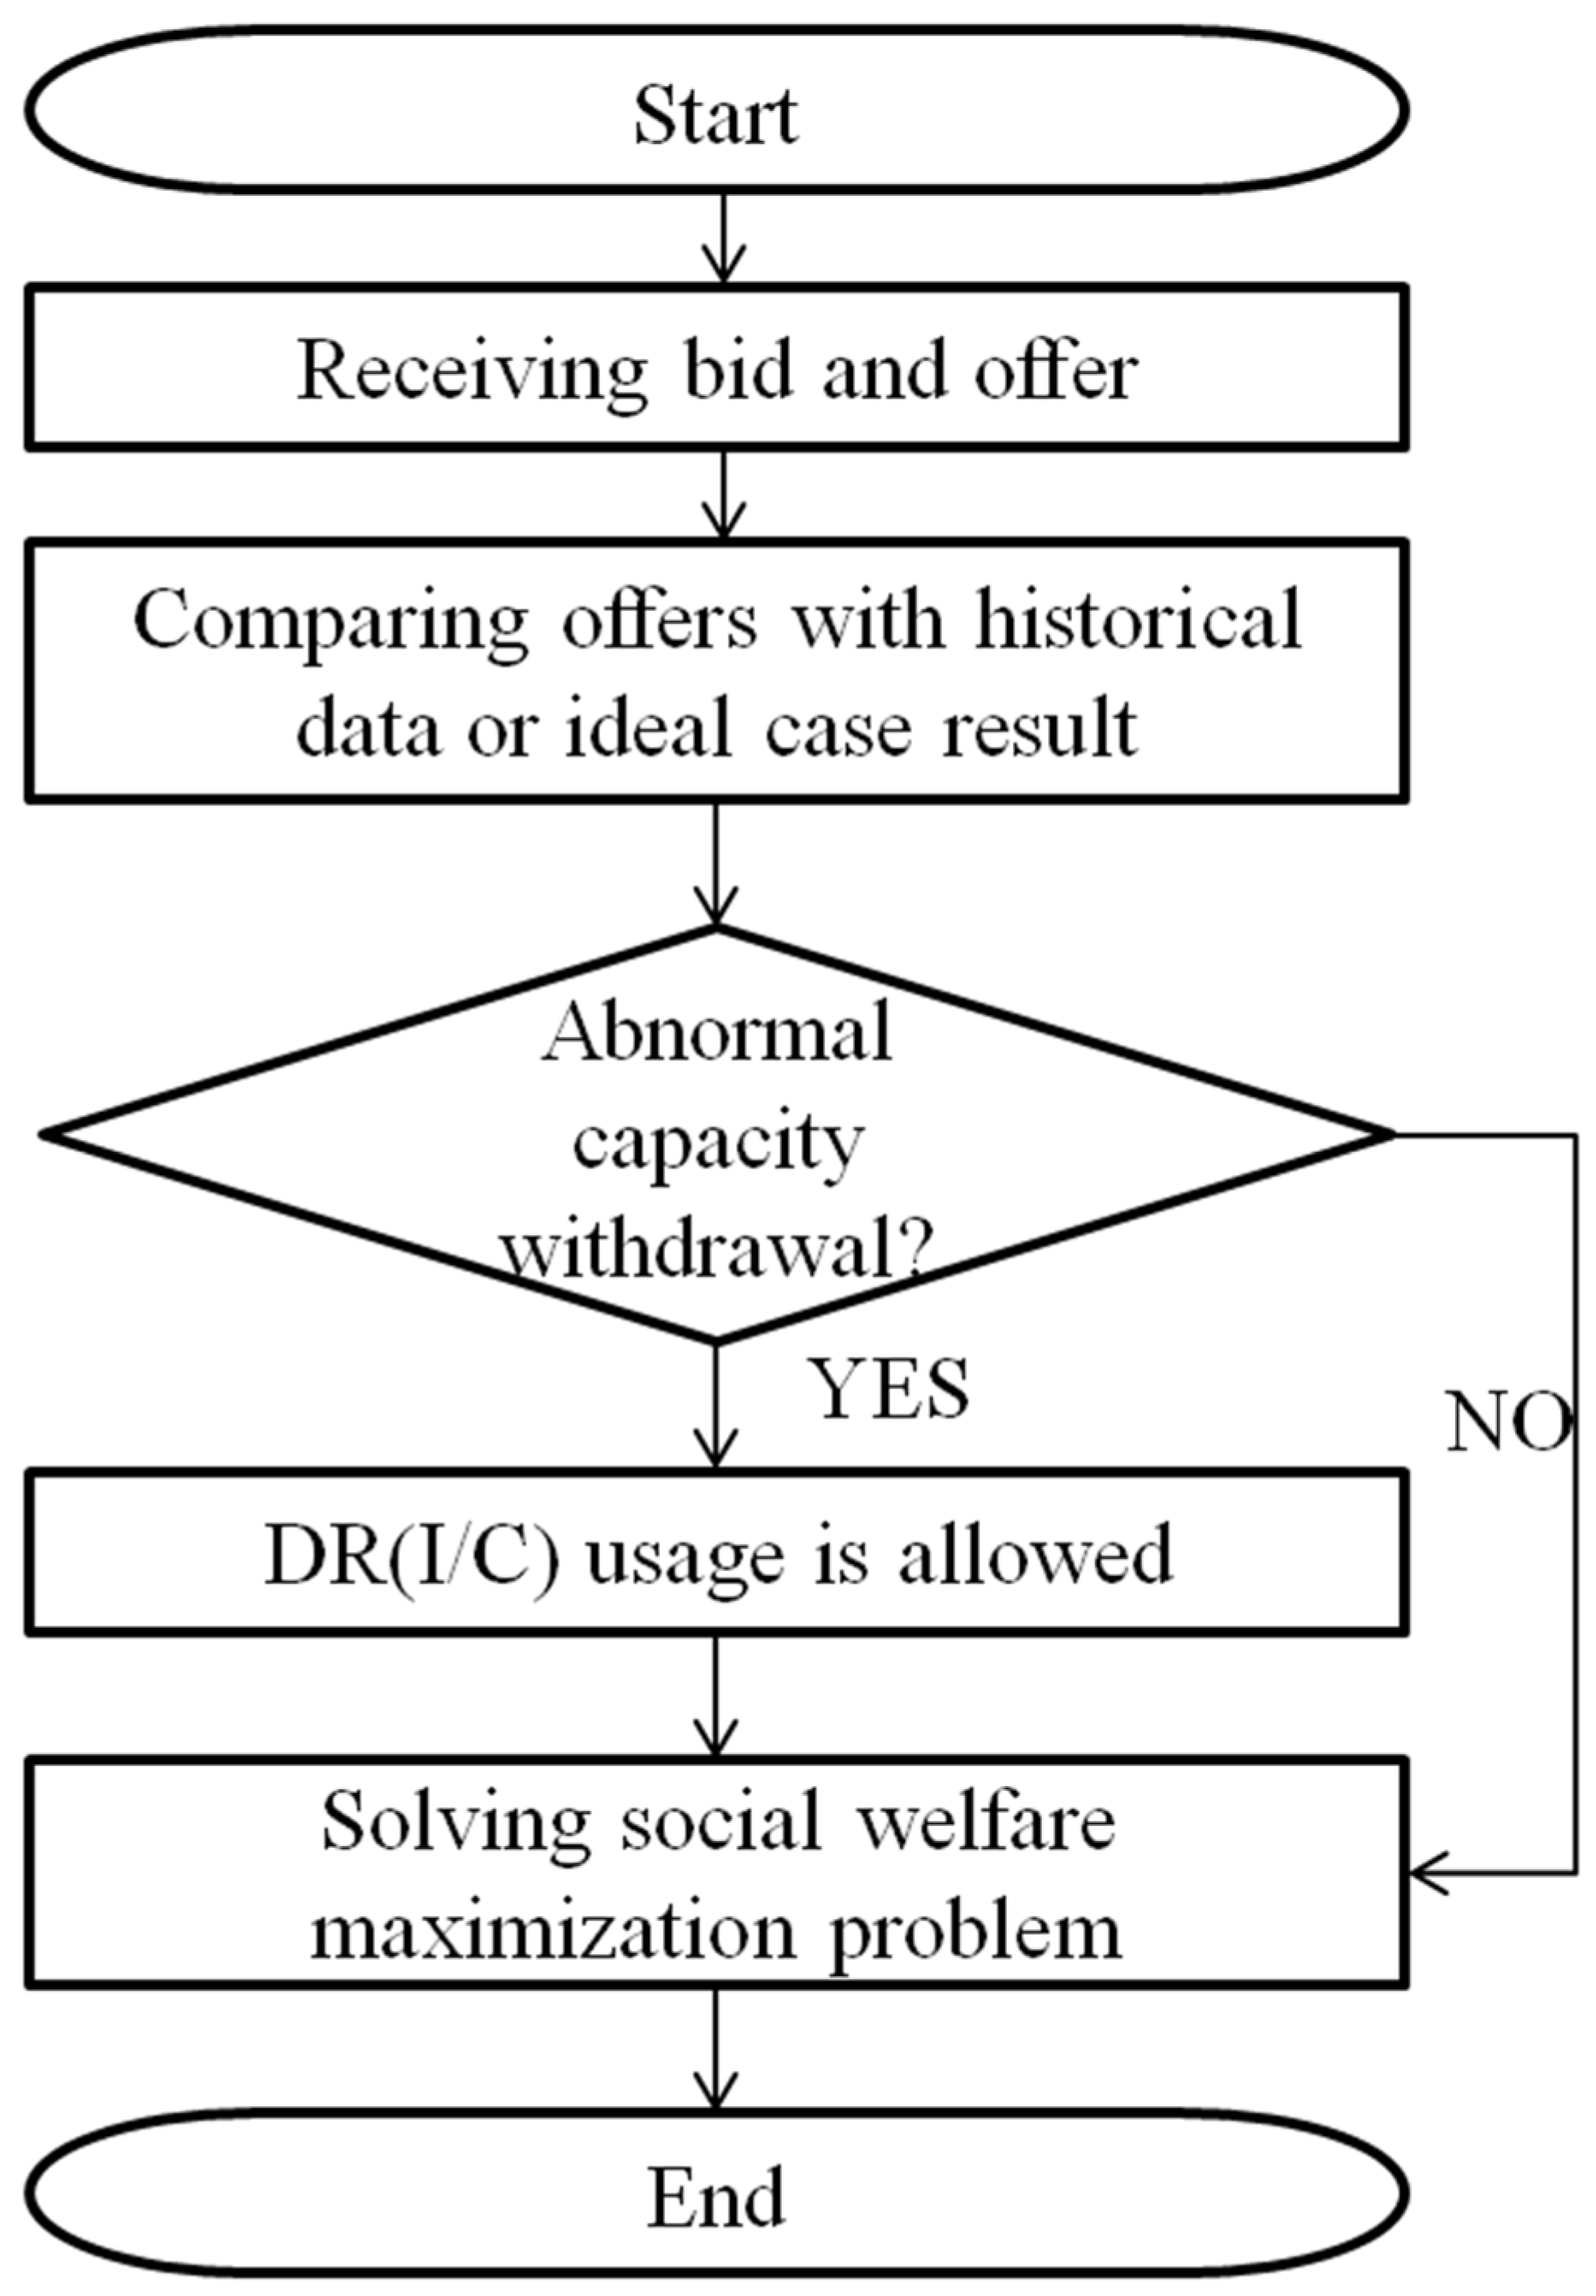
i.e., I/C) reduces the total social welfare and leads to inefficiencies in resource scheduling. Therefore, there is a need to distinguish situations in which market power is being exercised. If strategic behavior is not observed, events that trigger I/C should be excluded in scheduling procedure. Where there exist putative market powers, the optimization sequence must include the use of I/C. This concept and the total sequence for maximizing the social welfare are described in
Figure 2. The ISO receives bids and offers from GENCOs and consumers until the gate closure of the day-ahead wholesale market. Based on these data on bids and offers, the checking sequence is carried out to search for anomalous bid/offer values compared with the historical clearing data or the results of simulations assuming perfect competition (the search method can vary between market observation systems; however, in this paper, perfect competition is used).
Figure 2.
The scheduling process of the method described here.
Figure 2.
The scheduling process of the method described here.
If no anomalous bids or offers are found, the ISO solves the social welfare maximization problem without I/C commitment. If anomalous behavior is found, I/C is permitted only where it increases the social welfare. Based on this above procedure, the day-ahead market-clearing prices are determined depending on the I/C and generation. The advantages of our method is that the conventional method of describing DR resources as a negative generation can lead to a decrease in the social welfare with high penetration of PRD into the electricity markets, as the original demand curve is used. Our method is used when anomalous market behavior is detected. Therefore, the I/C is employed more effectively and does not negatively affect the social welfare, even with significant penetration of PRD.
The maximization of social welfare when anomalous bids or offers are detected provides new constraints for the objective function in Equation (13). To avoid strategic behavior by GENCOs, there must be no motivation to withhold the capacity. It follows that the left-hand side of Equations (9) and (12) must be less than or equal to zero. In other words, the additional surplus gained by withholding capacity must be less or equal to the surplus loss that they must incur. Using this approach, ISOs can maximize social welfare while eliminating the ability of GENCOs to exercise market power. This social welfare maximization problem can be formulated as follows:
subject to:
This objective function determines the use of I/C and power generation. Equations (14) and (15) describe the limits of the available resources; Equations (16) and (17) relate to the determination of market price; and Equations (18) and (19) are constraints that prevent the suppliers and demand-resource owners from exercising market power. This method can be used to solve economic dispatch considering both capacity withholding and excessive use of interruptible loads. As a result, the generated power, demand reduction, and clearing price that maximize the social welfare are obtained.
5. Simulations
Here we describe a social welfare maximization problem with six generators and elastic demand. The parameters of simulation are listed in
Table 1. There were six GENCOs in the simulation, each of which owned one generator. This method can be extended to an arbitrarily large system; however, here we consider six generators to facilitate a concise calculation.
Table 1.
Producers parameters.
Table 1.
Producers parameters.
| Generators | ci ($) | bi ($/MW) | ai ($/MW2) | Pmax (MW) | Pmin (MW) |
|---|
| Gen1 | 0 | 18 | 0.25 | 80 | 0 |
| Gen2 | 0 | 20 | 0.20 | 60 | 0 |
| Gen3 | 0 | 25 | 0.30 | 60 | 0 |
| Gen4 | 0 | 22 | 0.20 | 65 | 0 |
| Gen5 | 0 | 32 | 0.20 | 80 | 0 |
| Gen6 | 0 | 16 | 0.25 | 70 | 0 |
We investigated the effectiveness of the method using interruptible loads with various consumers. The simulations were carried out with a range of consumer sensitiveness to the market-clearing price. We used the gradient of the demand curve to describe the consumer characteristics, rather than the elasticity of demand. The elasticity can be observed if a reference price and corresponding quantity are determined; however, the gradient of the demand curve is more appropriate to describe the effects our method than the elasticity of demand, since elasticity can vary over all points of the demand curve. The simulation scenarios were characterized in terms of the gradient of the demand function. We evaluate the effectiveness with gradients from −1 to −2, decreasing in steps of 0.1.
The total demand was 377.27 MW, which is 90% of the sum of the generator capacities, so that there was a 10% system reserve margin. The capacity of the interruptible loads was 10% of the total demand; i.e., 37.727 MW.
A method to prevent the exercising of market power via capacity withdrawal in electricity markets is proposed. Therefore, an expression for market power due to the withholding of generator supply must be modeled to compare the social welfare and market-clearing price between oligopoly conditions and conditions with the method described here.
The Cournot equilibrium was used to describe the oligopoly conditions, whereby market power can be exercised. The Cournot model is an oligopoly model used to describe competition in terms of the quantity of goods supplied by companies. All companies determine production independently. The model is a simultaneous game, because each company is unaware of the quantities of goods produced by the other companies. In the example discussed here, we assume that the various GENCOs exercise market power considering the strategy of each of the other parties. The strategic behavior of GENCOs can be expressed in terms of withdrawal of capacity; therefore, the Cournot equilibrium point corresponds to market-clearing prices.
Three scenarios are examined to compare the social welfare (and other indices) to examine the operation of markets, which are as follows:
- (1)
With our method. All GENCOs bid on capacity considering the behavior of other companies. If the exercising of market power is detected, the ISO maximizes the social welfare via I/C resources to prevent unfair additional surpluses.
- (2)
Oligopoly: All GENCOs bid on capacity considering the behavior of other companies. The ISO maximizes the social welfare; however, the market-clearing price is higher than that with perfect competition.
- (3)
Perfect competition. All GENCOs bid with full capacity to the wholesale market and ISO maximizes the social welfare. The market-clearing price is determined based on the marginal cost of the most expensive generator.
Table 2 lists a summary of the results of the simulations. Based on these data we find the following:
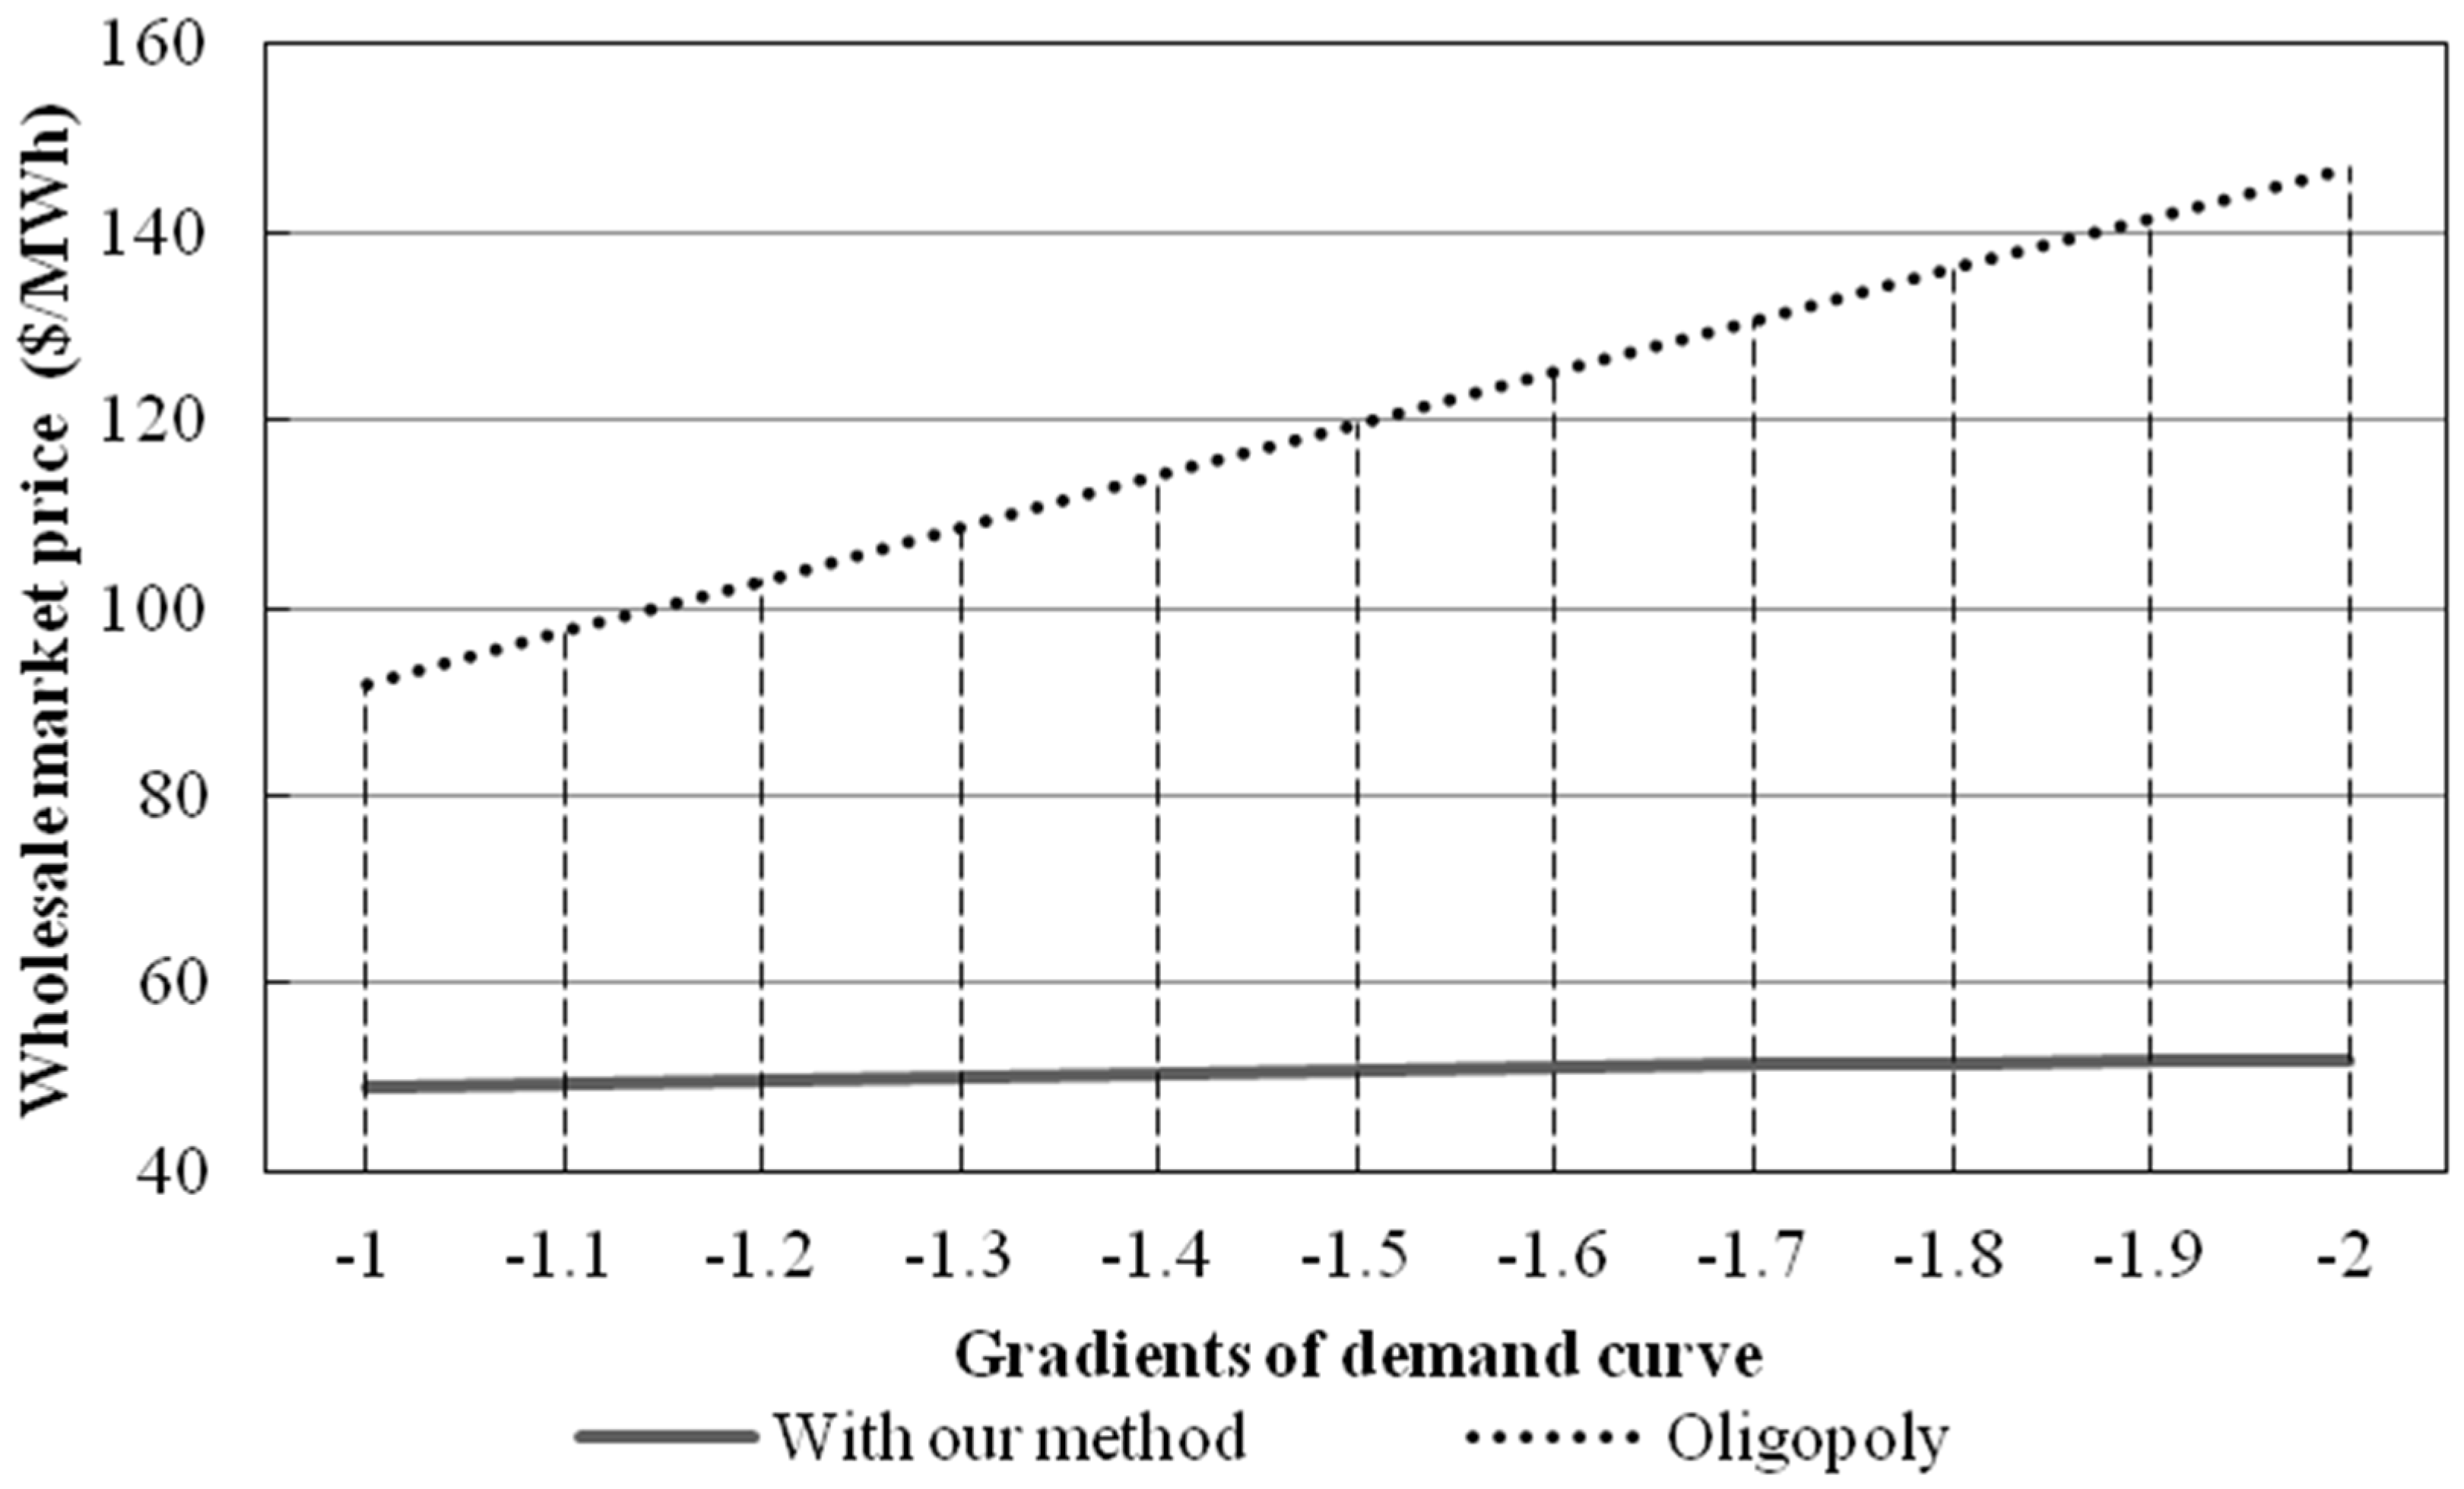
(1) The market-clearing price was lower with our method than with the oligopoly scenario
The simulated data show that the market-clearing price was higher with oligopoly conditions that with the method described here.
Figure 3 shows the market-clearing price with our method and oligopoly conditions as a function of the gradient of the demand curve. Both curves increased monotonically as the gradient of the demand function become steeper; however, the rate of increase in the prices with our method was less than that with oligopoly conditions. It follows that our method can be used to mitigate market powers, even when consumers are insensitive to market conditions (
i.e., the gradient of the demand curve was negative).
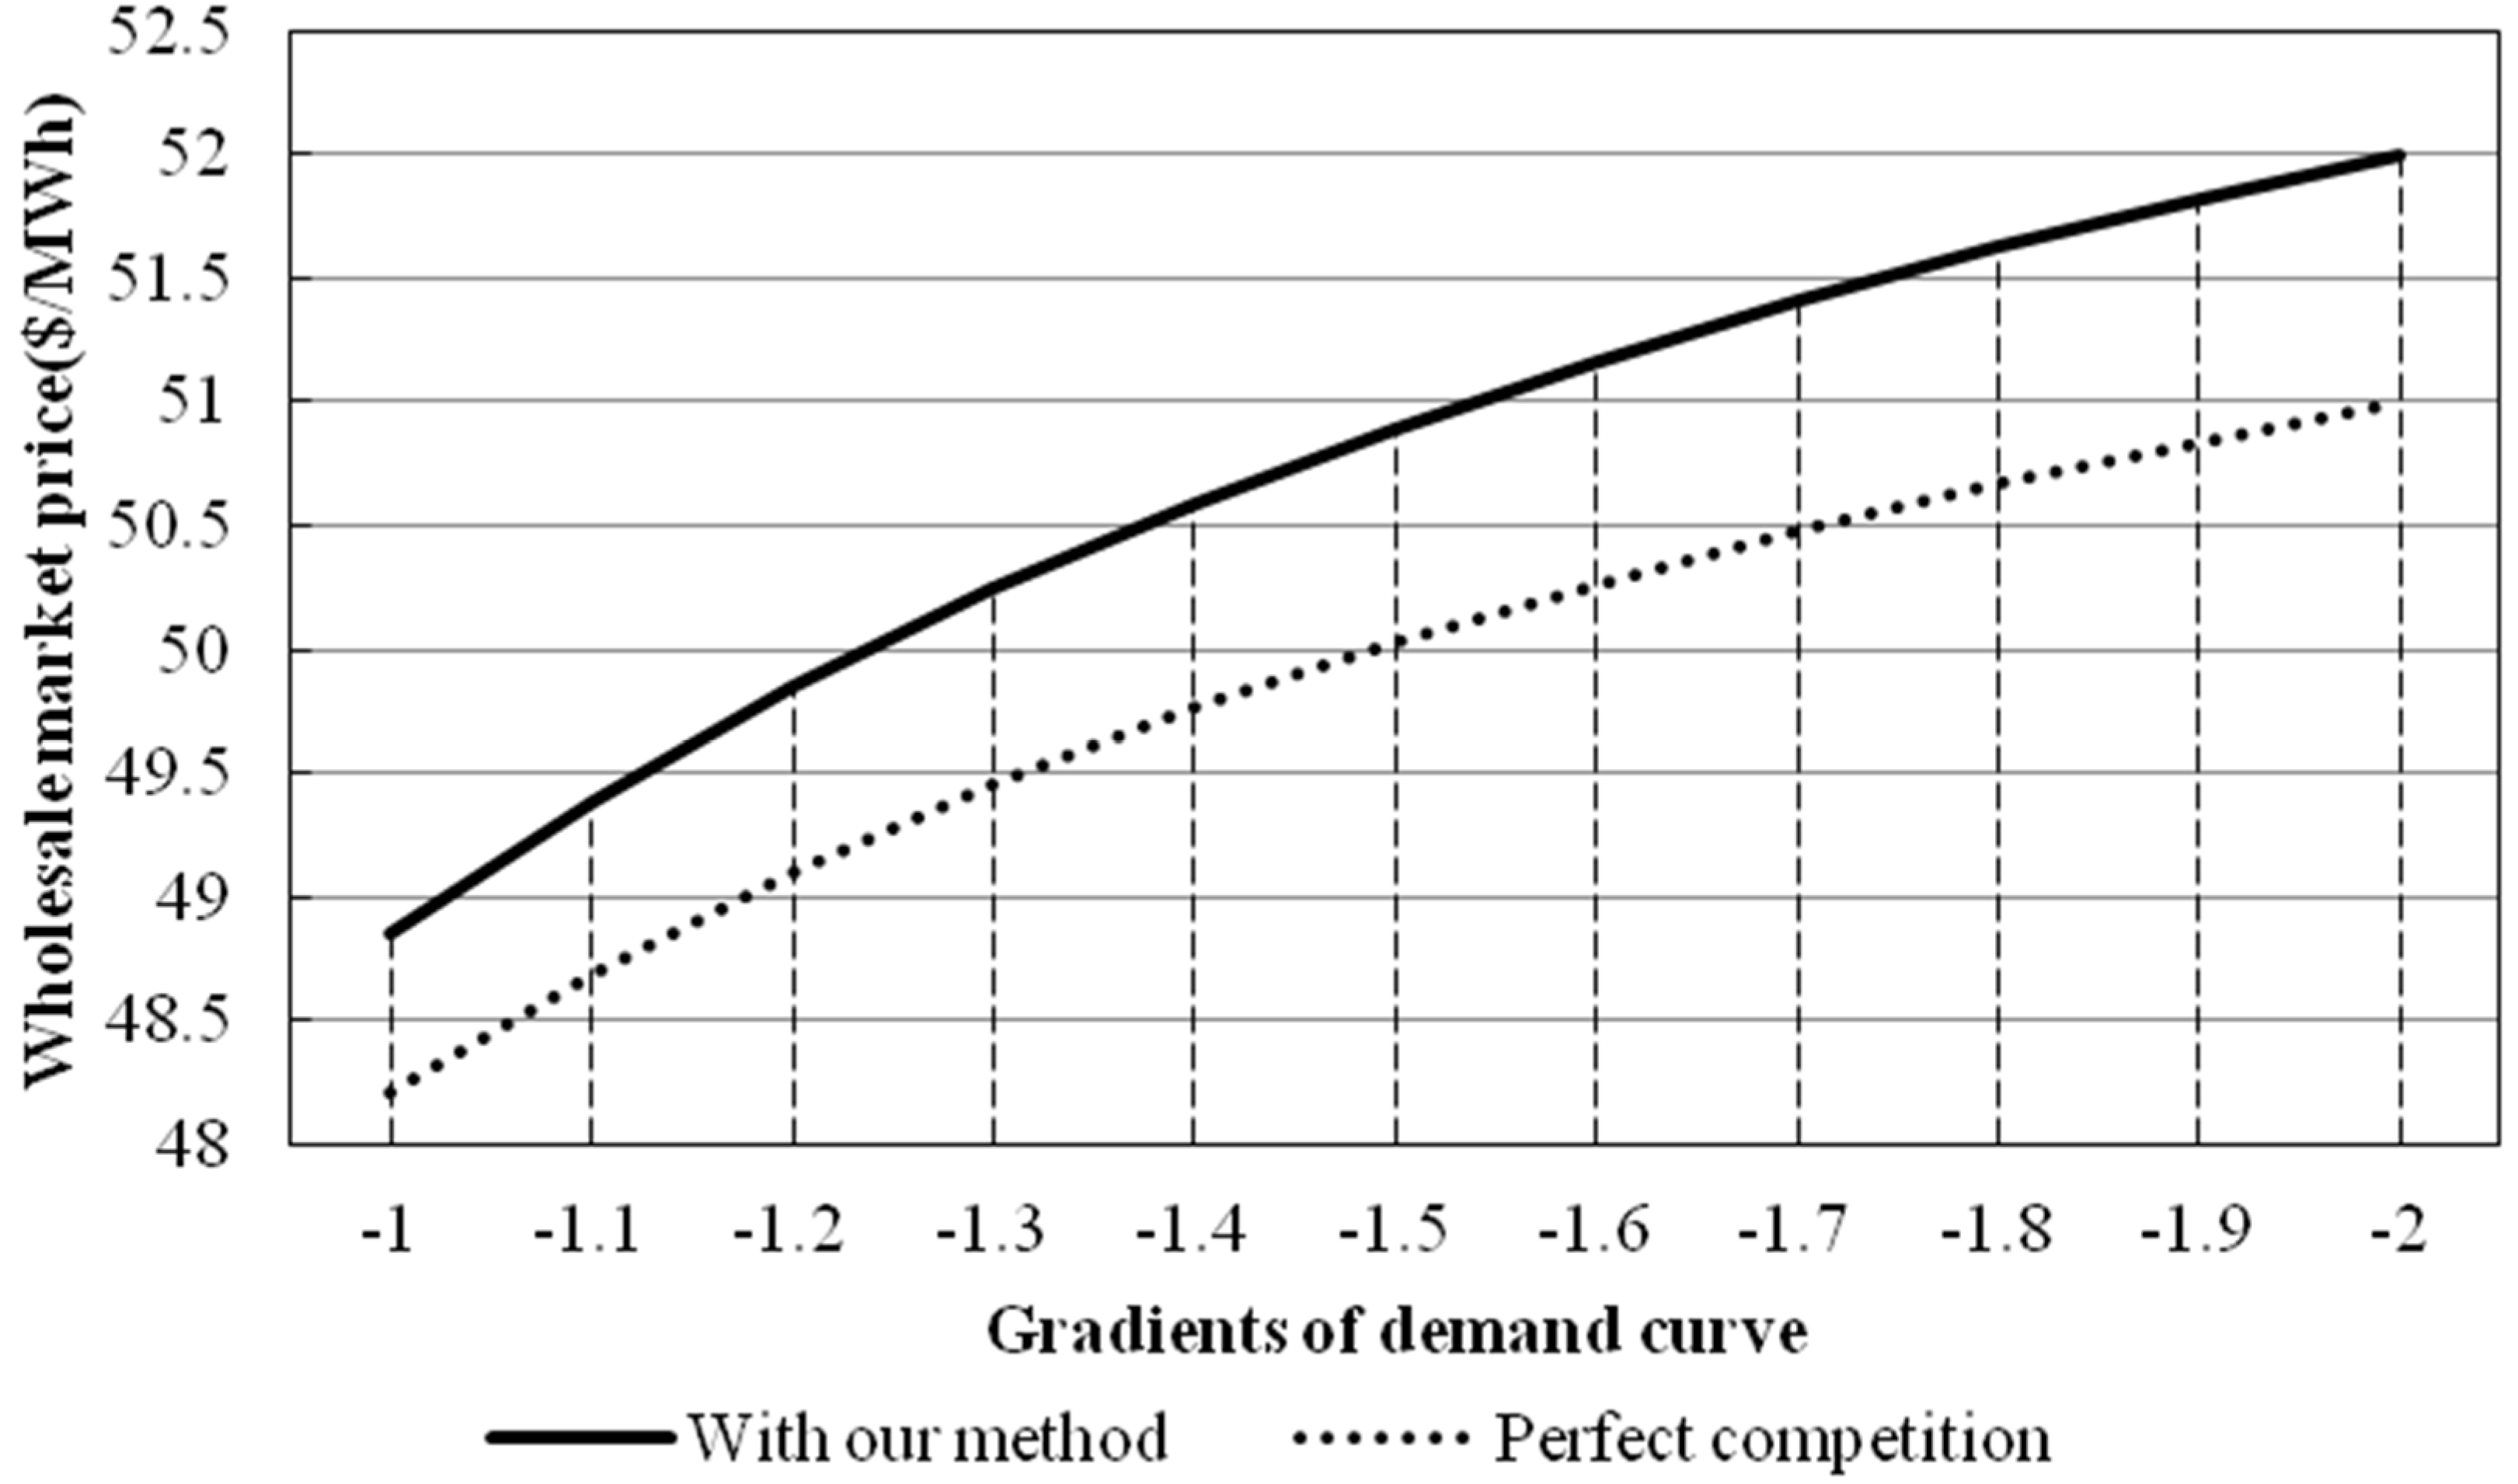
Figure 4 shows the market-clearing price with method described here and perfect competition as a function of the gradient of the demand curve. The graph shows that the prices with our method were higher than those for perfect competition. Furthermore, as the gradient increased, the difference in price between the two scenarios increased from 0.637 (Case 1) to 1.004 (Case 11). The components that lead to differences between these two scenarios are the surplus loss due to the use of I/C and capacity withholding by the generators. That is, although the proposed method inhibits the exercising of market power to some extent, the reduction in price is diminished because the consumers reduce usage when the price increases. This results from the large value of consumer surplus (
i.e., I/C reduces the consumer surplus).
Table 2.
Simulation results with respect to demand curve slope.
Table 2.
Simulation results with respect to demand curve slope.
| Scenarios | Evaluation items | Case 1 (f = −1.0) | Case 2 (f = −1.1) | Case 3 (f = −1.2) | Case 4 (f = −1.3) | Case 5 (f = −1.4) | Case 6 (f = −1.5) | Case 7 (f = −1.6) | Case 8 (f = −1.7) | Case 9 (f = −1.8) | Case 10 (f = −1.9) | Case 11 (f = −2.0) |
|---|
| Perfect competition scenario | Market clearing price ($/MW·h) | 48.21 | 48.69 | 49.10 | 49.46 | 49.76 | 50.03 | 50.27 | 50.48 | 50.67 | 50.84 | 50.99 |
| Cleared demand (MW·h) | 329.06 | 333.01 | 336.35 | 339.23 | 341.73 | 343.92 | 345.86 | 347.58 | 349.12 | 350.52 | 351.78 |
| Social welfare ($) | 58,700 | 65,710 | 72,736 | 79,775 | 86,824 | 93,882 | 100,950 | 108,020 | 115,090 | 122,170 | 129,250 |
| Oligopoly scenario | Market clearing price ($/MW·h) | 91.83 | 97.44 | 103.01 | 108.56 | 114.09 | 119.60 | 125.10 | 130.58 | 136.05 | 141.52 | 146.98 |
| Cleared demand (MW·h) | 285.45 | 288.69 | 291.43 | 293.76 | 295.78 | 297.54 | 299.09 | 300.46 | 301.69 | 302.79 | 303.78 |
| Social welfare ($) | 57,565 | 64,433 | 71,316 | 78,212 | 85,118 | 92,033 | 98,953 | 105,880 | 112,810 | 119,750 | 126,680 |
| Inefficiency index | −0.019 | −0.019 | −0.02 | −0.02 | −0.02 | −0.02 | −0.02 | −0.02 | −0.02 | −0.02 | −0.02 |
| Proposed scenario | Market clearing price ($/MW·h) | 48.85 | 49.39 | 49.85 | 50.25 | 50.59 | 50.90 | 51.17 | 51.41 | 51.62 | 51.82 | 52.00 |
| Cleared demand (MW·h) | 323.54 | 327.87 | 331.55 | 334.72 | 337.48 | 339.89 | 342.03 | 343.94 | 345.65 | 347.20 | 348.60 |
| Social welfare ($) | 58,267 | 65,256 | 72,264 | 79,287 | 86,322 | 93,367 | 100,420 | 107,480 | 114,540 | 121,610 | 128,690 |
| I/C curtailment level (MW·h) | 4.89 | 4.50 | 4.18 | 3.90 | 3.66 | 3.45 | 3.26 | 3.09 | 2.94 | 2.80 | 2.68 |
| Inefficiency index | −0.007 | −0.007 | −0.006 | −0.006 | −0.006 | −0.005 | −0.005 | −0.005 | −0.005 | −0.004 | −0.004 |
Figure 3.
Market-clearing price with oligopoly conditions and with the method described here.
Figure 3.
Market-clearing price with oligopoly conditions and with the method described here.
Figure 4.
Market-clearing price with perfect competition and with the method described here.
Figure 4.
Market-clearing price with perfect competition and with the method described here.
Both of these comparisons show that our method exhibits better performance when consumers are less sensitive to the wholesale prices.
(2) The deployment of I/C decreases as a function of the gradient of the demand curve
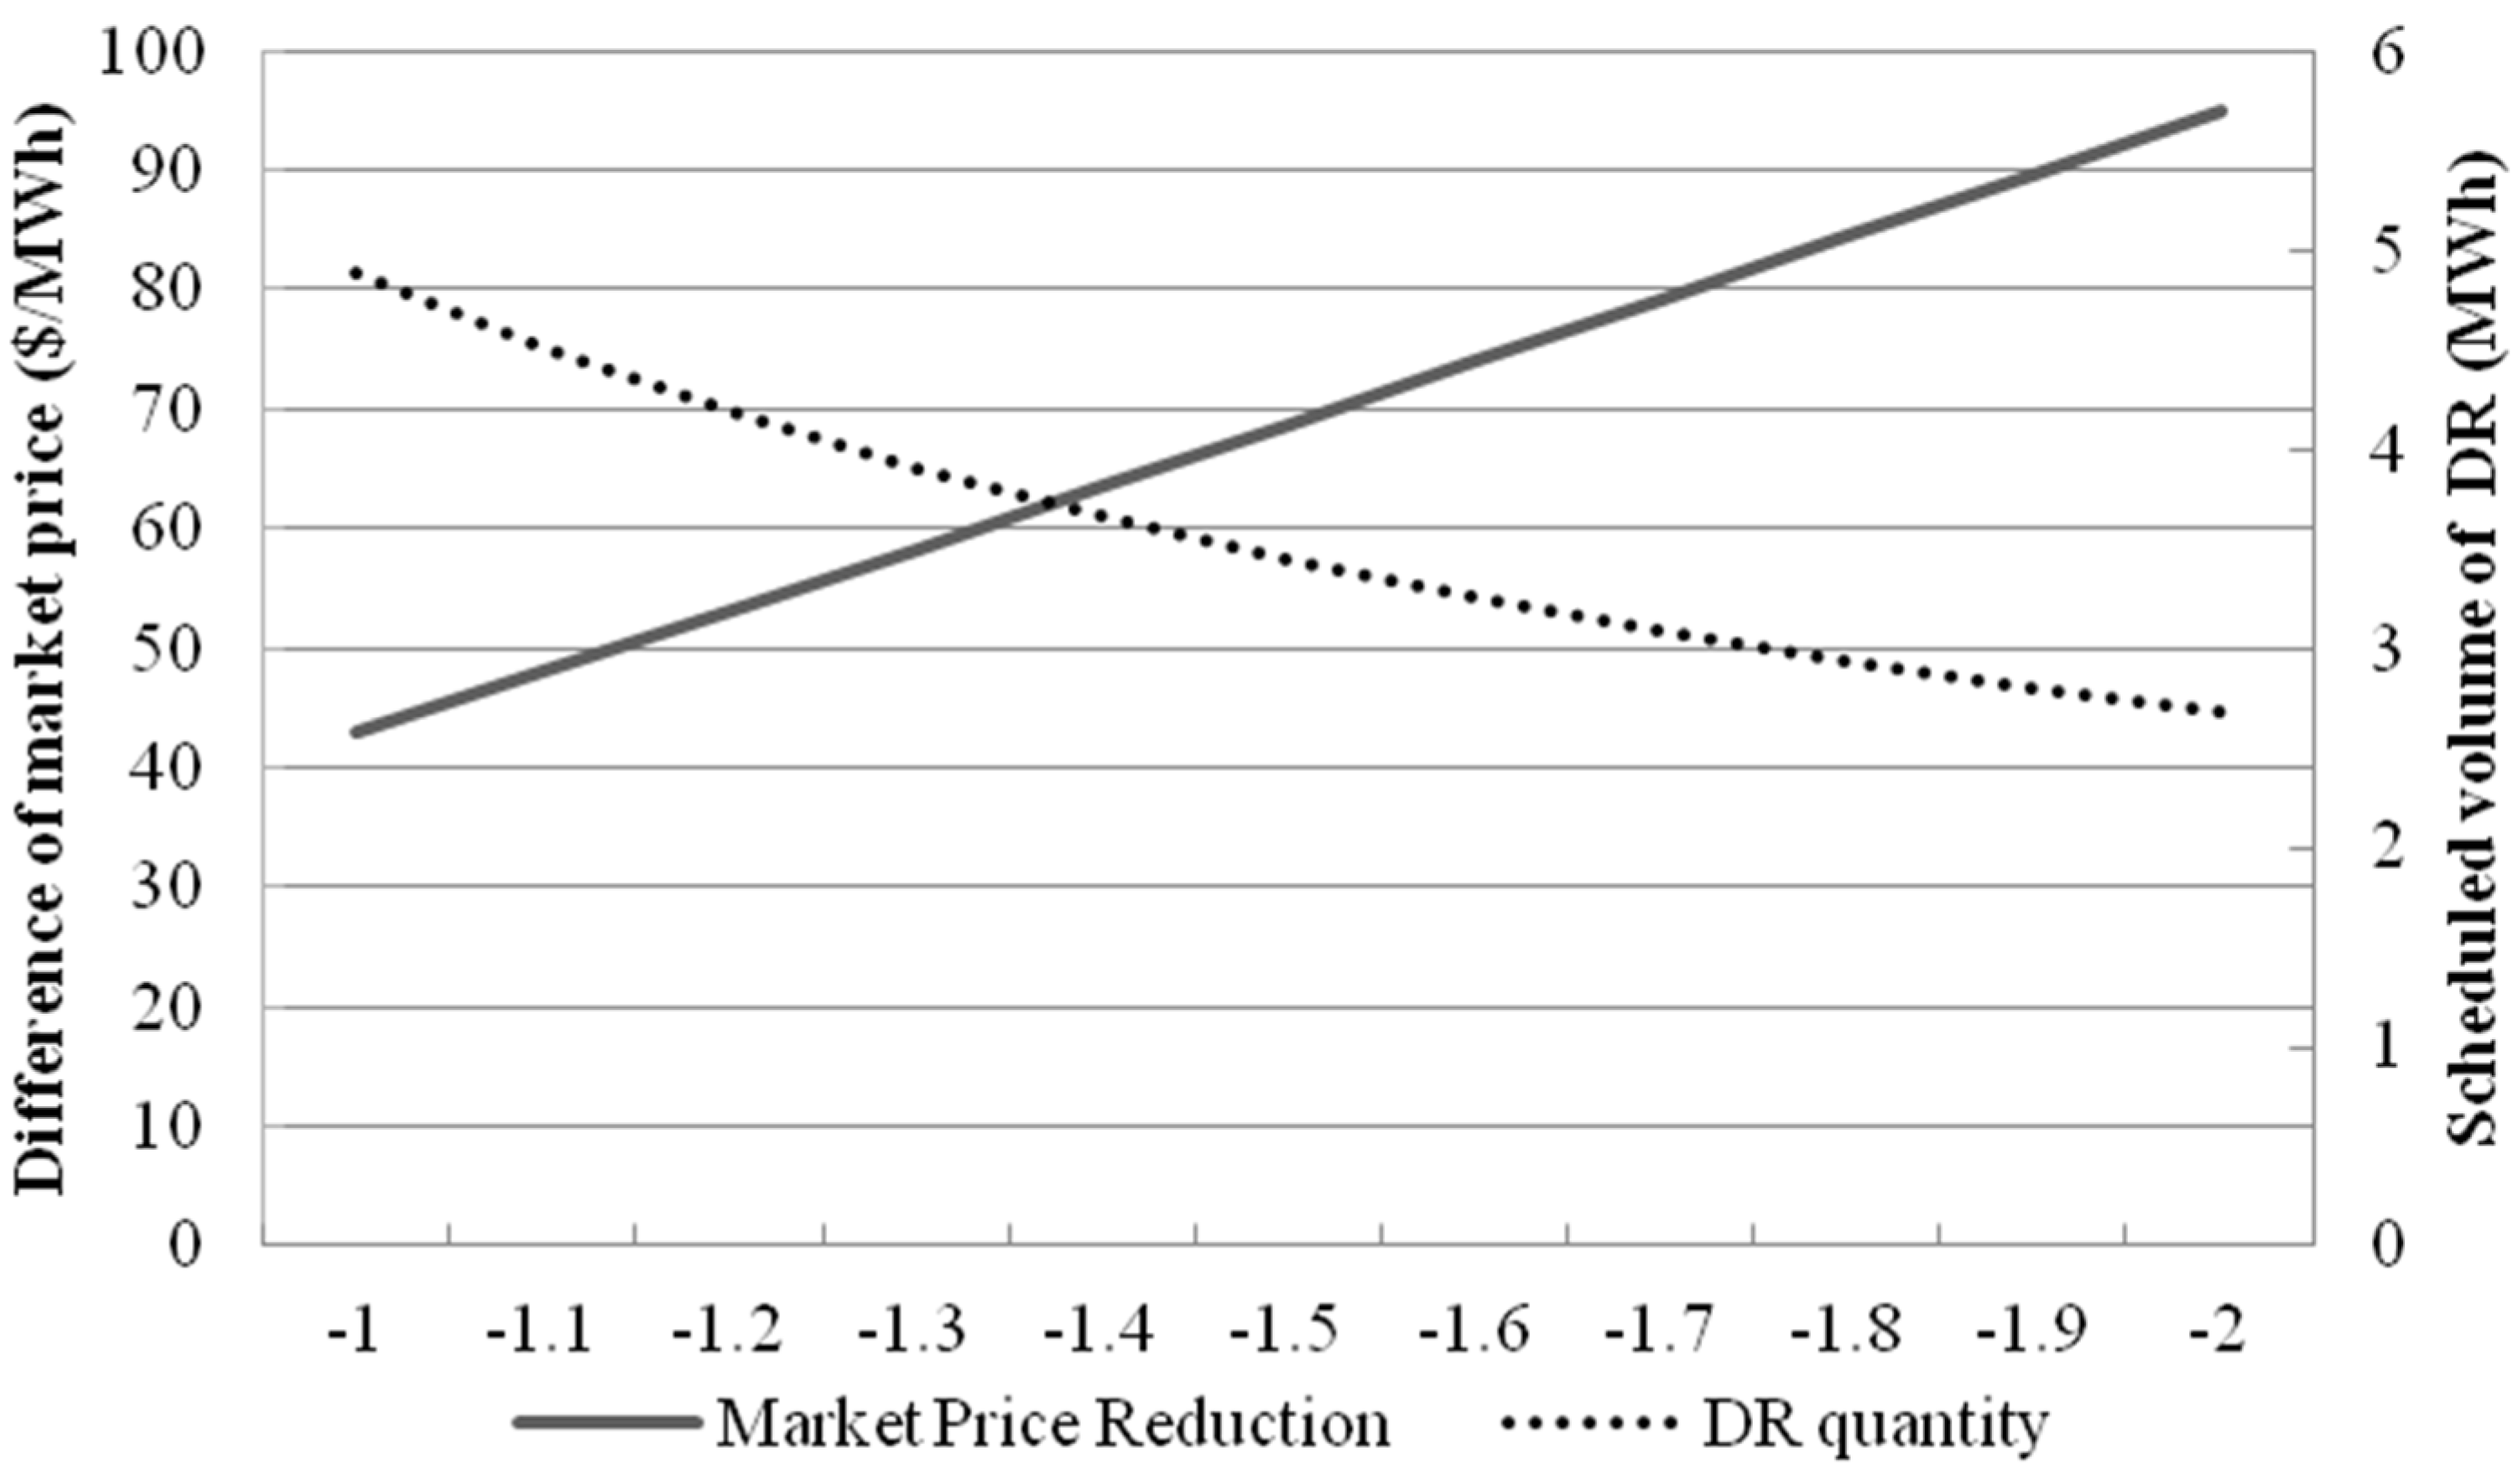
Figure 5 shows the scheduled I/C and the difference in price between the oligopoly conditions and our method as a function of the gradient of the demand curve. When the gradient was −1.0, the I/C that maximized the social welfare and prevented market power from being exercised was 4.886 MW·h. When the gradient of the demand curve was −2.0, the I/C was 2.679 MW·h.
Figure 5.
The scheduled I/C and the difference in price between our method and oligopoly conditions. The horizontal axis is the gradient of the demand function, the left vertical axis is the difference between market prices, and the right vertical axis shows the scheduled I/C.
Figure 5.
The scheduled I/C and the difference in price between our method and oligopoly conditions. The horizontal axis is the gradient of the demand function, the left vertical axis is the difference between market prices, and the right vertical axis shows the scheduled I/C.
In other words, if the consumer is less sensitive to the market prices (i.e., a steeper gradient of the demand curve), less DR is required to maximize social welfare. The difference in price between oligopoly and our method increased from 42.977 to 94.98 $/MW·h as the gradient became steeper. Even though the deployed demand resource quantity is decreased as the demand gradient became steeper, the market power mitigation effect is exposed strongly.
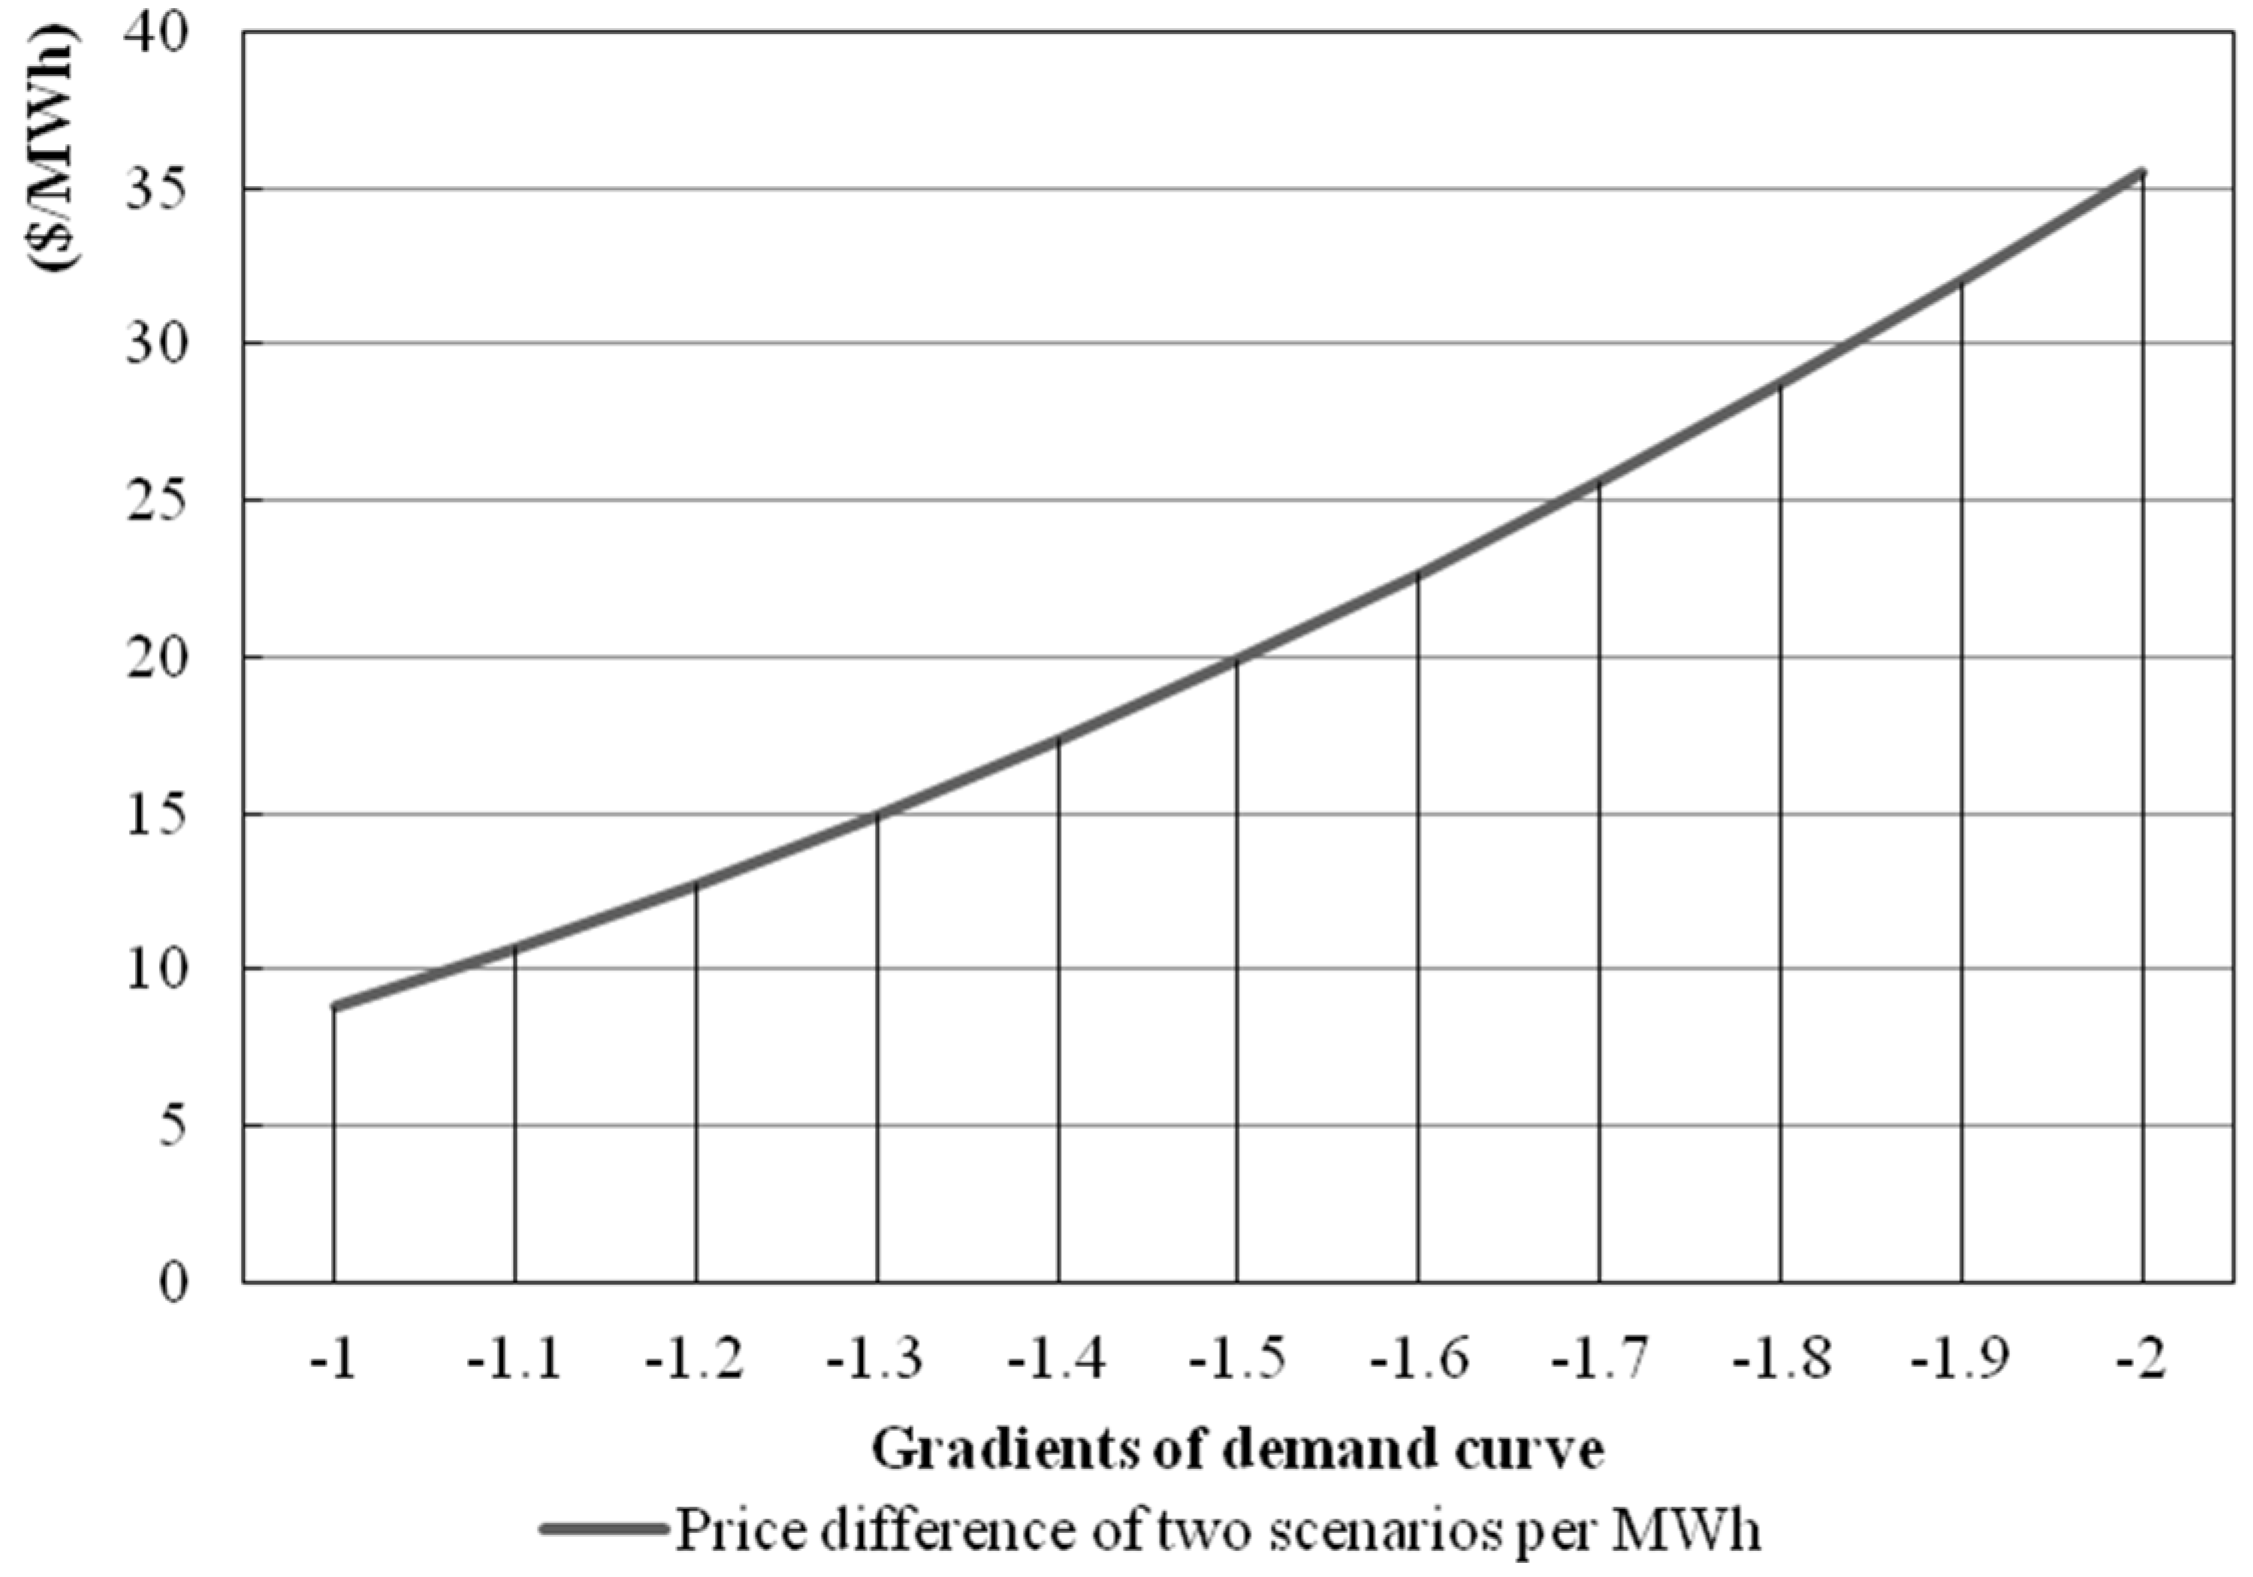
Figure 6 shows deployed I/C per MW·h as a function of the difference in price between our method and oligopoly. The price reduction per MW·h of demand resource increased as consumers become insensitive. With Case 1, 1 MW·h of I/C demand resource induced a price reduction of 8.796 $/MW·h, whereas a reduction in price of 35.453 $/MW·h was found for Case 11. It follows that demand resource influences the market price more effectively as the gradient of the demand curve increases, and our method is sufficient to manage a variety of different utilities.
Figure 6.
The assigned demand resource per MW·h.
Figure 6.
The assigned demand resource per MW·h.
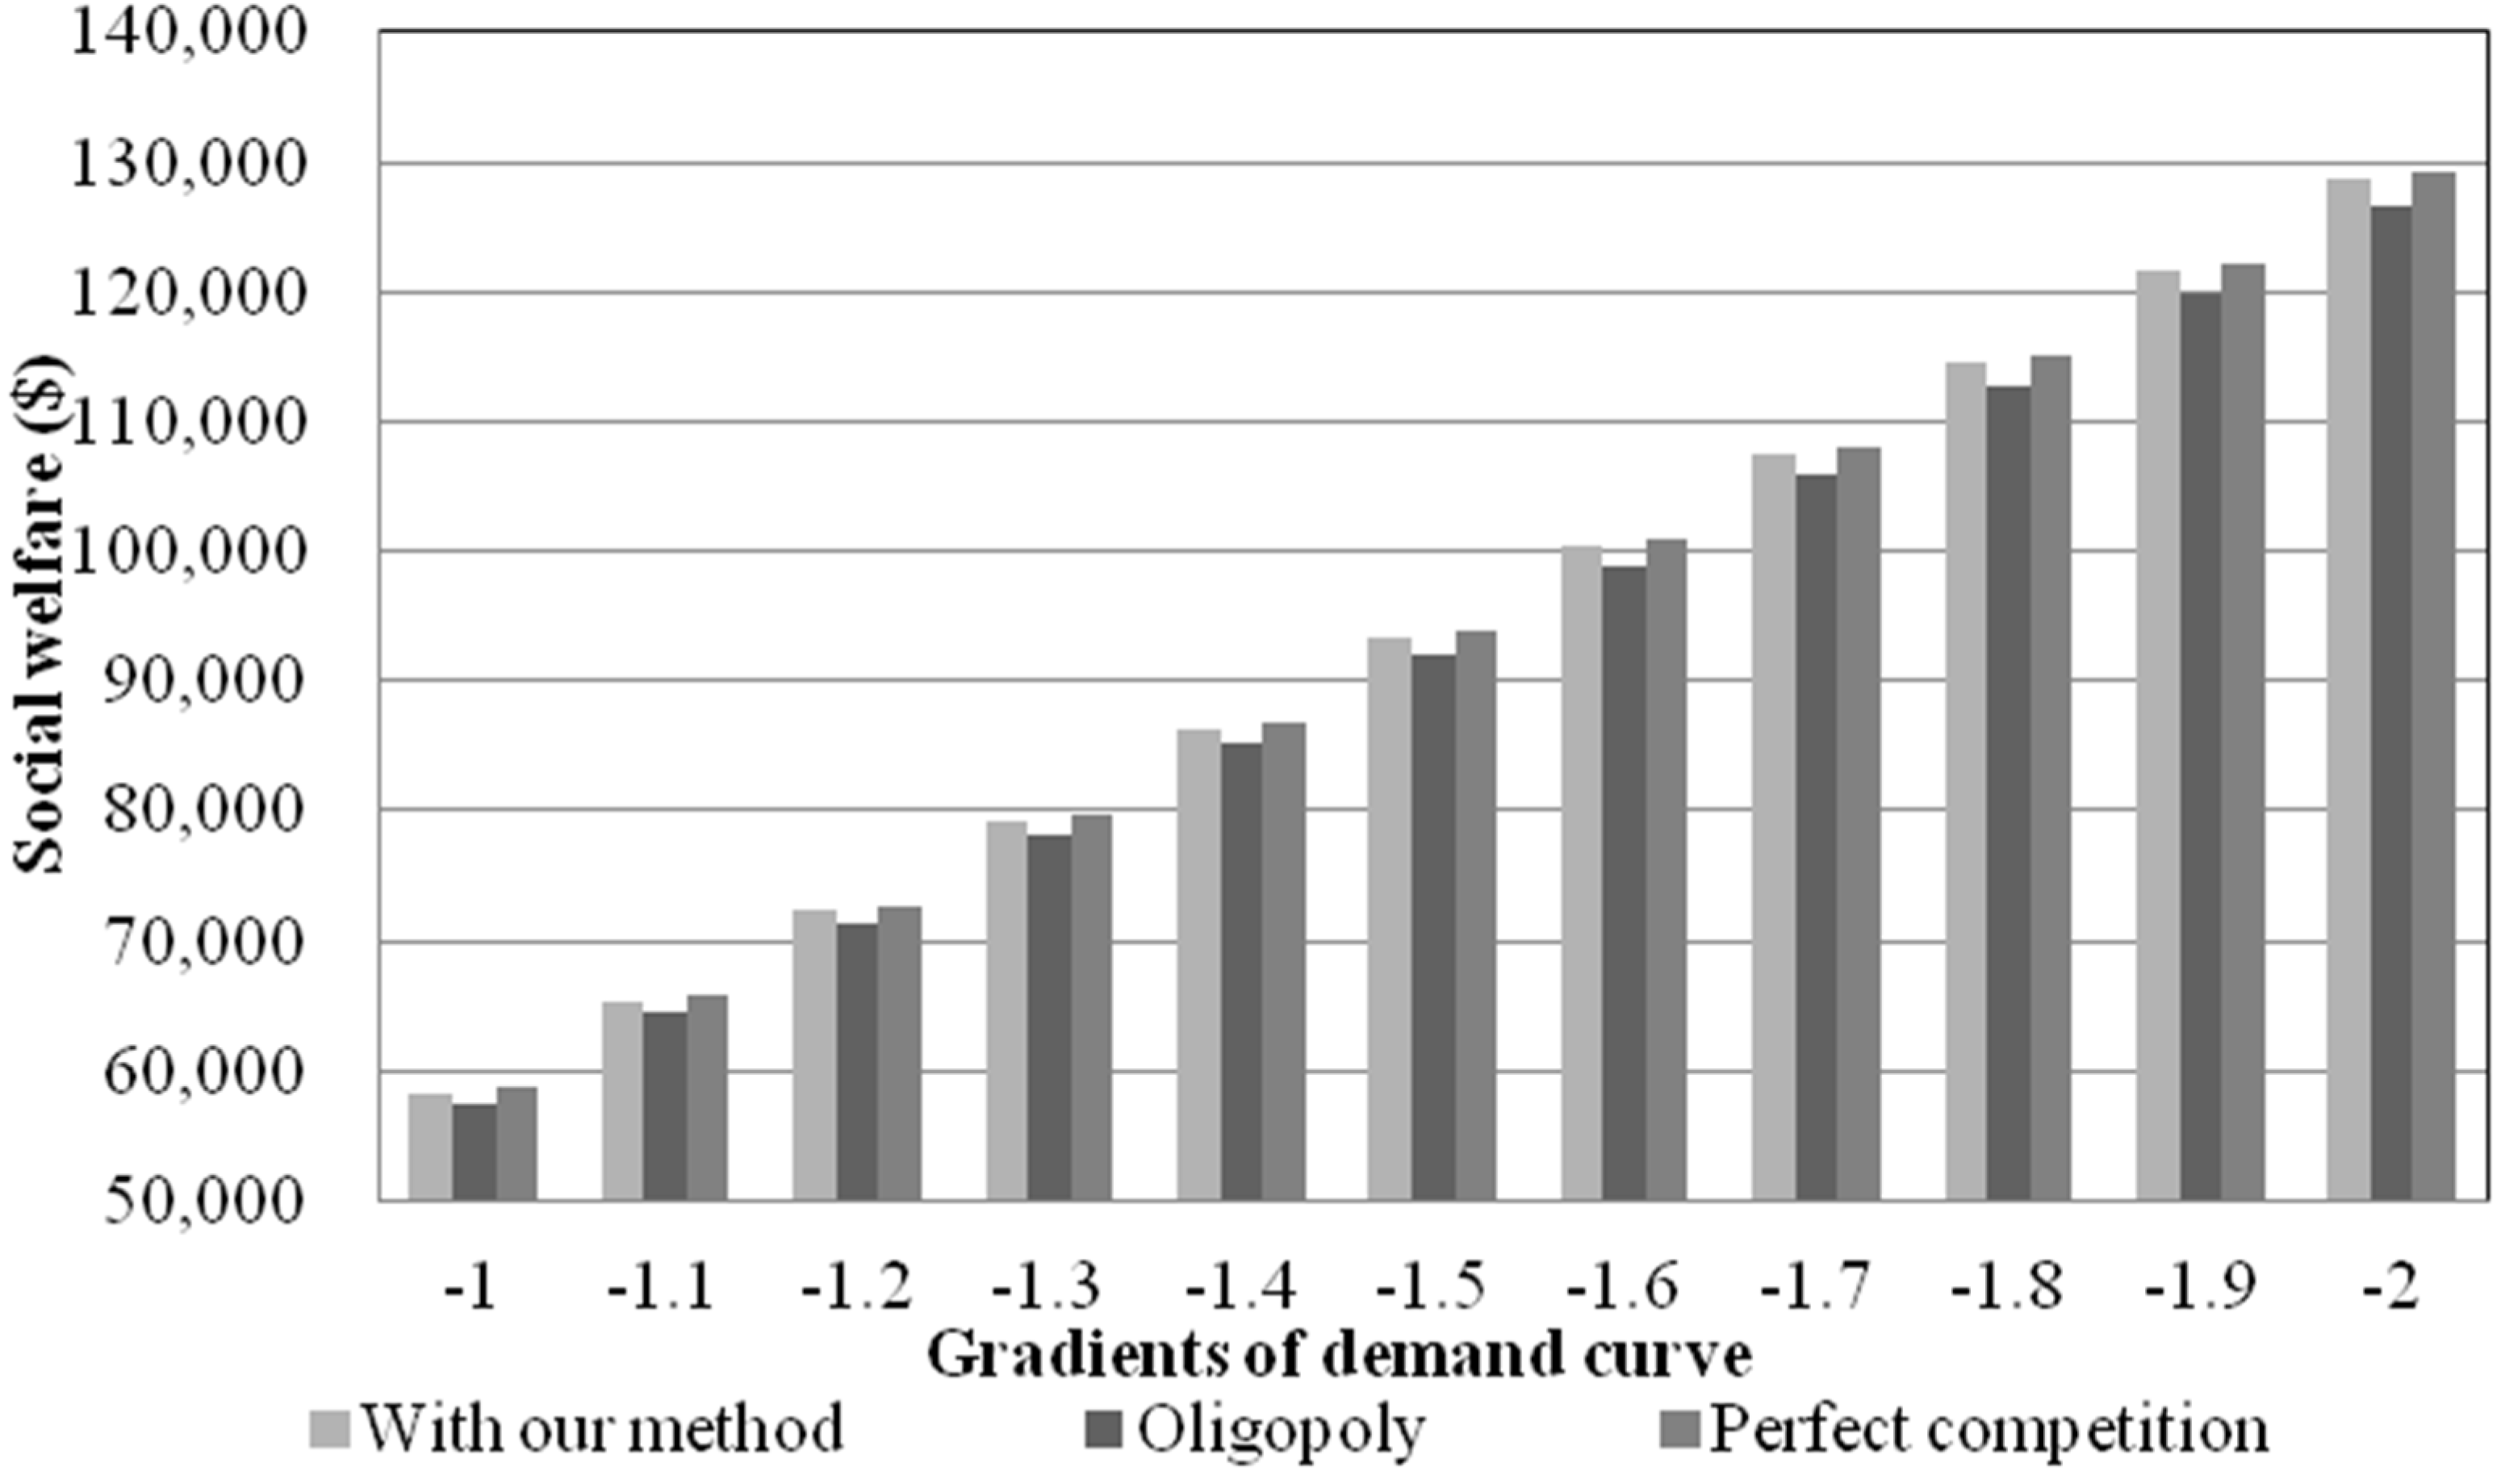
(3) The social welfare with our method was greater than with the oligopoly scenario
As shown in
Figure 7, the social welfare with our method was greater than with the oligopoly conditions for all cases. This is because the increase in the consumer surplus was greater than the decrease in the supplier surplus with a given reduction in the market-clearing price. The dispatch of generators that did not withhold capacity and the use of I/C resources increased social welfare. This effect is observed most clearly when consumers are insensitive to the market prices, as shown in
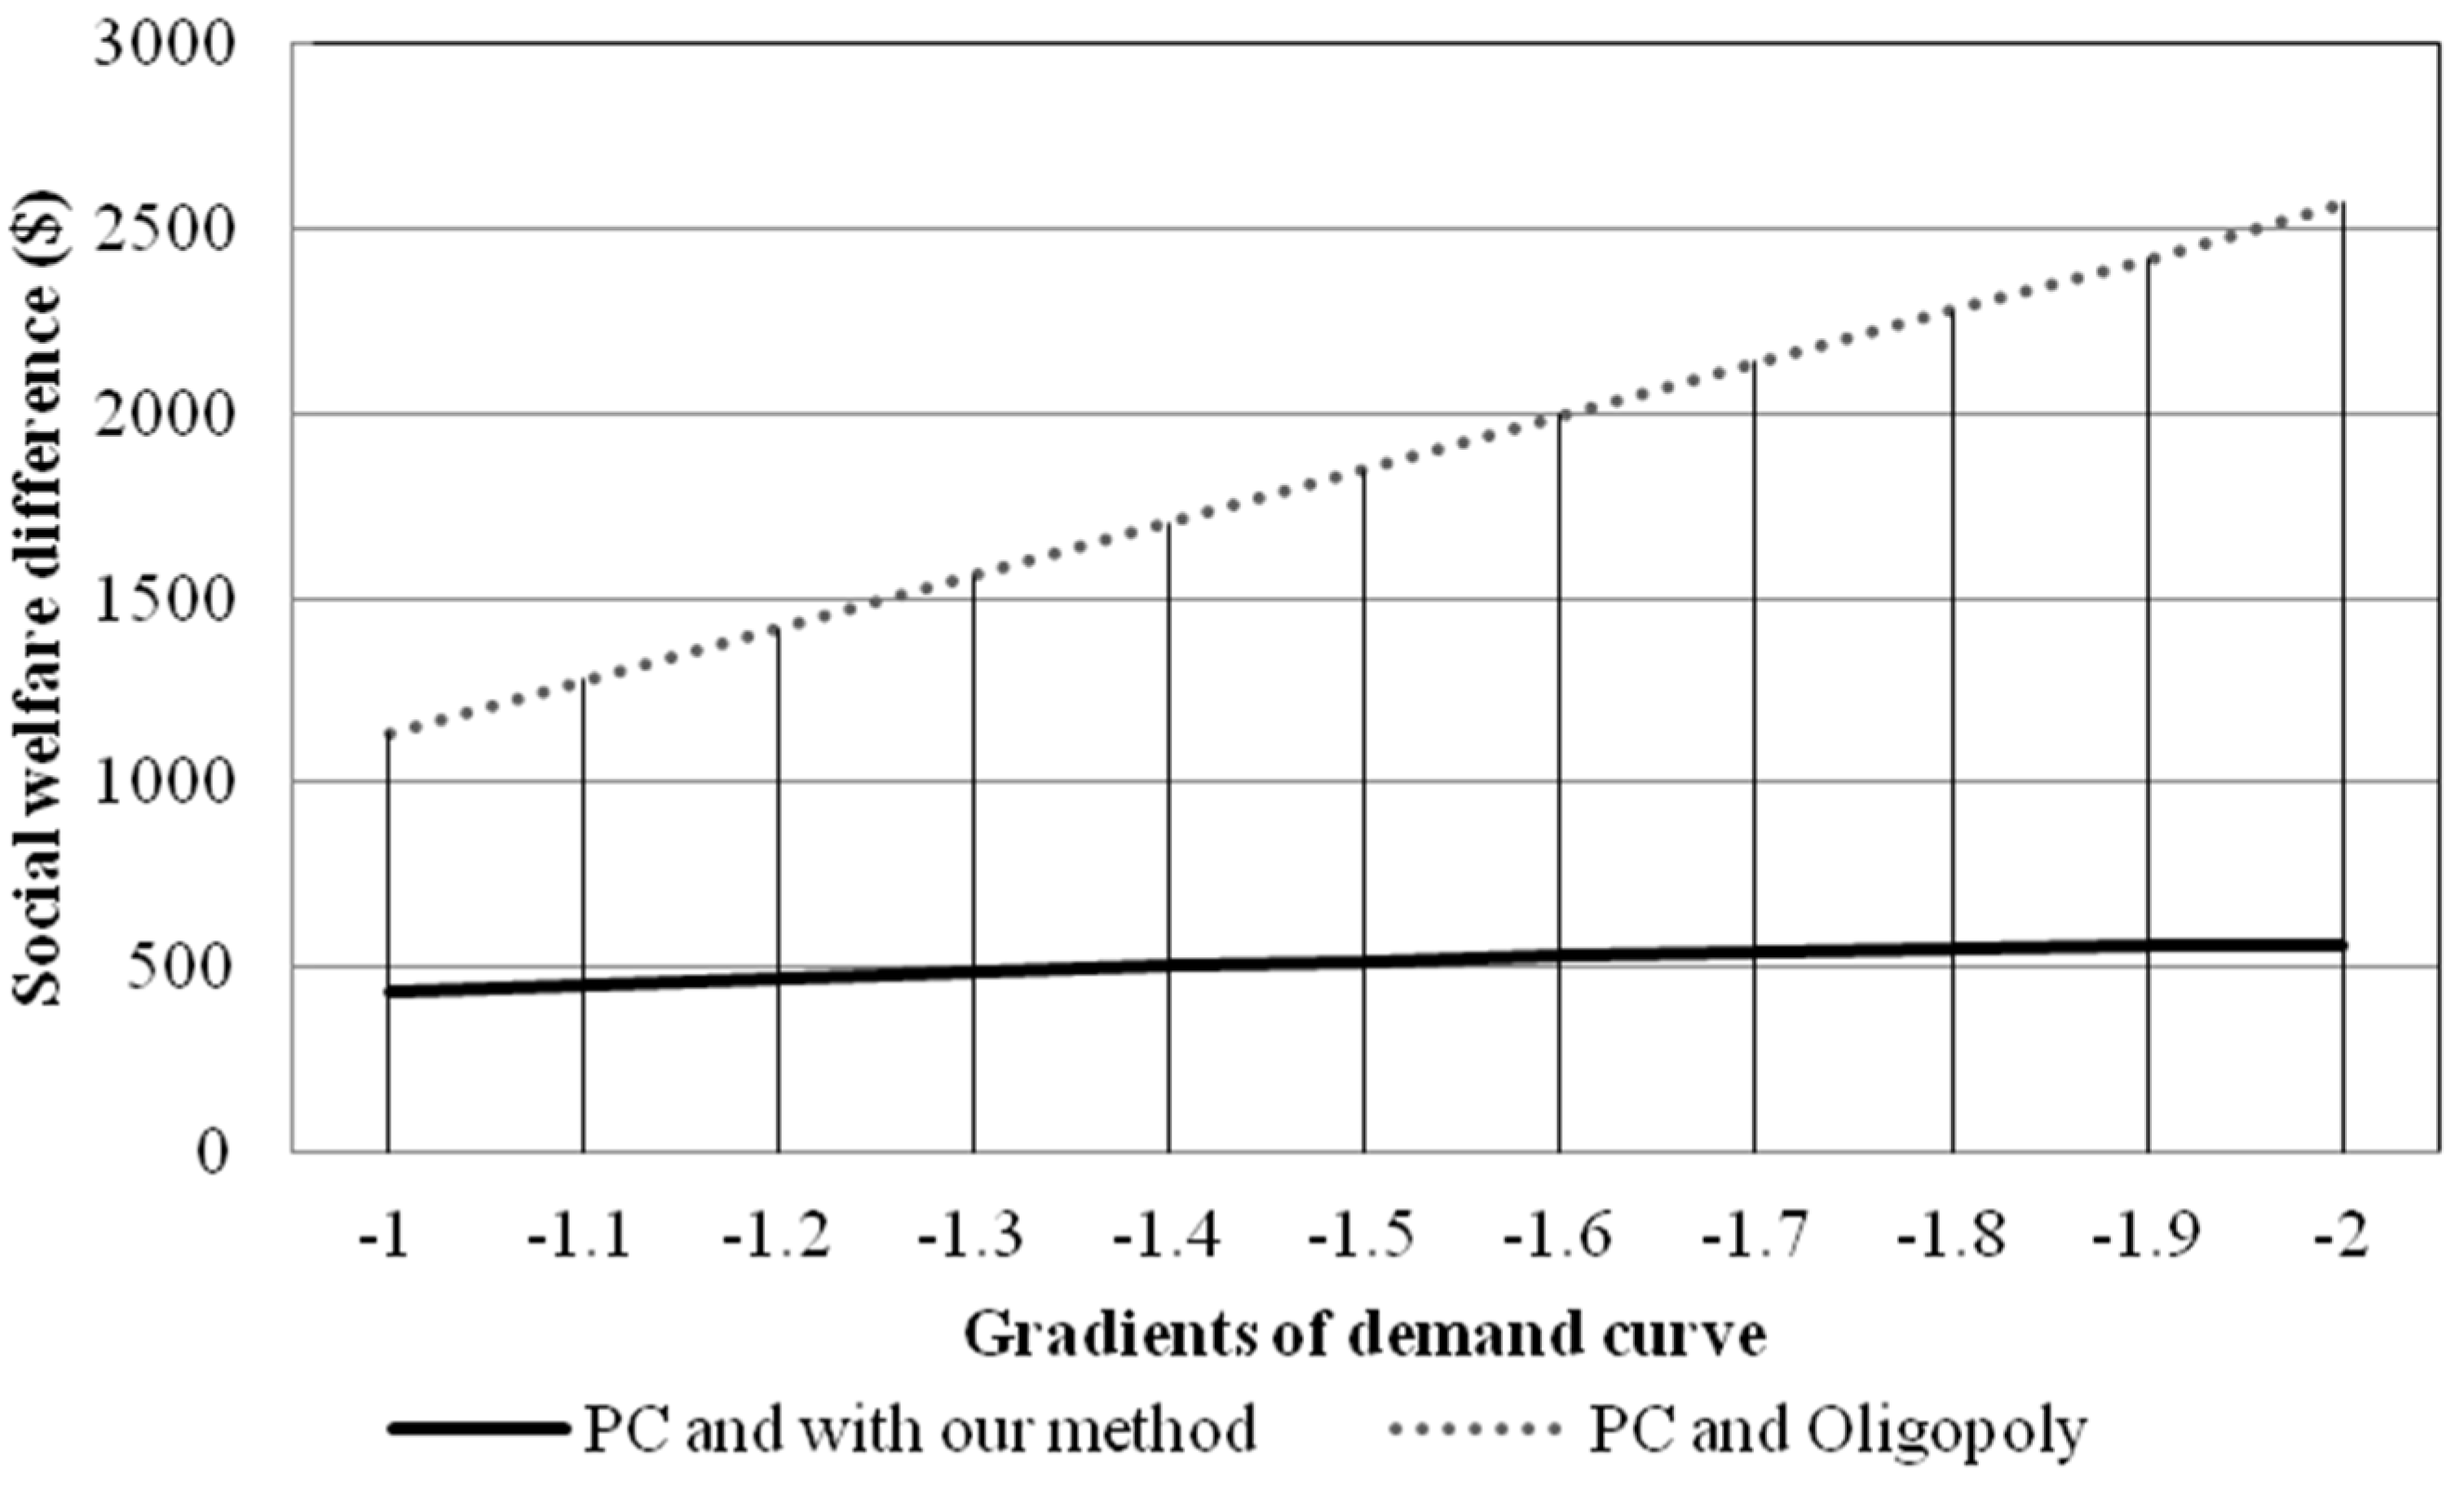
Figure 8. In Case 1 (where the gradient of the demand curve was −1), the difference in social welfare between our method and perfect competition was 433.156 $. The difference in social welfare between an oligopoly and perfect competition was 1135.124 $. When consumers are less sensitive, this difference increases. With Case 11 (where the gradient of the demand curve was −2.0), the difference in social welfare between scenario 1 and 3 was equal to 560 $; however, the difference between scenarios 2 and 3 was 2,570 $. These results show that the use of the method described here was more effective with less sensitive consumers, and mitigated the exercising of market powers via decreasing the economic efficiency of the oligopoly.
The social welfare with our method was always smaller than that with perfect competition. The first reason is that the demand curve used in the simulations was assumed to explicitly reflect the utility of the consumers. Therefore, external management of demand always reduces the social welfare. In other words, the total generated (and consumed) energy was always lower with I/C. A second reason is that the surplus of curtailed load, which was transferred to other time periods due to cross elasticity, was not contained in the calculation of the social welfare during the target period. This results in a decrease in the social welfare calculated using our method.
Figure 7.
The social welfare for the three different scenarios.
Figure 7.
The social welfare for the three different scenarios.
Figure 8.
The difference in social welfare between oligopoly and perfect competition, and between our method and perfect competition.
Figure 8.
The difference in social welfare between oligopoly and perfect competition, and between our method and perfect competition.
(4) The assessment indices show better economic efficiency with our method than with oligopoly conditions
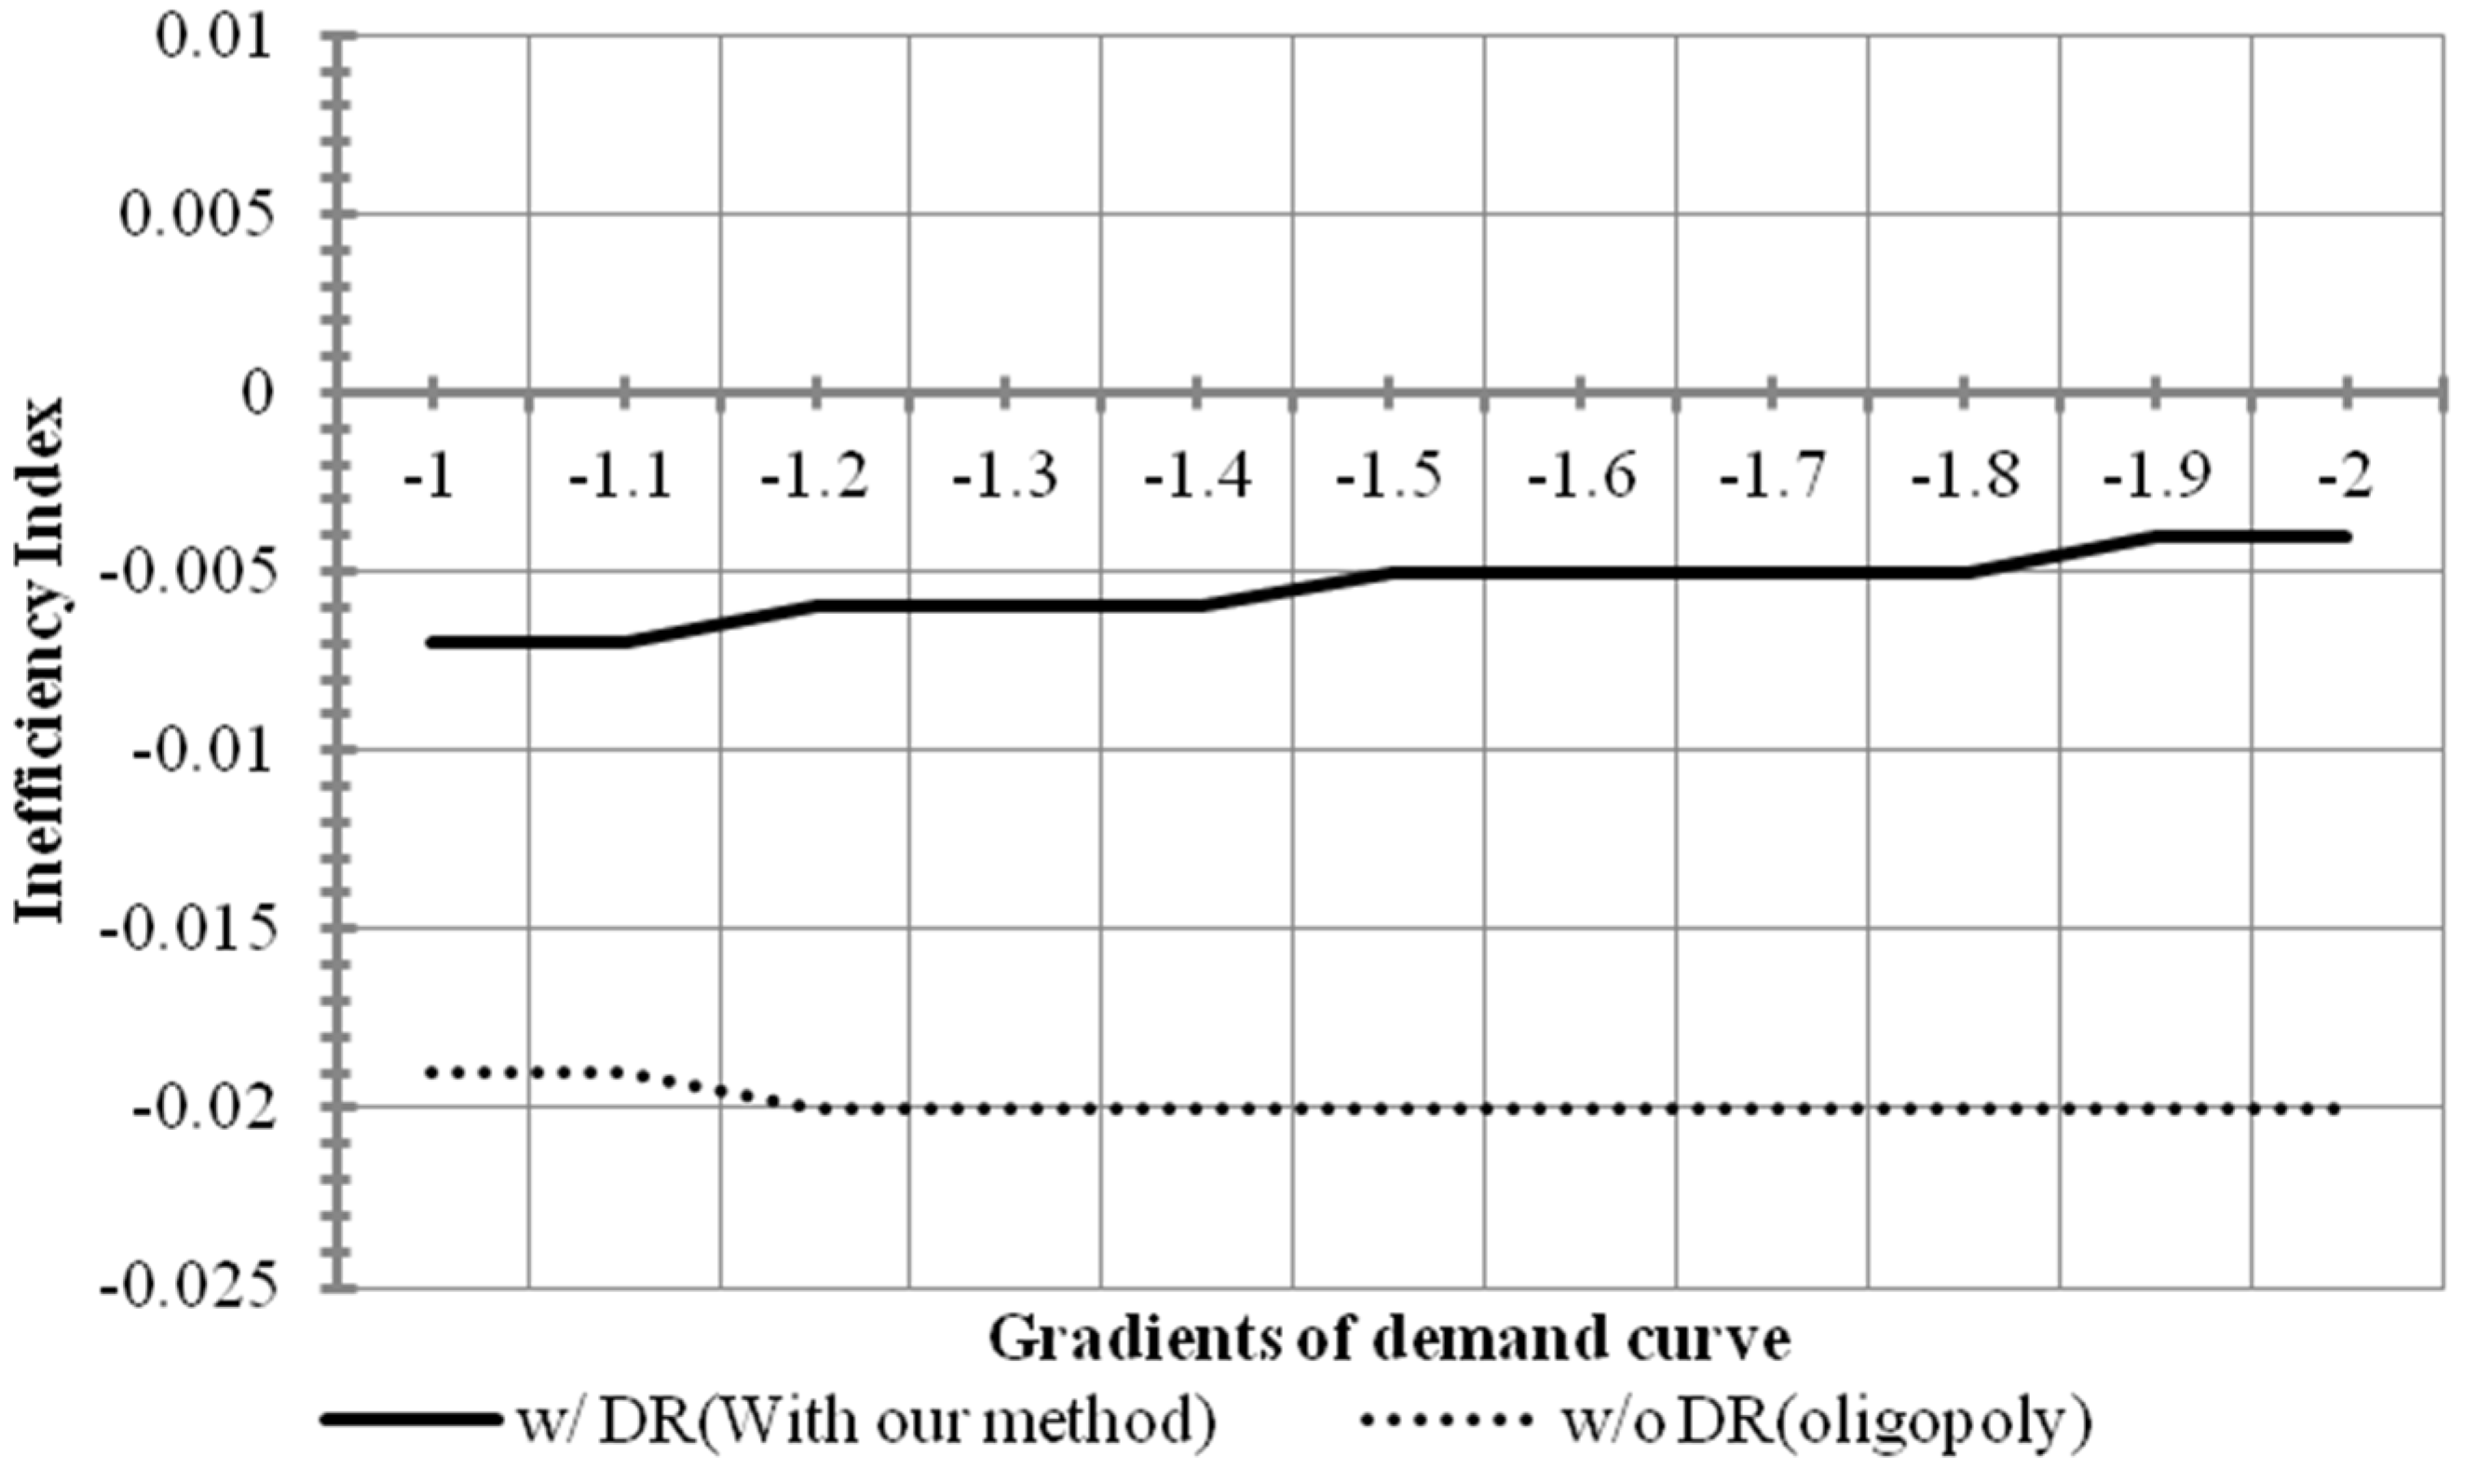
The inefficiency index can be obtained from the social welfare indices with perfect competition, oligopoly conditions and with the method described here. The efficiency issues are shown in
Figure 9 as a function of the gradient of the demand curve. As the inefficiency index gets closer to the zero, economic efficiency improves (the inefficiency index of perfect competition is zero). Increasingly negative inefficiency indices correspond to a lower social welfare. The inefficiency index of the oligopoly conditions was similar for all gradients of the demand curve, being −0.019 with Cases 1 and 2, and −0.020 for the other cases. The inefficiency index with our method increased as the consumer became less sensitive, and was −0.007 with Case 1 to 0.004 in Case 2. These results demonstrate the ability of our method to resolve the gap between the ideal case and practice. Furthermore, as the consumer became less sensitive to the price, the gap between oligopoly and perfect competition increased.
Figure 9.
The inefficiency index with the three methods as a function of the gradient of the demand curve.
Figure 9.
The inefficiency index with the three methods as a function of the gradient of the demand curve.
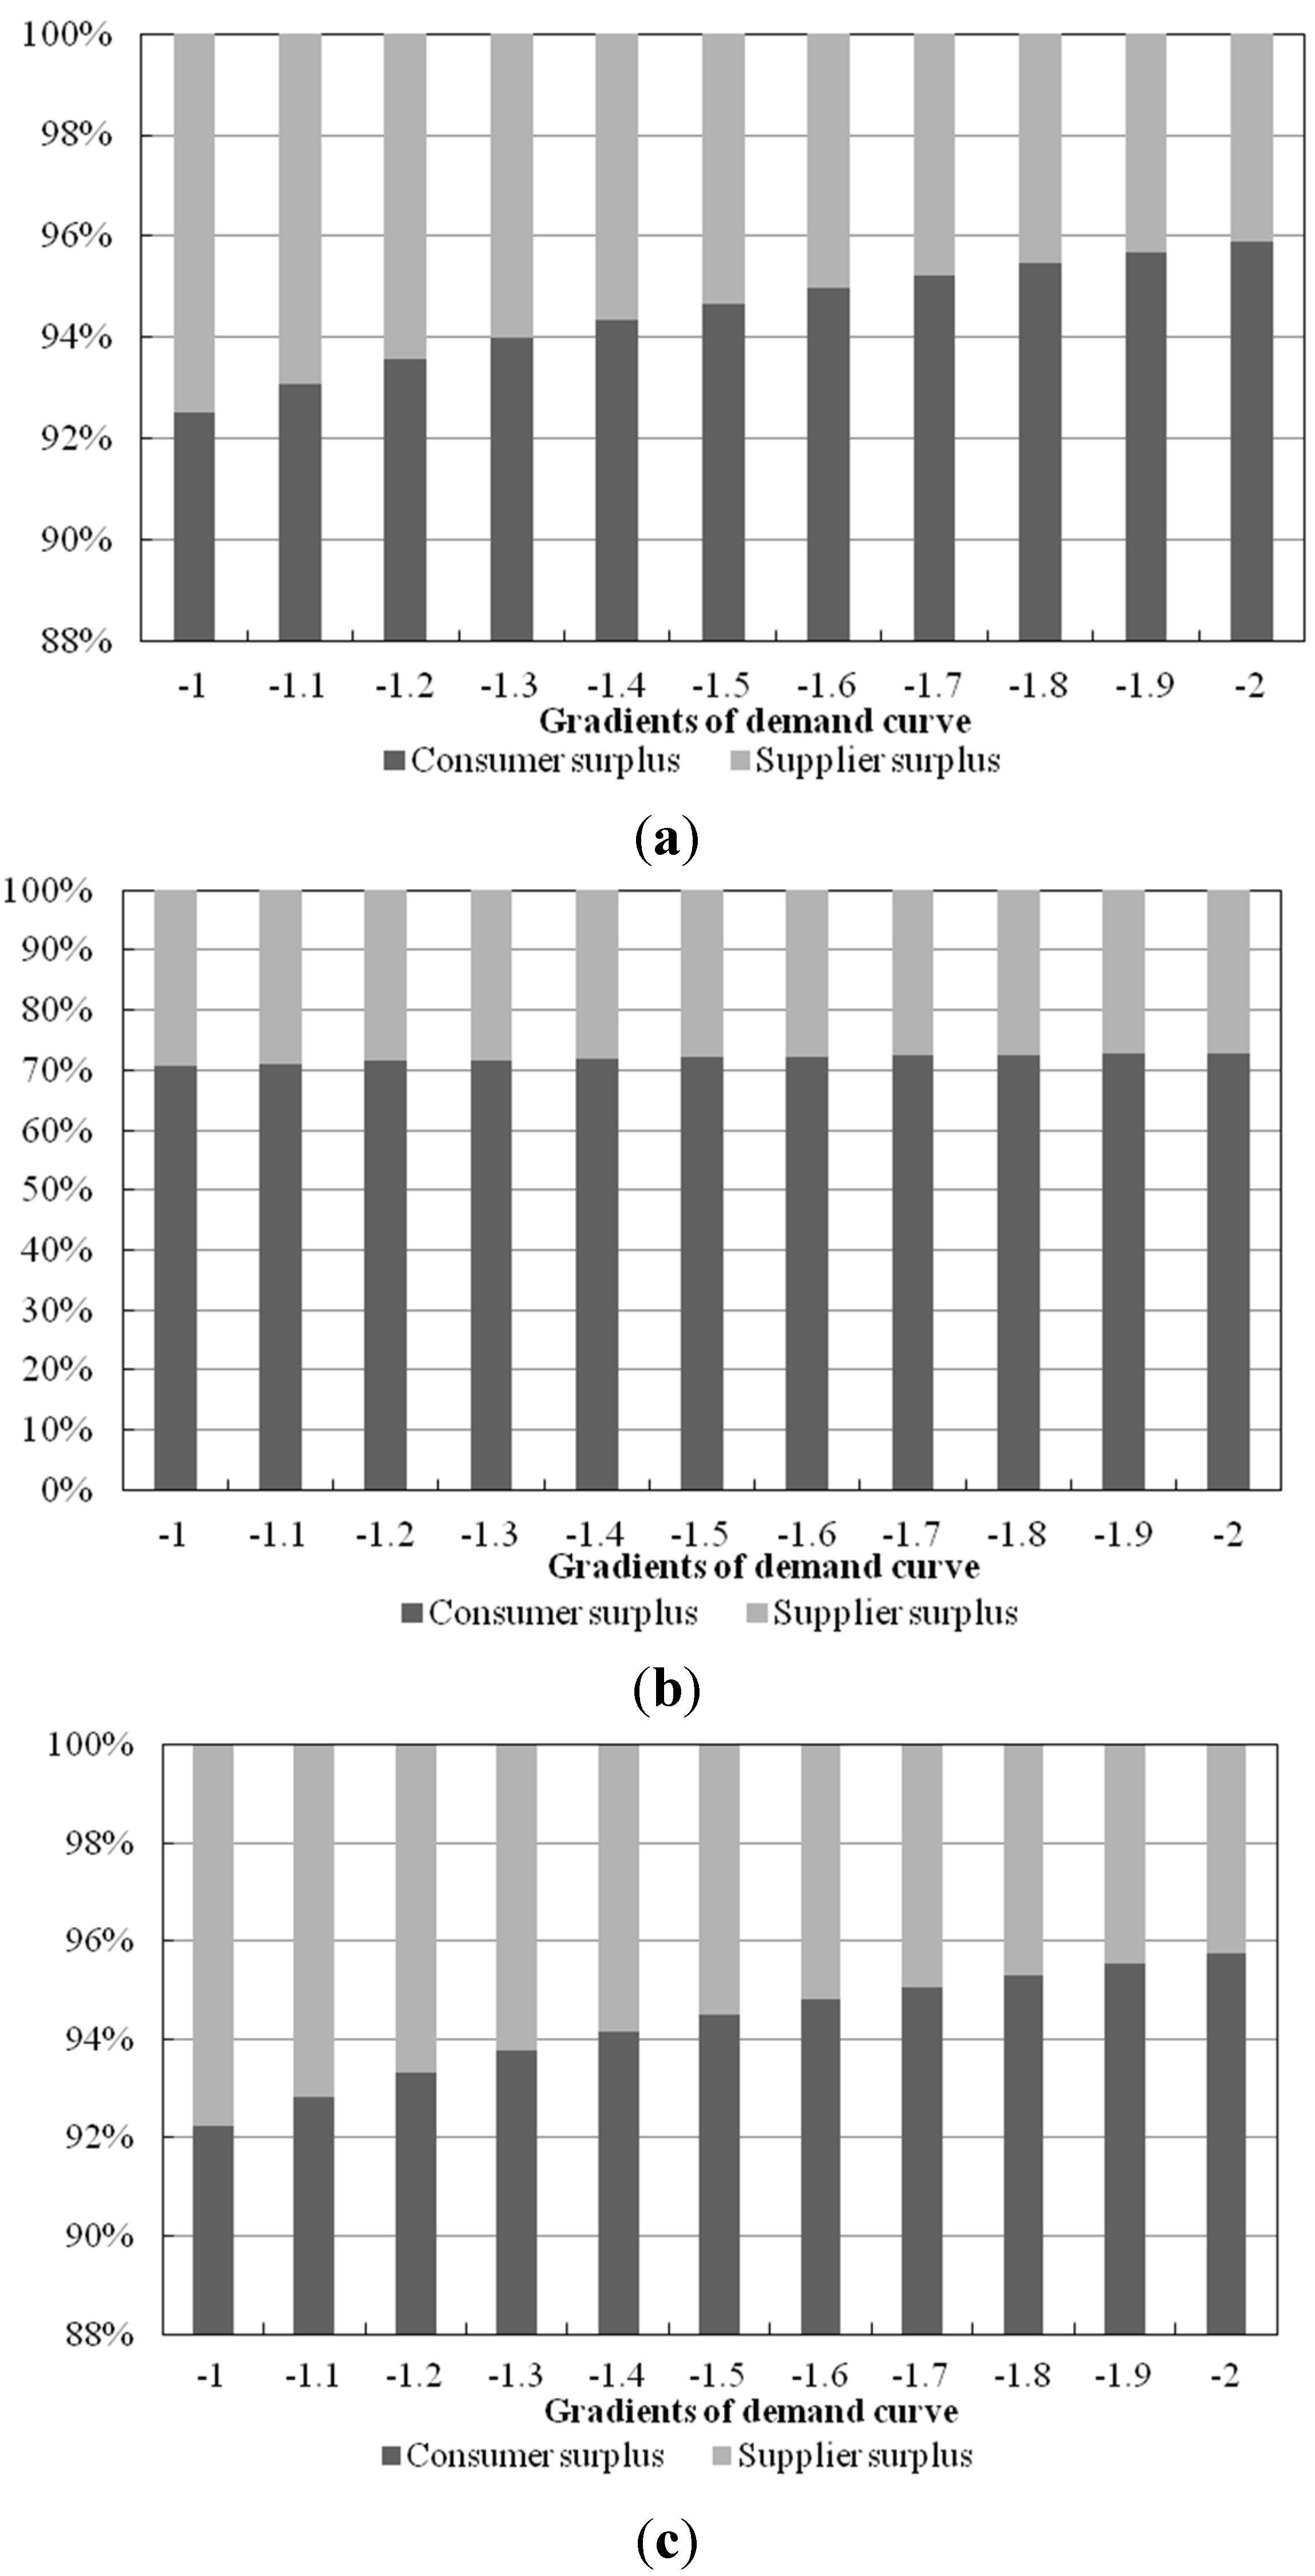
Figure 10 shows the ratio of the consumer and supplier surpluses for each scenario as a function of the gradient of the demand curve. The composition of the surplus with our method was similar to that with perfect competition. When the consumer was less sensitive to the market prices, consumers took a larger portion of the surplus compared with the supplier; however, the oligopoly exhibited an almost fixed ratio of surpluses. It follows that consumers cannot take fair surplus quantities because of strategic capacity withholding of GENCOs. Therefore, the proposed method can inhibit the exercising of market power and improve the economic efficiency of the market.
Figure 10.
The ratio of consumer and supplier surpluses with each scenario. (a) The method described here; (b) Oligopoly conditions, and (c) Perfect competition.
Figure 10.
The ratio of consumer and supplier surpluses with each scenario. (a) The method described here; (b) Oligopoly conditions, and (c) Perfect competition.
The deviation indices of the consumer and supplier surplus are listed in
Table 3 and
Table 4, which also describes how fair or unfair the distribution of surpluses was. As the indices become closer to the zero, economic efficiency improves (the indices of perfect competition are zero). With the oligopoly, deviations of the supplier surplus index were positive, with values in the range 2.69–5.25. The deviation of the consumer surplus index was negative, and the values were approximately −0.24 for all cases.
Table 3.
Consumer surplus deviation index with respect to gradients of the demand curve.
Table 3.
Consumer surplus deviation index with respect to gradients of the demand curve.
| Gradient value | −1 | −1.1 | −1.2 | −1.3 | −1.4 | −1.5 | −1.6 | −1.7 | −1.8 | −1.9 | −2 |
|---|
| Without I/C | −0.2475 | −0.2484 | −0.2493 | −0.2501 | −0.2508 | −0.2515 | −0.2522 | −0.2528 | −0.2533 | −0.2538 | −0.2543 |
| With I/C | −0.00431 | −0.00415 | −0.00399 | −0.00384 | −0.00369 | −0.00355 | −0.00342 | −0.00331 | −0.00319 | −0.00308 | −0.00299 |
Table 4.
Supplier surplus deviation index with respect to gradients of the demand curve.
Table 4.
Supplier surplus deviation index with respect to gradients of the demand curve.
| Gradient value | −1 | −1.1 | −1.2 | −1.3 | −1.4 | −1.5 | −1.6 | −1.7 | −1.8 | −1.9 | −2 |
|---|
| Without I/C | 2.6902 | 2.9400 | 3.1920 | 3.4458 | 3.7009 | 3.9571 | 4.2140 | 4.4717 | 4.7299 | 4.9885 | 5.2475 |
| With I/C | −0.04378 | −0.04248 | −0.04132 | −0.04031 | −0.03942 | −0.03863 | −0.03793 | −0.0373 | −0.03674 | −0.03624 | −0.03578 |
These results show that the supplier takes additional surplus from consumers by increasing prices via capacity withdrawal. With our method, indices are all negative and there was less deviation compared with oligopoly. This supports improvements in economic efficiency using the method described here via fairer distribution of surpluses.


