
Optimizing Solar Heating for Thangka Exhibition Halls: A Case Study in Malkang Cultural Village


Abstract
:1. Introduction
2. Materials and Methods
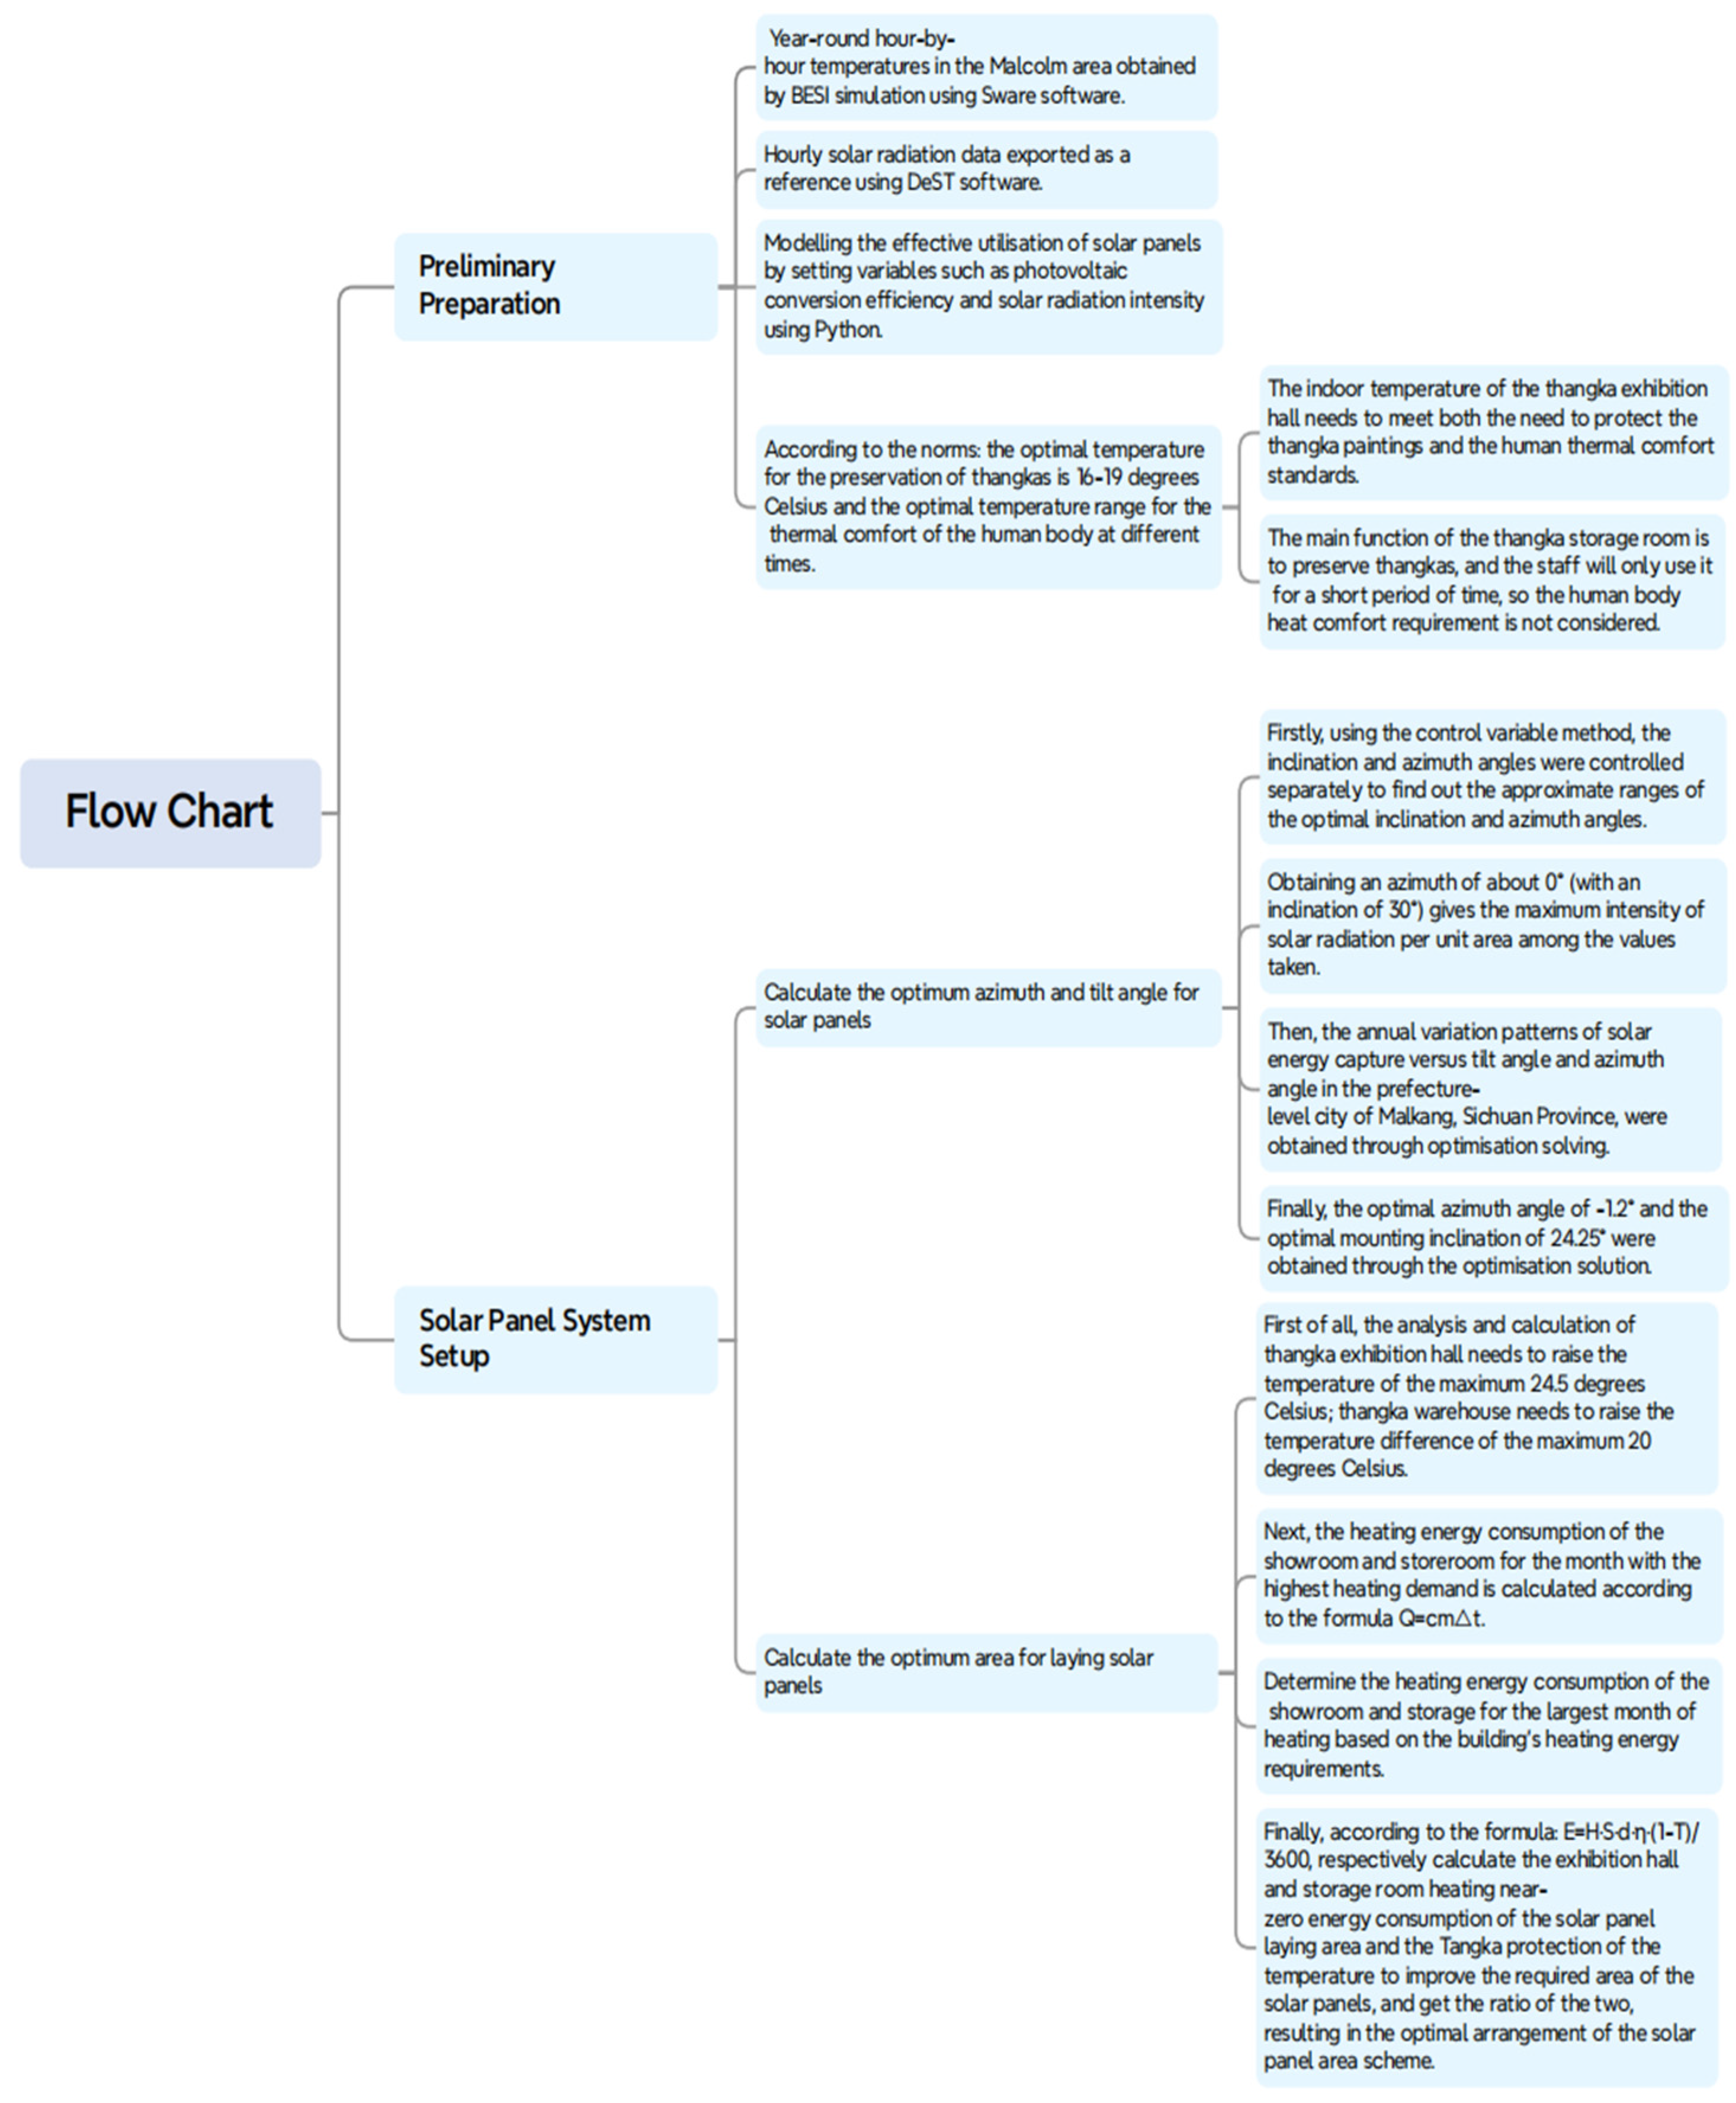
2.1. Research Process
2.2. Solar Heating Mechanism
2.3. Thangka Exhibition Room Parameter Setting
2.4. Solar Energy System Setup
- 1
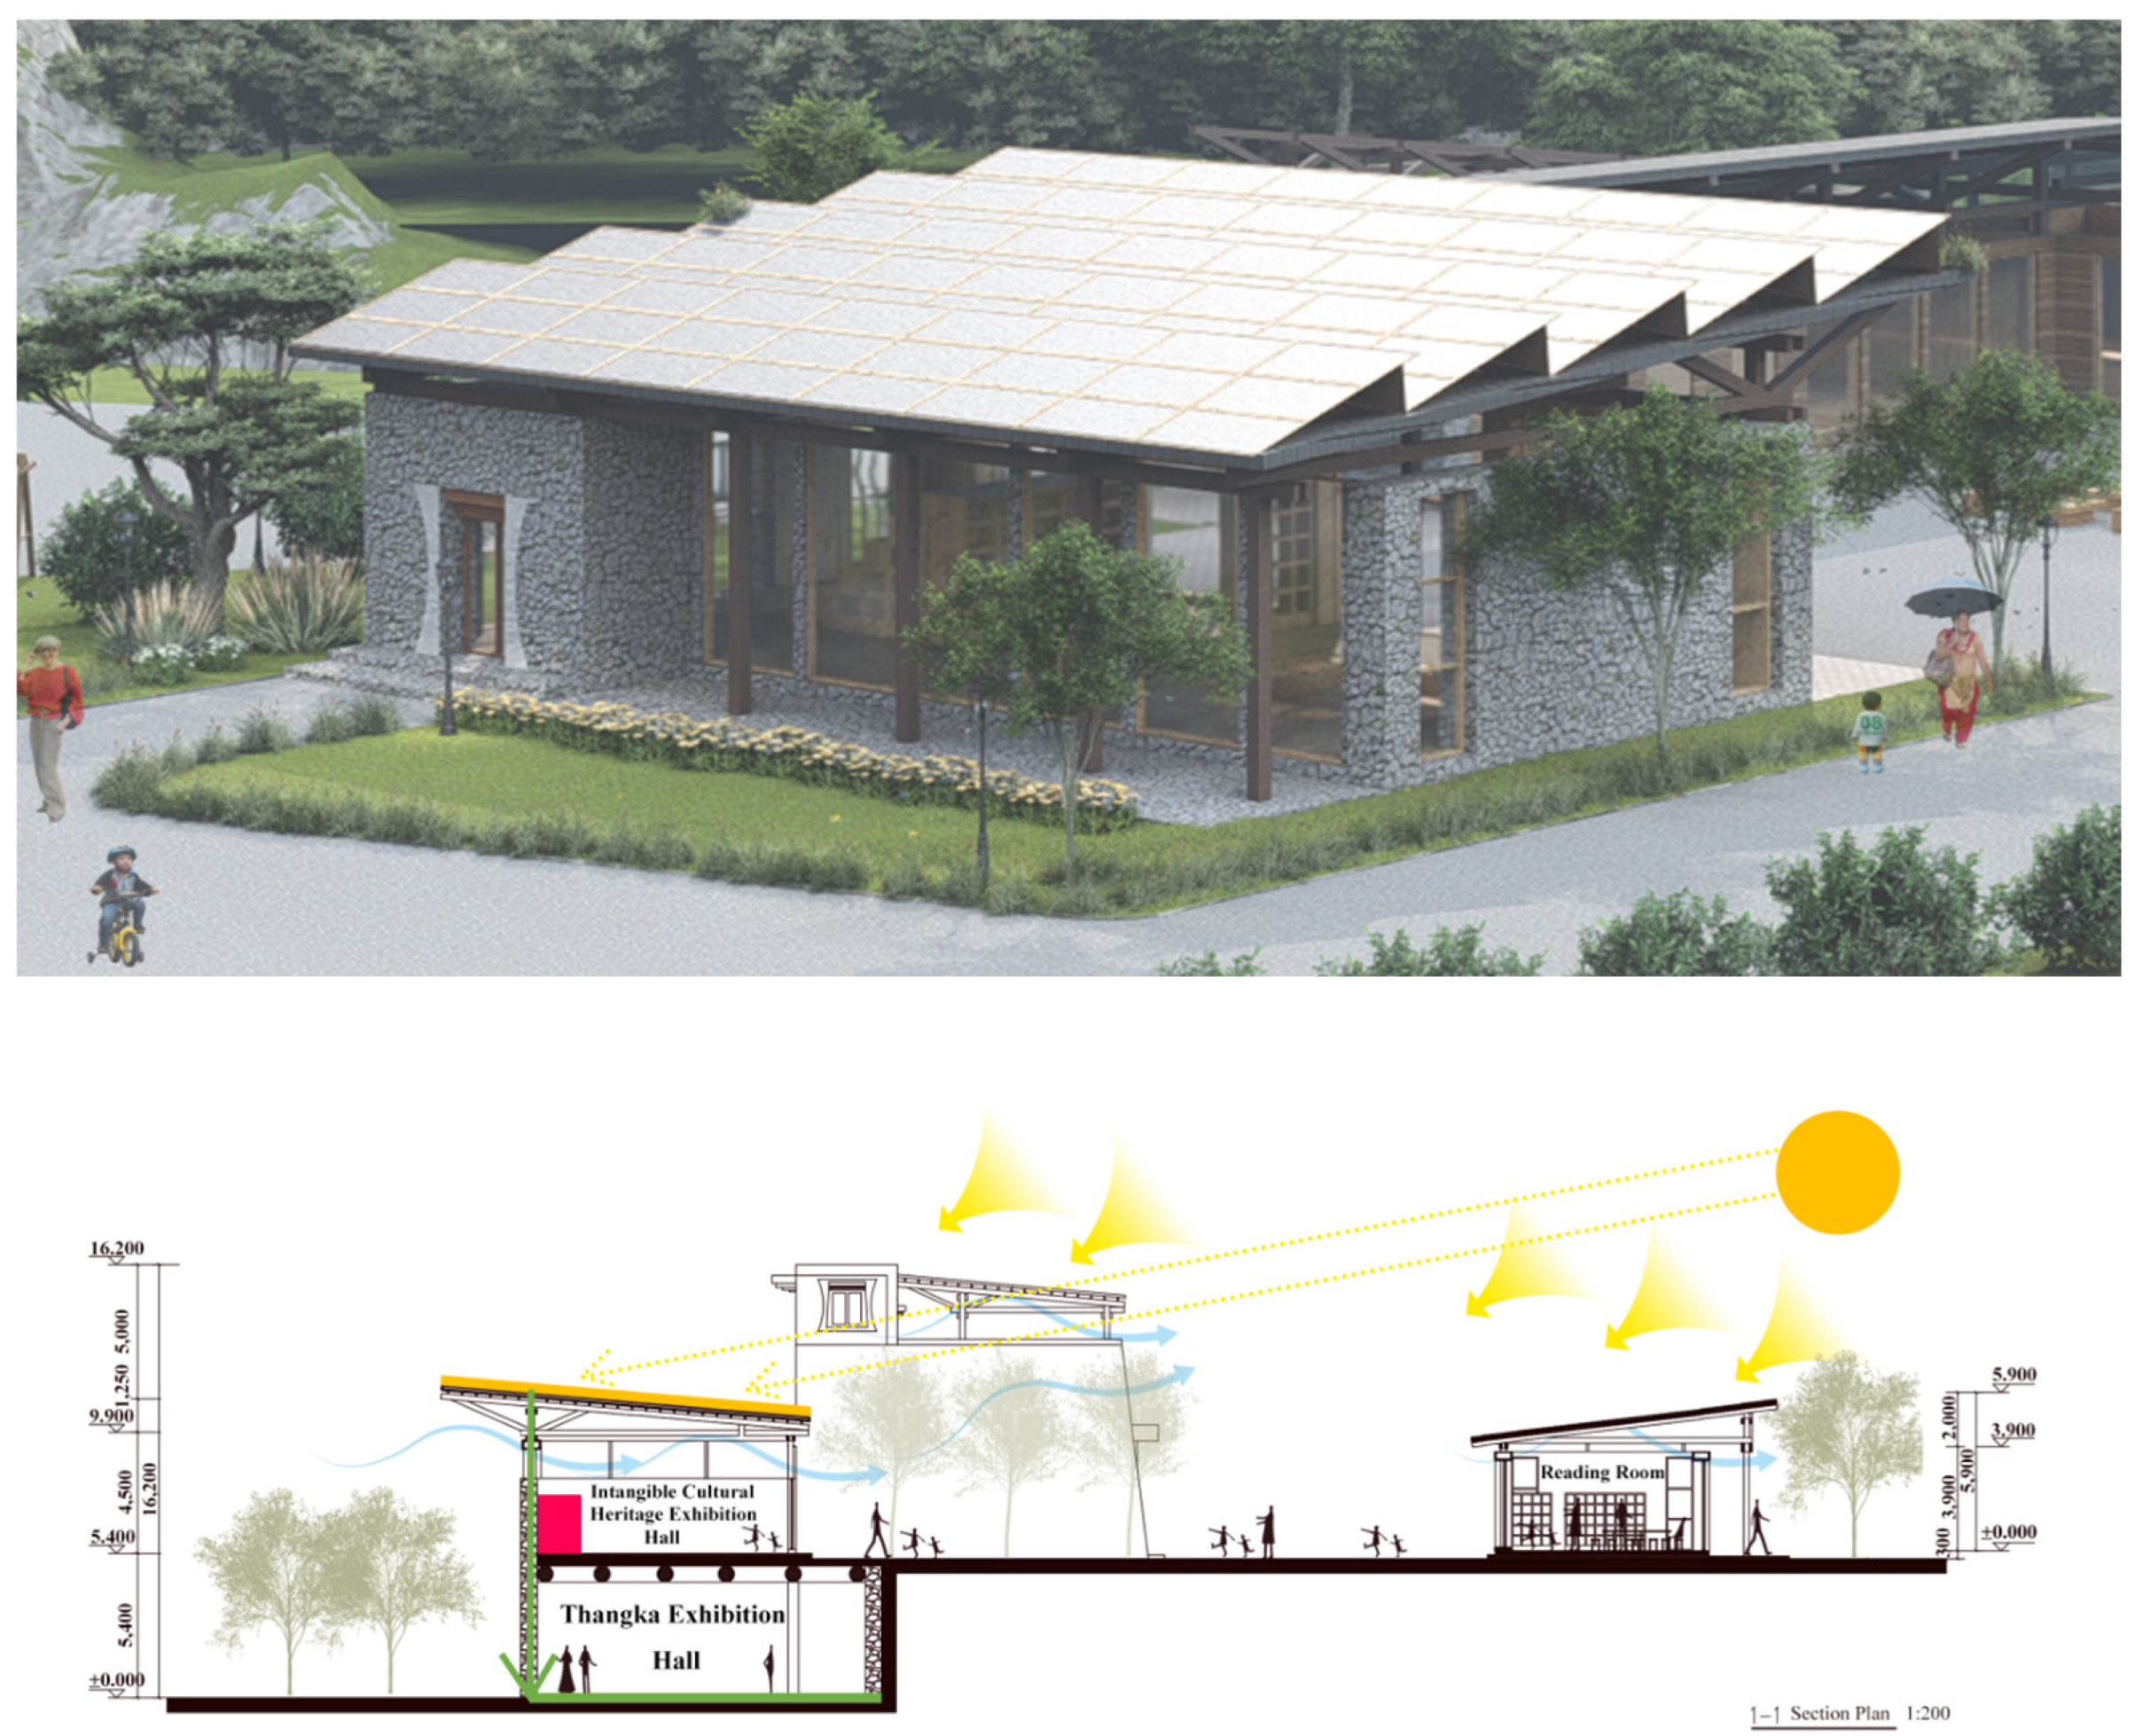
- Installation of solar panels: Due to the ample sunlight conditions in the Malkang area, solar resources are readily available, making it feasible to utilize solar energy in this study. Additionally, as the Thangka exhibition hall is situated below the intangible cultural heritage exhibition hall, to primarily meet the building’s functional requirements, we have positioned the solar panels on the roof of the intangible cultural heritage exhibition hall (highlighted in orange in Figure 5). The relevant heating equipment is arranged inside the intangible cultural heritage exhibition hall (highlighted in red in Figure 5). Heat pipes are embedded in the walls and extend beneath the floor of the Thangka exhibition hall (highlighted in green in Figure 5), allowing for indoor heating from both the walls and the floor, ensuring that the indoor temperature reaches the required level for preserving Thangka and providing human thermal comfort.
- 2
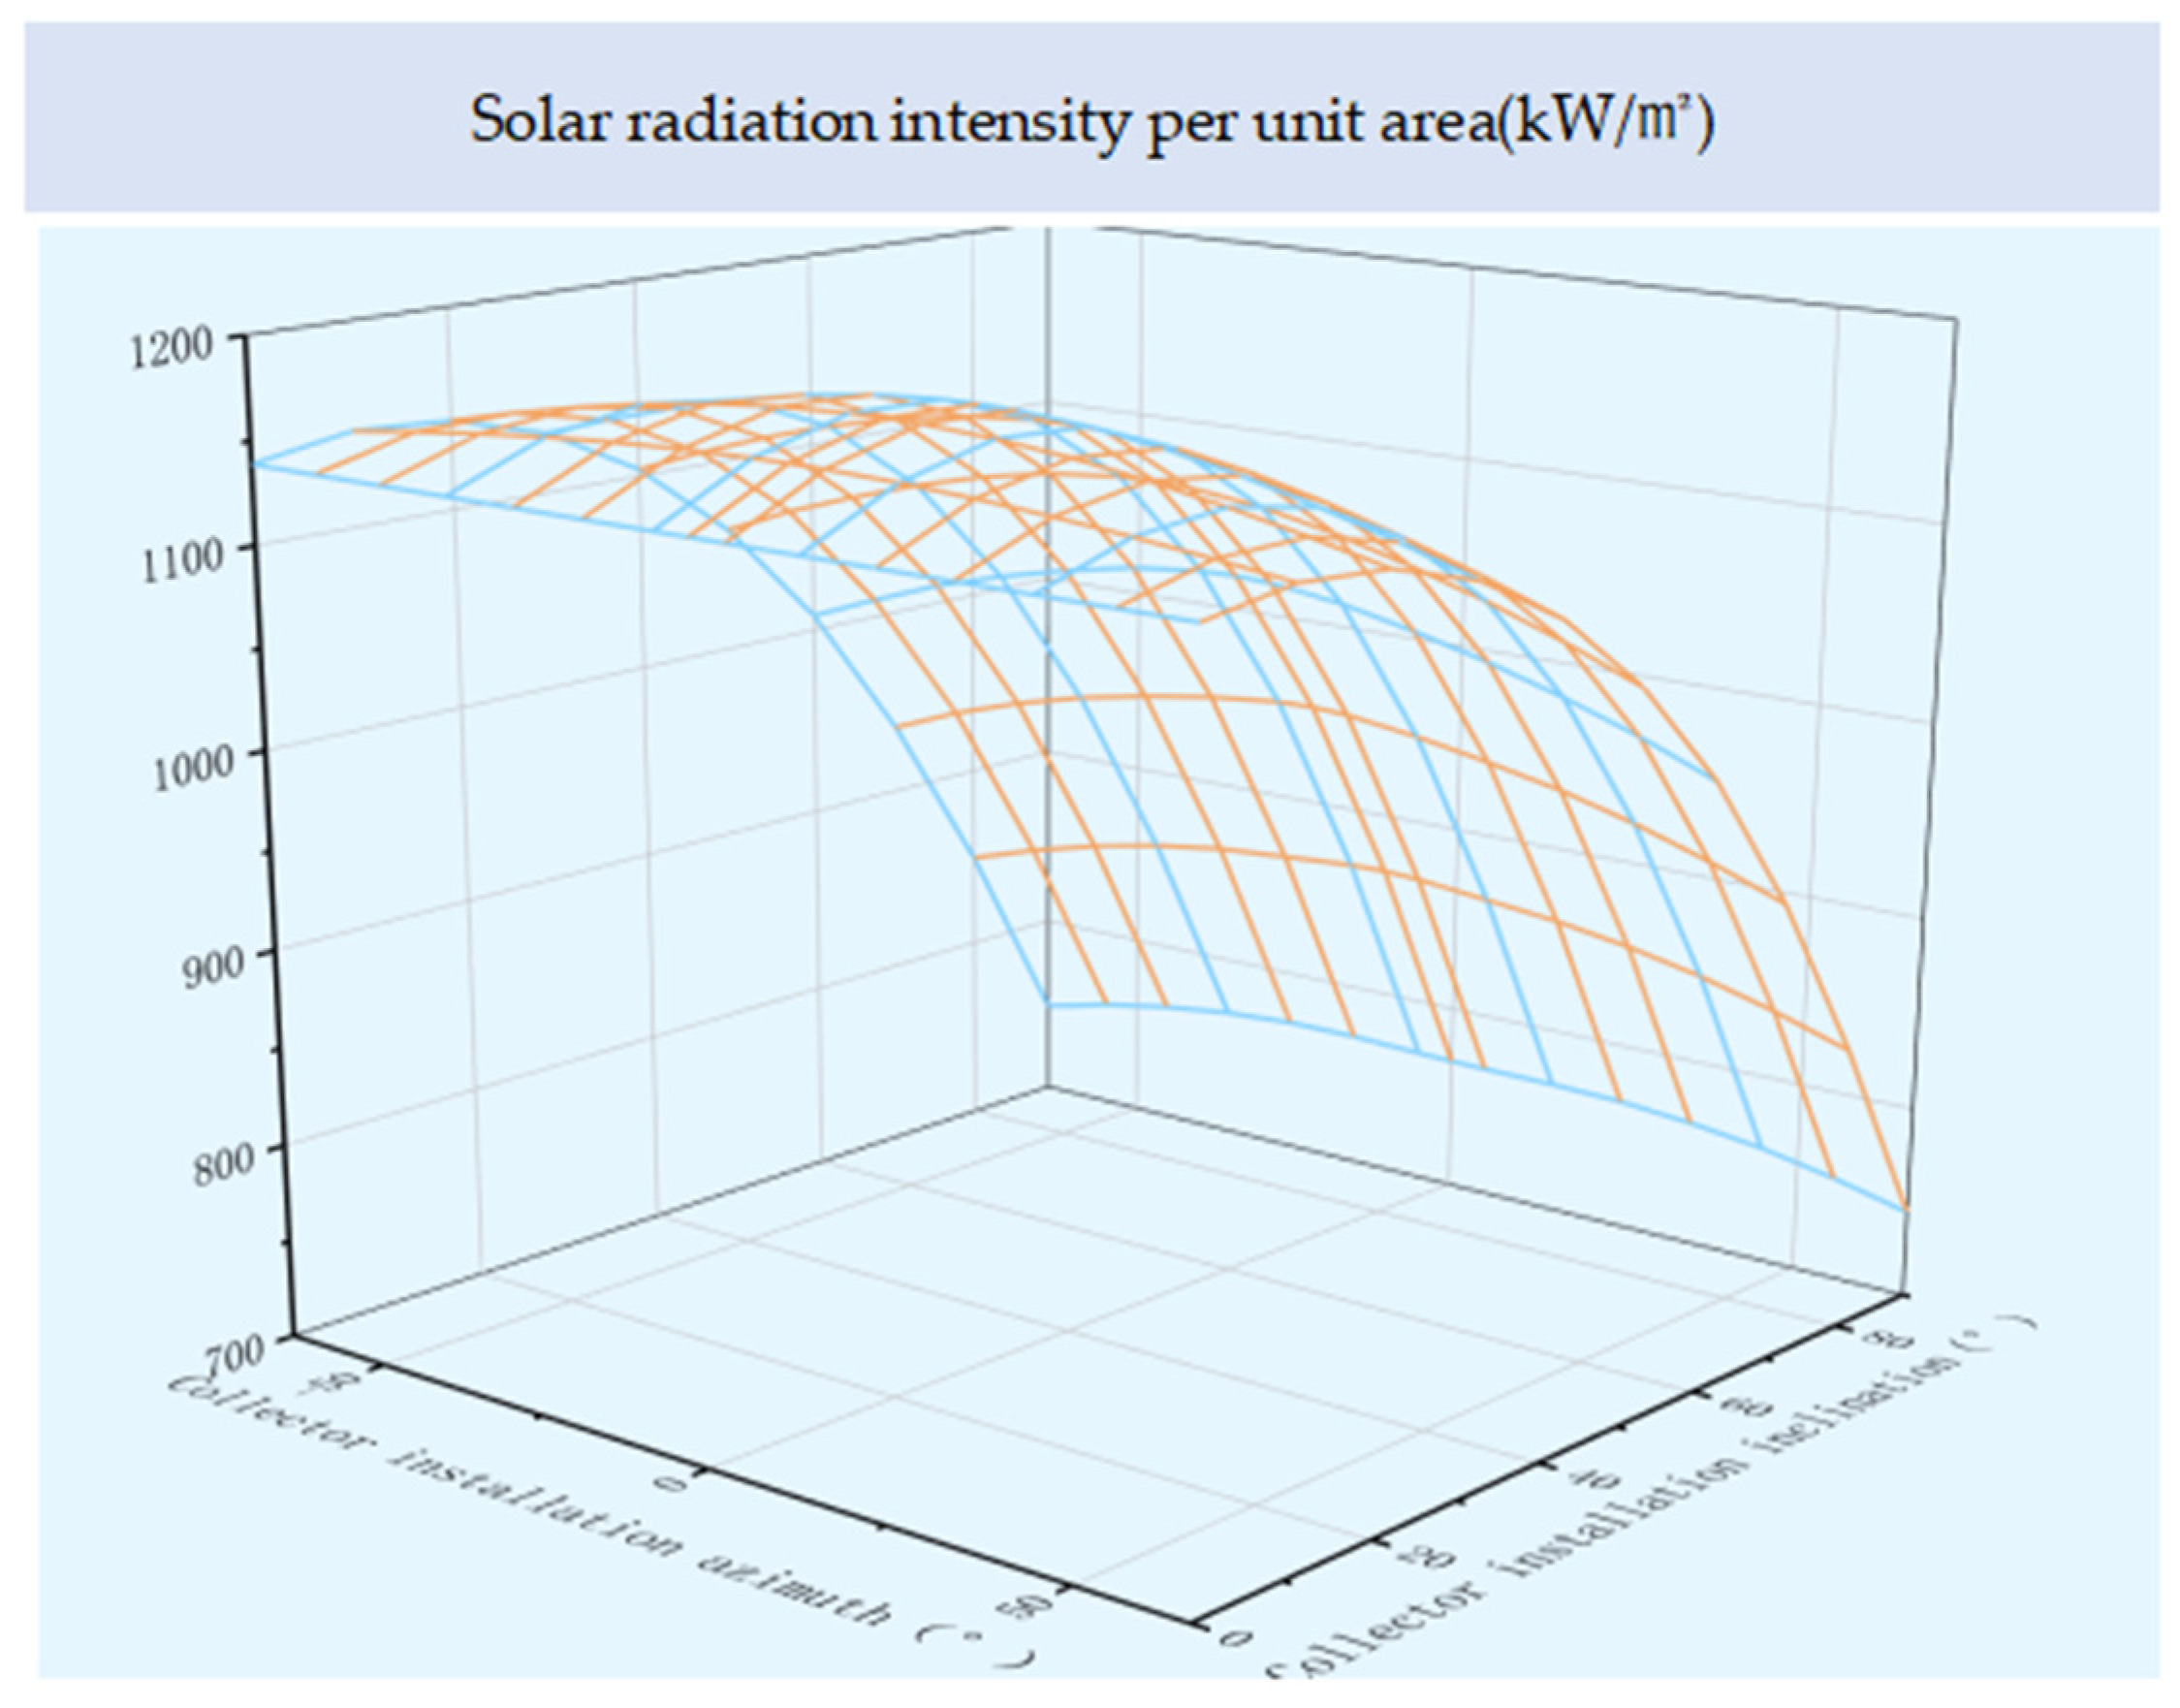
- Optimal mounting angle for solar panels: In this study, we used hourly solar radiation data from the DeST software (h) as a reference. The optimal installation angle of the solar panels was calculated using Formulas (2)–(5) [23], where HT is the total radiation in W/m2; HbT is the direct radiation in W/m2; HdT is the diffuse sky radiation in W/m2; HrT is the ground-reflected radiation in W/m2; HDN is the normal radiation intensity in W/m2; ε is the tilt angle of the solar panel collector; β is the solar azimuth angle; α is the solar altitude angle; A is the orientation angle of the solar panel collector; Hd is the diffuse sky radiation intensity in W/m2; ρ is the ground reflection coefficient; and H is the horizontal total radiation intensity in W/m2. The selected analysis location is Zhibo Village, Songgang Town, Malkang City, Aba Prefecture, Sichuan Province, China, with coordinates at longitude 102.104722 and latitude 31.91474. The selected range of azimuth angles includes −65 to 65, covering directions from east to west. Regarding tilt angles, values from 0 to 90 (representing horizontal to vertical directions) were considered. Using Excel (2016) planning and solving, by exploring different combinations of tilt angles and azimuth angles, we determined the pattern of solar capture in response to changes in installation angles. The angle with a relative loss of 0.0% was determined as the optimal installation tilt angle, along with the optimal azimuth angle. This analysis aims to alleviate the impact of solar panel angles on installation area requirements and thermal economics.
- 3
- Conversion and loss rates of solar panels: This study employs a novel ceramic-aluminum composite solar panel, which is primarily composed of aluminum alloy substrate, flow-collecting pipes, and a nanostructured absorptive coating. The main materials used in its development include black ceramic powder and a corrosion-resistant aluminum alloy. This solar panel exhibits an exceptional thermal conductivity efficiency of 0.98, a collector efficiency of 43.6%, and a sunlight absorption rate of 0.96% on its surface. The conversion efficiency is shown schematically in Figure 6. With its high conversion rate and low loss rate, this solar panel is exceptionally well suited for use in heritage buildings [39].
- 4
- The optimal laying area for solar panels: Formula (6) represents the daily average solar radiation in KJ/m2 for the month with the highest heating demand. Formula (7) is used to calculate the heating energy consumption of the solar panels. In this formula, “E” represents the energy generated by the solar panels; “H” represents the average daily solar radiation in KJ/m2; “H0” indicates the monthly average solar radiation; “S” represents the area covered by the solar panels, measured in square meters (m2); “d” represents the number of days the solar panels operate, measured in days; “η” represents the conversion efficiency of the solar panels, expressed as a percentage (%); and “T” represents the conversion loss rate of the solar panels, also expressed as a percentage (%).
3. Current Situation and Requirements for Thangka Conservation
4. Local Climate Conditions
- 1.
- Geographical position:
- 2.
- Temperature:
- 3.
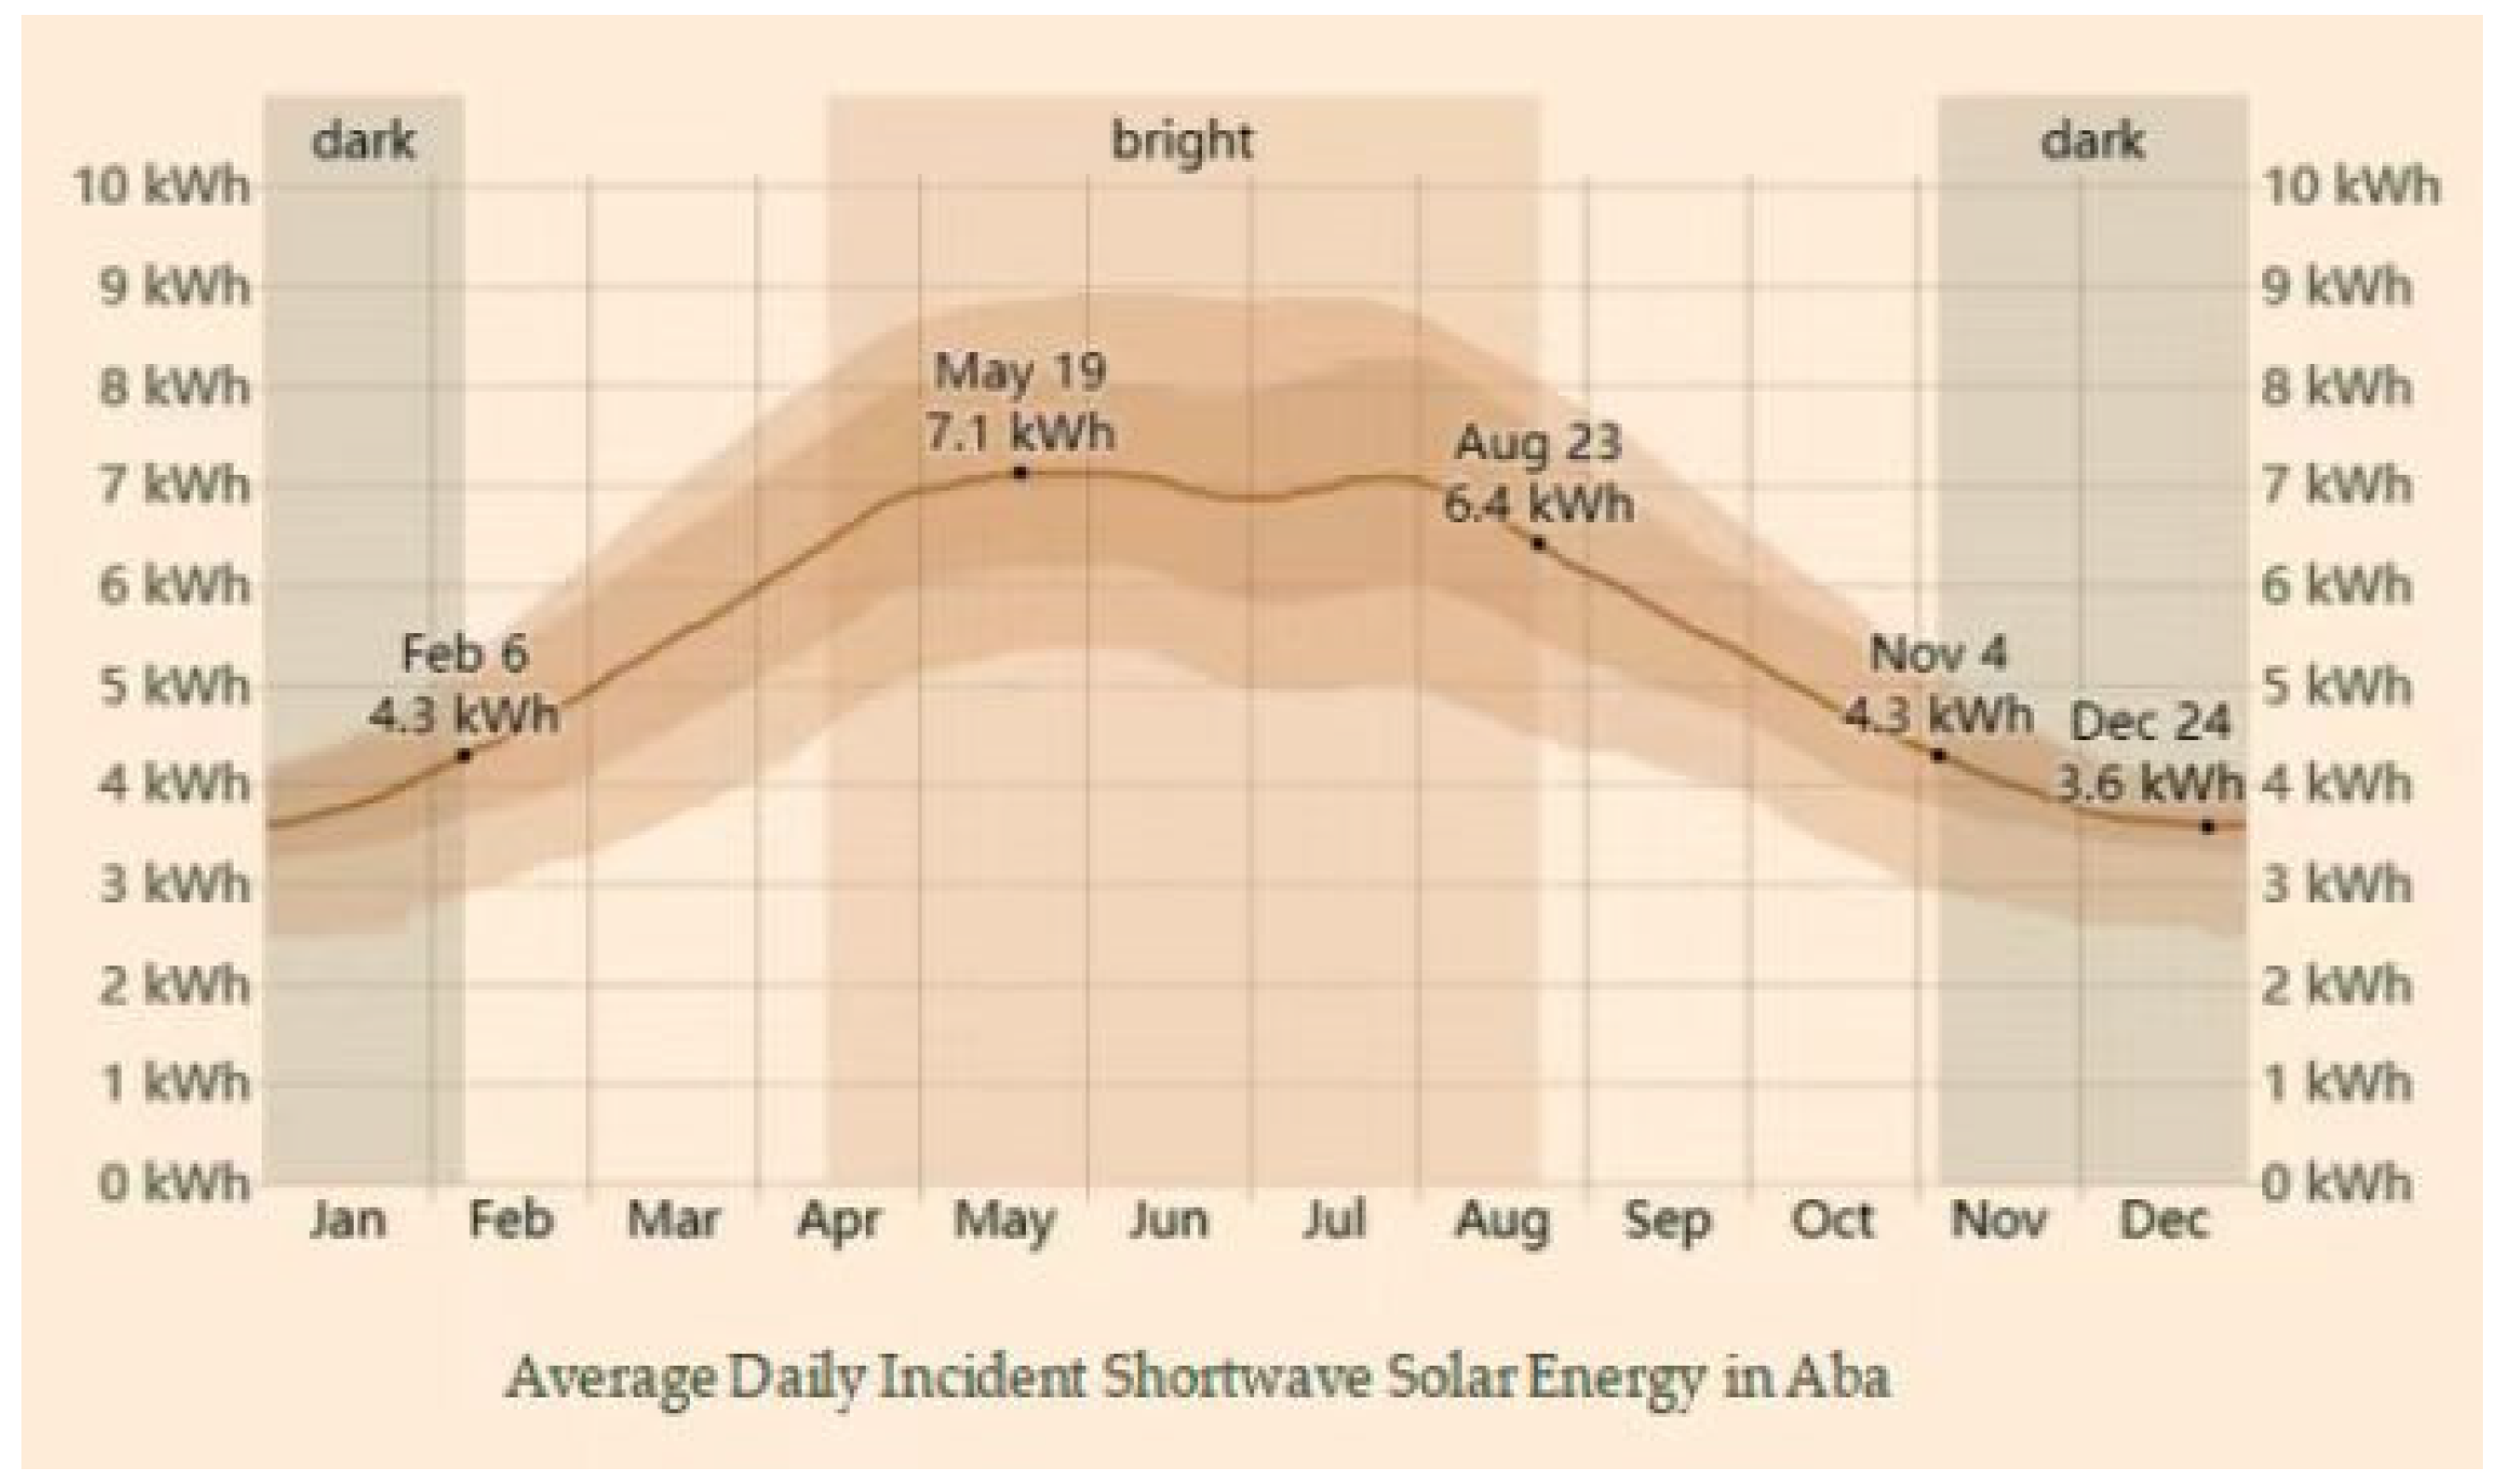
- Solar Energy:
5. Results and Discussion
5.1. Indoor Temperature Optimization
- From October to April each year, the lowest indoor temperature occurs on December 11th, reaching −7 °C. The range for the minimum and maximum comfortable temperatures is between 17.5 °C and 24.5 °C. To meet the Thangka preservation requirements, the temperature needs to be maintained at 16–19 °C.
- In May and September each year, the average indoor temperature is 14 °C, with the minimum and maximum values of thermal comfort temperature being 18 °C and 25 °C, respectively. To meet the Thangka preservation requirements, the temperature needs to be maintained at 16–19 °C.
- In June and August each year, the average indoor temperature is 16 °C, with the minimum and maximum values of thermal comfort temperature being 18.5 °C and 25.5 °C, respectively. To meet the Thangka preservation requirements, the temperature needs to be maintained at 16–19 °C.
- In July each year, the average indoor temperature is 17.5 °C, with the minimum and maximum values of thermal comfort temperature being 19 °C and 26 °C, respectively. To meet the Thangka preservation requirements, the temperature needs to be maintained at 16–19 °C.
- From October to April each year, the indoor temperature should be maintained between 17.5 °C and 19 °C. However, considering the lowest temperature recorded on December 11th, an increase of at least 24.5 °C is required to meet the requirements for protecting the Thangka.
- In May and September each year, the indoor temperature should be controlled at 18–19 °C, requiring an increase of 4–5 °C.
- In June and August each year, the indoor temperature should be controlled at 18.5–19 °C, requiring an increase of 2.5–3 °C.
- In July each year, since the minimum temperature for human thermal comfort is equal to the optimal temperature range for Thangka preservation, the indoor temperature should be controlled at 19 °C, requiring an increase of 2.5 °C.

- From October to April each year, the minimum indoor temperature was −4 °C, and it should be maintained within the range of 16–19 °C. An increase of at least 20 °C required to meet the temperature requirements for preserving Thangka.
- In May and September each year, with an average indoor temperature of 13 °C, the indoor temperature should be controlled within the range of 16–19 °C. Currently, an increase of 3–6 °C is needed.
- In June and August each year, with an average indoor temperature of 15 °C, the indoor temperature should be controlled within 16–19 °C. Currently, an increase of 1–4 °C is required.
- In July each year, with an average indoor temperature of 17 °C, the indoor temperature should be controlled within 16–19 °C. Currently, an increase of 0–2 °C is needed.

5.2. Solar Panel Optimization Mode
- 1
- Optimal installation angle of solar panels:
- 2
- Minimum installation area of the solar panels:
- 3
- Thermal economy:
6. Conclusions
Author Contributions
Funding
Data Availability Statement
Conflicts of Interest
References
- Fei, J.; Han, D.; Ge, J.; Wang, X.; Koh, S.W.; Gao, S.; Sun, Z.; Wan, M.P.; Ng, B.F.; Cai, L. Switchable surface coating for bifunctional passive radiative cooling and solar heating. Adv. Funct. Mater. 2022, 32, 2203582. [Google Scholar] [CrossRef]
- Dai, B.; Li, X.; Xu, T.; Zhang, X. Radiative cooling and solar heating janus films for personal thermal management. ACS Appl. Mater. Interfaces 2022, 14, 18877–18883. [Google Scholar] [CrossRef] [PubMed]
- Pasupathi, M.K.; Alagar, K.; P, M.J.S.; M.M, M.; Aritra, G. Characterization of hybrid-nano/paraffin organic phase change material for thermal energy storage applications in solar thermal systems. Energies 2020, 13, 5079. [Google Scholar] [CrossRef]
- Ansu, A.K.; Sharma, R.; Hagos, F.; Tripathi, D.; Tyagi, V. Improved thermal energy storage behavior of polyethylene glycol-based NEOPCM containing aluminum oxide nanoparticles for solar thermal applications. J. Therm. Anal. Calorim. 2021, 143, 1881–1892. [Google Scholar] [CrossRef]
- Zheng, Z.; Chang, Z.; Xu, G.-K.; McBride, F.; Ho, A.; Zhuola, Z.; Michailidis, M.; Li, W.; Raval, R.; Akhtar, R. Microencapsulated phase change materials in solar-thermal conversion systems: Understanding geometry-dependent heating efficiency and system reliability. ACS Nano 2017, 11, 721–729. [Google Scholar] [CrossRef] [PubMed]
- Tyagi, V.; Chopra, K.; Kalidasan, B.; Chauhan, A.; Stritih, U.; Anand, S.; Pandey, A.; Sarı, A.; Kothari, R. Phase change material based advance solar thermal energy storage systems for building heating and cooling applications: A prospective research approach. Sustain. Energy Technol. Assess. 2021, 47, 101318. [Google Scholar] [CrossRef]
- Li, X.; Sun, B.; Sui, C.; Nandi, A.; Fang, H.; Peng, Y.; Tan, G.; Hsu, P.-C. Integration of daytime radiative cooling and solar heating for year-round energy saving in buildings. Nat. Commun. 2020, 11, 6101. [Google Scholar] [CrossRef] [PubMed]
- Hassan, H.; Abo-Elfadl, S.; El-Dosoky, M. An experimental investigation of the performance of new design of solar air heater (tubular). Renew. Energy 2020, 151, 1055–1066. [Google Scholar] [CrossRef]
- Vengadesan, E.; Senthil, R. A review on recent development of thermal performance enhancement methods of flat plate solar water heater. Solar Energy 2020, 206, 935–961. [Google Scholar] [CrossRef]
- Munusamy, A.; Barik, D.; Sharma, P.; Medhi, B.J.; Bora, B.J. Performance analysis of parabolic type solar water heater by using copper-dimpled tube with aluminum coating. Environ. Sci. Pollut. Res. 2023, 1–16. [Google Scholar] [CrossRef]
- Khimsuriya, Y.D.; Patel, D.; Said, Z.; Panchal, H.; Jaber, M.M.; Natrayan, L.; Patel, V.; El-Shafay, A. Artificially roughened solar air heating technology—A comprehensive review. Appl. Therm. Eng. 2022, 214, 118817. [Google Scholar] [CrossRef]
- Kumar, P.G.; Balaji, K.; Sakthivadivel, D.; Vigneswaran, V.; Velraj, R.; Kim, S.C. Enhancement of heat transfer in a combined solar air heating and water heater system. Energy 2021, 221, 119805. [Google Scholar] [CrossRef]
- Mayer, M.J.; Szilágyi, A.; Gróf, G. Environmental and economic multi-objective optimization of a household level hybrid renewable energy system by genetic algorithm. Appl. Energy 2020, 269, 115058. [Google Scholar] [CrossRef]
- Zhang, Z.-Y.; He, Y.; Wang, Z.; Xu, J.; Xie, M.; Tao, P.; Ji, D.; Moth-Poulsen, K.; Li, T. Photochemical phase transitions enable coharvesting of photon energy and ambient heat for energetic molecular solar thermal batteries that upgrade thermal energy. J. Am. Chem. Soc. 2020, 142, 12256–12264. [Google Scholar] [CrossRef]
- Abokersh, M.H.; Gangwar, S.; Spiekman, M.; Valles, M.; Jiménez, L.; Boer, D. Sustainability insights on emerging solar district heating technologies to boost the nearly zero energy building concept. Renew. Energy 2021, 180, 893–913. [Google Scholar] [CrossRef]
- Dehghan, M.; Pfeiffer, C.F.; Rakhshani, E.; Bakhshi-Jafarabadi, R. A review on techno-economic assessment of solar water heating systems in the middle east. Energies 2021, 14, 4944. [Google Scholar] [CrossRef]
- Koçak, B.; Fernandez, A.I.; Paksoy, H. Review on sensible thermal energy storage for industrial solar applications and sustainability aspects. Solar Energy 2020, 209, 135–169. [Google Scholar] [CrossRef]
- Abokersh, M.H.; Valles, M.; Saikia, K.; Cabeza, L.F.; Boer, D. Techno-economic analysis of control strategies for heat pumps integrated into solar district heating systems. J. Energy Storage 2021, 42, 103011. [Google Scholar] [CrossRef]
- Hosseini, S.M.; Carli, R.; Dotoli, M. Robust Optimal Demand Response of Energy-efficient Commercial Buildings. In Proceedings of the 2022 European Control Conference (ECC), London, UK, 12–15 July 2022; pp. 1–6. [Google Scholar]
- Arteconi, A.; Ciarrocchi, E.; Pan, Q.; Carducci, F.; Comodi, G.; Polonara, F.; Wang, R. Thermal energy storage coupled with PV panels for demand side management of industrial building cooling loads. Appl. Energy 2017, 185, 1984–1993. [Google Scholar] [CrossRef]
- Li, W.-T.; Tushar, W.; Yuen, C.; Ng, B.K.K.; Tai, S.; Chew, K.T. Energy efficiency improvement of solar water heating systems–An IoT based commissioning methodology. Energy Build. 2020, 224, 110231. [Google Scholar] [CrossRef]
- Kalbasi, R.; Jahangiri, M.; Mosavi, A.; Dehshiri, S.J.H.; Dehshiri, S.S.H.; Ebrahimi, S.; Etezadi, Z.A.-S.; Karimipour, A. Finding the best station in Belgium to use residential-scale solar heating, one-year dynamic simulation with considering all system losses: Economic analysis of using ETSW. Sustain. Energy Technol. Assess. 2021, 45, 101097. [Google Scholar] [CrossRef]
- Han, W.; Han, M.; Zhang, M.; Zhao, Y.; Xie, K.; Zhang, Y. Historic Building Renovation with Solar System towards Zero-Energy Consumption: Feasibility Analysis and Case Optimization Practice in China. Sustainability 2024, 16, 1298. [Google Scholar] [CrossRef]
- Siraki, A.G.; Pillay, P. Study of optimum tilt angles for solar panels in different latitudes for urban applications. Solar Energy 2012, 86, 1920–1928. [Google Scholar] [CrossRef]
- Sharma, M.K.; Kumar, D.; Dhundhara, S.; Gaur, D.; Verma, Y.P. Optimal tilt angle determination for PV panels using real time data acquisition. Glob. Chall. 2020, 4, 1900109. [Google Scholar] [CrossRef] [PubMed]
- Schuster, C.S. The quest for the optimum angular-tilt of terrestrial solar panels or their angle-resolved annual insolation. Renew. Energy 2020, 152, 1186–1191. [Google Scholar] [CrossRef]
- Zhong, Q.; Tong, D. Spatial layout optimization for solar photovoltaic (PV) panel installation. Renew. Energy 2020, 150, 1–11. [Google Scholar] [CrossRef]
- Gardashov, R.; Eminov, M.; Kara, G.; Kara, E.G.E.; Mammadov, T.; Huseynova, X. The optimum daily direction of solar panels in the highlands, derived by an analytical method. Renew. Sustain. Energy Rev. 2020, 120, 109668. [Google Scholar] [CrossRef]
- Meng, X.; Feng, R.; Yang, Y. Research status and development trend of solar heating technology. IOP Conf. Ser. Earth Environ. Sci. 2019, 300, 042081. [Google Scholar] [CrossRef]
- Li, Z.; Wang, W. Study of image features between carved Thangka and embroidered Thangka. J. Comput. Methods Sci. Eng. 2021, 21, 367–381. [Google Scholar] [CrossRef]
- Feng, F. Research on the Protection System of Thangka Intangible Cultural Heritage Based on VR Technology. Acad. J. Sci. Technol. 2023, 7, 178–182. [Google Scholar] [CrossRef]
- Zhao, Y.; Zhou, L.; Liu, Z. Bibliometric Analysis of the Research Status of Thangka Images at Home and Abroad. J. Phys. Conf. Ser. 2020, 1634, 012108. [Google Scholar] [CrossRef]
- Zhu, J. Research on the Conservation of Thangka. In Proceedings of the Second Academic Annual Conference of the Chinese Association for Cultural Heritage Conservation Technology, Xi’an, China, 1 July 2002. [Google Scholar]
- Du, H.; Bai, Y. Research on the Cleaning of Ancient Thangka. In Proceedings of the Fourth Academic Annual Conference of the Chinese Association for Cultural Heritage Conservation Technology, Jingzhou, China, 7–11 November 2005; Science Press: Beijing, China, 2005; pp. 298–301. [Google Scholar]
- Liu, H.; Tang, S.; Xie, H. Research on Thangka Image Restoration Technology Based on Sample Blocks. Fujian Comput. 2007, 15–16. [Google Scholar] [CrossRef]
- JGJ66-2015; Code for Museum Building Design. MOHURD: Beijing, China, 2015.
- GB 50176-2016; Code for Thermal Design of Civil Buildings. MOHURD: Beijing, China, 2017.
- Za, S. A Brief Discussion on the Influence of Temperature, Humidity, and Environment on Thangka Preservation. Sci. Wealth 2019, 12. Available online: https://www.fx361.cc/page/2019/1021/8186609.shtml (accessed on 30 March 2024).
- Xiu, D.; Zhang, X.; Xu, J.; Zhou, G.; Jiang, X.; Zhang, S.; Wang, J.; Hong, S. A novel porcelain-aluminum composite solar plate. Shandong Sci. 2021, 34, 68–76. [Google Scholar]
- Tan, B. Storage Management of Thangka Cultural Relics. Tibet. Sci. Technol. 2008, 6, 15–17. [Google Scholar]


| Category | Detail |
|---|---|
| Exhibition hall area | 240.648 square meters |
| Storage room area | 43.4 square meters |
| Building height | 5.2m |
| Building orientation | East–west orientation |
| Heating period | 24 months |
| Angle of dip of roof | 20° |
| Door and window opening method | Half-open |
| (a) Building structural materials | ||||||
| Architectural Parts | Structural Measures | |||||
| Wall construction | Cement mortar, lime mortar, reinforced concrete, extruded polystyrene foam (with skin) | |||||
| Flooring | Cement mortar, reinforced concrete | |||||
| Roofing | Cement mortar, lime mortar, reinforced concrete, gravel, concrete with pebbles (ρ = 2300), extruded polystyrene foam (with skin), aerated concrete, foam concrete (ρ = 700). | |||||
| Doors | Single-layer solid wood | |||||
| Windows | 12A steel–aluminum single-frame double glazing window (average). | |||||
| (b) Nature of materials | ||||||
| Material Name | Thermal Conductivity Coefficient λ | Heat Storage Coefficient S | Density ρ | Specific Heat Capacity Cp | Vapor Permeability Coefficient u | Solar Heat gain Coefficient |
| W/(m·K) | W/(m2·K) | kg/m3 | J/(kg·K) | g/(m·h·kPa) | ||
| Cement mortar | 0.930 | 11.370 | 1800.0 | 1050.0 | 0.0210 | |
| Lime mortar | 0.810 | 10.070 | 1600.0 | 1050.0 | 0.0443 | |
| Steel-reinforced concrete | 1.740 | 17.200 | 2500.0 | 920.0 | 0.0158 | |
| Gravel stone and pebble concrete (ρ = 2300) | 1.510 | 15.360 | 2300.0 | 920.0 | 0.0173 | |
| Extruded polystyrene foam plastic (with skin) | 0.030 | 0.340 | 35.0 | 1380.0 | 0.0000 | |
| Aerated concrete, foam concrete (ρ = 700) | 0.180 | 3.100 | 700.0 | 1050.0 | 0.0998 | |
| Porous concrete brick (190 six-hole brick) | 0.750 | 7.490 | 1450.0 | 709.4 | 0.0000 | |
| 12A steel–aluminum single-frame double-glazed window (average) | 3.900 | 0.652 | ||||
| Wooden | 4.700 | 0.566 | ||||
Disclaimer/Publisher’s Note: The statements, opinions and data contained in all publications are solely those of the individual author(s) and contributor(s) and not of MDPI and/or the editor(s). MDPI and/or the editor(s) disclaim responsibility for any injury to people or property resulting from any ideas, methods, instructions or products referred to in the content. |
© 2024 by the authors. Licensee MDPI, Basel, Switzerland. This article is an open access article distributed under the terms and conditions of the Creative Commons Attribution (CC BY) license (https://creativecommons.org/licenses/by/4.0/).
Share and Cite
Han, W.; Bai, Y.; Du, M.; Tao, Y.; Zhang, Y.; Yang, Q. Optimizing Solar Heating for Thangka Exhibition Halls: A Case Study in Malkang Cultural Village. Energies 2024, 17, 2091. https://doi.org/10.3390/en17092091
Han W, Bai Y, Du M, Tao Y, Zhang Y, Yang Q. Optimizing Solar Heating for Thangka Exhibition Halls: A Case Study in Malkang Cultural Village. Energies. 2024; 17(9):2091. https://doi.org/10.3390/en17092091
Chicago/Turabian StyleHan, Wenyang, Yan Bai, Miao Du, Yujie Tao, Yin Zhang, and Qianru Yang. 2024. "Optimizing Solar Heating for Thangka Exhibition Halls: A Case Study in Malkang Cultural Village" Energies 17, no. 9: 2091. https://doi.org/10.3390/en17092091