Article

Assessing the Potential of Teff Husk for Biochar Production through Slow Pyrolysis: Effect of Pyrolysis Temperature on Biochar Yield

1
Department of Technologies and Installations for Waste Management, Faculty of Energy and Environmental Engineering, Silesian University of Technology, 44-100 Gliwice, Poland
2
Faculty of Mechanical Engineering, Jimma Institute of Technology, Jimma University, Jimma P.O. Box 378, Ethiopia
3
Department of Physical Chemistry and Technology of Polymers, Faculty of Chemistry, Silesian University of Technology, Marcina Strzody 9, 44-100 Gliwice, Poland
4
Department of Power Engineering, TUM School of Engineering and Design, Technical University of Munich, Boltzmannstrasse 15, 85748 Garching bei München, Germany
*
Author to whom correspondence should be addressed.
Energies 2024, 17(9), 1988; https://doi.org/10.3390/en17091988
Submission received: 8 March 2024 / Revised: 14 April 2024 / Accepted: 16 April 2024 / Published: 23 April 2024
(This article belongs to the Section A4: Bio-Energy)

Abstract

:
Environmental restoration and sustainable energy solutions require effective management and utilization of agricultural crop residues to reduce greenhouse gas emissions. Biowastes are a valuable resource that can be converted into biofuels and their byproducts, solving the energy crisis and reducing environmental impact. In this study, teff husk, primarily generated in Ethiopia during the production of teff within the agro-industrial sector, is used as a feedstock for slow pyrolysis. Ethiopia generates an estimated annual production of over 1.75 million tons of teff husk, a significant portion of which is incinerated, resulting in significant pollution of the environment. This study focuses on assessing teff husk as a potential material for slow pyrolysis, a crucial stage in biochar production, to tap into its biochar-producing potential. To identify the composition of biomass, the teff husk underwent an initial analysis using thermogravimetry. The significant presence of fixed carbon indicates that teff husk is a viable candidate for pyrolytic conversion into biochar particles. The process of slow pyrolysis took place at three temperatures—specifically, 400, 450, and 500 °C. The maximum biochar yield was achieved by optimizing slow pyrolysis parameters including reaction time, temperature, and heating rate. The optimized reaction time, temperature, and heating rate of 120 min, 400 °C, and 4.2 °C/min, respectively, resulted in the highest biochar yield of 43.4 wt.%. Furthermore, biochar’s physicochemical, SEM-EDX, FTIR, and TGA characterization were performed. As the temperature of biochar increases, its carbon content and thermal stability increases as well. Unlike fuel recovery, the results suggest that teff-husk can be used as a feedstock for biochar production.

1. Introduction

Globally, significant quantities of agricultural byproducts are produced, frequently needing more appropriate means of disposal, reuse or recycling [1]. In Ethiopia, a significant amount of agricultural residues are produced every year, commonly utilized in the animal feed industry and/or in composting [2,3]. Proper disposal and reuse of these wastes are crucial for environmental well-being [4,5]. Efficient recovery not only contributes to global sustainability but also enhances profitability in both industrial and agricultural sectors, aligning with the circular economy concept. The literature indicated that Ethiopia has a bio-energy potential of approximately 750 PJ per year, disseminated among several sources. Agricultural residues make up approximately 34% of this potential, livestock waste contribute around 19%, and forest residues account for about 47% [6]. As the leading producer of agricultural residues in East Africa, Ethiopia generates an estimated residual amount of teff husk as high as 1.75 million tons [3,7]. For a long time, they have mainly been disposed of in landfill, composting, and used in incineration for energy generation. In the past, the most common methods for disposing of agricultural residues were landfills, composting, and incineration for energy generation. Rural households predominantly use agricultural waste for baking and cooking, typically using inefficient cooking stoves with low energy efficiency [8], which is not only a waste of resources but also contributes to air pollution and poses a threat to human health [9,10].
The circular economy concept emphasizes the importance of utilizing agricultural residues to create value-added materials that benefit the environment [11].
One example of such a material is biochar, which is a solid byproduct produced by the pyrolysis of lignocellulosic biomass [12]. Pyrolysis is a popular technology used for managing waste, which sets itself apart by being able to generate gaseous, liquid, and biochar products [13]. This thermochemical process decomposes biomass in the absence of oxygen to produce biochar [14,15]. According to research reported elsewhere, the temperature range for slow pyrolysis of biomass is typically between 300 and 800 °C [16,17,18], but recent studies suggest that it can range from 300 to 950 °C [19]. Pyrolysis is a complex process that involves various chemical reactions that occur instantaneously [20].
Biochar is a type of porous and carbon-rich material that is created through biomass pyrolysis in oxygen-limited conditions [21,22]. This material has a lot of potential uses, including enhancing agricultural processes, managing waste effectively, supporting catalysts, generating clean energy, mitigating climate change, and improving soil quality [23,24,25]. In most systems that currently burn pulverized coal, biochar is also a solid that can be burned to produce heat (~18 MJ/kg) [26].
Teff husk, one of the prominent agricultural residues in Ethiopia, has not been studied for its conversion into biofuels, particularly biochar. In this study, teff husk (see Figure 1), was subjected to slow pyrolysis at 400, 450 and 500 °C under a pressure of 1 atm and with a heating rate of 4.2 °C per minute, resulting in the production of biochar.
Subsequently, these biochars were compared in terms of their thermal stability, chemical composition, and microstructures at different pyrolysis temperatures. The motivation to investigate these agricultural residues is related to environmental impacts linked to their cultivation and soil degradation in Ethiopia. In addition to offering a solution for waste management, achieving the conversion of waste to biochar could also be beneficial for improving soil quality. However, the biochar’s yield and quality depend on factors like the pyrolysis process, feedstock types, and operational conditions. The primary objective of this study is to assess the potential of teff husk for biochar production and to analyze the influence of process parameters on the characteristics of the resulting biochar. The findings of this study will serve as a foundation for future research on using biochar to improve soil quality.

2. Materials and Experimental Methodology

2.1. Collection and Preparation of Feedstock

In this research, teff husk was selected as the feedstock. This particular agricultural residue was selected because of Ethiopia’s high demand for eragrostis teff compared to other crops for food security. The teff husk was collected from flour mills located in the cities of Adama and Jimma, Ethiopia. After collection, the samples were parted from the teff grain, washed thoroughly, and left to air-dry for 72 h. Following this, the samples were ground to a particle size of less than 0.5 mm.

2.2. Physicochemical Properties of Teff Husk and Its Product

A detailed physical analysis of the sample was conducted according to ASTM International standards E872-82, E1756-01, and E1755-01 [27]. Fixed carbon content (FC) was determined by subtracting the total moisture content (MC), ash content (AC), and volatile matter (VM) from 100%, as outlined in Equation (1).
FC (wt.%) = 100 − (MC wt.% + AC wt.% + VM wt.%)
The content of chlorine in the biochar obtained after the extraction process with nitric acid (V) was analyzed through the Mohr method. In an oxidizing atmosphere, a sample of known mass in direct contact with the Eschka mixture was burned to remove the combustible ingredient and convert the chlorine to alkali chlorides. To calculate the amount of chlorine in checked waste samples, the formula presented below was used:
W c l = 3.545 c V 2 V 1 m
where:
  • c—the concentration of the AgNO3 (V) solutions, (mol/dm3).
  • V 2 —represents the volume of the AgNO3 (V) solution utilized in the determination process in, [cm3].
  • V 1 —the volume of the AgNO3 (V) solution utilized to determine the blank sample, [cm3].
  • m—mass of titrated sample, [g].
The weight percentages of carbon (C), hydrogen (H), nitrogen (N), and sulfur (S) present in the feedstock and biochar were directly determined using an elemental analyzer, specifically the Perkin Elmer 2400 manufactured by PerkinElmer, Inc. and manufactured in Waltham, MA, USA. However, the oxygen content was calculated by using Equation (3):
O (%) = 100 − (%H + %C + %Cl + %S + %N)
Ground teff husk samples, weighing around 0.5–0.6 g, were analyzed to determine their higher heating values (HHV) using a commercial Parr 6200 Isoperibol bomb calorimeter from Parr Instrument Company in Moline, IL, USA. The tests were conducted according to the ASTM D 2015 standard test method [28], and each sample was analyzed at least three times to ensure the reproducibility of the data.

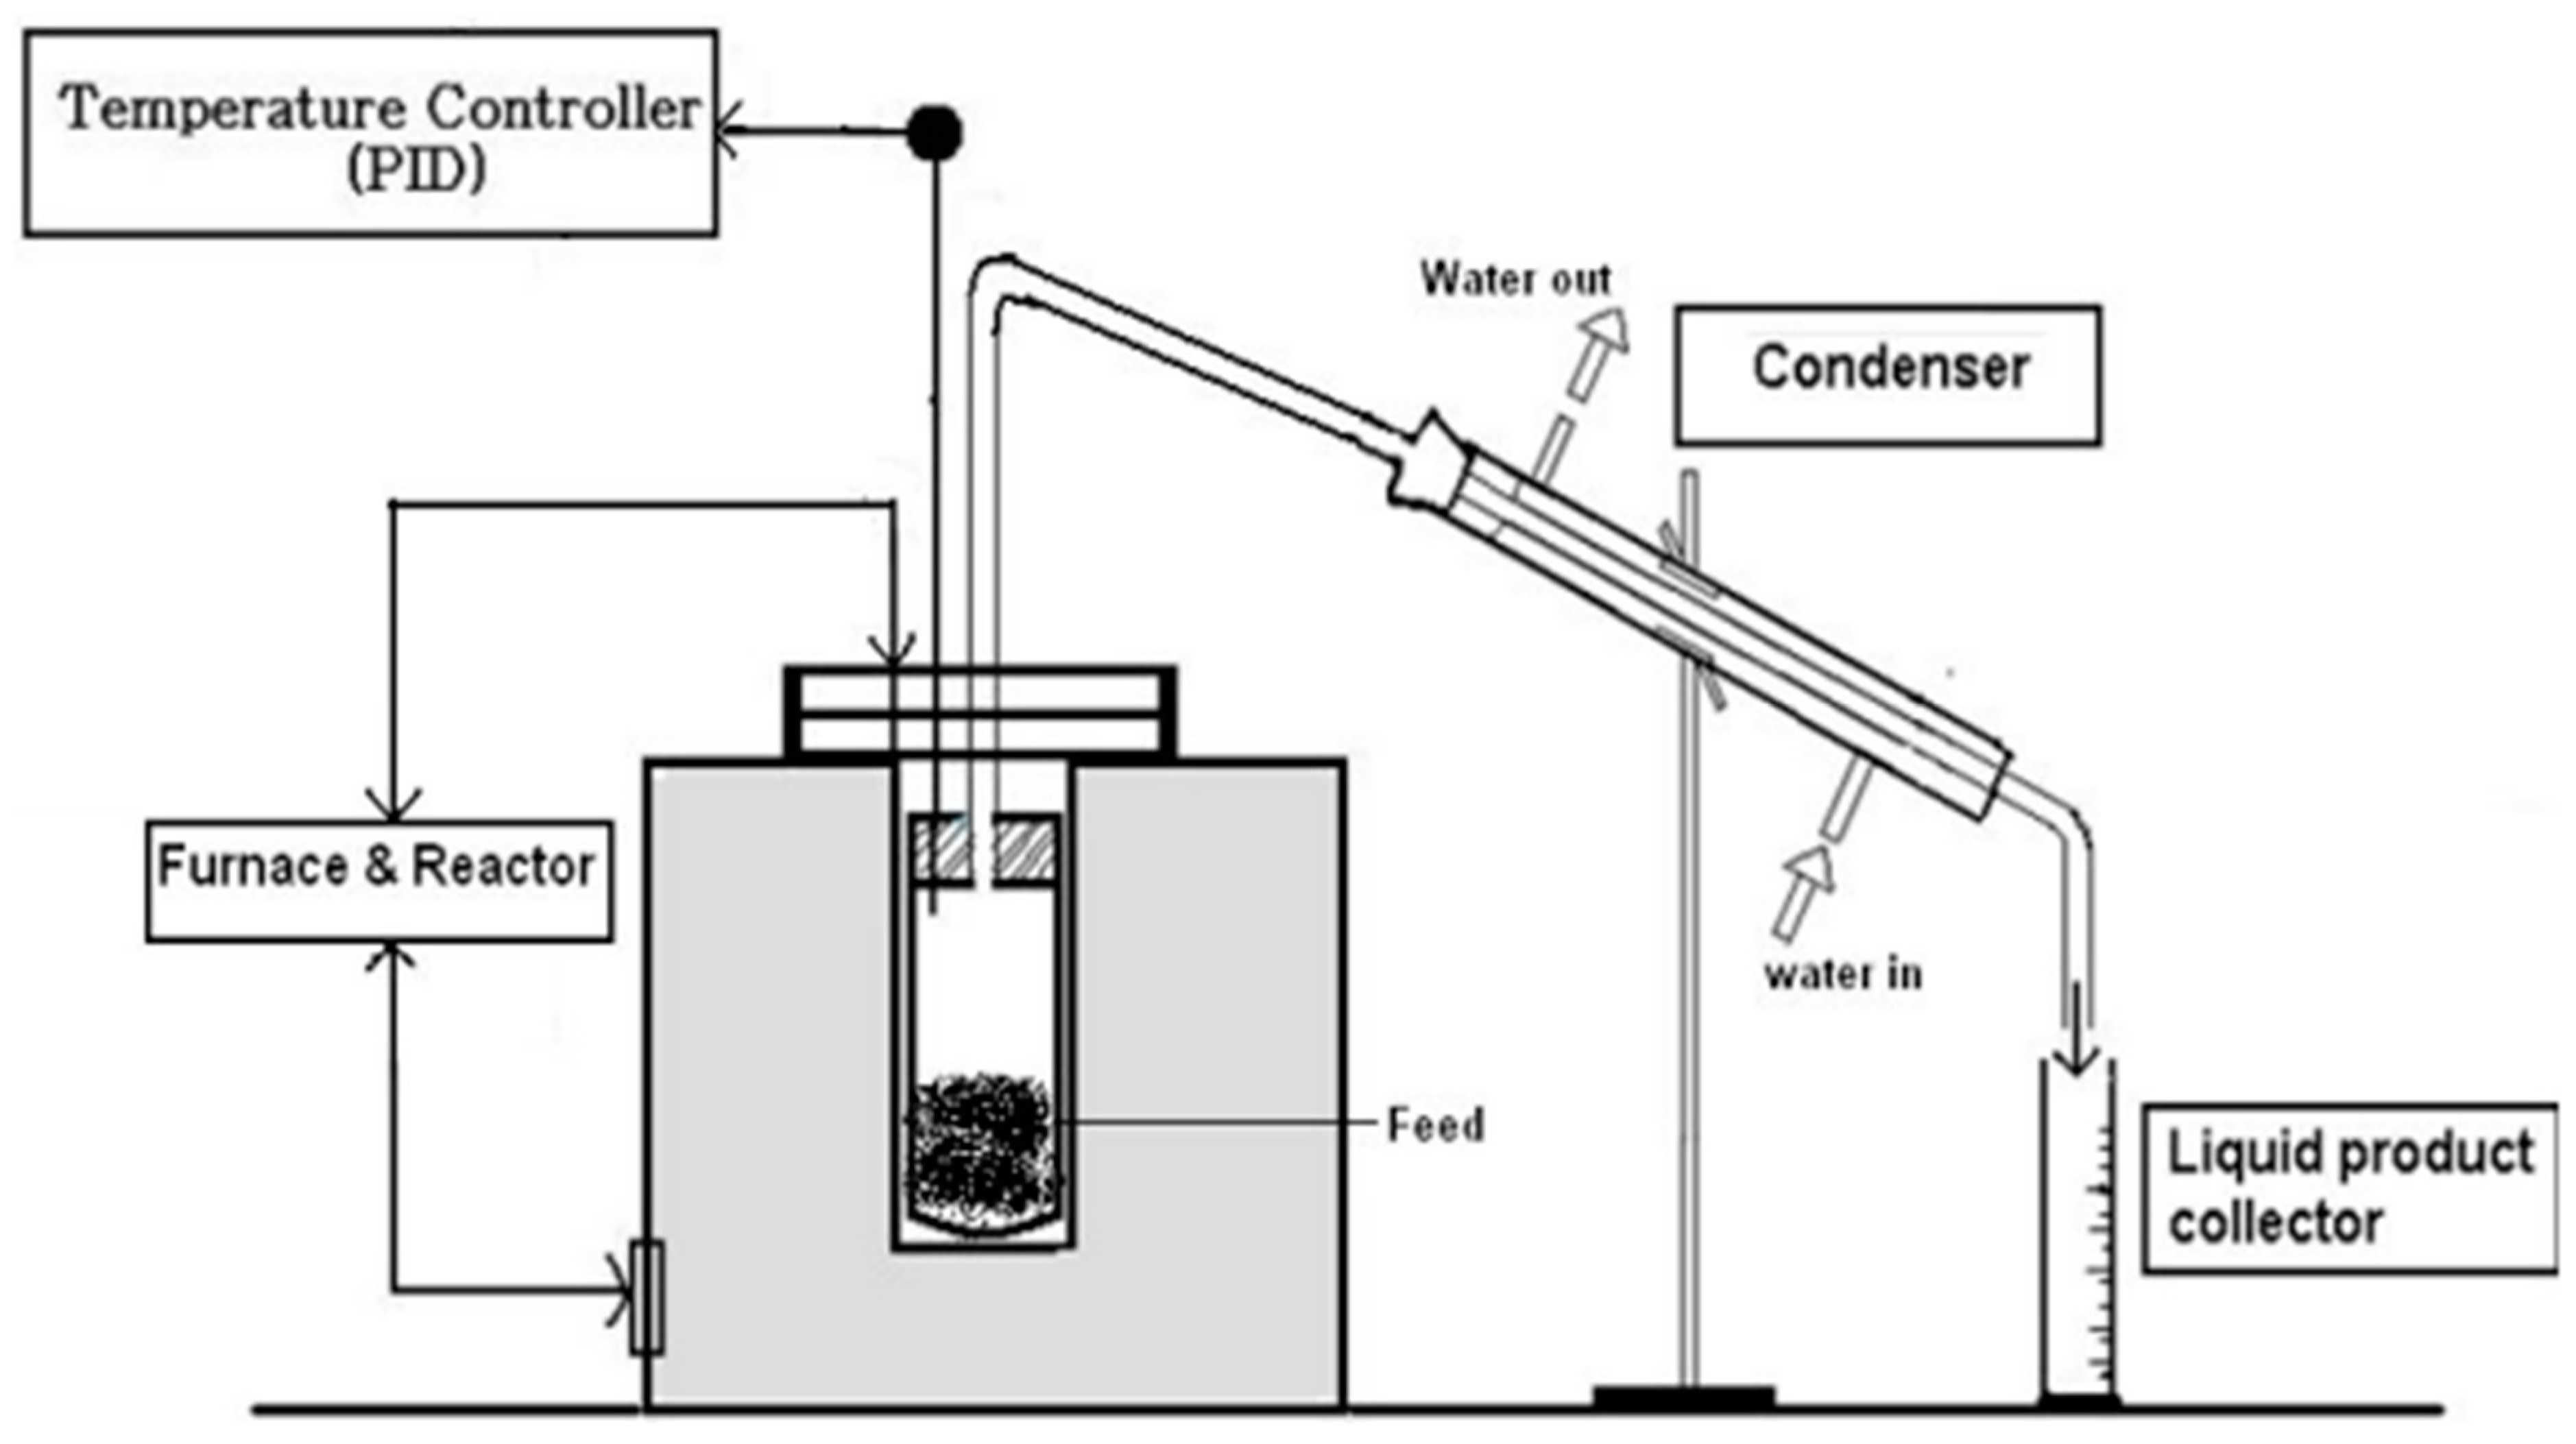
2.3. Pyrolysis Procedure

Figure 2 presents a detailed visual representation of the intricate reaction pathway observed during the pyrolysis of teff husk, which was investigated within a batch fixed bed reactor in the present study. With this reactor design, the pyrolysis experiments were precisely carried out with controlled conditions, which allowed us to investigate the pyrolysis phenomenon in depth. Teff husks were pyrolyzed at 400–500 °C under a nitrogen atmosphere and 1 atm pressure with a heating rate of 4.2 °C/min. This temperature range was selected considering that higher temperatures can potentially enhance the pyrolysis process. However, this study was limited to a maximum temperature of 500 °C to effectively manage energy consumption. The apparatus consisted of an electric furnace, a temperature controller, a condenser, and a K-type thermocouple to measure the actual temperature of the reactor. A proportional integral derivative (PID) temperature controller was used to regulate the temperature and ensure that the reactor remained below a maximum temperature limit of 500 °C.
This pyrolysis process was started by adding 1 kg of dried teff husk with particle sizes of less than 0.5 mm to the 0.5 m3 reactor, as shown in Figure 3. The yields of the products were determined using the following equations.
B i o c h a r   y e l d % = m a s s   o f   b i o c h a r g i n i t i a l   m a s s   o f   f e e d s t o c k g × 100
B i o o i l   y i e l d % = m a s s   o f   b i o o i l g i n i t i a l   m a s s   o f   f e e d s t o c k g × 100
G a s   y i e l d % = 100 ( B i o c h a r   y i e l d + B i o   o i l   y i e l d )
The heating rate was determined by observing the rise in the temperature of the reactor bed over time [29,30,31,32]. The pyrolysis setup also had built-in additional components such as a mass flow meter, pressure gauge, and pressure relief valves. After the completion of the pyrolysis process, the biochar was left at room temperature, while the bio-oil was collected inside the condenser after each procedure and carefully stored in clean glass bottles to avoid polymerization.

2.4. Product Analysis

The mass loss of Teff husk was measured using a thermogravimetric analyzer (TGA) (STA 449 F1 Jupiter, Netzsch, Selb, Germany) by heating the samples in a crucible from 40 to 900 °C at two different heating rates (5, 20 °C/min) while nitrogen was flowing at 30 mL/min. The experiment was conducted with at least three repetitions to ensure repeatability and an error rate of 1.5%. The TG and DTG curves showed minimal differences, resulting in very low standard deviations for the calculated kinetic parameters.

2.4.1. Surface Area Analyses

Brunauer–Emmett–Teller (BET) [33,34,35] analyses were conducted using the Micromeritics ASAP 2020 apparatus, manufactured by Micromeritics Instrument Corporation in Norcross, GA, USA. The BET analysis utilized the adsorption–desorption isotherm of N2 at −196 °C [36]. To remove absorbed gases and moisture from the biochar samples following pyrolysis, the samples underwent degassing at 300 °C under a vacuum pressure of 500 mmHg for 4 h.

2.4.2. FTIR Analysis

Fourier-transform infrared spectroscopy (FTIR) analysis was conducted to identify chemical compounds and explore the existence of chemical functional groups. This was carried out using the FTIR instrument (PERKIN ELMER RX) manufactured by PerkinElmer, Inc. and manufactured in Waltham, MA, USA [37]. This instrument was utilized for conducting the FTIR analysis on both the teff husk and obtained biochar. Fourier-transform infrared spectroscopy spectra were obtained with a resolution of 8 cm−1, covering the range from 400 to 4000 cm−1.

2.4.3. SEM-EDX Analysis

The investigation incorporated the analysis of biochar images acquired at various temperatures. This analysis was conducted employing SEM-EDX [37,38]. SEM images were obtained using a JEOL (JSM-6480 LV) microscope with an acceleration voltage of 10 kV manufactured by JEOL Ltd and manufactured in Tokyo, Japan. This setup allowed for a detailed examination of the biochar’s surface morphology at magnifications of 1000×, 2500×, and 4000×. Additionally, EDX was used to determine the elemental components of the biochar. To ensure a comprehensive analysis, random areas of interest were selected to investigate the elements present in each sample.

2.4.4. pH Value

The pH value of biochar samples that measured less than 0.5 mm in size were determined using an Elite PCTS pH manufactured by Elite Scientific & Diagnostic International, Inc. based in Davao City, Philippines. To conduct the measurement, the biochar was mixed with deionized water at a ratio of 1:5 and left for 24 h with sporadic agitation [39,40]. To ensure the accuracy of the data, the experiment was repeated three times, and the average result was taken as the final yield.

3. Results and Discussion

3.1. Characteristics of Feedstock

Table 1 presents a summary of the proximate and elemental analyses conducted on teff husk. The results show that teff husk contains 8.57 wt.% moisture, 6.13 wt.% ash, and 76.85 wt.% volatile matter. These findings suggest that teff husk is a suitable feedstock for the production of biochar using the slow pyrolysis method [32,36,41]. Further, the elemental analysis of teff husk revealed that it contains 41.39 wt.% carbon and 7.77 wt.% hydrogen, which is consistent with the values reported in the literature. Sulfur and chlorine were present in minimal amounts of 0.055 wt.% and 0.0063 wt.%, respectively. The fixed carbon content calculated using Equation (1) was 11.19 wt.%. By using teff husk as a feedstock for biochar production, we can expect low levels of sulfur and nitrogen oxides to be released, making it an environmentally friendly option due to its low nitrogen, chlorine, and sulfur concentrations, as determined by elemental analysis.
The study found that the higher heating value (HHV) of teff husk was 15.41 MJ/kg, which is slightly higher than the value reported by Leitea et al. [42]. Higher fixed carbon contents lead to increased heat production during combustion, resulting in a higher heating value [40]. The graph in Figure 4 shows the TG (left side y-axis) and DTG (right side y-axis) profiles of the raw teff husk sample for the temperature range of 40–800 °C with a heating rate of 10 °C/min. The TG graph reveals that heat begins to penetrate the teff husk at around 110 °C, removing inherent moisture which makes up 8% of the sample weight. The primary degrading processes, including depolymerization, cracking, and decarboxylation, occur within the temperature range of 155–650 °C.
Thermal degradation of teff husk begins at around 155 °C and reaches its peak between 270 °C and 425 °C, which is consistent with recent studies on lignocellulosic feedstocks characterized by high ash and potassium content, suggesting the catalytic effect of ash [43]. The devolatilization of the sample is almost complete at around 650 °C. The TGA results show that there are two main weight loss stages for teff husk. The first stage occurs at lower temperatures (155–350 °C) and is associated with the decomposition of hemicellulose and the early stages of cellulose decomposition. The second stage occurs at higher temperatures (350–455 °C) and is primarily associated with the later stages of cellulose decomposition. Lignin thermal degradation, on the other hand, occurs across the entire pyrolysis temperature range (170–560 °C).
Table 1. Physicochemical characteristics of teff husk.
AnalysisResults
Teff HuskRhodes Grass
[44]
Food Waste
[45]
Canola Hull
[45]
Moisture8.577.88.77.6
BET surface area (m2 g−1)8.541.97--
pH5.626.1--
Proximate analysis
Volatile matter76.8566.577.279.2
FC8.4511.05.14.0
Ash 6.1314.79.09.2
Ultimate analysis (db. wt.%)
Carbon41.442.540.842.5
Hydrogen7.85.54.15.1
Nitrogen2.321.93.92.2
Sulfur0.065.30.20.6
Chlorine0.0063---
Oxygen a48.528.742.040.5
HHV (MJ/kg)15.41 17.017.2
a by difference.

3.2. Thermal Decomposition Analysis of Teff Husk

The thermogravimetric analysis of teff husk is shown in Figure 4. The thermal degradation of the raw material indicated three weight loss regions. The first weight loss step occurred at the temperature range between 70 °C and 270 °C, where moisture content in the teff husk was removed. The second weight loss step happened at the temperature range of 270–425 °C, where volatilization of hemicelluloses and residual oil occurs. The third weight loss occurs from 425–650 °C with the inflection point at 350 °C, where the maximum rate of weight loss occurs, which may be due to the decomposition of lignin and cellulose.

3.3. Produced Biochar Characterization

3.3.1. Thermogravimetric Analysis of Biochar (TGA)

Figure 5 shows the biochar TGA curves. There were two stages in the thermal decomposition of all the biochar’s. The first phase started at about 100 °C and was mainly caused by moisture evaporation. Slow devolatilization occurred at temperatures higher than 300 °C and up to 950 °C, at which the rate of weight loss accelerated. The amount of residual carbon was lowest at 400 °C and highest at 500 °C.

3.3.2. Physicochemical Characterization

Table 2 depicts the elemental analysis of biochars containing carbon (C), hydrogen (H), nitrogen (N), sulfur (S), and oxygen (O). As the temperature of pyrolysis increases from 400 to 500 °C, the concentration of carbon increases significantly, while the levels of oxygen and hydrogen decrease in comparison to the feedstocks. The content of carbon present in the biochar obtained from teff husk increased from 47.21 wt.% (at 400 °C) to 54.75 wt.% (at 500 °C) over 120 min. This increase in carbon content with temperature suggests that the biochar underwent a more extensive carbonization process, which resulted in the formation of aromatic and condensed carbon structures [46]. Studies on biochars from oak trees [47], coconut shells [48], rice husks, and moso bamboo [49] also yielded similar results. On the other hand, the volatile matter content decreased significantly from 25.42 to 14.26 as the temperature increased from 400 to 450 °C, respectively. The volatile matter content graph plotted against temperature is shown in Table 2. This decrease was associated with the thermal breakdown of lignocellulosic materials, leading to the release of water vapor and volatile organic compounds such as CO, H2, CH4, and CO2, which resulted in substantial yield loss at lower temperatures [50,51].
The teff husk had an ash content of 6.13 wt.%, which was relatively lower than its corresponding biochar samples produced at 400, 450, and 500 °C, measuring 7.25 wt.%, 12.78 wt.%, and 15.63 wt.%, respectively. This increase in the ash content in the biochar samples was attributed to the gradual accumulation of inorganic constituents present in the biomass [52]. Similarly, the trend in fixed carbon content in teff husk at 400 °C (46.25 wt.%), 450 °C (52 wt.%), and 500 °C (55 wt.%) was consistent. These proximate findings are in line with previous studies [53,54].
Table 2 shows that the hydrogen content in teff husk biochar samples decreased from 3.99 wt.% to 2.75 wt.% when the temperature was increased from 400 °C to 500 °C over a period of 120 min. Similarly, the oxygen content of teff husk biochar decreased slightly from 42.27 wt.% (at 400 °C) to 40.69 wt.% (at 500 °C). Increasing the pyrolysis temperature results in the breakdown of oxygenated bonds into smaller molecular by-products, mostly volatile vapors, which results in less oxygen being present in the biochar. Additionally, the nitrogen content in the biochar also decreases as the temperature increases.

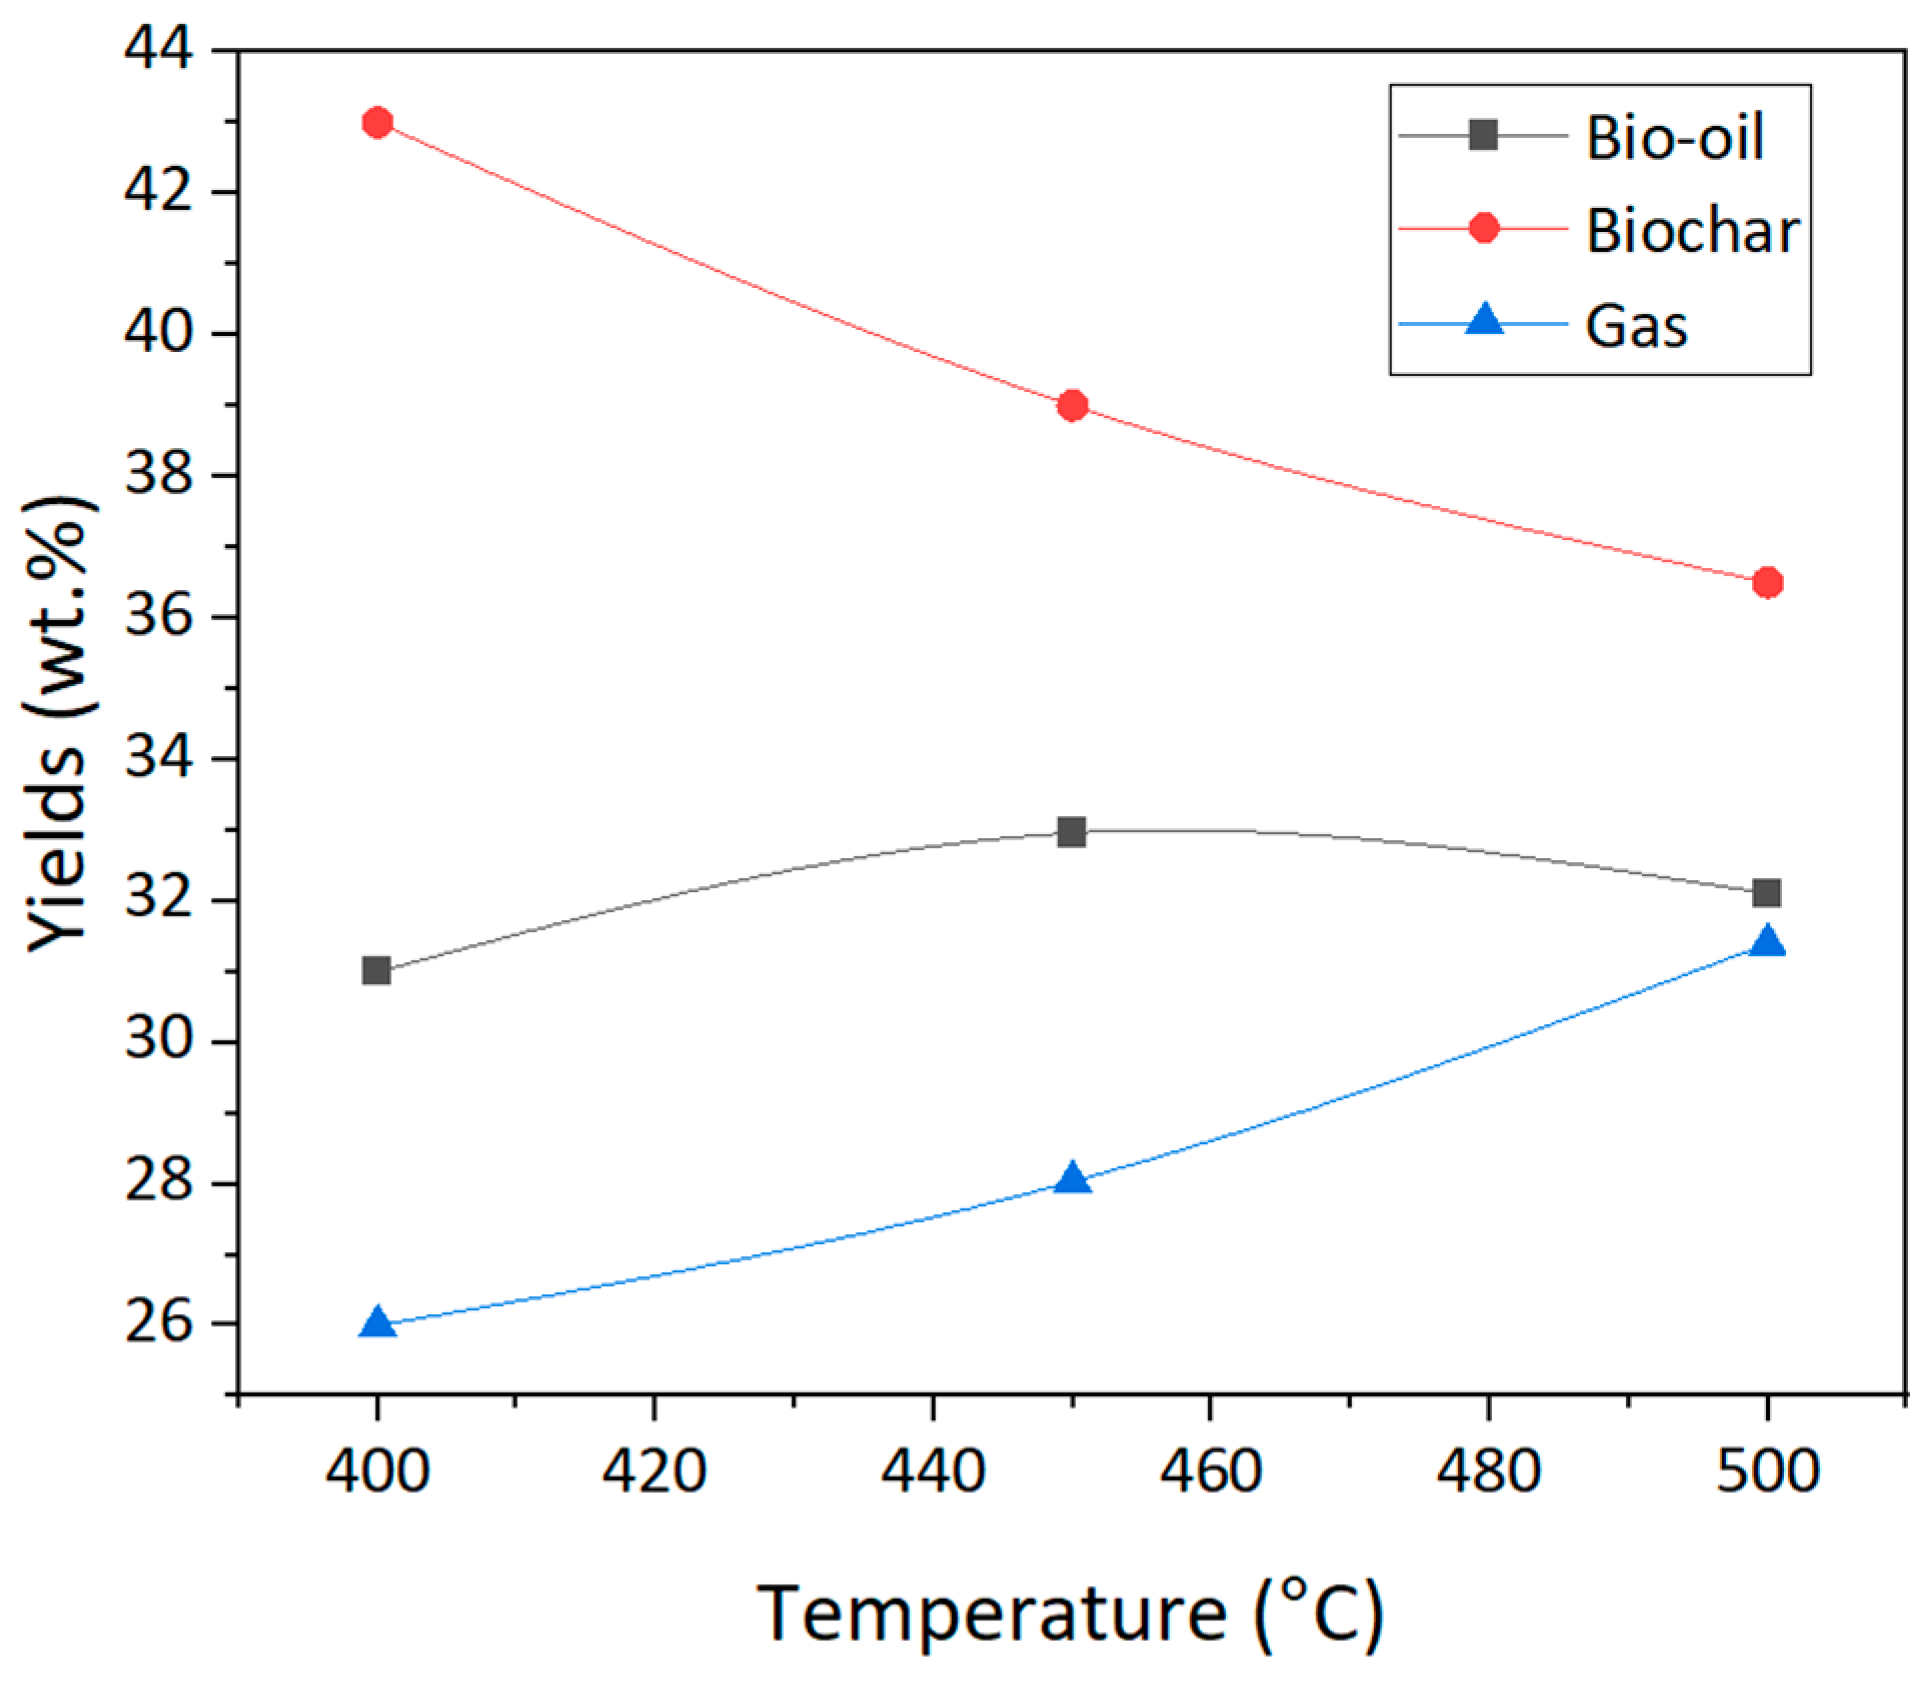
3.3.3. Effect of Pyrolysis Temperature and Heating Rate Value (HHV) on Biochar Yield

The pivotal parameter in the biochar production process is the influence of the heating rate and reaction temperature on product yield. Extensive literature surveys and previous studies have consistently highlighted the significant role of pyrolysis temperature in determining the distribution of products [45,55,56]. Figure 6 presents the biochar yields obtained at various pyrolysis temperatures ranging from 400 to 500 °C with 50 °C intervals. It is observed that the yield gradually declines as the temperature increases. The highest yield of 43.4% is recorded at 400 °C, but it decreases sharply to 39% at 450 °C. As the temperature further increases to 500 °C, the biochar yield decreases gradually with a slower rate of weight loss observed. At 500 °C, the biochar yield is the lowest, at 36.5%. This decrease in yield is due to the decomposition of lignocellulosic materials and the devolatilization of organic matter [57].
The higher heating value of biochar indicates its potential as a fuel. Figure 7 shows that the high heating rate affects the weight loss. At a heating rate of 20 °C per minute, teff husk undergoes high decomposition compared to a heating rate of 4.2 °C per minute, potentially resulting in an increase in the production of volatiles and a decrease in ash residues. The primary reason for the increased volatiles is the additional tar decompositions at high heating rates. For the teff husk biochar, a higher heating value was observed with an increase in pyrolysis temperature from 400 to 500 °C and a heating rate of 4.2 °C/min. The higher heating values of teff husk biochar were higher than those of other agricultural residues such as wheat straw (18.3 MJ/kg), rice straw (15.5 MJ/kg), and rice husk (16.0 MJ/kg) [58]. The higher heating values of teff husk biochar were slightly similar to those of other biochars derived from Rhodes grass, food waste, canola hull, cotton stalk, beech trunk bark, and Cynara cardunculus L. [44,59,60,61]. This indicates the potential of biochar as a solid fuel, with higher heating values similar to those of solid fuels ranging from lignite to anthracite [62,63].

3.3.4. pH Values

Table 2 presents the pH values of biochars produced at different pyrolysis temperatures. It was observed that higher pyrolysis temperatures lead to higher pH values. The biochars showed a pH range between 7.65 (at 400 °C) and 9.52 (at 500 °C). These pH values are consistent with those observed in biochar produced from sewage sludge, sugar beet tailings, and sugarcane bagasse at higher temperatures [64,65,66].

3.3.5. Fourier-Transform Infrared Spectroscopy (FTIR) Characterization

The functional groups in the biochar generated from teff husk pyrolysis were identified using FTIR analysis. Figure 8 displays the infrared spectra of three different types of biochar. Their wavenumbers and shape are similar and comparable.
There are several peaks that show that the biochar’s structure contains the functional groups O–H, C–O, and C–C, as well as aromatic rings. Table 3 presents details on the typical band assignments for the three types of biochars.

3.3.6. Scanning Electron Microscopy (SEM) Analysis

SEM analysis was conducted to study the textural property, surface morphology, and porous structure of biochar samples. The SEM images of biochar produced from teff husk at different temperatures are shown in Figure 9. Based on the SEM images, it is concluded that porosity and pore size increase with temperature. At 400 °C, only a few pores appeared due to the low decomposition of volatile matter. However, as the temperature reached 450 °C, a substantial increase in both the number and size of pores was observed on the surface of solid biochar, as shown in Figure 9. The significant development of micro-sized pores at a temperature of 450 °C resulted in a notable expansion of the biochar samples’ surface area [67,68]. These findings were attributed to the rapid release of volatile compounds during pyrolysis at higher temperatures. The results obtained in this study align closely with previous research [12,57,69,70], which investigated the impact of pyrolysis temperature on biochar porosity and pore size using SEM and BET analysis simultaneously. It has been found that the pyrolysis reaction obtained in this study closely matches the results of Landrat et. regarding biochar porosity.
However, at 500 °C, these pores might be blocked and combined, thereby reducing in size due to the plastic nature of the biochar. Additionally, a significant number of pore blockages may arise from the melting and combination of minerals, which are primary constituents of biochar produced at high temperatures. The maximum porosity development occurred at 450 °C, correlating with the peak devolatilization phase during pyrolysis. Additionally, these images showed the uneven distribution of pores and the surface texture. White spots on the surface indicate the presence of residual ash.
The presence of large pores at the surface of biochar has multifunctional values that include uses for the following purposes: porous material for mitigating greenhouse gas emissions and odorous compounds; as catalysts for industrial applications, soil amendment to improve soil health, nutrients, and microbial carrier; and to increase metal adsorption capacity by the chemisorption method [32,71].

3.3.7. Energy-Dispersive X-ray Spectroscopy (SEM-EDX) Analysis

The EDX analysis confirmed that biochar contains a range of inorganic elements including C, O, N, Al, Ca, Fe, Si, K, P, and Mg. Biochar enriched with these elements is applied to soil as a fertilizer, especially in acidic soil, as it provides essential plant nutrients [44,49]. N, P, and K are essential macronutrients for plants, supporting their growth and fertility [57]. The oxygen, gold, and carbon values obtained from the EDX investigation were observed to be slightly higher than those of other elements in all examinations. The surface elemental analysis of the biochar, conducted using EDX, indicates the predominance of C (41.50 wt.%), O (18.50 wt.%), and Au (24.65%) as its primary components, as summarized in Table 4. Images were taken at magnifications of 1000× and 2500×. The examination at 450 °C shows the presence of C (47.45 wt.%), O (14.36 wt.%), and Au (28.33 wt.%), as shown in Table 5.
The images were captured at magnifications of 1000×, 2500×, and 4000×. Moreover, at 500 °C, the analysis shows the composition, including C (53.15 wt.%), O (4.04 wt.%), and Au (39.88 wt.%), with detailed images taken at magnifications of 1000× and 2500×, as shown in Table 6. As the teff husk was manually separated from its grain on the earth’s surface, there is a possibility that gold might be present in this biochar. This indicates that some minerals could potentially be mixed with the teff husk from the soil during the separation process. As a final note, FTIR analysis (Figure 2) indicated the presence of robust CO2 characteristic bands in the spectra of the three biochars [52,72], suggesting their potential as sorbents for atmospheric CO2. Previous research has demonstrated the effectiveness of biochar-amended soil in reducing atmospheric CO2 concentrations, presenting biochar as a viable candidate for mitigating CO2 emissions, particularly in heavily polluted areas [22]. In light of this, the biochars used in this study could potentially be applied in similar applications; however, this will require further research.

4. Conclusions

In this study, the pyrolysis of teff husk was conducted within a fixed bed reactor at temperatures ranging from 400 °C to 500 °C. The teff husk particles used were smaller than 0.5 mm, and the reactor had a nominal capacity of 1 kg/h. Subsequently, the produced biochar underwent characterization. At a temperature of 400 °C, the maximum biochar yield achieved was 43.4 wt.%, a result that aligns with the biochar yield obtained from various other agricultural residues. The physical and chemical properties of the biochars produced from teff husk at different temperatures are quite similar to those obtained from other agricultural residues in the existing literature. Biochars derived from teff husk pyrolysis displayed high carbon content (47.21–54.75%), reduced hydrogen content (2.75–4%), and moderate oxygen levels (40.69–42.28%), indicating an increase in carbon concentration relative to the feedstock.
Thermogravimetric analysis (TGA) conducted in an inert gas (N2) showed notable differences in the thermal degradation behavior among the three biochars. The higher heating value (HHV) of the biochar produced from teff husk pyrolysis ranged from 21.22 to 22.8 MJ/kg, exceeding the values typically observed in lower-ranked coals (12 to 25 MJ/kg). SEM analysis showed that higher pyrolysis temperatures increased pore sizes and surface area in biochar derived from teff husk, but excessive temperatures resulted in pore blockages and size reduction. The EDX analysis confirmed the presence of various inorganic elements in biochar, including C, O, N, Al, Ca, Fe, Si, K, P, and Mg, which are essential nutrients for plant growth and fertility, with C and O being the predominant elements observed.
In our future work, we plan to delve deeper into the economic aspects of biochar production, including cost–benefit analyses and assessments of scalability. By evaluating the affordability of the process and its viability for large-scale implementation, we aim to provide valuable insights for decision-makers and stakeholders in the field. Moreover, in future research, emphasis will be placed on establishing correlations between the biochar properties identified in this study and their potential implications for soil improvement or other environmental applications.

Author Contributions

Conceptualization, M.L. and M.A.; methodology, M.A. and S.S.; formal analysis, M.A. and P.A.F.; investigation, M.L. and M.A.; resources, K.P.; writing—original draft preparation, M.A.; writing—review and editing, M.A., S.S. and P.A.F.; visualization, M.A. All authors have read and agreed to the published version of the manuscript.

Funding

Publication was funded by the research subsidy allocated for 2024 (08/030/BK_24/0131).

Data Availability Statement

The original contributions presented in the study are included in the article, further inquiries can be directed to the corresponding author.

Acknowledgments

The authors would like to express their gratitude to the Silesian University of Technology and Jimma University for their financial support and provision of research materials. Additionally, we extend our appreciation to Roman Turczyn and Ścierski Waldemar for their assistance in facilitating the experimental tests.

Conflicts of Interest

The authors declare no conflicts of interest.

Nomenclature

DTGDerivative thermogravimetric
EDXEnergy-dispersive X-ray spectroscopy
FCFixed carbon
FTIRFourier-transform infrared spectroscopy
GHGGreenhouse gas
HHVHigher heating value
PIDproportional integral derivative
SEMScanning electron microscopy
THTeff husk
TGAThermogravimetric analysis
VMVolatile matter

References

  1. Koul, B.; Yakoob, M.; Shah, M.P. Agricultural Waste Management Strategies for Environmental Sustainability. Environ. Res. 2022, 206, 112285. [Google Scholar] [CrossRef] [PubMed]
  2. Benti, N.E.; Gurmesa, G.S.; Argaw, T.; Aneseyee, A.B.; Gunta, S.; Kassahun, G.B.; Aga, G.S.; Asfaw, A.A. The Current Status, Challenges and Prospects of Using Biomass Energy in Ethiopia. Biotechnol. Biofuels 2021, 14, 209. [Google Scholar] [CrossRef]
  3. Landrat, M.; Abawalo, M.T.; Pikoń, K.; Turczyn, R. Bio-Oil Derived from Teff Husk via Slow Pyrolysis Process in Fixed Bed Reactor and Its Characterization. Energies 2022, 15, 9605. [Google Scholar] [CrossRef]
  4. Hajam, Y.A.; Kumar, R.; Kumar, A. Environmental Waste Management Strategies and Vermi Transformation for Sustainable Development. Environ. Chall. 2023, 13, 100747. [Google Scholar] [CrossRef]
  5. Kihila, J.M.; Wernsted, K.; Kaseva, M. Waste Segregation and Potential for Recycling—A Case Study in Dar Es Salaam City, Tanzania. Sustain. Environ. 2021, 7, 1935532. [Google Scholar] [CrossRef]
  6. Gabisa, E.W.; Gheewala, S.H. Potential of Bio-Energy Production in Ethiopia Based on Available Biomass Residues. Biomass Bioenergy 2018, 111, 77–87. [Google Scholar] [CrossRef]
  7. Tolessa, A. Bioenergy Potential from Crop Residue Biomass Resources in Ethiopia. Heliyon 2023, 9, e13572. [Google Scholar] [CrossRef] [PubMed]
  8. Tolessa, A. Bioenergy Production Potential of Available Biomass Residue Resources in Ethiopia. J. Renew. Energy 2023, 2023, 2407300. [Google Scholar] [CrossRef]
  9. Bećirović, S.; Ibro, S.; Kalač, B. Environmental Pollution and Waste Management. Balk. J. Health Sci. 2015, 3, 2–10. [Google Scholar]
  10. Ścierski, W.; Landrat, M.; Magdalena, B.; Pikoń, K. Analysis of chlorine migration in low temperature pyrolysis. Przemysł Chem. 2019, 98, 1448–1450. [Google Scholar] [CrossRef]
  11. Amalina, F.; Razak, A.S.A.; Krishnan, S.; Sulaiman, H.; Zularisam, A.W.; Nasrullah, M. Biochar Production Techniques Utilizing Biomass Waste-Derived Materials and Environmental Applications—A Review. J. Hazard. Mater. Adv. 2022, 7, 100134. [Google Scholar] [CrossRef]
  12. Landrat, M. Possibilities of polyphenol floral foam waste utilization. Przemysł Chem. 2017, 96, 1704–1706. [Google Scholar] [CrossRef]
  13. Dhyani, V.; Bhaskar, T. A Comprehensive Review on the Pyrolysis of Lignocellulosic Biomass. Renew. Energy 2018, 129, 695–716. [Google Scholar] [CrossRef]
  14. Jesus, M.S.D.; Martinez, C.L.M.; Costa, L.J.; Pereira, E.G.; Carneiro, A.C.O.D. Thermal Conversion of Biomass: A Comparative Review of Different Pyrolysis Processes. Revista Ciência Madeira 2020, 11, 12–22. [Google Scholar] [CrossRef]
  15. Yazhini, G.; Abishek, R.; Ilakiya, T.; Shanmugapriya, S.; Piriya, R.S. Beneficial Effects of Biochar on Agriculture and Environments. Int. Res. J. Pure Appl. Chem. 2020, 21, 74–88. [Google Scholar] [CrossRef]
  16. Mohanty, P.; Nanda, S.; Pant, K.K.; Naik, S.; Kozinski, J.A.; Dalai, A.K. Evaluation of the Physiochemical Development of Biochars Obtained from Pyrolysis of Wheat Straw, Timothy Grass and Pinewood: Effects of Heating Rate. J. Anal. Appl. Pyrolysis 2013, 104, 485–493. [Google Scholar] [CrossRef]
  17. Pahnila, M.; Koskela, A.; Sulasalmi, P.; Fabritius, T. A Review of Pyrolysis Technologies and the Effect of Process Parameters on Biocarbon Properties. Energies 2023, 16, 6936. [Google Scholar] [CrossRef]
  18. Basu, P. Biomass Gasification, Pyrolysis and Torrefaction: Practical Design and Theory; Academic Press: Cambridge, MA, USA, 2018; ISBN 978-0-12-813040-7. [Google Scholar]
  19. Aboelela, D.; Saleh, H.; Attia, A.M.; Elhenawy, Y.; Majozi, T.; Bassyouni, M. Recent Advances in Biomass Pyrolysis Processes for Bioenergy Production: Optimization of Operating Conditions. Sustainability 2023, 15, 11238. [Google Scholar] [CrossRef]
  20. Yogalakshmi, K.N.; Sivashanmugam, P.; Kavitha, S.; Kannah, Y.; Varjani, S.; AdishKumar, S.; Kumar, G. Lignocellulosic Biomass-Based Pyrolysis: A Comprehensive Review. Chemosphere 2022, 286, 131824. [Google Scholar] [CrossRef]
  21. Zadeh, Z.E.; Abdulkhani, A.; Aboelazayem, O.; Saha, B. Recent Insights into Lignocellulosic Biomass Pyrolysis: A Critical Review on Pretreatment, Characterization, and Products Upgrading. Processes 2020, 8, 799. [Google Scholar] [CrossRef]
  22. Wardani, S.; Pranoto; Himawanto, D.A. Kinetic Parameters and Calorific Value of Biochar from Mahogany (Swietenia Macrophylla King) Wood Pyrolysis with Heating Rate and Final Temperature Variations. In Proceedings of the 3rd International Seminar on Chemistry: Green Chemistry and Its Role for Sustainability, Surabaya, Indonesia, 18–19 July 2018; p. 020034. [Google Scholar]
  23. Sri Shalini, S.; Palanivelu, K.; Ramachandran, A.; Raghavan, V. Biochar from Biomass Waste as a Renewable Carbon Material for Climate Change Mitigation in Reducing Greenhouse Gas Emissions—A Review. Biomass Conv. Bioref. 2021, 11, 2247–2267. [Google Scholar] [CrossRef]
  24. Neogi, S.; Sharma, V.; Khan, N.; Chaurasia, D.; Ahmad, A.; Chauhan, S.; Singh, A.; You, S.; Pandey, A.; Bhargava, P.C. Sustainable Biochar: A Facile Strategy for Soil and Environmental Restoration, Energy Generation, Mitigation of Global Climate Change and Circular Bioeconomy. Chemosphere 2022, 293, 133474. [Google Scholar] [CrossRef]
  25. Qambrani, N.A.; Rahman, M.M.; Won, S.; Shim, S.; Ra, C. Biochar Properties and Eco-Friendly Applications for Climate Change Mitigation, Waste Management, and Wastewater Treatment: A Review. Renew. Sustain. Energy Rev. 2017, 79, 255–273. [Google Scholar] [CrossRef]
  26. Ma, Y.; Wang, M.; Zhao, X.; Dai, X.; He, Y. Study of the Microstructural Characteristics of Low-Rank Coal under Different Degassing Pressures. Energies 2022, 15, 3691. [Google Scholar] [CrossRef]
  27. Hernandez-Mena, L.; Pecora, A.; Beraldo, A. Slow Pyrolysis of Bamboo Biomass: Analysis of Biochar Properties. Chem. Eng. Trans. 2014, 37, 115–120. [Google Scholar] [CrossRef]
  28. Biegańska, J.; Czop, M.; Kajda-Szcześniak, M. Gospodarka Odpadami Niebezpiecznymi: Materiały do Zajęć Laboratoryjnych; Politechnika Śląska: Gliwice, Poland, 2010. [Google Scholar]
  29. Angın, D. Effect of Pyrolysis Temperature and Heating Rate on Biochar Obtained from Pyrolysis of Safflower Seed Press Cake. Bioresour. Technol. 2013, 128, 593–597. [Google Scholar] [CrossRef] [PubMed]
  30. Higashikawa, F.S.; Conz, R.F.; Colzato, M.; Cerri, C.E.P.; Alleoni, L.R.F. Effects of Feedstock Type and Slow Pyrolysis Temperature in the Production of Biochars on the Removal of Cadmium and Nickel from Water. J. Clean. Prod. 2016, 137, 965–972. [Google Scholar] [CrossRef]
  31. Pranoto; Nugrahaningtyas, K.D.; Putri, R.N.O. Study of Final Temperature and Heating Rate Variation to Pyrolysis of Acacia (Acacia mangium W.) Wood Waste. IOP Conf. Ser. Mater. Sci. Eng. 2020, 959, 012012. [Google Scholar] [CrossRef]
  32. Zhao, B.; O’Connor, D.; Zhang, J.; Peng, T.; Shen, Z.; Tsang, D.; Hou, D. Effect of Pyrolysis Temperature, Heating Rate, and Residence Time on Rapeseed Stem Derived Biochar. J. Clean. Prod. 2017, 174, 977–987. [Google Scholar] [CrossRef]
  33. Shaaban, A.; Se, S.-M.; Mitan, N.M.M.; Dimin, M.F. Characterization of Biochar Derived from Rubber Wood Sawdust through Slow Pyrolysis on Surface Porosities and Functional Groups. Procedia Eng. 2013, 68, 365–371. [Google Scholar] [CrossRef]
  34. Amalina, F.; Razak, A.S.A.; Krishnan, S.; Zularisam, A.W.; Nasrullah, M. A Comprehensive Assessment of the Method for Producing Biochar, Its Characterization, Stability, and Potential Applications in Regenerative Economic Sustainability—A Review. Clean. Mater. 2022, 3, 100045. [Google Scholar] [CrossRef]
  35. Dhar, S.A.; Sakib, T.U.; Hilary, L.N. Effects of Pyrolysis Temperature on Production and Physicochemical Characterization of Biochar Derived from Coconut Fiber Biomass through Slow Pyrolysis Process. Biomass Conv. Bioref. 2022, 12, 2631–2647. [Google Scholar] [CrossRef]
  36. Kalus, K.; Koziel, J.A.; Opaliński, S. A Review of Biochar Properties and Their Utilization in Crop Agriculture and Livestock Production. Appl. Sci. 2019, 9, 3494. [Google Scholar] [CrossRef]
  37. Chia, C.H.; Gong, B.; Joseph, S.D.; Marjo, C.E.; Munroe, P.; Rich, A.M. Imaging of Mineral-Enriched Biochar by FTIR, Raman and SEM–EDX. Vib. Spectrosc. 2012, 62, 248–257. [Google Scholar] [CrossRef]
  38. Ma, X.; Zhou, B.; Budai, A.; Jeng, A.; Hao, X.; Wei, D.; Zhang, Y.; Rasse, D. Study of Biochar Properties by Scanning Electron Microscope—Energy Dispersive X-Ray Spectroscopy (SEM-EDX). Commun. Soil Sci. Plant Anal. 2016, 47, 593–601. [Google Scholar] [CrossRef]
  39. Yakout, S.M. Physicochemical Characteristics of Biochar Produced from Rice Straw at Different Pyrolysis Temperature for Soil Amendment and Removal of Organics. Proc. Natl. Acad. Sci. India Sect. A Phys. Sci. 2017, 87, 207–214. [Google Scholar] [CrossRef]
  40. Karaeva, J.; Timofeeva, S.; Islamova, S.; Bulygina, K.; Aliev, F.; Panchenko, V.; Bolshev, V. Pyrolysis of Amaranth Inflorescence Wastes: Bioenergy Potential, Biochar and Hydrocarbon Rich Bio-Oil Production. Agriculture 2023, 13, 260. [Google Scholar] [CrossRef]
  41. Sun, J.; He, F.; Pan, Y.; Zhang, Z. Effects of Pyrolysis Temperature and Residence Time on Physicochemical Properties of Different Biochar Types. Acta Agric. Scand. Sect. B Soil Plant Sci. 2017, 67, 12–22. [Google Scholar] [CrossRef]
  42. Leite, S.; Leite, B.; Carrico, C.; Dell Isola, A.T.; Dangelo, J.V. Characterization of Biomass Residues Aiming Energy and By-Products Generation. Chem. Eng. Trans. 2018, 65, 733–738. [Google Scholar] [CrossRef]
  43. Parthasarathy, P.; Alherbawi, M.; Pradhan, S.; Al-Ansari, T.; Mackey, H.R.; McKay, G. Pyrolysis Characteristics, Kinetic, and Thermodynamic Analysis of Camel Dung, Date Stone, and Their Blend Using Thermogravimetric Analysis. Biomass Conv. Bioref. 2022, 13, 31–47. [Google Scholar] [CrossRef]
  44. Jouiad, M.; Al-Nofeli, N.; Khalifa, N.; Benyettou, F.; Yousef, L.F. Characteristics of Slow Pyrolysis Biochars Produced from Rhodes Grass and Fronds of Edible Date Palm. J. Anal. Appl. Pyrolysis 2015, 111, 183–190. [Google Scholar] [CrossRef]
  45. Patra, B.R.; Nanda, S.; Dalai, A.K.; Meda, V. Slow Pyrolysis of Agro-Food Wastes and Physicochemical Characterization of Biofuel Products. Chemosphere 2021, 285, 131431. [Google Scholar] [CrossRef]
  46. Azargohar, R.; Nanda, S.; Dalai, A.K.; Kozinski, J.A. Physico-Chemistry of Biochars Produced through Steam Gasification and Hydro-Thermal Gasification of Canola Hull and Canola Meal Pellets. Biomass Bioenergy 2019, 120, 458–470. [Google Scholar] [CrossRef]
  47. Jindo, K.; Mizumoto, H.; Sawada, Y.; Sanchez-Monedero, M.A.; Sonoki, T. Physical and Chemical Characterization of Biochars Derived from Different Agricultural Residues. Biogeosciences 2014, 11, 6613–6621. [Google Scholar] [CrossRef]
  48. Mohamed Noor, N.; Shariff, A.; Abdullah, N.; Mohamad Aziz, N.S. Temperature Effect on Biochar Properties from Slow Pyrolysis of Coconut Flesh Waste. Mal. J. Fund. Appl. Sci. 2019, 15, 153–158. [Google Scholar] [CrossRef]
  49. Zhang, Y.; Ma, Z.; Zhang, Q.; Wang, J.; Ma, Q.; Yang, Y.; Luo, X.; Zhang, W. Comparison of the Physicochemical Characteristics of Bio-Char Pyrolyzed from Moso Bamboo and Rice Husk with Different Pyrolysis Temperatures. BioResources 2017, 12, 4652–4669. [Google Scholar] [CrossRef]
  50. Li, S.; Barreto, V.; Li, R.; Chen, G.; Hsieh, Y.P. Nitrogen Retention of Biochar Derived from Different Feedstocks at Variable Pyrolysis Temperatures. J. Anal. Appl. Pyrolysis 2018, 133, 136–146. [Google Scholar] [CrossRef]
  51. Liu, W.-J.; Jiang, H.; Yu, H.-Q. Development of Biochar-Based Functional Materials: Toward a Sustainable Platform Carbon Material. Chem. Rev. 2015, 115, 12251–12285. [Google Scholar] [CrossRef]
  52. Rafiq, M.K.; Bachmann, R.T.; Rafiq, M.T.; Shang, Z.; Joseph, S.; Long, R. Influence of Pyrolysis Temperature on Physico-Chemical Properties of Corn Stover (Zea mays L.) Biochar and Feasibility for Carbon Capture and Energy Balance. PLoS ONE 2016, 11, e0156894. [Google Scholar] [CrossRef] [PubMed]
  53. Wilk, M.; Magdziarz, A. Hydrothermal Carbonization, Torrefaction and Slow Pyrolysis of Miscanthus Giganteus. Energy 2017, 140, 1292–1304. [Google Scholar] [CrossRef]
  54. Xue, S.; Zhang, X.; Ngo, H.H.; Guo, W.; Wen, H.; Li, C.; Zhang, Y.; Ma, C. Food Waste Based Biochars for Ammonia Nitrogen Removal from Aqueous Solutions. Bioresour. Technol. 2019, 292, 121927. [Google Scholar] [CrossRef]
  55. Tomczyk, A.; Sokołowska, Z.; Boguta, P. Biochar Physicochemical Properties: Pyrolysis Temperature and Feedstock Kind Effects. Rev. Environ. Sci Biotechnol. 2020, 19, 191–215. [Google Scholar] [CrossRef]
  56. Song, H.; Wang, J.; Garg, A.; Lin, X.; Zheng, Q.; Sharma, S. Potential of Novel Biochars Produced from Invasive Aquatic Species Outside Food Chain in Removing Ammonium Nitrogen: Comparison with Conventional Biochars and Clinoptilolite. Sustainability 2019, 11, 7136. [Google Scholar] [CrossRef]
  57. Amenaghawon, A.N.; Anyalewechi, C.L.; Okieimen, C.O.; Kusuma, H.S. Biomass Pyrolysis Technologies for Value-Added Products: A State-of-the-Art Review. Environ. Dev. Sustain. 2021, 23, 14324–14378. [Google Scholar] [CrossRef]
  58. Song, G.; Shen, L.; Xiao, J. Estimating Specific Chemical Exergy of Biomass from Basic Analysis Data. Ind. Eng. Chem. Res. 2011, 50, 9758–9766. [Google Scholar] [CrossRef]
  59. Chen, Y.; Yang, H.; Wang, X.; Zhang, S.; Chen, H. Biomass-Based Pyrolytic Polygeneration System on Cotton Stalk Pyrolysis: Influence of Temperature. Bioresour. Technol. 2012, 107, 411–418. [Google Scholar] [CrossRef]
  60. Demirbas, A. Effects of Temperature and Particle Size on Bio-Char Yield from Pyrolysis of Agricultural Residues. J. Anal. Appl. Pyrolysis 2004, 72, 243–248. [Google Scholar] [CrossRef]
  61. Encinar, J.M.; González, J.F.; González, J. Fixed-Bed Pyrolysis of Cynara cardunculus L. Product Yields and Compositions. Fuel Process. Technol. 2000, 68, 209–222. [Google Scholar] [CrossRef]
  62. Raveendran, K.; Ganesh, A.; Khilar, K.C. Pyrolysis Characteristics of Biomass and Biomass Components. Fuel 1996, 75, 987–998. [Google Scholar] [CrossRef]
  63. Pawlak-Kruczek, H. 2—Properties of Low Rank Coals and Resulting Challenges in Their Utilization. In Low-Rank Coals for Power Generation, Fuel and Chemical Production; Luo, Z., Agraniotis, M., Eds.; Woodhead Publishing: Sawston, UK, 2017; pp. 23–40. ISBN 978-0-08-100895-9. [Google Scholar]
  64. Yao, Y.; Gao, B.; Inyang, M.; Zimmerman, A.R.; Cao, X.; Pullammanappallil, P.; Yang, L. Biochar Derived from Anaerobically Digested Sugar Beet Tailings: Characterization and Phosphate Removal Potential. Bioresour. Technol. 2011, 102, 6273–6278. [Google Scholar] [CrossRef]
  65. Jindarom, C.; Meeyoo, V.; Kitiyanan, B.; Rirksomboon, T.; Rangsunvigit, P. Surface Characterization and Dye Adsorptive Capacities of Char Obtained from Pyrolysis/Gasification of Sewage Sludge. Chem. Eng. J. 2007, 133, 239–246. [Google Scholar] [CrossRef]
  66. Inyang, M.; Gao, B.; Pullammanappallil, P.; Ding, W.; Zimmerman, A.R. Biochar from anaerobically digested sugarcane bagasse. Bioresour. Technol. 2010, 101, 8868–8872. [Google Scholar] [CrossRef]
  67. Muzyka, R.; Misztal, E.; Hrabak, J.; Banks, S.W.; Sajdak, M. Various Biomass Pyrolysis Conditions Influence the Porosity and Pore Size Distribution of Biochar. Energy 2023, 263, 126128. [Google Scholar] [CrossRef]
  68. Tolessa, A. Potential of Biomethane-Based Energy Production from Livestock Waste Biomass Resources in Ethiopia. Front. Energy Res. 2023, 11, 1249327. [Google Scholar] [CrossRef]
  69. Tessfaw, Z.A.; Beyene, A.; Nebiyu, A.; Pikoń, K.; Landrat, M. Co-Composting of Khat-Derived Biochar with Municipal Solid Waste: A Sustainable Practice of Waste Management. Sustainability 2020, 12, 10668. [Google Scholar] [CrossRef]
  70. Reyhanitabar, A.; Frahadi, E.; Ramezanzadeh, H.; Oustan, S. Effect of Pyrolysis Temperature and Feedstock Sources on Physicochemical Characteristics of Biochar. J. Agric. Sci. Technol. 2020, 22, 547–561. [Google Scholar]
  71. Ścierski, W. Study of the physico-chemical properties of solid pyrolysis products of contaminated and mixed plastics. Przemysł Chem. 2020, 99, 1366–1368. [Google Scholar] [CrossRef]
  72. Liu, Y.; Paskevicius, M.; Wang, H.; Parkinson, G.; Wei, J.; Asif Akhtar, M.; Li, C.-Z. Insights into the Mechanism of Tar Reforming Using Biochar as a Catalyst. Fuel 2021, 296, 120672. [Google Scholar] [CrossRef]
Figure 1. Teff with its residues: (a) Teff; (b) teff husk; (c) produced biochar.
Energies 17 01988 g001
Figure 2. Schematic diagram of the methodology used for biochar production from teff husk and its characterization.
Energies 17 01988 g002
Figure 3. Schematic diagram of the pyrolysis experimental setup.
Energies 17 01988 g003
Figure 4. Thermogravimetric (TGA) and derivative thermogravimetric (DTG) plots of teff husk at 20 °C/min heating rate.
Energies 17 01988 g004
Figure 5. Thermogravimetric analysis of biochar.
Energies 17 01988 g005
Figure 6. Effect of temperature variation on biofuel yields derived from pyrolysis of teff husk in fixed bed reactor.
Energies 17 01988 g006
Figure 7. Effect of heating rate at 4.2 °C/min and 20 °C/min: (a) TGA and (b) DTGA plots of teff husk.
Energies 17 01988 g007
Figure 8. FTIR spectra of the biochar from teff husk pyrolysis at different temperatures.
Energies 17 01988 g008
Figure 9. SEM images of the particles of the biochar samples: (a) 400 °C, (b) 450 °C, (c) 500 °C.
Energies 17 01988 g009
Table 2. Physicochemical comparison of biochar produced from teff husk and other agricultural residues.
CharacteristicsFeedstocks
Teff Husk
(This Work)
Rhodes Grass
[44]
Food Waste
[45]
Canola Hull
[45]
Pyrolysis temperature (°C)400450500340400600
Yield of biochar (wt.%)43.438.8536.1---
BET surface area (m2/g)25.7032.6543.216.782.18-
pH7.658.029.529.708.310.9
Moisture (wt.%)3.42.101.321.806.705.65
VM (wt.%)25.4214.2614.111.838.218.7
FC (wt.%)46.25525556.631.058.2
Ash (wt.%)7.2512.7815.628.824.117.4
Carbon (wt.%)47.2151.9654.756.753.563.5
Hydrogen (wt.%)3.993.522.752.204.84.8
Nitrogen (wt.%)1.751.561.321.902.603.6
Sulfur (wt.%)0.0230.0160.031.600.3025.6
Chlorine (wt.%)0.000.000.00---
Oxygen a42.2741.4040.69---
HHV (MJ/kg)22.3421.2222.80-21.117.1
a by difference.
Table 3. FTIR functional group compositions of biochar.
Wave Number (cm−1)Wave Number (cm−1)GroupClass of Compound
3200–36003549, 3784O–H bondedAlcohol and phenols
2852–29602927C–H stretchingAlkane
1400–16001436–1595C–C stretchingAromatic
1300–9501035, 1041, 1112C–O stretching
O–H bending
Primary, secondary and tertiary alcohols, phenols, esters and ethers
790–830792C–H bending1,4-disubstituted
Table 4. EDX analysis of the biochar at 400 °C (wt.%).
Element NumberElement SymbolElement NameAtomic Conc.Weight Conc.
6CCarbon63.9241.50
8OOxygen21.3918.50
7NNitrogen5.714.32
15PPhosphorus2.504.18
12MgMagnesium2.373.11
79AuGold2.3124.65
19KPotassium1.683.55
14SiSilicon0.130.19
Table 5. EDX analysis of the biochar at 450 °C (wt.%).
Element NumberElement SymbolElement NameAtomic Conc.Weight Conc.
6CCarbon72.2247.45
8OOxygen16.4114.36
7NNitrogen5.694.36
79AuGold2.6328.33
20CaCalcium1.262.76
14SiSilicon0.781.20
15PPhosphorus0.430.73
13AlAluminum0.320.48
12MgMagnesium0.250.34
26FeIron0.000.00
Table 6. EDX analysis of the biochar at 500 °C (wt.%).
Element NumberElement SymbolElement NameAtomic Conc.Weight Conc.
6CCarbon87.8953.27
8OOxygen4.083.29
79AuGold4.0340.03
7NNitrogen3.372.38
14SiSilicon0.390.55
19KPotassium0.240.47
Disclaimer/Publisher’s Note: The statements, opinions and data contained in all publications are solely those of the individual author(s) and contributor(s) and not of MDPI and/or the editor(s). MDPI and/or the editor(s) disclaim responsibility for any injury to people or property resulting from any ideas, methods, instructions or products referred to in the content.

