Article

Study of a Novel Hybrid Refrigeration System, with Natural Refrigerants and Ultra-Low Carbon Emissions, for Air Conditioning

1
Institute of Refrigeration and Cryogenics, Zhejiang University, Hangzhou 310027, China
2
Zhejiang Shike Auto Parts Co., Ltd., Lishui 323799, China
*
Author to whom correspondence should be addressed.
Energies 2024, 17(4), 880; https://doi.org/10.3390/en17040880
Submission received: 2 January 2024 / Revised: 31 January 2024 / Accepted: 6 February 2024 / Published: 14 February 2024

Abstract

:
Due to its environmental benefits, CO2 shows great potential in refrigeration systems. However, a basic CO2 transcritical (BCT) refrigeration system used for airconditioning in buildings might generate massive indirect carbon emissions for its low COP. In this study, a novel CO2 transcritical/two-stage absorption (CTTA) hybrid refrigeration system is broadly investigated, and both energy efficiency and life cycle climate performance (LCCP) are specifically engaged. The theoretical model shows that optimal parameters for the generator inlet temperature (TG2), intermediate temperature (Tm), and discharge pressure (Pc), exist to achieve maximum COPtol. Using the LCCP method, the carbon emissions of the CTTA system are compared to six typical refrigeration systems by using refrigerants, including R134a, R1234yf and R1234ze(E) etc. The LCCP value of the CTTA system is 3768 kg CO2e/kW, which is 53.6% less than the BCT system and equivalent to the R134a system. Moreover, its LCCP value could be 3.4% less than the R1234ze(E) system if the COP of the CO2 subsystem is further improved. In summary, the CTTA system achieves ultra-low carbon emissions, which provides a potential alternative to air conditioning systems in buildings that can be considered alongside R1234yf and R1234ze(E) systems.

1. Introduction

In the past few years, energy consumption in the building sector has exploded as a result of urbanization and economic development. According to the International Energy Agency, global final energy consumption will increase by 60% in the building sector, bringing corresponding environmental challenges, such as carbon emissions [1]. Air conditioning is an essential addition to most commercial buildings, although it is more widely used in residences. However, such systems consume large amounts of power and generate massive carbon emissions. Air conditioning systems and heat pumps account for about 7.8% of global carbon emissions [2]. Environmental concerns and the development of low carbon emission buildings have led to restrictions on widely used high GWP refrigerants such as R134a, which pose serious challenges to the transformation and upgrading of the air conditioning industry and buildings. Environmentally friendly refrigerants with high energy efficiency have attracted attentions as a way to reduce carbon emissions [3]. As alternative refrigerants, R32, R1234yf, R1234ze(E), R513a, R450a, R744a (N2O) and R744 (CO2), have been gradually investigated by those with an interest in developing refrigeration systems for air conditioning. The main properties of these refrigerants are listed in Table 1.
Compared to a R134a system, the study of R32 refrigeration systems showed a 5–7% increase in COP [5]. The GWP of R32 is relatively high, and so more environmental-friendly refrigerant alternatives are expected to emerge and take its place. R1234yf and R1234ze(E) have been suggested as promising refrigerants for their extremely low GWP and excellent thermal properties, despite their relatively high cost [6]. Joaquin et al. conducted a theoretical and experimental study of a R1234yf refrigeration system with internal heat exchanger (IHX) [7]. Although the IHX improved the COP by 2–6%, the COP of the R1234yf system was still 6–13% lower than that of the R134a system in air conditioning conditions. Considering the GWP of the refrigerant and its system COP, both R513a (a mixture of R134a and R1234yf) and R450a (a mixture of R134a and R1234ze(E)) have been considered as alternatives to R134a, as they both have similar thermal properties and relatively low GWP that have been studied. And carbon emissions have, over the life cycle of the system, been increasingly used to assess the environmental impacts [8]. A substitution study of R450a and R513a showed that R513a had a slightly higher COP than the R450a system for air conditioning [2,9]. Compared to the R134a system, their direct carbon emissions were reduced by 50–52% for lower GWP and less refrigerant leakage. The carbon emissions of refrigeration systems during their life cycle need to be considered by referring to several sources, such as refrigerant leakage, electricity consumption and manufacturing processes, etc.
The International Institute of Refrigeration (IIR) developed the life cycle climate performance (LCCP) method to evaluate all the direct and indirect carbon emissions of a refrigeration system during its life cycle [10], and it is widely used in comparisons between different refrigerants or refrigeration systems [11,12]. In the literature [2,9], when the carbon emissions generated by energy consumption are taken into account, the carbon emissions of the R513a system are equivalent to the R134a system, while the R450a system is 4.8% higher. In the transformation and upgrading of air conditioning systems, it is essential to not only focus on the use of 0 ODP and low GWP refrigerants, but to also obtain advantages, in terms of life cycle carbon emissions. The above studies imply that refrigerant alternatives are still confronted by challenges, and that the development of new alternative refrigeration will be an essential priority for future research.
Natural refrigerants have received widespread attention in the research of air conditioning systems. Of them, CO2 (R744) is recognized as a non-flammable and non-toxic attractive option, with superior properties such as extremely low GWP, low production cost, and high thermal conductivity [13]. Because of a relatively low COP, a basic CO2 transcritical (BCT) refrigeration cycle has still not been adapted for air conditioning in buildings. Researchers have paid attention to the parameter optimization and cycle innovation of CO2 transcritical refrigeration systems. Zheng et al. studied the CO2 mass migration and distribution of an air conditioning system and found that an appropriate charge could improve the COP by 10.1% [14]. In a subcooler-based CO2 transcritical system, it was found that optimizing compressor discharge pressure increased the COP by 8.8% [15]. Moreover, advanced cycles have been found to significantly affect the improvement of COP. A CO2 ejector refrigeration cycle for air conditioning proposed by Lawrence et al. improved the COP by 20% [16]. Tashtoush et al. proposed an ejector-cascade refrigeration cycle for air conditioning; when compared to the BCT cycle, this new cycle improved the COP by 30% [17,18]. From an environmental perspective, the improvement in COP shows the potential of CO2 refrigeration in low carbon buildings. An energy and environmental analysis of a CO2 heat pump system shows that its COP competes with a R134a system, reducing total carbon emissions by 52.05%, while maintaining a lower COP in cooling mode [19]. A further study of the air conditioning performance of CO2 refrigeration systems is however necessary.
Input power converted to high temperature heat at the outlet of the gas cooler is one of the limitations leading to low COP, and the high temperature heat might need to be recovered. Efficient absorption refrigeration systems have the advantage of low-grade heat recovery and use natural refrigerants as well. Hybrid refrigeration systems that combine absorption and vapor compression refrigeration systems have the potential to improve overall energy efficiency and reduce carbon emissions. Chan et al. developed a hybrid system for cooling by driving an absorption refrigeration system with condensing heat recovery, resulting in a 53% reduction in carbon emissions [20]. Similarly, Jain et al. developed a vapor compression-absorption hybrid refrigeration system, with power consumption 170.4% lower than a vapor compression system [21]. Andrej et al. used the heat from the CO2 compressor outlet to drive an adsorption chiller [22]. The hybrid system showed 22% annual energy savings. These studies suggest that coupling a CO2 transcritical refrigeration system with an absorption refrigeration system may lead to a reduction in overall carbon emissions, and also that the application of CO2 to air conditioning in low carbon buildings shows promise.
In our previous work, thermodynamic analyses of a two-stage absorption/transcritical hybrid refrigeration system was conducted [23]. The high-pressure generator of the absorption subsystem is driven by the waste heat from the gas cooler outlet. The hybrid system converts waste heat as low as 45–55 °C into useful cooling of 7 °C, and uses a rational coupling method to recover the gas cooler waste heat with the absorption system. Further research should investigate the potential of the low-pressure generator to recover the waste heat and carbon emission reductions.
In this study, a novel CO2 transcritical/two-stage absorption (CTTA) hybrid refrigeration system for air conditioning is conducted on the basis of both COP and LCCP value. A simulation model of the CTTA system is established and calculated by EES [24] and the effects of key parameters on the COP are analyzed. Its carbon emissions are evaluated by using the LCCP method and are then compared with six typical refrigeration systems by using R744 (CO2), R134a, R32, R450a, R513a, R1234yf, and R1234ze(E) as refrigerants, respectively. Finally, the potential LCCP values of the CTTA system are estimated to demonstrate the prospect it can be applied to low carbon emission buildings in the future.

2. Descriptions of the CTTA System and Theoretical Model

2.1. Descriptions of the CTTA System

Based on the previous investigations [23], further modification is adopted and a new CO2 transcritical/two-stage absorption (CTTA) hybrid refrigeration system for air conditioning is proposed, which also mainly consists of two subsystems, namely the two-stage absorption refrigeration subsystem and the CO2 transcritical refrigeration sub-system, as shown in the schematic of Figure 1. Its main components contain generator1 (G1), condenser (C), throttling valve 1 (TV1), condensing subcooler (CS), absorber1 (AB1), solution pump 1 (SP1), solution heat exchanger 1 (SHX1), TV2, G2, TV3, evaporator (E), AB2, SP2, SHX2, TV4, compressor (COMP), gas cooler (GC), IHX and TV5. Furthermore, its P-T diagram is shown as Figure 2. From the P-T diagram, it is easy to find the main difference between the new system and the previous one [23], where the two-stage absorption refrigeration system is depicted with a dotted line. There is important difference in the process of the CO2 transcritical refrigeration subsystem for the new system, where the discharged heat at high pressure of the CO2 transcritical refrigeration subsystem not only involves G1 but also G2, and the discharged heat at an extended temperature range is effectively utilized to generate refrigeration without external input heat. As a result, the energy efficiency of the input power to refrigeration is obviously lifted. Accordingly, involved thermodynamic states obviously change, as shown in Figure 2. For example, a decrease in the intermediate pressure of the absorption refrigeration subsystem results in an increase in the concentration of the concentrated solution in G2 and the dilute solution in G1. Consequently, the decrease in the generation temperature of G2 (TG2) in similar operating conditions demonstrates the good potential for exhaust heat from the CO2 subsystem to be utilized. Similarly, there is an increase in the concentration difference at G2, while the concentration difference at G1 decreases.
CO2 transcritical refrigeration subsystem: In COMP, CO2 is compressed into high-temperature and high-pressure steam (state point 21). It then enters G1 and a large amount of heat is transferred to the LiBr solution (state point 22). The outlet temperature of CO2 at G1 is still high enough to enter G2 and transfer the heat to the LiBr solution (state point 23). After the temperature of CO2 is further reduced at G2, it enters the GC to get cooled (state point 24), before entering IHX for heat exchange with the vapor from E (state point 25). CO2 is throttled by TV5 (state point 26) and then enters CS and IHX for heat absorption (state point 28). Finally, CO2 is compressed by COMP to complete the transcritical refrigeration cycle.
Water working cycle: Heat exchange between LiBr solution and CO2 in G1 generates high-temperature and high-pressure water vapor (state point 1). The vapor is cooled by water in C and is throttled by TV1 to CS. Similarly, the LiBr solution in G2 generates high-temperature and high-pressure vapor after absorbing exhaust heat from the outlet of G1 (state point 5). The water vapor goes directly into CS, mixes with water vapor from G1, and exchanges heat with CO2. The liquid refrigerant in the condensing subcooler (state point 6) is throttled by TV3 and then enters E (state point 7) for heat absorption and producing refrigeration capacity, before entering AB2 (state point 8) and being absorbed by the concentrated solution. The refrigerant vapor (state point 4) then enters AB1 and is absorbed by the concentrated solution.
Solution working cycle: After the LiBr solution’s concentration increases in G1 (state point 12), it enters SHX1 and is cooled (state point 13) through TV 2 (state point 14), then enters AB1m, absorbing water vapor into a dilute solution (state point 9); after this, it then enters into the SHX1 (state point 10) and exchanges heat with concentrated solution from G1, before finally being returned to G1 (state point 11).

2.2. Construction of the Simulation Model

Herold established a steady-state model for a single effect absorption refrigeration system, which uses LiBr-H2O as the working fluids [25]. The model worked on the assumptions that there was only condensing and evaporation pressure in the entire system and the working fluids in the generator and absorber were in a state of equilibrium. He et al. established a thermodynamic model of a hybrid system of liquid desiccant and CO2 transcritical cycles [26], and used a similar approach to establish a steady-state simulation model of the CTTA system. The process of simulation is as follows: first, establish a mathematical model for each component of the system and verify the model. Then, combine these models under the designed working conditions. The design conditions of the CTTA system are listed in Table 2. Finally, the input parameters are changed sequentially to analyze the CTTA system performance.
In the simulation process, the system is assumed to be steady-state and several assumptions are made to simplify the model:
  • The water vapor mass flow rates from G1 and G2 are equivalent to the mass flow rates from AB1 and AB2, respectively.
  • The power consumption of the solution pumps is not factored into the analysis.
  • All throttling processes are assumed to be isenthalpic.
  • The outlet solution from the generator and absorber is saturated.
  • The heat loss along the pipeline is disregarded.
  • The pressure drop in the pipes and heat exchangers of the absorption subsystem is negligible.
  • The isentropic efficiency of the compressor is taken as 0.8.
  • The outlet solution temperature of the generator is the generation temperature and the outlet dilute solution temperature of the absorber is the absorption temperature.
Based on the above assumptions, the control equations for each component are as follows:
G 1 :   m ˙ 1 h 1 + m ˙ 12 h 12 = m ˙ 11 h 11 + Q G 1
Q G 1 = m ˙ 21 h 21 m ˙ 22 h 22
m ˙ 11 = m ˙ 1 + m ˙ 12
m ˙ 11 x 11 = m ˙ 1 x 1 + m ˙ 12 x 12
C :   m ˙ 1 h 1 = m ˙ 2 h 2 + Q c
m ˙ 1 = m ˙ 2
TV 1 :   m ˙ 2 h 2 = m ˙ 3 h 3
m ˙ 2 = m ˙ 3
AB 1 :   m ˙ 4 h 4 + m ˙ 14 h 14 = m ˙ 9 h 9 + Q AB 1
m ˙ 4 + m ˙ 14 = m ˙ 9
m ˙ 4 x 4 + m ˙ 14 x 14 = m ˙ 9 x 9
SP 1 :   m ˙ 10 h 10 = m ˙ 9 h 9 + W SP 1
m ˙ 9 = m ˙ 10
SHX 1 :   m ˙ 12 h 12 m ˙ 13 h 13 = m ˙ 11 h 11 m ˙ 10 h 10
m ˙ 10 = m ˙ 11
m ˙ 12 = m ˙ 13
TV 2 :   m ˙ 13 h 13 = m ˙ 14 h 14
m ˙ 13 h 13 = m ˙ 14 h 14
G 2 :   m ˙ 18 h 18 + m ˙ 5 h 5 = m ˙ 17 h 17 + Q G 2
m ˙ 18 + m ˙ 5 = m ˙ 17
m ˙ 18 x 18 + m ˙ 5 x 5 = m ˙ 17 x 17
TV 3 :   m ˙ 6 h 6 = m ˙ 7 h 7
m ˙ 6 = m ˙ 7
E :   m ˙ 8 h 8 = m ˙ 7 h 7 + Q E
m ˙ 8 = m ˙ 7
AB 2 :   m ˙ 8 h 8 + m ˙ 20 h 20 = m ˙ 15 h 15 + Q AB 2
m ˙ 8 x 8 + m ˙ 20 x 20 = m ˙ 15 x 15
m ˙ 8 + m ˙ 20 = m ˙ 15
SHX 2 :   m ˙ 18 h 18 m ˙ 19 h 19 = m ˙ 17 h 17 m ˙ 16 h 16
m ˙ 16 = m ˙ 17
m ˙ 18 = m ˙ 19
TV 4 :   m ˙ 19 h 19 = m ˙ 20 h 20
m ˙ 19 = m ˙ 20
COMP :   m ˙ 21 h 21 = m ˙ 27 h 27 + W c
m ˙ 21 = m ˙ 27
GC :   m ˙ 22 h 22 m ˙ 23 h 23 = Q GC
m ˙ 22 = m ˙ 23
IHX :   m ˙ 23 h 23 m ˙ 24 h 24 = m ˙ 27 h 27 m ˙ 26 h 26
m ˙ 23 = m ˙ 24
m ˙ 26 = m ˙ 27
TV 5 :   m ˙ 24 h 24 = m ˙ 25 h 25
m ˙ 24 = m ˙ 25 ,
CS :   m ˙ 3 h 3 + m ˙ 5 h 5 = m ˙ 4 h 4 + m ˙ 6 h 6 + m ˙ 26 h 26 m ˙ 25 h 25
m ˙ 25 = m ˙ 26
m ˙ 3 + m ˙ 5 = m ˙ 4 + m ˙ 6
The thermal properties of the LiBr-H2O pair are vital for calculating the performance of the absorption refrigeration subsystem. Mcneely carried out several studies of the thermal properties of the LiBr solution and produced empirical formulas for computing its thermal properties [27]. The formula applies to a concentration range of 0% to 70% and a temperature range of 4.4 °C to 121 °C. Therefore, the thermal properties of the LiBr solution reference Mcneely’s study, and the equations used to calculate the thermal properties of H2O are taken from IAPWS-95 [28]. The thermal property of CO2 is calculated by using correlations proposed by Span and Wagner in 1996 [29]. The heat transfer of the refrigerant in the absorption refrigeration subsystem is calculated by drawing on correlations from the literature [30]. The heat transfer of CO2 in smooth tubes is calculated by using the correlation given by Pital and the pressure drop is calculated by using the correlation given by Wang [31,32]. The heat transfer of CO2 in the boiling zone is calculated by using the correlation given by Wattelet-Carle and the pressure drop is calculated according to the correlation given by Lockhart-Martinelli [33,34].
Various evaluation criteria have been proposed by researchers for hybrid refrigeration systems. In this context, two criteria are used. C O P t o l represents the overall coefficient of performance of the CTTA system, which is the ratio of the total refrigeration capacity ( Q e , kW) to the mechanical work ( W , kW) consumed by COMP.
C O P t o l = Q e / W
Another evaluation criterion, C O P c h , is proposed to evaluate the performance of a conventional hybrid refrigeration system, where the generators are not coupled to GC. Where C O P a represents the C O P that a conventional two-stage absorption refrigeration system can achieve under the same operating conditions, without coupling a CO2 system
C O P ch = Q e ( Q G 1 + Q G 2 ) C O P a / W
To compare the environmental advantages of the CTTA system, the direct and indirect carbon emissions of the system are calculated by using the L C C P method.
L C C P = D i r e c t   E m i s s i o n s + I n d i r e c t   E m i s s i o n s
D i r e c t   e m i s s i o n s are the effects of refrigerants released into the atmosphere over the lifetime of the unit and afterwards. It is calculated in kg CO2e/kW, as the ratio of Direct emissions to the total refrigeration capacity:
D i r e c t   E m i s s i o n s = C r ( L A L R + E O L ) ( G W P + A d p . G W P ) / Q e
I n d i r e c t   c a r b o n   e m i s s i o n s account for all other sources of power generation, material manufacturing, and equipment disposal during the life cycle. It is calculated in kg CO2e/kW, as the ratio of Indirect emissions to the total refrigeration capacity:
I n d i r e c t   E m i s s i o n s = L A E C E M + ( M M M ) + ( m r R M ) + C r ( 1 + A L R ) R F M + C r ( 1 E O L ) R F D

3. Validation of the Performance Simulation Model

Based on the simulation models and the designing working conditions, the structure parameters of each component used in the CTTA system are listed in Table 3. The simulation models of the CTTA system are solved by using EES, RefProp and Matlab/Simulink programs, and are validated by using experimental data from the literature [35,36].
In a hybrid refrigeration system, theoretical model verification is conducted separately for subsystem models; for example, Mohammadi validated the proposed hybrid system of CO2 transcritical system and an absorption system separately [37]. The calculated results are in agreement with the published data and the difference is within the permitted limits. The same validation approach is adopted by Farsi et al. for a hybrid system, which consists of a CO2 transcritical system and multi-effect desalination system [38]. The calculated results are in agreement with the validation data, and the maximum diversity is 6.6% in similar working conditions. The preceding results show that the hybrid system models can be verified by individual verification of the subsystems.
In this context, the simulation results of the absorption refrigeration subsystem are compared to the published experimental data in the literature [21,39] , respectively. The convergence accuracy of the model is set as 0.5%. Figure 3 compares the COP and the Qe to [21,39]. The simulation results and the experimental data show good agreement. The simulation results of the COP (COPsim) are 4~6% higher than that of the experiment (COPexp). The simulation results of the Qe,sim are 1~4% higher than the Qe,exp. The neglect of the heat leakage of each heat exchanger and other relevant factors in the simulation processes induces the deviation.
Comparisons of the experimental data and the calculation show the maximum deviation is calculated at 8.6%, and the average deviation is calculated at 4.5%, which implies the reliability of the chosen empirical correlations and the simulation models of the CO2 subsystem. On the basis of the validation results of each subsystem, we also conclude the simulation models of the CTTA system show an ability to predict main performance and characteristics.

4. Results and Discussion

The performance of the transcritical refrigeration subsystem is first compared by using CO2he and N2O as refrigerants. TG1 and TG2 are 55 °C and 52 °C, respectively, and other operating parameters are the same as those listed in Table 2.
As shown in Figure 4, both COPtol and COPch of the N2O subsystem decrease with the increase of discharge pressure (Pc), while the CO2 subsystem first increases and then decreases because of its thermal property change near the critical point. As the exhaust pressure increases, both the power consumption and the cooling capacity of the transcritical subsystem increase. At the same time, the increase in the cooling capacity of the transcritical subsystem causes the water vapor to be gradually and completely condensed in the condensing subcooler, resulting in an increase in the cooling capacity of the CTTA system. Since the CTTA system consists of a coupled two-stage absorption refrigeration subsystem and a transcritical heat pump subsystem, it is driven by both external low-grade energy and mechanical work. When the Pc is higher than the optimal value for this operating condition, the cooling capacity generated by the input mechanical work is increasing, leading to a decrease in the COP of the CTTA system.
COP using CO2 is higher than that using N2O when the discharge pressure is higher than 8.3 MPa and the GWP of N2O is higher than CO2. So the novel hybrid system uses CO2 as the refrigerant and the simulation is carried out in different working conditions, and the other designing parameters are the same as those listed in Table 2.
In order to analyze the COP improvement of the hybrid system, a BCT refrigeration system with IHX previously examined by Zhang et al. is used as a comparison [40]. The maximum COP obtained for this BCT system is 2.75 when the TE is 10 °C, the gas cooler outlet temperature is 20 °C, and the Pc is 10 MPa; in this study, it is named COPt.
CS is a key component of the CTTA system that was introduced in our previous study [
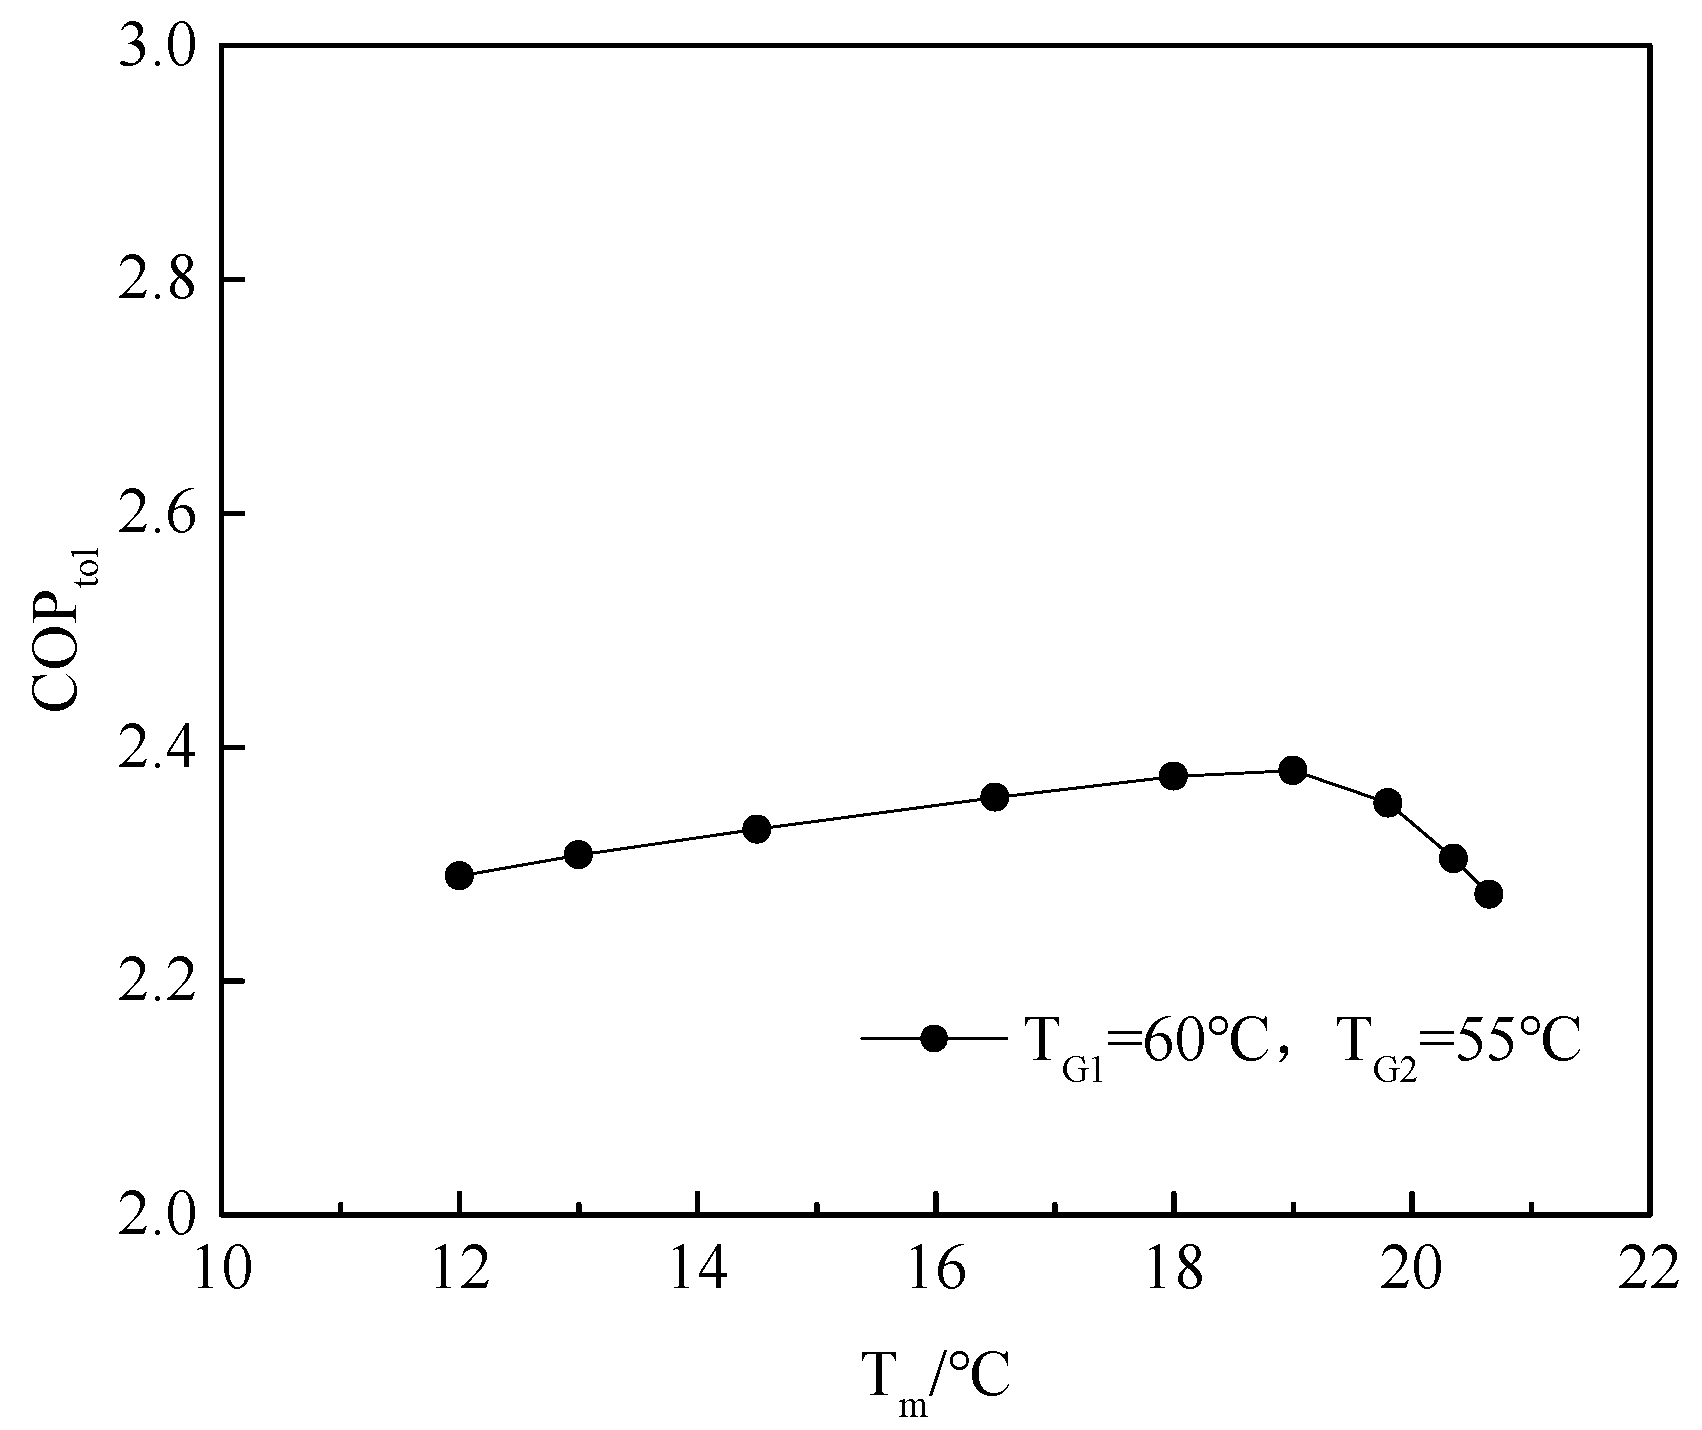
23]. The effect of Tm on COPtol is first investigated, and the results are shown in Figure 5. The other parameters are the same as those of the design conditions. Figure 5 shows that there is a maximum COPtol , which occurs with the increase of Tm. The optimal value of Tm is 19 °C and the maximum COPtol is 2.38, which is 4.4% higher than the minimum COPtol. The absorption pressure of AB1 decreases with the increase of Tm. The concentration of the dilute solution at the outlet of AB1 decreases when the absorption temperature is constant, so it can be driven by a lower temperature at the same generation pressure. The concentration of dilute solution entering G2 remains unchanged but the generation pressure decreases, making both TG2 and TG1 increase. CS is the evaporator for the CO2 transcritical subsystem. With the increase of Tm, the power consumption of COMP is gradually reduced, and the performance of the CO2 transcritical subsystem is then improved. Adjusting Tm is beneficial for reducing the input temperature of G1 and G2, which means more discharge heat can be recovered by a two-stage absorption refrigeration system. In a word, Tm has a significant impact on the performance of the CTTA system, and so it is necessary to match Tm reasonably.
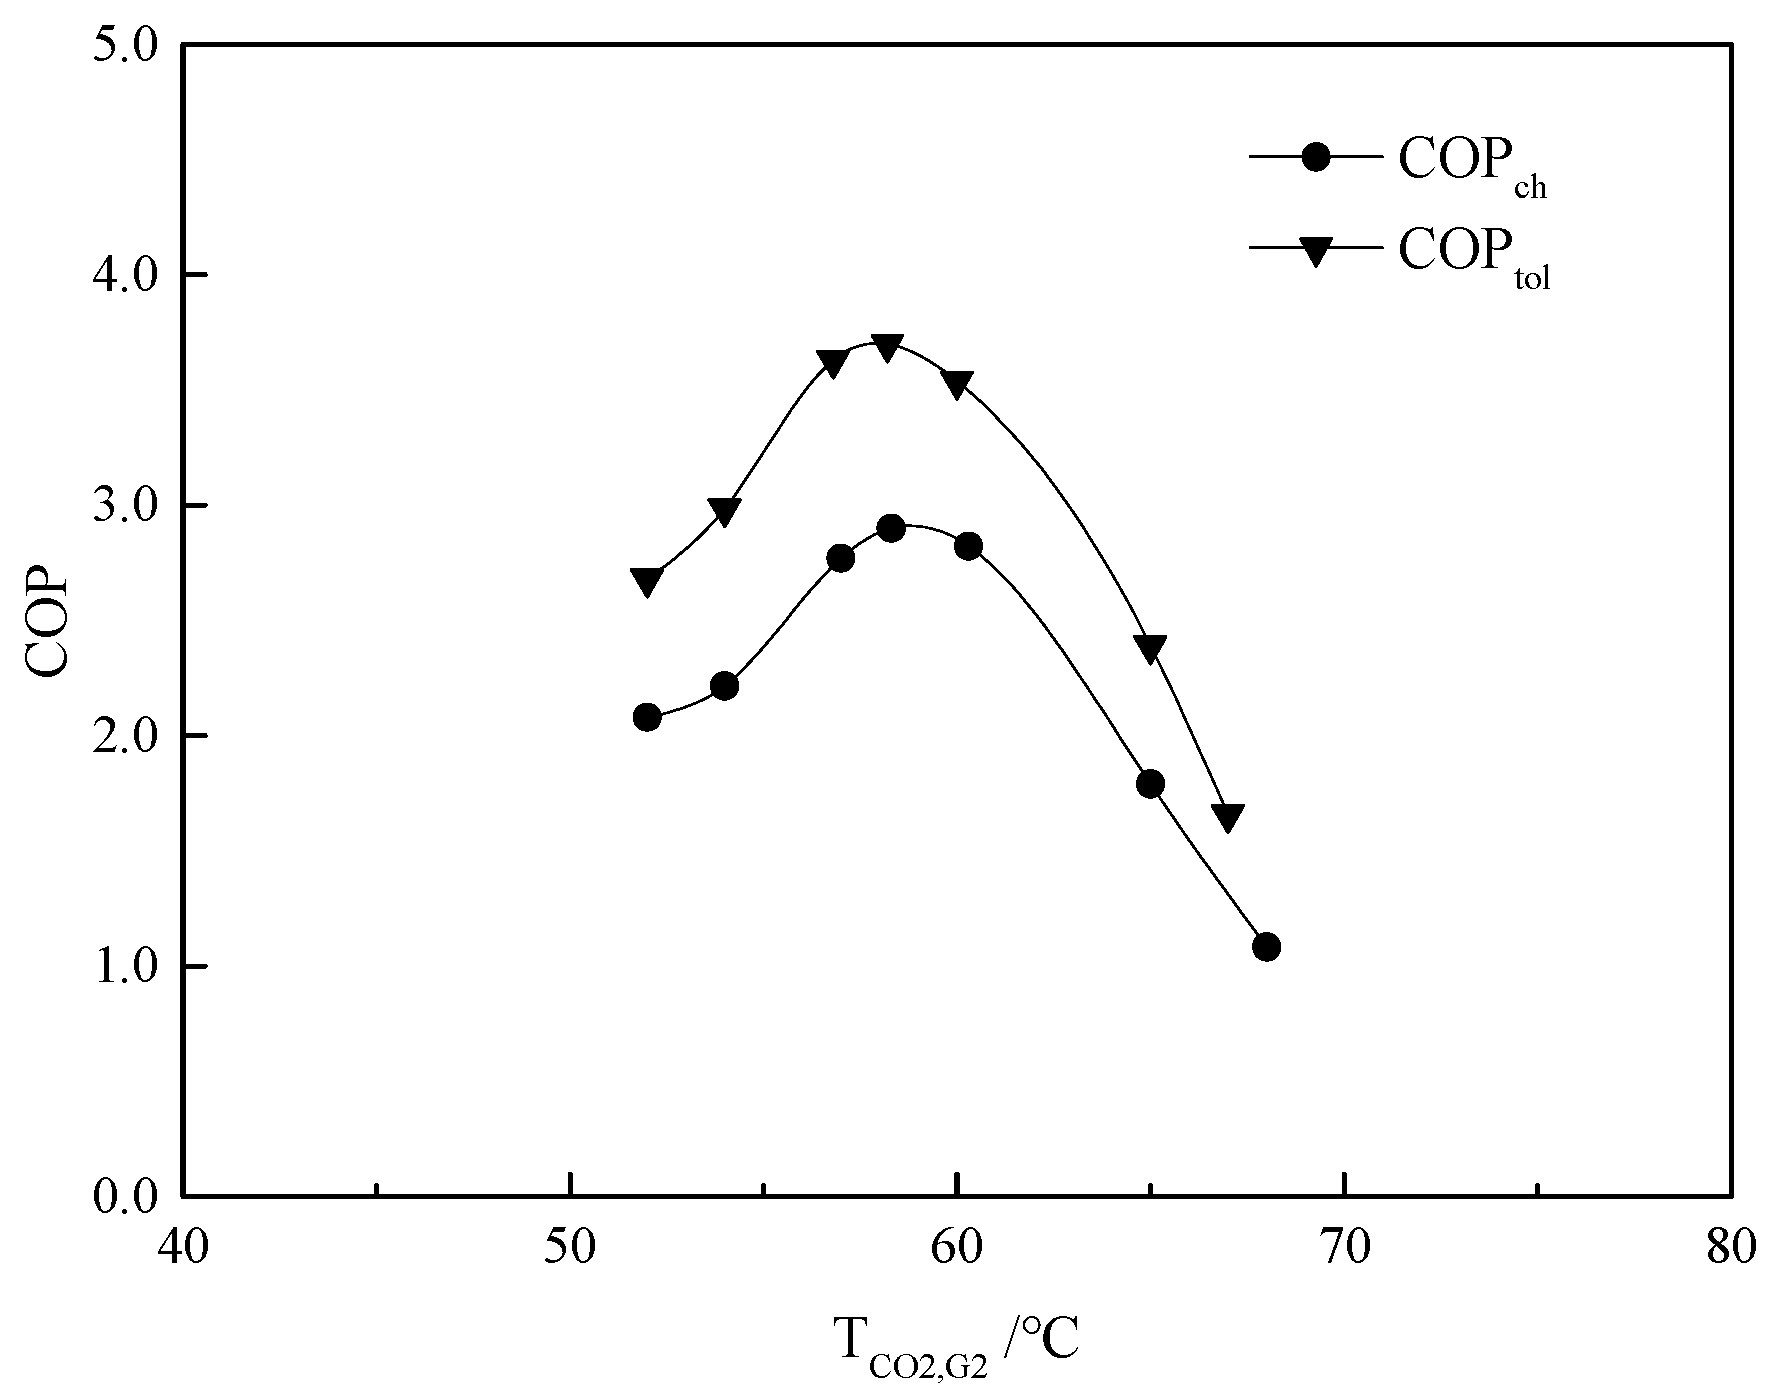
Figure 6 shows the effects of TG2 on COPtol and COPch, while the other parameters are the same as in the design conditions mentioned above. It can be seen that the CTTA system has an optimal value of TG2 in the obtaining of high COP. The maximum value of COPtol and COPch is 3.70 and 2.90, respectively, when TG2 is 58 °C. The mass flow rate of water vapor generated at G2 increases with the increase of TG2, so the refrigeration capacity increases, which leads to an increase in COPch and COPtol. With the further increase of TG2, the water vapor cannot be totally condensed at CS. Thus, the outlet quality in CS gradually increases after the mixture process, which leads to the increase of throttling loss at TV3. COPtol and COPch then decline. Meanwhile, the traditional absorption refrigeration system cannot work normally when the generation temperature is below 58 °C. The refrigeration capacity is entirely generated by the input mechanical work, and so COPch increases. When TG2 is higher than 58 °C, the refrigerating capacity generated by the absorption system gradually increases, leading to the rapid decline of COPch. The maximum COPtol is 27.6% higher than the maximum COPch, and 34.5% higher than COPt, which shows the advantage of utilizing the exhaust heat of GC.
The effects of TE on COPch and COPtol are depicted in Figure 7, while the other parameters are the same as design conditions. COPch and COPtol keep rising as TE increases. The maximum COPtol is 3.84 which is 21.5% higher than COPch, and 39.6% higher than COPt. TE causes the increase in the concentration difference of solutions in AB2, which leads to the increase of the mass flow rate of refrigerant in G2 and the refrigeration capacity in E. Therefore, the performance of the absorption refrigeration subsystem rises first, and COPtol increases as well. However, when TE is higher than 6 °C, more water vapor is generated; this vapor cannot be totally condensed in CS, so the quality of CS at the outlet gradually increases after the mixture process, which leads to the increase of throttling loss at TV3. Thus, the performance of the absorption refrigeration subsystem decreases and the slope of the COPtol curve goes down.
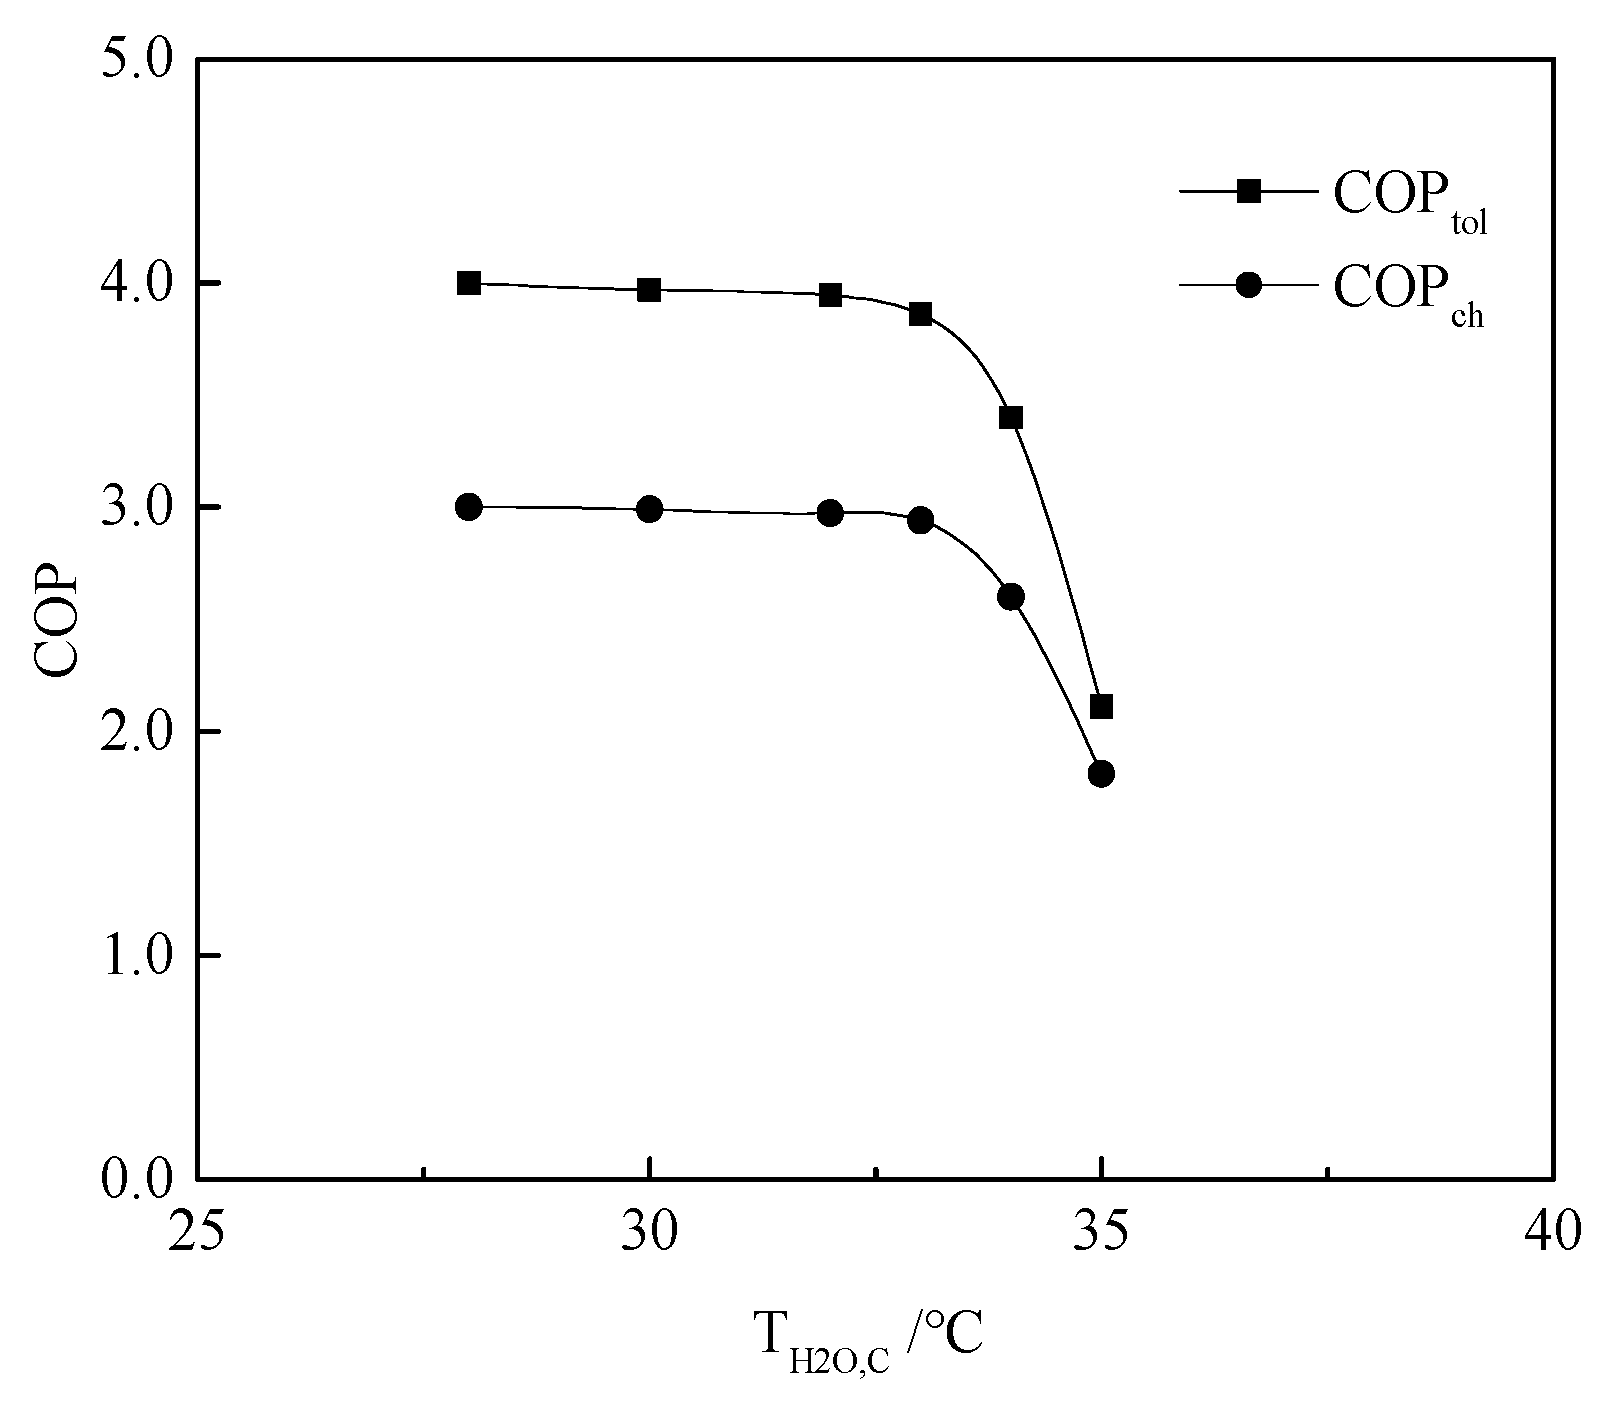
The effects of TC are shown in Figure 8, while the other parameters are the same as those of the design conditions. With the increase of TC, the heat transfer efficiency in C decreases, which causes an increase in refrigerant quality at C outlet and CS. Then, the refrigeration capacity declines and the performance of the absorption subsystem decreases. Meanwhile, the conventional two-stage absorption refrigeration system cannot be driven when TG2 is lower than 60 °C. The increase of TC will reduce the performance of the CO2 transcritical subsystem, and the COPch shows a similar trend with COPtol. The maximum COPtol is 4.01 and COPch is 3.01 in the TC of 28 °C. The maximum COPtol is 33.2% higher than COPch, and 45.8% higher than COPt.
The effects of TAB on COPch and COPtol are illustrated in Figure 9, and the other parameters are the same as the design conditions. The heat load on the refrigeration water side of the absorber decreases due to the increase of TAB, which causes the vapor flow from G1 and G2 to decrease. Therefore, the refrigeration capacity of the CTTA system is reduced and COP decreases with the increase of TAB. But because the vapor generated by G1 and G2 can be completely condensed in CS, the throttling loss of the system is reduced. In addition, the decrease of the vapor flow rate will also enhance the heat transfer efficiency of heat exchangers. Therefore, when TAB is below 28 °C, the COPtol is still high; when TAB is greater than 28 °C, the system performance starts to decrease; and when TAB is below 28 °C, the generation temperature is low, so the COPa is 0 and the COPch decreases with the increase of TAB. The maximum COPtol of 3.78 and the maximum COPch of 3.02 are obtained at TAB of 28 °C.
The effects of Tair on COPch and COPtol are shown in Figure 10, while the other parameters are consistent with the design conditions. As Tair increases, an optimal value of Tair exists, that can be used to obtain the maximum COP. The temperature of CO2 at the GC outlet increases as Tair rises, resulting in increases of TG1 and TG2. So the performance of the absorption subsystem is increased first. In the CO2 transcritical subsystem, the increase in Tair causes the temperature of CO2 at the outlet of GC to increase, resulting in a decrease in CO2 flow rate, refrigeration capacity, and COP of the CO2 transcritical subsystem. There is therefore an optimal Tair to maximize the COPtol. For COPch, an increase in Tair leads to a temperature increase in CS; an optimum value of Tm also exists, so the COPch increases first and then decreases. The optimal value of Tair is 58 °C, when the maximum COPch is 3.32 and the maximum COPtol is 4.32, which is 30.1% higher than COPch.
The effects of Pc on COPch and COPtol are displayed in Figure 11, while the other parameters are the same as the design conditions. There is also an optimal value for Pc to maximize system performance. Both the power consumption and the refrigeration capacity of the CO2 transcritical subsystem increase as Pc increases. The increase in refrigeration capacity of the CO2 transcritical subsystem allows the water vapor to be completely condensed in CS, resulting in an increase in the refrigeration capacity of the absorption subsystem. When Pc is lower than the optimal value, the refrigeration capacity contributed by the absorption subsystem is relatively high, so COPtol gradually increases. And when Pc is higher than the optimal value, the refrigeration capacity generated by the CO2 transcritical subsystem input mechanical work increasingly becomes larger, leading to a reduction in the performance of the CTTA system. The optimal value of Pc is 9.1 kPa when the maximum COPtol is 4.18 and the corresponding COPch is 3.32.
The determination of the optimal parameters is essential to improve the performance of the CTTA system and reduce its carbon emissions. In the three optimal operating conditions of Figure 6, Figure 10 and Figure 11, COPtol improved by 34.5–57.1% over COPt. The coupling method to GC is the major difference between the CTTA system and the conventional hybrid refrigeration system. Optimizing Tair can improve 27.6% of the COPtol, compared to COPch, while optimizing TG2 can improve 13.2%. The highest COPtol of 4.32 indicates that the proposed coupling method provides a significant improvement when compared to conventional hybrid systems, and accordingly will result in a lower carbon emission of the refrigeration system, making the application of CO2 to air conditioning in low carbon emission buildings more competitive.
To demonstrate the potential of the CTTA system to contribute to air conditioning in low carbon emission buildings, the LCCP method is used to compare the CTTA system with a BCT system and seven conventional refrigeration systems that use CO2, R134a, R32, R450a, R513a, R1234yf, and R1234ze(E), respectively. The coefficients required in the calculation of the LCCP values are obtained from the IIR guidelines [10], and the COP reference values for each system are obtained from the literature [40,41,42,43,44]. The main data required for the calculations are listed in Table 4. And the calculation results are shown in Table 4 and Figure 12.
As seen in Figure 12, systems with low GWP refrigerants all show a considerable reduction in direct carbon emissions, when compared to R134a systems. Direct carbon emission of the BCT system, for example, is comparable to the R1234yf and R1234ze(E) systems, and is seen to be significantly reduced when compared to the R134a and R32 systems. It shows that CO2 used for air conditioning has a huge advantage in direct carbon emissions, compared to other low GWP refrigerants. Indirect carbon emissions account for the largest share of the LCCP value, of which carbon emissions generated from power generation are the main cause.
The BCT system has the highest LCCP value of 5788 kg CO2e/kW, as its COP is much lower than the other systems. It also shows that the BCT system for air conditioning is still confronted by challenges. The R134a system already has a high COP at present, so its indirect emissions are 40% lower than the BCT system. But the higher GWP of the refrigerant also makes its LCCP value higher than the other systems. With a higher COP, the CTTA system has an LCCP value of 3768 kg CO2e/kW, which is not only 53.6% lower than the BCT system, but also lower than the R134a system, which shows the potential of the CTTA system for air conditioning. R450a and R513a still have higher GWP, and their direct carbon emissions are 400% higher than that of the CTTA system. The R1234yf and R1234ze(E) systems, which also have extremely low GWP, have the lowest LCCP values , 18% and 20% lower than the CTTA system, respectively, which is because their COP is also higher. The LCCP values of the R32, R450a and R513a systems are reduced compared to the R134a system, but are slightly higher than the R1234yf and R1234ze(E) systems. From the perspective of the LCCP value, the CTTA system achieves ultra-low carbon emissions (compared to conventional BCT systems), greatly improves competitiveness when using CO2 for air conditioning, and also has the advantages of natural refrigerants. In order to underscore the potential for CTTA system applications, comparisons should be made with the same models and operational conditions. Unfortunately, few studies of the life cycle analysis for related systems can be found. The lack of comparative data obtained in the same operational conditions clearly challenges efforts to accurately evaluate CTTA systems. However, there is a growing interest in a trend that seeks to demonstrate application potential by undertaking life cycle analysis.
It is worth mentioning that the CTTA system has huge potential to reduce carbon emissions, as the efficiency of the CO2 transcritical subsystem could be further improved. In the Introduction, performance enhancement methods for CO2 transcritical refrigeration systems were discussed [14,15,16,17]. The COP of a BCT subsystem could be enhanced by the above methods. The potential of the CTTA system to reduce the LCCP value could also be estimated by calculating the improvement in COP by using the above methods. The COP of the CTTA system is evaluated in Table 5. The LCCP values are also compared with other conventional systems in Figure 13, and are summarized in Table 5.
For example, it is only after the key parameters of the CO2 transcritical cycle are optimized that the potential carbon emissions of the CTTA system could be reduced to 3433 kg CO2e/kW, which is 9.1% lower than the R134a system and equivalent to the R32 system [14]. When the CO2 subsystem uses ejector to lift COP, the carbon emissions of the CTTA system might be reduced to 3160 kg CO2e/kW [16], which is comparable to the carbon emissions of the R1234yf system. Further, with the use of the ejector-cascade cycle [17], the potential carbon emissions of the CTTA system are reduced to 2926 kg CO2e/kW. This carbon emission is 3.4% lower than the R1234ze(E) system, demonstrating the prospect that the CTTA system could positively contribute to air conditioning applications in ultra-low carbon emission buildings.

5. Conclusions

As a natural refrigerant with extremely low GWP, and which is environmentally friendly, easily available and low cost, CO2’s potential application to refrigeration systems is very promising. Conventional CO2 transcritical refrigeration systems have relatively low COP, which means they generate massive indirect carbon emissions. In this study, a novel CO2 transcritical/two-stage absorption hybrid refrigeration system is investigated on the basis of the COP and LCCP values. After the effects of key parameters on the COPtol of the CTTA system are analyzed, the optimal parameters are determined by observing the Figures of COP-P and COP-T. The LCCP value of the CTTA system is compared with seven conventional refrigeration systems, by using CO2, R134a, R32, R450a, R513a, R1234yf, and R1234ze(E) as refrigerants, respectively. The potential of the CTTA system to reduce the LCCP value is also estimated by referring to four potential cases. The conclusions of the study are as follows:
  • Optimal values of Tm, TG2, Tair, and Pc exist for obtaining the maximum COPtol.
  • The CTTA system has a notable improvement of 57.1% in COPtol, when compared to the BCT system.
  • The CTTA system has an equivalent carbon emission to the R134a system, which is 53.6% lower than the BCT system.
  • Ultra-low carbon emissions could be obtained for the CTTA system, which could be reduced to 2926 kg CO2e/kW, a total 3.4% lower than the R1234ze(E) systems.
The above findings indicate that the CTTA system leads to an obvious improvement in the low COP of BCT systems for air conditioning, and also achieves ultra-low carbon emissions. It can therefore be considered alongside R1234yf and R1234ze refrigeration systems, and should be seen as providing a potential alternative for the transformation and upgrading of air conditioning systems in the future.

Author Contributions

Y.H.: Conceptualization, investigation, methodology, writing—original draft; Y.Z.: data curation, resources; J.Z.: formal analysis, visualization; Q.C.: validation; L.Z.: writing—review & editing. All authors have read and agreed to the published version of the manuscript.

Funding

This work was supported by the Key Research and Development Program in Zhejiang Province (No. 2023C01251).

Data Availability Statement

Data are contained within the article.

Conflicts of Interest

Authors Yufu Zheng and Jianguang Zhao were employed by the company Zhejiang Shike Auto Parts Co., Ltd. The remaining authors declare that the research was conducted in the absence of any commercial or financial relationships that could be construed as a potential conflict of interest.

Nomenclature

NomenclatureUnit Subscripts
Adp.GWPGWP of atmospheric degradation productkg CO2e/kg1,2,3State point
AECAnnual energy consumptionkWhaAbsorption system
CrRefrigerant chargekgchConventional hybrid system
EMPower plant emission factorkg CO2e/kWhexpExperimental result
EOLEnd-of-life refrigeration leakage%mIntermedia
GWPGlobal Warming Potentialkg CO2e/kgsimSimulation result
hEnthalpykJ/kgtolTotal
LAverage lifetime of equipmentyear Abbreviations
MMass of unitkgABAbsorber
MMCO2e produced/materialkg CO2e/kgBCTBasic CO2 transcritical
m ˙   Mass flow ratekg/sCCondenser
mrMass of recycle materialkgCOMPCompressor
QRated heat loadkWCSCondensing subcooler
QeRefrigeration capacitykWCTTACO2 transcritical/two-stage absorption
RMCO2e produced/Recycled Materialkg CO2e/kgEEvaporator
RFMRefrigerant manufacturing emissionskg CO2e/kgGGenerator
RFDRefrigerant disposal emissionskg CO2e/kgGCGas cooler
TTemperature°CGWPGlobal warming potential
WInput powerkWIHXInternal heat exchanger
LCCPLife cycle climate performance
SHXSolution heat exchanger
SPSolution pump
TVThrottling valve
DMSDedicated mechanical subrefrigeration

References

  1. Li, J. Towards a low-carbon future in China’s building sector-A review of energy and climate models forecast. Energy Policy 2008, 36, 1736–1747. [Google Scholar] [CrossRef]
  2. Makhnatch, P.; Mota-Babiloni, A.; López-Belchí, A.; Khodabandeh, R. R450A and R513A as lower GWP mixtures for high ambient temperature countries: Experimental comparison with R134a. Energy 2019, 166, 223–235. [Google Scholar] [CrossRef]
  3. Li, Y.X.; Zhang, Z.Y.; De An, M.; Gao, D.; Yi, L.Y.; Hu, J.X. The estimated schedule and mitigation potential for hydrofluorocarbons phase-down in China. Adv. Clim. Chang. Res. 2019, 10, 174–180. [Google Scholar] [CrossRef]
  4. Lemmon, E.W.; Huber, M.L.; McLinden, M.O.; Bai, W. REFPROP, NIST Standard Reference Database 23; Version 9.1; National Institute of Standards and Technology: Gaithersburg, MD, USA, 2013.
  5. Bhamidipati, A.; Pendyala, S.; Prattipati, R. Performance evaluation of multi pressure refrigeration system using R32. Mater. Today Proc. 2020, 28, 2405–2410. [Google Scholar] [CrossRef]
  6. Tanaka, K.; Higashi, Y. Thermodynamic properties of HFO-1234yf (2,3,3,3-tetrafluoropropene). Int. J. Refrig. 2010, 33, 474–479. [Google Scholar] [CrossRef]
  7. Navarro-Esbrí, J.; Molés, F.; Barragán-Cervera, Á. Experimental analysis of the internal heat exchanger influence on a vapour compression system performance working with R1234yf as a drop-in replacement for R134a. Appl. Therm. Eng. 2013, 59, 153–161. [Google Scholar] [CrossRef]
  8. Gaurav; Kumar, R. Computational energy and exergy analysis of R134a, R1234yf, R1234ze and their mixtures in vapour compression system. Ain Shams Eng. J. 2018, 9, 3229–3237. [Google Scholar] [CrossRef]
  9. Makhnatch, P.; Mota-Babiloni, A.; Khodabandeh, R. Experimental study of R450A drop-in performance in an R134a small capacity refrigeration unit. Int. J. Refrig. 2017, 84, 26–35. [Google Scholar] [CrossRef]
  10. International Institute of Refrigeration (IIR). Guideline for Life Cycle Climate Performance January 2016; International Institute of Refrigeration: Paris, France, 2016; pp. 1–26. [Google Scholar]
  11. Choi, S.; Oh, J.; Hwang, Y.; Lee, H. Life cycle climate performance evaluation (LCCP) on cooling and heating systems in South Korea. Appl. Therm. Eng. 2017, 120, 88–98. [Google Scholar] [CrossRef]
  12. Lee, H.; Troch, S.; Hwang, Y.; Radermacher, R. LCCP evaluation on various vapor compression cycle options and low GWP refrigerants. Int. J. Refrig. 2016, 70, 128–137. [Google Scholar] [CrossRef]
  13. Yu, B.; Yang, J.; Wang, D.; Shi, J.; Chen, J. An updated review of recent advances on modified technologies in transcritical CO2 refrigeration cycle. Energy. 2019, 189, 116147. [Google Scholar] [CrossRef]
  14. Wang, A.; Yin, X.; Fang, J.; Cao, F. Refrigerant Distributions and Dynamic Migration Characteristics of the Transcritical CO2 Air Conditioning System. Int. J. Refrig. 2021, 130, 233–241. [Google Scholar] [CrossRef]
  15. Song, Y.; Ye, Z.; Wang, Y.; Cao, F. The experimental verification on the optimal discharge pressure in a subcooler-based transcritical CO2 system for space heating. Energy Build. 2018, 158, 1442–1449. [Google Scholar] [CrossRef]
  16. Lawrence, N.; Elbel, S. Comparison of CO2 and R134a two-phase ejector performance for use in automotive air conditioning applications. SAE Tech. Pap. 2014, 1. [Google Scholar] [CrossRef]
  17. Tashtoush, B.; Megdouli, K.; Elakhdar, M.; Nehdi, E.; Kairouani, L. A comprehensive energy and exergoeconomic analysis of a novel transcritical refrigeration cycle. Processes 2020, 8, 758. [Google Scholar] [CrossRef]
  18. Megdouli, K.; Tashtoush, B.M.; Nahdi, E.; Elakhdar, M.; Kairouani, L.; Mhimid, A. Thermodynamic analysis of a novel ejector- cascade refrigeration cycles for freezing process applications and air-conditioning. Int. J. Refrig. 2016, 70, 108–118. [Google Scholar] [CrossRef]
  19. Liu, X.; Hu, Y.; Wang, Q.; Yao, L.; Li, M. Energetic, environmental and economic comparative analyses of modified transcritical CO2 heat pump system to replace R134a system for home heating. Energy 2021, 229, 120544. [Google Scholar] [CrossRef]
  20. Chan, W.M.; Leong, Y.T.; Foo, J.J.; Chew, I.M.L. Synthesis of energy efficient chilled and cooling water network by integrating waste heat recovery refrigeration system. Energy 2017, 141, 1555–1568. [Google Scholar] [CrossRef]
  21. Jain, V.; Sachdeva, G.; Kachhwaha, S.S. Comparative performance study and advanced exergy analysis of novel vapor compression-absorption integrated refrigeration system. Energy Convers. Manag. 2018, 172, 81–97. [Google Scholar] [CrossRef]
  22. Gibelhaus, A.; Fidorra, N.; Lanzerath, F.; Bau, U.; Köhler, J.; Bardow, A. Hybrid refrigeration by CO2 vapour compression cycle and water-based adsorption chiller: An efficient combination of natural working fluids. Int. J. Refrig. 2019, 103, 204–214. [Google Scholar] [CrossRef]
  23. He, Y.J.; Jiang, Y.Y.; Gao, N.; Chen, G.M.; Tang, L.M. Theoretical analyses of a new two- stage absorption-transcritical hybrid refrigeration system. Int. J. Refrig. 2015, 56, 105–113. [Google Scholar] [CrossRef]
  24. Klein, S.A. Engineering Equation Solver (EES) 1992–2014; F-Chart Software: Middleton, WI, USA, 2020. [Google Scholar]
  25. Herold, K.E. 99/01562 An analysis of the major variables impacting performance of absorption chillers and heat pumps. Fuel Energy Abstr. 1997, 40, 157. [Google Scholar] [CrossRef]
  26. Chen, X.; He, Y.; Wang, Y.; Chen, G. Analysis of a hybrid system of liquid desiccant and CO2 transcritical cycles. Int. J. Refrig. 2019, 105, 101–108. [Google Scholar] [CrossRef]
  27. Mcneely, L.A. Thermodynamic properties of aqueous solutions of lithium-bromide. ASHRAE Trans. 1979, 20, 54–55. [Google Scholar]
  28. Berlitz, T.; Plank, H.; Ziegler, F.; Kahn, R. An ammonia-water absorption refrigerator with a large temperature lift for combined heating and cooling. Int. J. Refrig. 1998, 21, 219–229. [Google Scholar] [CrossRef]
  29. Span, R.; Wagner, W. A new equation of state for carbon dioxide covering the fluid region from the triple-point temperature to 1100K at Pressures up to 800 MPa. J. Phys. Chem. Ref. Data. 1996, 6, 1509–1596. [Google Scholar] [CrossRef]
  30. Dai, Y. The Technology and Application of Lithium Bromide Absorption Refrigeration; Machinery Industry Press: Beijing, China, 1996. (In Chinese) [Google Scholar]
  31. Pitla, S.S.; Groll, E.A.; Ramadhyani, S. New correlation to predict the heat transfer coefficient in-tube cooling of supercritical CO2 in horizontal macro-tubes. Exp. Therm. Fluid Sci. 2002, 25, 887–895. [Google Scholar] [CrossRef]
  32. Huang, D.; Liang, Z.; Ding, G.; Zhang, C. Modeling and Performance Analysis of LFSN. J. Chem. Ind. Eng. 2002, 53, 832–836. [Google Scholar] [CrossRef]
  33. Agrawal, N.; Bhattacharyya, S. Non-adiabatic capillary tube flow of carbon dioxide in a transcritical heat pump cycle. Energy Convers. Manag. 2007, 48, 2491–2501. [Google Scholar] [CrossRef]
  34. Lockhart, R.; Martinelli, R. Proposed correlation of data for isothermal two-phase, two-component flow in pipes. Chem. Eng. Prog. Symp. Ser. 1949, 45, 39–48. [Google Scholar]
  35. Yunho, H.; Reinhard, R. Performance Measurement of CO2 Heat Exchangers. ASHRAE Trans. 2005, 111, 306–316. [Google Scholar]
  36. Boewe, D.; Bullard, C.; Yin, J.; Hrnjak, P. Contribution of internal heat exchanger to transcritical R744 cycle performance. ASHRAE Trans. 2001, 2, 189–198. [Google Scholar]
  37. Mohammadi, S.M.H. Theoretical investigation on performance improvement of a low-temperature transcritical carbon dioxide compression refrigeration system by means of an absorption chiller after-cooler. Appl. Therm. Eng. 2018, 138, 264–279. [Google Scholar] [CrossRef]
  38. Farsi, A.; Mohammadi, S.M.H.; Ameri, M. An efficient combination of transcritical CO2 refrigeration and multi-effect desalination: Energy and economic analysis. Energy Convers. Manag. 2016, 127, 561–575. [Google Scholar] [CrossRef]
  39. Yuan, Y.; Xianlong, W.; Yongjun, T. Performance investigation on double- lift LiBr absorption refrigerator in variable conditions. Cryogenics 2013, 193, 21–26. [Google Scholar]
  40. Zhang, F.Z.; Jiang, P.X.; Lin, Y.S.; Zhang, Y.W. Efficiencies of subcritical and transcritical CO2 inverse cycles with and without an internal heat exchanger. Appl. Therm. Eng. 2011, 31, 432–438. [Google Scholar] [CrossRef]
  41. Janković, Z.; Atienza, J.S.; Suárez, J.A.M. Thermodynamic and heat transfer analyses for R1234yf and R1234ze(E) as drop-in replacements for R134a in a small power refrigerating system. Appl. Therm. Eng. 2015, 80, 42–54. [Google Scholar] [CrossRef]
  42. Bolaji, B.O. Experimental study of R152a and R32 to replace R134a in a domestic refrigerator. Energy 2010, 35, 3793–3798. [Google Scholar] [CrossRef]
  43. Mendoza-Miranda, J.M.; Mota-Babiloni, A.; Ramírez-Minguela, J.J.; Muñoz-Carpio, V.D.; Carrera-Rodríguez, M.; Navarro-Esbrí, J.; Salazar-Hernández, C. Comparative evaluation of R1234yf, R1234ze(E) and R450A as alternatives to R134a in a variable speed reciprocating compressor. Energy 2016, 114, 753–766. [Google Scholar] [CrossRef]
  44. Llopis, R.; Sánchez, D.; Cabello, R.; Catalán-Gil, J.; Nebot-Andrés, L. Experimental analysis of R-450A and R-513A as replacements of R-134a and R-507A in a medium temperature commercial refrigeration system. Int. J. Refrig. 2017, 84, 52–66. [Google Scholar] [CrossRef]
Figure 1. Schematic of the CTTA system.
Energies 17 00880 g001
Figure 2. Comparison of a new two-stage absorption refrigeration subsystem and normal two-stage absorption refrigeration system, in a P-T diagram.
Energies 17 00880 g002
Figure 3. Comparisons of the simulation and experimental results: (a) COP-TE (b) Qe-TG2 (c) COP-TC.
Energies 17 00880 g003
Figure 4. Effects of Pc on the performance, using different refrigerants.
Energies 17 00880 g004
Figure 5. Effects of Tm on CTTA system performance.
Energies 17 00880 g005
Figure 6. Effects of TG2 on CTTA system performance.
Energies 17 00880 g006
Figure 7. Effects of TE on CTTA system performance.
Energies 17 00880 g007
Figure 8. Effects of TC on CTTA system performance.
Energies 17 00880 g008
Figure 9. Effects of TAB on CTTA system performance.
Energies 17 00880 g009
Figure 10. Effects of Tair on CTTA system performance.
Energies 17 00880 g010
Figure 11. Effects of Pc on CTTA system performance.
Energies 17 00880 g011
Figure 12. LCCP evaluation of a refrigeration system with different refrigerants.
Energies 17 00880 g012
Figure 13. LCCP potentials of the CTTA system, compared with conventional systems.
Energies 17 00880 g013
Table 1. Main properties of typical refrigerants [4].
CharacteristicR744R744aR134aR32R1234yfR1234ze(E)R513aR450a
ODP00000000
GWP12401300675<14572547
Critical temperature/°C31.036.4101.178.494.7109.494.9104.5
Critical pressure/MPa7.47.34.15.83.43.63.73.8
Boiling point/°C−78.5−88.5−26.1−51.6−29.5−19.0−29.8−23.4
Standard safety classificationA1/A1A2A2LA2LA1A1
Table 2. Designing conditions of the CTTA system.
ParameterValueUnit
Inlet temperature of CO2 in G180°C
Inlet temperature of cooling water for condenser and absorber32°C
Inlet temperature of air32°C
Outlet temperature of chilled water9°C
Temperature at subcooler18°C
Condensing temperature35°C
Absorption temperature35°C
Evaporating temperature7°C
Discharged pressure9.7MPa
Table 3. The structural parameters of each component.
ComponentParameters
The CO2 subsystem
COMPthe special piston compressor for CO2, Vth = 2.7 m3/h, rated input power: 3 kW, rated speed: 1450 rpm
GCFin-tube heat exchanger, diameter: 7 × 0.35 mm, fin thickness: 0.15 mm, fin pitch: 2 mm, tube spacing: 21 mm
IHXDouble tube heat exchanger, diameter: 6 × 0.5 mm, 10 × 1 mm
CSTube heat exchanger, diameter: 8 × 1 mm
The absorption subsystem
G1Immersive serpentine coil heat exchanger, diameter: 8 × 1 mm
G2Immersive serpentine coil heat exchanger, diameter: 6 × 0.5 mm
EShell and tube heat exchanger, diameter: 8 × 1 mm
CShell and tube heat exchanger, diameter: 8 × 1 mm
AB1Shell and tube heat exchanger, diameter: 6 × 0.5 mm
AB2Shell and tube heat exchanger, diameter: 10 × 1 mm
SHX1Double tube heat exchanger, diameter: 8 × 1 mm
SHX2Double tube heat exchanger, diameter: 6 × 0.5 mm
Table 4. Reference values used for LCCP calculation and calculation results.
CO2R134aR32R450aR513aR1234yfR1324ze(E)
COP2.75 [40]6.00 [41]5.70 [42]5.64 [43]5.83 [44]5.22 [43]5.34 [43]
L (yr)15151515151515
ALR (%)5555555
EOL (%)15151515151515
Adp. GWP (kg CO2e/kg)01.6///3.3/
EM (kg CO2e/kWh)0.973
RFM (kg CO2e/kg)057.2101013.714
Direct emission (kg CO2e/kW)2108759548649214
Indirect emission (kg CO2e/kW)5786268928322866277430993024
Table 5. Potential of the CTTA system to reduce of LCCP values.
New CTTA SystemCOP Improvement (%)LCCP Value (kg CO2e/kW)Improvement, Compared to Traditional Refrigerant Systems (%)
Potential CaseR134aR32R1234yfR1234ze(E)
1Discharge pressure optimization [15]8.834738.0−1.7−12.0−14.7
2Refrigerant discharge optimization [14]10.134339.1−0.5−10.8−13.4
3Ejector expansion cycle [16]20.0316016.37.4−1.9−4.4
4Ejector-csscade cycle [17]30.0292622.514.35.6−3.4
Disclaimer/Publisher’s Note: The statements, opinions and data contained in all publications are solely those of the individual author(s) and contributor(s) and not of MDPI and/or the editor(s). MDPI and/or the editor(s) disclaim responsibility for any injury to people or property resulting from any ideas, methods, instructions or products referred to in the content.

