Article

Fully Coupled Whole-Annulus Investigation of Combustor–Turbine Interaction with Reacting Flow

Mechanical Engineering Department, Faculty of Engineering Sciences, University College London, London WC1E 7JE, UK
*
Author to whom correspondence should be addressed.
Energies 2024, 17(4), 873; https://doi.org/10.3390/en17040873
Submission received: 6 September 2023 / Revised: 2 February 2024 / Accepted: 5 February 2024 / Published: 13 February 2024
(This article belongs to the Special Issue Clean Combustion and Heat Transfer of Gas Turbine)

Abstract

:
Micro-gas turbines are used for power generation and propulsion in unmanned aerial vehicles. Technological advancements to enhance their efficiency and fuel adaptability are continuously sought out. As part of a comprehensive study focused on understanding the fundamental performance and emission characteristics of a micro gas turbine model, with the aim of finding ways to enhance the operation of micro gas turbines, the current study uses a fully coupled whole-annulus simulation approach to systematically explore the combustor–turbine interaction without compromising the accuracy due to domain truncation. The numerical model is highly complex, spanning aerothermodynamics, fuel vaporization, combustion, and multi-species flow transport. Coupled with the realistic geometries of a representative micro-gas turbine, the proposed numerical model is highly accurate with the capability to capture the complex interaction between the flowfield and the aerothermodynamics and emission performances. The results show that unburnt gaseous Jet-A fuel is carried into the turbine domain through vortical flow structures originating from the combustion chamber. Notably, combustion processes persist within the turbine, leading to rapid Jet-A fuel concentration decay and linearly increasing soot concentration across the turbine domain. The relative circumferential positioning of the combustion chamber and turbine vane (i.e., clocking effects) profoundly influences micro-gas turbine aerothermodynamics and pollutant emissions. Leading-edge impingement hot-streak configurations enhance aerodynamic efficiency, while mid-passage hot-streak configurations mitigate aerothermal heat load and soot emissions. Clocking effects impact all parameters, indicating a complex interplay between the flowfield, aerothermal performance, and pollutant emissions. However, turbine vane heat load exhibits the most significant variations.

1. Introduction

Micro-gas turbines are widely used within the renewable energy sector to generate electricity as well as the aviation industry to facilitate propulsion. Nonetheless, to date, these micro-gas turbines still mainly rely on fossil fuels for operation, which has significantly contributed to global warming over recent decades. In response, governments have established the ambitious objective of achieving net zero emissions by 2050 to mitigate the effects of climate change. Ongoing technological advancements are dedicated to enhancing the efficiency and fuel adaptability of micro-gas turbines through continuous technological innovation.
In the renewable energy field, micro-gas turbines are employed for generating electricity. These turbines are beneficial due to their ability to operate on various alternative fuels like biogas, hydrogen, and liquid biofuels, and they also have a low initial investment cost. A study by De Robbio [1] emphasized the increasing importance of micro-gas turbines in producing both electric and thermal energy from renewable sources. This paper also discusses how micro-gas turbines could be integrated with other energy systems such as solar fields, ORCs, and fuel cells. Banihabib and Assadi [2] acknowledged the growing significance of micro-gas turbines in the expanding market of decentralized energy, citing advantages like low emissions, versatility in fuel use, and minimal maintenance requirements. They also addressed the need to enhance the operational adaptability, dependability, and availability of these turbines while still minimizing environmental impact. Research by Ji et al. [3] showed the potential of micro-gas turbines in extending the range of electric vehicles, offering an alternative to diesel engines. These turbines are also utilized as propulsion systems in unmanned aircraft. Capata and Saracchini [4] tested a small-scale turbine in radio-controlled vehicles using different fuels and found that using a propane–butane mix is more cost-effective than kerosene. Habib et al. [5] examined the impact of blending biofuel with Jet A fuel, noting that while it reduced static thrust and fuel consumption, it enhanced thermal efficiency and optimally reduced CO and NO emissions without significantly impacting static thrust. Lastly, Large and Pesyridis [6] investigated ways to boost the performance of existing micro turbojet gas turbine engines by converting them to turbofans.
In a micro-gas turbine engine, the interaction between a combustor and an immediate downstream turbine stage is of particular importance. The turbine blades must withstand substantial aerothermal and mechanical loading. The structural integrity of turbine blades tends to be the limiting factor of a micro-gas turbine. Thus, many researchers have attempted to investigate combustor–turbine interaction. Miki et al. [7] used the Open National Combustion Code to simulate a 1/15 sector of a realistic combustor and first-stage high-pressure turbine. They performed three different cases: (1) without the vane and (2,3) with the vane at different clocking conditions. They found that the presence of the vane caused a noticeable difference in the flowfield. Clocking did not significantly affect the combustor flow field but altered the migration of the hot streaks. Raynauld et al. [8] used a CFD solver that was able to deal with both reacting and compressible flow to simulate one sector of the combustor–turbine system. They demonstrated that the common approach based on spatial–temporal averaging to generate constant pressure boundary conditions at the combustor outlet would affect the predicted accuracy inside the combustion chamber. Koupper et al. [9] performed Large Eddy Simulation on a single periodic sector of a combustor with a two-vane system. They found that vane clocking has a noticeable effect on the hot streak transport in the turbine stage. The vane potential effect did not change the temperature patterns noticeably but significantly affected the radial and azimuthal mass flow distribution. Lo Presti et al. [10] simulated a full-annulus of a three-stage turbine with multi-species to resemble the combustion mixture composition. The results showed that the unsteady inlet boundary conditions increased the mixing, leading to a more uniform temperature profile. Duchaine et al. [11] performed Large Eddy Simulation on a single periodic sector of a combustor and a turbine stage system. The authors showed the difference in the turbulence from the combustion chamber that was not injected properly to the turbine stage if the turbine stage alone simulation was used. As a result, the blade thermal load predictions were significantly affected, while the stage expansion was not affected. Flaszynski et al. [12] used the Spalart–Allmaras and explicit algebraic Reynolds stress turbulence models for a combustor–turbine system with different clocking positions. They observed that whilst the vane potential effect is weak, the clocking significantly affects the van temperature and flow conditions. Miki et al. [13] compared the sequential single-component simulation method against the fully coupled simulation method for a combustor–turbine system. Although the mean combustor flowfields were similar between the two methods, there was a significant difference in the hot-streak distributions. The predicted turbine efficiencies also differed by 7% between the two methods. Salvadori et al. [14] compared the decoupled and loosely coupled approaches in simulating the combustor–turbine system. They demonstrated the importance of evaluating the aerothermal performance using realistic boundary conditions, with 22% differences observed in Nusselt number prediction between the two methods. Verma et al. [15] evaluated the effectiveness of the joint simulation method against the co-simulation method for modeling combustor–turbine interaction. They concluded that the co-simulation was less accurate for aerothermal prediction because each vane was exposed to a similar temperature distribution.
Only a few combustor–turbine interaction studies attempt to model the combustion process and multi-species transportation. Nguyen et al. [16] studied the aero-thermodynamic processes, formation of nitrate and sulfate aerosol precursors, and influence of chemical processes on aero-thermodynamics. They demonstrated that the chemical process had a significant impact on the flow aerothermodynamics, with up to 16.9% discrepancy for temperature prediction and 38.8% for flow velocity. Perpignan et al. [17] used computational fluid dynamics (CFD) and chemical reactor network (CRN) simulations to analyze the progress of NOx and CO species through a turbine stator with uniform boundary conditions. They found that the inclusion of the turbine stator is important for accurate prediction of pollutant emission prediction.
The current study employs a turbojet-type micro-gas turbine, based on the KJ66 micro-gas turbine model [18]. Originally designed for application in small radio-controlled unmanned aerial vehicles, this turbine model and its modified versions have been extensively investigated by other researchers due to the accessibility of both its geometric and operational details. Xiang et al. [19] studied the performance of the compressor stage of a KJ-66 using a steady and unsteady simulation approach. The unsteady simulation gave more details of transient flow behavior during its operation. Teixera et al. [20] demonstrated a capability to perform an integrated fully coupled engine simulation on a redesign of KJ66. The component-to-component interactions were captured using mixing-plane interfaces and a nonlinear harmonic methodology. The combustion was modeled using a simplified flamelet model, and no soot model was implemented. More recently, Yang et al. [21] performed a full engine 2D throughflow simulation on a KJ66 micro gas turbine model. This simulation approach has the advantage of using less computational resources and producing results quicker, thus enabling more efficient performance sweeping across different operating points. With the continuous improvement in computational hardware capabilities, the number of full-engine simulations has increased steadily in recent years, and this trend is projected to be ongoing [22,23,24]. For example, Xu et al. [22] compared the predictions of 3D full engine simulation between the coupled and uncoupled schemes. They concluded that the uncertainty of the boundary conditions limited by the 3D uncoupled scheme and the low-dimensional forced mixing at the component’s interfaces result in significant errors. Arroyo et al. [23] demonstrated a 360-azimuthal-degree large-eddy simulation of the DGEN-380 demonstrator engine including a fully integrated fan, compressor, and annular combustion chamber at take-off conditions. Xu et al. [24] proposed a component-coupled approach with the power balance iteration technique for 3D full engine CFD simulations. They successfully demonstrated the robustness of the method not only for the co-working state but also for the windmill stage of the gas turbine engine.
The present study is part of a more comprehensive project aimed at understanding the fundamental aerothermal performance and emission characteristics of a micro-gas turbine engine and finding ways to improve its operation [25,26]. In the previous published work of the authors [26], a combustor with a reacting flow was investigated. The authors have identified various aerothermal performance and emission characteristics of a micro-gas turbine combustor. The current work is a further study aiming to investigate the combustor–turbine interaction in more detail. Based on the above literature review, it is clear that the combustor–turbine interaction potentially has a non-negligible impact on both the aero-thermodynamic and emission characteristic. However, due to limited computational resources, numerical models must be simplified, typically by imposing a periodicity condition and a decoupled combustor–turbine domain. Such simplifications may have an impact on the prediction accuracy and must be quantified. In addition, the combustion process and transportation of multi-species flow through the turbine stage has rarely been modeled, also due to the constrained resources. Therefore, the present work adopts a fully coupled whole annulus with reacting flow to investigate the combustor–turbine interaction in a micro-gas turbine engine. The whole annulus domain will be modelled without any periodicity condition imposed, and the turbine and the combustor domains will be directly linked in a single simulation (i.e., full coupling). As a result, the combustion process and the transportation of multi-species flow will be modelled in both the combustor and the turbine stage. If the local temperature inside the turbine is sufficiently high, it will promote further combustion inside the turbine domain. This complex interplay among the flow field, aerothermal performance, and pollutant emissions can thus be systematically explored and evaluated.

2. Numerical Methods

ANSYS CFX is the chosen numerical solver in the present study. The code solves the Navier–Stokes equations using an implicit finite-volume method. The conservation equations representing the mass, momentum, and energy continuity are as follows:
ρ t + ρ U = 0 , ρ U t + ρ U U = p + τ , ρ H t p t + ρ U H = λ T + U τ
Barth and Jespersen’s bounded high-resolution scheme [27] is utilized to discretize the advection terms. It achieves second-order accuracy on smooth parts of the solution while it reduces to first-order accuracy near discontinuities or steep gradients to maintain the boundedness of the solution and avoid non-physical oscillations. The coupling of pressure and velocity is achieved using Rhie and Chow’s fourth-order smoothing algorithm [28]. To speed up the convergence of the solver, the algebraic multigrid method is employed. The solution progresses with a pseudo time step until it satisfies the convergence standards and the residuals decrease by several orders of magnitude (up to 10 8 for present simulations). Menter’s k-ω SST turbulence model [29] is used to close the conservation equations.

2.1. Combustion Modeling

The transport equations for the combustion process use the same algorithms for multiphase flow with additional source terms due to chemical reactions:
ρ Y I t + ρ U Y I = Γ I e f f Y I + S I
where Y I is the component mass fraction and S I is the component chemical reaction rate.
In the present work, the Eddy Dissipation Model was selected for its computational speed and stability. This model is particularly well-suited for extensive industrial simulations, such as those required in this work to emulate the entire micro gas turbine under different operational states. The foundational principle of the Eddy Dissipation Model is the assumption that the rate of chemical reactions is rapid compared to the rate at which the flow transports reactants. It assumes that the rate of reaction correlates with the time it takes for the reactants to mix, which in turn correlates with the ratio of turbulent dissipation to turbulent kinetic energy:
r e a c t i o n   r a t e ε k
where k is the turbulent kinetic energy; ε is the rate of dissipation of turbulent kinetic energy.
It should be noted that the Eddy Dissipation Model does not resolve the detailed chemistry of the combustion process. In reality, combustion can occur under a wide range of temperatures and, in some cases, especially at lower temperatures, the assumption of infinitely fast chemistry may no longer hold. When the combustion process is influenced by finite-rate kinetics, a more comprehensive model such as Finite Rate Chemistry might be adopted.

2.2. Droplet Breakup Modeling

In the present work, the droplet breakup modeling technique is employed to replicate the liquid fuel vaporization process as a simplification for the modeling of the vaporizing system. Specifically, the Enhanced Taylor Analogy Breakup (ETAB) model is utilized. This particular model has demonstrated enhanced numerical prediction capabilities in comparison to experimental findings, as reported in [30,31]. Consequently, the ETAB model has been selected for this study. While it incorporates the droplet distortion mechanism similar to that of the conventional TAB model [32], the ETAB model introduces a distinct formula to characterize the breakup process. Within the ETAB framework, it is postulated that the creation rate of secondary droplets is directly proportional to their quantity.
r p , c h i l d r p , p a r e n t = e K b r t
where K b r is dependent on the breakup regime and Weber number.

2.3. Soot Modeling

The Magnussen soot model [33] is employed to simulate the production of soot particulate. It operates under the premise that soot originates from gaseous fuel through a two-step process: initially, radical nuclei are formed, followed by the creation of soot particles from these initial nuclei. Additional transport equations are required to be resolved in the context of soot modeling:
ρ ¯ X N ~ t + ρ ¯ U X N ~ = X N ~ μ ¯ + μ t P r t + S ~ n u c l e i , f + S ~ n u c l e i , c ρ ¯ Y S ~ t + ρ ¯ U Y S ~ = Y S ~ μ ¯ + μ t P r t + S ~ s o o t , f + S ~ s o o t , c
where X N is the specific concentration of radical nuclei and Y S is the soot mass fraction.
The modeling techniques are divided into three distinct segments:
(a)
The generation of nuclei and soot particles as described by the Tesner et al. model [34];
(b)
The burning process of the nuclei and soot particles;
(c)
The application of Magnussen’s eddy dissipation concept to model how turbulence impacts average reaction rates.

2.4. Data Post-Processing

Further calculations are required to post-process different quantities of interest. The primary variable under consideration is the combustion efficiency, denoted as η c c :
T 04 = T 03 + η c c f H V c p g
where η c c is the combustion efficiency, f is the fuel-to-air ratio, H V = 43.1   M J / k g is the Jet-A fuel heating value, and c p g is the gas specific heat.
To validate the numerical model, the engine thrust, represented by F , is a key parameter. This can be determined by measuring the change in momentum through the engine, with the assumption that the pressure at the nozzle’s exit matches the ambient freestream pressure:
F = m ˙ e V e m ˙ 0 V 0
where m ˙ e is the exit mass flow rate, m ˙ 0 is the inlet mass flow rate, V e is the exit gas velocity, and V 0 is the inlet gas velocity.
The turbine isentropic efficiency η is calculated as:
η = 1 T r 1 P r γ 1 γ
where T r and P r are the temperature ratio and pressure ratio across the turbine stage, respectively, and γ is the ratio of the specific heats.

3. Test Case Descriptions

3.1. Geometry

The current study employs a turbojet-type micro-gas turbine, based on the KJ66 micro-gas turbine model. Originally designed for application in small radio-controlled unmanned aerial vehicles, this turbine model and its modified versions have been extensively investigated by other researchers due to the accessibility of both its geometric and operational details. This micro-gas turbine model is composed of several key components: a single-stage centrifugal compressor, an annular combustion chamber, a single-stage axial turbine, and an exhaust. The combustion chamber follows a reverse-flow configuration and incorporates multiple vaporizing tubes at the core. To maintain the simplicity of the model, the fuel feed supply pipes are omitted from the model, and instead, liquid fuel is introduced into the vaporizing tubes. Through the utilization of droplet breakup models, the liquid fuel is subsequently converted into gaseous fuel via a vaporization process. Table 1 and Table 2 present the operational and geometrical parameters of the redesign micro gas turbine employed in this study. The currently investigated turbine geometry differs from the original geometry designed by Schreckling [18], so it is denoted as a redesign variation in the same way other researchers have (for example, see Teixera et al. [20]). In the validation stage, three operating points at a 40,000, 80,000, and 120,000 rpm shaft speed are chosen to compare the numerical prediction against the experimental data as well as against the numerical prediction using a different method (throughflow).

3.2. Computational Domain and Mesh

The simulation domain in the current work comprises of the combustion chamber, the turbine stage, and the exhaust. Figure 1a illustrates the computational domain and mesh of the combustion chamber, while Figure 1b illustrates that of the turbine stage. A whole-annulus model without any periodic interface assumption is adopted in this study. The combustion chamber domain and the turbine stage domain are directly coupled in a single simulation without any partitioning.
Figure 1a presents a detailed illustration of the combustor architecture featuring a reversed flow-type design. Inside the combustion chamber, various dilution holes of different sizes and positions are present along the inner walls. These holes serve the dual purpose of supplying air to support fuel combustion and cooling the walls of the combustion chamber. The geometry of the combustion chamber is meshed using ICEM v2023 R2 software, employing quad-dominant surface meshes and hexa-dominant volume meshes. The combustion chamber model, designed as a whole annulus, comprises approximately 36 million cells [26].
Figure 1b provides a clearer view of the turbine stage. The model accurately resolves boundary layers around turbine blades to capture viscous effects. Additionally, attention is given to the clearance height of rotor blades, ensuring sufficient mesh resolution in the tip gap area. Mesh refinement is applied near the hub and shroud endwalls. TurboGrid v2023 R2 software is utilized to mesh the turbine stage geometry with fully hexagonal elements. Each blade passage consists of around 500 thousand elements, aligning with resolutions typically employed in other turbomachinery simulations documented in the literature [35,36,37,38,39,40,41]. The stator blade row in the whole-annulus model encompasses 4.4 million cells, while the rotor blade row comprises 9.4 million cells. In total, the combustor-turbine domain encompasses nearly 50 million cells.

3.3. Simulation Setup and Boundary Conditions

A whole-annulus model is utilized, eliminating the necessity for specifying periodic conditions. Both the combustion chamber and the stationary turbine stator blade row are directly linked, allowing for conventional treatment of their interface. Conversely, the turbine rotor blade row rotates at a predetermined speed, necessitating specialized handling at the interface between the stator and rotor blade rows. In this study, the “Frozen Rotor” method is employed.
Parameters such as total pressure, total temperature, and flow angles are defined at the combustor inlet, while static pressure is set at the exhaust outlet. Liquid Jet-A fuel is introduced into the vaporizing tube at a designated mass flow rate, injection angle, and velocity. All wall surfaces are modeled as adiabatic no-slip surfaces. Clocking effects are examined by rotating the turbine stator blade row while keeping the combustion chamber domain fixed in its original position.

3.4. Validations

Within this section, the validation of the simulation method is accomplished through the comparison with publicly available data, incorporating both experimental findings by Schreckling [18] and numerical throughflow simulations conducted by Yang et al. [21], as shown in Figure 2. The comparison centers on two key parameters: engine thrust and exhaust temperature. There are three distinct test operating points at a 40,000, 80,000, and 120,000 rpm shaft speed. These operating points span across the working range of the investigated micro-gas turbine model, with the point at 120,000 rpm representing the maximum thrust operating condition. For the validation of engine thrust, the numerical predictions are in very good agreement with the experimental data. Regarding the exhaust temperature, both our model and Yang et al.’s throughflow model show a larger discrepancy compared to the experimental data. Nevertheless, the variation in the predicted engine exhaust temperature with shaft speed can be seen to resemble the experimental trend. It is worth noting that a comprehensive exploration of the entire engine model is beyond the immediate scope of this study and will be presented in a separate report. The validation outcomes, however, effectively affirm the credibility and suitability of the chosen simulation approach in the current investigation.
Regarding the particulate matter prediction, there is no experimental measurement of soot emissions for this model of micro-gas turbine engine, so there will be no validation 1 of soot modeling. Nevertheless, the use of the Magnussen soot model is popular in gas turbine studies and the model is expected to be of reasonable accuracy, at least in the qualitative manner.

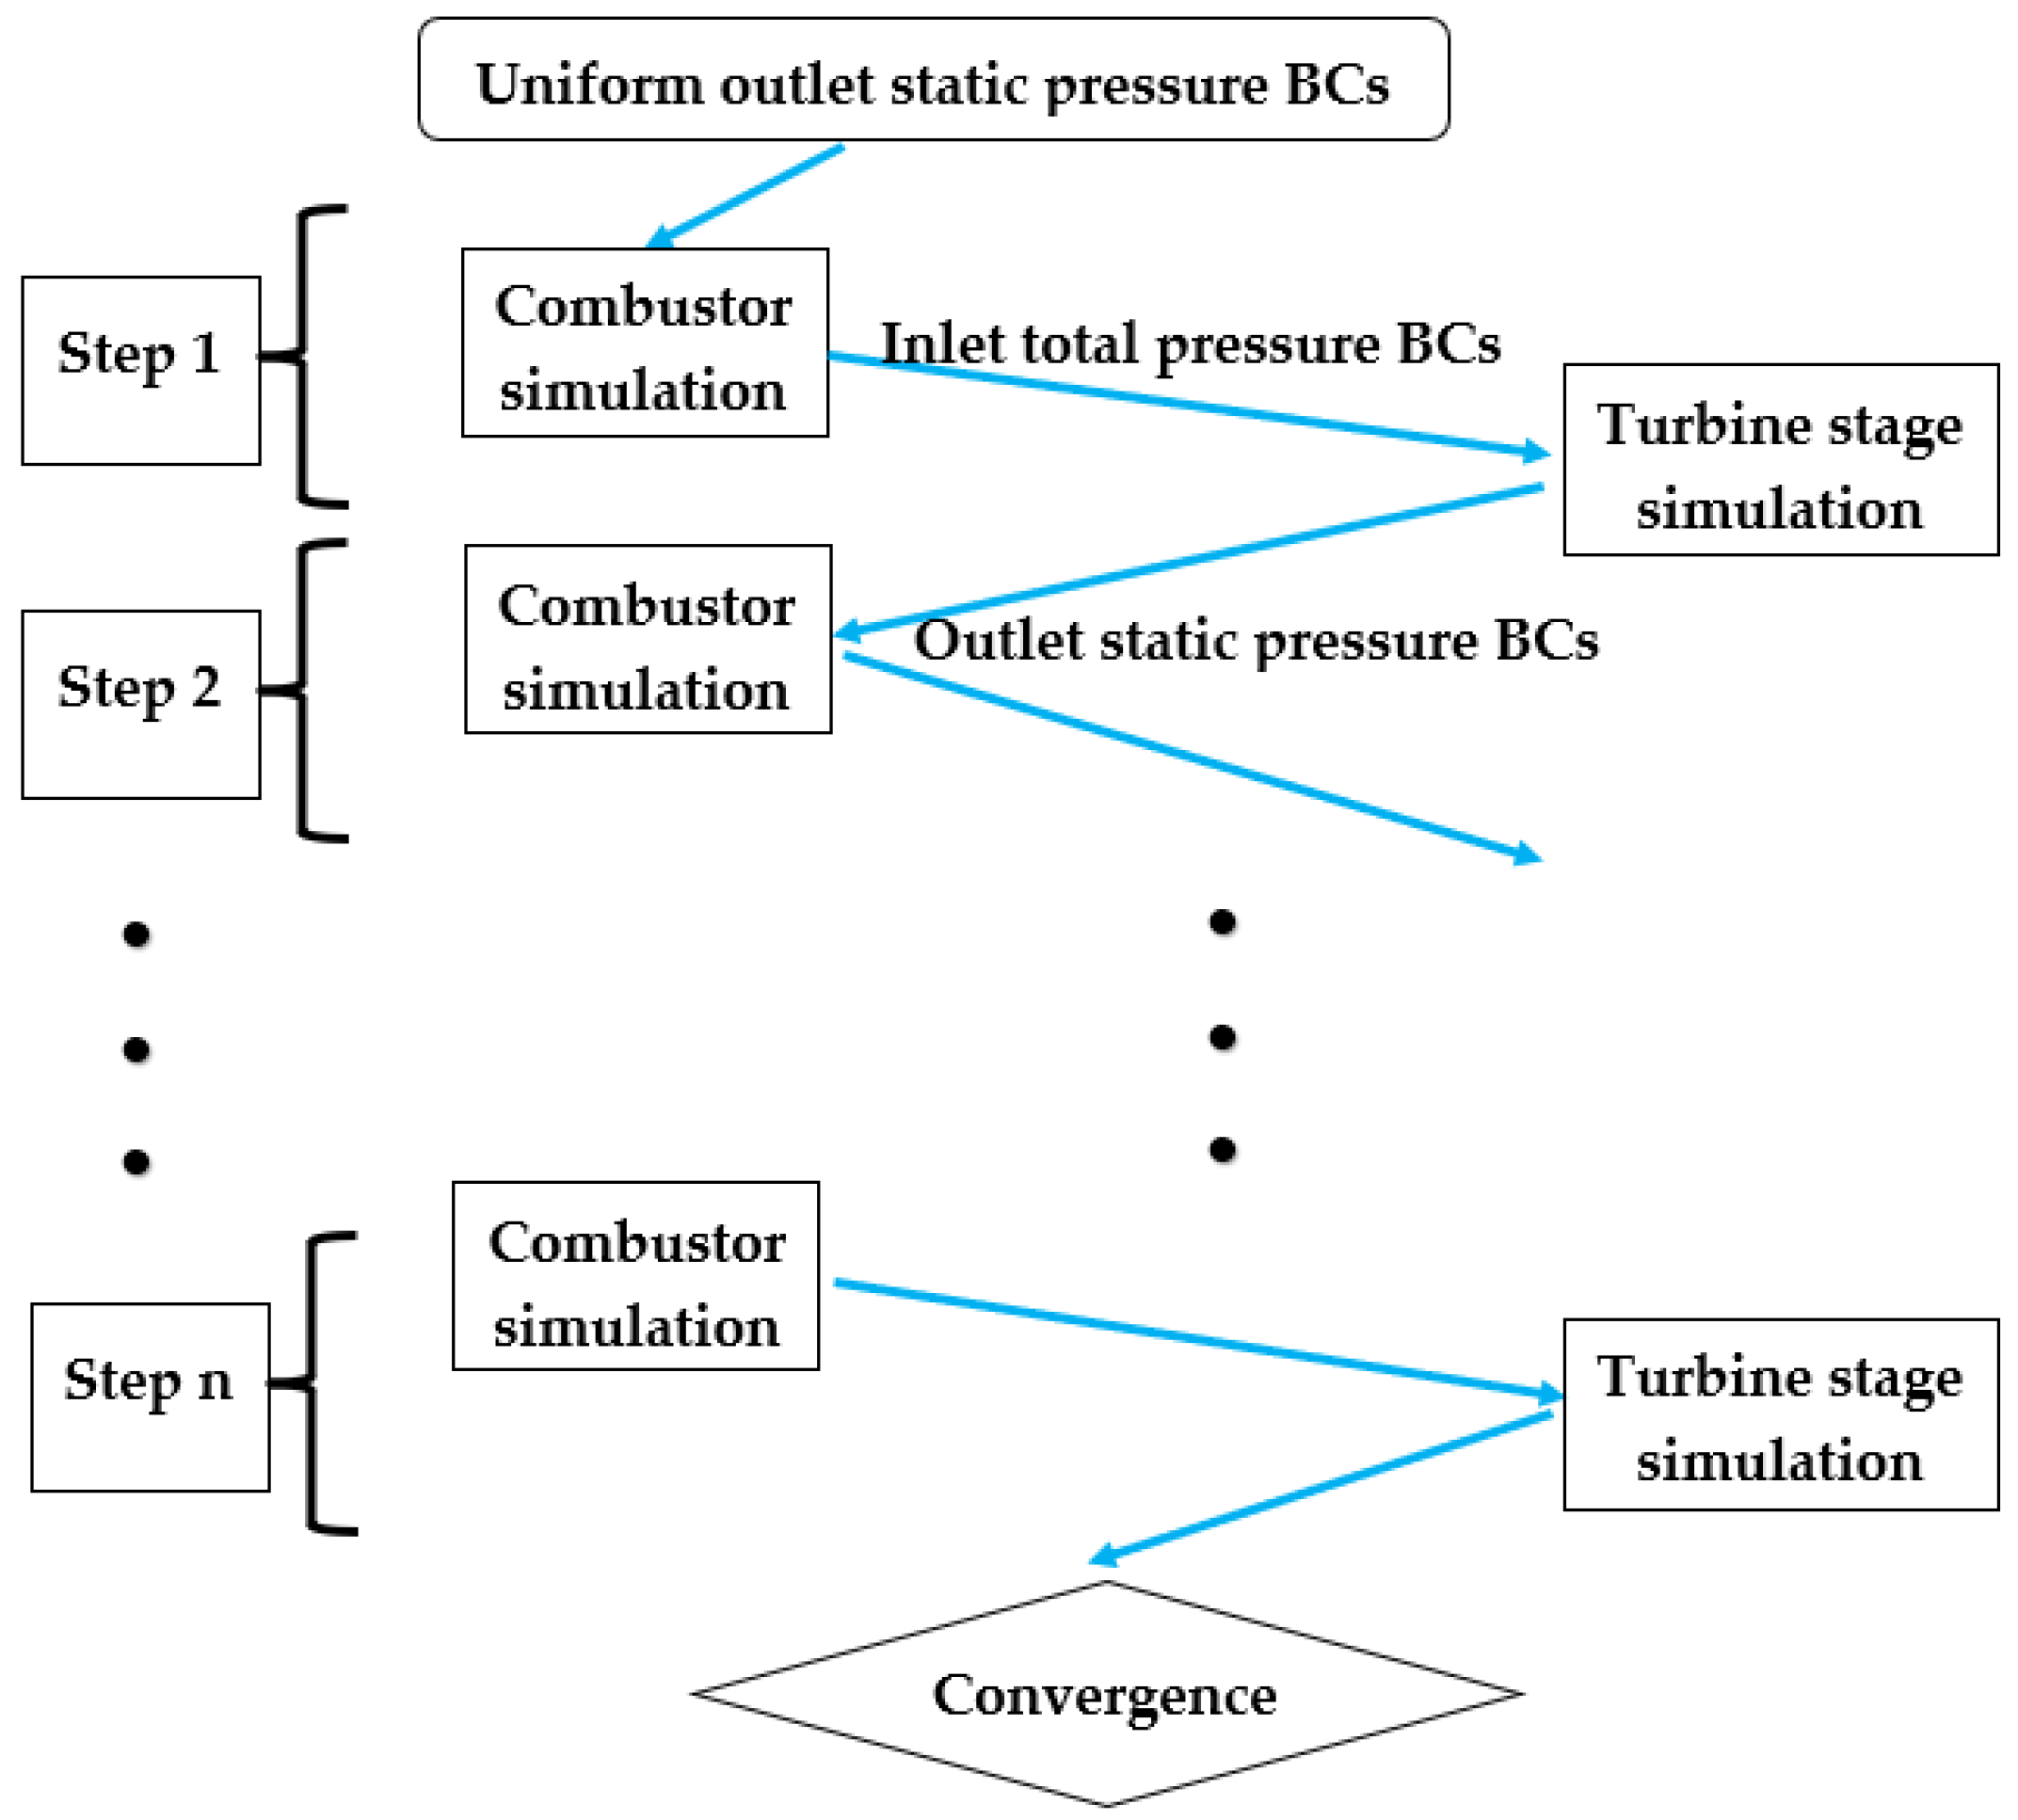
4. Decoupled vs. Coupled Simulation Methods

As pointed out in the literature, the combustor–turbine interaction is commonly investigated using the decoupled simulation method due to the constraint of computational resources. This practice is encouraged by the thought that the decoupled simulation can converge quickly in a few iterations, and the result is supposed to be similar to that of the fully coupled simulation. Prior to the main analyses of the fully coupled simulation results, first, the comparison between the decoupled and fully coupled simulation approaches are compared.
Figure 3 illustrates the sequential decoupled simulation method workflow for the simulation of combustor–turbine interaction. In the first iteration step, the combustor is simulated with an assumed uniform outlet static pressure boundary condition. Once the combustor simulation finishes, the total pressure and total temperature distribution at the combustor outlet is obtained. This total pressure and total temperature field acts as the inlet boundary conditions for the subsequent turbine stage simulation. Once the turbine stage simulation finishes, an iteration step finishes. In the next iteration step, a static pressure field at the turbine inlet is derived from the previous turbine stage simulation, which acts as the new outlet static pressure boundary condition for the next combustor simulation. This process continues for a few iterations until the solution fields converge. It is noted that combustion and species transport are modeled within the combustor domain only. The turbine stage domain is modeled with air ideal gas.
In contrast, Figure 4 illustrates the coupled simulation method workflow for the simulation of combustor–turbine interaction. The combustor domain and the turbine stage domain are directly coupled in space and time. During each pseudo-timestep, both domains are solved and driven toward the converged solution. Unlike the sequential decoupled simulation approach, combustion and species transport modeling are applied for the whole combustor–turbine domain. As a result, the combustion process and transport of the combustion gases can be observed inside the turbine domain.
Figure 5 compares the combustor efficiency calculated using the sequential decoupled approach against the coupled simulation approach. The prediction of the decoupled approach begins to stabilize after the third iteration; however, it still needs more iterations to converge to an acceptable error. The converged solution of the sequential decoupled approach is different to that from the coupled approach, with about 1.5% error. It has been noted that combustion and species transport modeling are the same in the combustor domain for both decoupled and coupled approaches. The only difference comes from the boundary conditions at the combustor–turbine interface. The result of the sequential decoupled approach at iteration step 1 represents the results of the standalone combustion chamber with a uniform outlet boundary condition. It is only less than 1% different from that predicted by the coupled approach and 1.5% different from the converged decoupled approach. Thus, it can be seen that the turbine potential field induced upstream has a negligible effect on the combustion chamber.
Figure 6 shows the comparison of turbine efficiency calculated using the sequential decoupled approach against the coupled simulation approach. The prediction of the decoupled approach begins to stabilize after the third iterations; however, it still needs more iterations to converge to an acceptable error. The converged solution of the sequential decoupled approach is different to that from the coupled approach, with approximately 4% error. It has been noted that the combustion and species transport modeling inside the turbine domain are applied in the coupled approach but not in the decoupled approach. The discrepancy between the two approaches not only stems from the boundary conditions at the combustor–turbine interface but also from the effects of multi-species gases in the turbine domain. As a result, it can be concluded that combustion and species transport modeling are important for a combustor–turbine interaction investigation. The sequential decoupled approach, although it initially appeared to be more efficient due to truncated domain modeling, turns out to be less efficient (due to a number of iterations required to achieve coupling convergence) and less accurate (due to the lack of modeling combustion and species transport effects in the turbine domain) compared to the coupled approach. The numerical prediction within the turbine domain is more significantly affected by the choice of simulation coupling approach, while the numerical predictions within the combustor domain are slightly affected as a result of upstream propagation from the turbine domain.

5. Aerothermodynamics and Soot Transportation across the Turbine Stage

In this section, the flow vortical structure across the turbine stage is investigated more in detail. Figure 7 shows the iso-surfaces of temperature T = 1300 K across the turbine stage. Because the temperature diffuses across the first turbine vane blade row, the constant temperature iso-surfaces do not appear in the rotor blade row. In Figure 7a, the hot-streak originates from the mid-passage circumferential location. As a result, the high-temperature vortical structure moves in between two stator blades. On the other hand, Figure 7b shows the movement of hot streak vortical structure for the case with leading edge impingement. The vortical structure comes into contact and wraps around the stator blades. It should also be noted that the mass flow averaged turbine inlet temperature in the current test case is about 1000 K, although the hot-spot temperature can reach above 1400 K, as shown in Figure 7. For modern micro-gas turbine applications without turbine cooling, the turbine inlet temperature will be in the range 900–1200 K, which is a significant advancement compared to 800–900 K in the early micro-gas turbines [42].
Because of the circumferentially relative location of the hot-streak vortical flow structure presented in Figure 7, the turbine vanes (stators) are exposed to different incoming flow temperatures. Figure 8 shows the turbine vane wall temperature on the suction surface (SS) for the mid-passage hot-streak case (Figure 8a) and the leading-edge hot-streak case (Figure 8b). It can be clearly seen that the hot-streak impingement on the leading-edge (Figure 8b) significantly increases the turbine vane wall temperature. The affected area tends to be at the lower half span, and it is more significant near the leading edge (LE). The high-temperature area diminishes as the flow approaches the blade trailing edge (TE). The high-temperature area exhibits the characteristic of the vortical flow structure wrapping around the turbine vane shown in Figure 7b. In addition, the lift-up area near the hub wall resembles that of the secondary passage vortex in the turbine cascade [32].
On the other hand, Figure 9 shows the turbine vane wall temperature on the pressure surface (PS) for the mid-passage hot-streak case (Figure 9a) and the leading-edge hot-streak case (Figure 9b). Similarly to what has been observed from Figure 8, the leading-edge impingement case (Figure 9b) exhibits a significantly higher wall temperature compared to the mid-passage case (Figure 9a). The most affected area is also the lower half span and near the leading edge (LE). Combining the observations from Figure 8 and Figure 9, it can be deduced that the relative location of the hot-streak impingement and the turbine vane significantly affects the blade aerothermal performances. Exposure of high wall temperature will lead to a shorter turbine life span due to increasing thermal stress.
Figure 10 shows the contour of the Jet-A fuel concentration at the axial location of the turbine stator inlet. Non-zero Jet-A gaseous fuel concentration downstream the combustor outlet suggests that fuel is not entirely combusted inside the combustor domain. Unburnt fuel propagates downstream across the turbine stage, carried by the vortical structures seen previously (e.g., Figure 7). The fuel concentration is highest in the mid-span region, and its distribution resembles that of the hot streak vortex.
Figure 11 illustrates the transportation of unburnt Jet-A fuel after the combustion chamber for case (a) with hot streak passing through the passage and case (b) with hot streak impinging onto the turbine vane leading edge. Firstly, the Jet-A fuel concentration clearly decays along the axial flow direction, indicating that combustion still takes place after the combustor and inside the turbine stage. The rate of decay of Jet-A fuel is rapid with most of the unburnt fuel combusted after passing the turbine vane row. Interestingly, Figure 11a,b show two different decaying characteristics. In Figure 11a, the zone of large unburnt Jet-A concentration passes through the turbine vane row with less decay compared to Figure 11b, where the zone impinges onto the vane leading edge. Halfway through the turbine vane row, Jet-A decays more significantly in Figure 11b. After the turbine vane row, the flow goes onto the next turbine rotor row, at which the Jet-A concentration is almost fully combusted in both cases.
Figure 12 shows the circumferentially radially averaged Jet-A fuel concentration distribution across the turbine stage. For both the leading-edge and mid-passage hot-streak cases, the Jet-A fuel concentration decays rapidly after the combustor outlet. However, the decay rate is discernible across the blade rows, with a more significant rate for the leading-edge hot-streak configuration. This is due to the leading-edge impingement effect described above, where the vortical structure carries unburnt fuel, impinges on the turbine vane, and enhances the secondary combustion process in the turbine stage. For both cases, the Jet-A fuel concentration after the turbine stage almost diminishes to zero, suggesting that the combustion process ends.
Figure 13 illustrates the formation and transportation of soot after the combustor for case (a) with hot streak passing through the passage and case (b) with hot streak impinging on the turbine vane leading edge. From the combustor study, we know that as the combustion process takes place, the Jet-A concentration decreases and combustion products such as the soot concentration increase. From Figure 12, we can observe that the Jet-A concentration decreases as the flow goes through the turbine stage. As a result, it is expected that the soot concentration would increase across the turbine stage. In Figure 13, the additional soot formation cannot be clearly observed, and the soot transportation pattern is also not clearly discernible between Figure 13a,b. The common characteristics in both cases are such that the soot distribution preserves their shapes across the turbine vane row but diffuses across the turbine rotor row.
Figure 14 shows the circumferentially radially averaged soot concentration distribution across the turbine stage. The overall trend is the same for both leading-edge and mid-passage hot-streak cases with a linear increase in soot concentration as the flow travels downstream. The soot concentration of the leading-edge hot-streak case is slightly higher than that of the mid-passage hot-streak case for all axial locations across the turbine stage.

6. Effects of Stator Clocking

In Section 5, the relative circumferential location of hot-streak impingement and the turbine vane were shown to have pronounced effects on the micro gas turbine aerothermal performance and emission characteristics. In this section, the relative circumferential location will be investigated in more detail using the design variable known as clocking. Clocking is the control of the relative location between the combustor and the turbine stator, which effectively implies the control of the circumferential location of the hot streak relative to the turbine vane. Each revolution of the clocking period is defined as the angle between two consecutive turbine vanes. It is thus related to the number of turbine vanes in the blade row:
Φ = N b 2 π
where Φ is the angle in radians of each complete clocking revolution and N b is the number of turbine vanes in the blade row.
For each complete clocking revolution, multiple clocking positions will be simulated and compared to investigate the clocking effects.

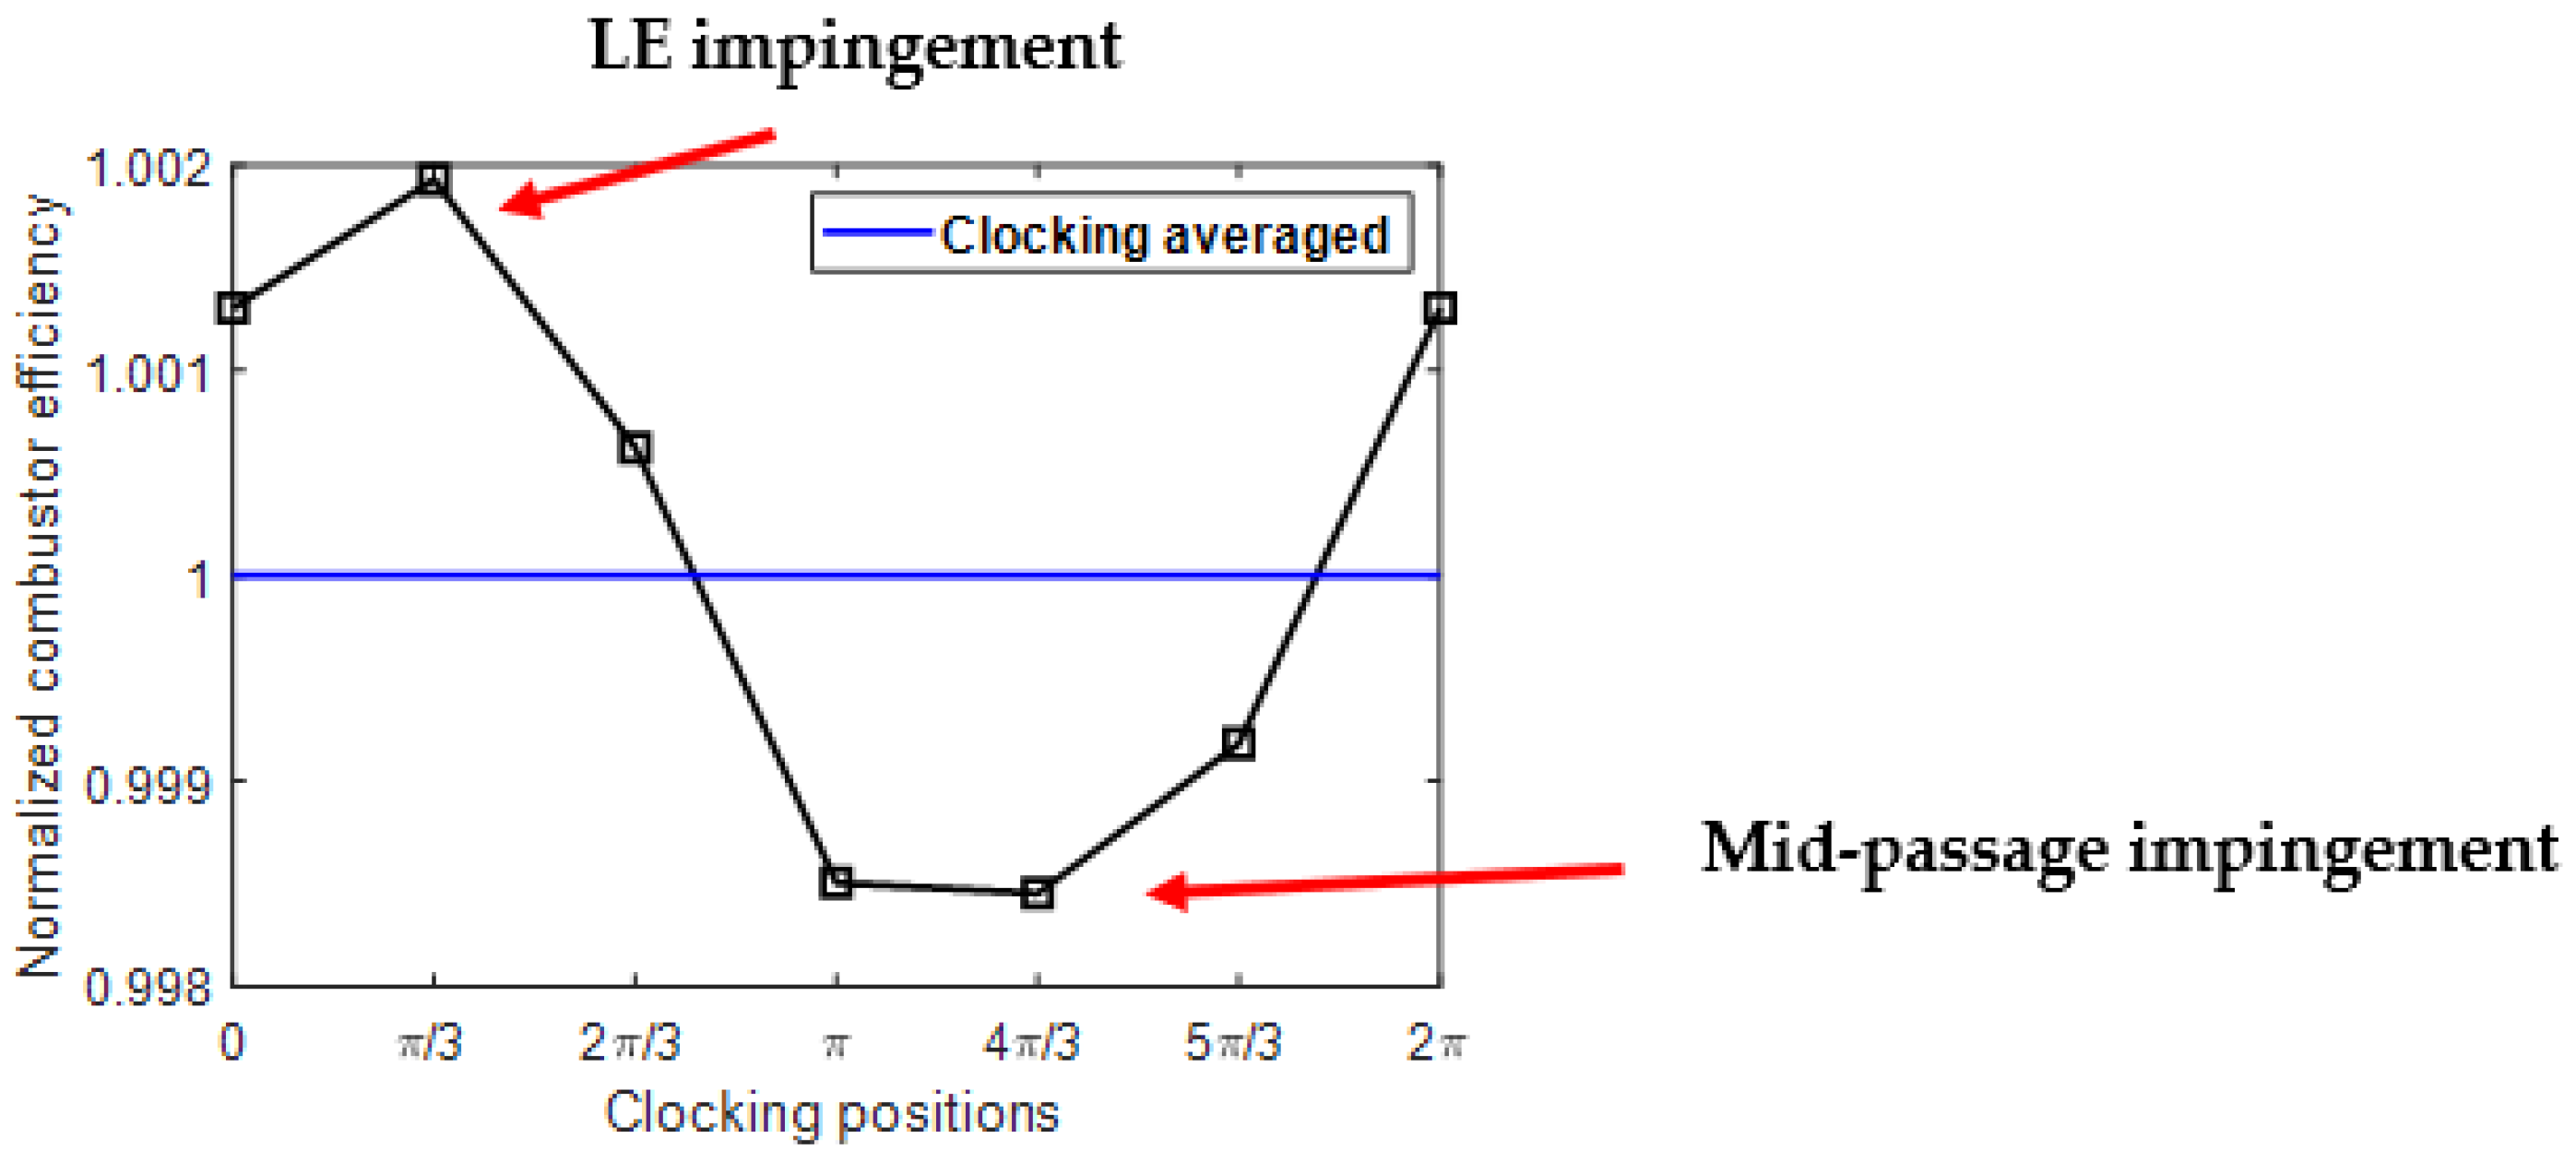
6.1. Combustor Efficiency

In present simulations, clocking positions are adjusted by changing the circumferential location of the turbine vane blade row while keeping the combustor stationary. First, we investigated the effects of stator clocking on the combustor efficiency. Figure 15 shows the variation in normalized combustor efficiency with clocking positions. It can be seen that the combustor efficiency varies in a sinusoidal pattern with a very small amplitude. Figure 15 suggests that clocking effects propagate upstream and affect the combustor aerothermodynamics although its impact is small. The peak of the sinusoidal curve in Figure 15 is the case with hot-streak leading-edge impingement, while the trough is the case with hot-streak mid-passage impingement. The interaction between the downstream combustor flow and the turbine vanes seems to slightly enhance the combustor efficiency.

6.2. Turbine Aerodynamics Efficiency

Figure 16 shows the variation in normalized turbine aerodynamic efficiency with clocking positions. The turbine aerodynamic efficiency varies largely in a sinusoidal pattern with a small amplitude. Although the flow field and vortical structure are quite different among the clocking positions (as seen in previous discussions), the turbine aerodynamic efficiency is not significantly affected. This is attributed to the effects of the rotor operation, which diffuses the flow significantly and enhances mixing. The peak of the near sinusoidal curve in Figure 16 is the case with hot-streak leading-edge impingement, while the trough is the case with hot-streak mid-passage impingement. There is a sudden jump between the clocking position ϕ = 4 π / 3 and ϕ = 5 π / 3 , but the origin of this variation is not well understood. In general, the interaction between the downstream combustor flow and the turbine vanes seems to slightly enhance the turbine efficiency.

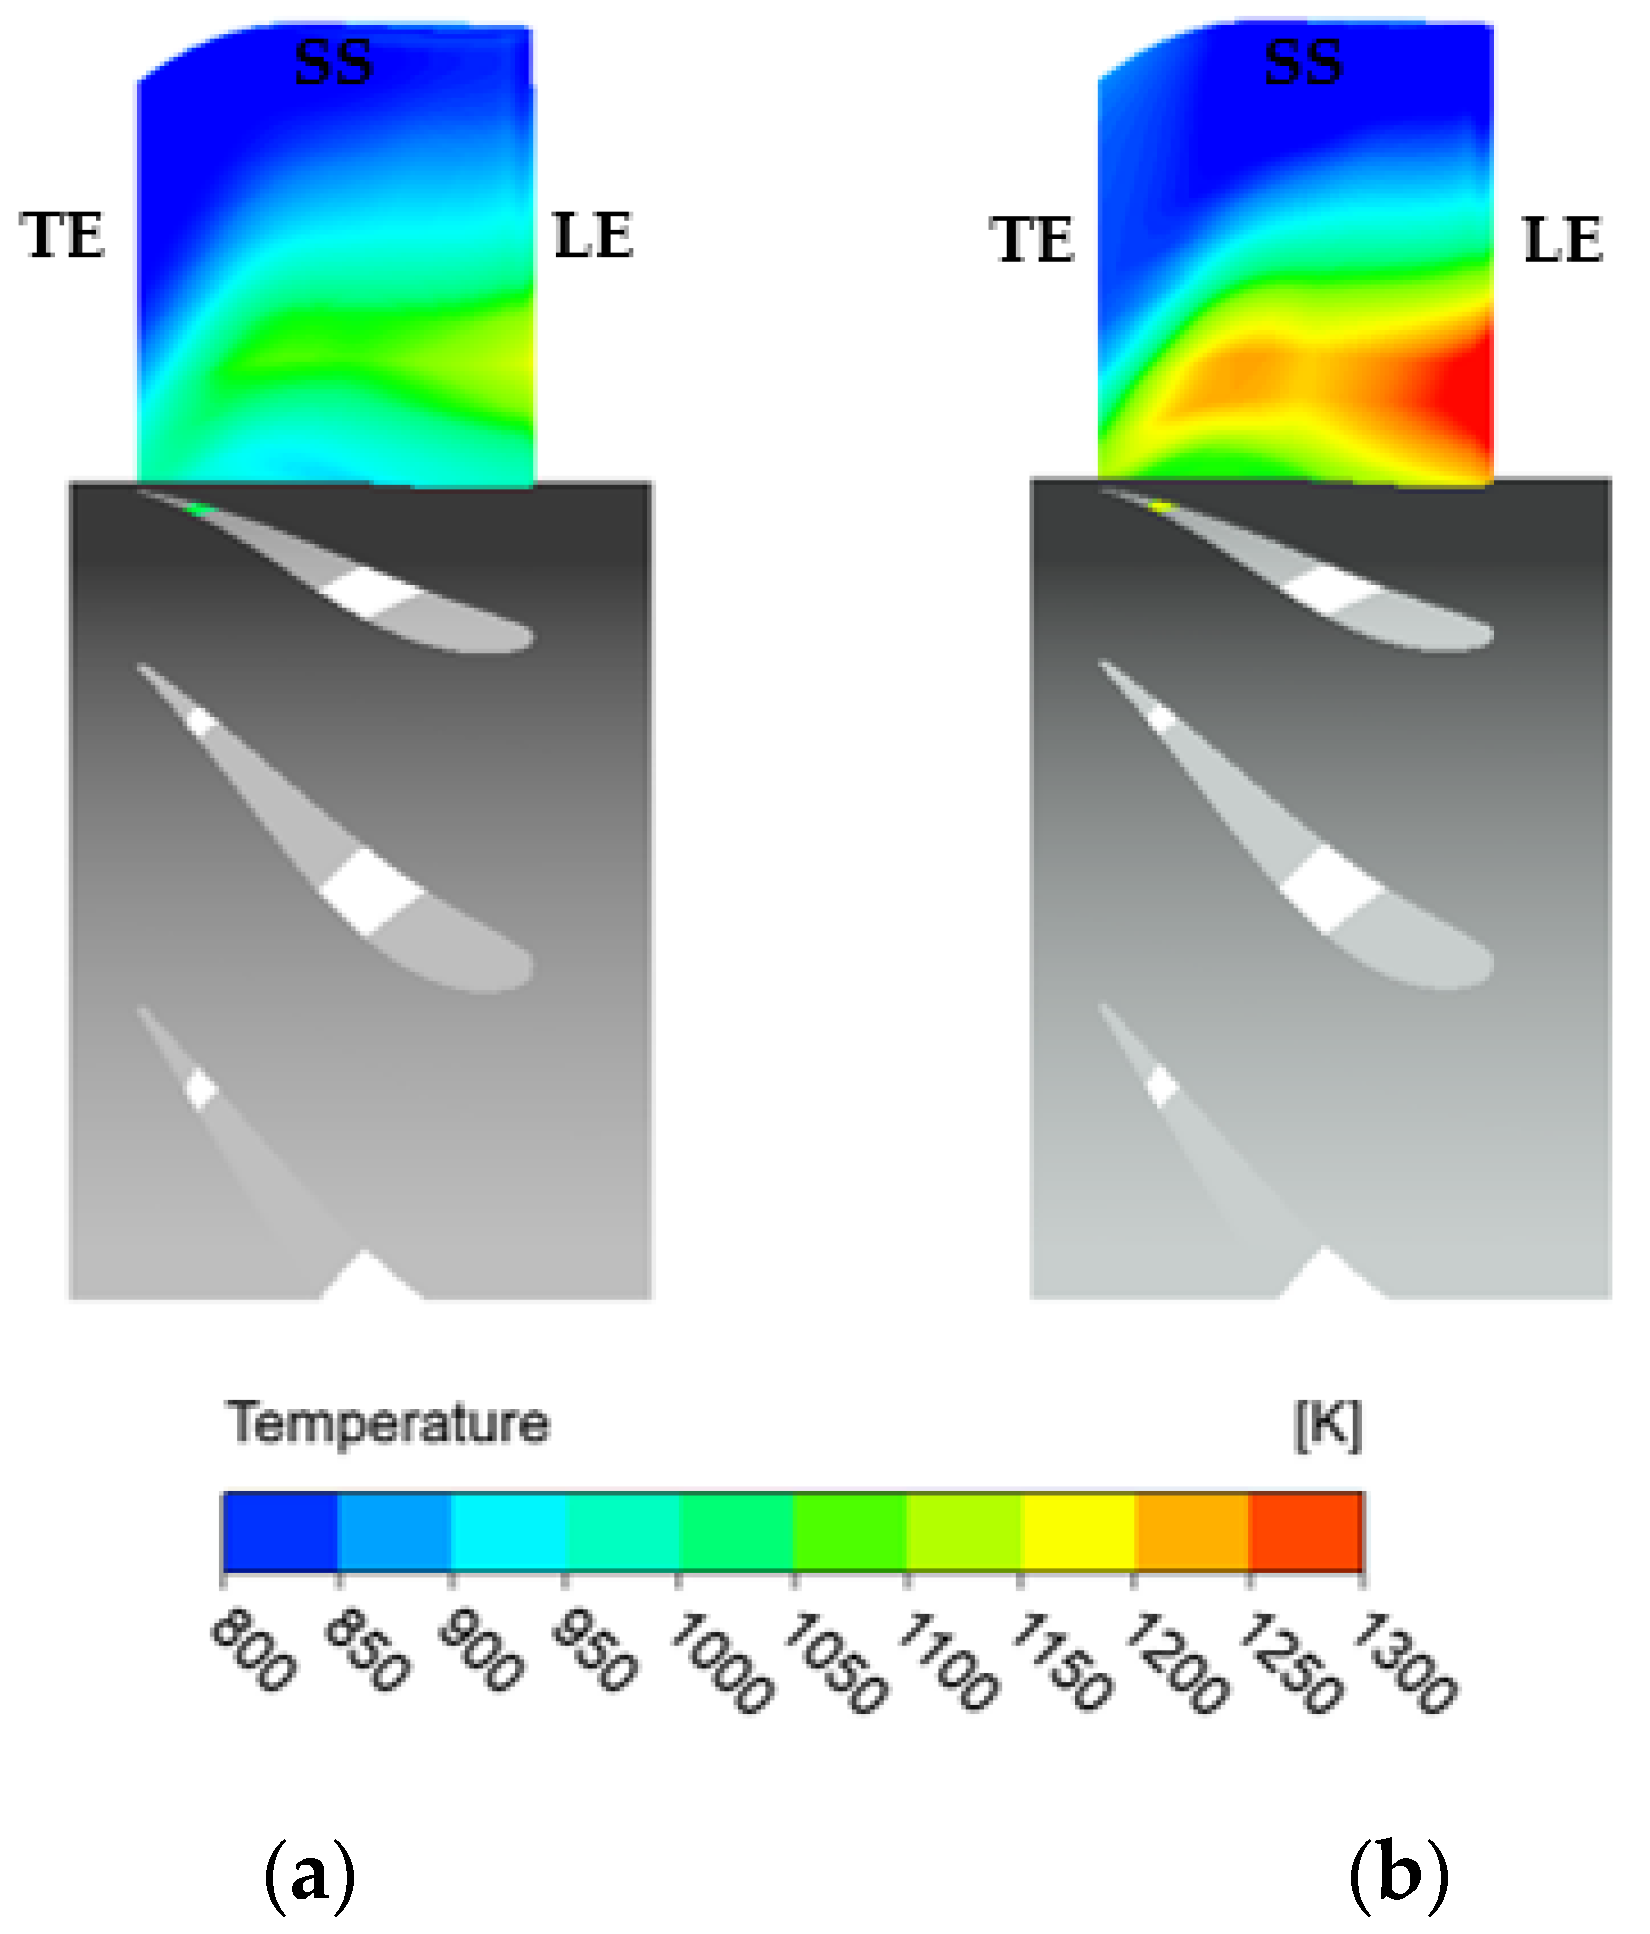
6.3. Turbine Heat Transfer

Figure 17 shows the clocking effects on the normalized area-averaged turbine stator wall temperature. The stator wall temperature changes dramatically with clocking positions and exhibits a sinusoidal pattern. The peak of the sinusoidal curve in Figure 17 is the case with hot-streak leading-edge impingement, while the trough is the case with hot-streak mid-passage impingement. This confirms our qualitative observations in the previous section about the effects of hot-streak location on the turbine stator wall temperature.
Figure 18 shows the clocking effects on the normalized area-averaged turbine rotor wall temperature. It is quite interesting to observe that the rotor wall temperature only slightly changes with clocking positions, unlike previous observations with the stator wall temperature (Figure 17). This effect might be attributed to two sources: (1) the significant decay of bulk flow temperature when passing through the stator blade row and (2) the rapid diffusion and mixing effects of the rotor with rotational effects in action. The peak of the sinusoidal curve in Figure 18 is the case with hot-streak leading-edge impingement, while the trough is the case with hot-streak mid-passage impingement.
Combining the observations in Figure 17 and Figure 18, it can be deduced that the heat transfer performance of the turbine stator blade row is significantly affected by the clocking effects. The rotor heat transfer performance is only slightly affected.

6.4. Soot Formation

Figure 19 illustrates the variation in normalized soot emissions with clocking positions. Soot emission varies in a sinusoidal pattern with a rather small amplitude. The peak of the sinusoidal curve in Figure 19 is the case with hot-streak leading-edge impingement, while the trough is the case with hot-streak mid-passage impingement, in agreement with the findings in Section 5. This is due to the combustion of unburnt fuel in the turbine stage and mixing enhancement due to the hot-streak leading-edge impingement. It is additional evidence that the complex interplay of the flow field can affect the pollutant emission characteristics.

7. Conclusions

The current study serves as a continuation of our previous study [27], which explored the aerothermal performance and emission characteristics of a micro-gas turbine combustor. In the present work, the interaction between the combustor and the turbine is investigated more in detail with a focus on the clocking effects. Both studies are part of a more comprehensive project aimed at understanding the fundamental aerothermal performance and emission characteristics of a micro gas turbine model and finding ways to improve its operation. A complex computational fluid dynamics (CFD) model was developed in this project that has the capability to model the reacting flow in the combustion chamber and its transportation downstream across the turbine stage. The model is highly accurate with the full coupling between the combustor and the turbine stage domain, and the errors due to truncated and periodic domains are removed. In addition, the annular domain is modelled as a whole annulus without any truncation in the domain, and there is no use of periodic boundary conditions. With such high modelling accuracy, the present study provides many useful insights and understanding into the interaction between the combustor and the turbine stage with a particular focus on the complex interplay among the flow field, aerothermal performance, and soot emissions. The main points are briefly summarized below:
  • The sequential decoupled modeling approach is not as accurate as the fully coupled modeling approach because the unburnt fuel at the combustor outlet continues its combustion process in the turbine stage and the upstream propagation effect is not fully captured. Both predictions of aerothermal performance and emission characteristics are affected by the choice of modeling approach. At first, the sequential decoupled approach seems to be more efficient since only a few coupling iterations are needed. However, the present study shows that the sequential decoupled simulation approach will struggle to converge to a tight tolerance because the flow field settles slowly in response to the continuous changes in boundary conditions. The fully coupled simulation approach is more accurate and easier to converge at the cost of high memory due to a large simulation domain.
  • Unburnt gaseous Jet-A fuel travels downstream of the combustion chamber and into the turbine stage domain within the vortical flow structure. The combustion process still takes place inside the turbine domain. The Jet-A fuel concentration decays rapidly across the turbine domain, while soot concentration increases linearly.
  • The relative circumferential location of the combustion chamber and the turbine vane (clocking effects) has been shown to affect the aerothermodynamics and pollutant emissions of the micro-gas turbine. The leading-edge impingement hot-streak configuration is favored in terms of improving aerodynamic efficiency. On the other hand, the mid-passage hot-streak configuration is favored in terms of reducing aerothermal heat load and reducing soot emissions. Although all aerothermodynamic and pollutant emissions parameters are affected by the clocking effects, the turbine vane heat load is the most significantly affected parameter (up to ± 10% for the peak and trough compared to the averaged value).

Author Contributions

Conceptualization, H.W. and K.H.L.; methodology, H.W.; software, H.W.; validation, H.W.; formal analysis, H.W. and K.H.L.; investigation, H.W. and K.H.L.; data curation, H.W.; writing—original draft preparation, H.W.; writing—review and editing, H.W. and K.H.L.; visualization, H.W.; supervision, K.H.L. All authors have read and agreed to the published version of the manuscript.

Funding

Support from the UK Engineering and Physical Sciences Research Council under the project “UK Consortium on Mesoscale Engineering Sciences (UKCOMES)” (Grant No. EP/X035875/1) is gratefully acknowledged. This work made use of computational support by CoSeC, the Computational Science Centre for Research Communities, through UKCOMES.

Data Availability Statement

Numerical values such as efficiency are reported as normalization in the present work. The data that support the findings of this study are available for academic purposes upon reasonable request with proper non-disclosure agreements.

Acknowledgments

The authors would like to thank the editor and the anonymous reviewers for the insightful comments that lead to the improvement of the quality of this paper.

Conflicts of Interest

The authors declare no conflict of interest.

Nomenclature

MGTMicro-gas turbine
ORCOrganic Rankine cycle
CFDComputational fluid dynamics
ETABEnhanced Taylor Analogy Breakup
TABTaylor Analogy Breakup
BCBoundary condition
SSSuction surface
PSPressure surface
LELeading edge
TETrailing edge
TTemperature
FEngine thrust
η Efficiency
Φ Angle of each complete clocking revolution
ϕ Clocking position

References

  1. De Robbio, R. Micro gas turbine role in distributed generation with renewable energy sources. Energies 2023, 16, 704. [Google Scholar] [CrossRef]
  2. Banihabib, R.; Assadi, M. The role of micro gas turbines in energy transition. Energies 2022, 15, 8084. [Google Scholar] [CrossRef]
  3. Ji, F.; Zhang, X.; Du, F.; Ding, S.; Zhao, Y.; Xu, Z.; Wang, Y.; Zhou, Y. Experimental and numerical investigation on micro gas turbine as a range extender for electric vehicle. Appl. Therm. Eng. 2020, 173, 115236. [Google Scholar] [CrossRef]
  4. Capata, R.; Saracchini, M. Experimental campaign tests on ultra micro gas turbines, fuel supply comparison and optimization. Energies 2018, 11, 799. [Google Scholar] [CrossRef]
  5. Habib, Z.; Parthasarathy, R.; Gollahalli, S. Performance and emission characteristics of biofuel in a small-scale gas turbine. Appl. Energy 2013, 87, 1701–1709. [Google Scholar] [CrossRef]
  6. Large, J.; Pesyiridis, A. Investigation of micro gas turbine systems for high speed long loiter tactical unmanned air systems. Aerospace 2019, 6, 55. [Google Scholar] [CrossRef]
  7. Miki, K.; Moder, J.; Liou, M.S. Computational study of combustor-turbine interactions. J. Propuls. Power 2018, 34, 1529–1541. [Google Scholar] [CrossRef]
  8. Raynauld, F.; Eggels, R.L.G.M.; Staufer, M.; Sadiki, A.; Janicka, J. Towards unsteady simulation of combustor-turbine interaction using an integrated approach. In Proceedings of the Turbo Expo 2015: Turbine Technical Conference and Exposition, Volume 2B: Turbomachinery, Montreal, QC, Canada, 15–19 June 2015. GT2015-42110. [Google Scholar]
  9. Koupper, C.; Bonneau, G.; Gicquel, L.; Duchaine, F. Large eddy simulations of the combustor turbine interface: Study of the potential and clocking effects. In Proceedings of the Turbo Expo 2016: Turbomachinery Technical Conference and Exposition, Volume 5B: Heat Transfer, Seoul, South Korea, 13–17 June 2016. GT2016-56443. [Google Scholar]
  10. Lo Presti, F.; Sembritzky, M.; Winhart, B.; Post, P.; di Mare, F.; Wiedermann, A.; Greving, J.; Krewinkel, R. Numerical investigation of unsteady combustor turbine interaction for flexible power generation. J. Turbomach. 2022, 144, 021003. [Google Scholar] [CrossRef]
  11. Duchaine, F.; Dombard, J.; Gicquel, L.; Koupper, C. Integrated large eddy simulation of combustor and turbine interactions: Effect of turbine stage inlet condition. In Proceedings of the Turbo Expo 2017: Turbomachinery Technical Conference and Exposition, Volume 2B: Turbomachinery, Charlotte, NC, USA, 26–30 June 2017. GT2017-63473. [Google Scholar]
  12. Flaszynski, P.; Piotrowicz, M.; Bacci, T. Clocking and potential effects in combustor-turbine stator interactions. Aerospace 2021, 8, 285. [Google Scholar] [CrossRef]
  13. Miki, K.; Wey, T.; Moder, J. Computational study on fully-coupled combustor-turbine interactions. J. Propuls. Power 2022, 39, 15. [Google Scholar] [CrossRef]
  14. Salvadori, S.; Riccio, G.; Insinna, M.; Martelli, F. Analysis of combustor/vane interaction with decoupled and loosely coupled approaches. In Proceedings of the ASME Turbo Expo 2012: Turbine Technical Conference and Exposition, Volume 8: Turbomachinery, Parts A, B, and C, Copenhagen, Denmark, 11–15 June 2012. GT2012-69038. [Google Scholar]
  15. Verma, I.; Zori, L.; Basani, J.; Rida, S. Modeling of combustor and turbine vane interaction. In Proceedings of the ASME Turbo Expo 2019: Turbomachinery Technical Conference and Exposition, Volume 2C: Turbomachinery, Phoenix, AZ, USA, 17–21 June 2019. GT2019-90325. [Google Scholar]
  16. Nguyen, T.H.; Nguyen-Tri, P.; Vancassel, X.; Garnier, F. Aero-thermodynamic and chemical process interactions in an axial high-pressure turbine of aircraft engines. Int. J. Engine Res. 2019, 20, 653–669. [Google Scholar] [CrossRef]
  17. Perpignan, A.A.; Tomasello, S.G.; Rao, A.G. Evolution of emission species in an aero-engine turbine stator. Aerospace 2021, 8, 11. [Google Scholar] [CrossRef]
  18. Schreckling, K. Home Built Model Turbines; Traplet Publications Limited: Malvern, UK, 2005. [Google Scholar]
  19. Xiang, J.; Schlüter, J.U.; Duan, F. Study of KJ-66 micro gas turbine compressor: Steady and unsteady Reynolds-averaged Navier-Stokes approach. Proc. Inst. Mech. Eng. G J. Aerosp. Eng. 2017, 231, 904–917. [Google Scholar] [CrossRef]
  20. Teixera, M.; Romagnosi, L.; Mezine, M.; Baux, Y.; Anker, J.; Claramunt, K.; Hirsch, C. A methodology for fully-coupled CFD engine simulations, applied to a micro gas turbine engine. In Proceedings of the Turbo Expo 2018: Power for Land, Sea, and Air, Volume 2C: Turbomachinery, Oslo, Norway, 11–15 June 2018; Volume 2. GT2018-76870. [Google Scholar]
  21. Yang, C.; Wu, H.; Du, J.; Zhang, H.; Yang, J. Full-engine simulation of micro gas turbine based on time-marching throughflow method. Appl. Therm. Eng. 2022, 217, 119213. [Google Scholar] [CrossRef]
  22. Xu, Y.; Yan, C.; Piao, Y. Analysis of discrepancies between 3-D coupled and uncoupled schemes based on CFD in full engine simulation. Aerosp. Sci. Technol. 2022, 131, 107978. [Google Scholar] [CrossRef]
  23. Arroyo, C.P.; Dombard, J.; Duchaine, F.; Gicquel, L.; Martin, B.; Odier, N.; Staffelbach, G. Towars the large-eddy simulation of a full engine: Integration of a 360 azimuthal degrees fan, compressor and combustion chamber. Part I: Methodology and Initialisation. J. Glob. Power Propuls. Soc. 2021, 133115. [Google Scholar] [CrossRef]
  24. Xu, Y.; Gao, L.; Cao, R.; Yan, C.; Piao, Y. Power balance strategies in steady-state simulation of the micro gas turbine engine by component-coupled 3D CFD method. Aerospace 2023, 10, 782. [Google Scholar] [CrossRef]
  25. Wang, H.; Luo, K.H. Numerical investigation of dump diffuser combustor performance at uniform and non-uniform inlet conditions. In Proceedings of the Turbo Expo: Power for Land, Sea, and Air, London, UK, 21–25 September 2020. GT2020-15982. [Google Scholar]
  26. Wang, H.; Luo, K.H. Aerothermal performance and soot emissions of reacting flow in a micro-gas turbine combustor. Energies 2023, 16, 2947. [Google Scholar] [CrossRef]
  27. Barth, T.; Jespersen, D. The design and application of upwind schemes on unstructured meshes. In Proceedings of the 27th Aerospace Sciences Meeting, Reno, NV, USA, 9–12 January 1989. AIAA 89-0366. [Google Scholar]
  28. Rhie, C.M.; Chow, W.L. Numerical study of the turbulent flow past an airfoil with trailing edge separation. AIAA J. 1983, 21, 1525–1532. [Google Scholar] [CrossRef]
  29. Menter, F.R. Two-equation eddy-viscosity turbulence models for engineering applications. AIAA J. 1994, 32, 1598–1605. [Google Scholar] [CrossRef]
  30. Wahba, E.M.; Nawar, H. Multiphase Flow Modeling and optimization for online wash systems of gas turbines. Appl. Math. Model. 2013, 37, 7549–7560. [Google Scholar] [CrossRef]
  31. Liu, H.F.; Li, W.F.; Gong, X.; Cao, X.K.; Xu, J.L.; Chen, X.L.; Wang, Y.F.; Yu, G.S.; Wang, F.C.; Yu, Z.H. Effect of liquid jet diameter on performance of coaxial two-fluid airblast atomizers. Chem. Eng. Process 2006, 45, 240–245. [Google Scholar] [CrossRef]
  32. Tanner, F.X. Liquid jet atomization and droplet breakup modeling of non-evaporating diesel fuel sprays. SAE Trans. 1997, 106, 127–140. [Google Scholar] [CrossRef]
  33. Magnussen, B.F.; Hjertager, B.H. On mathematical modeling of turbulent combustion with special emphasis on soot formation and combustion. Symp. (Int.) Combust. 1977, 16, 719–729. [Google Scholar] [CrossRef]
  34. Tesner, P.A.; Smegiriova, T.D.; Knorre, V.G. Kinetics of dispersed carbon formation. Combust. Flame 1971, 17, 253–260. [Google Scholar] [CrossRef]
  35. Phan, H.M.; He, L. Validation studies of linear oscillating compressor cascade and use of influence coefficient method. J. Turbomach. 2020, 142, 051005. [Google Scholar] [CrossRef]
  36. Phan, H.M.; He, L. Efficient steady and unsteady flow modeling for arbitrarily mis-staggered bladerow under influence of inlet distortion. J. Eng. Gas. Turbine Power 2021, 143, 071009. [Google Scholar] [CrossRef]
  37. Phan, H.M. Modeling of a turbine bladerow with stagger angle variation using the multi-fidelity influence superposition method. Aerosp. Sci. Technol. 2022, 121, 107318. [Google Scholar] [CrossRef]
  38. Phan, H.M.; He, L. Efficient modeling of mistuned blade aeroelasticity using fully-coupled two-scale method. J. Fluids Struct. 2022, 115, 103777. [Google Scholar] [CrossRef]
  39. Phan, H.M.; He, L. Investigation of structurally and aerodynamically mistuned oscillating cascade using fully coupled method. J. Eng. Gas. Turbine Power 2022, 144, 031009. [Google Scholar] [CrossRef]
  40. Phan, H.M. A spatial-temporal analysis approach for flutter predictions using decoupled and fully-coupled methods. J. Fluids Struct. 2021, 107, 103412. [Google Scholar] [CrossRef]
  41. Phan, H.M.; Duan, P.H.; Dinh, C.T. Numerical aero-thermal study of high-pressure turbine nozzle guide vane: Effects of inflow conditions. Phys. Fluids. 2020, 32, 034111. [Google Scholar] [CrossRef]
  42. Li, J.; Li, Y. Micro gas turbine: Developments, applications, and key technologies on components. Propul. Power Res. 2023, 12, 1–43. [Google Scholar] [CrossRef]
Figure 1. Computational domain and mesh of the coupled combustor–turbine simulation: (a) combustion chamber; (b) turbine stage.
Energies 17 00873 g001
Figure 2. Full engine validation results for (a) engine thrust and (b) exhaust temperature [18,21].
Energies 17 00873 g002
Figure 3. Sequential decoupled simulation method workflow.
Energies 17 00873 g003
Figure 4. Coupled simulation method workflow.
Energies 17 00873 g004
Figure 5. Combustor efficiency predicted by the decoupled vs. coupled approach.
Energies 17 00873 g005
Figure 6. Turbine efficiency predicted by the decoupled vs. coupled approach.
Energies 17 00873 g006
Figure 7. Turbine inlet temperature and iso-surface of T = 1300 K for (a) mid-passage hot-streak case and (b) leading-edge hot-streak case.
Energies 17 00873 g007
Figure 8. Turbine stator blade suction surface wall temperature for (a) mid-passage hot-streak case and (b) leading-edge hot-streak case.
Energies 17 00873 g008
Figure 9. Turbine stator blade pressure surface wall temperature for (a) mid-passage hot-streak case and (b) leading-edge hot-streak case.
Energies 17 00873 g009
Figure 10. Jet-A concentration at turbine stator inlet, unburned fuel.
Energies 17 00873 g010
Figure 11. Unburnt Jet-A fuel transportation across the turbine stage for (a) mid-passage hot-streak case and (b) leading-edge hot-streak case.
Energies 17 00873 g011
Figure 12. Decay of Jet-A fuel concentration across the turbine stage.
Energies 17 00873 g012
Figure 13. Soot evolution and transportation across the turbine stage for (a) mid-passage hot-streak case and (b) leading-edge hot-streak case.
Energies 17 00873 g013
Figure 14. Accumulation of soot concentration across the turbine stage.
Energies 17 00873 g014
Figure 15. Effects of clocking on the normalized combustor efficiency.
Energies 17 00873 g015
Figure 16. Effects of clocking on the normalized turbine efficiency.
Energies 17 00873 g016
Figure 17. Effects of clocking on the normalized area-averaged turbine stator wall temperature.
Energies 17 00873 g017
Figure 18. Effects of clocking on the normalized area-averaged turbine rotor wall temperature.
Energies 17 00873 g018
Figure 19. Effects of clocking on the normalized soot concentration.
Energies 17 00873 g019
Table 1. Operating parameters of the redesign micro gas turbine.
ParametersValuesUnits
Thrust80N
Shaft speed20,000–120,000rpm
Air flow rate0.23kg/s
Table 2. Geometrical parameters of the redesign micro gas turbine.
ParametersValuesUnits
Diameter110mm
Length240mm
Vaporizing tubes12-
Turbine vane count12-
Turbine rotor blade count46-
Disclaimer/Publisher’s Note: The statements, opinions and data contained in all publications are solely those of the individual author(s) and contributor(s) and not of MDPI and/or the editor(s). MDPI and/or the editor(s) disclaim responsibility for any injury to people or property resulting from any ideas, methods, instructions or products referred to in the content.

