Article

Experimental Investigation on the Performance of the Scroll Expander under Various Driving Cycles

1
Beijing University of Technology, Beijing 100124, China
2
Mechanical Electrical Engineering School, Beijing Information Science and Technology University, Beijing 100192, China
3
Institute of Engineering Thermophysics, Chinese Academy of Sciences, Beijing 100190, China
4
Key Laboratory of Wind Energy Utilization, Chinese Academy of Sciences, Beijing 100190, China
5
University of Chinese Academy of Sciences, Beijing 100049, China
*
Authors to whom correspondence should be addressed.
Energies 2024, 17(2), 433; https://doi.org/10.3390/en17020433
Submission received: 30 November 2023 / Revised: 23 December 2023 / Accepted: 10 January 2024 / Published: 16 January 2024
(This article belongs to the Special Issue Novel Method, Optimization and Applications of Thermodynamic Cycles)

Abstract

:
Energy storage is considered a crucial unit in utilizing renewable energy sources, and compressed air energy storage (CAES) provides a cost-effective solution. It offers the benefits of zero pollution, a long lifespan, low maintenance costs, and minimal environmental impact. In order to increase the possibilities of compressed air energy storage for vehicle power, the performance of the expander needs to be studied. First, a CAES unit test bench is established. Then, the volumetric flow rate, rotational speed, torque, and output power are examined. Additionally, the isentropic exhaust temperature, pressure, and gas consumption rate of the scroll expander are analyzed. Finally, analyzing the economic feasibility of the CAES unit entails running the unit under varied driving conditions. Results reveal that the pressure of the input expander is high, which will lead to greater torque, greater peak power, and a greater temperature drop, but the gas in the air tank will also run out quickly. The peak power of the scroll expander does not occur at the maximum volume flow rate, rotation speed, and torque. The basic investment of the CAES unit mainly depends on the peak output power.

1. Introduction

The use of fossil fuels has led to environmental pollution and an energy crisis, creating a critical need for energy-efficient and environmentally friendly technologies [1,2]. Renewable energy has emerged as the preferred option for ensuring sustainable and clean energy while also reducing carbon emissions. However, the fluctuation and intermittency of renewable energy pose significant challenges and obstacles to its reliable use [3,4]. Energy storage technologies offer crucial solutions to overcome the fluctuations and intermittency of renewable energy [5,6]. A variety of types of energy storage technologies, such as electrochemical energy storage [7], pumped-hydro energy storage (PHES), thermochemical energy storage, magnetic energy storage, hydrogen energy storage [8], and CAES, are available [9]. Among them, PHES and CAES show the most potential for massive application [10]. CAES has numerous advantages, including zero pollution, a long lifespan, low maintenance costs, and minimal environmental impact [11]. However, CAES also has certain disadvantages, such as low efficiency and low energy density [12]. Many researchers are addressing these issues with the goal of making CAES units available for automotive power, providing a new, nonpolluting, renewable solution for automotive power. It is necessary to develop energy-efficient vehicles in the Asian market, because China’s carbon dioxide pollution is second only to that of the United States. In order to meet the 2060 carbon emissions target, the use of nonrenewable energy will be reduced from 55% to 4%, and the use of renewable energy will increase from 42% to 93% [13].
Compressed air hybrids were first developed in the 19th century [14] for use in city locomotives and trams [15]. In 1840, Andraud and Tessie of Motay introduced the first compressed air vehicle, which ran on a French test track [14]. Charles invented the air engine in 1896, leading to the marketing of hundreds of air cars through HK Porter and the generation of profits [16,17,18]. However, the production of air motors came to a halt in 1931 after the outbreak of the Second World War. Interest in air motors arose again in the 1970s due to the oil shortage, resulting in the emergence of a variety of air cars. In 2007, MDI developed the CityCat, which was unveiled as a commercially available air-powered vehicle. Verma [19] found that, when pressure is converted into energy, compressed air contains 50 Wh/L, equivalent to 0.18 MJ/L, when compressed air is at 310 bar. Mousavi et al. [20] found that a motorbike powered by 18 L of compressed air at a pressure of 250 bar can cover a distance of 5 km at a speed of 16.7 km/h while operating at a pressure of 9 bar.
Higelin et al. [21,22] conducted a simulation of a hybrid system in a European driving environment, demonstrating that the system can generate torque at 0 rpm, eliminating the idling phase of the combustion engine. Additionally, the regenerative braking system can store energy during braking, resulting in a 15% decrease in fuel consumption without optimization. Tai et al. [23] simulated the system with a camless air distribution system and found a 64% improvement in fuel economy under city driving conditions and a 12% improvement under highway driving conditions. Andersson et al. [24] modeled the system using two air storage tanks: a high-pressure tank and a low-pressure tank, with the latter optimizing the torque of the air motor. Trajkovic et al. [25,26,27] conducted simulations and experiments to investigate the dynamic behavior of the pneumatic hybrid system. Brejaud et al. [28,29,30] improved the Higelin design by adding an intermediate tank between the air tank and the charging valve. This resulted in a 46% and 26% improvement in fuel economy under hot-start conditions, tested under the world-harmonized light-duty vehicle test cycle (WLTC) and the new European driving cycle (NEDC) working conditions, respectively. Fazel et al. [31] simulated the control mechanism for an air hybrid throttle and found it to be 22% more efficient than a standard engine. Bao et al. [32] introduced a split air intake for an air hybrid engine, resulting in a fuel consumption reduction of at least 5% and a 90% reduction in the idling time. Dimitrova et al. [33] found that incorporating air motors and waste heat recovery systems into small engines led to good fuel economy and reduced carbon emissions. Vehicles powered by compressed air typically operate in three modes: the engine mode, motor mode, and air-assisted mode, and commonly use pneumatic and hydraulic motors as propulsion equipment. The current pneumatic motors are classified as vane, piston, and scroll types. However, the commercially available piston and scroll types necessitate inlet modification. For example, the Peugeot Citroën hybrid car stores nitrogen through compression, which is subsequently used to generate power when required.
The scroll expander is a versatile device that can operate at a wide range of pressure, speed, and power output, extracting mechanical energy from various gases to generate electricity. It is known for its simple structure, low vibration, low noise, and minimal parts, and is widely used in the refrigeration and air conditioning industry [34,35,36]. Additionally, scroll expanders are utilized in various applications, such as the organic Rankine cycle, refrigeration cycle, carbon dioxide cycle, and CAES unit [37,38,39,40,41,42]. They can operate at pressure ratios ranging from 1.25 to 10 and speeds of 250 to 5000 RPM, with a power output typically ranging from a few hundred watts to 10 kW and efficiencies between 10% and 80%. The scroll expander is the preferred choice for applications with a rated power up to 100 kW [43]. Theoretical models have been formulated to predict and enhance the performance of scroll expanders [44,45], and analyze the impact of the initial angles of the involutes on the mass flow rate, exhaust temperature, and compression input power. Wang et al. [46] constructed a comprehensive geometric model based on arbitrary involute initial angles, which encompasses all the scroll compressor contours as a segmented function to facilitate the simulation and visualization of its operation. Park et al. [47] revealed that leakage is one of the key factors affecting the working process of a scroll compressor, and an isentropic compressible nozzle flow model is usually used to simulate the flank and radial leakage flows. Li [48] developed experimental and semiempirical models based on empirical data, which accurately predicted the mass flow rate, shaft power, and exhaust temperature. Song et al. [49] utilized a dynamic mesh of the CFD to observe flow features within the scroll expander, but additional research is required to simulate both the friction and multiphase flow. Li et al. [50] discovered the effect of pressure on ORC economics and constructed an optimization model. Yang [51] conducted a preliminary investigation employing a prototype of the scroll expander, which revealed that the energy conversion efficiency varied mainly due to the inlet structure and pressure loss. Wu et al. [52] affirmed that the inlet structure was the primary factor affecting the energy conversion efficiency of the scroll expander, and that the energy conversion efficiency can be significantly improved by the characteristics of the inlet in the waist shape in comparison with the circular inlet. Ping et al. [53] analyzed the impact of road conditions on the economic performance (WLTC, NEDC, and EUDC)
This article introduces a test bench for a CAES unit. The study examines the impact of the volume flow rate, rotating speed, and torque on the performance of the scroll expander under different regulator pressures through experimentation. Additionally, the scroll expander is analyzed under various driving cycles. Finally, an economic model is developed to investigate the investment cost of the CAES unit.

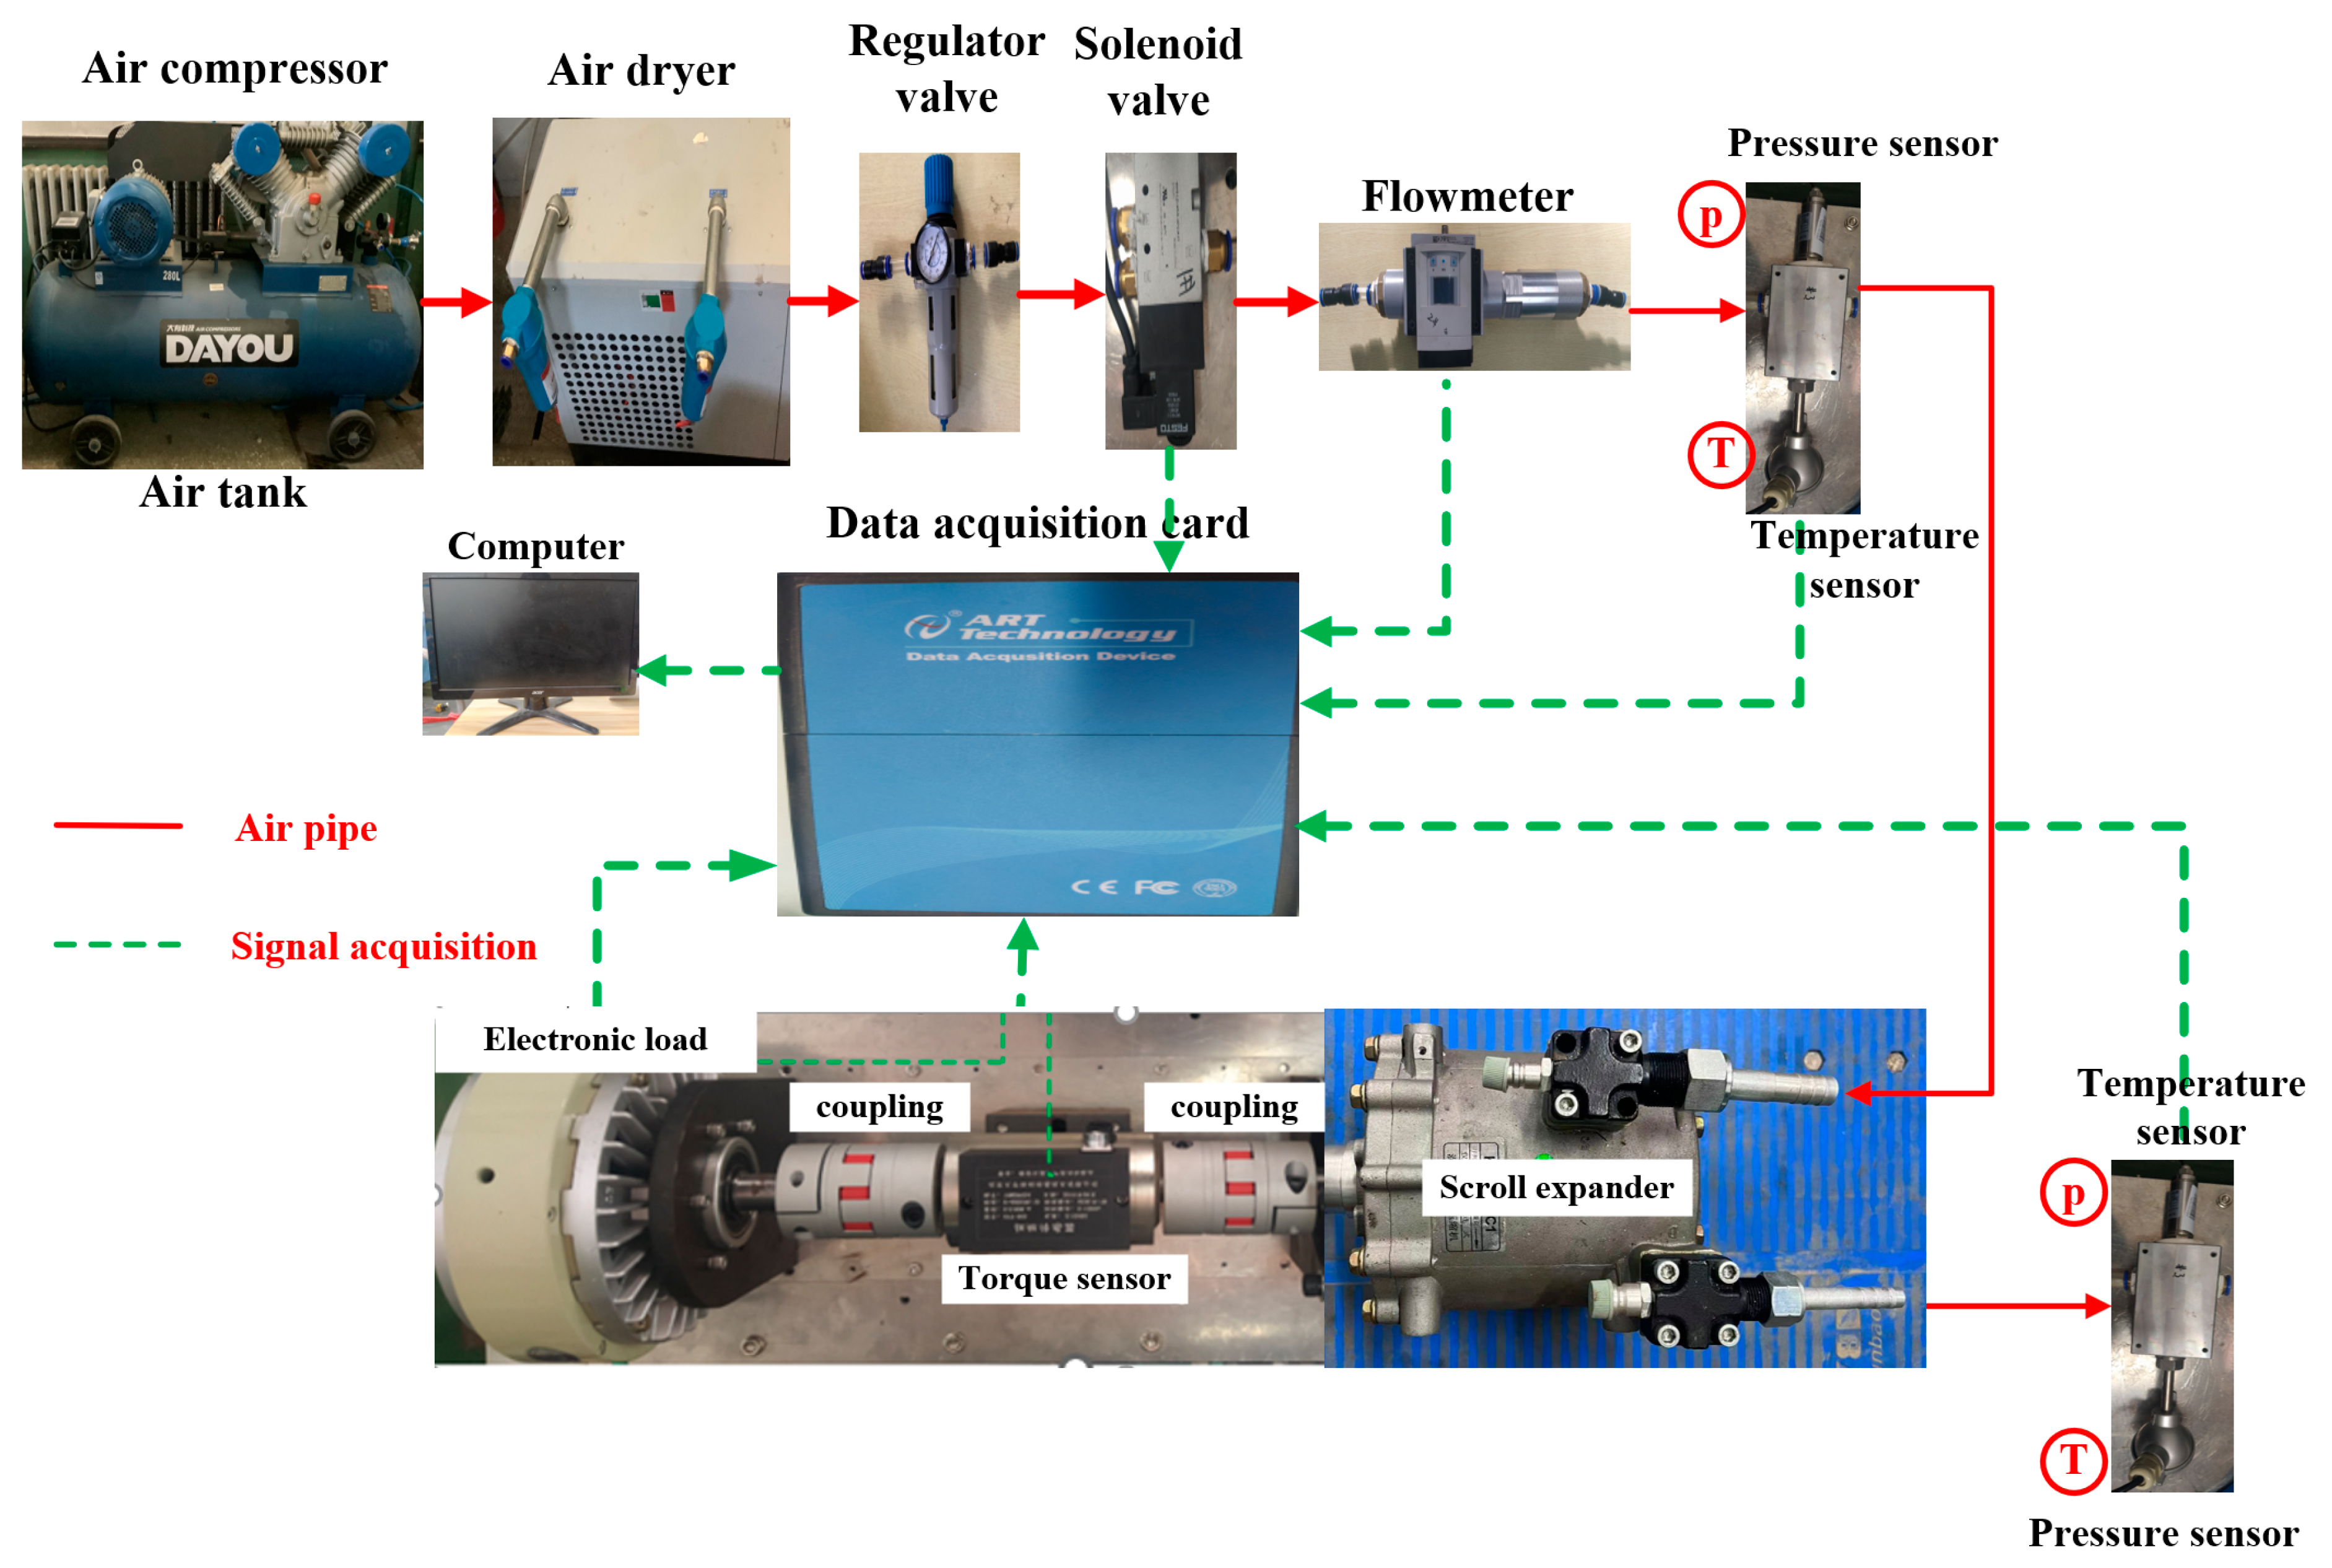
2. Experimental Setup

The testing equipment for compressed air vehicles includes a variety of components, such as a scroll expander, magnetic powder brake, compressor, air dryer, coupling, torque sensor, regulator valve, solenoid valve, flow meter, temperature sensor, pressure sensor, and data acquisition card. The scroll expander converts the pressure of compressed air into mechanical energy, while the magnetic powder brake simulates the torque needed for driving on roads. The compressor generates the compressed air required to operate the system, and an air dryer dehumidifies. The pressure regulator valve adjusts the pressure of the compressed air before it enters the scroll expander. The solenoid valve controls the opening and closing, indirectly determining the start and stop of the expander by allowing compressed air into it. Torque sensors measure the speed and torque of the scroll expander, while a flow meter measures the volume flow rate of the compressed air flow. Temperature and pressure sensors are positioned at the inlet and outlet of the scroll expander to measure the intake temperature, intake pressure, exhaust temperature, and exhaust pressure.
The scroll expander is connected to the torque sensor through a fixed coupling. The other end of the torque sensor is connected to the magnetic powder brake via a fixed coupling as well. The experimental setup and schematic diagram of the scroll expander-based CAES unit are illustrated in Figure 1 and Figure 2, respectively. Table 1 and Table 2 outline the principal parameters for various sensors.
The expansion ratio of the scroll expander can be expressed as [54]
ε e = p in p out
where ε e is the expansion ratio; p in is the intake pressure, bar; p out is the exhaust pressure, bar.
The power output of the scroll expander can be expressed as
P = 2 π n r T r 60
where P is the power output of the scroll expander, W; n r is the rotation speed of the scroll expander, r/min; T r is the torque of the scroll expander, N·m.
In order to calculate the mass of the compressed air, the density is obtained by the temperature and pressure at the inlet of the expander, and then multiplied by the volume.
The density of the compressed air is calculated using Excel 2019 and Refprop 9.0.
The mass of the compressed air can be expressed as:
m as = ρ V as
where Vas is the volume of air, m3, and mas is the mass of air, g.
The scroll expander generates electricity by utilizing compressed air. The gas consumption rate of the compressed air is a crucial factor in measuring the output power and gas consumption of the CAES unit. This rate can be defined as the compressed air consumption rate (CACR), and is expressed as [54]
c = m ˙ as P
where m ˙ as is the mass flow rate of air, g/s, and c is the CACR, g/J.
The scroll expander usually uses the isentropic efficiency as an index to evaluate the performance, which is expressed as:
η s = h in h out h in h iout
where η s is the isentropic efficiency of the scroll expander, %; h out is the isentropic enthalpy of the compressed air at the outlet of the scroll expander, J/g; h in and h out are the enthalpy of the air entering and exiting the scroll expander, J/g.

3. Results and Discussion

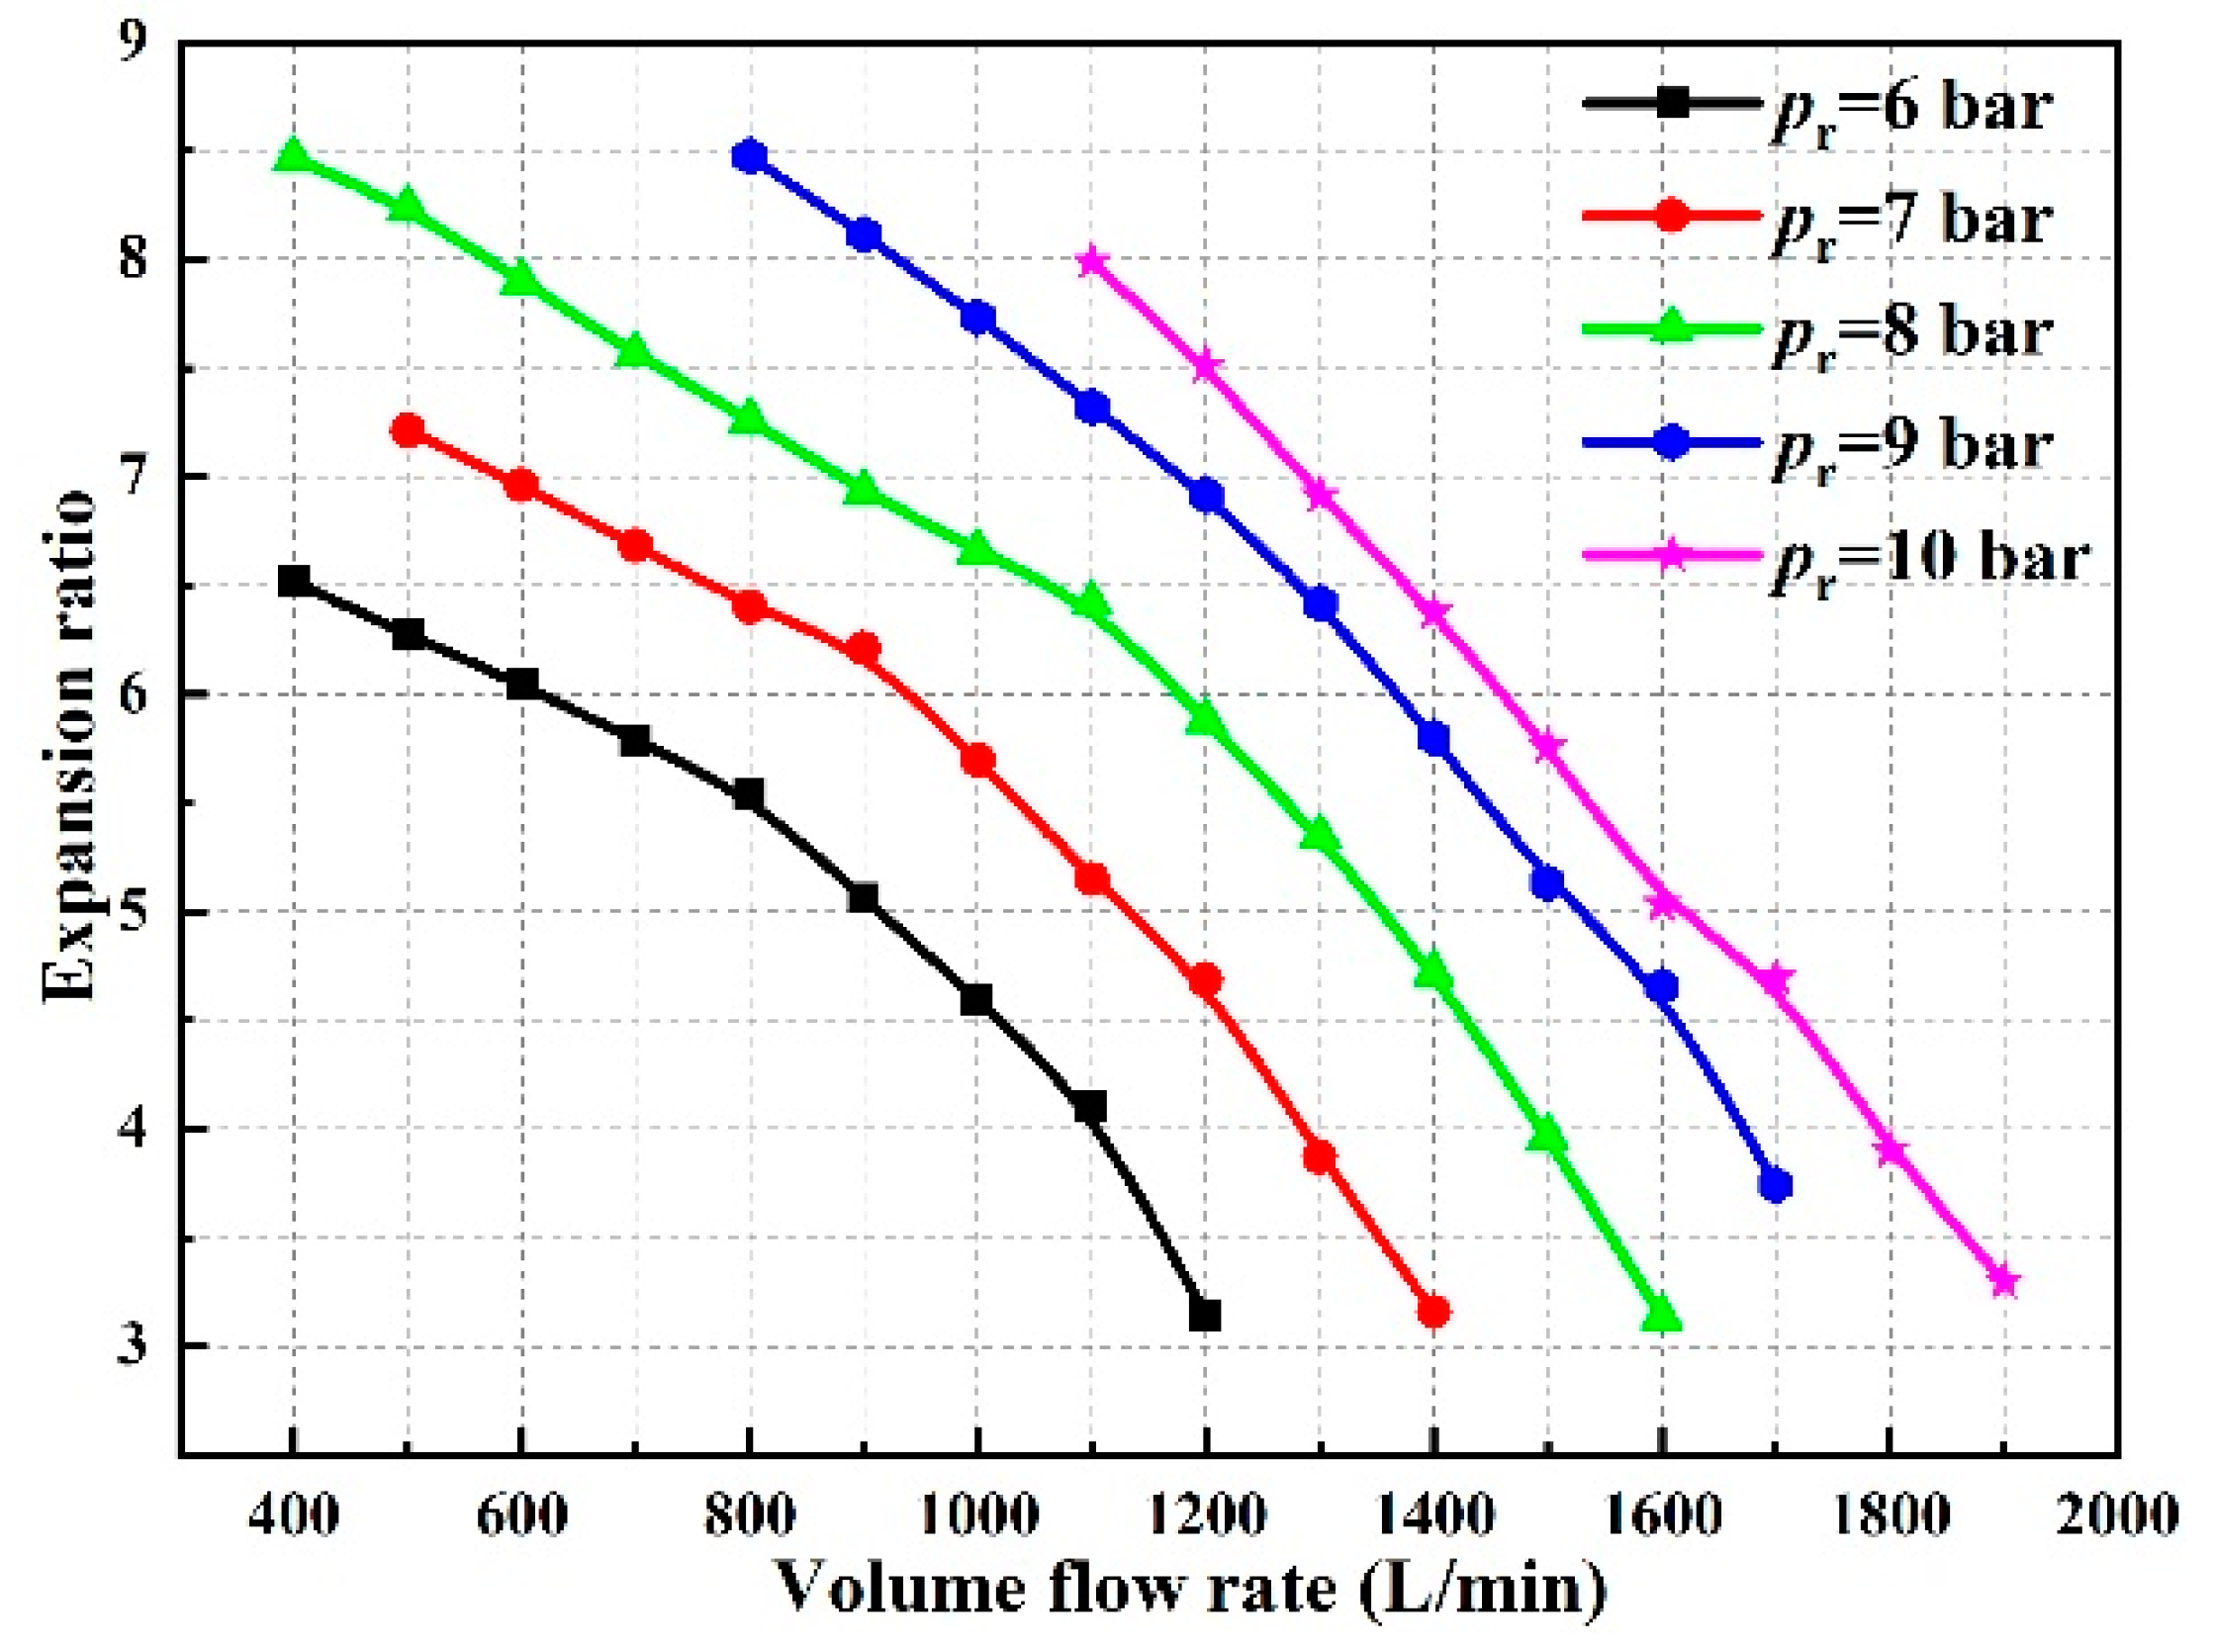
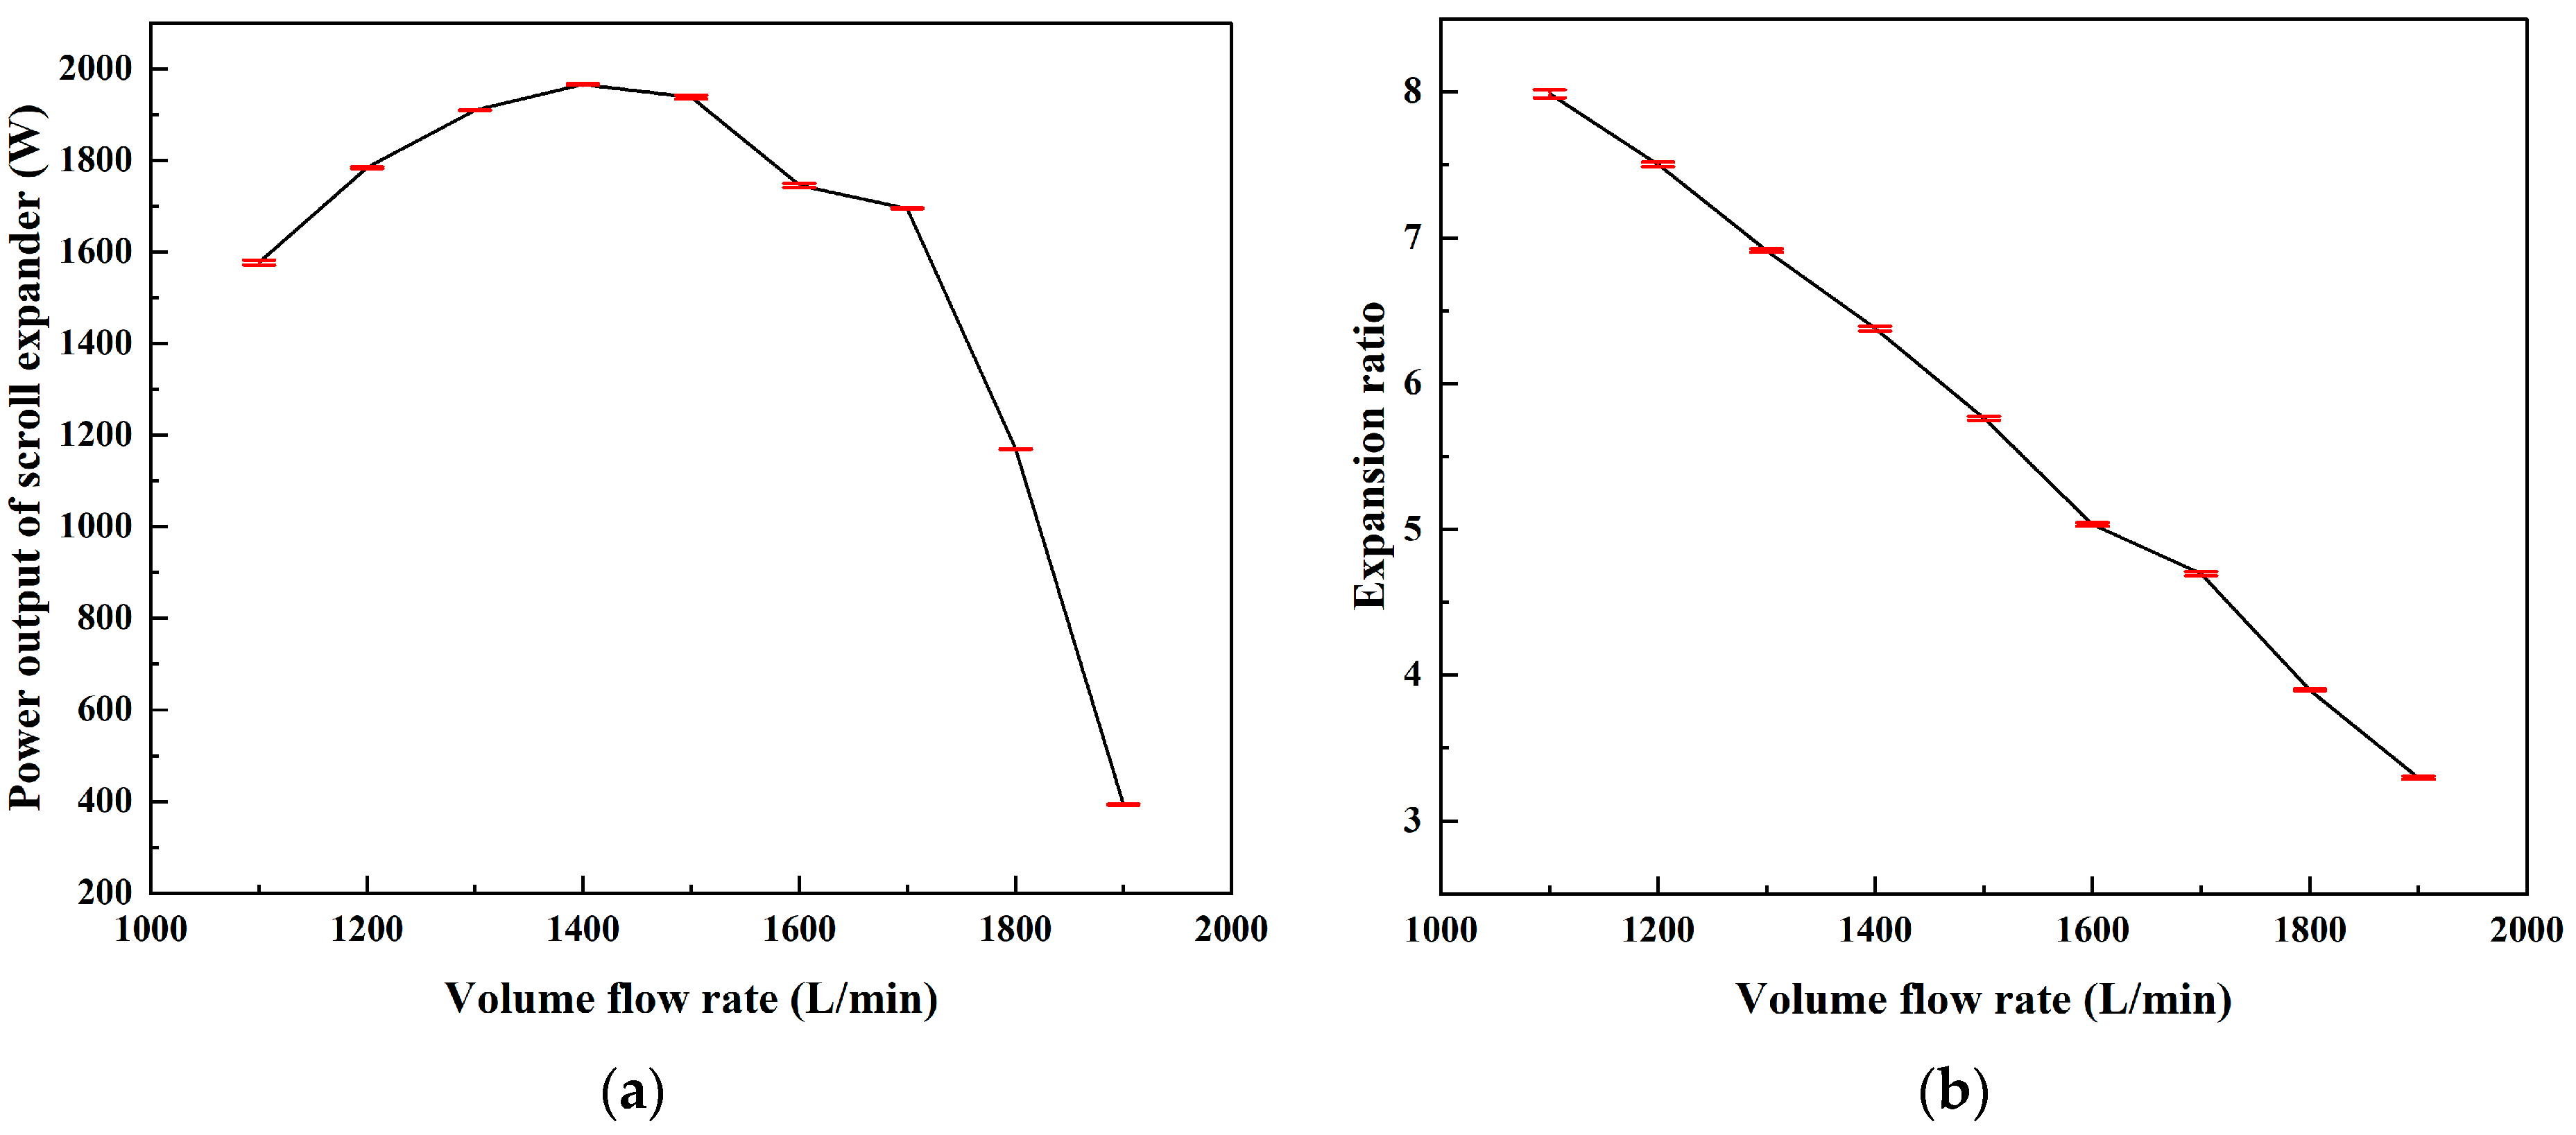
3.1. Influence of the Volume Flow Rate on the Performance of the Scroll Expander

In Figure 3, it can be seen that, under the same regulator pressure of the expander, the volumetric flow rate increases as the inlet pressure decreases. A larger intake pressure leads to a larger volume flow rate. In this figure, the maximum volume flow rate reaches 1200 L/min at 6 bar. However, the maximum volume flow rate reaches 2000 L/min at 10 bar.
It can be clearly seen from Figure 4 that the expansion ratio of the scroll expander and the intake pressure are basically consistent. The volume flow rate is inversely proportional to the expansion ratio; that is, the higher volume flow rate corresponds to the lower expansion ratio. In this case, the expansion ratio gradually decreases with the increase in the volume flow rate. The moment of the maximum expansion ratio occurs at the moment of the maximum intake pressure and minimum flow. This means that a larger reservoir pressure will produce a larger expansion ratio.
Figure 5 shows the effect of different regulator pressures on the mass and volume flow rate. As everyone knows, mass divided by volume is the density of air. The density decreases with the increase in the volumetric flow. The maximum of the mass flow rate (205 g/s) appears at a pressure of 10 bar, with a speed of 1500 L/min. As the pressure-regulating valve decreases, the maximum point is achieved at a smaller volume flow rate. For instance, at a pressure-regulating valve of 6 bar, the maximum point of the mass flow is observed at 1100 L/min or 94.87 g/s. This higher pressure of the regulating valve results in a higher mass flow rate. The reason for reaching the maximum point is due to either the inability to discharge residual gas in the scroll expander or the small outlet area.
It is evident from Figure 6 that the primary parameters are largely reliant on the dimensions of the gas storage container. The volume flow decreases with increasing torque under identical conditions. At a given regulator pressure of 10 bar, the torque for 1100 L/min is 24.64 N·m. Correspondingly, the torque descends steadily as the volume flow does too. It generates a maximum torque of 19.92 N·m at a volume flow of 400 L/min and a minimum torque of approximately 2.64 N·m at 1200 L/min under 6 bar conditions. When the volume flow is 1900 L/min, the torque reduces to only 1.28 N·m under 10 bar conditions. The figure indicates a consistent trend between the torque and expansion ratio. Typically, the torque is produced by the enthalpy difference between the inlet and outlet. Enthalpy is a state function that takes into account both the internal energy of an object and the technical work involved.
Figure 7 shows the relationship between the rotating speed and the volume flow rate. The regulating valve set at the pressure of 10 bar requires 611 rpm to discharge 1100 L/min, whereas at the pressure of 6 bar needs 1616 rpm to discharge the same volume of air (1100 L/min). At the end of the curves, for various pressure regulators, the corresponding point for 10 bar indicates the discharge of 1900 L/min at 2935 rpm, while the point at 6 bar indicates the discharge of 1200 L/min at 2686 rpm. At 10 bar, one round could expel 1.8 L. As the speed increases and the air tank pressure decreases, this value reduces to 0.64 L per round, one-third of the original value. At 6 bar, 1.25 L discharges one round of the scroll expander, which decreases to 0.45 L. This reduction equates to one-third of the original volume. It is apparent that the high-pressure conditions facilitate the rapid removal of gas from the chamber, causing the specific volume to increase rapidly.
Figure 8 shows that the output power of the scroll expander varies in relation to the volume flow rate, initially increasing and then decreasing. A peak value is observed under varying pressure-regulating-valve pressures. A maximum output power of 1474.13 W is attained at 6 bar and 1000 L/min, while a maximum output power of 1618.13 W is achieved at 7 bar and 1100 L/min. Additionally, the maximum output power under 8 bar is observed at 1100 L/min. At the volume flow rate of 1400 L/min and 10 bar, the highest power output is 1965.23 W. The maximum power output increases with the pressure valve’s pressure and the flow rate. It is evident from the parabolic graph that the output power of the scroll expander increases monotonically with the increase in the volume flow rate.
Figure 9 shows that the performance of the scroll expander with compressed air is measured by the CACR. At low volume flow rates, it is apparent that the air consumption rate is quite similar at various regulator pressures, with most of the curves hovering around 0.1 g/J. When the pressure-regulating valve is low, the corresponding turning point for 6 bar is 0.06 g/J at 1000 L/min; for 10 bar, the turning point is 0.11 g/J at 1700 L/min, and then CACR suddenly spiked. Beyond the turning point, the CACR intensifies, causing the output power to drop abruptly.
Figure 10 shows that, as the regulator pressure increases, the scroll expander converts more internal energy into work and releases it to the generator. A temperature difference of 35 °C is generated under a relatively large pressure of 10 bar, resulting in a considerable energy output. Therefore, the scroll expander can use a water jacket for cold energy recovery to maintain the high operating efficiency of the CAES system.
Figure 11 shows the increasing trend of isentropic efficiency as the pressure of the regulator valve increases. It illustrates that the isentropic efficiency is approximately 15% when the pressure-regulating valve is at 6 bar. At 7 bar, the isentropic efficiency range is 20% to 25%. This increase is caused by the inherent design factors of the scroll expander, such as radial leakage and axial leakage, which are more strongly influenced by a larger expansion ratio. The maximum isentropic efficiency is 37.45%, corresponding to a flow rate of 1900 L/min under the 10 bar working condition. When the volume flow rate increases from 1100 L/min to 1900 L/min, the isentropic efficiency increases from 25.15% to 37.45%.

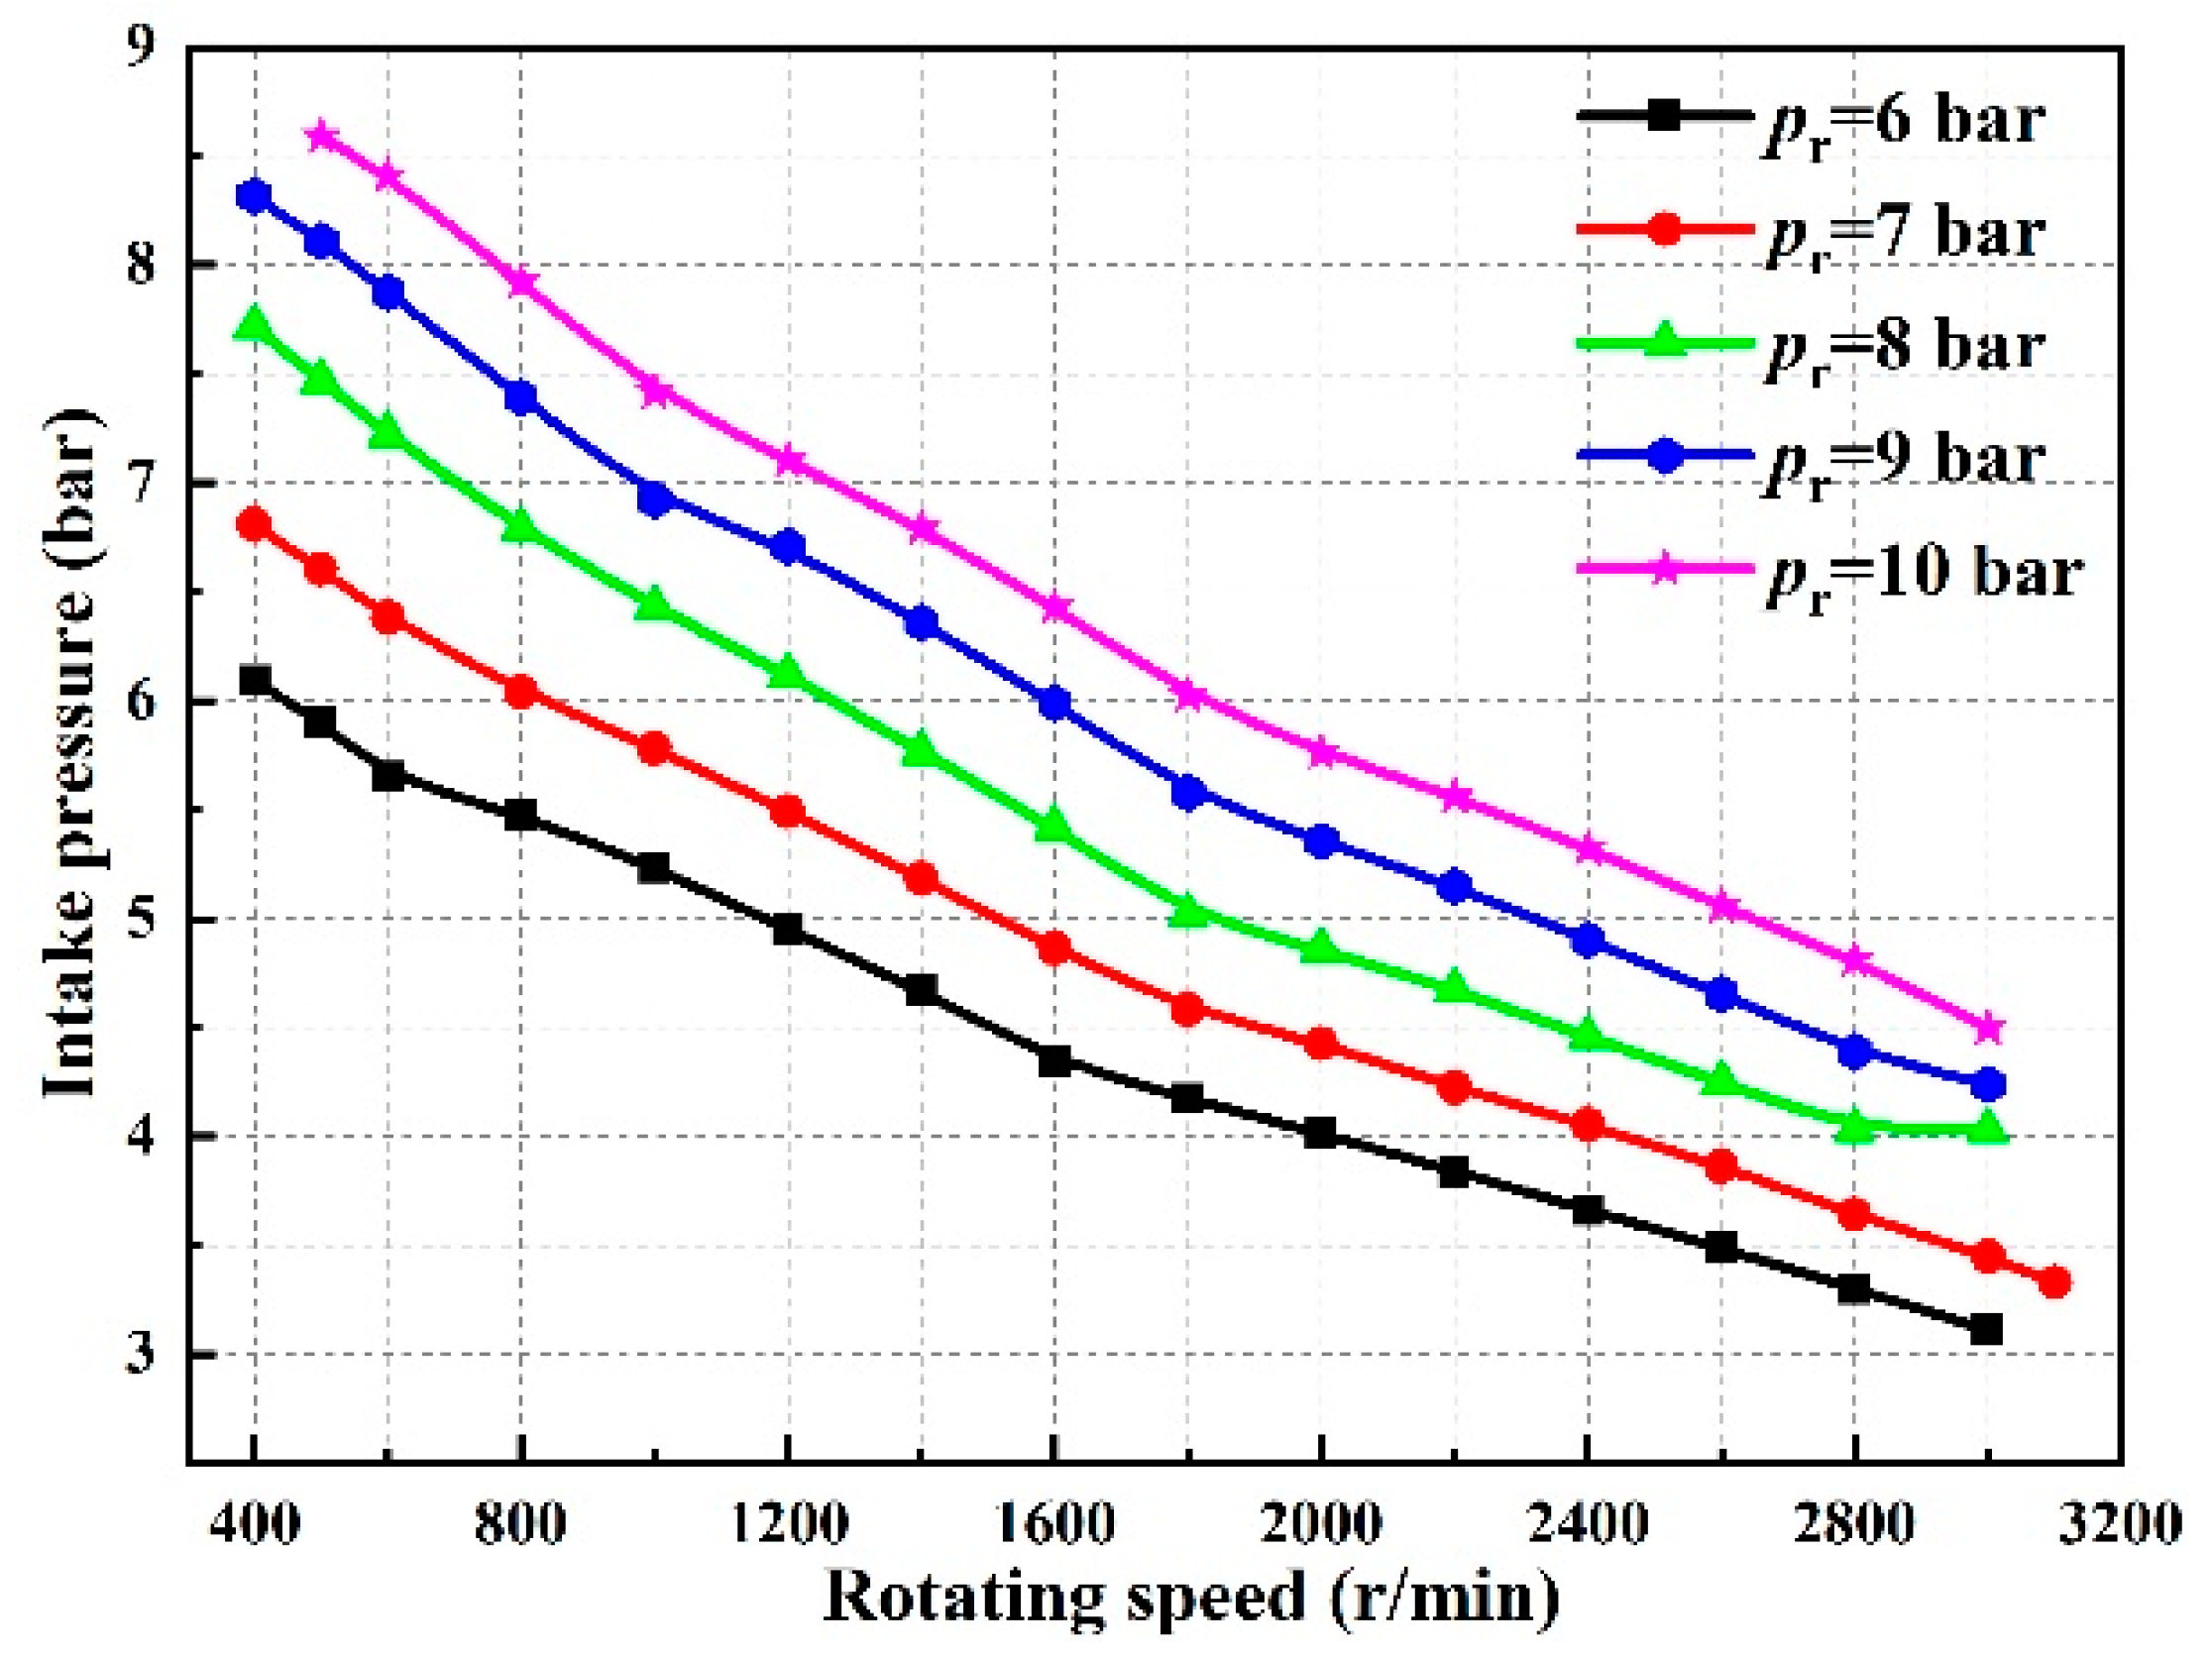
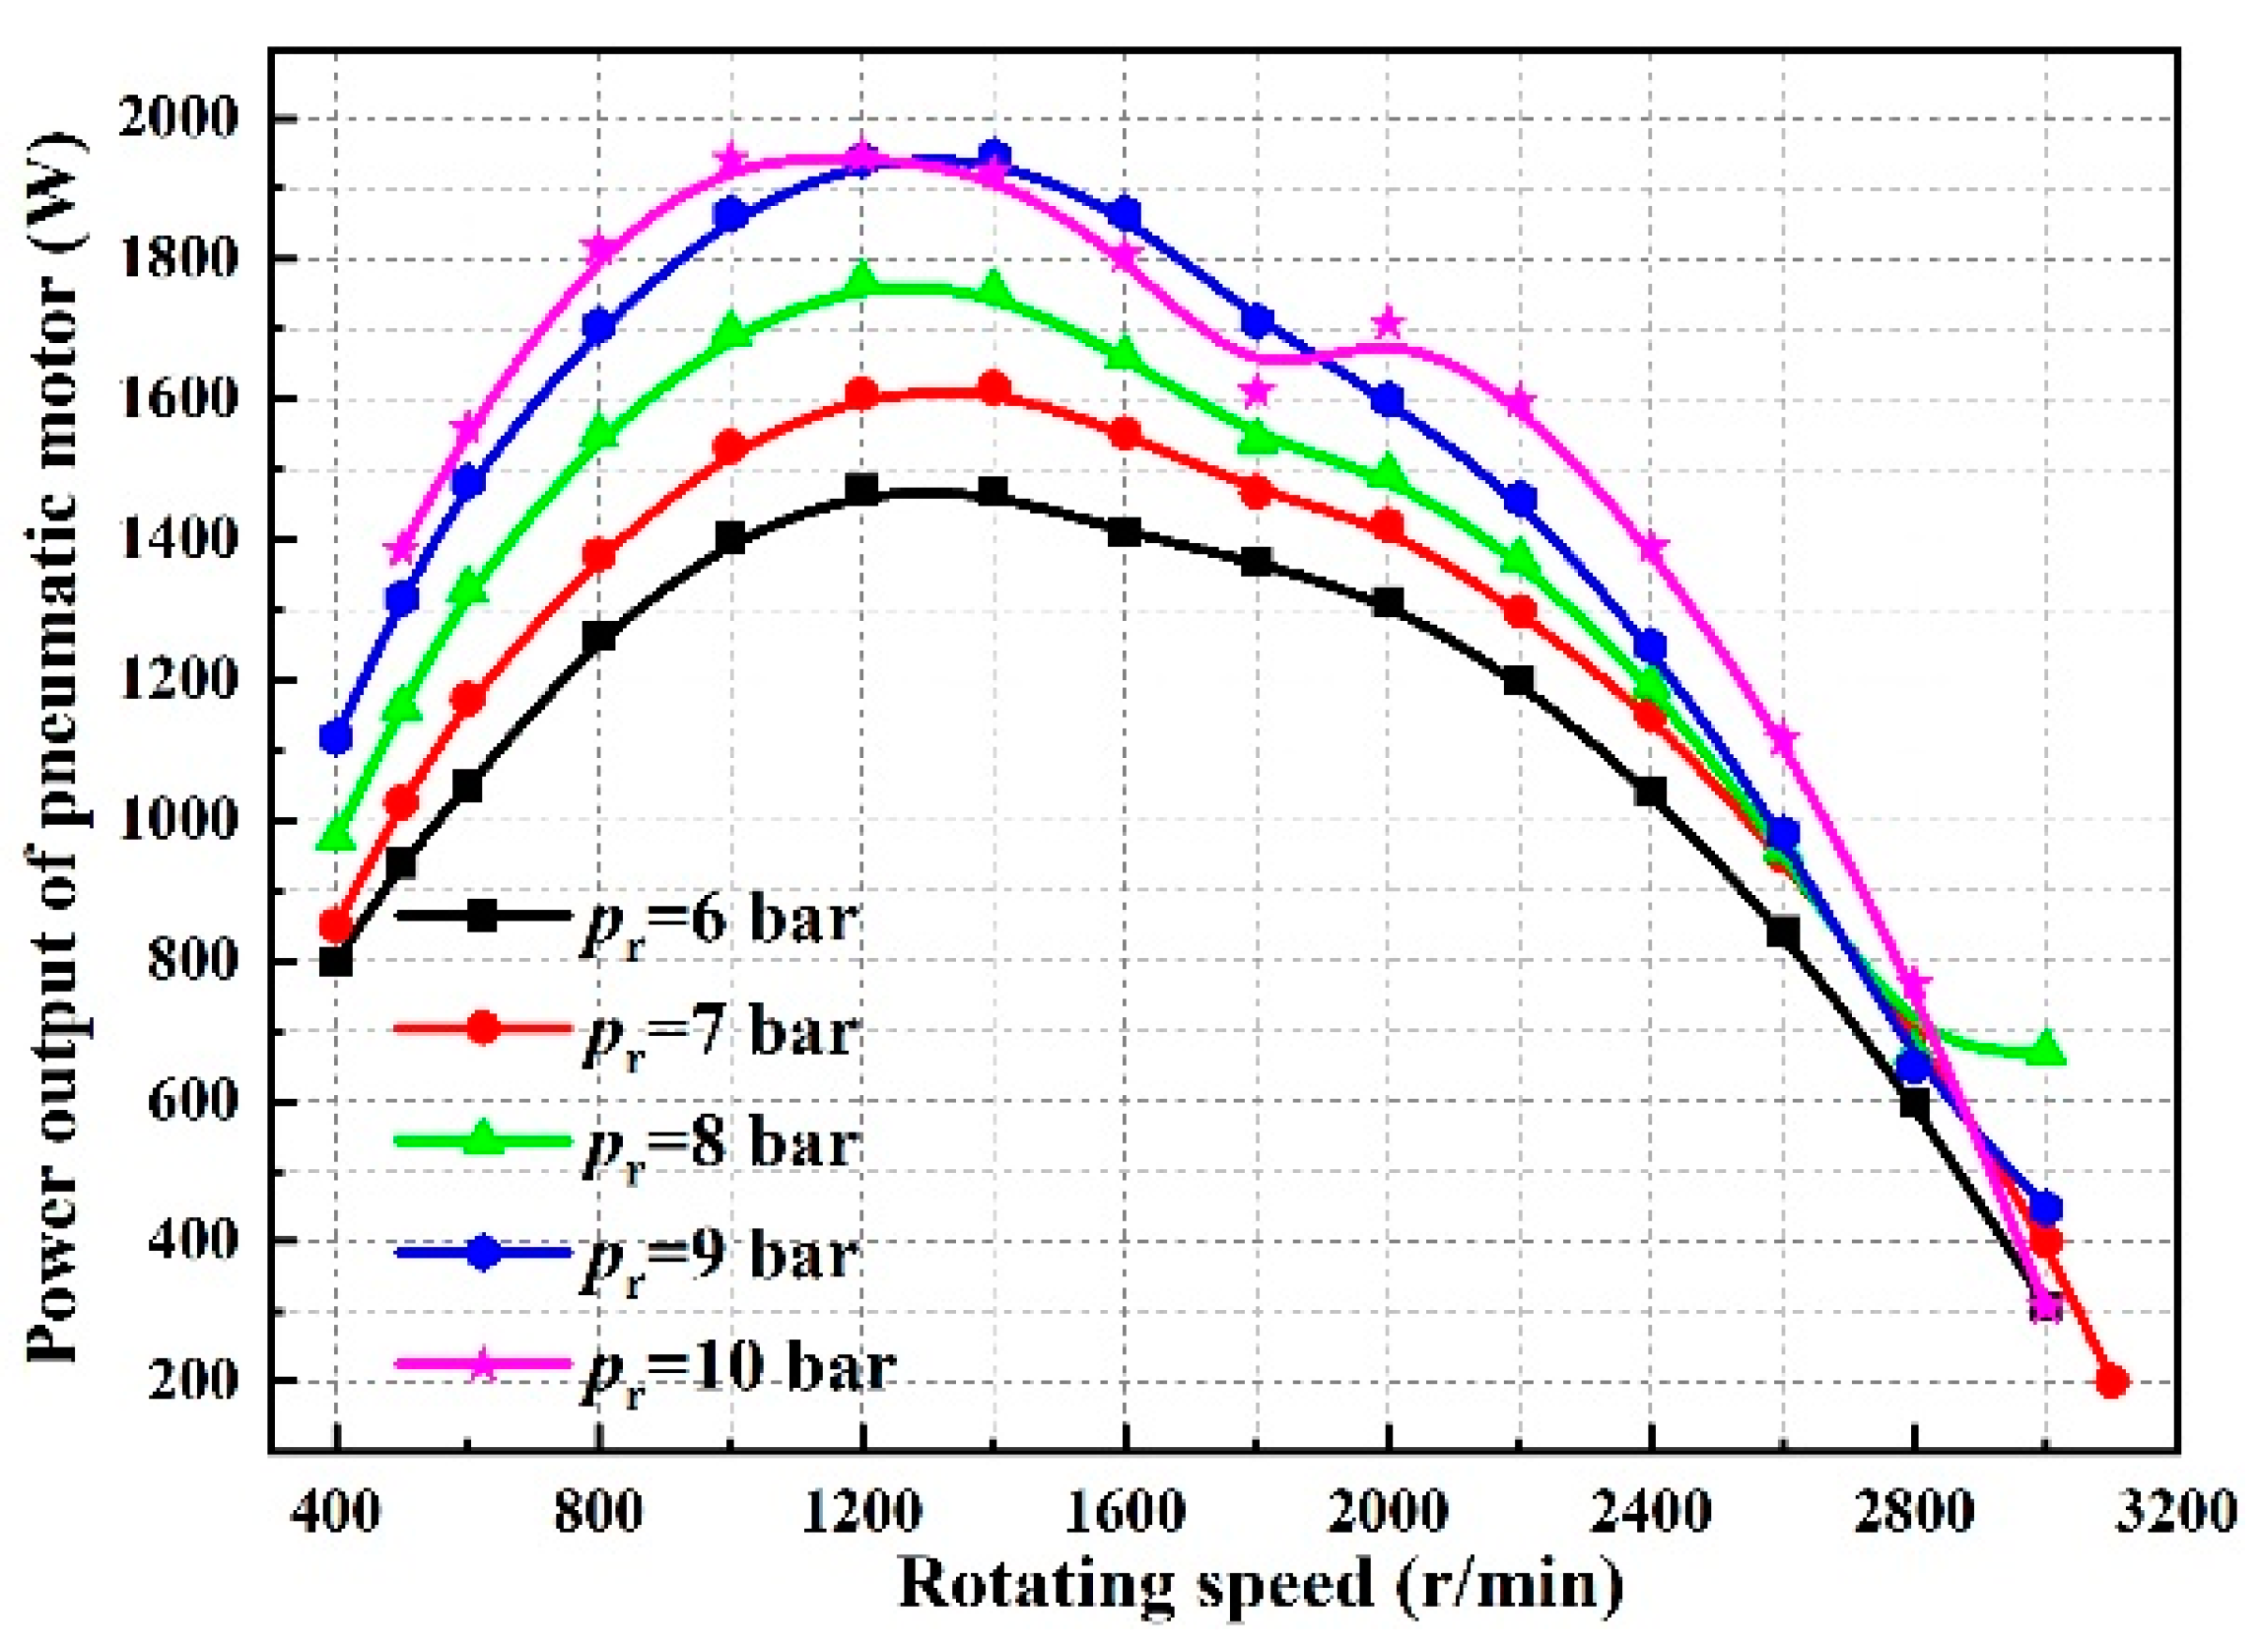
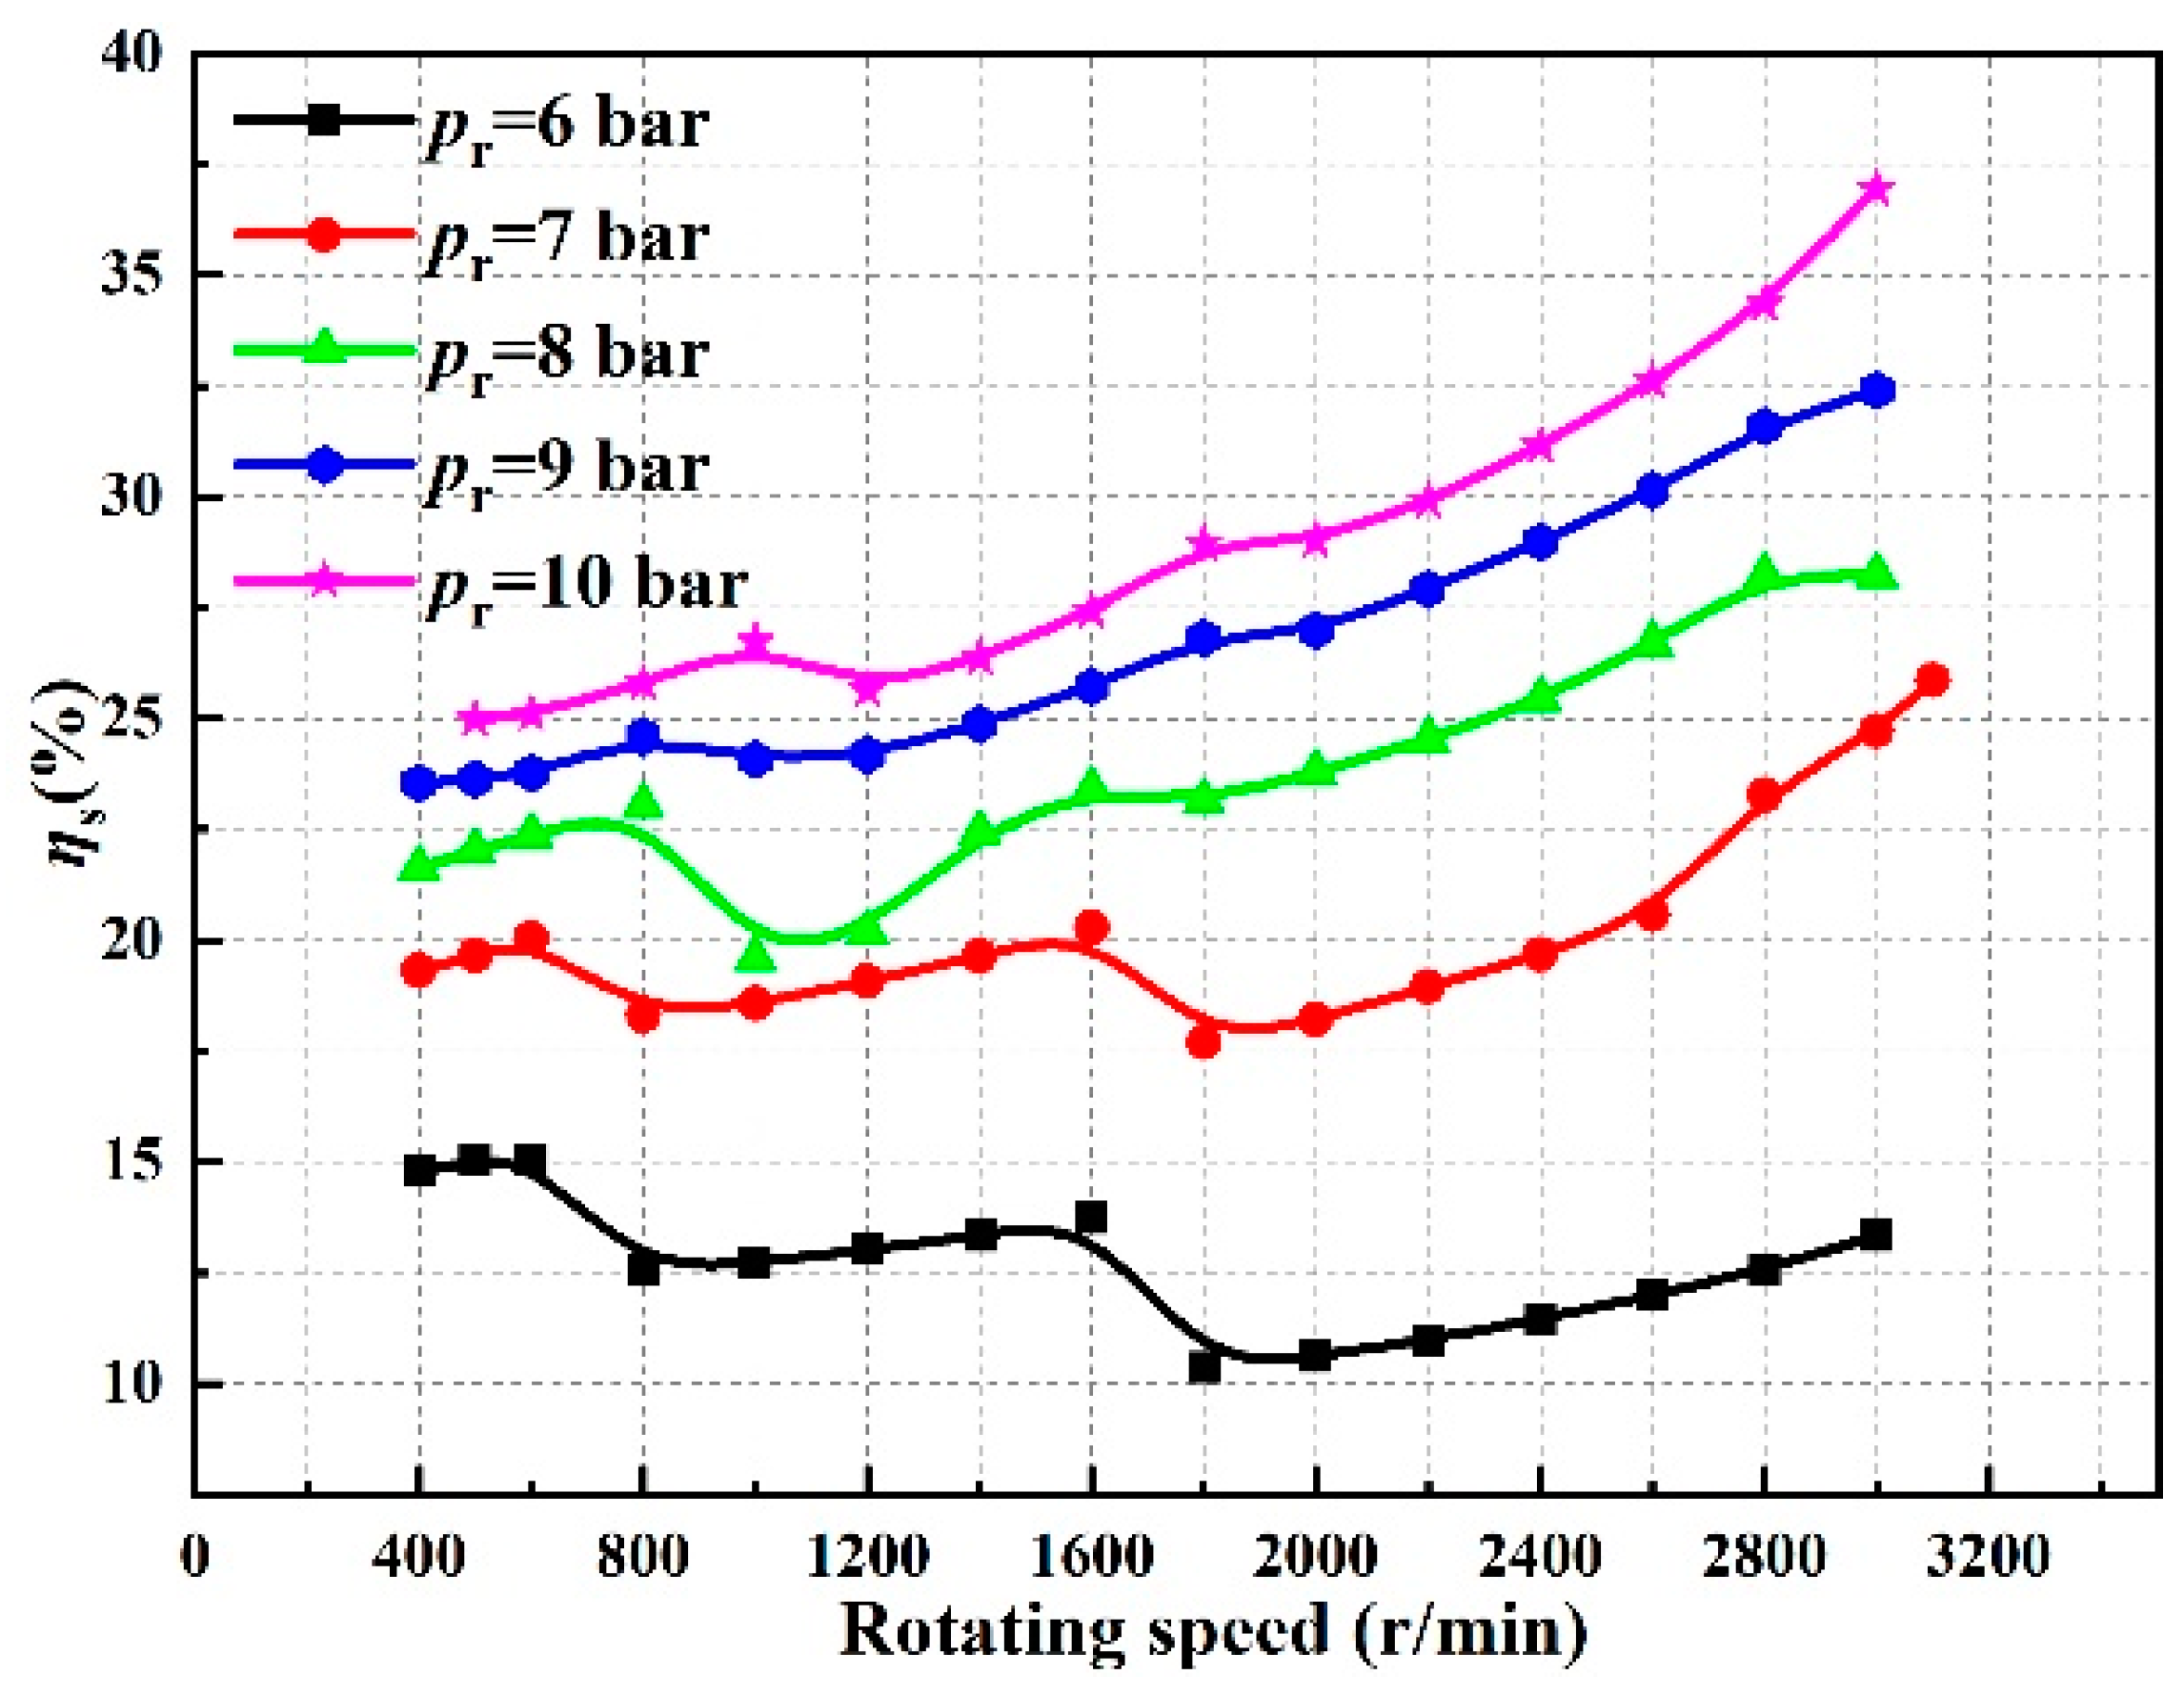
3.2. Influence of the Rotation Speed on the Performance of the Scroll Expander

In Figure 12, as the rotating speed increases, the inlet pressure shows a decreasing trend because the pressure of the air tank will gradually decrease. Basically, with the increase in the speed, there is a linear decreasing trend, as can be seen from the curve for 10 bar. The initial pressure is 8.58 bar when the rotation speed is 500 r/min, and the termination pressure is 3000 r/min at 4.49 bar. The initial pressure is 6.09 bar at a speed of 400 r/min, and the termination pressure is 3.11 bar at a speed of 3000 r/min. The slope of the pressure reduction remains almost the same at different regulator pressures.
Figure 13 shows that the expansion ratio decreases with the rotating speed from 8.25 bar down to 3.25 bar at a regulator pressure of 10 bar. It is evident that a smaller regulator pressure corresponds to a smaller expansion ratio. Under different regulator pressures, the maximum rotating speed can reach up to 3100 rpm. This means that a higher rotating speed does not rely on the regulator pressure and expansion ratio.
In Figure 14, the mass flow rate depends on the density of the air. Compared with the volume flow rate, the trend of the mass flow rate with the rotational speed is very different, mainly because of the density before and after the expansion. Firstly, the mass flow rate increases with the rotating speed, but after reaching the highest point, it starts to decrease. Analyzed from the density point of view, in the first stage, the density remains basically constant, but finally, as the rotational speed peaks, the density decreases rapidly. The maximum mass flow rate corresponding to the regulator pressure ranging from 6 to 8 bar occurs at is 1400 r/min and is 94.7 g/s, 120.1 g/s, and 150.6 g/s, respectively. While the maximum mass flow rate for the regulator at 9 and 10 bar occurs at 1200 r/min and is 179.7 g/s and 207.2 g/s, respectively.
In Figure 15, it can be seen that the torque is at its maximum value when the rotational speed is low. As the rotational speed increases, the pressure in the storage tank gradually decreases, the torque decreases, and finally tends to 0. Therefore, for automotive compressed air, the storage pressure and the size of the storage tank are key factors in determining this technology.
The output power of the scroll expander is the product of the rotational speed and torque. In Figure 16, under different regulator pressures, the output power shows a trend of increasing and then decreasing. With the increase in the rotational speed, the higher the regulator pressure, the greater the internal energy of the air, and the more obvious the effect of the work on the expander. At 10 bar and 800 r/min, the motor output power is 1816 W. At other regulator pressures (9 bar, 8 bar, 7 bar, and 6 bar) at 800 r/min, the corresponding expander output power is 1705 W, 1549 W, 1378 W, and 1262 W, respectively. The maximum output power is 1946 W at 10 bar and 1200 r/min, 1946 W at 9 bar and 1200 r/min, and 1766 W at 8 bar and 1200 r/min.
In Figure 17, it can be seen that the CACR does not exceed 0.15 g/J over a wide speed range from 400 to 2400 r/min. When the rotating speed exceeds 2400 r/min, the air consumption rate rises rapidly. The higher the pressure of the regulator, the greater the air consumption rate.
Figure 18 shows that, at lower regulator pressures, there could be a smaller temperature difference. If the regulator pressure is 10 bar, the temperature difference could reach approximately 32 °C. The cooling power could be used in automotive refrigeration, which depends on the expansion ratio, and the larger, the better.
Figure 19 shows that the isentropic efficiency curves increase as the regulator pressure increases, but at smaller regulator pressures, the isentropic efficiency is lower than 15%. As the regulator pressure increases, the trend of increasing speed becomes more obvious. It is evident that, at a regulator pressure of 10 bar, the efficiency is 24.9% at 500 r/min and 36.4% at 3000 r/min, which is an increase of 46%.

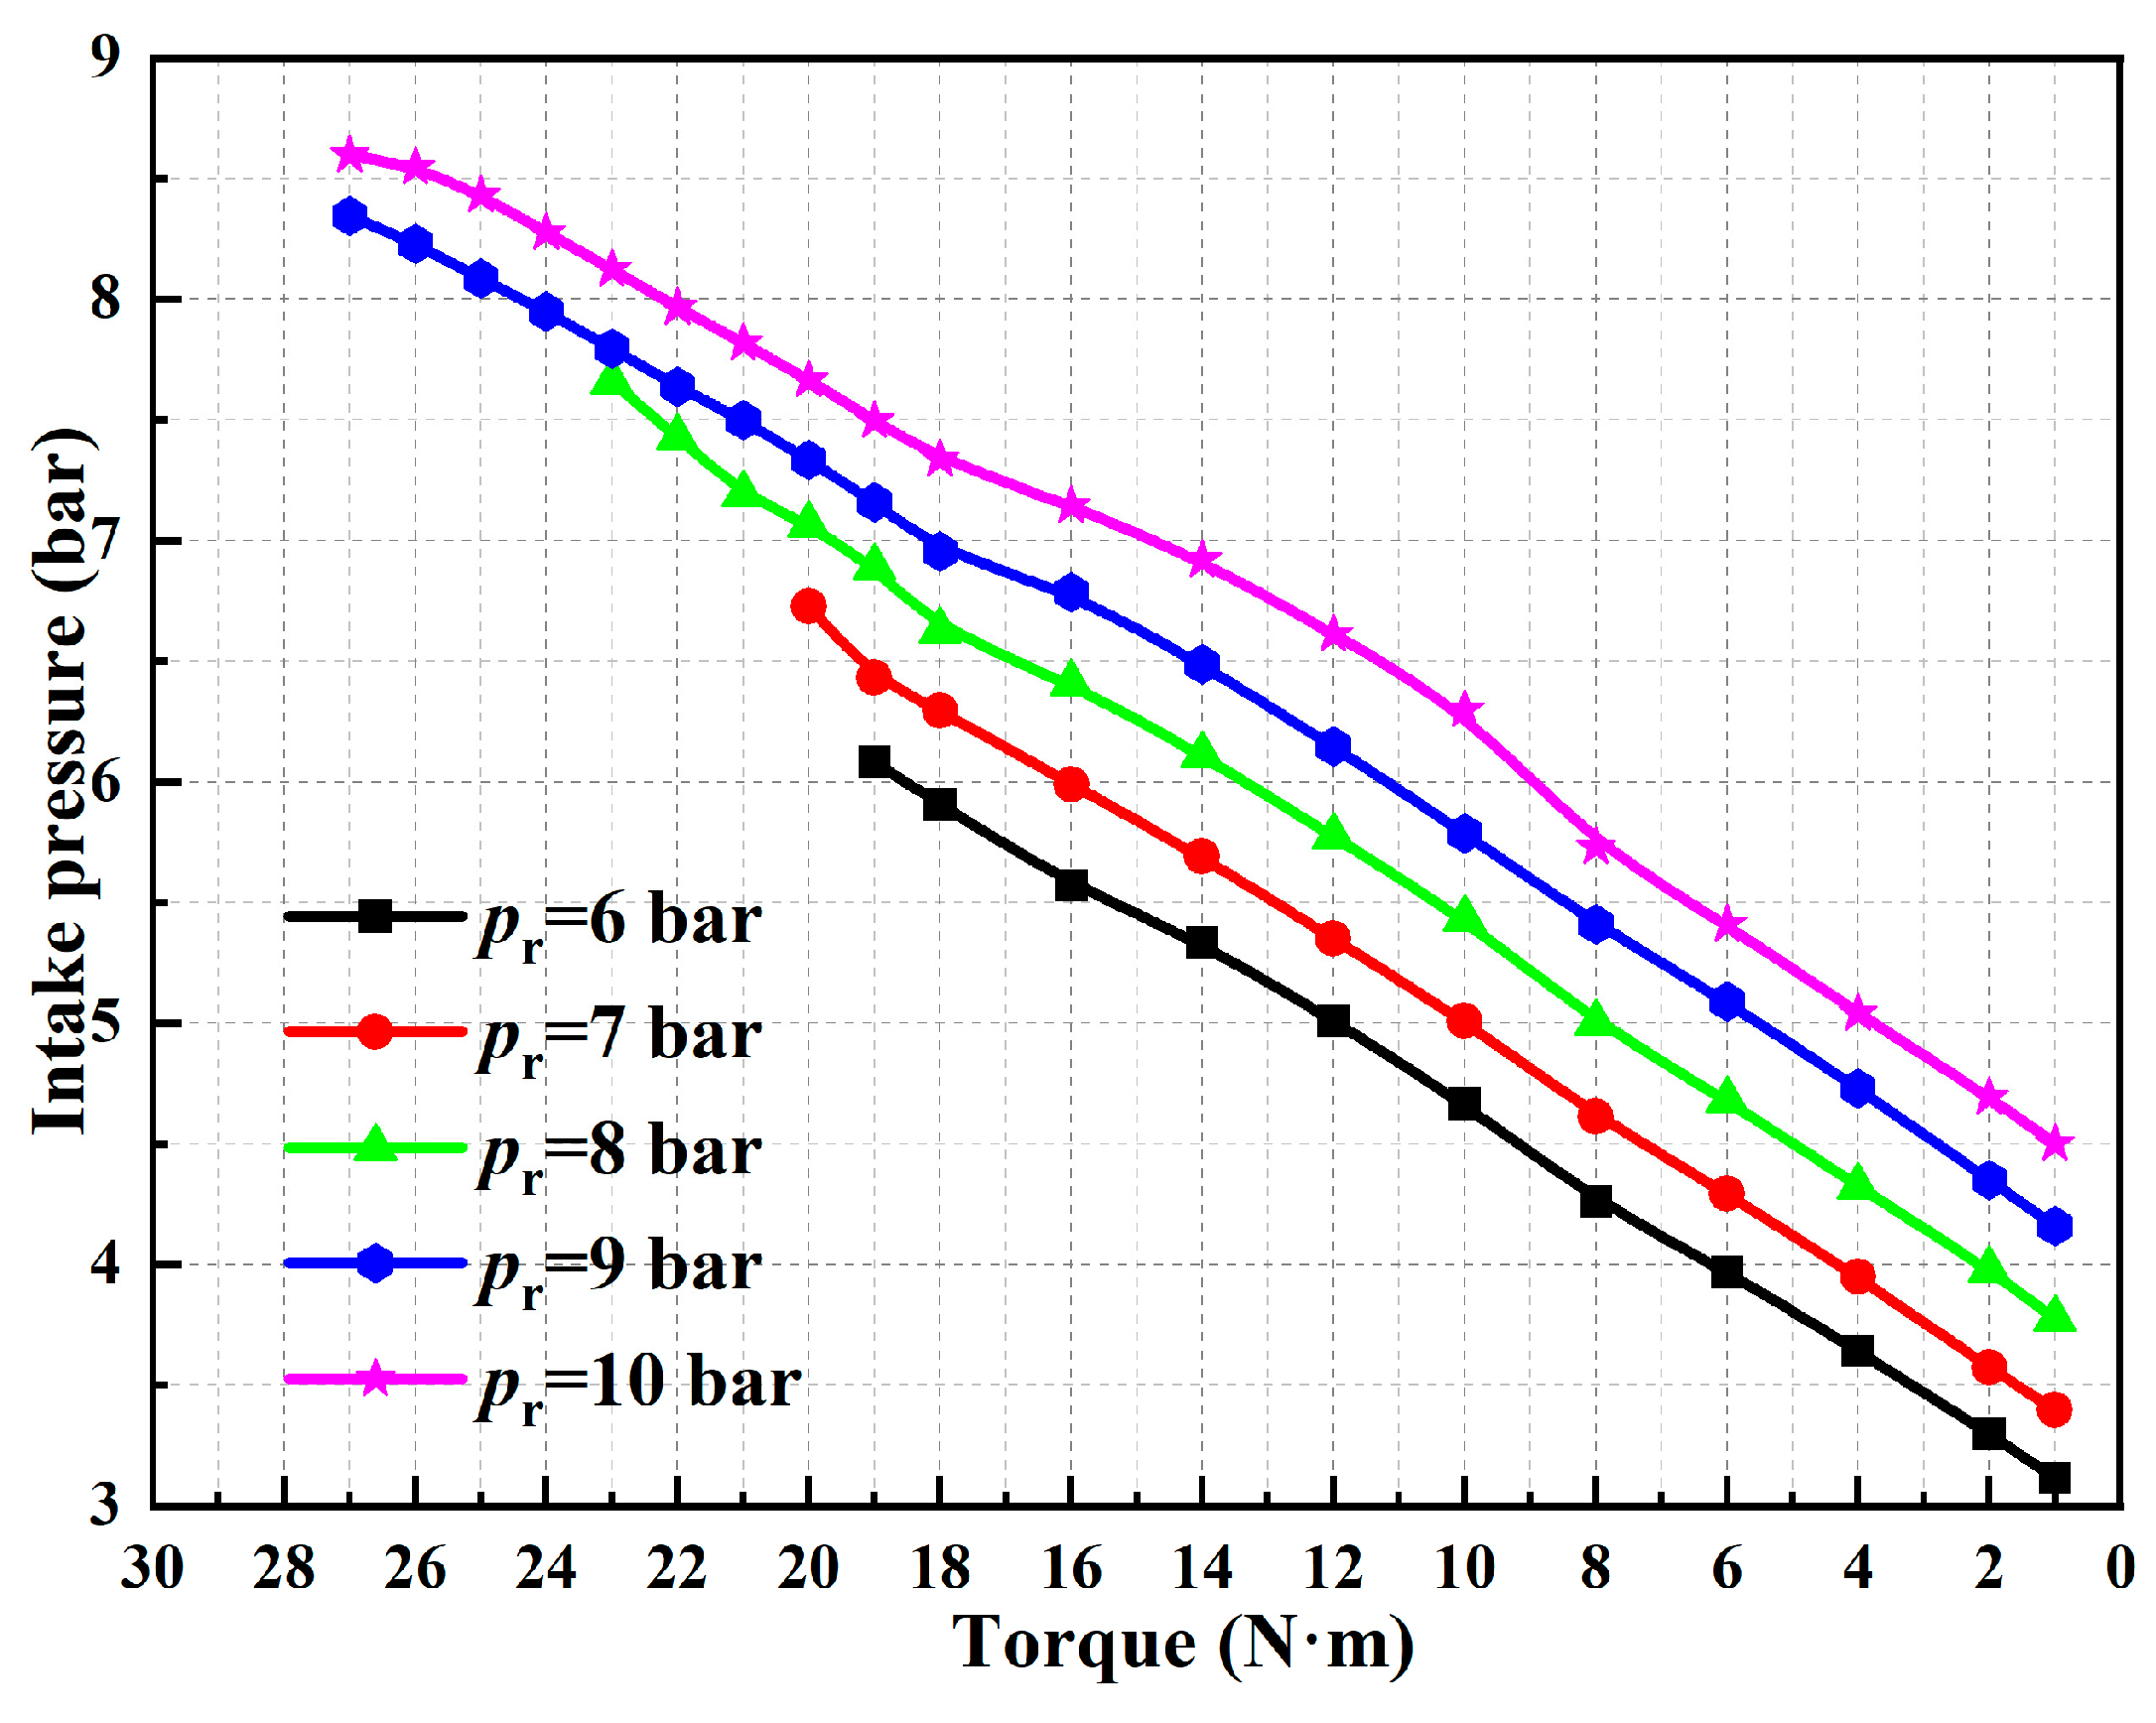
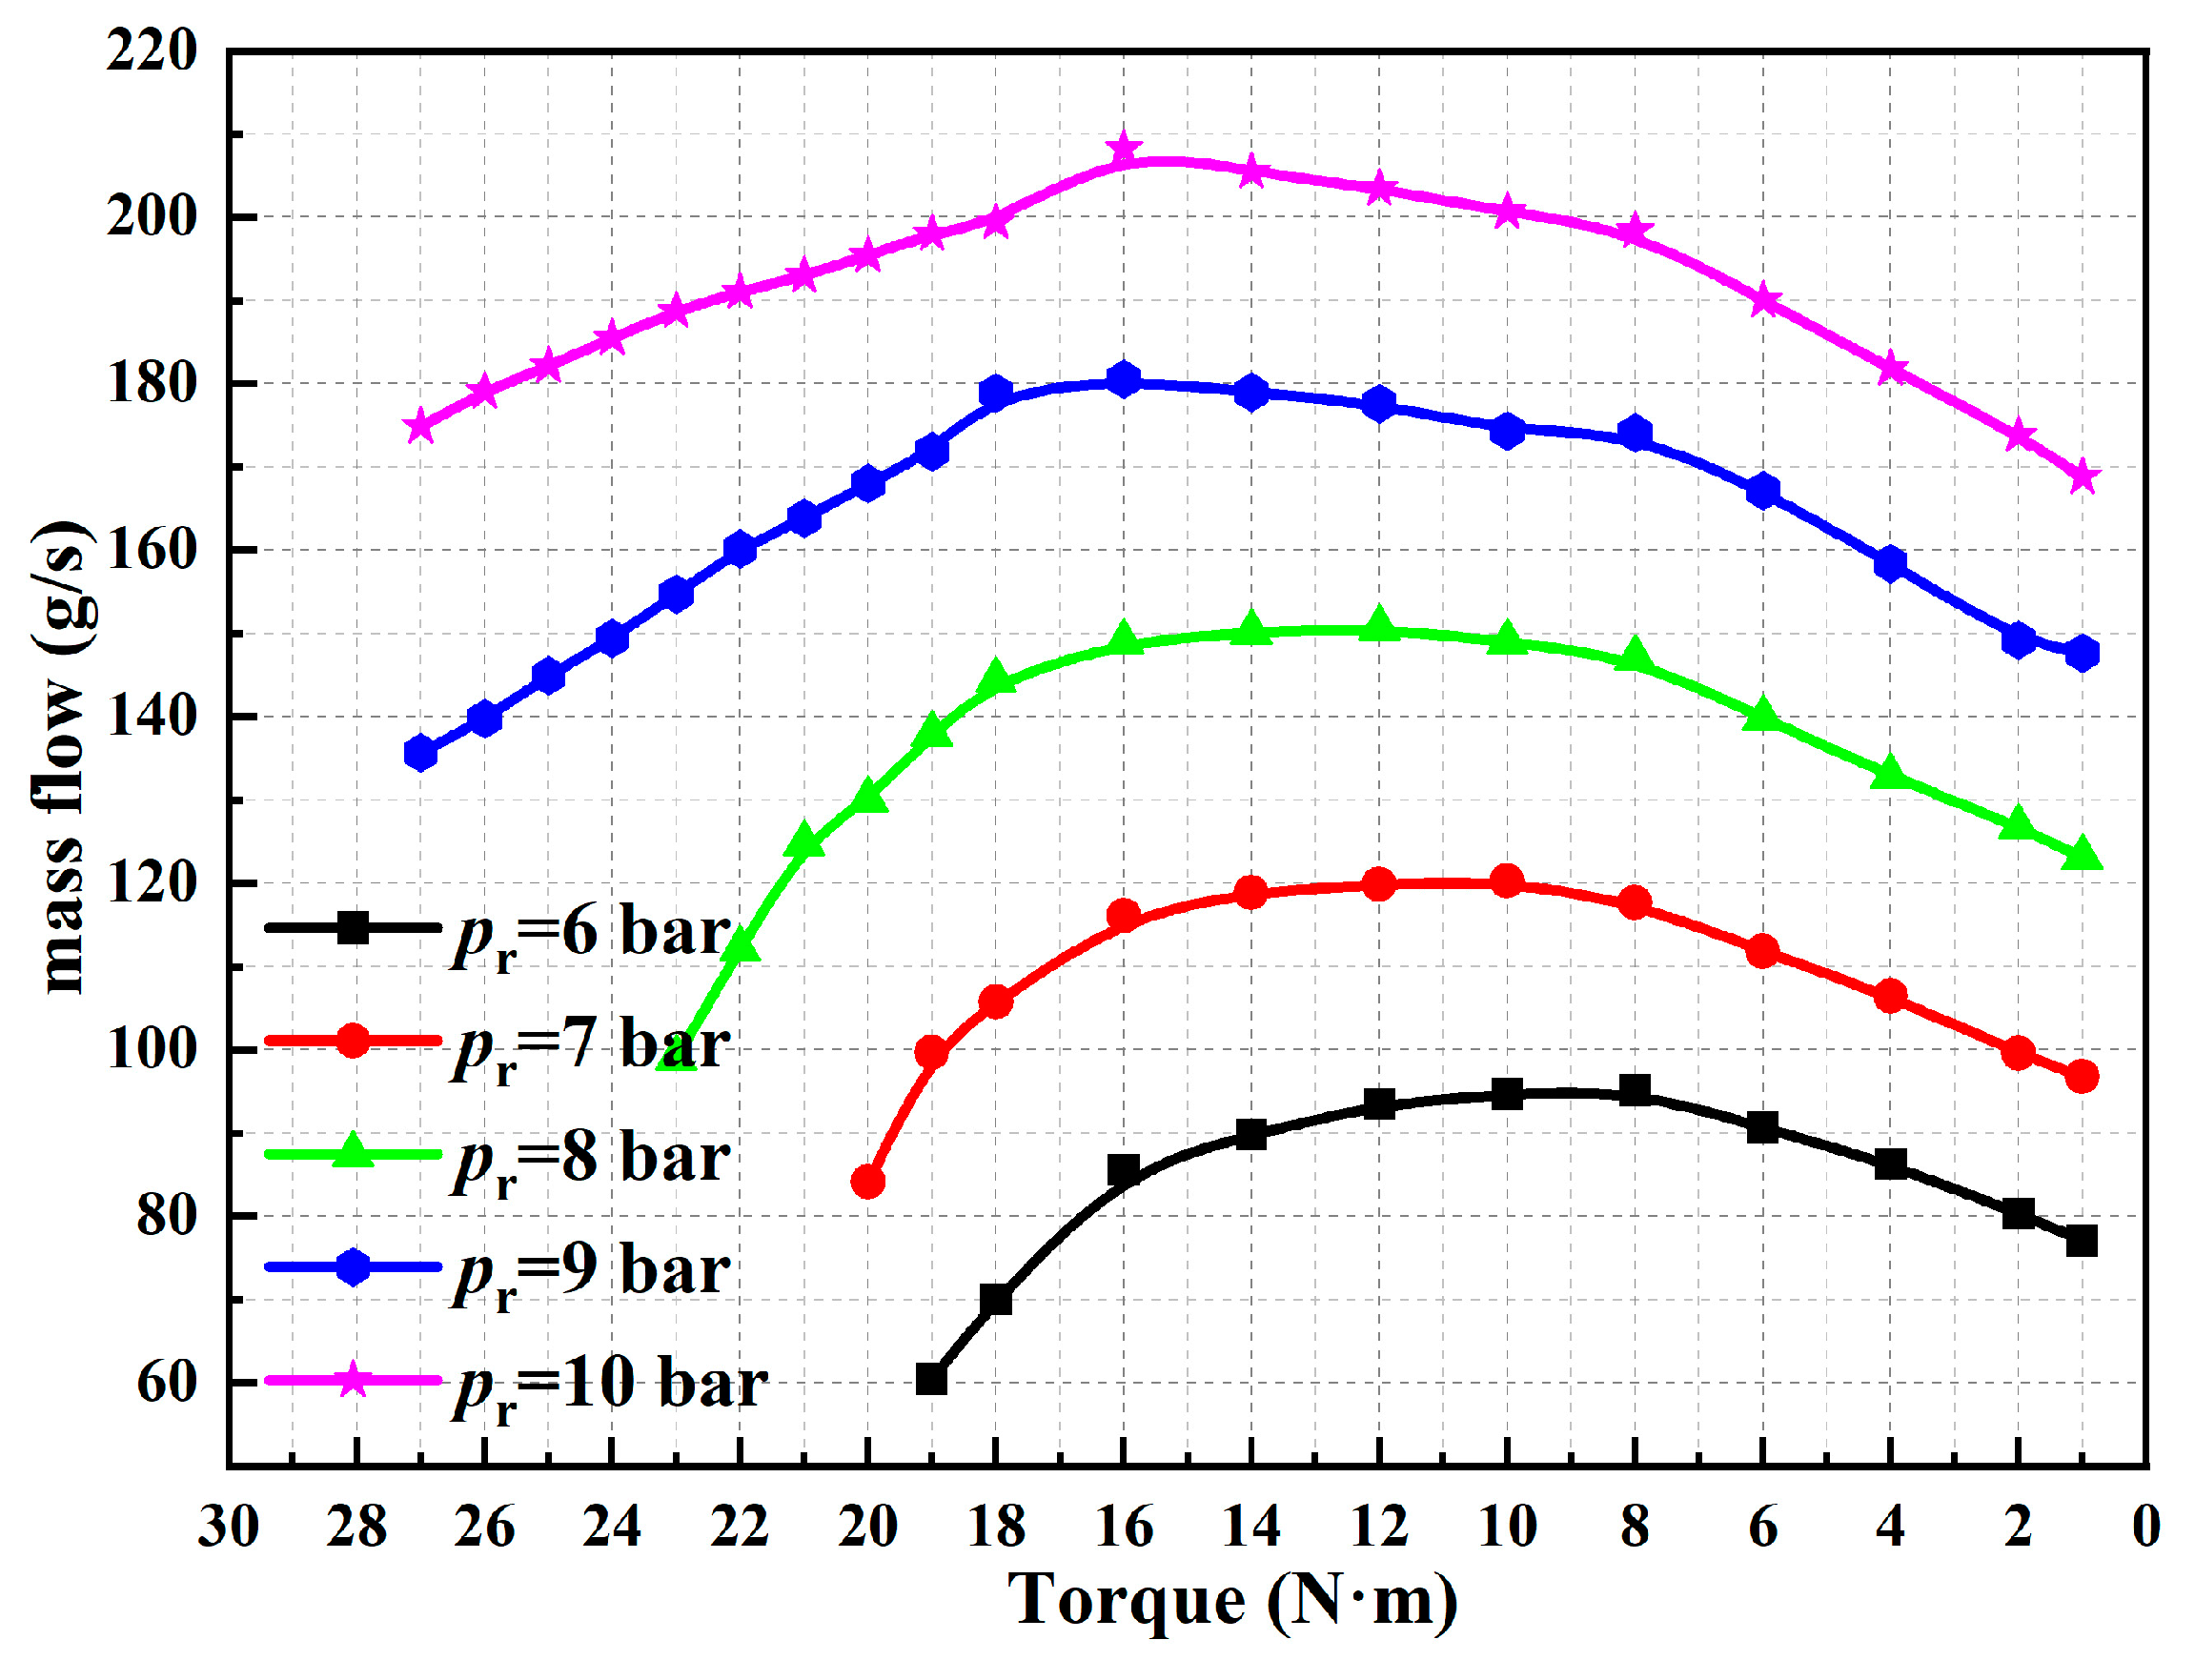
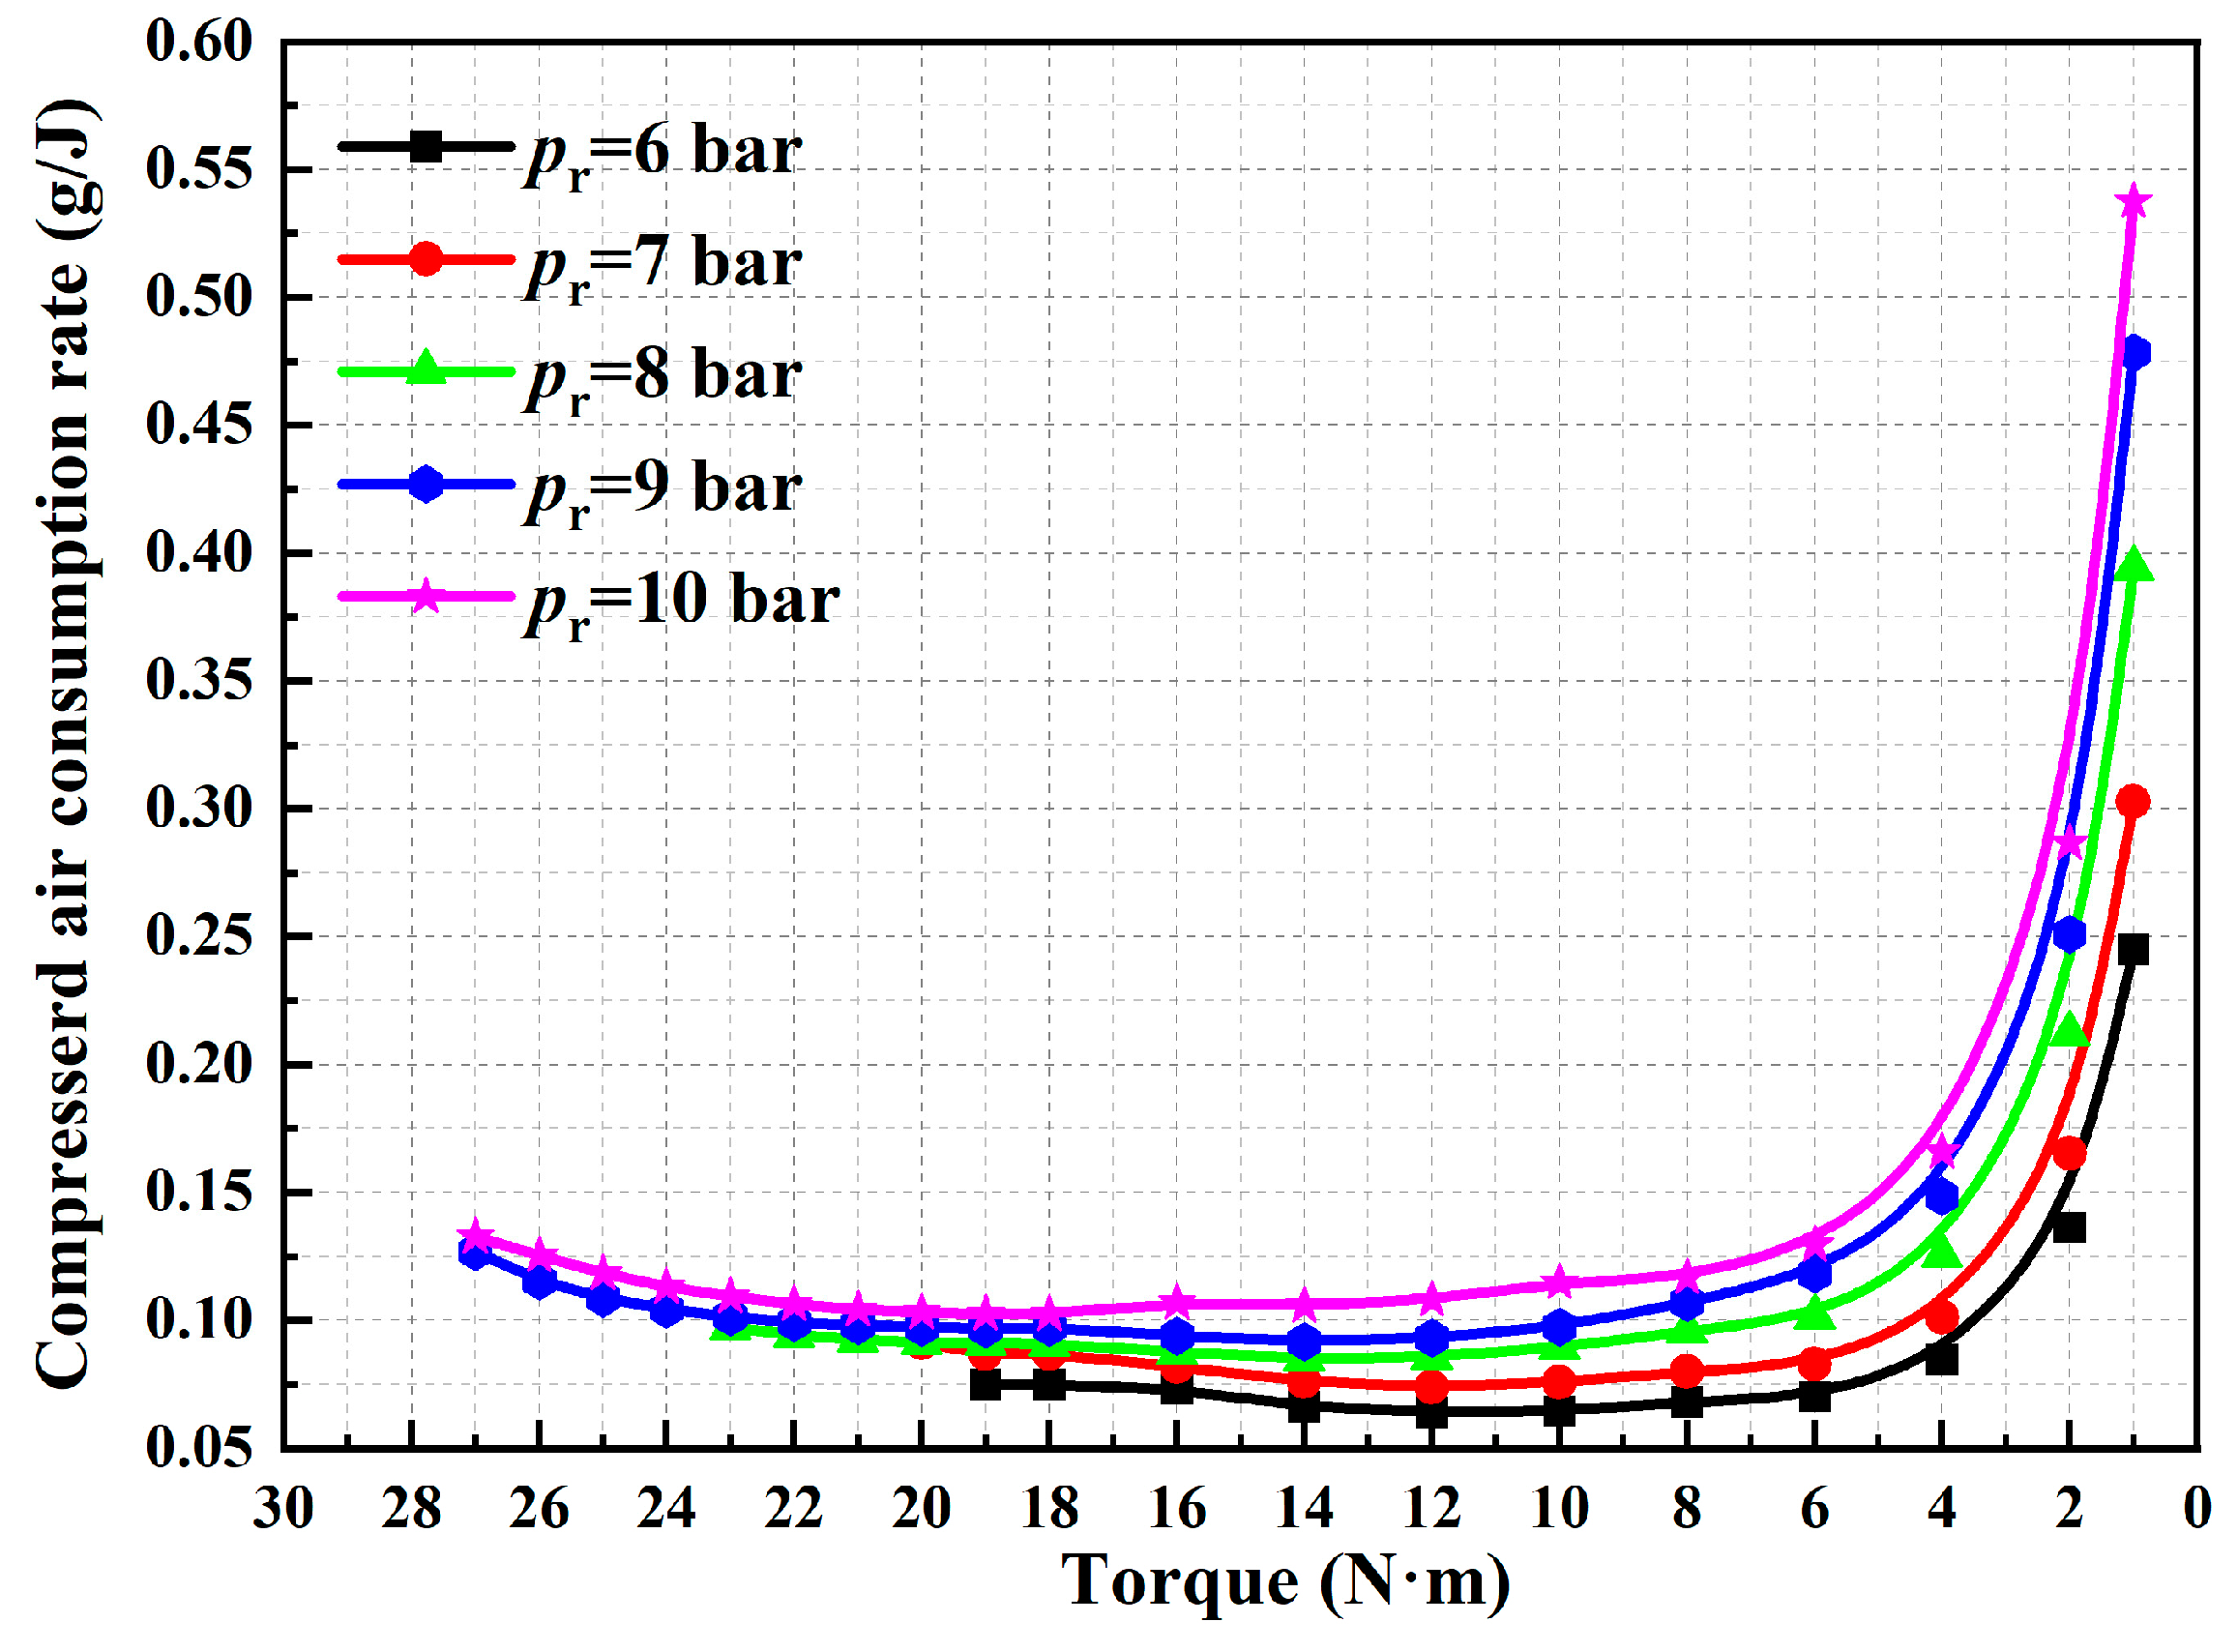
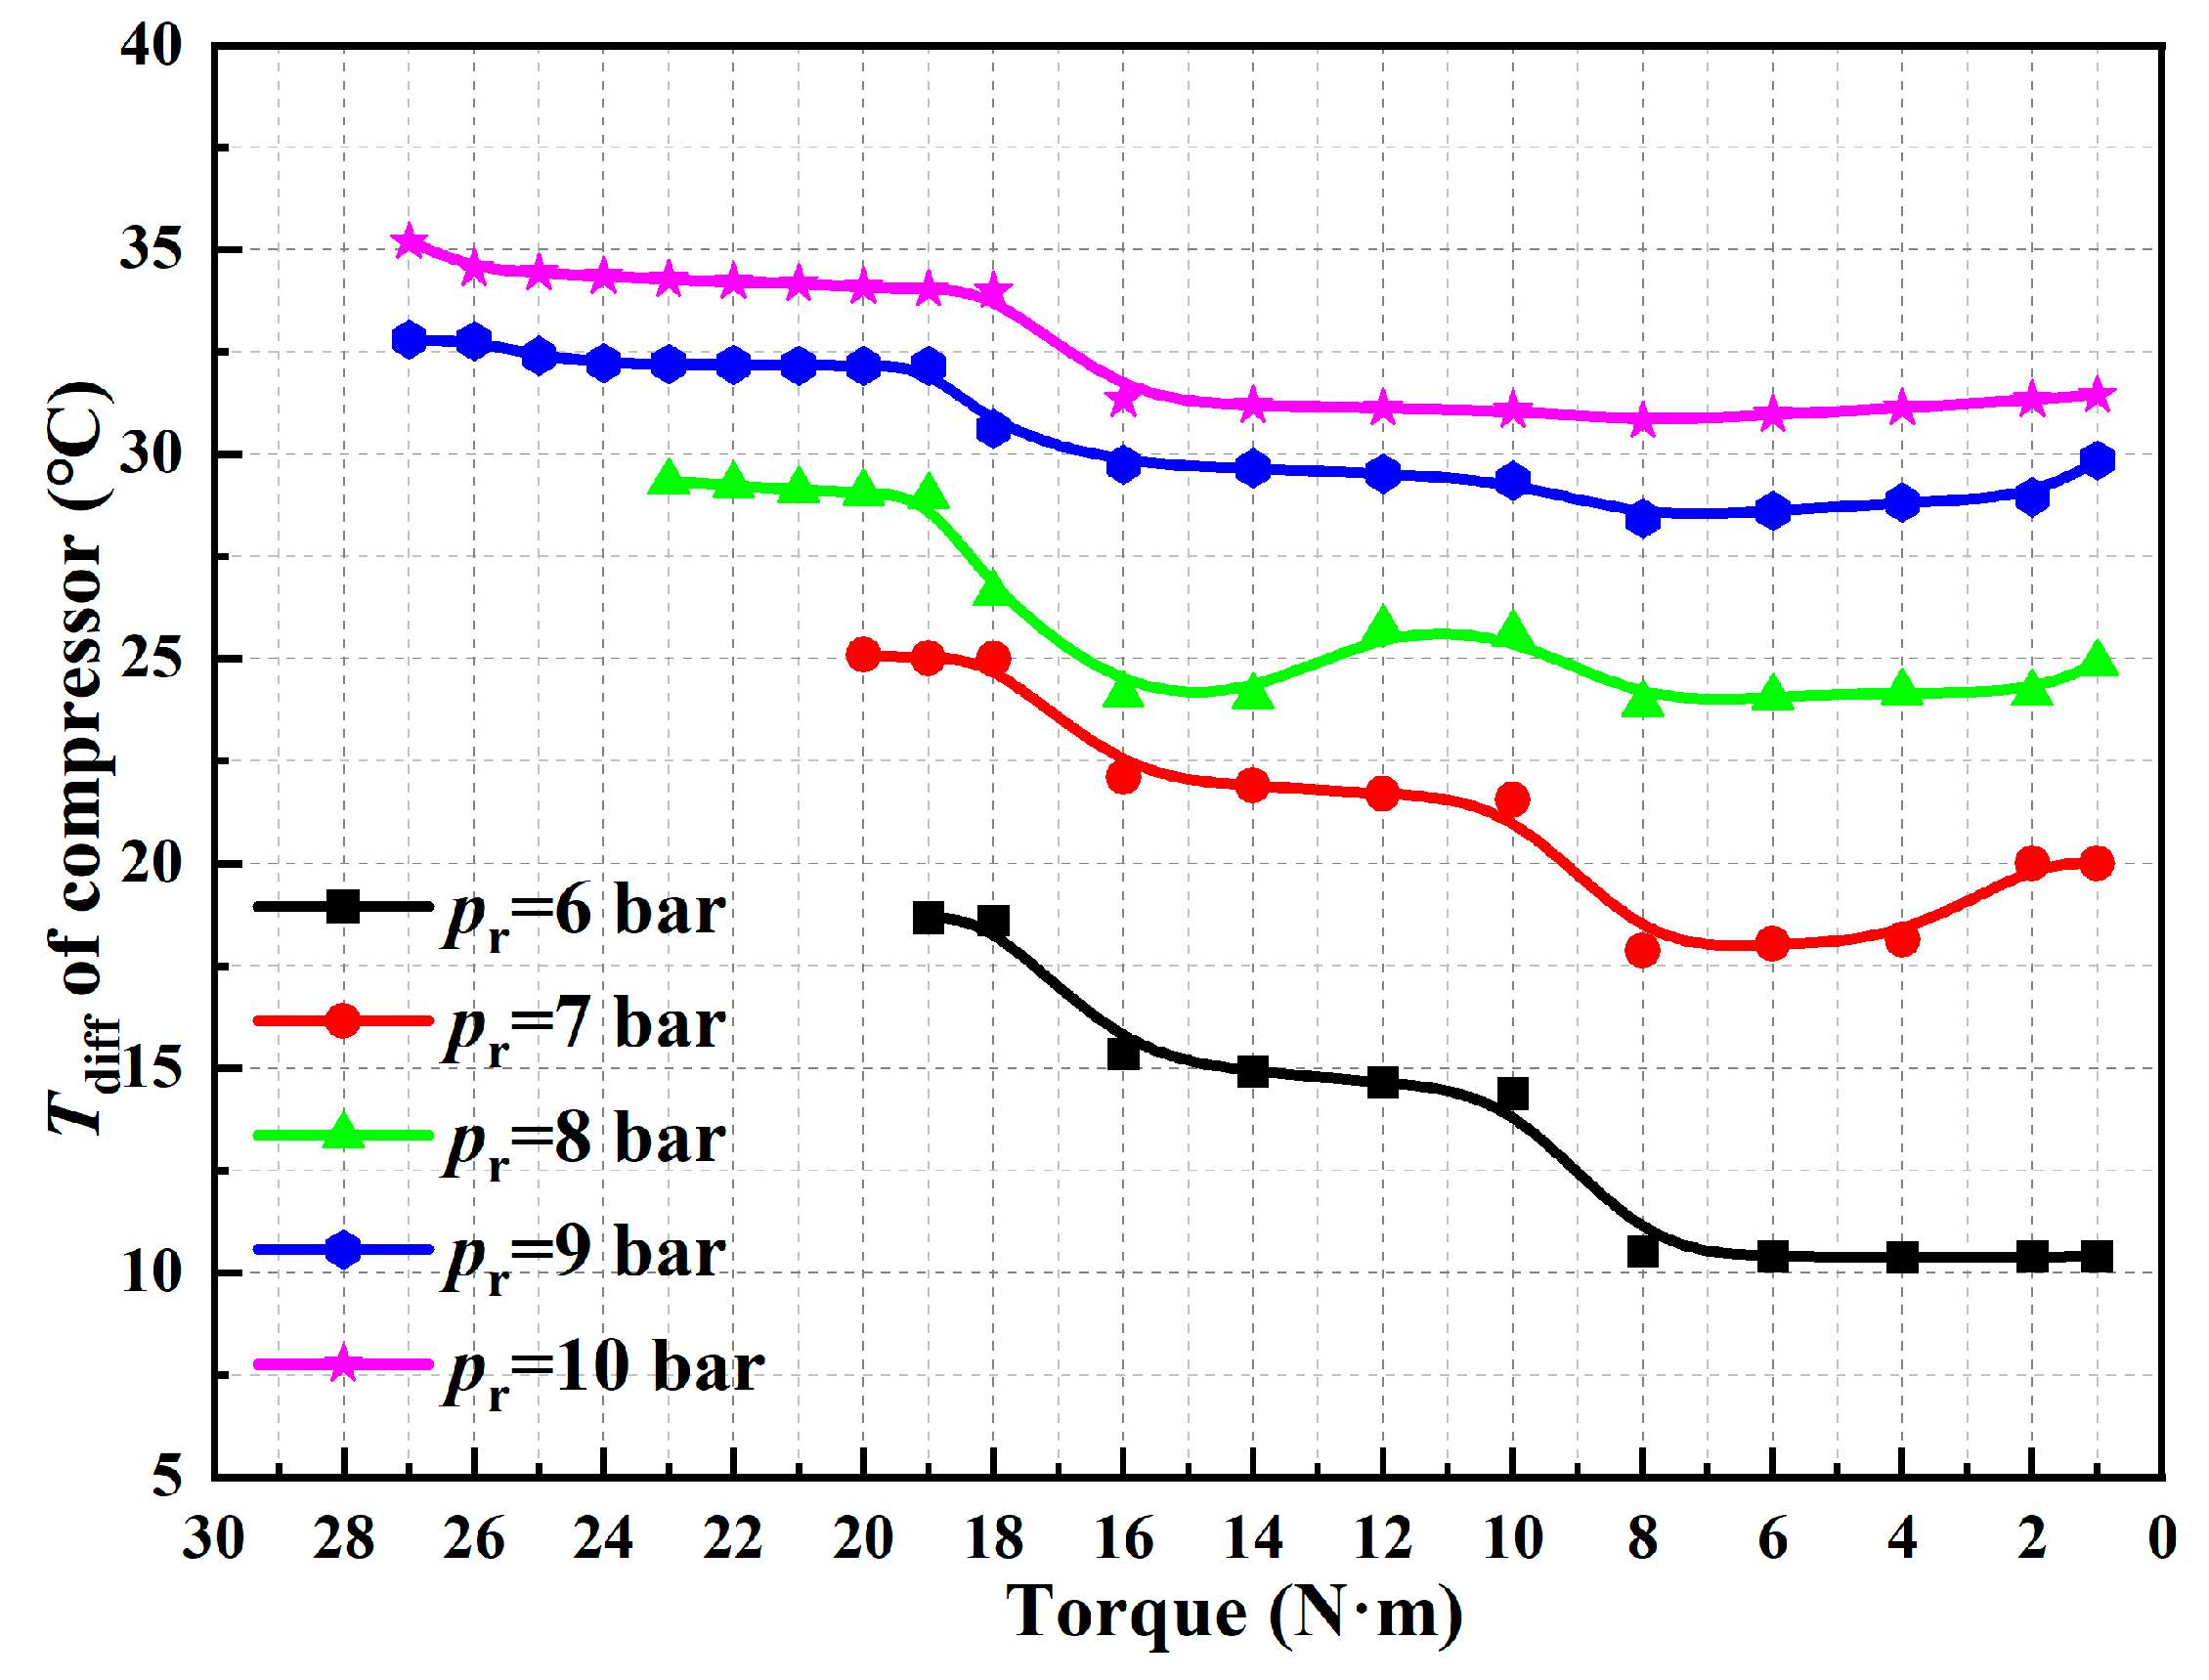
3.3. Influence of the Torque on the Performance of the Scroll Expander

In Figure 20, the inlet pressure decreases as the torque decreases, and a lower regulator pressure results in a lower inlet pressure. As the torque decreases, it shows a linear downward trend. A larger inlet pressure can produce more torque, and a smaller inlet pressure produces less torque. At 10 bar, the maximum torque is 27 N·m, and at 6 bar, the maximum torque is 19 N·m.
Figure 21 shows that the expansion ratio decreases with the torque. The regulator has an expansion ratio of 8.3 at a torque of 10 bar 27 N·m, which gradually decreases to 3.25 with decreasing torque. Other regulator pressures also show a consistent decreasing trend with decreasing torque.
Figure 22 shows that a higher mass flow rate at a larger pressure of the regulator produces a larger initial torque. The mass flow rate shows a trend of increasing and then decreasing, while the trend of the torque and speed remains the same. The maximum mass flow rates corresponding to a regulator pressure ranging from 6 to 10 bar occurring at 8 N·m, 10 N·m, 12 N·m, 16 N·m, and 16 N·m are 95.1 g/s, 120.2 g/s, 150.6 g/s, 180 g/s, and 208 g/s, respectively.
Figure 23 shows that the initial torque varies at different regulator pressures. As the regulator pressure increases, the initial torque also increases. As the torque decreases, the output power shows a tendency to first increase and then decrease. The maximum torque occurs at various regulator pressures. For example, at the 10 bar condition, the maximum torque is 1946 W at 18 N·m, and at the 6 bar condition, the maximum torque is 1467 W at 10 N·m. This means that high pressure can produce high power at high torque. Low pressure results in smaller peak output power and torque. Pressure is very important for compressed air cars, as it can lead to different torques and maximum outputs.
Figure 24 shows the same trend as in Figure 17. The initial torque at a high pressure (10 bar) could reach 27 N·m. After that, the CACR remains stable in a wide range of torques from 27 N·m to 6 N·m. As the torque continues to decrease, the CACR increases rapidly to 0.53 g/J. Conversely, the initial torque at a high pressure (6 bar) could reach 19 N·m. After that, the CACR remains stable from 19 N·m to 4 N·m. As the torque continues to decrease, the CACR increases rapidly to 0.24 g/J. From this figure, it is evident that various regulator pressures can keep the CACR stable in a wide range, with high pressure having a wider range than lower pressure.
Figure 25 shows that, at a lower regulator pressure, there could be a smaller temperature difference. If the regulator pressure is 10 bar, the temperature difference could reach approximately 32 °C. As the torque decreases, the temperature difference becomes larger. If the regulator pressure is at 6 bar, the temperature difference could reach 10 °C. When the regulator pressure is at 10 bar, the temperature difference is higher than 30 °C. If the intake pressure is higher, the CAES unit could withstand greater temperature variations. The cooling power could be used in automotive refrigeration.
Figure 19 and Figure 26 are symmetrical about the y-axis. As the torque declines, the isentropic efficiency increases. If the regulator is working at a high pressure, the isentropic efficiency could be higher than that at a lower pressure. As the torque decreases, the isentropic efficiency tends to increase or remain constant. For example, under a regulator pressure of 10 bar, the isentropic efficiency could increase from 25.31% at 27 N·m to 36.87% at 1 N·m. On the contrary, the isentropic efficiency remains constant from 14.81% at 19 N·m to 13.31% at 1 N·m when the regulator pressure is 6 bar.

3.4. Uncertainty Analysis

An error and uncertainty analysis is conducted in this study using the experimental data. The experiment was repeated three times under the same conditions. Figure 27 displays the error bars for the volume flow rate, output power, expansion ratio, rotating speed, and torque at the regulator pressure of 10 bar.
S = ( X i X ¯ ) n 1
where S represents the parameter error, X i represents the experimental data, X ¯ represents the average of multiple experimental data, and n represents the number of experimental repetitions.

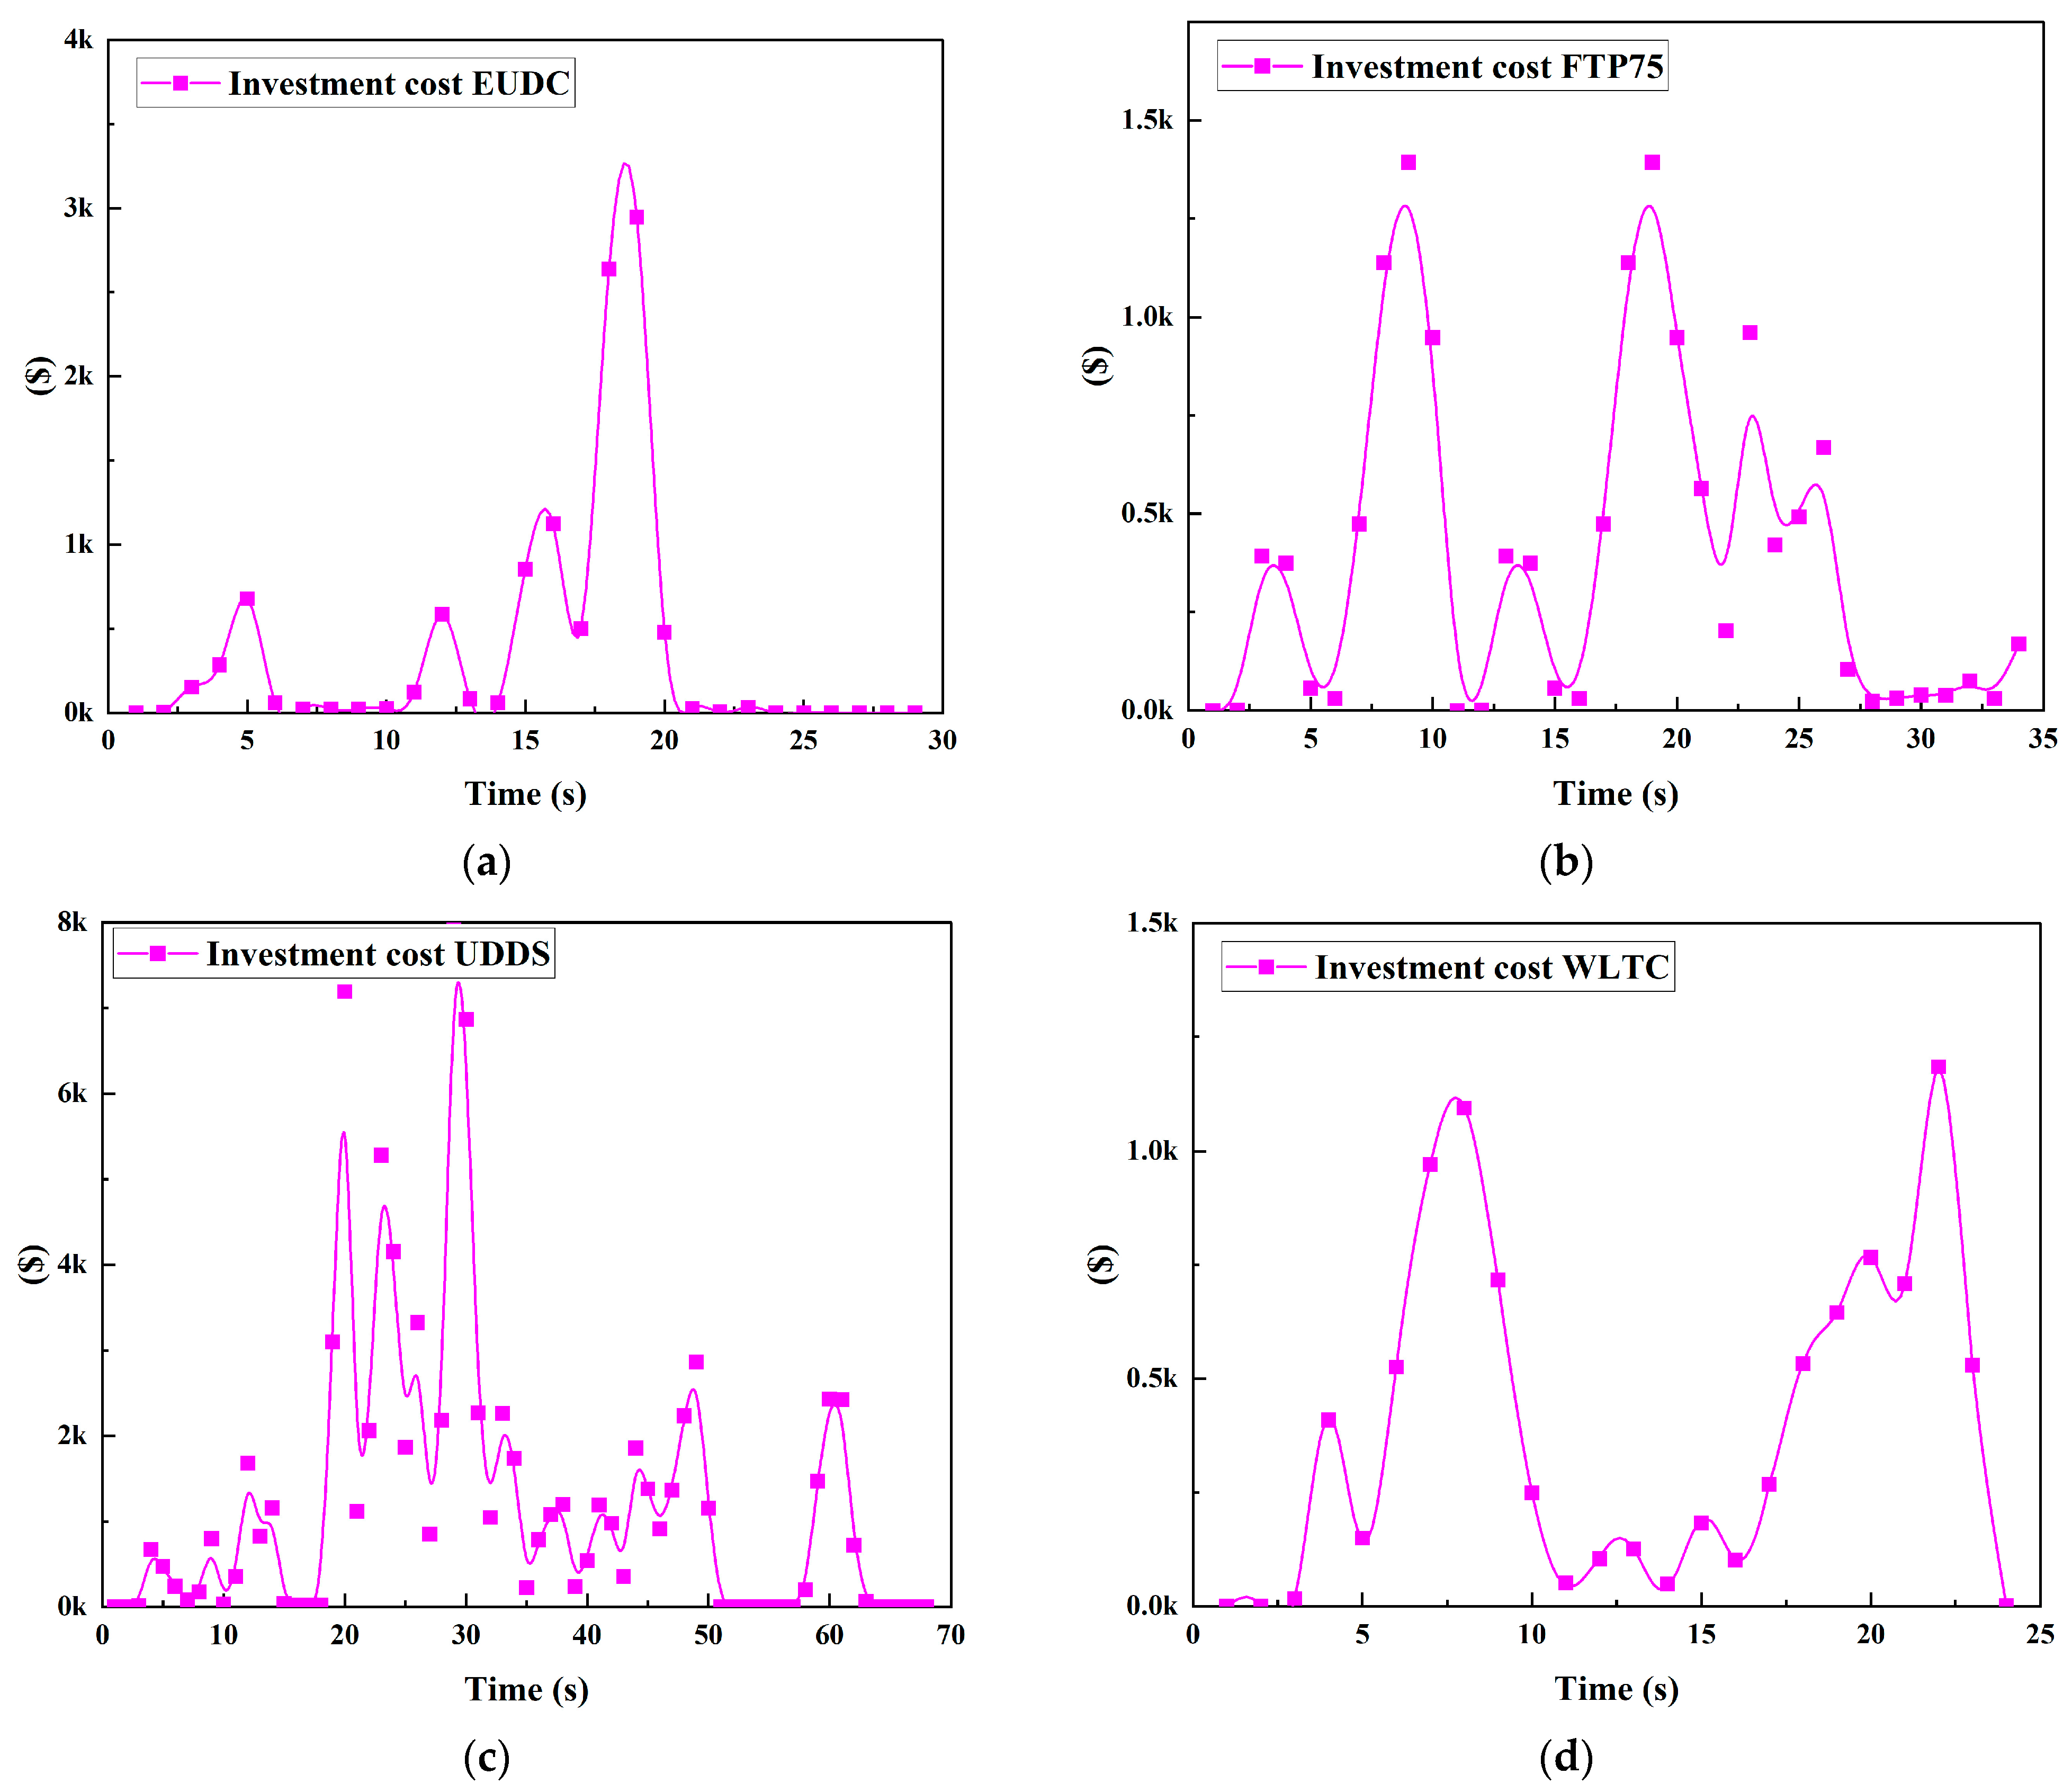
3.5. Performance of the CAES Unit under Various Driving Cycles

Figure 28 illustrates the results of testing a scroll expander at a 10 bar regulator pressure across various driving cycles. Figure 28a depicts the scroll expander’s performance under EUDC conditions, where the maximum output power reached approximately 1800 W with an average power of 281.5 W. Meanwhile, Figure 28b portrays the scroll expander’s performance during FTP75 conditions, where the maximum output power was 951 W and the average power was 288.5 W. Figure 28c displays the output performance of the scroll expander under UDDS conditions, with a maximum output power of approximately 3500 W and an average power of 756.4 W. Figure 28d illustrates the output results of the scroll expander under the WLTC condition, which exhibits a maximum output of 851 W and an average output of 363.9 W. It is evident that both the FTP75 and EUDC conditions display excellent economic performance, while a greater amplitude and higher peak are noticeable in the UDDS condition.

3.6. Economic Model

The cost of the expander is estimated as:
C EXP = C E P C I 2023 C E P C I 2020 F S C EXP 0 F MP
where the C EXP 0 is the base cost of the expander and F MP is the material and pressure factor of the expander.
The basic cost of the expander is:
lg C EXP 0 = K 1 , EXP + K 2 , EXP lg W ˙ EXP + K 3 , EXP ( lg W ˙ EXP ) 2
where K 1 , EXP , K 2 , EXP , and K 3 , EXP are constants based on the type of expander and W ˙ EXP is the output power of the expander.
The coefficients in each of the above equations are given in Table 3.
When considering the use of a CAES unit as a vehicle power source, it is important to take into account the economics of the initial investment in Figure 29. The initial investment is directly related to the output of the scroll expander. Since operating conditions can vary, the economic viability of using a CAES unit as a vehicle power source can be determined by calculating the initial investment cost. It is evident that a higher output power results in a higher investment cost, as seen in Figure 29a for the EUDC driving cycle, where the investment cost is approximately USD 3.5 k. The initial investment cost is directly proportional to the output power. For the FTP75 in Figure 29b, the maximum investment cost is around USD 1.5 k, and for the UDDS in Figure 29c, a larger output power results in a larger investment cost of up to USD 7.1 k in Figure 29d.

3.7. Discussion

The most obvious finding to emerge from this study is that the maximum power of the scroll expander does not occur at the maximum volume flow rate, rotating speed, and torque. The reason depends on the intrinsic properties of the scroll expander; for example, lubrication and leakage.
Some of the results are consistent with Liangjia’s experiment. This article uses a scroll expander to extract compressed air. The output power could be larger than a pneumatic motor. An economic model is established using a scroll expander as vehicle power. The initial investment is related to the maximum power of the scroll expander.
In this paper, a scroll expander is used as vehicle power. A new approach for the use of compressed air is provided.

4. Summary and Conclusions

In this study, the CAES unit test bench was investigated under various parameters. Based on the experimental data, the performance of the scroll expander was analyzed. The test bench also simulated different driving cycles in order to assess the CAES unit’s use in vehicle power. Finally, the economy of the CAES unit was built and researched. The main conclusions of the study can be drawn as follows:
  • The larger inlet pressure results in a larger volume flow, speed, and torque. The inlet pressure decreases with the increase in the flow rate, decreases with the increase in the speed, and decreases with the decrease in the torque.
  • Under different pressures of the regulator, the influence of the volume flow on the expansion ratio is obvious, and the influence of torque on the expansion ratio is the weakest.
  • There is an obvious relationship between the maximum output power of the scroll expander and the pressure of the regulator. The maximum output power is 1965.23 W under the pressure of a 10 bar pressure regulator, and it is not the maximum value of the torque, speed, and volume flow.
  • Larger regulator pressures can lead to a larger temperature drop as they expand, which can be used for vehicle cooling and as a vehicle air conditioner.
  • When compressed air is used as vehicle power, the system cost needs to be considered, and the higher the peak power, the higher the cost. But higher inlet pressures also result in larger volumetric flows, which leads to the need for larger air reservoirs.
In future work, the machine-learning method will be used to predict the performance indicators under high pressure. The size of the air storage tank will be estimated and used as an economic indicator and a mileage indicator, and then compared with the engine map of a fuel car to obtain the best configuration in order to provide the CAES unit with a wide range in vehicle power.

Author Contributions

H.Y.: Conceptualization, Methodology, Experiment, Investigation, Software, Validation, and Writing—Original Draft. Y.X.: Experiment and Writing—Review and Editing. X.Z.: Conceptualization, Investigation, Methodology, Validation, and Supervision. J.Z.: Conceptualization, Methodology, Software, Validation, and Supervision. F.Y.: Investigation, Supervision, and Validation. All authors have read and agreed to the published version of the manuscript.

Funding

This work was sponsored by the Beijing Natural Science Foundation (Grant Nos. 3222024 and 3244039).

Data Availability Statement

The data presented in this study are available on request from the corresponding author.

Conflicts of Interest

The authors declare no conflict of interest.

Nomenclature

p in intake pressure (bar)
p out exhaust pressure (bar)
n r rotation speed of the scroll expander (r/min)
T r torque of the scroll expander (N·m)
p pressure (bar)
P power output of the scroll expander (W)
V as volume (m3)
m as mass (g)
m ˙ as mass flow rate (g/s)
c CACR (g/J)
h out enthalpy of air exiting (J/g)
h in enthalpy of air entering (J/g)
h iout isentropic enthalpy of compressed air at the outlet (J/g)
X i experimental data
X ¯ average of multiple experimental data
Sparameter error
nnumber of experimental repetitions
C EXP cost of the expander (USD)
F S material factor of the expander
C EXP 0 base cost of the expander (USD)
F MP pressure factor of the expander
K 1 , EXP a constant based on the type of expander
K 2 , EXP a constant based on the type of expander
K 3 , EXP a constant based on the type of expander
W ˙ EXP power output of the scroll expander (kW)
Greek letters
ε e expansion ratio
η s isentropic efficiency
Acronyms
CAEScompressed air energy storage
PHESpumped-hydro energy storage
WLTCworld-harmonized light-duty vehicle test cycle
NEDCnew European driving cycle
FTP75federal test procedure
EUDCextra-urban driving cycle
CACRcompressed air consumption rate
CEPCIchemical engineering plant cost index

References

  1. Chang, J.W.; Li, Z.; Huang, Y.; Yu, X.N.; Jiang, R.C.; Huang, R.; Yu, X.L. Multi-objective optimization of a novel combined cooling, dehumidification and power system using improved M-PSO algorithm. Energy 2022, 239, 122487. [Google Scholar] [CrossRef]
  2. Li, P.; Hu, Q.Y.; Han, Z.H.; Wang, C.X.; Wang, R.X.; Han, X.; Wang, Y.Z. Thermodynamic analysis and multi-objective optimization of a trigenerative system based on compressed air energy storage under different working media and heating storage media. Energy 2022, 239, 122252. [Google Scholar] [CrossRef]
  3. Dib GHaberschill PRullière, R.; Perroit, Q.; Davies, S.; Revellin, R. Thermodynamic simulation of a micro advanced adiabatic compressed air energy storage for building application. Appl. Energy 2020, 260, 114248. [Google Scholar]
  4. Li, J.; Yang, F.B.; Zhang, H.G.; Wu, Z.; Hou, X.C.; Xu, Y.H.; Ren, J. Comparative analysis of different valve timing control methods for single-piston free piston expander-linear generator via an orthogonal experimental design. Energy 2020, 195, 116966. [Google Scholar] [CrossRef]
  5. Mahmoud, M.; Ramadan, M.; Olabi, A.G.; Pullen, K.; Naher, S. A review of mechanical energy storage systems combined with wind and solar applications. Energy Convers. Manag. 2020, 210, 112670. [Google Scholar] [CrossRef]
  6. Yu, X.L.; Jiang, R.C.; Li, Z.; Gao, Q.; Wang, B.Z.; Wang, L.; Huang, R. Synergistic improvement of melting rate and heat storage capacity by a rotation-based method for shell-and-tube latent thermal energy storage. Appl. Therm. Eng. 2023, 219, 119480. [Google Scholar] [CrossRef]
  7. Malozyomov, B.V.; Kukartsev, V.V.; Martyushev, N.V.; Kondratiev, V.V.; Klyuev, R.V.; Karlina, A.I. Improvement of hybrid electrode material synthesis for energy accumulators based on carbon nanotubes and porous structures. Micromachines 2023, 14, 1288. [Google Scholar] [CrossRef] [PubMed]
  8. Fang, J.; Wang, D.C.; Xu, H.M.; Sun, F.; Fan, Y.N.; Rong, C.; Liu, Q.B. Unleashing solar energy’s full potential: Synergetic thermo-photo catalysis for enhanced hydrogen production with metal-free carbon nitrides. Energy Convers. Manag. 2024, 300, 117995. [Google Scholar] [CrossRef]
  9. Koohi-Fayegh, S.; Rosen, M.A. A review of energy storage types, applications and recent developments. J. Energy Storage 2020, 27, 101047. [Google Scholar] [CrossRef]
  10. Alirahmi, S.M.; Mousavi, S.B.; Razmi, A.R.; Ahmadi, P. A comprehensive techno-economic analysis and multi-criteria optimization of a compressed air energy storage (CAES) hybridized with solar and desalination units. Energy Convers. Manag. 2021, 236, 114053. [Google Scholar] [CrossRef]
  11. He, W.; Wang, J. Optimal selection of air expansion machine in Compressed Air Energy Storage: A review. Renew. Sustain. Energy Rev. 2018, 87, 77–95. [Google Scholar] [CrossRef]
  12. Marvania, D.; Subudhi, S. A comprehensive review on compressed air powered engine. Renew. Sustain. Energy Rev. 2017, 70, 1119–1130. [Google Scholar] [CrossRef]
  13. Zahoor, A.; Mehr, F.; Mao, G.Z.; Yu, Y.J.; Sápi, A. The carbon neutrality feasibility of worldwide and in China’s transportation sector by E-car and renewable energy sources before 2060. J. Energy Storage 2023, 61, 10669. [Google Scholar] [CrossRef]
  14. Nayak, H.K.; Goswami, D.; Hablani, V. Technical review on study of compressed air vehicle (CAV). Int. J. Automob. Eng. 2013, 3, 81–90. [Google Scholar]
  15. Finkelstein, T.; Organ, A.J. Air Engines: The History, Science, and Reality of the Perfect Engine; ASME Press: New York, NY, USA, 2009. [Google Scholar]
  16. Thipse, S.S. Compressed air car. Tech Monit. 2008, 11, 33–37. [Google Scholar]
  17. Hodges, C.B. Compressed-Air Engine. U.S. Patent US953336, 29 March 1910. [Google Scholar]
  18. Hodges, C.B. Compressed-Air Engine. U.S. Patent US1024778, 30 April 1912. [Google Scholar]
  19. Verma, S.S. Latest developments of a compressed air. Glob. J. Res. Eng. 2013, 13, 1119–1130. [Google Scholar]
  20. Mousavi, S.; Kara, S.; Kornfeld, B. Energy efficiency of compressed air systems. Procedia CIRP 2014, 15, 313–318. [Google Scholar] [CrossRef]
  21. Higelin, P.; Charlet, A. Thermodynamic Cycles for a New Hybrid Pneumatic Combustion Engine Concept; SAE Technical Paper 2001-24-0033; SAE International: Warrendale, PA, USA, 2001. [Google Scholar]
  22. Higelin, P.; Charlet, A.; Chamaillard, Y. Thermodynamic simulation of a hybrid pneumatic-combustion engine concept. Appl. Thermodyn. 2002, 5, 1–11. [Google Scholar]
  23. Tai, C.; Tsao, T.C.; Levin, M.B.; Barta, G.; Schechter, M.M. Using camless valvetrain for air hybrid optimization. SAE Trans. 2003, 112, 196–210. [Google Scholar]
  24. Andersson, M.; Johansson, B.; Hultqvist, A. An Air Hybrid for High Power Absorption and Discharg; SAE Technical Paper 2005-01-2137; SAE International: Warrendale, PA, USA, 2005. [Google Scholar]
  25. Trajkovic, S.; Tunestål, P.; Johansson, B. Simulation of a Pneumatic Hybrid Powertrain with VVT in GT-Power and Comparison with Experimental Data; SAE Technical Paper 2009-01-1323; SAE International: Warrendale, PA, USA, 2009. [Google Scholar]
  26. Trajkovic, S.; Tunestål, P.; Johansson, B.; Carlson, U.; Höglund, A. Introductory Study of Variable Valve Actuation for Pneumatic Hybridization; SAE Technical Paper 2007-01-0288; SAE International: Warrendale, PA, USA, 2007. [Google Scholar]
  27. Trajkovic, S.; Tunestål, P.; Johansson, B. Investigation of different valve geometries and valve timing strategies and their effect on regenerative efficiency for a pneumatic hybrid with variable valve actuation. SAE Int. J. Fuels Lubr. 2008, 1, 1715. [Google Scholar] [CrossRef]
  28. Brejaud, P.; Charlet, A.; Chamaillard, Y.; Ivanco, A.; Higelin, P. Pneumatic-combustion hybrid engine: A study of the effect of the valvetrain sophistication on pneumatic modes. Oil Gas Sci. Technol. Rev. d’IFP Energ. Nouv. 2009, 65, 27–37. [Google Scholar] [CrossRef]
  29. Brejaud, P.; Charlet, A.; Higelin, P. Improving the Overall Efficiency of a Pneumatic-Combustion Hybrid Engine by Adding an Intermediate Heated Tank; SAE Technical Paper 2013-24-0075; SAE International: Warrendale, PA, USA, 2013. [Google Scholar]
  30. Brejaud, P.; Higelin, P.; Charlet, A.; Colin, G.; Chamaillard, Y. One dimensional modeling and experimental validation of single cylinder pneumatic combustion hybrid engine. SAE Int. J. Engines 2011, 4, 2326–2337. [Google Scholar] [CrossRef]
  31. Fazeli, A.; Khajepour, A.; Devaud, C.; Azad, N.L. A New Air Hybrid Engine Using Throttle Control; SAE Technical Paper 2009-01-1319; SAE International: Warrendale, PA, USA, 2009. [Google Scholar]
  32. Bao, R.; Stobart, R. Using Pneumatic Hybrid Technology to Reduce Fuel Consumption and Eliminate Turbo-Lag; SAE Technical Paper 2013-01-1452; SAE International: Warrendale, PA, USA, 2013. [Google Scholar]
  33. Dimitrova, Z.; Lourdais, P.; Maréchal, F. Performance and economic optimization of an organic Rankine cycle for a gasoline hybrid pneumatic powertrain. Energy 2015, 86, 574–588. [Google Scholar] [CrossRef]
  34. Liu, G.B.; Zhao, Y.Y.; Li, L.S.; Shu, P.C. Simulation and experiment research on wide ranging working process of scroll expander driven by compressed air. Appl. Therm. Eng. 2010, 30, 2073–2079. [Google Scholar]
  35. Lemort, V.; Quoilin, S.; Cuevas, C.; Lebrun, J. Testing and modeling a scroll expander integrated into an Organic Rankine Cycle. Appl. Therm. Eng. 2009, 29, 3094–3102. [Google Scholar] [CrossRef]
  36. Song, P.P.; Wei, M.S.; Shi, L.; Danish, S.N.; Ma, C.C. A review of scroll expanders for organic Rankine cycle systems. Appl. Therm. Eng. 2015, 75, 54–64. [Google Scholar] [CrossRef]
  37. Chu, X.; Zhang, C.; Li, K.; Jing, Y. Dynamic modeling and efficiency analysis of compressed air energy storage system equipped with scroll compressor. Trans. China Electrotech. Soc. 2011, 26, 126–132. [Google Scholar]
  38. Clemente, S.; Micheli, D.; Reini, M.; Taccani, R. Energy efficiency analysis of organic Rankine cycles with scroll expanders for cogenerative applications. Appl. Energy 2012, 97, 792–801. [Google Scholar] [CrossRef]
  39. Qiu, G.Q.; Liu, H.; Riffat, S. Expanders for micro-CHP systems with organic Rankine cycle. Appl. Therm. Eng. 2011, 31, 3301–3307. [Google Scholar] [CrossRef]
  40. Declaye, S.; Quoilin, S.; Guillaume, L.; Lemort, V. Experimental study on an open drive scroll expander integrated into an ORC (organic Rankine cycle) system with R245fa as working fluid. Energy 2013, 55, 173–183. [Google Scholar] [CrossRef]
  41. Kim, H.J.; Ahn, J.M.; Cho, S.O.; Cho, K.R. Numerical simulation on scroll expander–compressor unit for CO2 trans-critical cycles. Appl. Therm. Eng. 2008, 28, 1654–1661. [Google Scholar] [CrossRef]
  42. Kohsokabe, H.; Koyama, M.; Tojo, K.; Matsunaga, M.; Nakayama, S. Performance characteristics of scroll expander for CO2 refrigeration cycles. In Proceedings of the International Compressor Engineering Conference, West Lafayette, IN, USA, 14–17 July 2008; p. 1847. [Google Scholar]
  43. Clemente, S.; Micheli, D.; Reini, M.; Taccani, R. Bottoming organic Rankine cycle for a small scale gas turbine: A comparison of different solutions. Appl. Energy 2013, 106, 355–364. [Google Scholar] [CrossRef]
  44. Chen, Y.; Halm, N.P.; Groll, E.A.; Braun, J.E. Mathematical modeling of scroll Compressors-Part I: Compression process modeling. Int. J. Refrig. 2002, 25, 731–750. [Google Scholar] [CrossRef]
  45. Chen, Y.; Halm, N.P.; Braun, J.E.; Groll, E.A. Mathematical modeling of scroll Compressors-Part II: Overall scroll compressor modeling. Int. J. Refrig. 2002, 25, 751–764. [Google Scholar] [CrossRef]
  46. Wang, B.L.; Li, X.T.; Shi, W.X. A general geometrical model of scroll compressors based on discretional initial angles of involute. Int. J. Refrig. 2005, 28, 958–966. [Google Scholar] [CrossRef]
  47. Park, Y.C.; Kim, Y.C.; Cho, H.H. Thermodynamic analysis on the performance of a variable speed scroll compressor with refrigerant injection. Int. J. Refrig. 2002, 25, 1072–1082. [Google Scholar] [CrossRef]
  48. Li, X.M. Study on the Influence of Component Characteristics for Advanced Adiabatic Compressed Air Energy Storage System. Ph.D. Thesis, University of Chinese Academy of Sciences (Institute of Engineering Thermophysics), Beijing, China, 2015. [Google Scholar]
  49. Song, P.P.; Wei, M.S.; Liu, Z.; Zhao, B. Effects of suction port arrangements on a scroll expander for a small scale ORC system based on CFD approach. Appl. Energy 2015, 150, 274–285. [Google Scholar] [CrossRef]
  50. Li, J.; Peng, X.Y.; Yang, Z.; Hu, S.Z.; Duan, Y.Y. Design, improvements and applications of dual-pressure evaporation organic Rankine cycles: A review. Appl. Energy 2022, 311, 118609. [Google Scholar] [CrossRef]
  51. Yang, X.H. Performance Study of Scroll Compressor/Expander Composite Machine in Compressed Air Energy Storage. Ph.D. Thesis, East China University of Science and Technology, Shanghai, China, 2014. [Google Scholar]
  52. Wu, Z.; Yan, J.; Xie, F.B.; Zhu, T.; Gao, N.P. Research on the effect of suction port shape on a scroll expander pressure loss during the suction process. Compress. Technol. 2016, 1, 1–6. [Google Scholar]
  53. Ping, X.; Zhang, H.G.; Xing, C.D.; Pan, Y.C.; Zhang, W.J.; Wang, Y. Nonlinear modeling and multi-scale influence characteristics analysis of organic Rankine cycle (ORC) system considering variable driving cycle. Energy 2023, 265, 126311. [Google Scholar] [CrossRef]
  54. Xu, Y.H.; Wang, X.; Zhang, J.; Zhang, H.G.; Yang, F.B.; Yan, D.; Liang, J.; Yang, H.L.; Wang, Y. Experimental investigation and artificial neural network prediction of small-scale compressed air energy storage system based on pneumatic motor. Therm. Sci. Eng. Prog. 2024, 47, 102287. [Google Scholar] [CrossRef]
Figure 1. Test bench diagram of the compressed-air-powered vehicle.
Energies 17 00433 g001
Figure 2. Schematic diagram of the compressed-air-powered vehicle.
Energies 17 00433 g002
Figure 3. The impact of the volume flow rate on the intake pressure.
Energies 17 00433 g003
Figure 4. The impact of the volume flow rate on the expansion ratio.
Energies 17 00433 g004
Figure 5. The impact of the volume flow rate on the mass flow rate.
Energies 17 00433 g005
Figure 6. The impact of the volume flow rate on the torque.
Energies 17 00433 g006
Figure 7. The impact of the volume flow rate on the rotation speed.
Energies 17 00433 g007
Figure 8. The impact of the volume flow rate on the scroll expander output.
Energies 17 00433 g008
Figure 9. The impact of the volume flow rate on the CACR.
Energies 17 00433 g009
Figure 10. The impact of the volume flow rate on the temperature difference.
Energies 17 00433 g010
Figure 11. The impact of the volume flow rate on the isentropic efficiency.
Energies 17 00433 g011
Figure 12. The impact of the rotation speed on the intake pressure.
Energies 17 00433 g012
Figure 13. The impact of the rotation speed on the expansion ratio.
Energies 17 00433 g013
Figure 14. The impact of the rotation speed on the mass flow rate.
Energies 17 00433 g014
Figure 15. The impact of the rotating speed on the torque.
Energies 17 00433 g015
Figure 16. The impact of the rotation speed on the scroll expander output.
Energies 17 00433 g016
Figure 17. The impact of the rotation speed on the CACR.
Energies 17 00433 g017
Figure 18. The impact of the rotation speed on the temperature difference.
Energies 17 00433 g018
Figure 19. The impact of the rotation speed on the isentropic efficiency.
Energies 17 00433 g019
Figure 20. The impact of the torque on the intake pressure.
Energies 17 00433 g020
Figure 21. The impact of the torque on the expansion ratio.
Energies 17 00433 g021
Figure 22. The impact of the torque on the mass flow rate.
Energies 17 00433 g022
Figure 23. The impact of the torque on the scroll expander output.
Energies 17 00433 g023
Figure 24. The impact of the torque on the CACR.
Energies 17 00433 g024
Figure 25. The impact of the torque on the temperature difference.
Energies 17 00433 g025
Figure 26. The impact of the torque on the isentropic efficiency.
Energies 17 00433 g026
Figure 27. Error bar analysis of the main performance of the scroll expander. (a) Error bar analysis of power output of scroll expander; (b) Error bar analysis of expansion ratio; (c) Error bar analysis of rotating speed; (d) Error bar analysis of torque.
Energies 17 00433 g027aEnergies 17 00433 g027b
Figure 28. Performance of the CAES unit under various driving cycles. (a) Expander output under EUDC driving cycle; (b) Expander output under FTP75 driving cycle; (c) Expander output under UDDS driving cycle; (d) Expander output under WLTC driving cycle.
Energies 17 00433 g028aEnergies 17 00433 g028b
Figure 29. Investment cost of the scroll expander. (a) Investment cost under EUDC driving cycle; (b) Investment cost under FTP75 driving cycle; (c) Investment cost under UDDS driving cycle; (d) Investment cost under WLTC driving cycle.
Energies 17 00433 g029
Table 1. Parameters of the scroll expander and magnetic powder brake.
NameTypeParameter
Scroll expanderKWX-40-C1
Rated rotation speed2000 r/min
Rated power485 W
Rated torque7.0 N·m
Magnetic powder brakeFZ-50-D
Rated voltage24 V
Rated current2.0 A
Rated torque50.0 N·m
Table 2. Main parameters of the various sensors.
NameMeasure RangeTolerance
Pressure sensor0~15 bar±0.2% FS
Temperature sensor−20~100 °C±0.5% FS
Torque sensor0~20 N·m±0.5% FS
Rotation speed sensor0~6000 r/min±0.5% FS
Flowmeter0~5000 L/min±0.5% FS
Table 3. Constants for the economic model.
NameParameter
FS1.7
FMP3.5
K1,EXP2.2659
K2,EXP1.4398
K3,EXP−0.1776
CEPCI2023813.0
CEPCI2020596.2
Disclaimer/Publisher’s Note: The statements, opinions and data contained in all publications are solely those of the individual author(s) and contributor(s) and not of MDPI and/or the editor(s). MDPI and/or the editor(s) disclaim responsibility for any injury to people or property resulting from any ideas, methods, instructions or products referred to in the content.

