
Optimal Unit Commitment and Generation Scheduling of Integrated Power System with Plug-In Electric Vehicles and Renewable Energy Sources

Abstract
:1. Introduction
2. Problem Formulation
- System power balance constraint
- System spinning reserve constraint
- Maximum and minimum power generation limit
- Minimum up (MUT)/minimum down time (MDT)
- Up/down ramp constraint
- Vehicle balance constraint
3. Chaotic Zebra Optimization Algorithm
- Phase 1: Foraging Behavior
- Phase 2: Defense Strategies against Predators
| Algorithm 1. PSEUDO code of CZOA |
| Inputs: Search Agents, T, LB, UB, dimensions |
| Initialize X matrix with random values within bounds for each element |
| Initialize fit array with fitness values for each agent |
| Initialize and PZ |
| for t = 1 to Max_iterations: |
| Update and PZ based on fit values |
| for i = 1 to Search Agents |
| Choose a strategy I = round(1 + rand()) |
| if I == 1: |
| Calculate based on foraging behavior using Equation (12) |
| else: |
| Choose an attacking predator AZ based on certain conditions |
| Calculate based on defense behavior using Equation (13) |
| Apply bounds to or |
| Calculate fitness |
| if ≤ : |
| Update and using Equation (14) |
| Store the best-so-far solution and other performance metrics |
| Return Best Position, Best fitness and convergence curve |
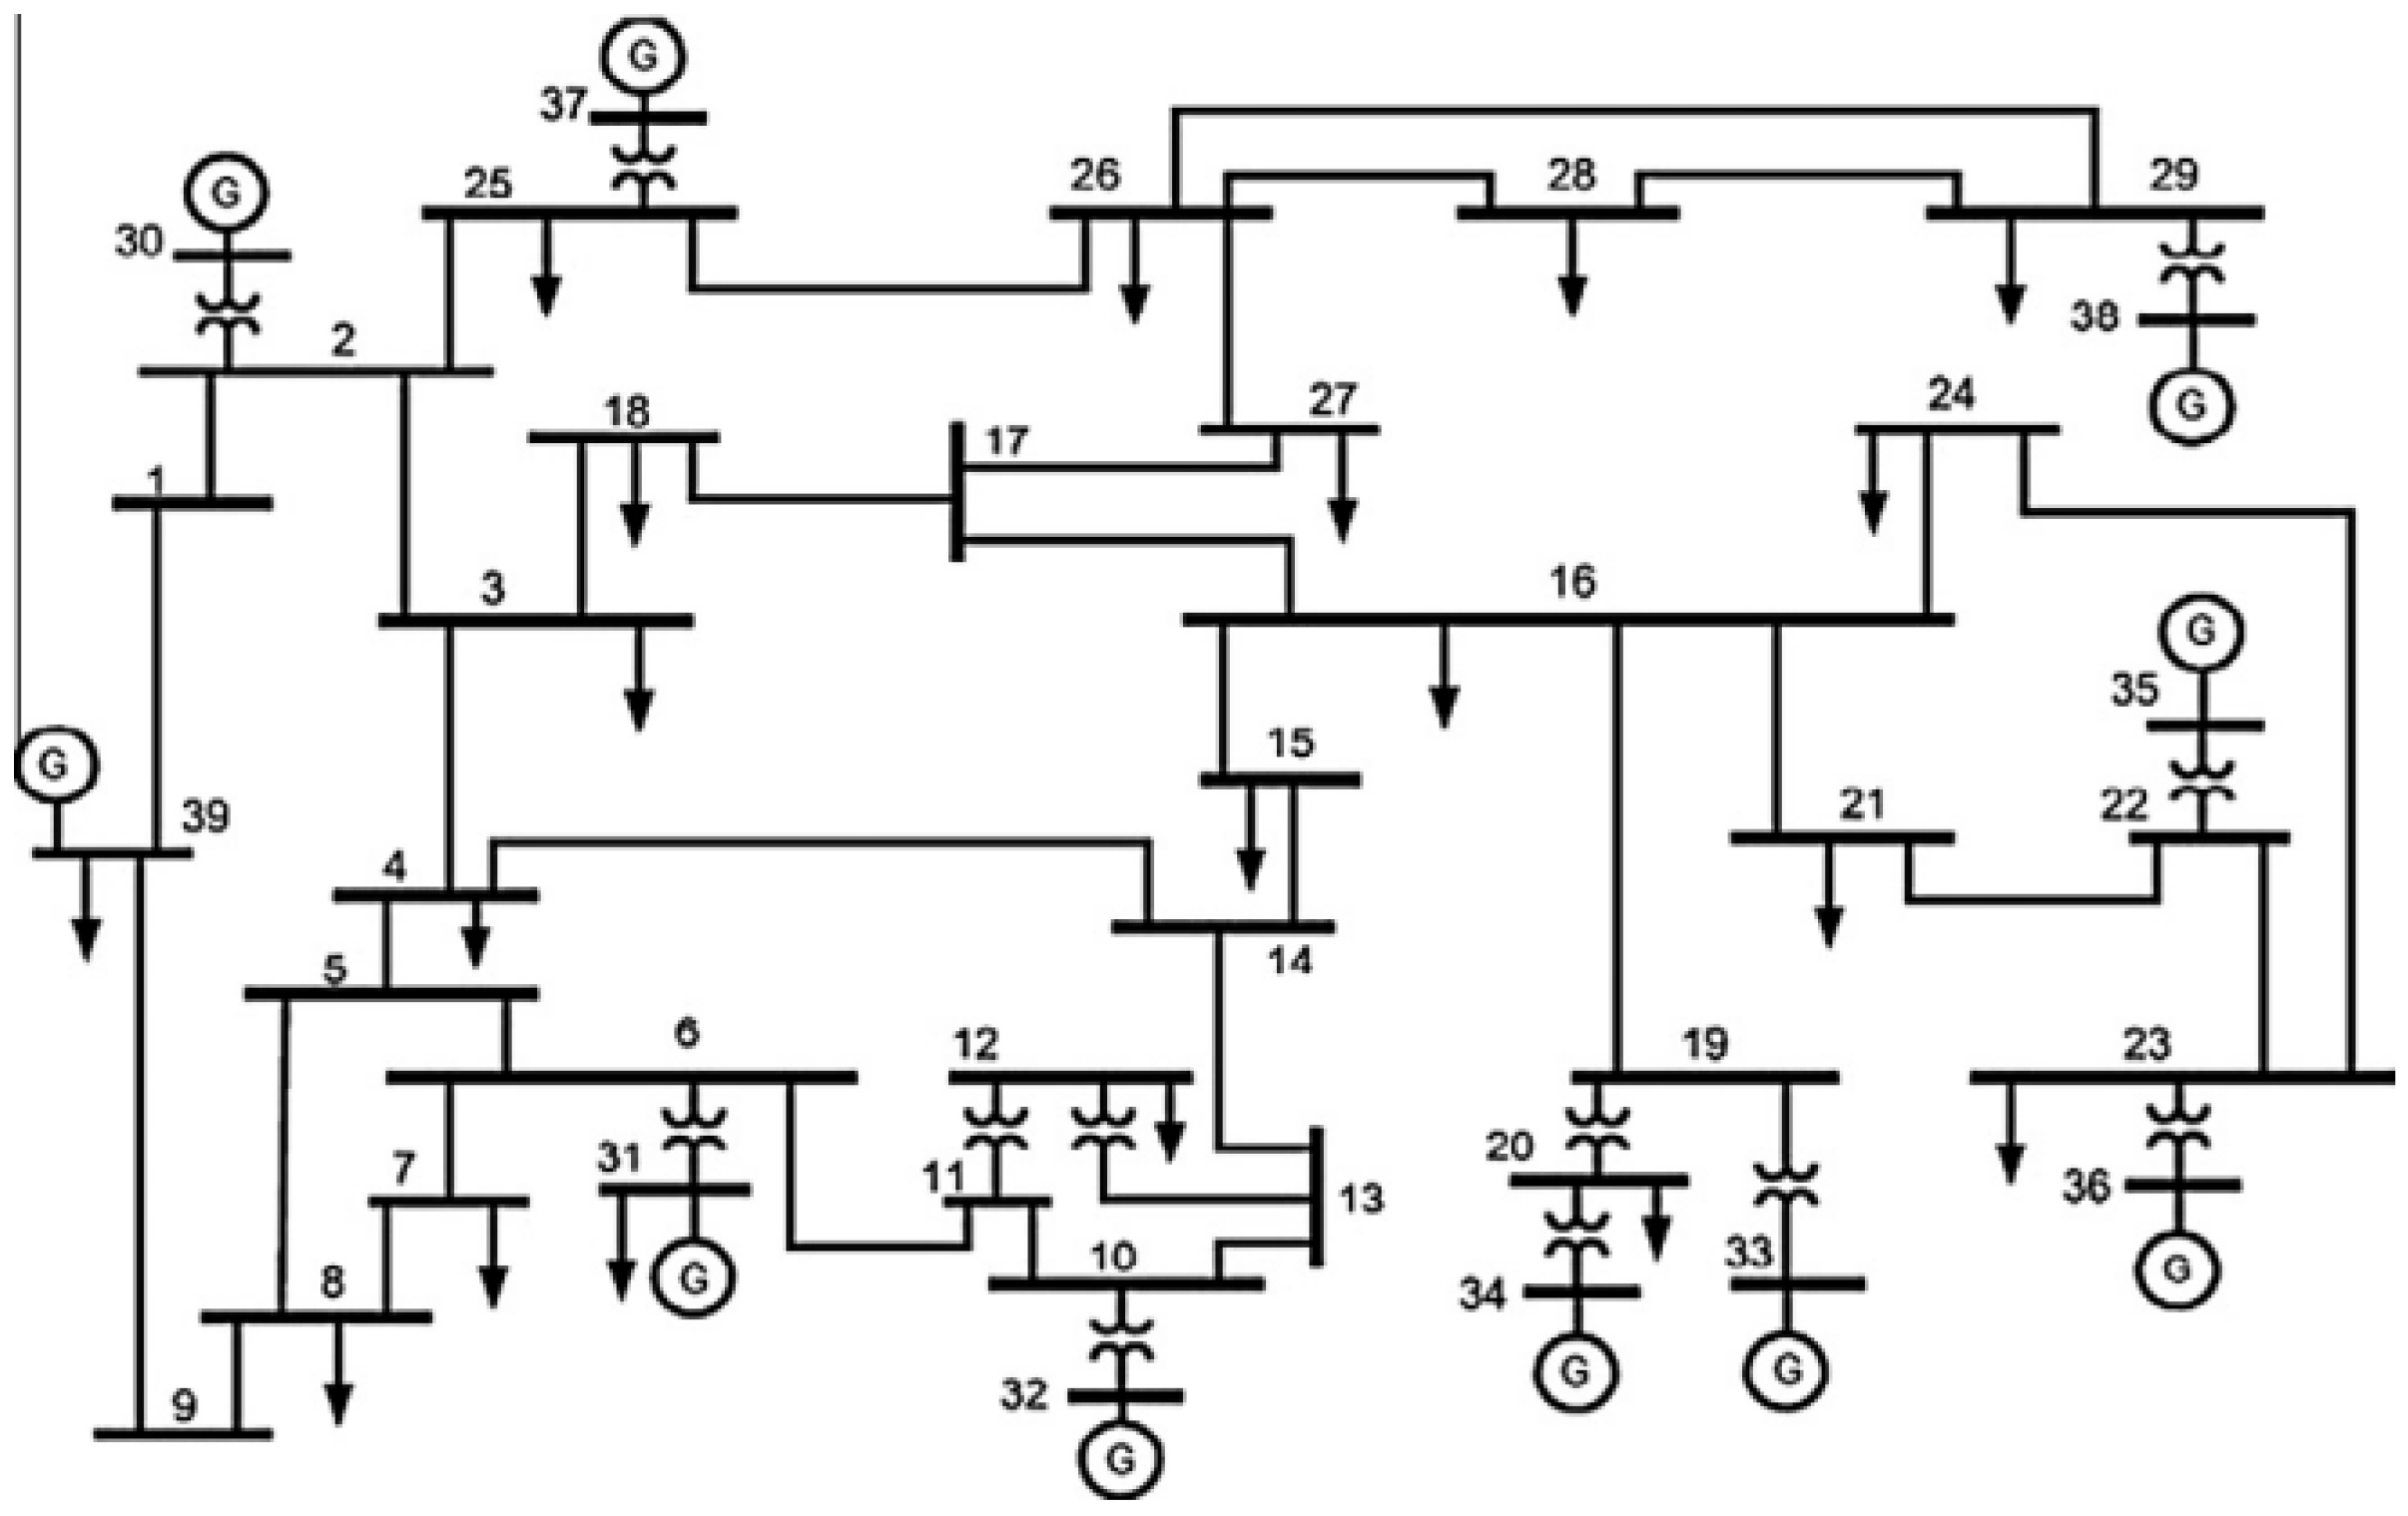
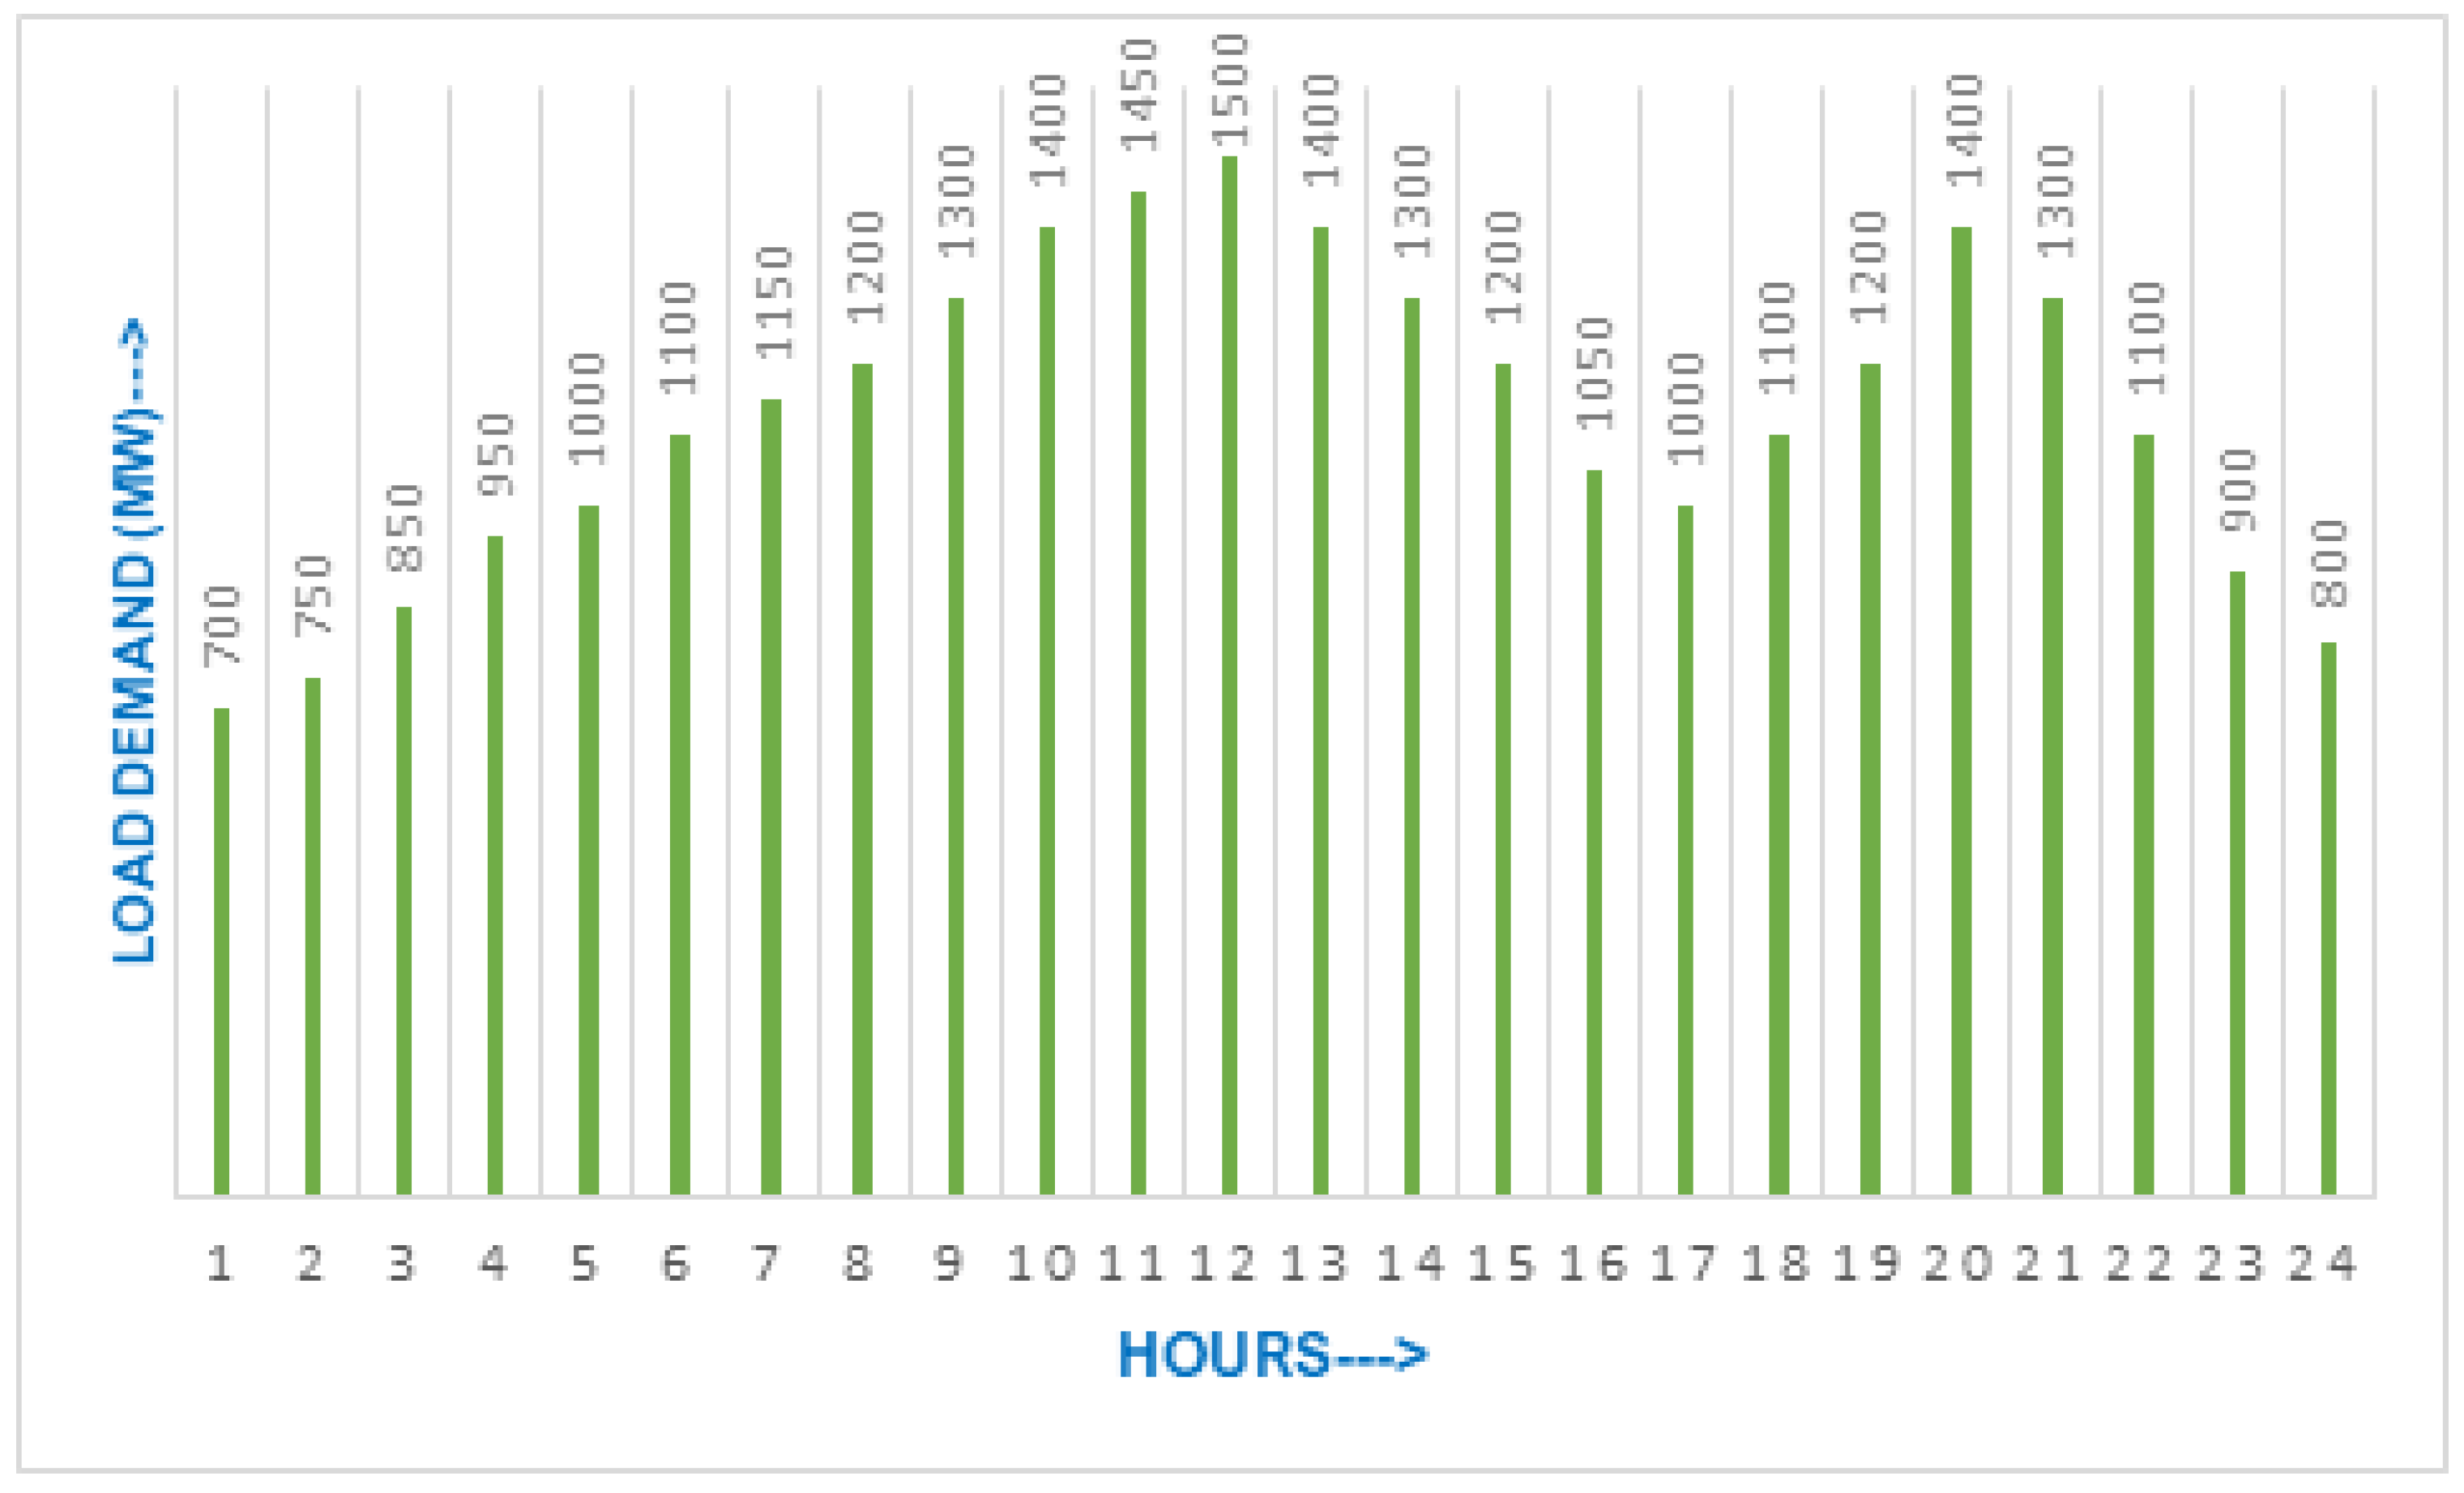
4. Test Systems
5. Results and Discussion
6. Conclusions and Future Scope
Author Contributions
Funding
Data Availability Statement
Acknowledgments
Conflicts of Interest
Nomenclature
| Z | zebra population |
| ith zebra | |
| j zebra | |
| N | No. of zebra population |
| m | No. of decision variables |
| New status of the ith. zebra based on first phase | |
| New status of the ith. zebra based on second phase | |
| I | I is the round (1 + rand), rand is [0, 1]. Thus, I ∈ {1, 2} |
| T and t | Maximum number of iterations and iteration counter |
| Best fitness value | |
| Pioneer zebra in jth dimension | |
| PZ | Pioneer zebra which is the best member |
| r | Random number in interval [0, 1] |
| Objective function value in first phase | |
| Objective function value in second phase | |
| AZ | attacked zebras |
| R and Ps | Constant number equal to 0.01 and randomly generated in [0, 1]. |
| New status of the ith. zebra based on first phase |
References
- Manousakis, N.M.; Karagiannopoulos, P.S.; Tsekouras, G.J.; Kanellos, F.D. Integration of Renewable Energy and Electric Vehicles in Power Systems: A Review. Processes 2023, 11, 1544. [Google Scholar] [CrossRef]
- Avvari, R.K.; DM, V.K. A new hybrid evolutionary algorithm for multi-objective optimal power flow in an integrated WE, PV, and PEV power system. Electr. Power Syst. Res. 2023, 214, 108870. [Google Scholar] [CrossRef]
- Kuloor, S.; Hope, G.S.; Malik, O.P. Environmentally constrained unit commitment. IEE Proc. C (Gener. Transm. Distrib.) 1992, 139, 122–128. [Google Scholar] [CrossRef]
- Montero, L.; Bello, A.; Reneses, J. A Review on the Unit Commitment Problem: Approaches, Techniques, and Resolution Methods. Energies 2022, 15, 1296. [Google Scholar] [CrossRef]
- Zhang, X.; Wang, M.; Wang, M.; Jing, L. A Unit Commitment Model Considering Peak Regulation of Units for Wind Power Integrated Power System. In Proceedings of the 2020 IEEE/IAS Industrial and Commercial Power System Asia, I CPS Asia 2020, Weihai, China, 13–15 July 2020; pp. 714–719. [Google Scholar] [CrossRef]
- Nandi, A.; Kamboj, V.K. A New Solution to Profit Based Unit Commitment Problem Considering PEVs/BEVs and Renewable Energy Sources. E3S Web Conf. 2020, 184, 01070. [Google Scholar] [CrossRef]
- Imani, M.H.; Yousefpour, K.; Ghadi, M.J.; Andani, M.T. Simultaneous presence of wind farm and V2G in security constrained unit commitment problem considering uncertainty of wind generation. In Proceedings of the 2018 IEEE Texas Power Energy Conference TPEC 2018, College Station, TX, USA, 8–9 February 2018; pp. 1–6. [Google Scholar] [CrossRef]
- Trojovska, E.; Dehghani, M.; Trojovsky, P. Zebra Optimization Algorithm: A New Bio-Inspired Optimization Algorithm for Solving Optimization Algorithm. IEEE Access 2022, 10, 49445–49473. [Google Scholar] [CrossRef]
- Venkatesan, T.; Sanavullah, M.Y. SFLA approach to solve PBUC problem with emission limitation. Int. J. Electr. Power Energy Syst. 2013, 46, 1–9. [Google Scholar] [CrossRef]
- Zhang, N.; Li, W.; Liu, R.; Lv, Q.; Sun, L. A three-stage birandom program for unit commitment with wind power uncertainty. Sci. World J. 2014, 2014, 583157. [Google Scholar] [CrossRef]
- Saniya, M.; Mohammadi, S. Optimal scheduled unit commitment considering suitable power of electric vehicle and photovoltaic uncertainty. J. Renew. Sustain. Energy 2018, 10, 043705. [Google Scholar]
- Braik, M.; Hammouri, A.; Atwan, J.; Al-Betar, M.A.; Awadallah, M.A. White Shark Optimizer: A novel bio-inspired meta-heuristic algorithm for global optimization problems. Knowl.-Based Syst. 2022, 243, 108457. [Google Scholar] [CrossRef]
- Faramarzi, A.; Heidarinejad, M.; Mirjalili, S.; Gandomi, A.H. Marine Predators Algorithm: A nature-inspired metaheuristic. Expert Syst. Appl. 2020, 152, 113377. [Google Scholar] [CrossRef]
- Mirjalili, S.; Lewis, A. The Whale Optimization Algorithm. Adv. Eng. Softw. 2016, 95, 51–67. [Google Scholar] [CrossRef]
- Mirjalili, S.; Mirjalili, S.M.; Lewis, A. Grey Wolf Optimizer. Adv. Eng. Softw. 2014, 69, 46–61. [Google Scholar] [CrossRef]
- Rashedi, E.; Nezamabadi-pour, H.; Saryazdi, S.G. A Gravitational Search Algorithm, Information Sciences. Inf. Sci. 2009, 179, 2232–2248. [Google Scholar] [CrossRef]
- Rao, R.V.; Savsani, V.J.; Vakharia, D.P. Teaching-learning-based optimization: A novel method for constrained mechanical design optimization problems. CAD Comput. Aided Des. 2011, 43, 303–315. [Google Scholar] [CrossRef]
- Goldberg, D.E.; Holland, J.H. Genetic Algorithms and Machine Learning. Mach. Learn. 1988, 19 (Suppl. 2), 95–99. [Google Scholar] [CrossRef]


| Sr. No. | Paper Title | Year | Main Finding |
|---|---|---|---|
| 1. | Integration of Renewable and Electric Vehicles in Power System: Review [1] | 2023 | This paper presents a comprehensive review of integrating Renewable Energy Sources (RESs) and Electric Vehicles (EVs) into power systems, emphasizing the sustainable approach to address environmental impacts. It highlights the implications of widespread EV adoption for power system management and categorizes the reviewed literature based on primary objectives, such as emissions reduction and EV charging infrastructure [1]. |
| 2. | A New hybrid optimization algorithm for multi-objective optimal power flow in an integrated WE, PV. and PEV power system [2] | 2023 | This study proposes a novel hybrid multi-objective evolutionary algorithm (MOEA) for the optimal power flow (OPF) problem in transmission networks. It integrates wind energy (WE), photovoltaic (PV), and plug-in electric vehicle (PEV) systems’ uncertainty, using adaptive penalty computation and selection features using the invasive weed optimization (IWO) method. The suggested method is evaluated on IEEE 57 and IEEE 118-bus systems, demonstrating its viability and superiority through a one-way ANOVA test [2]. |
| 3. | Optimal Sizing of Hybrid Renewable Energy System for Electricity Production for Remote Areas [3] | 2022 | This study explores the adoption of alternative energy resources, specifically hybrid renewable energy systems, to meet the electrical load demand of a remote site in India. Two intelligent approaches, Improved Harmony Search (IHS) and Particle Swarm Optimization (PSO), are used to optimize the system and minimize the Net Present Cost (NPC) [3]. |
| 4. | A Review on the unit Commitment Problem-Approaches, Techniques and Resolution Methods [4] | 2022 | This paper presents a review of the unit commitment problem, focusing on techniques for optimizing thermal generators’ schedules in power systems. It addresses the significance of the unit commitment problem in handling emerging energy market trends, such as renewable energy integration and non-conventional energy storage [4]. |
| 6. | A unit commitment Model Considering Peak Regulation of Units for Wind Power Integrated Power System [5] | 2020 | This paper introduces a new unit commitment model to tackle the challenges of peak regulation in power systems with high wind power penetration. The model incorporates regular peak regulation, deep peak regulation, and deep peak regulation with oil operation stages of units. It effectively addresses net load fluctuations by scheduling peak power regulation capacity and peak ramp regulation capability to meet power capacity and ramp capability demands [5]. |
| 7. | A New solution to Profit Based Unit Commitment Problem Considering PEVs/BEVs and Renewable Energy Sources [6] | 2020 | This paper focuses on the unit commitment problem in the power sector, considering dynamic load demand and the inclusion of electric vehicles. The proposed mathematical formulation uses Intensify Harris Hawks Optimizer (IHHO) to find the most economical patterns of generating stations, meeting varying load demand with minimum production cost and higher reliability. The study also emphasizes the importance of renewable energy sources to generate low-cost power with reduced environmental impact, considering the effects of increasing industrialization on the environment [6]. |
| Unit Parameter | U1 | U2 | U3 | U4 | U5 | U6 | U7 | U8 | U9 | U10 |
|---|---|---|---|---|---|---|---|---|---|---|
| (MW) | 455 | 455 | 130 | 130 | 162 | 80 | 85 | 55 | 55 | 55 |
| (MW) | 150 | 150 | 20 | 20 | 25 | 20 | 25 | 10 | 10 | 10 |
| ($/hour) | 1000 | 970 | 700 | 680 | 450 | 370 | 480 | 660 | 665 | 670 |
| ($/MWh) | 16.19 | 17.26 | 16.60 | 16.50 | 19.70 | 22.26 | 27.74 | 25.92 | 27.27 | 27.79 |
| ($/MWh2) | 0.00048 | 0.00031 | 0.002 | 0.00211 | 0.00398 | 0.00712 | 0.00079 | 0.00413 | 0.00222 | 0.00173 |
| (h) | 8 | 8 | 5 | 5 | 6 | 3 | 3 | 1 | 1 | 1 |
| (h) | 8 | 8 | 5 | 5 | 6 | 3 | 3 | 1 | 1 | 1 |
| ($) | 4500 | 5000 | 550 | 560 | 900 | 170 | 260 | 30 | 30 | 30 |
| ($) | 9000 | 10,000 | 1100 | 1120 | 1800 | 340 | 520 | 60 | 60 | 60 |
| (h) | 5 | 5 | 4 | 4 | 4 | 2 | 2 | 0 | 0 | 0 |
| 8 | 8 | −5 | −5 | −6 | −3 | −3 | −1 | −1 | −1 |
| Functions | Index | CZOA | WSO [9] | MPA [10] | WOA [11] | GWO [12] | GSA [13] | TLBO [14] | GA [15] |
|---|---|---|---|---|---|---|---|---|---|
| F1 | Mean | 3.2 × 10−258 | 65.84207 | 1.92 × 10−49 | 1.40 × 10−151 | 1.77 × 10−59 | 1.33 × 10⁻¹⁶ | 2.52 × 10−74 | 30.4715 |
| Best | 2.3 × 10−261 | 5.289861 | 3.80 × 10−52 | 9.30 × 10−171 | 1.49 × 10−61 | 5.35 × 10⁻¹⁷ | 5.86 × 10−77 | 17.90903 | |
| Worst | 9.5 × 10−258 | 238.6714 | 1.66 × 10−48 | 2.70 × 10−150 | 7.71 × 10−59 | 3.73 × 10⁻¹⁶ | 2.59 × 10−73 | 56.87106 | |
| Std | 0 | 58.09538 | 4.33 × 10−49 | 6.60 × 10−151 | 2.35 × 10−59 | 7.88 × 10⁻¹⁷ | 6.78 × 10−74 | 11.51854 | |
| Median | 5.7 × 10−260 | 45.37455 | 4.16 × 10−50 | 2.20 × 10−159 | 1.07 × 10−59 | 1.13 × 10⁻¹⁶ | 1.69 × 10−75 | 28.17077 | |
| F2 | Mean | 5.3 × 10−134 | 2.1377 | 6.96 × 10⁻²⁸ | 2.50 × 10−105 | 1.35 × 10⁻³⁴ | 5.48 × 10−08 | 6.76 × 10−39 | 2.785606 |
| Best | 4.1 × 10−137 | 0.661815 | 1.84 × 10⁻²⁹ | 7.90 × 10−118 | 4.87 × 10−36 | 3.48 × 10−08 | 8.81 × 10−40 | 1.743611 | |
| Worst | 1.6 × 10−133 | 7.438052 | 4.70 × 10⁻²⁷ | 2.70 × 10−104 | 7.90 × 10⁻³⁴ | 1.23 × 10−07 | 2.44 × 10−38 | 3.80275 | |
| Std | 9.1 × 10−134 | 1.953299 | 1.20 × 10⁻²⁷ | 7.60 × 10−105 | 2.16 × 10⁻³⁴ | 2.06 × 10−08 | 6.14 × 10−39 | 0.599756 | |
| Median | 5 × 10−136 | 1.528931 | 3.51 × 10⁻²⁸ | 3.40 × 10−108 | 6.50 × 10⁻³⁵ | 5.12 × 10−08 | 4.97 × 10−39 | 2.738814 | |
| F3 | Mean | 1.1 × 10−159 | 1784.524 | 2.51 × 10⁻¹² | 19,939.26 | 2.17 × 10⁻¹⁴ | 475.0243 | 3.84 × 10⁻²⁴ | 2166.814 |
| Best | 2.4 × 10−167 | 1039.407 | 6.18 × 10⁻¹⁹ | 2062.816 | 2.35 × 10⁻¹⁹ | 245.7179 | 2.20 × 10⁻²⁹ | 1422.763 | |
| Worst | 3.3 × 10−159 | 3539.57 | 1.43 × 10⁻¹¹ | 34,653.75 | 4.04 × 10⁻¹³ | 1185.13 | 3.60 × 10⁻²³ | 3455.476 | |
| Std | 1.9 × 10−159 | 691.1359 | 4.83 × 10⁻¹² | 9420.548 | 9.93 × 10⁻¹⁴ | 242.5098 | 1.19 × 10⁻²³ | 704.235 | |
| Median | 1.2 × 10−163 | 1556.732 | 1.83 × 10⁻¹³ | 20,303.94 | 4.66 × 10⁻¹⁶ | 399.9344 | 4.04 × 10⁻²⁶ | 2098.599 | |
| F4 | Mean | 1.9 × 10−115 | 17.2787 | 2.98 × 10⁻¹⁹ | 51.76951 | 1.23 × 10⁻¹⁴ | 1.234645 | 1.83 × 10⁻³⁰ | 2.826566 |
| Best | 5.2 × 10−118 | 11.90291 | 3.01 × 10⁻²⁰ | 0.903667 | 6.55 × 10⁻¹⁶ | 9.89 × 10−09 | 5.81 × 10⁻³² | 2.214252 | |
| Worst | 4 × 10−115 | 23.8119 | 9.60 × 10⁻¹⁹ | 91.61802 | 5.73 × 10⁻¹⁴ | 4.922767 | 8.11 × 10⁻³⁰ | 3.988745 | |
| Std | 2 × 10−115 | 3.178756 | 2.52 × 10⁻¹⁹ | 32.60275 | 1.61 × 10⁻¹⁴ | 1.527107 | 2.64 × 10⁻³⁰ | 0.514049 | |
| Median | 1.7 × 10−115 | 17.75492 | 2.58 × 10⁻¹⁹ | 55.36903 | 6.34 × 10⁻¹⁵ | 0.906041 | 6.52 × 10⁻³¹ | 2.780694 | |
| F5 | Mean | 28.68011 | 10,788.60 | 23.30066 | 27.28239 | 26.55501 | 44.00585 | 26.76115 | 594.79 |
| Best | 28.59876 | 1345.963 | 22.78581 | 26.69534 | 25.54099 | 25.85872 | 25.5631 | 228.5792 | |
| Worst | 28.79517 | 92,623.17 | 24.02522 | 28.70663 | 27.12889 | 167.0769 | 28.72392 | 2254.801 | |
| Std | 0.10245 | 22,093.25 | 0.427845 | 0.636008 | 0.579436 | 48.79555 | 1.030818 | 467.867 | |
| Median | 28.64641 | 5604.085 | 23.27164 | 27.05974 | 26.20545 | 26.32007 | 26.30152 | 475.0975 | |
| F6 | Mean | 2.067735 | 100.8059 | 1.80 × 10−09 | 0.081492 | 0.660188 | 1.05 × 10⁻¹⁶ | 1.260143 | 34.11331 |
| Best | 1.99537 | 16.93604 | 8.07 × 10⁻¹⁰ | 0.01051 | 0.246482 | 5.52 × 10⁻¹⁷ | 0.232888 | 15.59683 | |
| Worst | 2.20709 | 382.1118 | 4.80 × 10−09 | 0.326421 | 1.251026 | 1.81 × 10⁻¹⁶ | 2.162628 | 62.70425 | |
| Std | 0.120715 | 105.1108 | 1.03 × 10−09 | 0.111874 | 0.337545 | 4.08 × 10⁻¹⁷ | 0.547394 | 14.91716 | |
| Median | 2.000745 | 69.50695 | 1.60 × 10−09 | 0.031576 | 0.726589 | 9.47 × 10⁻¹⁷ | 1.216208 | 31.6505 | |
| F7 | Mean | 0.000102 | 9.00 × 10−05 | 0.000546 | 0.001277 | 0.00083 | 0.052756 | 0.001528 | 0.010578 |
| Best | 4.1 × 10−05 | 1.06 × 10−05 | 0.000111 | 2.02 × 10−05 | 0.000182 | 0.01411 | 9.00 × 10−05 | 0.003029 | |
| Worst | 0.00016 | 0.000339 | 0.000898 | 0.005394 | 0.001955 | 0.095479 | 0.002944 | 0.021917 | |
| Std | 5.97 × 10−05 | 9.85 × 10−05 | 0.000236 | 0.001591 | 0.000514 | 0.027476 | 0.000968 | 0.005305 | |
| Median | 0.000104 | 6.37 × 10−05 | 0.000533 | 0.000817 | 0.000844 | 0.05178 | 0.001505 | 0.010168 |
| Test Cases | Best | Average | Worst | STD | Median | Wilcoxon Rank Sum Test (p-Value) | t-Test (p-Value) | Best Time (in s) | Avg. Time (in s) | Worst Time (in s) |
|---|---|---|---|---|---|---|---|---|---|---|
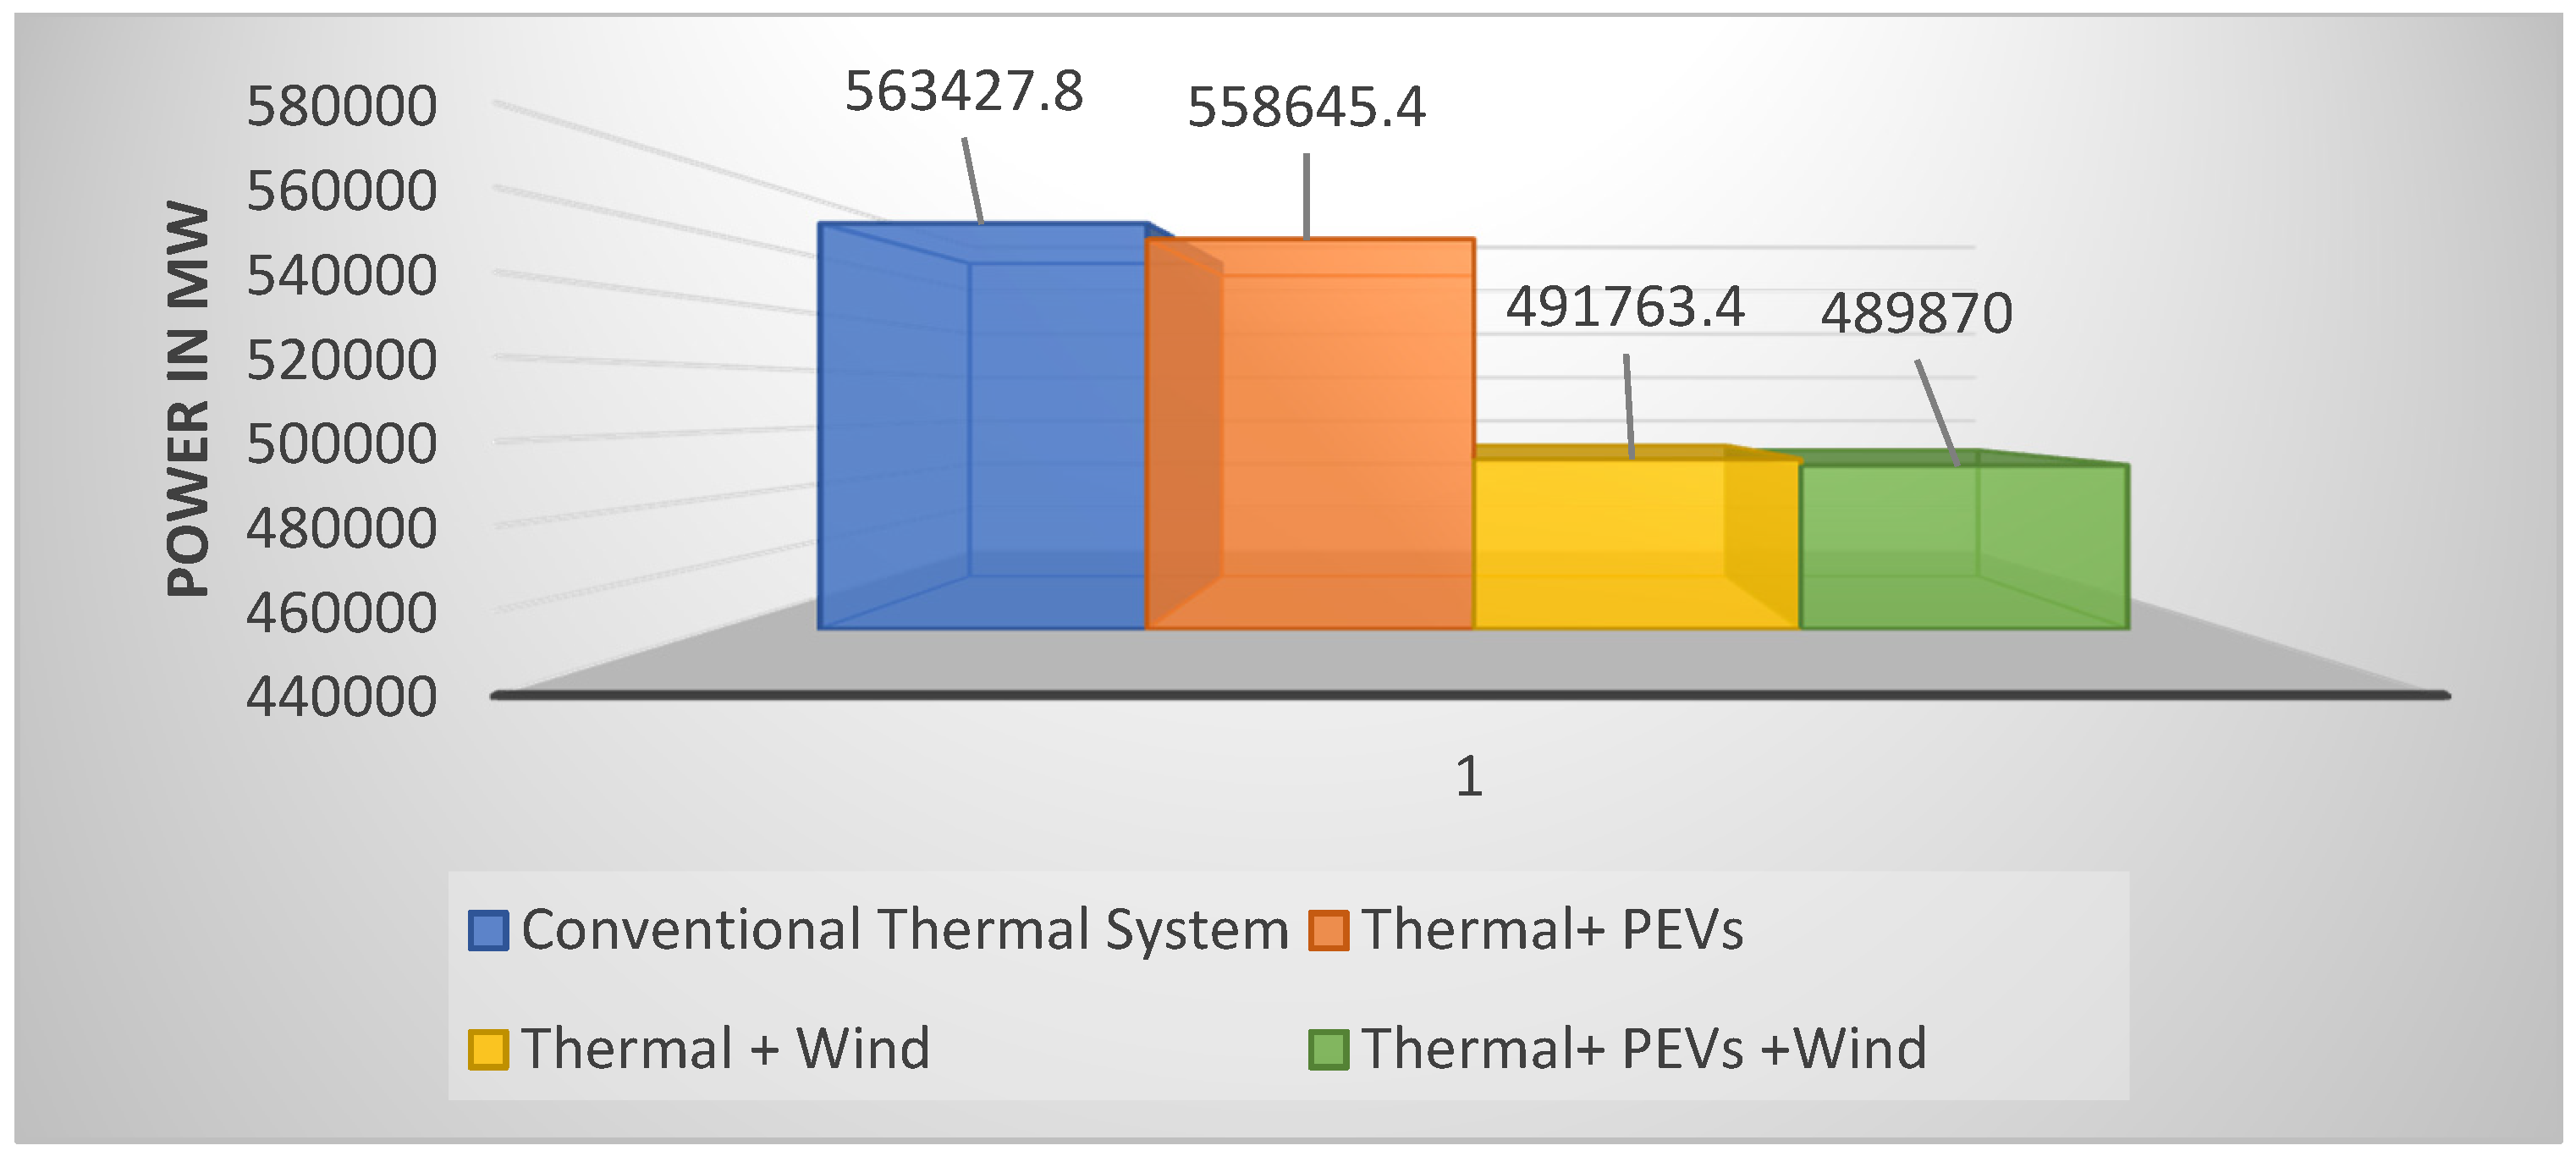
| Thermal System | 563,427.8 | 564,297 | 565,017.7 | 387.2645 | 564,327 | 1.73 × 10⁻⁶ | 1.63 × 10−93 | 0.0132 | 0.02083 | 0.0313 |
| Thermal + PEVs + Wind | 489,870 | 490,994.5 | 492,368.4 | 624.9831 | 491,057 | 1.73 × 10⁻⁶ | 9.83 × 10−86 | 0.0156 | 0.01875 | 0.0313 |
| Test Cases | Best | Average | Worst | STD | Median | Wilcoxon Rank Sum Test (p-Value) | t-Test (p-Value) | Best Time (in s) | Avg. Time (in s) | Worst Time (in s) |
|---|---|---|---|---|---|---|---|---|---|---|
| Thermal System | 1,123,401 | 1,125,228 | 1,126,808 | 1014.409 | 1,125,441 | 1.73 × 10⁻⁶ | 4.44 × 10−90 | 0.013 | 0.021875 | 0.03125 |
| Thermal + Wind + PEVs | 1,050,274 | 1,053,285 | 1,055,320 | 1275.875 | 1,053,348 | 1.7344 × 10⁻⁶ | 2.334 × 10−86 | 0.014 | 0.020833 | 0.046875 |
| Test Cases | Best | Average | Worst | STD | Median | Wilcoxon Rank Sum Test (p-Value) | t-Test (p-Value) | Best Time (in s) | Avg. Time (in s) | Worst Time (in s) |
|---|---|---|---|---|---|---|---|---|---|---|
| Thermal System | 2,246,014 | 2,250,002 | 2,252,619 | 1578.101 | 2,250,432 | 1.73 × 10⁻⁶ | 3.06 × 10−93 | 0.015625 | 0.043229 | 0.09375 |
| Thermal + Wind + PEVs | 2,166,287 | 2,169,067 | 2,171,629 | 1345.898 | 2,169,687 | 1.29 × 10⁻⁶ | 8.77 × 10−95 | 0.015625 | 0.039583 | 0.09375 |
| Hours | PG1 | PG2 | PG3 | PG4 | PG5 | PG6 | PG7 | PG8 | PG9 | PG10 |
|---|---|---|---|---|---|---|---|---|---|---|
| H1 | 1 | 1 | 0 | 0 | 0 | 0 | 0 | 0 | 0 | 0 |
| H2 | 1 | 1 | 0 | 0 | 0 | 0 | 0 | 0 | 0 | 0 |
| H3 | 1 | 1 | 0 | 0 | 0 | 0 | 0 | 0 | 0 | 0 |
| H4 | 1 | 1 | 0 | 0 | 1 | 0 | 0 | 0 | 0 | 0 |
| H5 | 1 | 1 | 0 | 0 | 1 | 0 | 0 | 0 | 0 | 0 |
| H6 | 1 | 1 | 0 | 1 | 1 | 0 | 0 | 0 | 0 | 0 |
| H7 | 1 | 1 | 0 | 1 | 1 | 0 | 0 | 0 | 0 | 0 |
| H8 | 1 | 1 | 0 | 1 | 1 | 1 | 0 | 0 | 0 | 0 |
| H9 | 1 | 1 | 0 | 1 | 1 | 1 | 0 | 0 | 0 | 0 |
| H10 | 1 | 1 | 1 | 1 | 1 | 1 | 0 | 0 | 0 | 0 |
| H11 | 1 | 1 | 1 | 1 | 1 | 1 | 1 | 0 | 0 | 0 |
| H12 | 1 | 1 | 1 | 1 | 1 | 1 | 1 | 0 | 0 | 0 |
| H13 | 1 | 1 | 1 | 1 | 1 | 0 | 1 | 0 | 0 | 0 |
| H14 | 1 | 1 | 1 | 1 | 1 | 0 | 0 | 0 | 0 | 0 |
| H15 | 1 | 1 | 1 | 1 | 1 | 0 | 0 | 0 | 0 | 0 |
| H16 | 1 | 1 | 1 | 1 | 1 | 0 | 0 | 0 | 0 | 0 |
| H17 | 1 | 1 | 1 | 1 | 1 | 0 | 0 | 0 | 0 | 0 |
| H18 | 1 | 1 | 1 | 1 | 1 | 0 | 0 | 0 | 0 | 0 |
| H19 | 1 | 1 | 1 | 1 | 1 | 0 | 0 | 0 | 0 | 0 |
| H20 | 1 | 1 | 1 | 1 | 1 | 0 | 0 | 1 | 0 | 0 |
| H21 | 1 | 1 | 1 | 1 | 1 | 0 | 0 | 0 | 0 | 0 |
| H22 | 1 | 1 | 0 | 0 | 1 | 0 | 0 | 0 | 0 | 0 |
| H23 | 1 | 1 | 0 | 0 | 0 | 0 | 0 | 0 | 0 | 0 |
| H24 | 1 | 1 | 0 | 0 | 0 | 0 | 0 | 0 | 0 | 0 |
| Hours | PG1 | PG2 | PG3 | PG4 | PG5 | PG6 | PG7 | PG8 | PG9 | PG10 | Power Gen | SUC | Fuel Cost ($) |
|---|---|---|---|---|---|---|---|---|---|---|---|---|---|
| H1 | 405.4 | 150 | 0 | 0 | 0 | 0 | 0 | 0 | 0 | 0 | 555.4 | 810 | 11,208.2886 |
| H2 | 450.5 | 150 | 0 | 0 | 0 | 0 | 0 | 0 | 0 | 0 | 600.5 | 0 | 11,956.98612 |
| H3 | 455 | 258.24 | 0 | 0 | 0 | 0 | 0 | 0 | 0 | 0 | 713.24 | 560 | 13,913.71765 |
| H4 | 455 | 367.35 | 0 | 0 | 25 | 0 | 0 | 0 | 0 | 0 | 847.35 | 0 | 16,763.10377 |
| H5 | 455 | 400.99 | 0 | 0 | 25 | 0 | 0 | 0 | 0 | 0 | 880.99 | 1300 | 17,351.74272 |
| H6 | 455 | 392.24 | 0 | 130 | 25 | 0 | 0 | 0 | 0 | 0 | 1002.24 | 0 | 20,059.22509 |
| H7 | 455 | 433.54 | 0 | 130 | 25 | 0 | 0 | 0 | 0 | 0 | 1043.54 | 0 | 20,782.63555 |
| H8 | 455 | 455 | 0 | 130 | 34.67 | 20 | 0 | 0 | 0 | 0 | 1094.67 | 0 | 22,169.78975 |
| H9 | 455 | 455 | 0 | 130 | 77.24 | 20 | 0 | 0 | 0 | 0 | 1137.24 | 0 | 23,027.3795 |
| H10 | 455 | 455 | 130 | 130 | 48.52 | 20 | 0 | 0 | 0 | 0 | 1238.52 | 60 | 25,339.02043 |
| H11 | 455 | 455 | 130 | 130 | 84.77 | 20 | 25 | 0 | 0 | 0 | 1299.77 | 690 | 27,246.36959 |
| H12 | 455 | 455 | 130 | 130 | 121.27 | 20 | 25 | 0 | 0 | 0 | 1336.27 | 0 | 27,995.35102 |
| H13 | 455 | 455 | 130 | 130 | 44.27 | 0 | 25 | 0 | 0 | 0 | 1239.27 | 60 | 25,609.67163 |
| H14 | 455 | 448.53 | 130 | 130 | 25 | 0 | 0 | 0 | 0 | 0 | 1188.53 | 0 | 23,937.26184 |
| H15 | 455 | 382.02 | 130 | 130 | 25 | 0 | 0 | 0 | 0 | 0 | 1122.02 | 0 | 22,772.17488 |
| H16 | 455 | 205.81 | 130 | 130 | 25 | 0 | 0 | 0 | 0 | 0 | 945.81 | 0 | 19,698.68 |
| H17 | 455 | 191.8 | 130 | 130 | 25 | 0 | 0 | 0 | 0 | 0 | 931.8 | 0 | 19,455.14054 |
| H18 | 455 | 310.06 | 130 | 130 | 25 | 0 | 0 | 0 | 0 | 0 | 1050.06 | 230 | 21,514.70663 |
| H19 | 455 | 401.61 | 130 | 130 | 25 | 0 | 0 | 0 | 0 | 0 | 1141.61 | 0 | 23,115.05718 |
| H20 | 455 | 455 | 130 | 130 | 53.04 | 0 | 0 | 10 | 0 | 0 | 1233.04 | 0 | 25,531.45645 |
| H21 | 455 | 416.42 | 130 | 130 | 25 | 0 | 0 | 0 | 0 | 0 | 1156.42 | 0 | 23,374.43344 |
| H22 | 455 | 435.56 | 0 | 0 | 25 | 0 | 0 | 0 | 0 | 0 | 915.56 | 0 | 17,957.38598 |
| H23 | 455 | 249.08 | 0 | 0 | 0 | 0 | 0 | 0 | 0 | 0 | 704.08 | 0 | 13,754.17546 |
| H24 | 430.59 | 150 | 0 | 0 | 0 | 0 | 0 | 0 | 0 | 0 | 580.59 | 0 | 11,626.22282 |
| Total Fuel Cost | 489,869.9767 | ||||||||||||
| Hours | PG1 | PG2 | PG3 | PG4 | PG5 | PG6 | PG7 | PG8 | PG9 | PG10 | PG11 | PG12 |
|---|---|---|---|---|---|---|---|---|---|---|---|---|
| H1 | 455 | 157 | 0 | 0 | 0 | 0 | 0 | 0 | 0 | 0 | 455 | 156.5 |
| H2 | 455 | 210 | 0 | 0 | 0 | 0 | 0 | 0 | 0 | 0 | 455 | 209.5 |
| H3 | 455 | 316 | 0 | 0 | 0 | 0 | 0 | 0 | 0 | 0 | 455 | 316 |
| H4 | 455 | 358 | 0 | 0 | 0 | 0 | 0 | 0 | 0 | 0 | 455 | 357.5 |
| H5 | 455 | 396 | 0 | 0 | 0 | 0 | 0 | 0 | 0 | 0 | 455 | 396.5 |
| H6 | 455 | 369 | 0 | 130 | 0 | 0 | 0 | 0 | 0 | 0 | 455 | 369 |
| H7 | 455 | 363 | 130 | 130 | 0 | 0 | 0 | 0 | 0 | 0 | 455 | 362.5 |
| H8 | 455 | 406 | 130 | 130 | 25 | 0 | 0 | 0 | 0 | 0 | 455 | 405.5 |
| H9 | 455 | 455 | 130 | 130 | 62 | 20 | 0 | 0 | 0 | 0 | 455 | 455 |
| H10 | 455 | 455 | 130 | 130 | 127 | 20 | 25 | 0 | 0 | 0 | 455 | 455 |
| H11 | 455 | 455 | 130 | 130 | 162 | 24.5 | 25 | 10 | 0 | 0 | 455 | 455 |
| H12 | 455 | 455 | 130 | 130 | 162 | 65.5 | 25 | 10 | 10 | 0 | 455 | 455 |
| H13 | 455 | 455 | 130 | 130 | 128 | 20 | 25 | 0 | 0 | 0 | 455 | 455 |
| H14 | 455 | 455 | 130 | 130 | 65.5 | 20 | 0 | 0 | 0 | 0 | 455 | 455 |
| H15 | 455 | 455 | 130 | 130 | 41.5 | 0 | 0 | 0 | 0 | 0 | 455 | 455 |
| H16 | 455 | 320 | 130 | 130 | 25 | 0 | 0 | 0 | 0 | 0 | 455 | 319.5 |
| H17 | 455 | 274 | 130 | 130 | 25 | 0 | 0 | 0 | 0 | 0 | 455 | 273.5 |
| H18 | 455 | 370 | 130 | 130 | 25 | 20 | 0 | 0 | 0 | 0 | 455 | 369.8 |
| H19 | 455 | 453 | 130 | 130 | 25 | 20 | 25 | 0 | 0 | 0 | 455 | 452.7 |
| H20 | 455 | 455 | 130 | 130 | 132.5 | 20 | 25 | 10 | 0 | 0 | 455 | 455 |
| H21 | 455 | 455 | 130 | 130 | 44 | 0 | 25 | 0 | 0 | 0 | 455 | 455 |
| H22 | 455 | 372 | 0 | 130 | 0 | 0 | 0 | 0 | 0 | 0 | 455 | 371.5 |
| H23 | 455 | 300 | 0 | 0 | 0 | 0 | 0 | 0 | 0 | 0 | 455 | 300 |
| H24 | 455 | 365 | 0 | 0 | 0 | 20 | 0 | 0 | 0 | 0 | 455 | 0 |
| Hours | PG13 | PG14 | PG15 | PG16 | PG17 | PG18 | PG19 | PG20 | Power Generated | SUC | FC ($) |
|---|---|---|---|---|---|---|---|---|---|---|---|
| H1 | 0 | 0 | 0 | 0 | 0 | 0 | 0 | 0 | 1223 | 0 | 24,289.21 |
| H2 | 0 | 0 | 0 | 0 | 0 | 0 | 0 | 0 | 1329 | 430 | 26,130.8 |
| H3 | 0 | 0 | 0 | 0 | 0 | 0 | 0 | 0 | 1542 | 1460 | 29,841.87 |
| H4 | 0 | 130 | 0 | 0 | 0 | 0 | 0 | 0 | 1755 | 560 | 34,152.44 |
| H5 | 0 | 130 | 25 | 0 | 0 | 0 | 0 | 0 | 1858 | 1450 | 36,461.94 |
| H6 | 130 | 130 | 25 | 0 | 0 | 0 | 0 | 0 | 2063 | 0 | 41,252.05 |
| H7 | 130 | 130 | 25 | 0 | 0 | 0 | 0 | 0 | 2180 | 0 | 43,916.52 |
| H8 | 130 | 130 | 25 | 0 | 0 | 0 | 0 | 0 | 2291 | 1100 | 46,366.34 |
| H9 | 130 | 130 | 62 | 0 | 0 | 0 | 0 | 0 | 2484 | 170 | 50,402.96 |
| H10 | 130 | 130 | 127 | 20 | 25 | 0 | 0 | 0 | 2684 | 1120 | 56,227.79 |
| H11 | 130 | 130 | 162 | 24.5 | 25 | 10 | 0 | 0 | 2783 | 120 | 59,729.72 |
| H12 | 130 | 130 | 162 | 65.5 | 25 | 10 | 10 | 0 | 2885 | 120 | 63,483.43 |
| H13 | 130 | 130 | 128 | 20 | 25 | 0 | 0 | 0 | 2686 | 0 | 56,269.22 |
| H14 | 130 | 130 | 65.5 | 0 | 0 | 0 | 0 | 0 | 2491 | 0 | 50,544.42 |
| H15 | 0 | 130 | 41.5 | 0 | 0 | 0 | 0 | 0 | 2293 | 60 | 45,868.53 |
| H16 | 0 | 130 | 25 | 0 | 0 | 0 | 0 | 0 | 1989 | 0 | 40,467.17 |
| H17 | 0 | 130 | 25 | 0 | 0 | 0 | 0 | 0 | 1897 | 0 | 38,862.33 |
| H18 | 0 | 130 | 25 | 0 | 0 | 0 | 0 | 0 | 2109.5 | 0 | 43,041.32 |
| H19 | 0 | 130 | 25 | 0 | 0 | 0 | 0 | 0 | 2300.4 | 400 | 47,121.04 |
| H20 | 130 | 130 | 132.5 | 20 | 0 | 0 | 0 | 0 | 2680 | 580 | 56,201.47 |
| H21 | 130 | 130 | 44 | 20 | 0 | 0 | 0 | 0 | 2473 | 0 | 50,852.57 |
| H22 | 130 | 130 | 0 | 20 | 0 | 0 | 0 | 0 | 2063 | 0 | 41,212.56 |
| H23 | 130 | 0 | 0 | 0 | 0 | 0 | 0 | 0 | 1640 | 0 | 32,175.24 |
| H24 | 130 | 0 | 0 | 0 | 0 | 0 | 0 | 0 | 1425 | 0 | 27,952.69 |
| Test Case | Best | Average | Worst | STD | Median | Wilcoxon Test | t-Test | Average Time | Worst Time | |
|---|---|---|---|---|---|---|---|---|---|---|
| p-Value | p-Value | h-Value | ||||||||
| Thermal System | 2,246,014 | 2,250,002 | 2,252,619 | 1578.101 | 2,250,432 | 1.73 × 10⁻⁶ | 3.06 × 10−93 | 1 | 0.043229 | 0.09375 |
| Thermal + PEVs | 2,253,149 | 2,255,037 | 2,256,230 | 859.5718 | 2,255,440 | 1.21 × 10⁻⁶ | 6.40 × 10−101 | 1 | 0.047917 | 0.09375 |
| Thermal + SOLAR | 2,161,119 | 2,169,874 | 2,182,779 | 8420.975 | 2,171,364 | 1.37 × 10⁻⁶ | 1.08 × 10−71 | 1 | 0.038021 | 0.078125 |
| Thermal + WIND | 2,171,041 | 2,174,544 | 2,178,548 | 1812.338 | 2,175,304 | 1.56 × 10⁻⁶ | 4.56 × 10−91 | 1 | 0.042188 | 0.09375 |
| Thermal + WIND + PEVs | 2,166,287 | 2,169,067 | 2,171,629 | 1345.898 | 2,169,687 | 1.29 × 10⁻⁶ | 8.77 × 10−95 | 1 | 0.039583 | 0.09375 |
Disclaimer/Publisher’s Note: The statements, opinions and data contained in all publications are solely those of the individual author(s) and contributor(s) and not of MDPI and/or the editor(s). MDPI and/or the editor(s) disclaim responsibility for any injury to people or property resulting from any ideas, methods, instructions or products referred to in the content. |
© 2023 by the authors. Licensee MDPI, Basel, Switzerland. This article is an open access article distributed under the terms and conditions of the Creative Commons Attribution (CC BY) license (https://creativecommons.org/licenses/by/4.0/).
Share and Cite
Kamboj, V.K.; Malik, O.P. Optimal Unit Commitment and Generation Scheduling of Integrated Power System with Plug-In Electric Vehicles and Renewable Energy Sources. Energies 2024, 17, 123. https://doi.org/10.3390/en17010123
Kamboj VK, Malik OP. Optimal Unit Commitment and Generation Scheduling of Integrated Power System with Plug-In Electric Vehicles and Renewable Energy Sources. Energies. 2024; 17(1):123. https://doi.org/10.3390/en17010123
Chicago/Turabian StyleKamboj, Vikram Kumar, and Om Parkash Malik. 2024. "Optimal Unit Commitment and Generation Scheduling of Integrated Power System with Plug-In Electric Vehicles and Renewable Energy Sources" Energies 17, no. 1: 123. https://doi.org/10.3390/en17010123