Article

Dynamic Performance of Monopile-Supported Wind Turbines (MWTs) under Different Operating and Ground Conditions

School of Civil and Environmental Engineering, Harbin Institute of Technology, Shenzhen 518055, China
*
Author to whom correspondence should be addressed.
Energies 2024, 17(1), 112; https://doi.org/10.3390/en17010112
Submission received: 27 November 2023 / Revised: 18 December 2023 / Accepted: 19 December 2023 / Published: 24 December 2023
(This article belongs to the Special Issue Advancement in Wind Turbine Technology)

Abstract

:
A monopile is the most popular foundation type for wind turbines. However, the dynamic performance of monopile-supported wind turbines under different operating and ground conditions is not fully understood. In this study, an integrated monopile-supported wind turbine model in a wind tunnel was employed to jointly simulate the operating and ground conditions. A series of wind tunnel tests were designed and performed to investigate the dynamic performance of monopile-supported wind turbines. These tests included seven operating conditions (seven wind speeds and corresponding rotor speeds) and four ground conditions (one fixed ground condition and three deformable ground conditions with different soil relative densities). According to the test results, the structural responses and dynamic characteristics were analyzed and discussed. This shows that the assumption of fixed-base support significantly overestimates the natural frequency but underestimates the global damping ratio. With the increase in soil relative density, the natural frequency slightly increases, while the damping ratio decreases more significantly. With the increase in the wind speed and rotor speed, the increase in global damping is larger on softer ground. A regression analysis was performed to estimate the global damping ratio under different operating and ground conditions.

1. Introduction

Wind energy is sustainable and clean, which indicates that it has a prospective future [1]. Offshore wind turbines have become one of the most attractive options with the rapid development of the wind energy industry. In intertidal areas and offshore shallow waters, monopile-supported wind turbines (MWTs) are widely employed [2,3,4]. Designed to harvest wind energy, MWTs are vulnerable to external loads due to their flexibility [5]. On the one hand, the dynamic performances of MWTs are highly dependent on the wind speeds and rotor speeds under different operating conditions [6,7]. On the other hand, when standing on seabed soil, ground conditions impact the dynamics of MWTs through the soil–structure interaction [8,9]. Accordingly, it is of great significance to integrally investigate the dynamic performance of MWTs under different operating and ground conditions.
MWTs present complex dynamic behaviors due to the purpose of harvesting wind energy and their special structural form. The support structure of MWTs stands on the soil ground. With an enormous mass at the tower top, MWTs are flexible and sensitive to dynamic loads. During operation, MWTs suffer from a wide range of lateral loads due to wind and rotor rotation [10]. Wind and rotor rotation result in cyclic loads with a frequency of 1P and 3P (i.e., the rotor frequency and the blade passing frequency; see Figure 1). Meanwhile, the interaction between the vibrating rotor and wind causes significant aero damping. The lateral loads eccentrically applied at the tower top lead to a large amount of vibration and contribute to the complex dynamic performance of MWTs [11,12,13,14]. With different ground conditions, the natural frequency of MWTs may fall into the 1P or 3P frequency bands and lead to resonance (see Figure 1) [15,16]. Thus, it is essential to study the dynamic performance of MWTs under different operating and ground conditions.
Operating and ground conditions have remarkable effects on the dynamic performances of MWTs. Murtagh et al. [17] investigated the wind loads and structural responses of a wind turbine tower, considering the interaction between the tower and rotating blades. Staino et al. [18] developed a multi-modal wind turbine model and observed the large amplitude of edgewise oscillations with the increase in the rotor speed. Devriendt et al. [19] monitored the significant increase in the damping ratio of an MWT as the wind speed increased, but it was difficult to carry out a quantitative analysis via site monitoring. Using wind tunnel tests, Hu et al. [20] and Tian et al. [21] investigated the dynamic wind loads on fixed-base turbines under different wind conditions. Martín del Campo and Pozos-Estrada [22] carried out a FEM analysis on a 5 MW onshore turbine. They pointed out that the operating conditions considerably impact the dynamic properties and the load configurations of the wind turbine. Thus, operating conditions directly govern the dynamic loads and global damping of wind turbines, which further affect structural responses. Bhattacharya and Adhikari [23] conducted a series of 1 g tests on a scaled MWT model and validated that the ground condition directly changes the natural frequency and damping ratio of stopped MWTs. Galvín et al. [15] developed a fully coupled 3D boundary element model and found that standing on soil increases the global damping and reduces the natural frequency of the wind turbine. Harte et al. [24] observed that softer foundation soil significantly increases the along-wind displacement at the nacelle height using a multi-degree-of-freedom (MDOF) dynamic structural model. Fontana et al. [25] addressed the fact that soil brings more damping to MWTs, which reduces the mudline moment and fatigue damage. Using a numerical model, Abhinav and Saha [26] studied the effects of soil stiffness and pile parameters on the natural frequency and amplitude of the response. Abdelkader et al. [27] showed that the existence of a foundation may reduce wind loads, and they assumed that a fixed foundation leads to a conservative design. Thus, ground conditions impact the natural frequency and damping ratio of MWTs, which further affect structural responses. Regarding the effects of operating and ground conditions on the dynamic performance of MWTs, they should be jointly considered. However, they are usually considered separately, as in the above studies. Efforts have also been made to investigate the dynamic performance of MWTs under different operating and ground conditions. Zuo et al. [28] investigated the dynamic responses of MWTs by using ABAQUS and concluded that an MWT’s dynamic responses are strongly affected by the operation load and support stiffness. Häfele et al. [29] proposed a numerical method integrated in FAST to study the dynamic responses of wind turbines, taking support stiffness into consideration. It has been noticed that numerical studies are widely employed, in which a large number of simplifications and assumptions are adopted. Nevertheless, in the existing experimental studies, it is difficult to jointly simulate the operating and ground conditions. Additionally, in site monitoring, the operating and ground conditions are uncontrollable and nonadjustable. These qualities make it impossible to carry out quantitative analysis on the dynamic performance of monopile-supported wind turbines. In this regard, experimental studies are highly necessary in order to further understand the dynamic performances of MWTs.
Assuming a fixed base leads to the misrepresentation of ground conditions; meanwhile, the decoupling of the operating and ground conditions makes it difficult to understand the dynamic performance of MWTs. In this study, a series of advanced wind tunnel tests were performed based on an integrated MWT model. Both operating conditions (seven wind speeds and corresponding rotor speeds) and ground conditions (one fixed ground condition and three deformable ground conditions with different soil relative densities) were simulated. The joint effects of the operating conditions and ground conditions on the dynamic performance of MWTs were investigated. This paper is organized as follows: the methods, including the scaling laws, scaled model, test setups, and test cases are introduced in Section 2. The test results and discussions of the dynamic performances of MWTs are reported in Section 3. Section 4 presents some conclusions to facilitate the practical design of and future research on MWTs. This study will provide insights to aid further understanding of the dynamic performances of MWTs. This will contribute to realizing an integrated analysis and design of MWTs in the wind energy industry.

2. Methods

To investigate the dynamic performance of MWTs under different operating and ground conditions, the methods adopted in this study are shown in Figure 2. First, the scaling laws and the details of the scaled MWT model are introduced. The scaled MWT model is capable of mimicking the rotatable rotor, tower, monopile, and ground soil. The scaled MWT model was placed in a wind tunnel in which the wind could be simulated. On this basis, both the operating and ground conditions could be jointly simulated. Meanwhile, the sensors and the data acquisition system (DAQ) were designed to record the displacement, acceleration, and strain during the wind tunnel tests. Next, test cases were designed and corresponding wind tunnel tests were performed, including seven operating conditions (i.e., seven wind speeds and corresponding rotor speeds) and four ground conditions (including rigid ground, and deformable grounds with three soil-relative density values of 20%, 40%, and 60%). According to the test results, the dynamic performance of the MWTs could be systematically investigated and discussed from the aspects of structural responses and dynamic characteristics.

2.1. Scaling Laws and Scaled MWT Model

2.1.1. Scaling Laws in This Study

In an experimental study, it is imperative to choose proper scaling laws to scale up the test results to produce a prototype. Related to the operating condition, the reduced natural frequency is a dimensionless number that governs the relationships between length, frequency, and wind speed. However, the soil strain is a dimensionless number related to the ground condition. In this study, due to the low effects of the Reynolds number, the wind speed was increased to maintain the level of soil strain [30]. Accordingly, dimensionless numbers including length, mass, frequency, and soil strain (see Table 1) were adopted and well-controlled in this study in accordance with the literature [31,32,33]. Details concerning the adopted dimensionless groups are demonstrated in Table 1.
The geometry size of each part determines the dynamics of MWTs. For example, the ratio of the embedded length and pile diameter controls the stiffness of the monopile foundation. The lengths of the tower and the monopile determine the load eccentricity. The diameter of the rotor influences the swept area of the MWTs, etc. In this study, the length-scaling ratio was 1:100 (the model geometry divided by the corresponding geometry of the prototype). The following dimensionless groups were considered and kept consistent with the prototype:
( L tower L pile ,   R rotor L tower , H pile D pile ) model = ( L tower L pile ,   R rotor L tower , H pile D pile ) prototype
where L tower is the nacelle height (i.e., the distance from the rotor center to the tower base), L pile is the pile length, R rotor is the rotor radius, H pile is the embedded length of pile, and D pile represents the diameter of the monopile. Each of these geometries was determined according to a fictitious NREL 5 MW wind turbine. The detailed dimensions of the MWT model are presented in Appendix A.1.
The MWTs are dynamically sensitive structures with enormous top masses. The total mass at the tower top of an NREL 5 MW wind turbine is 350 tons, which includes the rotor, hub, nacelle, and generator sets. The distribution of mass influences the natural frequencies and the inertial loads of MWTs, especially the masses at the tower tops ( m top ). The ratio of the top mass m top and the tower mass ( m tower ) was considered during the design of the scaled model as follows:
( m top m tower ) model = ( m top m tower ) prototype
According to the study of Darvishi-Alamouti et al. [34], the mass of the monopile is not considered because it shows nearly no effects on the dynamics of the MWT. The mass of each part of the MWT model is presented in Appendix A.2.
The natural frequency of the MWT ( f MWT ) is wedged between the 1P ( f 1 P ) and the 3P ( f 3 P ) frequency bands. Thus, the relationships between the natural frequency ( f MWT ) and the forcing frequency ( f 1 P and f 3 P ) should be simulated. The f MWT of the prototype was taken as 0.240 Hz, which is within the range of f 1 P to f 3 P , and the frequency scaling ratio was set as 1:43.8. The following dimensionless groups were adopted:
( f MWT f 1 P ,   f MWT f 3 P ) model = ( f MWT f 1 P ,   f MWT f 3 P ) prototype
The rotor speed in this study was designed according to Equation (3) to simulate the f MWT , which is in the gap between f 1 P and f 3 P . The details can be found in Appendix A.3.
The MWT is mainly subjected to lateral loads due to the rotor thrust. The horizontal loads are transformed from the monopile to the soil. To mimic the soil–structure interaction it was essential to simulate the soil strain field around the monopile in the tests [32]. Thus, the following dimensionless groups were employed:
( P GD pile 2 ,   M GD pile 3 ) model = ( P GD pile 2 ,   M GD pile 3 ) prototype
where P represents the horizontal force at the pile head, M is the bending moment, and G is the soil shear modulus. In this study, wind load was applied by exciting the rotating rotor in a wind tunnel. The pile head load was controlled by adjusting the wind speed and the rotor speed. The selection of the wind speed and the rotor speed are given in Appendix A.4.

2.1.2. Details of the Scaled MWT Model

The limitations of a previous study mainly included oversimplification on a scaled MWT model and oversimplifications in terms of loads [30]. In this study, a 1/100-scaled MWT model based on an NREL 5 MW wind turbine was adopted, which included a rotatable rotor, support structure (tower and monopile), and soil. To simulate the operation of the MWT, the rotor is driven by a servo motor. The airfoils of the rotor blades are identical to those of the NREL 5 MW wind turbine. The blade consists of eight airfoils, tabulated in Table 2. Based on the airfoil data, a 3D model of the rotor was built and then fabricated using ABS plastics, as shown in Figure 3. The operating conditions were controlled by adjusting the rotor speed and corresponding wind speeds. The support structure, including the tower and monopile, was modelled after that used in [5,35]. Steel tubes were used to fabricate the tower and the monopile. The nacelle, tower, and monopile can be bolted together conveniently via flanges. More details can be found in the relevant previous study [30].
Dry sand has been widely used to study the soil–structure interaction assuming a completely drained condition [36]. The soil ground was simulated with dry sand in a soil container, which was placed in the wind tunnel. The soil properties are listed in Table 3. Different ground conditions were realized by varying support conditions including the fixed-base condition (FBC, i.e., rigid ground condition) and monopile-supported conditions (MSCs, i.e., deformable ground conditions). When MSCs were employed, three values of sand relative density ( D r ) were used. In this study, the simulation of D r was achieved by controlling the mass of the soil. Densified layer by layer, the achieved relative density was 19.5%, 38.9%, and 63.0%, which is very close to the D r target values of 20.0%, 40.0%, and 60.0%, respectively.
Figure 4 shows the overview of the test model. The rotor was bolted to the shaft of the motor. Next, the motor, tower, and monopile were bolted together via bolts and flanges. The soil container was placed at the center of the test section of the wind tunnel.
For the FBC (Figure 4a), the tower was bolted on a rigid frame. For MSCs (Figure 4b), the tower was bolted to the monopile and then buried in the sand.

2.2. Setup of Wind Tunnel Tests

Figure 5 shows the details of the test setups. The tests were performed in the wind tunnel of the Harbin Institute of Technology, Shenzhen. The test section was 24 m × 6 m × 3.6 m (length × width × height). The test model and apparatus were installed in the wind tunnel, and the wind speed was simulated. In this regard, the dynamic performance of the MWT model can be tested under the given joint operating and ground conditions. Laser displacement sensors (laser DS), accelerometers, and strain gauges were employed to record the structural responses inside the wind tunnel. The data acquisition device (DH5929), computer, DC power, and servo controller were arranged outside the wind tunnel.

2.3. Design of Test Cases

To study the dynamic performance of MWTs, both the operating and ground conditions were considered jointly in this study. As is shown in Table 4, seven operating conditions (R1 to R7) were designed. In this study, the wind shear and the wind turbulence were not considered. A uniform wind field was adopted and simulated in an empty wind tunnel. The mean wind speed at the hub height was well-controlled, and the corresponding turbulence intensity at hub height was at a low level, within 1% to 3%. The wind speed and corresponding rotor speed were from 3 m/s (302 rpm) to 9 m/s (451 rpm). Meanwhile, four ground conditions were considered. For the deformable ground condition, the D r of D1, D2, and D3 were 19.5%, 38.9%, and 63.0%, respectively. D0 represents the rigid ground condition.

3. Results and Discussion

The structural responses and dynamic characteristics represent the dynamic performance of MWTs. It is of great importance to quantitatively analyze the dynamic responses and the dynamic characteristics under different operating and ground conditions. The time histories of displacement, acceleration, and strain were recorded in the wind tunnel test. In this section, the structural responses including the nacelle displacement, tower top acceleration, and tower base bending moment are analyzed. Problems attributed to the structural responses that may threaten the serviceability and safety of MWTs are discussed. Meanwhile, the operational modal analysis is carried out to identify the natural frequency and the damping ratio of the MWTs. The potential resonance risks due to the overlap of natural frequency and loading frequency and the estimation of the global damping ratio against wind speed and ground conditions are discussed.

3.1. Structural Responses

3.1.1. Displacement at Nacelle Height

Figure 6 shows the standard deviation (STD, σ disp ) and average value (AVG, d - ) of the tower top displacement in the F–A direction. As is shown in Figure 6a, with the increase in wind speed and rotor speed, the σ disp also increases due to the fluctuation in the rotor thrust increases. The σ disp of D0 is greater than that of D1, D2, and D3 in most cases. With the upgrading of operating conditions, the increase in σ disp of D3 is more obvious than that of D2 or D1. This indicates that the soil–structure interaction will amplify the nacelle displacement when standing on stiffer soil ground conditions. Figure 6b shows the d - under different operating and ground conditions. It is observed that under R1 and R2, the d - values for D1, D2, D3, and D0 are almost identical. As wind speed increases, the d - value under the test condition with softer ground shows a significant increase. The d - values for D1 and D2 increase more significantly compared with D3 and D0. Under the R7 condition, the d - for D1, D2, D3, and D0 is 3.17 mm, 2.43 mm, 0.29 mm, and 0.07mm, respectively. It is noticed that the d - of D3 is much closer to the d - of D0 as compared with D1 and D2. This demonstrates that denser sand will significantly decrease the d - at the nacelle height. In general, standing on looser sand will lead to less of an increase in σ disp but a more significant increase in d - .

3.1.2. Acceleration at the Tower Top

Figure 7 shows the standard deviation (STD) of the acceleration ( σ acc ) in the F–A direction at the tower top (R1 to R7). With the increase in wind speeds and rotor speeds, the rotor thrust increases rapidly, and the σ acc also increases significantly (see Figure 7). Under different ground conditions, the values of the σ acc under FBC (D0) are generally larger than the σ acc under MSCs (i.e., D1, D2, and D3). The σ acc values of D1, D2, and D3 are very close, but a slight increase in σ acc can be observed with the increase in D r . Thus, assuming a fixed tower base significantly overestimates the amplitude of nacelle acceleration. The decrease in relative density shows limited effects on the reduction in σ acc .

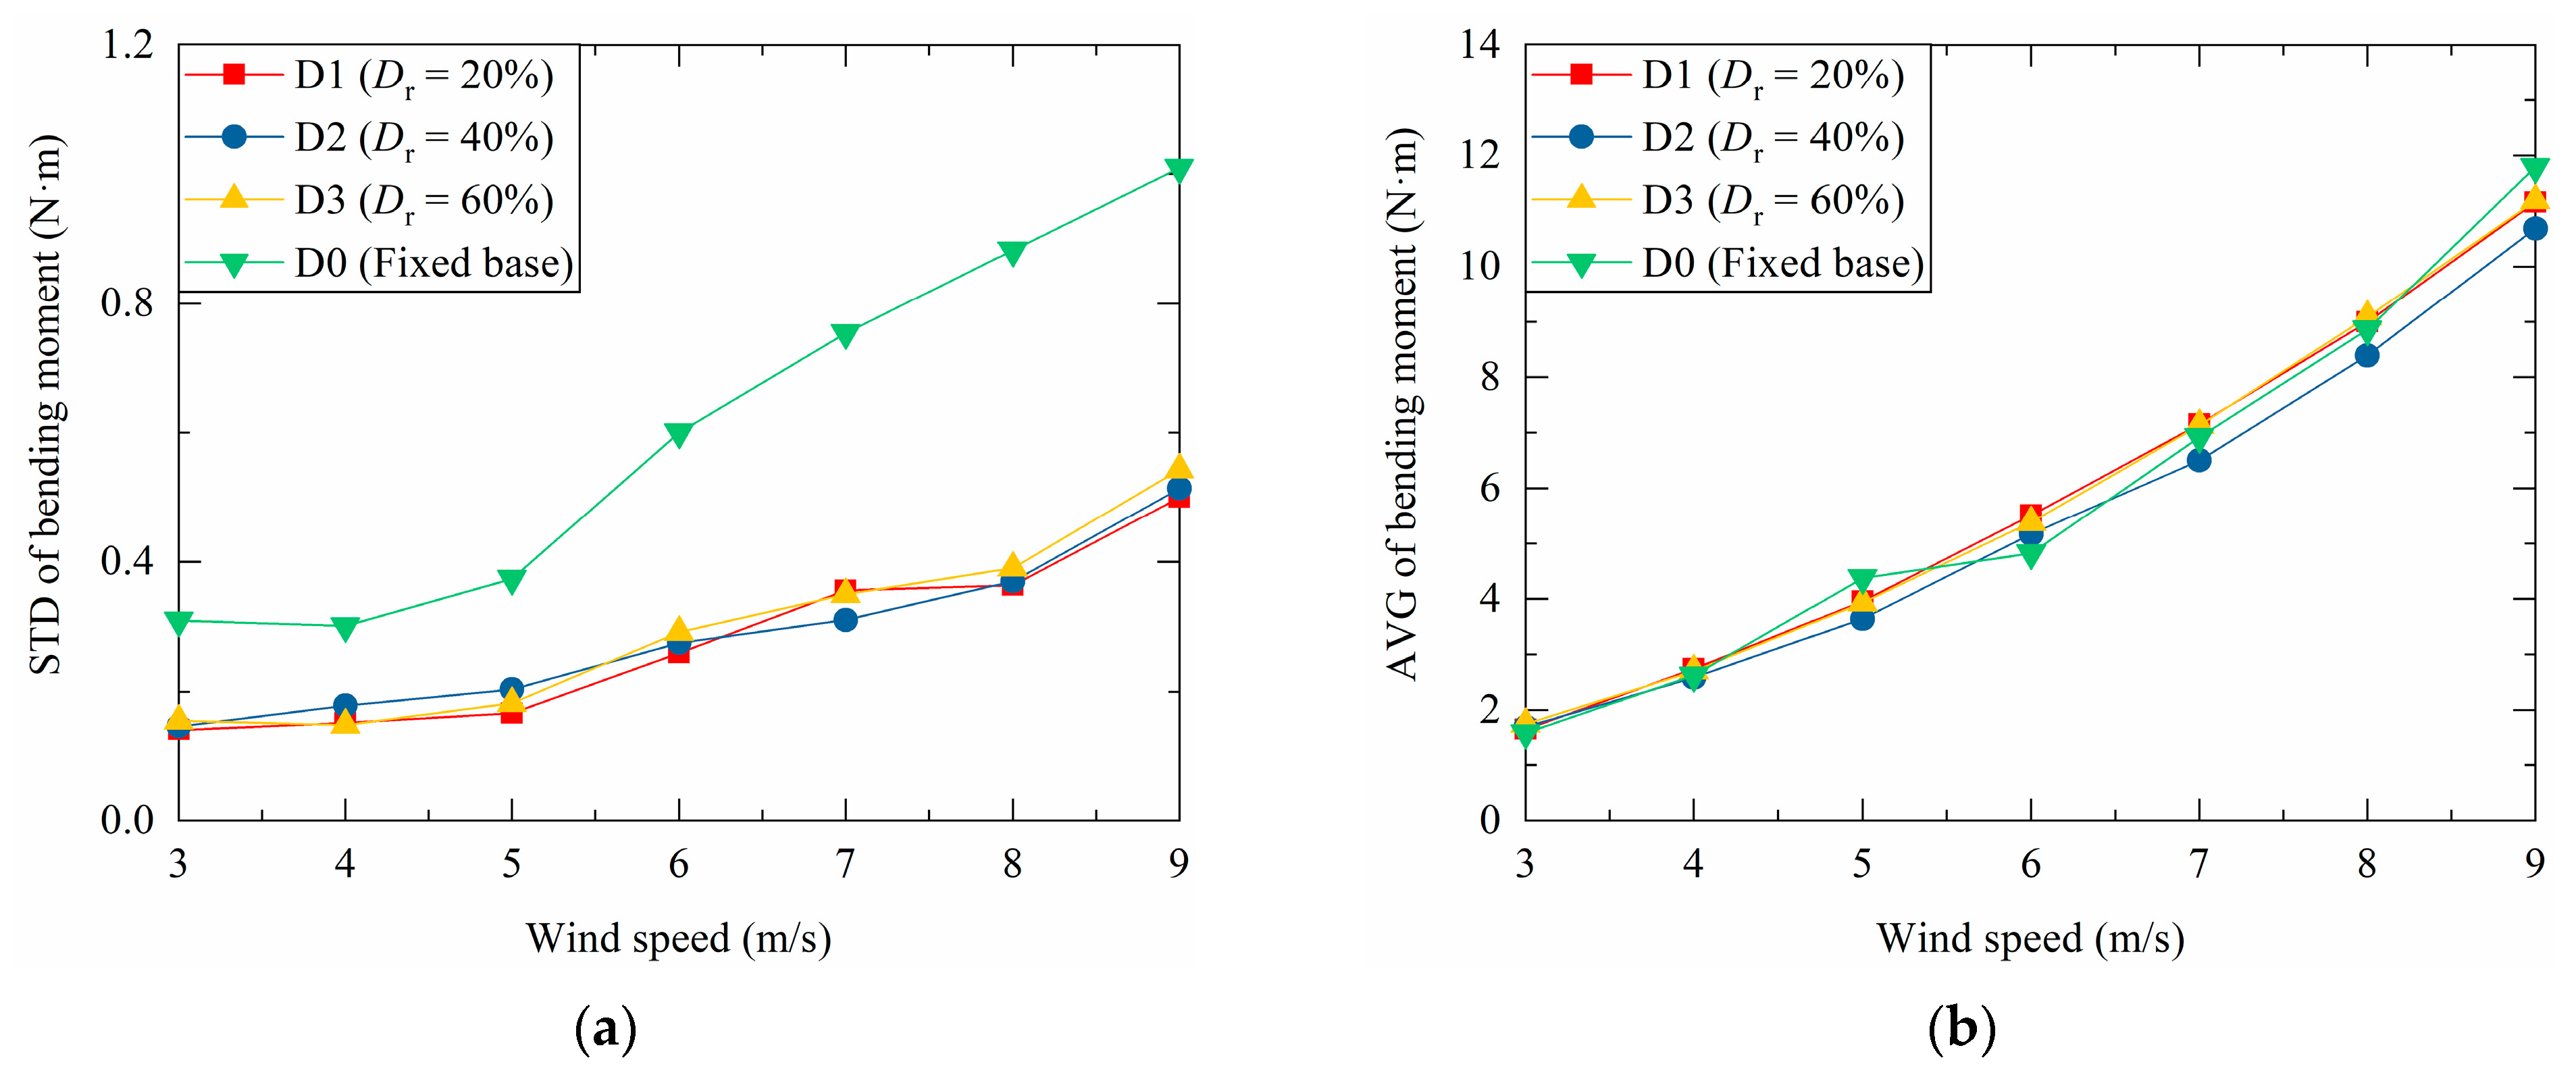
3.1.3. Bending Moment at the Tower Base

Figure 8 shows the standard deviation (STD, σ bend ) and the average value (AVG, M - ) of the bending moment at the tower base. As is shown in Figure 8a, with the increase in wind speeds and rotor speeds, the σ bend values increase gradually because the tower shadow effect is more significant under high wind speeds. The magnitude of the σ bend under an FBC is much larger than that under MSCs. With different values of D r , the σ bend values of D1, D2, and D3 are very close, which is similar to the phenomenon observed in nacelle acceleration. As is shown in Figure 8b, the M - at the tower base increases with the increase in the wind speed under different operating conditions. The curves of M - under different ground conditions are almost the same. The differences between each curve are attributed to the measuring error of the strain gauges.

3.1.4. Discussions Regarding Structural Responses

A lower D r results in a lower ground stiffness but higher damping. With the coupled effect of ground stiffness and ξ , the variation in the σ disp against the ground conditions is very close. In general, the σ disp under the FBC (D0) is greater than the σ disp under the MSC (such as D1, D2, and D3) (see Figure 6a). A lower D r leads to a higher ξ , which decreases the σ disp . However, the d - of D3 and D0 is much less than that of D1 and D2 (see Figure 6b) due to the higher ground stiffness. This indicates that the d - under the MSC will behave like that under the FBC when D r is high (such as D3). In general, ground conditions have limited effects on the σ disp but impact the d - significantly. To ensure the serviceability of wind turbines, the tower top rotation should be less than 5° [37] and the threshold of displacement is 1.25% of the tower height [38]. The increase in top displacement may lead to a large vibration of the blade, which may result in a collapse once the blade collides with the tower. Meanwhile, the increase in the nacelle displacement coupled with a long lifetime may result in unrecoverable accumulated deformation.
As for the nacelle acceleration and the tower base bending moment (see Figure 7 and Figure 8), it is observed that the σ acc and the σ bend values of D1, D2, and D3 are lower than that of D0 under various operating conditions (R1 to R7). The global damping values ( ξ ) of D1, D2, and D3 are greater than D0. In terms of this aspect, standing on ground composed of softer soil is beneficial for reducing the amplitudes of the tower top acceleration and tower base bending moment. Compared with σ disp , the σ acc and σ bend are more sensitive to the ground condition. Large top acceleration may lead to the shutdown of the generator. A large tower base bending moment may result in fatigue damage to the structure. The existence of soil will contribute to decreasing the amplitudes of the top acceleration and the tower base bending moment. This is beneficial to the fatigue life and long-term performance of MWTs. These observations are consistent with the study of Harte et al. [23] and Fontana et al. [24]. These studies verify the effectiveness of the method and the reliability of the test results in this study. This provides a solid contribution for further understanding the integral dynamic performance of MWTs, which helps to develop a more reasonable and less conservative design of MWTs.

3.2. Dynamic Characteristics

3.2.1. Modal Parameter Identification

Stochastic subspace identification [39,40] was employed to identify the modal parameters according to the tower acceleration (see Figure 9). As is shown in Figure 9a, Acc1, Acc2, and Acc3 represent the accelerometers at the top, middle, and base of the tower, respectively. During the tests, the accelerations were recorded via accelerometers. The time histories of the acceleration are shown in Figure 9b (case D1, R7). The amplitude of acceleration increased with the increase in height, and the largest acceleration was observed at the top of the tower. Next, the first-order F–A natural frequency ( f ) and the corresponding damping ratio ( ξ ) of the MWT could be identified via stochastic subspace identification. The diagrams of modal parameter identification are shown in Figure 9c,d. As is shown in Figure 9c, the f is 9.90 Hz, which is the peak of the acceleration PSD (power spectral density). The red circles represent the identified f with different orders. In general, the red circles are continuously distributed, which indicates the validity of the identification. The blue circles represent the frequency of the blade ( f 2 ), which is 19.39 Hz. Loaded with a uniform wind excitation, the f 2 of the rotor blade is not completely excited. Thus, the blue circles show a discontinuous distribution along the different order. The purple circles represent f 3 P (with a rotor speed of 451 rpm, f 3 P is 22.55 Hz, and the identified value is 22.49 Hz). As is shown in Figure 9d, the data points are concentratedly projected on the F–D (frequency and damping ratio) plane, indicating that the damping ratios are accurately identified. The global damping ratio ξ is 3.46%, which is much larger than the second-order damping ratio ( ξ 2 ) of 0.71%. Because the rotor speed is stable at 451 rpm, the damping ratio of f 3 P excitation ( ξ 3 ) is 0.00%; this means that f 3 P excitation does not decay with time. To conclude, when using this method, the modal parameters of the operating MWT standing on sandy ground can be identified with reliable precision. Similar applications of this method have been widely adopted in the literature [19,40]. The f and ξ of the MWT under different operating and ground conditions are identified and discussed in following sections.

3.2.2. Natural Frequency

Figure 10 shows the box plot of the first-order F–A natural frequency ( f ) of the MWTs. With different operating conditions, the values of f are within 9.77 Hz to 10.36 Hz (D1, D r   = 20%), 9.88 Hz to 10.38 Hz (D2, D r   = 40%), 10.18 Hz to 10.48 Hz (D3, D r   = 60%), and 13.75 Hz to 13.83 Hz (D0, rigid ground). It is observed that the f values under the condition of deformable ground are approximately 25% lower than the f on rigid ground. With the increase in D r , the f presents a slight increase because the pile head stiffness increases with the increase in D r [41]. However, the maximum f values under different ground conditions are very similar (10.36 Hz when D r   = 20%, 10.38 Hz when D r   = 40%, and 10.48 Hz when D r   = 60%). This indicates that D r exerts a limited influence on f compared with the rigid ground assumption.

3.2.3. Damping Ratio

Figure 11 shows the global damping ratio ( ξ ) of the MWTs. It is observed that the increase in wind speed leads to the increase in ξ . At a low wind speed and rotor speed (i.e., test case R1), the ξ values under different ground conditions are almost the same ( ξ = 1.38% when D r   = 20%, ξ = 1.21% when D r   = 40%, ξ = 0.96% when D r   = 60%, and ξ = 0.47% for rigid ground). If the wind speed and corresponding rotor speed increase to 9 m/s and 451 rpm (i.e., test case R7), respectively, the ξ values for different ground conditions are 3.46% ( D r   = 20%), 2.12% ( D r   = 40%), 1.51% ( D r   = 60%), and 1.28% (rigid ground). With the increase in D r values (e.g., from 20% to 60%), the increase in ξ at a high wind speed is much more significant than that at a moderate operating condition. The increase in ξ is attributed to the increase in the aero damping and soil damping. Aero damping depends on the wind velocity, the rotor speed, and the vibration of the structure [42]. Additionally, the soil damping depends on the soil properties and the magnitudes of the soil strain [7]. The ξ values of D1, D2, and D3 are larger than that of D0. This indicates that sand with a lower D r will bring more damping to MWTs compared with FBC. The softer ground condition (e.g., loose sand) results in a larger increase in ξ because the deformation of loose sand is larger, which increases the soil damping of MWTs.

3.2.4. Discussions Regarding Dynamic Characteristics

The natural frequency ( f ) of the MWT is in the gap between 1P and 3P (i.e., f 1 P and f 3 P ). Resonance may occur if the f falls into the f 1 P or f 3 P bands. In this study, the rotor speed of the model wind turbine varies from 302 rpm to 529 rpm. Correspondingly, the f 1 P ranges from 5.03 Hz to 8.82 Hz and f 3 P ranges from 15.10 Hz to 26.45 Hz. With a safety margin of 10%, the f should be within 9.20 Hz to 13.97 Hz. Figure 12 shows the relationship between f 1 P , f 3 P , and f via a power spectrum density graph of the tower top acceleration. As is demonstrated in Section 3.2.2, under the MSC, the f values of D1, D2, and D3 are close to the lower limiting frequency (9.20 Hz). Under the FBC (D0), the f is close to the upper limiting frequency (13.97 Hz). The ground conditions impact f significantly, and, assuming a fixed base, can lead to the overestimation of the f of MWTs. For the FBC, the f is close to f 3 P ; however, for the MSCs, the f values are close to f 1 P . To avoid structural resonance, the ground conditions must be considered to evaluate the f precisely.
Because the damping ratio ( ξ ) of the MWT significantly impacts the structural responses and fatigue life of MWT, it is critical to properly evaluate the ξ of MWTs during the design approach. However, a limited number of studies have focused on this issue. To observe the variation in ξ against D r under different operating conditions, ξ was plotted in Figure 13. Linear fitting was carried out to fit the variation in ξ against the increase in D r as follows:
ξ = A × D r + B
Where A and B are fitting parameters (see Table 5). R 2 values under different operating conditions are within 0.915 to 0.999, which indicates that the ξ values decrease linearly with the increase in D r . The parameter A = d ξ / d D r which represents the decreasing rate of ξ against the increase in D r . The parameter B represent the general magnitude of ξ under a certain operating condition. A and B can be further fitted as linear functions of wind speed.
A = k 1 × v h + b 1
B   = k 2 × v h + b 2
where v h is wind speed in m/s at nacelle (hub) height, and k 1 , b 1 , k 2 , b 2 are fitting parameters. With k 1   = −0.006 and b 1 = 0.013, R 2 is 0.939. This implies that the decreasing rate of ξ against the increase in D r is more rapid at a higher v h . With k 2   = 0.442 and k 2 = 0.052, R 2 is 0.958. This means that the magnitude of ξ is larger at a higher v h . Accordingly, ξ shows a more significant decrease against the increase in D r   under the operating condition with a higher v h . It should be noted that the ξ value demonstrated here consists of soil damping, structural material damping, and aero damping. The equations given above provide insight to estimate the ξ of MWTs with limited soil and wind properties. This may contribute to the initial design of the support structure for MWTs including a monopile and a tower. Considering the operating and soil ground conditions jointly, the magnitude of ξ is higher compared with that under stopped and fixed ground conditions. This may reduce the conservation required and the cost of support structures for the MWTs.

4. Conclusions

This study evaluated the effects of operating and ground conditions on the dynamic performance of MWTs. An integrated MWT model combined with a wind tunnel was adopted to jointly simulate the operating and ground conditions. Based on a series of wind tunnel tests, the structural responses, natural frequency, and damping ratio of the scaled MWT were observed and discussed. The main findings and conclusions of this study are drawn as follows:
(1)
In sandy soil, a higher soil relative density (i.e., higher ground stiffness) leads to a more significant reduction in the average displacement at the tower top, particularly under faster wind speeds. Assuming a fixed-base condition (FBC) has a limited effect on the amplitude of displacement at the tower top; however, this leads to a significant overestimation of the amplitudes of the tower top acceleration and the tower base bending moment.
(2)
Ground conditions have significant effects on the natural frequency and damping ratio of MWTs. Assuming an FBC will overestimate the natural frequency and underestimate the damping of MWTs. The natural frequency values of MWTs under MSCs are approximately 25% lower as compared with those of an FBC. The natural frequency presents a limited increase with the increase in the soil relative density. Compared with an FBC, MSCs on softer ground (with a lower soil relative density) lead to a higher damping ratio.
(3)
The variation in the global damping ratio with different relative densities and wind speeds can be accurately fitted via linear fitting. Under the same operating condition, the global damping ratio decreases with the increase in soil relative density. The soil relative density has a more significant effect on the global damping ratio of MWTs under a faster wind speed.
(4)
The operating and ground conditions should be jointly considered during the analysis and design procedure of MWTs. This contributes to maintaining the serviceability of MWTs and may reduce the required conservation and cost of the support structure. The main findings provide insight to further understand the complex dynamic performance of MWTs. However, further full-scale validation and investigation are necessary prior to practical application.
(5)
Only limited parameters related to operating and ground conditions were considered in this study, which should be expanded in future studies. Other parameters related to wind shear, turbulence, structural geometry, soil type, etc., should be systematically investigated in the future. Meanwhile, integrated numerical and theoretical models should be developed and carefully validated via an advanced experimental technique. This will solidly contribute to realizing an integrated analysis and the design of MWTs in the wind energy industry.

Author Contributions

S.X.: validation, investigation, data curation, writing—original draft; H.L.: investigation, supervision, project administration; K.L.: conceptualization, methodology, formal analysis, investigation, resources, writing—review and editing, supervision. All authors have read and agreed to the published version of the manuscript.

Funding

This study was supported by the National Natural Science Foundation of China (Grant numbers 51978221, 51978225, and 52378500).

Data Availability Statement

The data presented in this study are available upon request from the corresponding author. The data are not publicly available due to restrictions.

Conflicts of Interest

The authors declare no conflicts of interest.

Appendix A

The properties of the fictious prototype mainly refer to NREL 5 MW wind turbines that are widely employed to study dynamic issues with regard to wind turbines [5,35]. The dimensionless groups and the details of the test model used in this study are introduced in this section.

Appendix A.1. Length

The rotor diameter, nacelle height, and pile length of the fictitious NREL 5 MW wind turbine were 126 m, 90 m, and 50 m, respectively [5]; the corresponding values of the scaled model were 1.26 m, 0.9 m, and 0.5 m, respectively. The embedded length of the monopile was 40 m and the diameter of the monopile was 6 m in the prototype [35]. In this study, the embedded length and diameter of the monopile were 0.4 m and 0.06 m, respectively. The dimensionless groups given in Equation (1) for the prototype were consistent with those used in the model tests.

Appendix A.2. Mass

The total mass at the tower top of an NREL 5 MW wind turbine is 350 tons, including three blades (53.22 tons), the hub (56.78 tons), and the nacelle (240 tons) [5]. The overall mass of the tower of an NREL 5 MW wind turbine is 347.46 tons. In this study, the mass at the tower top was 4.61 kg, and the mass of the tower was adjusted to 4.57 kg using an extra counterweight. The ratio of m t o p and m t o w e r was 1.01 in both the prototype and the scaled model. The dimensionless groups in Equation (2) can be achieved.

Appendix A.3. Frequency

The rotor speed of an NREL 5 MW wind turbine varies from 6.9 rpm to 12.1 rpm under different wind speeds [5]. Correspondingly, the f 1 P of the prototype was from 0.115 Hz to 0.202 Hz, and the f 3 P was from 0.345 Hz to 0.605 Hz. Considering a safe margin of 10%, the gap between f 1 P and f 3 P was from 0.211 Hz to 0.319 Hz. The f of the prototype was taken as 0.240 Hz, which is within this range. The average f of the MWT standing on sand with three different soil relative densities was 10.45 Hz. Thus, the frequency-scaled ratio was set as 43.8. Next, the rotor speeds during the model test were determined. In the model tests, f 1 P was from 5.03 Hz to 8.82 Hz, and f 3 P was from 15.10 Hz to 26.45 Hz. The ratio of f and f 1 P was from 1.045 to 2.774 in the prototype and from 1.043 to 2.777 in the model test. Because f 3 P was equal to three times f 1 P , the ratio of f and f 3 P was simulated effectively. Using this method, the relationship between f , f 1 P , and f 3 P was implemented in the laboratory test.

Appendix A.4. Soil Strain

The rotor thrusts of an NREL 5 MW wind turbine under different operating conditions are tabulated in Table A1. Considering a load eccentricity of 90 m (i.e., nacelle height), the corresponding bending moments generated at the pile head (i.e., tower base) are given as well. The reasonable shear modulus values of the sandy soil were within 40 to 140 MPa [43]. The P / G D 2 and M / G D 3 were calculated and are given in Table A1. The P / G D 2 of the prototype wats within 0.341 × 10⁻⁴ to 4.022 × 10⁻⁴, and the M / G D 3 of the prototype was within 0.511 × 10⁻³ to 6.033 × 10⁻³.
Table A1. NREL 5 MW wind turbine operating conditions.
Operation IDWind Speed
(m/s)
Rotor Speed
(rpm)
Rotor Thrust
(kN)
Bending Moment (MN·m) P / G D 2
(×10−4)
M / G D 3
(×10−3)
R136.972171.715.50.341–1.1920.511–1.789
R247.183215.919.40.428–1.4990.643–2.249
R357.506268.924.20.534–1.8670.800–2.801
R467.942330.329.70.655–2.2940.983–3.441
R578.469398.635.90.791–2.7681.186–4.152
R689.156478.043.00.948–3.3191.423–4.979
R7910.296579.252.11.149–4.0221.724–6.033
In this study, the rotor thrust was simulated by exciting the rotating rotor with wind. Because a geometrically scaled blade will result in a lower rotor thrust, the wind speed was not scaled to increase the rotor thrust. The rotor trust of each test condition and the corresponding wind speed and rotor speed are listed in Table A2. The shear modulus values of the sand were calculated using the method provided in the literature [43]. Under different relative densities, the shear modulus values of the sand were 11.51 MPa (20%), 13.76 MPa (40%), and 15.71 (60%) MPa, respectively. The P / G D 2 and M / G D 3 of each test condition are given in Table A2. The P / G D 2 in the model test was from 0.328 × 10⁻⁴ to 3.326 × 10⁻⁴, and the M / G D 3 in model test was within 0.492 × 10⁻³ to 4.511 × 10⁻³. It can be concluded that the P / G D 2 and M / G D 3 in the prototype and the model test show good agreement, which indicates that the soil strain around the pile can be simulated effectively. However, it should be noted that, in the “1 g” tests, the effective stresses in the soil were lower as compared with the real site. The method that is able to identify this limitation and consequently scale the relative density to match the dilatancy in the real site has been outlined by LeBlanc et al. [44], which is not presented in this paper.
Table A2. Scaled wind turbine operating conditions.
Test IDWind Speed
(m/s)
Rotor Speed
(rpm)
Rotor Thrust
(N)
Bending Moment (N·m) P / G D 2
(×10−4)
M / G D 3
(×10−3)
R133021.86 1.67 0.328–0.4480.492–0.672
R243113.09 2.67 0.547–0.7470.786–1.073
R353304.73 3.98 0.836–1.1421.173–1.602
R463506.30 5.23 1.114–1.5211.540–2.103
R573728.46 6.93 1.495–2.0422.042–2.789
R6840810.85 8.84 1.918–2.6202.603–3.555
R7945113.78 11.21 2.435–3.3263.303–4.511

References

  1. Hong, L.; Möller, B. Offshore wind energy potential in China: Under technical, spatial and economic constraints. Energy 2011, 36, 4482–4491. [Google Scholar] [CrossRef]
  2. Abadie, C.N.; Byrne, B.W.; Houlsby, G.T. Rigid pile response to cyclic lateral loading: Laboratory tests. Geotechnique 2019, 69, 863–876. [Google Scholar] [CrossRef]
  3. Burd, H.J.; Taborda, D.M.G.; Zdravković, L.; Abadie, C.N.; Byrne, B.W.; Houlsby, G.T.; Gavin, K.G.; Igoe, D.J.P.; Jardine, R.J.; Martin, C.M.; et al. PISA Design Model for Monopiles for Offshore Wind Turbines: Application to a Marine Sand. Geotechnique 2019, 11, 1048–1066. [Google Scholar] [CrossRef]
  4. Sunday, K.; Brennan, F. A review of offshore wind monopiles structural design achievements and challenges. Ocean Eng. 2021, 235, 109409. [Google Scholar] [CrossRef]
  5. Jonkman, J.; Butterfield, S.; Musial, W.; Scott, G. Definition of a 5-MW Reference Wind Turbine for Offshore System Development; No. NREL/TP-500-38060; National Renewable Energy Laboratory: Golden, CO, USA, 2009. [Google Scholar]
  6. Devriendt, C.; Jordaens, P.J.; De Sitter, G.; Guillaume, P. Damping estimation of an offshore wind turbine on a monopile foundation. IET Renew. Power Gen. 2013, 7, 401–412. [Google Scholar] [CrossRef]
  7. Chen, C.; Duffour, P. Modelling damping sources in monopile-supported offshore wind turbines. Wind Energy 2018, 21, 1121–1140. [Google Scholar] [CrossRef]
  8. Lombardi, D.; Bhattacharya, S.; Muir Wood, D. Dynamic soil-structure interaction of monopile supported wind turbines in cohesive soil. Soil Dyn. Earthq. Eng. 2013, 49, 165–180. [Google Scholar] [CrossRef]
  9. Damgaard, M.; Andersen, L.V.; Ibsen, L.B. Dynamic response sensitivity of an offshore wind turbine for varying subsoil conditions. Ocean Eng. 2015, 101, 227–234. [Google Scholar] [CrossRef]
  10. Jalbi, S.; Arany, L.; Salem, A.; Cui, L.; Bhattacharya, S. A method to predict the cyclic loading profiles (one-way or two-way) for monopile supported offshore wind turbines. Mar. Struct. 2019, 63, 65–83. [Google Scholar] [CrossRef]
  11. Klinkvort, R.T.; Hededal, O. Effect of load eccentricity and stress level on monopile support for offshore wind turbines. Can. Geotech. J. 2014, 51, 966–974. [Google Scholar] [CrossRef]
  12. Wang, X.; Zeng, X.; Yang, X.; Li, J. Seismic response of offshore wind turbine with hybrid monopile foundation based on centrifuge modelling. Appl. Energy 2019, 235, 1335–1350. [Google Scholar] [CrossRef]
  13. Arany, L.; Bhattacharya, S.; Macdonald, J.; Hogan, S.J. Design of monopiles for offshore wind turbines in 10 steps. Soil Dyn. Earthq. Eng. 2017, 92, 126–152. [Google Scholar] [CrossRef]
  14. Arany, L.; Bhattacharya, S.; Macdonald, J.; Hogan, S.J. Simplified critical mudline bending moment spectra of offshore wind turbine support structures. Wind Energy 2015, 18, 2171–2197. [Google Scholar] [CrossRef]
  15. Galvín, P.; Romero, A.; Solís, M.; Domínguez, J. Dynamic characterisation of wind turbine towers account for a monopile foundation and different soil conditions. Struct. Infrastruct. Eng. 2016, 13, 942–954. [Google Scholar] [CrossRef]
  16. Ozbek, M.; Rixen, D.J.; Erne, O.; Sanow, G. Feasibility of monitoring large wind turbines using photogrammetry. Energy 2010, 35, 4802–4811. [Google Scholar] [CrossRef]
  17. Murtagh, P.J.; Basu, B.; Broderick, B.M. Along-wind response of a wind turbine tower with blade coupling subjected to rotationally sampled wind loading. Eng. Struct. 2005, 27, 1209–1219. [Google Scholar] [CrossRef]
  18. Staino, A.; Basu, B. Dynamics and control of vibrations in wind turbines with variable rotor speed. Eng. Struct. 2013, 56, 58–67. [Google Scholar] [CrossRef]
  19. Devriendt, C.; Weijtjens, W.; El-Kafafy, M.; De Sitter, G. Monitoring resonant frequencies and damping values of an offshore wind turbine in parked conditions. IET Renew. Power Gen. 2014, 8, 433–441. [Google Scholar] [CrossRef]
  20. Hu, H.; Yang, Z.; Sarkar, P. Dynamic wind loads and wake characteristics of a wind turbine model in an atmospheric boundary layer wind. Exp. Fluids 2012, 52, 1277–1294. [Google Scholar] [CrossRef]
  21. Tian, W.; Ozbay, A.; Hu, H. Effects of incoming surface wind conditions on the wake characteristics and dynamic wind loads acting on a wind turbine model. Phys. Fluids 2014, 26, 125108. [Google Scholar] [CrossRef]
  22. Martín Del Campo, J.O.; Pozos-Estrada, A. Multi-hazard fragility analysis for a wind turbine support structure: An application to the Southwest of Mexico. Eng. Struct. 2020, 209, 109929. [Google Scholar] [CrossRef]
  23. Bhattacharya, S.; Adhikari, S. Experimental validation of soil–structure interaction of offshore wind turbines. Soil Dyn. Earthq. Eng. 2011, 31, 805–816. [Google Scholar] [CrossRef]
  24. Harte, M.; Basu, B.; Nielsen, S.R.K. Dynamic analysis of wind turbines including soil-structure interaction. Eng. Struct. 2012, 45, 509–518. [Google Scholar] [CrossRef]
  25. Fontana, C.M.; Carswell, W.; Arwade, S.R.; DeGroot, D.J.; Myers, A.T. Sensitivity of the Dynamic Response of Monopile-Supported Offshore Wind Turbines to Structural and Foundation Damping. Wind Eng. 2015, 39, 609–627. [Google Scholar] [CrossRef]
  26. Abhinav, K.A.; Saha, N. Dynamic analysis of monopile supported offshore wind turbines. ICE Proc. Geotech. Eng. 2017, 170, 428–444. [Google Scholar] [CrossRef]
  27. Abdelkader, A.; Aly, A.M.; Rezaee, M.; Bitsuamlak, G.T.; El Naggar, M.H. On the evaluation of wind loads for wind turbines’ foundation design: Experimental and numerical investigations. Struct. Des. Tall Spec. Build. 2017, 26, e1362. [Google Scholar] [CrossRef]
  28. Zuo, H.; Bi, K.; Hao, H. Dynamic analyses of operating offshore wind turbines including soil structure interaction. Eng. Struct. 2018, 157, 42–62. [Google Scholar] [CrossRef]
  29. Häfele, J.; Hübler, C.; Gebhardt, C.G.; Rolfes, R. An improved two-step soil-structure interaction modeling method for dynamical analyses of offshore wind turbines. Appl. Ocean. Res. 2016, 55, 141–150. [Google Scholar] [CrossRef]
  30. Lin, K.; Xiao, S.; Zhou, A.; Liu, H. Experimental study on long-term performance of monopile-supported wind turbines (MWTs) in sand by using wind tunnel. Renew. Energy 2020, 159, 1199–1214. [Google Scholar] [CrossRef]
  31. Richards, I.A.; Byrne, B.W.; Houlsby, G.T. Monopile rotation under complex cyclic lateral loading in sand. Geotechnique 2020, 10, 926–930. [Google Scholar] [CrossRef]
  32. Bhattacharya, S.; Lombardi, D.; Muir Wood, D. Similitude relationships for physical modelling of monopile-supported offshore wind turbines. Int. J. Phys. Model. Geotech. 2011, 11, 58–68. [Google Scholar] [CrossRef]
  33. Xu, Y.; Nikitas, G.; Zhang, T.; Han, Q.; Chryssanthopoulos, M.; Bhattacharya, S.; Wang, Y. Support condition monitoring of offshore wind turbines using model updating techniques. Struct. Health Monit. 2019, 4, 1017–1031. [Google Scholar] [CrossRef]
  34. Darvishi-Alamouti, S.; Bahaari, M.; Moradi, M. Natural frequency of offshore wind turbines on rigid and flexible monopiles in cohesionless soils with linear stiffness distribution. Appl. Ocean Res. 2017, 68, 91–102. [Google Scholar] [CrossRef]
  35. Kooijman, H.J.T.; Lindenburg, C.; Winkelaar, D.; van der Hooft, E.L. DOWEC 6 MW PreDesign: Aeroelastic Modeling of the DOWEC 6 MW Predesign in PHATAS; Dutch Ministry of Economic Affairs: The Hague, The Netherlands, 2003. [Google Scholar]
  36. Bhattacharya, S.; Nikitas, N.; Garnsey, J.; Alexander, N.A.; Cox, J.; Lombardi, D.; Wood, D.M.; Nash, D.F.T. Observed dynamic soil-structure interaction in scale testing of offshore wind turbine foundations. Soil Dyn. Earthq. Eng. 2013, 54, 47–60. [Google Scholar] [CrossRef]
  37. Nicholson, J.C. Design of Wind Turbine Tower and Foundation Systems: Optimization Approach. Master’s Thesis, University of Iowa, Iowa City, IA, USA, 2011. [Google Scholar]
  38. Martín Del Campo, J.O.; Pozos Estrada, A.; Pozos Estrada, O. Development of fragility curves of land-based wind turbines with tuned mass dampers under cyclone and seismic loading. Wind Energy 2021, 24, 737–753. [Google Scholar] [CrossRef]
  39. Peeters, B.; De Roeck, G. Reference-based stochastic subspace identification for output-only modal analysis. Mech. Syst. Signal Process. 1999, 13, 855–878. [Google Scholar] [CrossRef]
  40. Hu, W.; Tang, D.; Wang, M.; Liu, J.; Li, Z.; Lu, W.; Teng, J.; Said, S.; Rohrmann, R.G. Resonance Monitoring of a Horizontal Wind Turbine by Strain-Based Automated Operational Modal Analysis. Energies 2020, 13, 579. [Google Scholar] [CrossRef]
  41. Aissa, M.H.; Amar Bouzid, D.; Bhattacharya, S. Monopile head stiffness for servicibility limit state calculations in assessing the natural frequency of offshore wind turbines. Int. J. Geotech. Eng. 2017, 12, 267–283. [Google Scholar] [CrossRef]
  42. Jureczko, M.; Pawlak, M.; Mężyk, A. Optimisation of wind turbine blades. J. Mater. Process Technol. 2005, 167, 463–471. [Google Scholar] [CrossRef]
  43. Cai, Y.; Dong, Q.; Wang, J.; Gu, C.; Xu, C. Measurement of small strain shear modulus of clean and natural sands in saturated condition using bender element test. Soil Dyn. Earthq. Eng. 2015, 76, 100–110. [Google Scholar] [CrossRef]
  44. Leblanc, C.; Houlsby, G.T.; Byrne, B.W. Response of stiff piles in sand to long-term cyclic lateral loading. Geotechnique 2010, 60, 79–90. [Google Scholar] [CrossRef]
Figure 1. Forcing frequencies plotted against the power spectral density of the NREL 5 MW wind turbine.
Energies 17 00112 g001
Figure 2. Flow chart of the test methods adopted in this study.
Energies 17 00112 g002
Figure 3. Designed and fabricated rotor. (a) designed 3D model; (b) fabricated ABS model.
Energies 17 00112 g003
Figure 4. Sketch of the test model. (a) rigid ground condition (FBC); (b) deformable ground conditions (MSCs).
Energies 17 00112 g004
Figure 5. Diagram of the wind tunnel test and sensor layouts.
Energies 17 00112 g005
Figure 6. Nacelle displacement under different operating and ground conditions. (a) STD; (b) AVG.
Energies 17 00112 g006
Figure 7. Tower top acceleration STD under different operating and ground conditions.
Energies 17 00112 g007
Figure 8. Tower base pile head bending moment under different operating and ground conditions. (a) STD; (b) AVG.
Energies 17 00112 g008
Figure 9. Procedure of modal parameter identification using the stochastic subspace method (case D1, R7). (a) the location of accelerometers; (b) the time histories of acceleration; (c) the diagram of frequency identification plotted via a power spectrum density; (d) the diagram of frequency and damping ratio identification plotted against the orders in a 3D view.
Energies 17 00112 g009
Figure 10. First-order F–A natural frequency (f) under different operating and ground conditions.
Energies 17 00112 g010
Figure 11. First-order F–A damping ratio ( ξ ) under different operating and ground conditions.
Energies 17 00112 g011
Figure 12. PSDs of 1P and 3P and the natural frequencies of the MWT under different ground conditions.
Energies 17 00112 g012
Figure 13. The variation in ξ against the D r under different operating conditions.
Energies 17 00112 g013
Table 1. Dimensionless numbers in this study.
Dimensionless GroupsPhysical Meanings
R rotor L tower , L tower L pile ,   H pile D pile Related to the rotor load, load eccentricity, and monopile slender ratio.
M top m tower Related to the mass distribution, frequency, and vibration mode of the MWT.
F MWT f 1 P ,   f MWT f 3 P Related to the relationships between the natural frequency and loading frequency under different operating conditions.
P G D pile 2 ,   M G D pile 3 Related to the soil strain field around pile under different ground conditions.
Table 2. Distributed blade properties [5].
NodeBlade Node Location (m)Twist Angle (°)Chord (m)Airfoil Type
12.86713.3083.542Cylinder1
28.33313.3084.167Cylinder2
311.75013.3084.557DU40_A17
415.85011.4804.652DU35_A17
524.0509.0114.249DU30_A17
628.1507.7954.007DU25_A17
736.3505.3613.502DU21_A17
844.5503.1253.010NACA64_A17
Table 3. Parameters of the sand used in this study.
Soil ParametersValue
Specific gravity, G s 2.62
Particle diameter (mm)0.25–0.50
Internal friction angle (degree)30
Maximum void ratio, e max 0.875
Minimum void ration, e min 0.606
Relative density, D r 20% (19.5%), 40% (38.9%), 60% (63.0%)
Table 4. Parameters of the test cases.
Ground ConditionValue
Deformable groundD1: D r = 20% (19.5%)R1: wind speed = 3 m/s and rotor speed = 302 rpm;
R2: wind speed = 4 m/s and rotor speed = 311 rpm;
R3: wind speed = 5 m/s and rotor speed = 330 rpm;
R4: wind speed = 6 m/s and rotor speed = 350 rpm;
R5: wind speed = 7 m/s and rotor speed = 372 rpm;
R6: wind speed = 8 m/s and rotor speed = 408 rpm;
R7: wind speed = 9 m/s and rotor speed = 451 rpm.
D2: D r   = 40% (38.9%)
D3: D r   = 60% (63.0%)
Rigid groundD0: fixed base
Table 5. Fitting parameters of ξ against D r .
Operating ConditionA (×10−2)BR2
R1−0.9691.5740.999
R2−1.2051.8800.942
R3−1.4192.0230.949
R4−1.8572.3940.958
R5−3.1853.2830.933
R6−3.7983.7570.915
R7−4.2114.0310.919
Disclaimer/Publisher’s Note: The statements, opinions and data contained in all publications are solely those of the individual author(s) and contributor(s) and not of MDPI and/or the editor(s). MDPI and/or the editor(s) disclaim responsibility for any injury to people or property resulting from any ideas, methods, instructions or products referred to in the content.

