Article

Impact of the Operation of Distribution Systems on the Resilience Assessment of Transmission Systems under Ice Disasters

1
State Grid Jilin Electric Power Co., Ltd., Changchun 130022, China
2
Department of Electrical Engineering, Northeast Electric Power University, Jilin 132012, China
3
State Grid Jilin Province Electric Research Institute, Changchun 130021, China
*
Author to whom correspondence should be addressed.
Energies 2023, 16(9), 3845; https://doi.org/10.3390/en16093845
Submission received: 23 March 2023 / Revised: 23 April 2023 / Accepted: 27 April 2023 / Published: 29 April 2023

Abstract

:
Ice disasters, such as ice storms, can cause serious damage to power systems. To understand ice disasters’ influences on power systems, this paper introduces a resilience evaluation frame for transmission and distribution systems during ice disasters. First, we built a vulnerability model for transmission and distribution systems under ice disaster weather. Then, we established an optimal load power shedding model for transmission and distribution systems. After this, according to the vulnerability model and the optimal power load power shedding model, we generated the fault scenario set of a system in the influence of an ice disaster. According to the curve of system resilience, we propose two resilience evaluation indices of transmission and distribution systems under ice disaster weather. Finally, we verified the efficacy and rationalization of the established resilience evaluation framework with an example in which a transmission and distribution system is coupled with a six-bus transmission system and two distribution systems. This study highlights the necessity of resilience assessment of transmission and distribution systems during ice disasters.

1. Introduction

Ice and snow disasters cause serious damage to power systems every year. For example, in November 2021, Northeast China suffered from ice disasters. Due to freezing rain, freezing snow, and strong wind disasters, the Heilongjiang power grid experienced equipment icing failure and pole disconnection. A total of 1500 kV line, 1220 kV line, 2766 kV lines, and 28,610 kV lines were suspended, involving 3766 kV substations, 11,152 outage stations, and 757,700 users. In the Changchun, Siping, Song-yuan, Baicheng, and Yanbian areas of the Jilin power grid, the damage included 2500 kV lines, 5220 kV lines, 1866 kV lines, 4266 kV substations, and 34,810 kV lines; in addition, 9903 stations experienced outages, and 469,392 users had their power cut off. Ice and snow disasters pose a risk of devastating impacts on transmission and distribution systems.
Considering this issue, the term “resilience” is used to describe the impact of devastating disasters that affects power systems and their resistibility and adaptability. An in-depth evaluation of resilience can provide a strong basis for studying and mitigating the influence of devastating disasters on power systems. Due to their serious impacts, it is vital to study the resilience of transmission and distribution systems under ice and snow disaster weather.
So far, most studies on resilience evaluation have focused on power transmission systems only. These studies are mainly concentrated in typhoons and earthquakes. For example, the resilience evaluation framework proposed in [1] introduces a combined enumeration method to generate various typhoon disasters and embeds a state enumeration method based on impact increments to improve the calculation speed of resilience evaluation indicators. Ref. [2] proposed a quantitative evaluation framework for transmission system resilience based on typhoon weather, in which they simulated the failure rate of the power system infrastructure using the finite element method and proposed a resilience evaluation index that considers both system performance and disaster characteristics. For earthquake disasters, ref. [3] proposed a probabilistic resilience evaluation method that integrates multiple risk measurement methods. Ref. [4] proposed a multi-temporal probabilistic resilience evaluation method and integrated power flow optimization model and a sequential Monte Carlo simulation method. Ref. [5] provided a quantitative resilience assessment framework that uses a cascading failure diagram of the transmission system. Ref. [6] proposed a method for evaluating resilience by adopting the non-sequential Monte Carlo simulation method and the Copland sorting method at ice disasters to judge the importance of transmission system components. In comparison, ref. [7] evaluated the transmission system resilience in devastating disasters using the sequential Monte Carlo simulation method. Ref. [8] constructed two resilience evaluation indicators from two levels of a whole transmission system and the evaluation of individual electrical components through resilience evaluation indicators before and after the disaster. Although these studies report insights into the resilience of power transmission systems under severe situations, there has been much less attention paid to ice disasters. For example, ref. [9,10] studied the effect of ice disasters using the unit division method for the resilience evaluation framework.
Moreover, there is room to improve the research on resilience evaluation for distribution systems. The main disaster scenario for the distribution system’s resilience is that of a typhoon. For example, ref. [11] proposes the framework for resilience by using the breadth-first search algorithm to divide the system into islands to calculate the load reduction of the corresponding islands. Ref. [12] designed a resilience evaluation framework for distribution systems based on a Monte Carlo simulation for typhoon disasters and evaluated resilience from the perspectives of robustness and rapidity. In contrast, there are far fewer studies on ice disasters. For example, ref. [13] built a probabilistic resilience evaluation framework to improve the resilience of distribution systems to ice disasters. It mainly showed the vulnerability model of trees to power system component faults during disasters.
From the perspective of disaster impact, ice disasters in recent years have caused great damage to the grid structures of transmission systems and distribution systems. However, most of the literature on the impact of ice disasters on power systems in recent years has only focused on one system. For example, ref. [9,10] only introduce the impact of ice disasters on transmission systems, but they do not introduce the impact of ice disasters on distribution systems. Ref. [13] only introduces the impact of ice disasters on distribution systems, but they do not introduce the impact of ice disasters on transmission systems. From the perspective of load recovery and resilience improvement, the installed capacity of distributed generation in distribution systems is increasing. The idea of coupling transmission systems and distribution systems and using distributed power supplies in distribution systems to provide power support for system power losses has been proposed in many studies, such as [14,15,16], but they do not link this idea with actual disaster scenarios.
Considering that ice disaster weather affects both transmission systems and distribution systems, and that the distributed power supply in a distribution system can provide power supply for the power loss of the transmission system and other distribution systems, this paper establishes a new evaluation frame aimed at considering the influence on the resilience of transmission and distribution systems under ice disaster weather. First, we established a vulnerability model of the system under ice and snow disaster weather. We then built a load-shedding model of the system. Then, according to the vulnerability and the load-shedding model of the system, we generated the fault scene set. According to the curve of power system resilience during devastating disasters, we further built two resilience evaluation indices for transmission and distribution systems under ice disaster weather. Finally, we verified the efficacy and rationalization of the proposed resilience evaluation framework of the system by using an improved transmission and distribution system as an example system. The resilience evaluation results can shed new and valuable insights toward selecting the proper measures to improve resilience.

2. Vulnerability Model of Transmission and Distribution Systems under Ice Disaster Weather

2.1. Ice Disaster Weather Data Acquisition

The influence process of an ice disaster on a power system is similar to that of a typhoon on a power system. Therefore, we adopted the model of a typhoon center and replaced it with an ice disaster center. As the position of the ice storm center changes, the wind speed and freezing rain imposed on the power line vary. Therefore, one can modify the model of the hurricane center to calculate the wind speed and freezing rain on the overhead line [17].
v i ( t ) = V R   max   ( t ) d ice ( t ) / R icemax ( t ) d ice ( t ) R icemax ( t ) V R   max   ( t ) R icemax ( t ) / d ice ( t ) 0.6 d ice ( t ) > R icemax ( t )
r i ( t ) = r R   max   ( t ) d ice ( t ) / R icemax ( t ) d ice ( t ) R icemax ( t ) r R   max   ( t ) R icemax ( t ) / d ice ( t ) 0.6 d ice ( t ) > R icemax ( t )
where vi(t) and ri(t) are the wind speed and freezing rain on the overhead line observation point i under t time, respectively; VRmax(t) and rRmax(t) are the wind speed and freezing rain on the disaster center position under t time, respectively; Ricemax(t) is the maximum influence distance of the disaster under t time; dice(t) is the geographical distance between the observation position and the storm center at time t.
Given that transmission lines often span multiple regions, meteorological data on different parts of the same line vary considerably. Hence, it is necessary to segment the transmission line, and the center of each segment is used as the center of the power line to calculate the wind speed and freezing rain at the segment. For the distribution line, be-cause its length is much smaller than the influence radius of the disaster center, we assumed that the speed of the wind and freezing rain of the same distribution system are the same, which is equal to the freezing rain and wind speed at the geographical location of the coupled transmission system bus.

2.2. Line Icing Growth Model

Under ice disaster weather, transmission lines and distribution lines are affected by freezing rain and strong winds for a long time, and icing begins to occur. At time t, the increase of icing thickness per unit length of power line i under the influence of freezing rain and strong wind is as given in [18]:
R eq i , t = T π ρ I ( r i , t ρ w ) 2 + ( 3.6 ν i , t W i , t ) 2
W i , t = 0.067 × r i , t 0.846
where Reqi,t and Wi,t are the ice thickness growth and content of water at the air of the power line, respectively, at observation point i under time t; T is the freezing rain time interval; ρI and ρw are the density of icing and freezing rain, respectively.
In ice disaster weather, over time, the total icing thickness of power lines i per kilometer at time t is
q i , t = 0 t R eq i , u d u
where qi,t is the ice thickness accumulation of the power line at observation point i under time t.

2.3. Line Ice Wind Load Model

According to the total icing amount and sustained wind speed at the overhead line at time t, one can calculate the ice force load and wind force load of the power line.
L I i , t = 9.8 × 10 3 ρ I π ( D i + q i , t ) q i , t
L W i , t = CS i v i , t 2 ( D i + 2 q i , t )
where LIi,t and LWi,t are the force load of ice and wind of the power line observation point i under time t, respectively; Di and Si are the wire diameter and crossover factor of observation point i of the power line, respectively. C is a constant with a value of 6.964 × 10⁻³.
Considering that the direction of the ice load and wind load of power lines in practical engineering is perpendicular to each other in space, the ice load and wind load applied to specific power lines are shown in Figure 1. Therefore, the ice wind load LWIi,t per unit length of the power line at time t is
L WI i , t = ( L I i , t ) 2 + ( L W i , t ) 2

2.4. Line Failure Rate Model

After calculating the ice wind force load of the overhead line affected by the ice storm, we calculated the abnormal operation probability of the overhead line per kilometer affected by the ice storm by setting the load threshold, that is,
P f i , t = 0 L WI i , t a WI exp [ 0.6931 ( L WI i , t a WI ) b W I a WI ] 1       a WI < L WI i , t < b WI 1 L WI i , t b WI
where Pfi,t is the line failure rate per kilometer of observation point i of the line under time t; aWI and bWI are the downward and upward threshold, respectively, of the ice wind load per kilometer line.
Considering that the abnormal operation probability of the icing overhead lines of any length and the abnormal operation probability of power lines per kilometer conform to the series probability model, the abnormal operation probability of overhead lines of any kilometer under ice disaster weather is
P i , t = 1 ( 1 P f i , t ) L i
where Li is the icing power line’s length of the overhead line sampling point i; Pi,t is the abnormal operation probability of the line length Li of the icing overhead line sampling point i under time t.
The fault caused by ice disaster weather to the power line is more complex, involving two factors of high-order fault and multi-type fault. This leads to the transient process of the power system involved, which is too complex. Therefore, in this study, we directly converted the fault line to the exit operation state and did not consider the dynamic process of the line from the fault to the line exit operation, but the dynamic process of a large-scale fault of a power system under the influence of extreme natural disasters such as ice disasters is very worthy of study.

3. Optimal Power Load-Shedding Model of Transmission and Distribution Systems

3.1. Optimization Objective

The optimization model’s task is to minimize all active power load shedding of the transmission and distribution systems. The specific calculation formula is:
min i N lt P Xt i + k N ds j N ld , k P Xd j , k
where Nds is the distribution systems’ quantity; Nlt is the load buses’ quantity in the transmission system; Nld,k is the load buses’ quantity in the kth distribution system; PXti is the ith load bus’s active power load shedding of the transmission system; PXdj,k is the jth load bus’s active power load shedding of the kth distribution system.

3.2. Transmission System Constraints

3.2.1. Power Balance Constraints at Buses

The transmission system should ensure a balance between the outflow power flow and the injection power flow of all buses during the ice disaster [19], that is,
C gt P tg + C lt ( P Xt P lt ) C td P dg = C t P t
C gt Q tg + C lt ( Q Xt Q lt ) C td Q dg = C t Q t
where Cgt, Clt, Ctd, and Ct are the correlation matrix of the transmission system bus-power supply bus, transmission system bus-load bus, transmission system bus-distribution system main network power supply, and transmission system bus-line, respectively. Ptg and Qtg represent the outflow active power vector and reactive power vector at the supply bus of the transmission system, respectively. PXt and QXt denote active and reactive power load-shedding vectors for load buses of the transmission system. Plt and Qlt are injection active and reactive power vectors at load buses. Pdg and Qdg represent the injection active and reactive power vectors of the main supply at distribution systems, respectively. Pt and Qt represent the active and reactive power flow vectors of transmission system lines.

3.2.2. Overhead Line Power Balance Constraints

Overhead line power balance constraints represent the relationship between line power flow, voltage amplitude at both ends of the line, and voltage phase angle, that is,
V t = V t 0 + d V t
P t = ( g t C t T d V t b t C t T θ t ) A l T z t
Q t = ( b t C t T d V t g t C t T θ t ) A l T z t
where Vt, Vt0, and dVt are the bus voltage amplitude vector under ice disaster weather, the bus voltage amplitude vector under normal weather, and the vector of the difference between the former and the latter. zt is the binary vector of the transmission system line state. gt and bt are the line conductance matrix and the line susceptance matrix of the transmission system, respectively. Al represents the bus vector of the transmission system. θt represents the vector of the bus voltage phase angle of the transmission system.

3.2.3. Branch Capacity Constraints

The line capacity constraint of a transmission system ensures that the power flow of the transmission line will change within an allowable range during an ice disaster, which is generally a nonlinear constraint condition, that is,
( P t ) 2 + ( Q t ) 2 ( S tmax z t ) 2
where Stmax is the upper peak matrix of the apparent power of the overhead line.
In order to linearly solve the load reduction model of the entire transmission system, it is necessary to linearize the line capacity constraints of the transmission system. As mentioned in [20], multiple square constraints can be used to approximate the nonlinear constraints to achieve the linearization of line capacity constraints, as shown in Figure 2.
The linearized transmission line capacity constraints are as follows.
S tmax z t P t S tmax z t
S tmax z t Q t S tmax z t
2 S tmax z t P t + Q t 2 S tmax z t
2 S tmax z t P t Q t 2 S tmax z t

3.2.4. Power Supply Bus-Related Constraints

The outflow power from the power supply buses needs to be within a specified range to guarantee the stability of the operation of the transmission system unit.
P tgmin P tg P tgmax
Q tgmin Q tg Q tgmax
where Ptgmin and Ptgmax are the minimum and the maximum vector of the outflow active power of the supply buses, respectively. Qtgmin and Qtgmax are the minimum and maximum vector of the outflow reactive power of the supply buses, respectively.

3.2.5. Load Shedding Constraints

The load shedding at the load buses of transmission systems also needs to be within the scope of the actual engineering situation, that is,
P Xtmin P Xt P Xtmax
Q Xtmin Q Xt Q Xtmax
where PXtmin and PXtmax are the lower and upper peak vector of the active power load shedding, respectively. QXtmin and QXtmax are the lower and upper peak vector of the reactive power load shedding, respectively.

3.2.6. Voltage Security Constraints

The bus voltage should have upper and lower limits to make the operation of the transmission system safe and stable.
V tmin V t V tmax
θ tmin θ t θ tmax
where Vtmin and Vtmax represent the lower and upper peak vectors of the bus voltage amplitude, respectively. θtmin and θtmax are the lower and upper peak vectors of the bus voltage phase angle, respectively.

3.3. Distribution System Constraints

3.3.1. Power Balance Constraints at Buses

Similar to the transmission system, the distribution system also needs to balance the output power and input power of each bus during the ice disaster [17], that is,
C dg P dg = C ld ( P dl P dX ) C ddg P ddg + C d ( P d + r d I d 2 )
C dg Q dg = C ld ( Q dl Q dX ) C ddg Q ddg + C d ( Q d + x d I d 2 )
where Pdg, Pdl, PdX, Pd, and Pddg are the outflow active power vector at the main power supply buses of the distribution systems, the injection active power vector at the load buses, the active power load shedding vector of the load buses, the active power flow vector of the distribution line, and the outflow active power vector of the distributed power source buses. Qdg, Qdl, QdX, Qd, and Qddg are the outflow reactive power vector of the main supply buses of the distribution systems, injection reactive power vector at load buses, reactive power load shedding vector, reactive power flow vector of the distribution line, and outflow reactive power vector at the distributed power source buses, respectively. Cdg, Cld, Cddg, and Cd are the correlation matrix of the distribution system bus-main network power supply bus, bus-load bus, bus-distributed power bus, and bus-distribution line, respectively. rd, xd, and Id are the distribution line resistance matrix, distribution line reactance matrix, and distribution line current vector, respectively.

3.3.2. Line Power Flow Balance Constraints

Similar to the line power flow balance constraint condition of the transmission system, the line power flow balance constraint condition of the distribution system mainly represents the relationship between line power flow and voltage amplitude at both ends of the line, that is,
C d T V d 0 V d = r d P d + x d Q d
where Vd0 is the initial bus voltage matrix of the distribution system.

3.3.3. Branch Capacity Constraints

The branch capacity constraints of the power distribution system are similar to that of the transmission system, i.e.,
S dmax z d P d S dmax z d
S dmax z d Q d S dmax z d
2 S dmax z d P d + Q d 2 S dmax z d
2 S dmax z d P d Q d 2 S dmax z d
where zd is the binary state vector of the distribution line; Sdmax is the upper peak matrix of apparent power flow at distribution lines.

3.3.4. Main Network Power Supply Bus Constraints

The related constraints of power buses in the main network restrict the power flow interaction between the transmission system and distribution system, i.e.,
P dgmax P dg P dgmax
Q dgmax Q dg Q dgmax
where Pdgmax and Qdgmax represent the upper limit vector of outflow active and reactive power at supply buses at the main network of the distribution system, respectively.

3.3.5. Voltage Security Constraint

The bus voltage amplitude must also be within the range of safe and stable system operation, that is,
U dmin U d U dmax
where Udmin and Udmax are the lower and upper peak vectors of buses’ voltage amplitudes, respectively.

3.3.6. Load Shedding Constraints

The load buses’ load shedding of the system also must be within the scope of the actual engineering situation, i.e.,
P dXmin P dX P dXmax
Q dXmin Q dX Q dXmax
where PdXmax and QdXmax are the upper limit vectors of active and reactive power for load buses of the distribution system, respectively. PdXmin and QdXmin are the lower limit vectors of active and reactive power lower limit vectors for load buses of the distribution system, respectively.

3.3.7. Constraints of Distributed Power Supply Output in Distribution Systems

The outflow power of distributed power supply of the distribution system needs to be limited to ensure that it conforms to the actual project situation, i.e.,
P ddgmin P ddg P ddgmax
Q ddgmin Q ddg Q ddgmax
where Pddgmin and Pddgmax are the smallest and largest value vectors of outflow active power of distributed power supply buses, respectively. Qddgmin and Qddgmax are the smallest and largest value vectors of outflow reactive power of distributed power supply buses, respectively.

4. Fault Scenario Generation Method Considering Vulnerability and System Load Shedding

4.1. Hybrid Sampling Method Adapted to the Change in Line Abnormal Operation Probability

According to the abnormal operation probability of each power line, we obtained the operation duration and repair duration of each transmission section line and distribution line according to the mixed sampling method adapted to the change in line failure rate. The specific calculation process is as follows [21]:
(1)
Combined with the ice storm weather data at time t, we calculated the failure rate Pj,t of power line j at time t.
(2)
We took a random number Wj,t from 0 to 1 that is uniformly distributed. If Pj,t is greater than or equal to Wj,t, it is considered that the power line j fails at time t, where t − 1 is the operation sustaining time trunj of the overhead line j, and the repair sustaining time of the power line j is calculated according to Equation (42):
t repair j = t m ln γ
where tm is the average repair time; the repair time trepairj of line j is set from 0.5 times to 2 times the average repair time; γ is a random number from 0 to 1 satisfying uniform distribution.
(1)
If Pj,t is less than Wj,t, it is considered that the power line j does not fail at time t; in this case, all normal power lines at time t are traversed, and let t = t + 1 after traversing all the normal lines until the ice disaster no longer affects the power system.
Because the transmission line is segmented, it is necessary to use the operation sustaining times and repair sustaining times of all transmission segment lines to calculate the operation sustaining time and repair sustaining time of the entire system line. The transmission system line i is divided into m segments, that is,
t run i = min t run i 1 , t run i 2 , , t run i k , , t run i m
t repair i   = max t repair i 1 , t repair i 2 , , t repair i k , , t repair i m
where trunim is the operation sustaining time of the mth segment of transmission system line i; trepairim is the repair sustaining time of the mth segment of transmission line i.

4.2. Fault Scenario Generation Method for Transmission and Distribution System Considering Maintenance Resupply Constraints

Next, it is necessary to arrange the repair sequence of each fault transmission line and distribution line to achieve less load power loss. Here, we assumed that the repaired line will not fail again; thus, the state of the line has only two directions of change. The first is that it will enter the waiting-for-repair state after the normal state fails, then enter the repair state, and enter the repair completion state after the repair is completed. The second is from the beginning of the ice disaster until the end of the repair work has been in normal condition. For power lines in ice disaster weather, most of the lines will be in the first direction of change; thus, there will inevitably be multiple lines waiting for repair. If the number of lines waiting for repair is more than the number that can be resupplied via maintenance, it is necessary to select the priority line to repair among all of the waiting lines. The benchmark for selecting the priority repair line is the minimum load shedding after the repair of the waiting line. The specific fault scenario generation method of the transmission and distribution system is shown in Figure 3.
The specific steps of the transmission and distribution system fault line maintenance strategy considering maintenance resource constraints are as follows. First, initialize the time t, and compare the operation duration trun and time t of all normal lines. If the time t is greater than the operation duration trun,i of the normal line i, the normal line i fails at time t. At the same time, for all lines under maintenance, judge whether the time t is greater than the start maintenance time tstart,j of the line j under maintenance plus the repair duration trepair,j of the line j under maintenance. If the condition is met, then the line j under repair is repaired at time t. Then, according to the rule minimizing system load reduction after fault recovery, the fault line with the number of remaining maintenance resources is selected for repair, and the starting repair time of the selected fault line k is tstart,k = t. Then, under the judgment time t, whether all the fault lines are repaired and the time t is greater than the duration of the ice disaster, if the judgment condition is satisfied, the cycle is withdrawn, and the fault scene set of the power system under the influence of the ice disaster weather can be obtained. If the condition is not satisfied, let the time t = t + 1 until the judgment condition is satisfied.

5. Resilience Evaluation Framework of Transmission and Distribution Systems under Ice Disaster Weather

Considering that the system resilience change in the transmission system and distribution system should be evaluated under ice disaster weather such as ice storms, the system resilience change curve of the system affected by devastating disasters is generally described in [22], as shown in Figure 4.
The vertical axis of Figure 4 represents the power system performance function. From the system operation level, it represents the system load power. From the infrastructure level, it can also represent the total quantity of lines in a working state. From t0 to t1, it belongs to the system performance collapse period. At this time, the impact of the disaster is more serious, resulting in a faster decline of system performance than its recovery rate. From t1 to t2, it belongs to the system performance adaptation period. During this period, the impact of the disaster is less than t0 to t1, and the system performance’s decline rate is equal to its recovery speed. From t2 to t3, it is the system performance recovery period. During this period, the disaster’s impact is lighter than the previous two stages; the disaster may even no longer affect the power system. The system performance recovery speed is greater than the decline speed until the system returns to normal work.
According to the performance function curve under devastating disasters (Figure 3), we propose two resilience evaluation indices, one each on the infrastructure level and the system operation level, to describe the resilience change in transmission and distribution systems under the influence of ice disaster weather.
The resilience assessment index of infrastructure (RI) is the total quantity of normal operating lines of the transmission system or distribution system in each period under the influence of the entire ice disaster event divided by the sum of the number of lines in each period. The specific formula is:
R I = t T N zc , t + N ro , t T N
where Nzc,t and Nro,t are the quantity of all normal lines and the quantity of repaired lines of the transmission system or distribution system under time t, respectively. T is the total time from the start of the disaster to the safe operation of all transmission and distribution lines.
The resilience assessment index of operation (RO) is the load power loss of the transmission and distribution system under the influence of the whole ice disaster event divided by the load power of transmission and distribution system during this period, which is equal to the ratio of SABCD and SAEFD in Figure 4.
R O = 1 S ABCD S AEFD
where SABCD represents the load loss in the system under devastating disasters; SAEFD represents the active power load of the power system under devastating disasters.
We established a resilience evaluation framework in the influence of the disaster, according to the proposed vulnerability model, optimal load shedding model, fault scenario generation method, and two resilience evaluation indices for transmission and distribution systems. The specific framework is illustrated in Figure 5.
The specific steps of the resilience assessment framework for transmission and distribution systems under the influence of ice disaster weather are as follows. First, according to the ice disaster weather data observed by the power observation point of the power line, the ice wind load change in the transmission and distribution lines can be calculated, and then, the failure rate change in the transmission and distribution lines can be obtained. Then, according to the change in the failure rate of the transmission and distribution lines, the hybrid sampling method considering the change in failure rates is used to generate the operation duration and repair duration of each transmission and distribution line. Next, the fault line repair strategy considering the limitation of maintenance resources is used to generate the fault scenario set of the transmission and distribution systems under the influence of ice disaster weather. Then, the combination of the fault scenario set of the transmission and distribution systems and the optimal load shedding model of the transmission and distribution systems mentioned previously can obtain the change in the load reduction of the transmission and distribution systems under the influence of ice disaster weather. Finally, the proposed infrastructure resilience evaluation index and system operation resilience evaluation index are calculated according to the fault scenario set and load reduction change in the transmission and distribution systems.

6. Case Study

6.1. An Example of Transmission and Distribution Systems under the Influence of Ice Disaster Weather

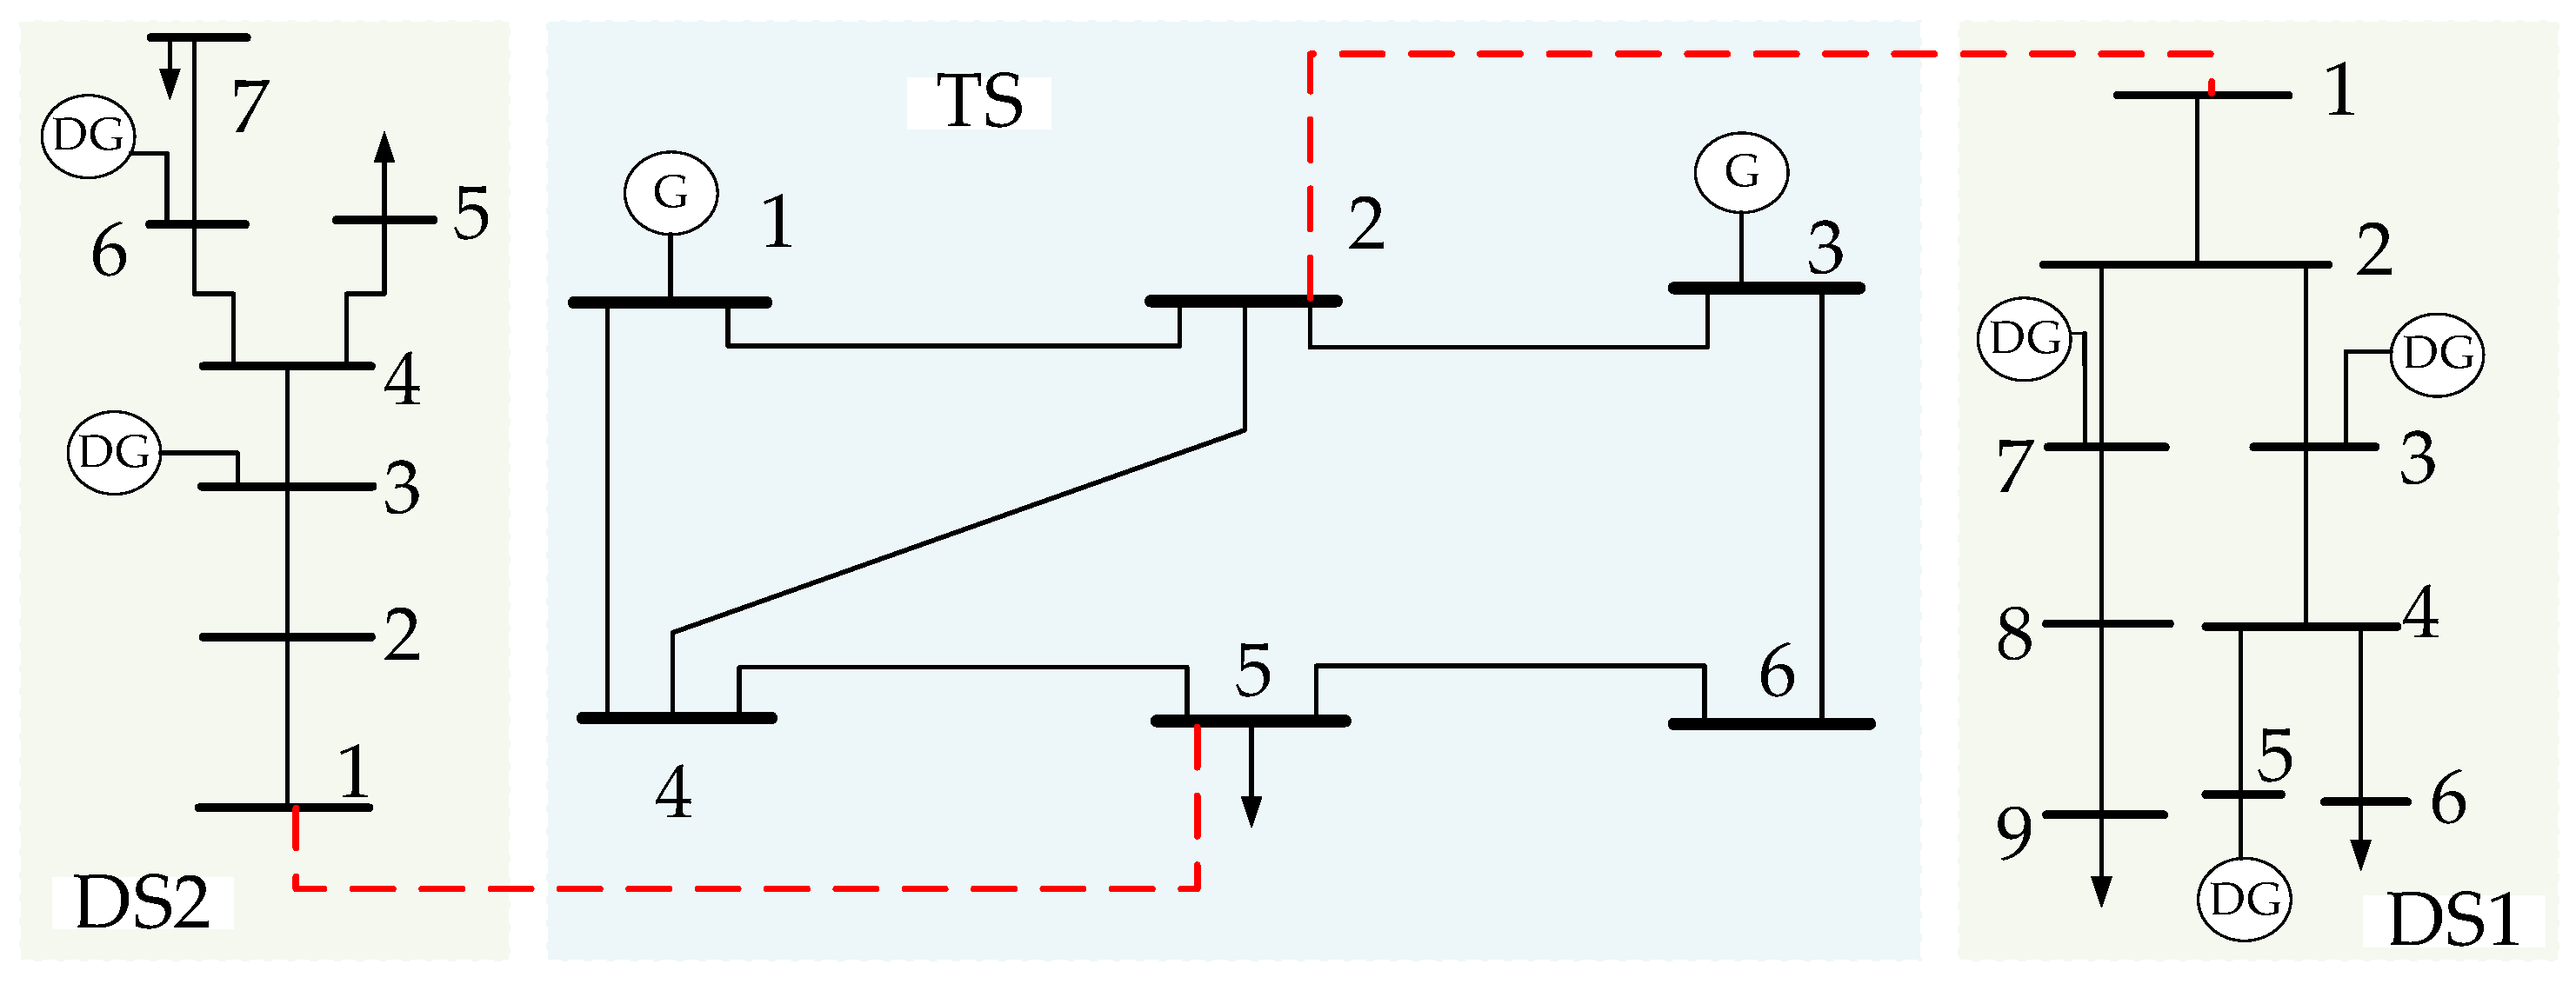
To verify that the built transmission and distribution system resilience evaluation frame can reasonably evaluate the resilience of transmission and distribution systems under ice disaster weather, we used an example system in which a transmission and distribution system is coupled by a modified six-bus transmission system and two distribution systems [15]. The specific transmission and distribution system topology is shown in Figure 6.
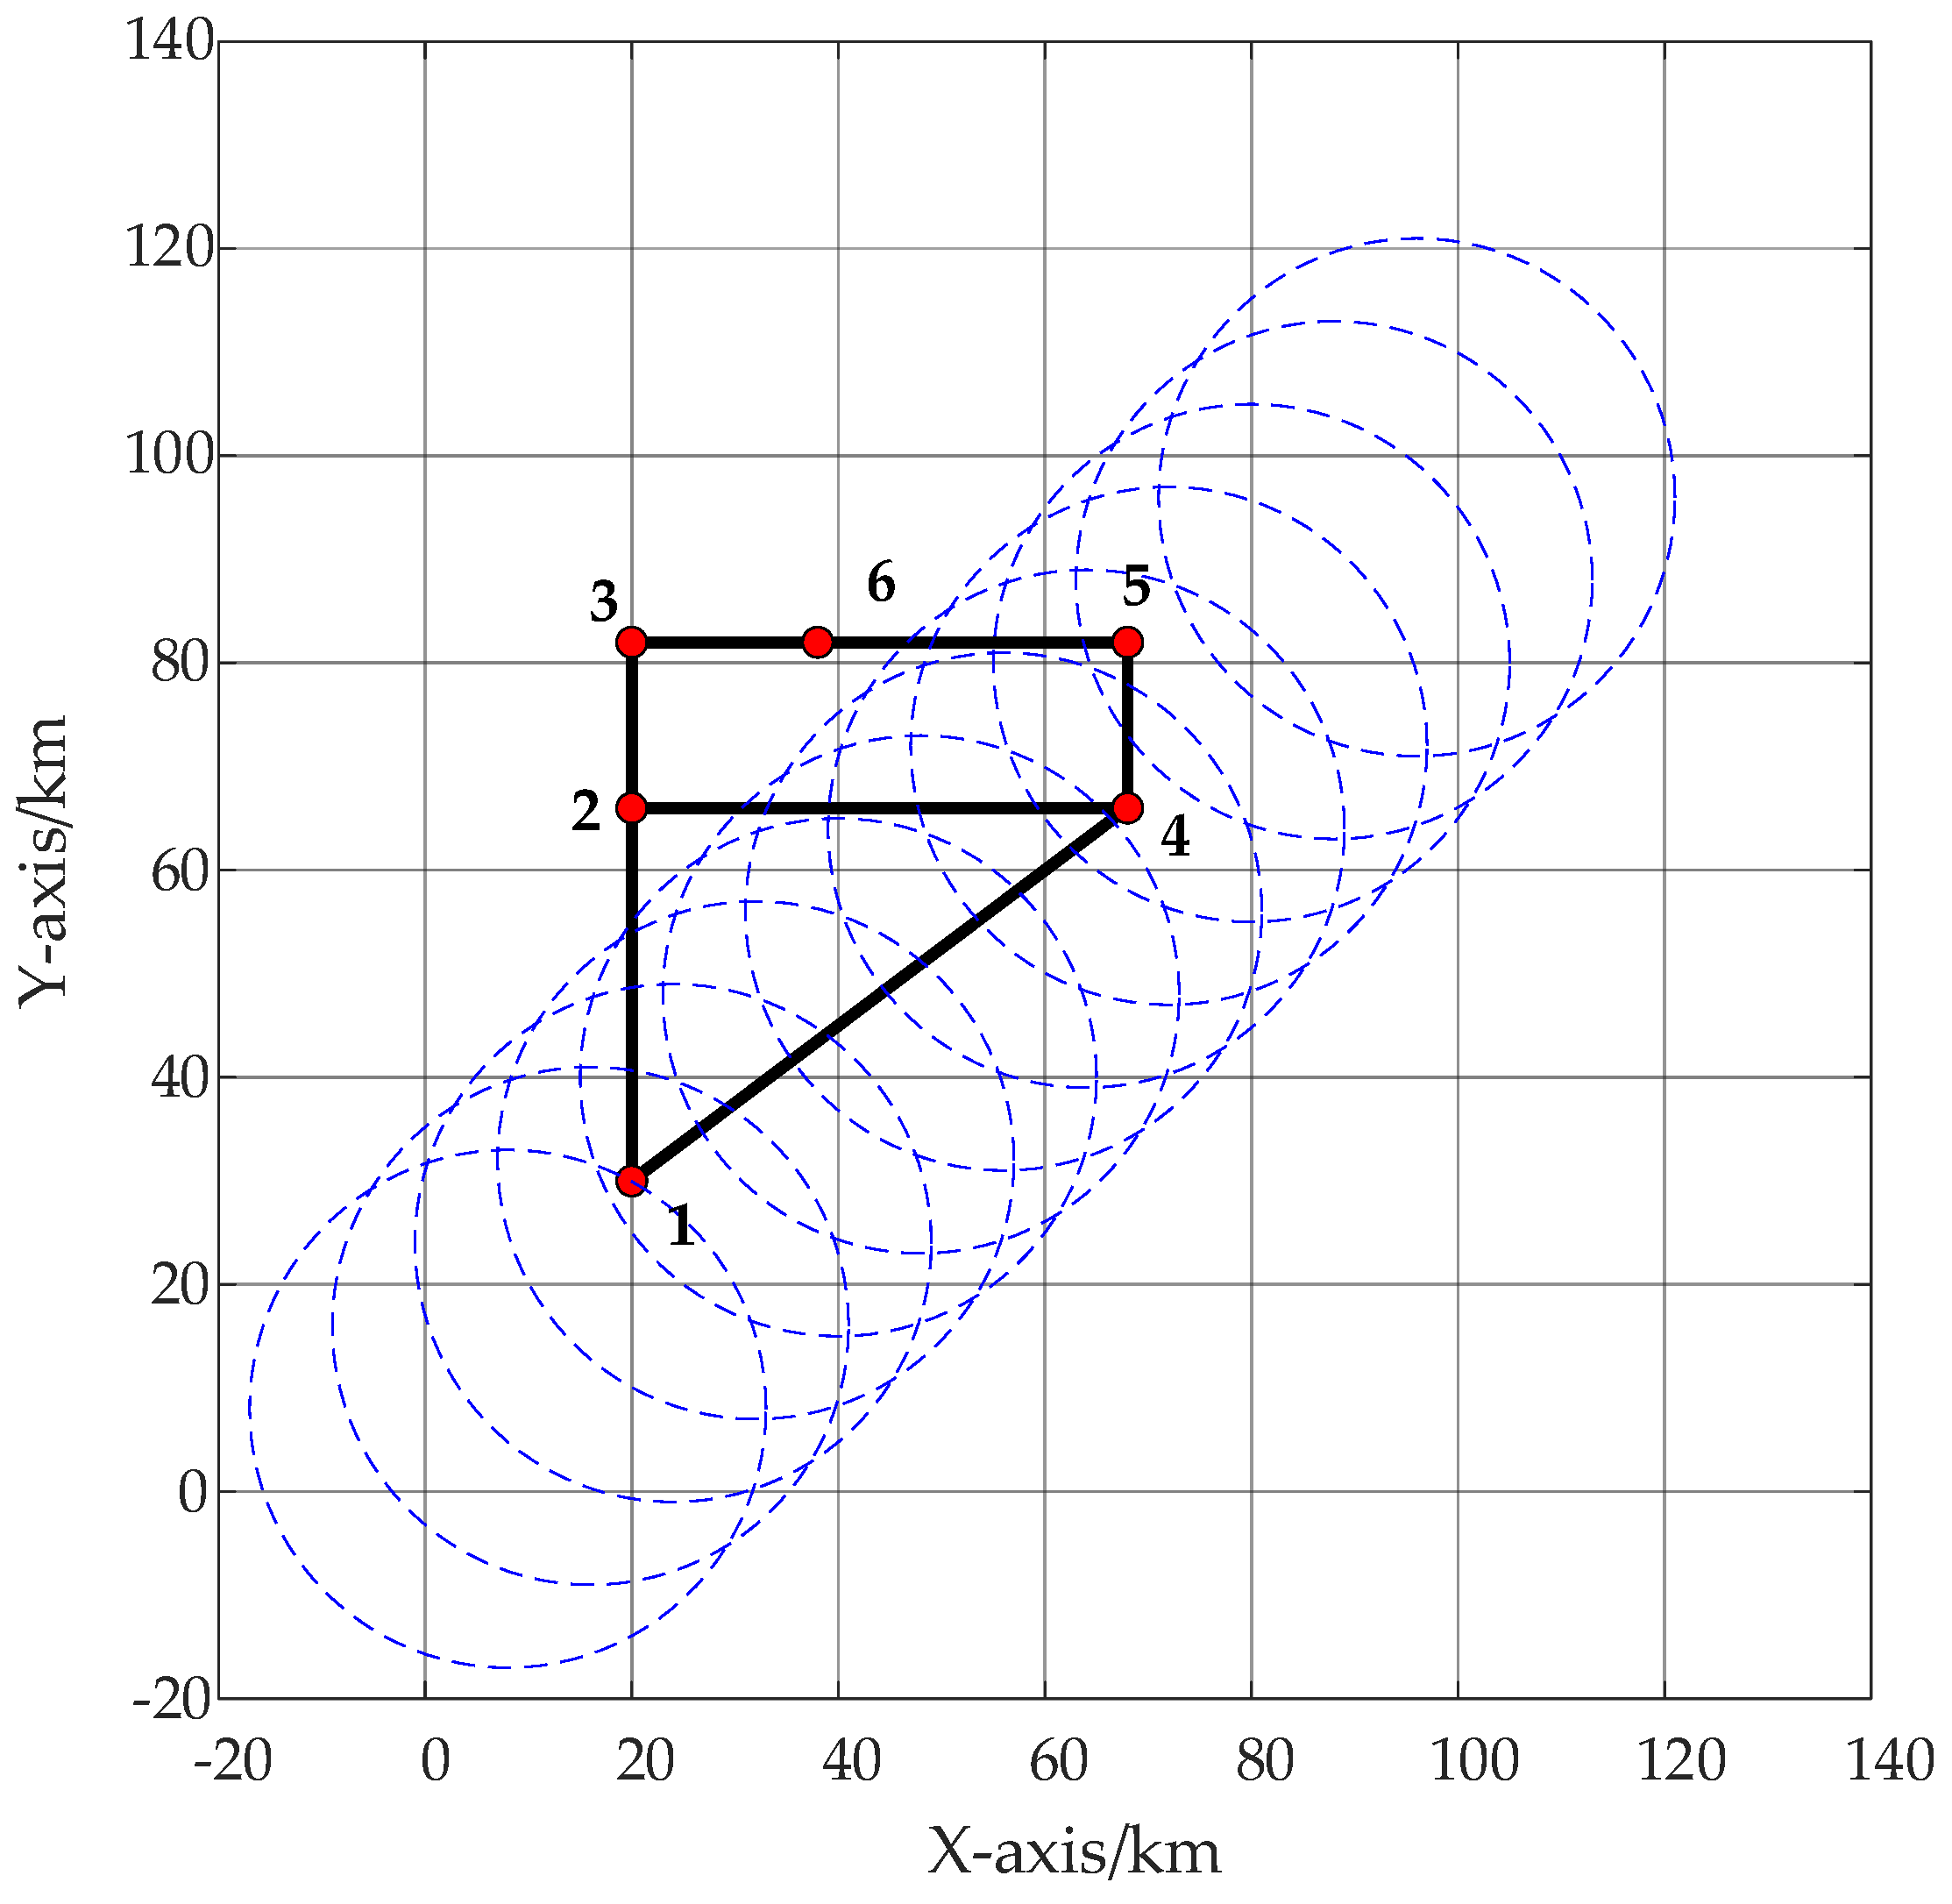
We assumed that the initial position of the disaster center is (0 km, 0 km), that the moving speed is 1 km/15 min, the moving direction is 45° northeast, and that the duration of the disaster is 48 h. The geographical location map of the transmission system influenced by the disaster was obtained (Figure 7).

6.2. Influence of Distributed Power Sources’ Output from the Distribution System on Resilience Improvement

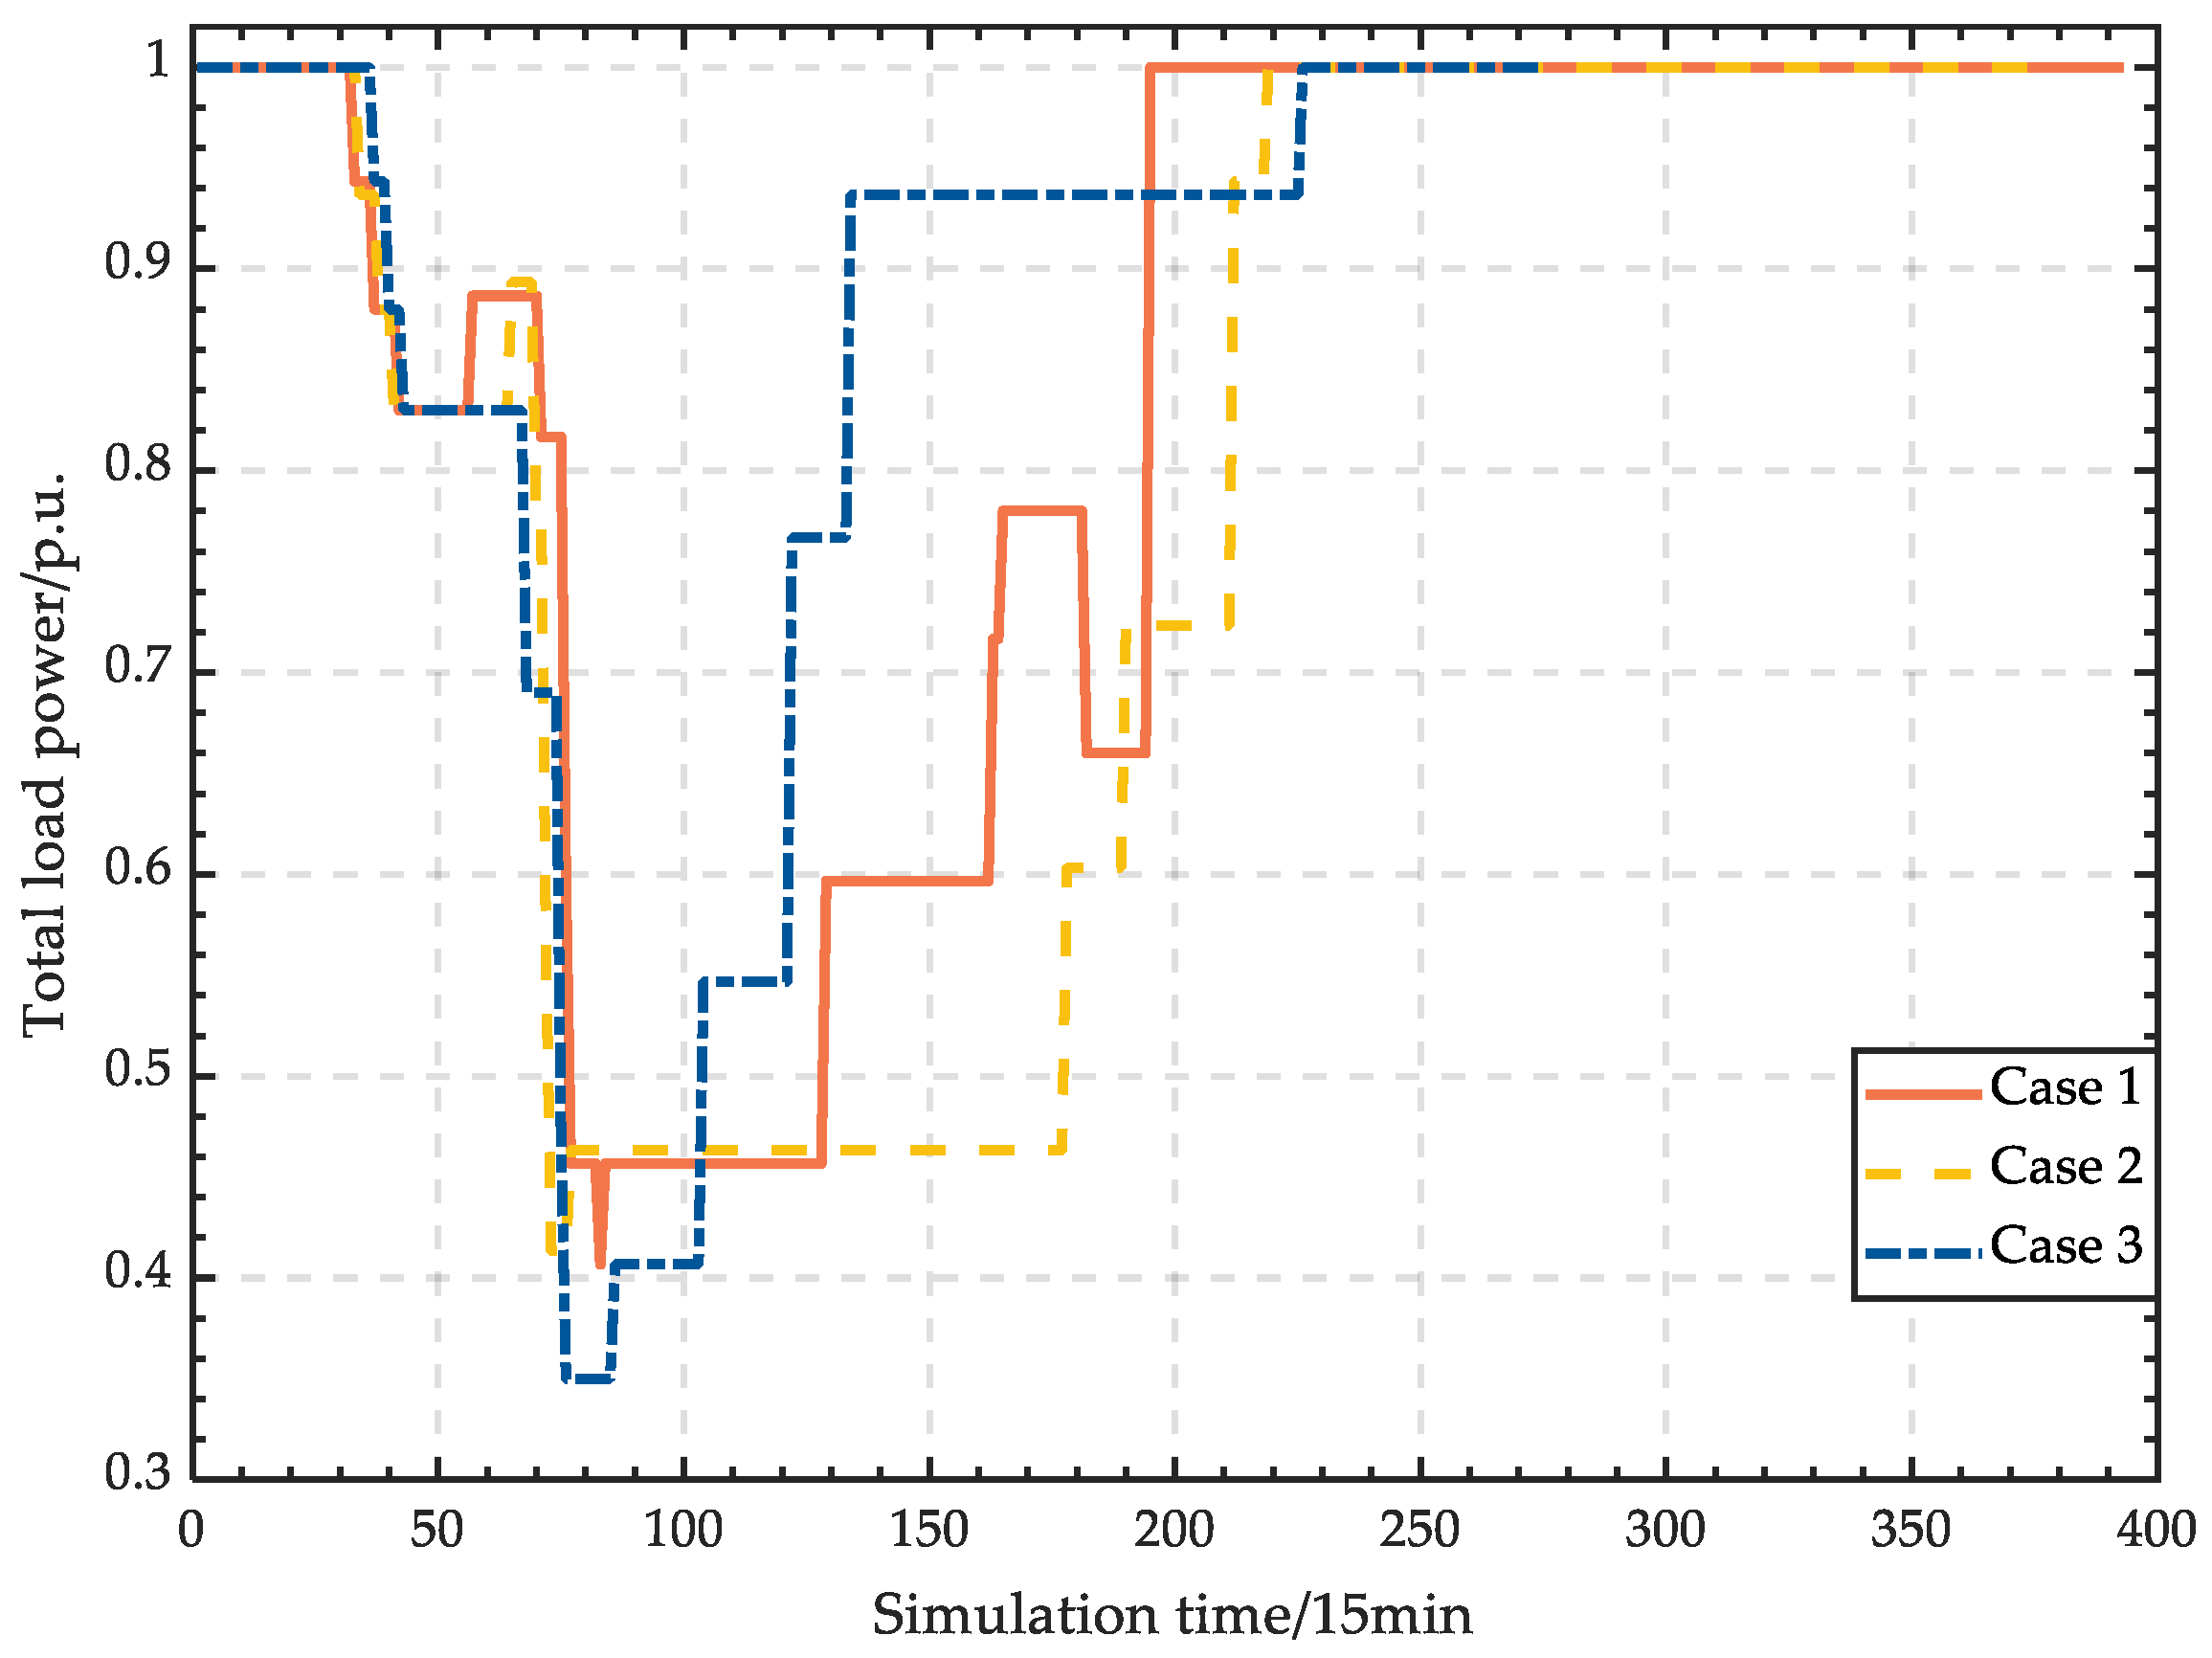
To verify the impact of distributed power sources’ output from the distribution system on resilience improvement, we designed a specific example scenario whose settings are:
Case 1: The upper peak of outflow power of distributed generation buses in the distribution systems is 1 MW.
Case 2: The upper peak of outflow power of distributed generation buses in the distribution systems is 0.3 MW.
Case 3: The upper peak of outflow power of distributed generation buses in the distribution systems is 0 MW.
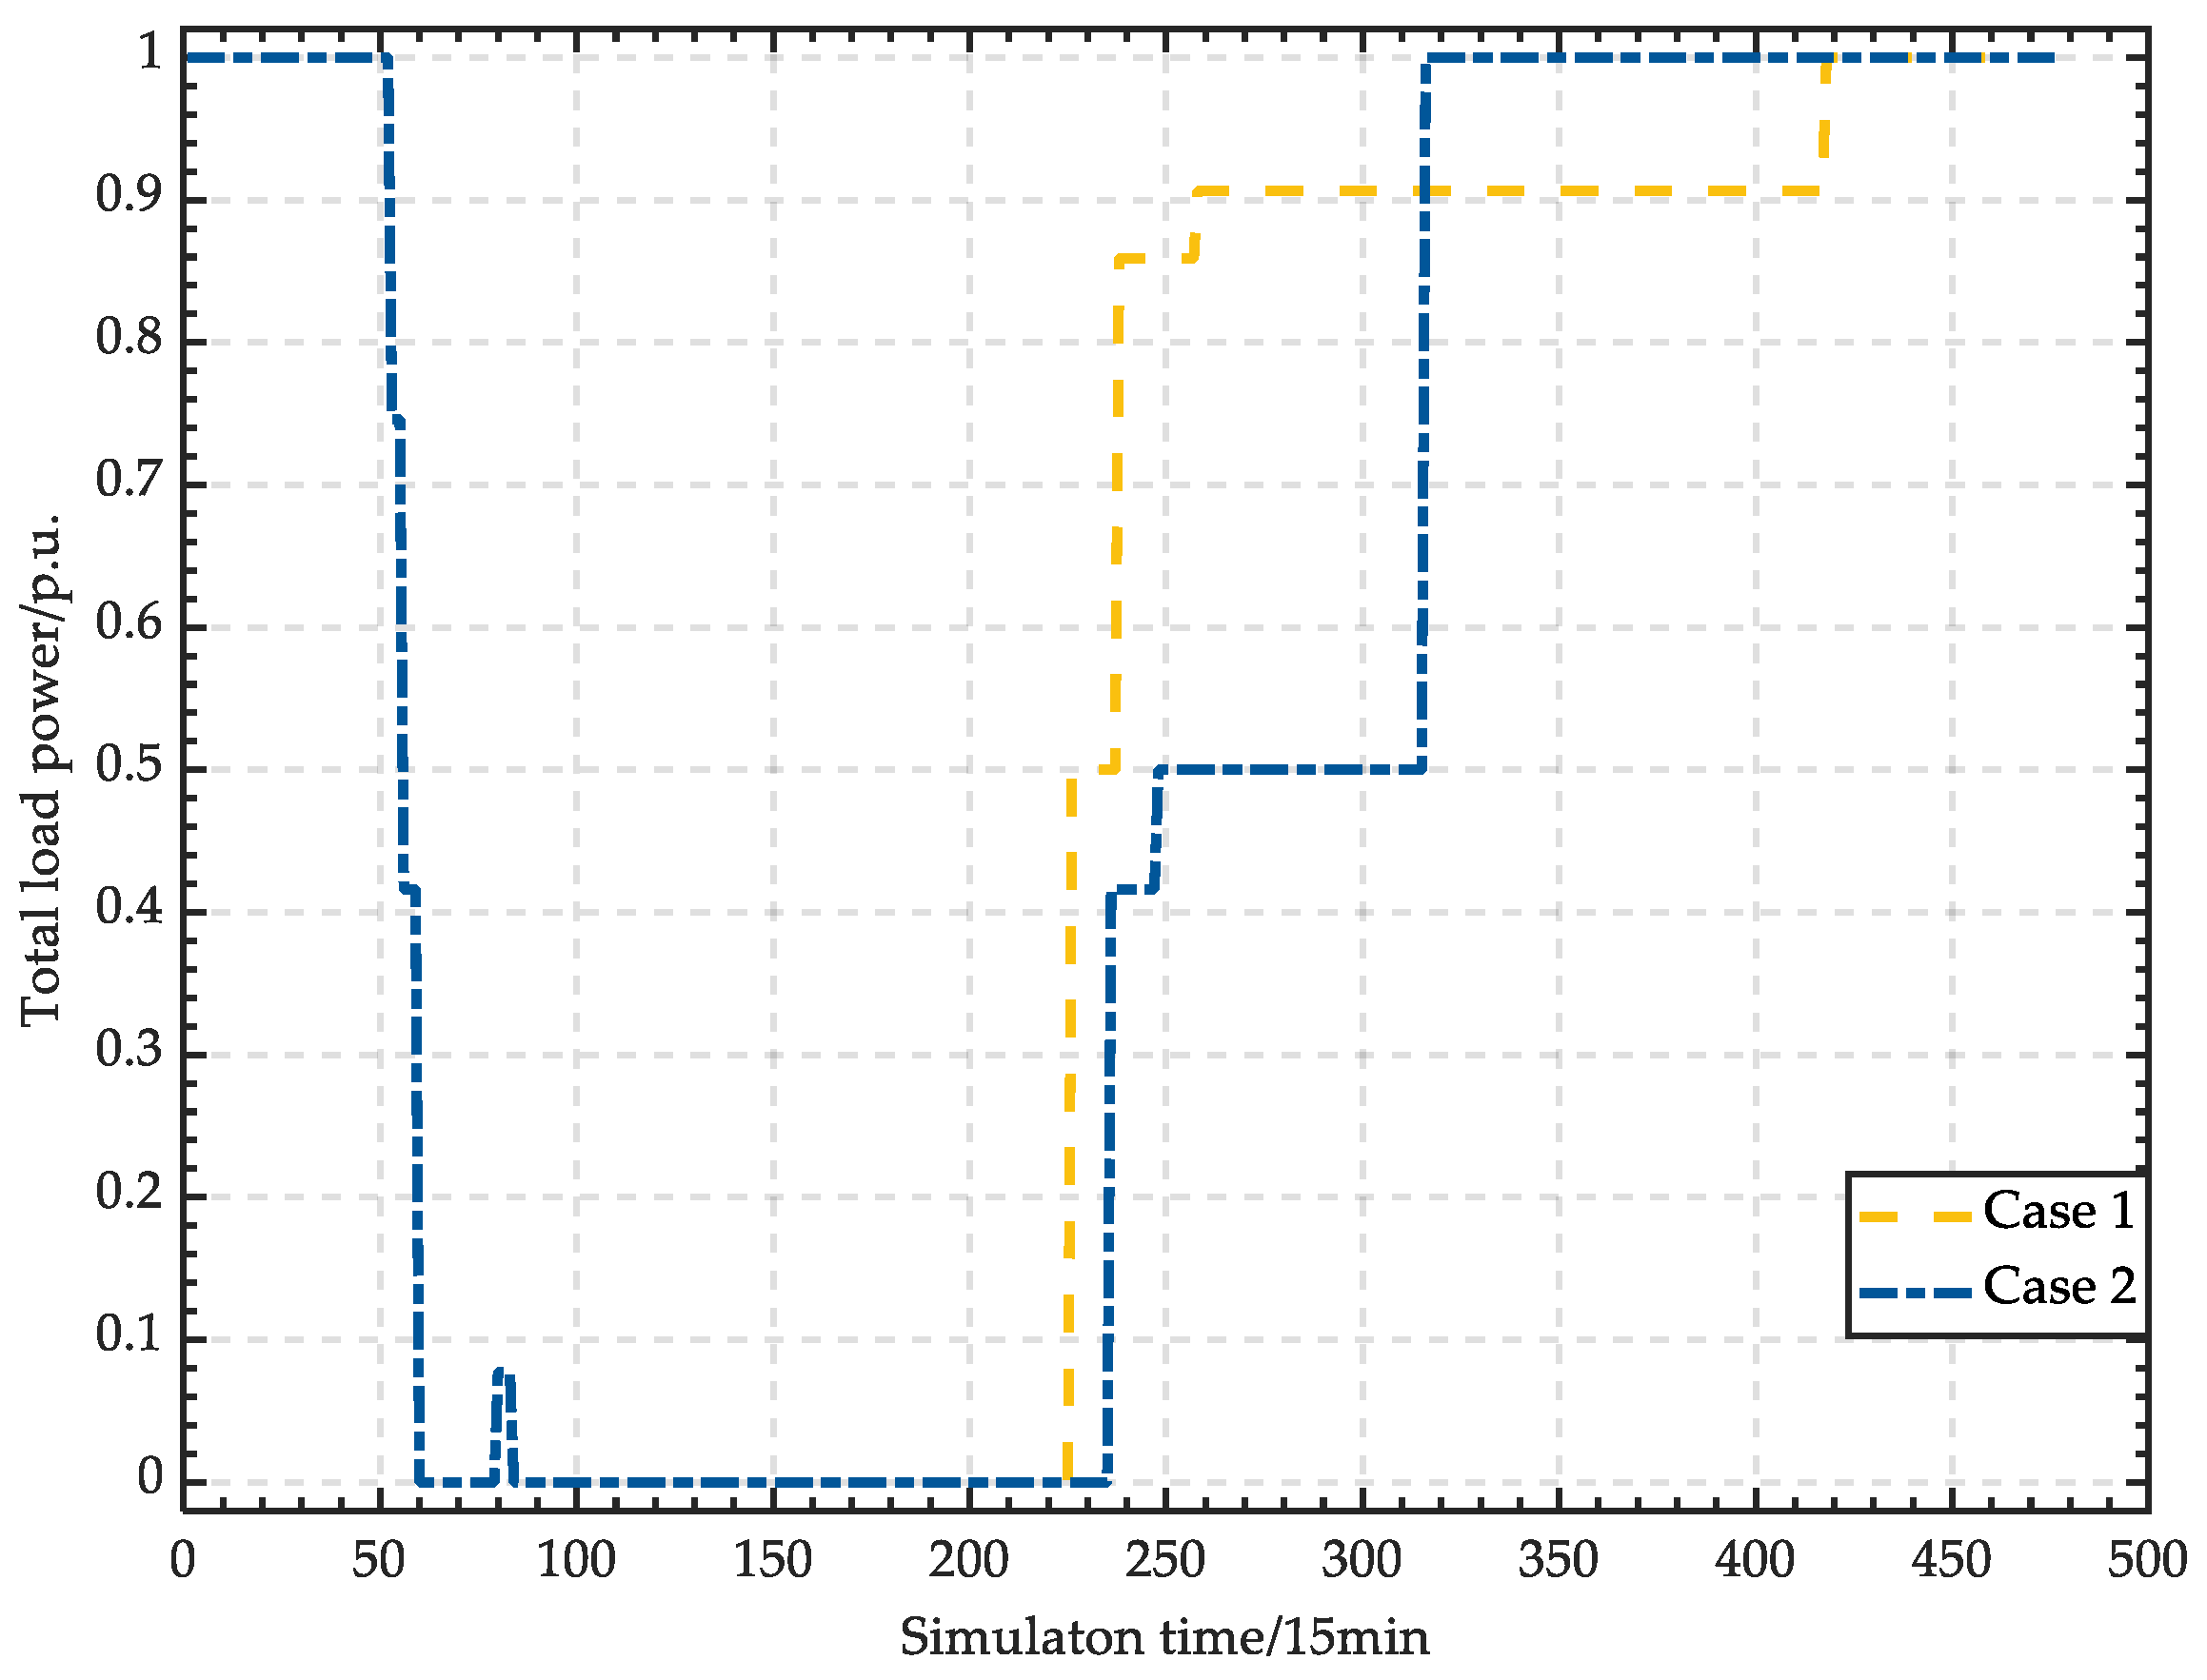
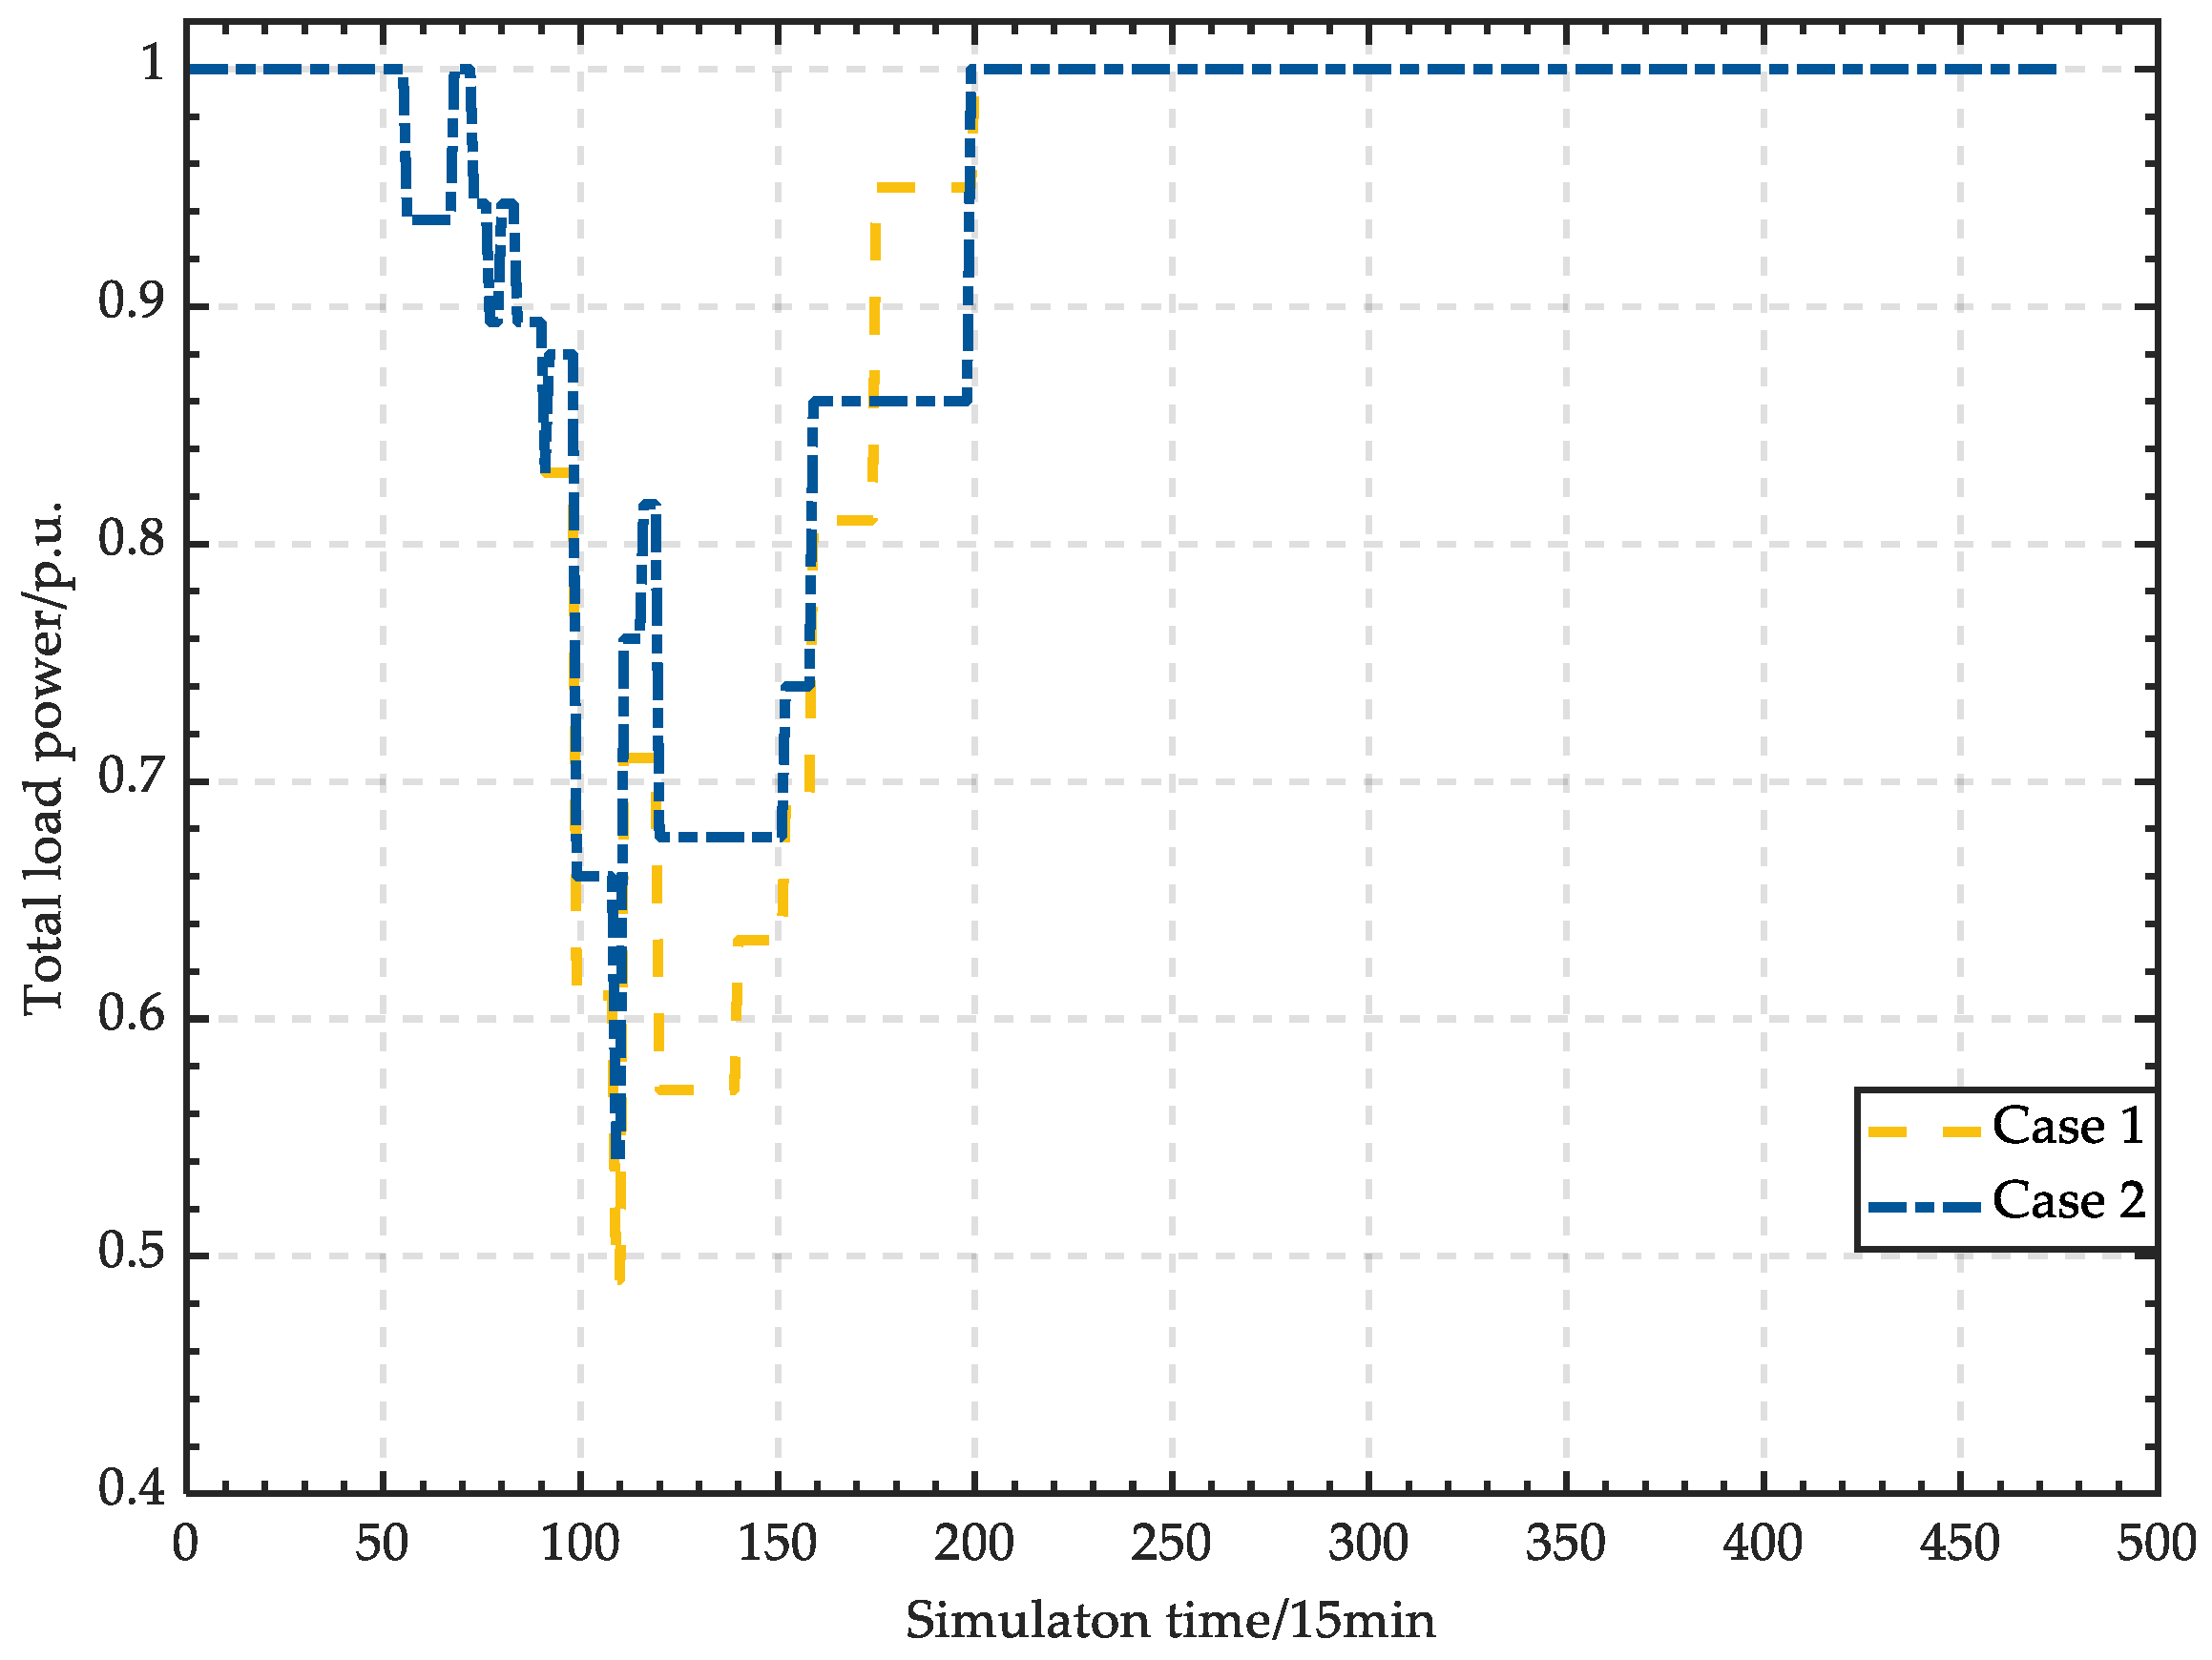
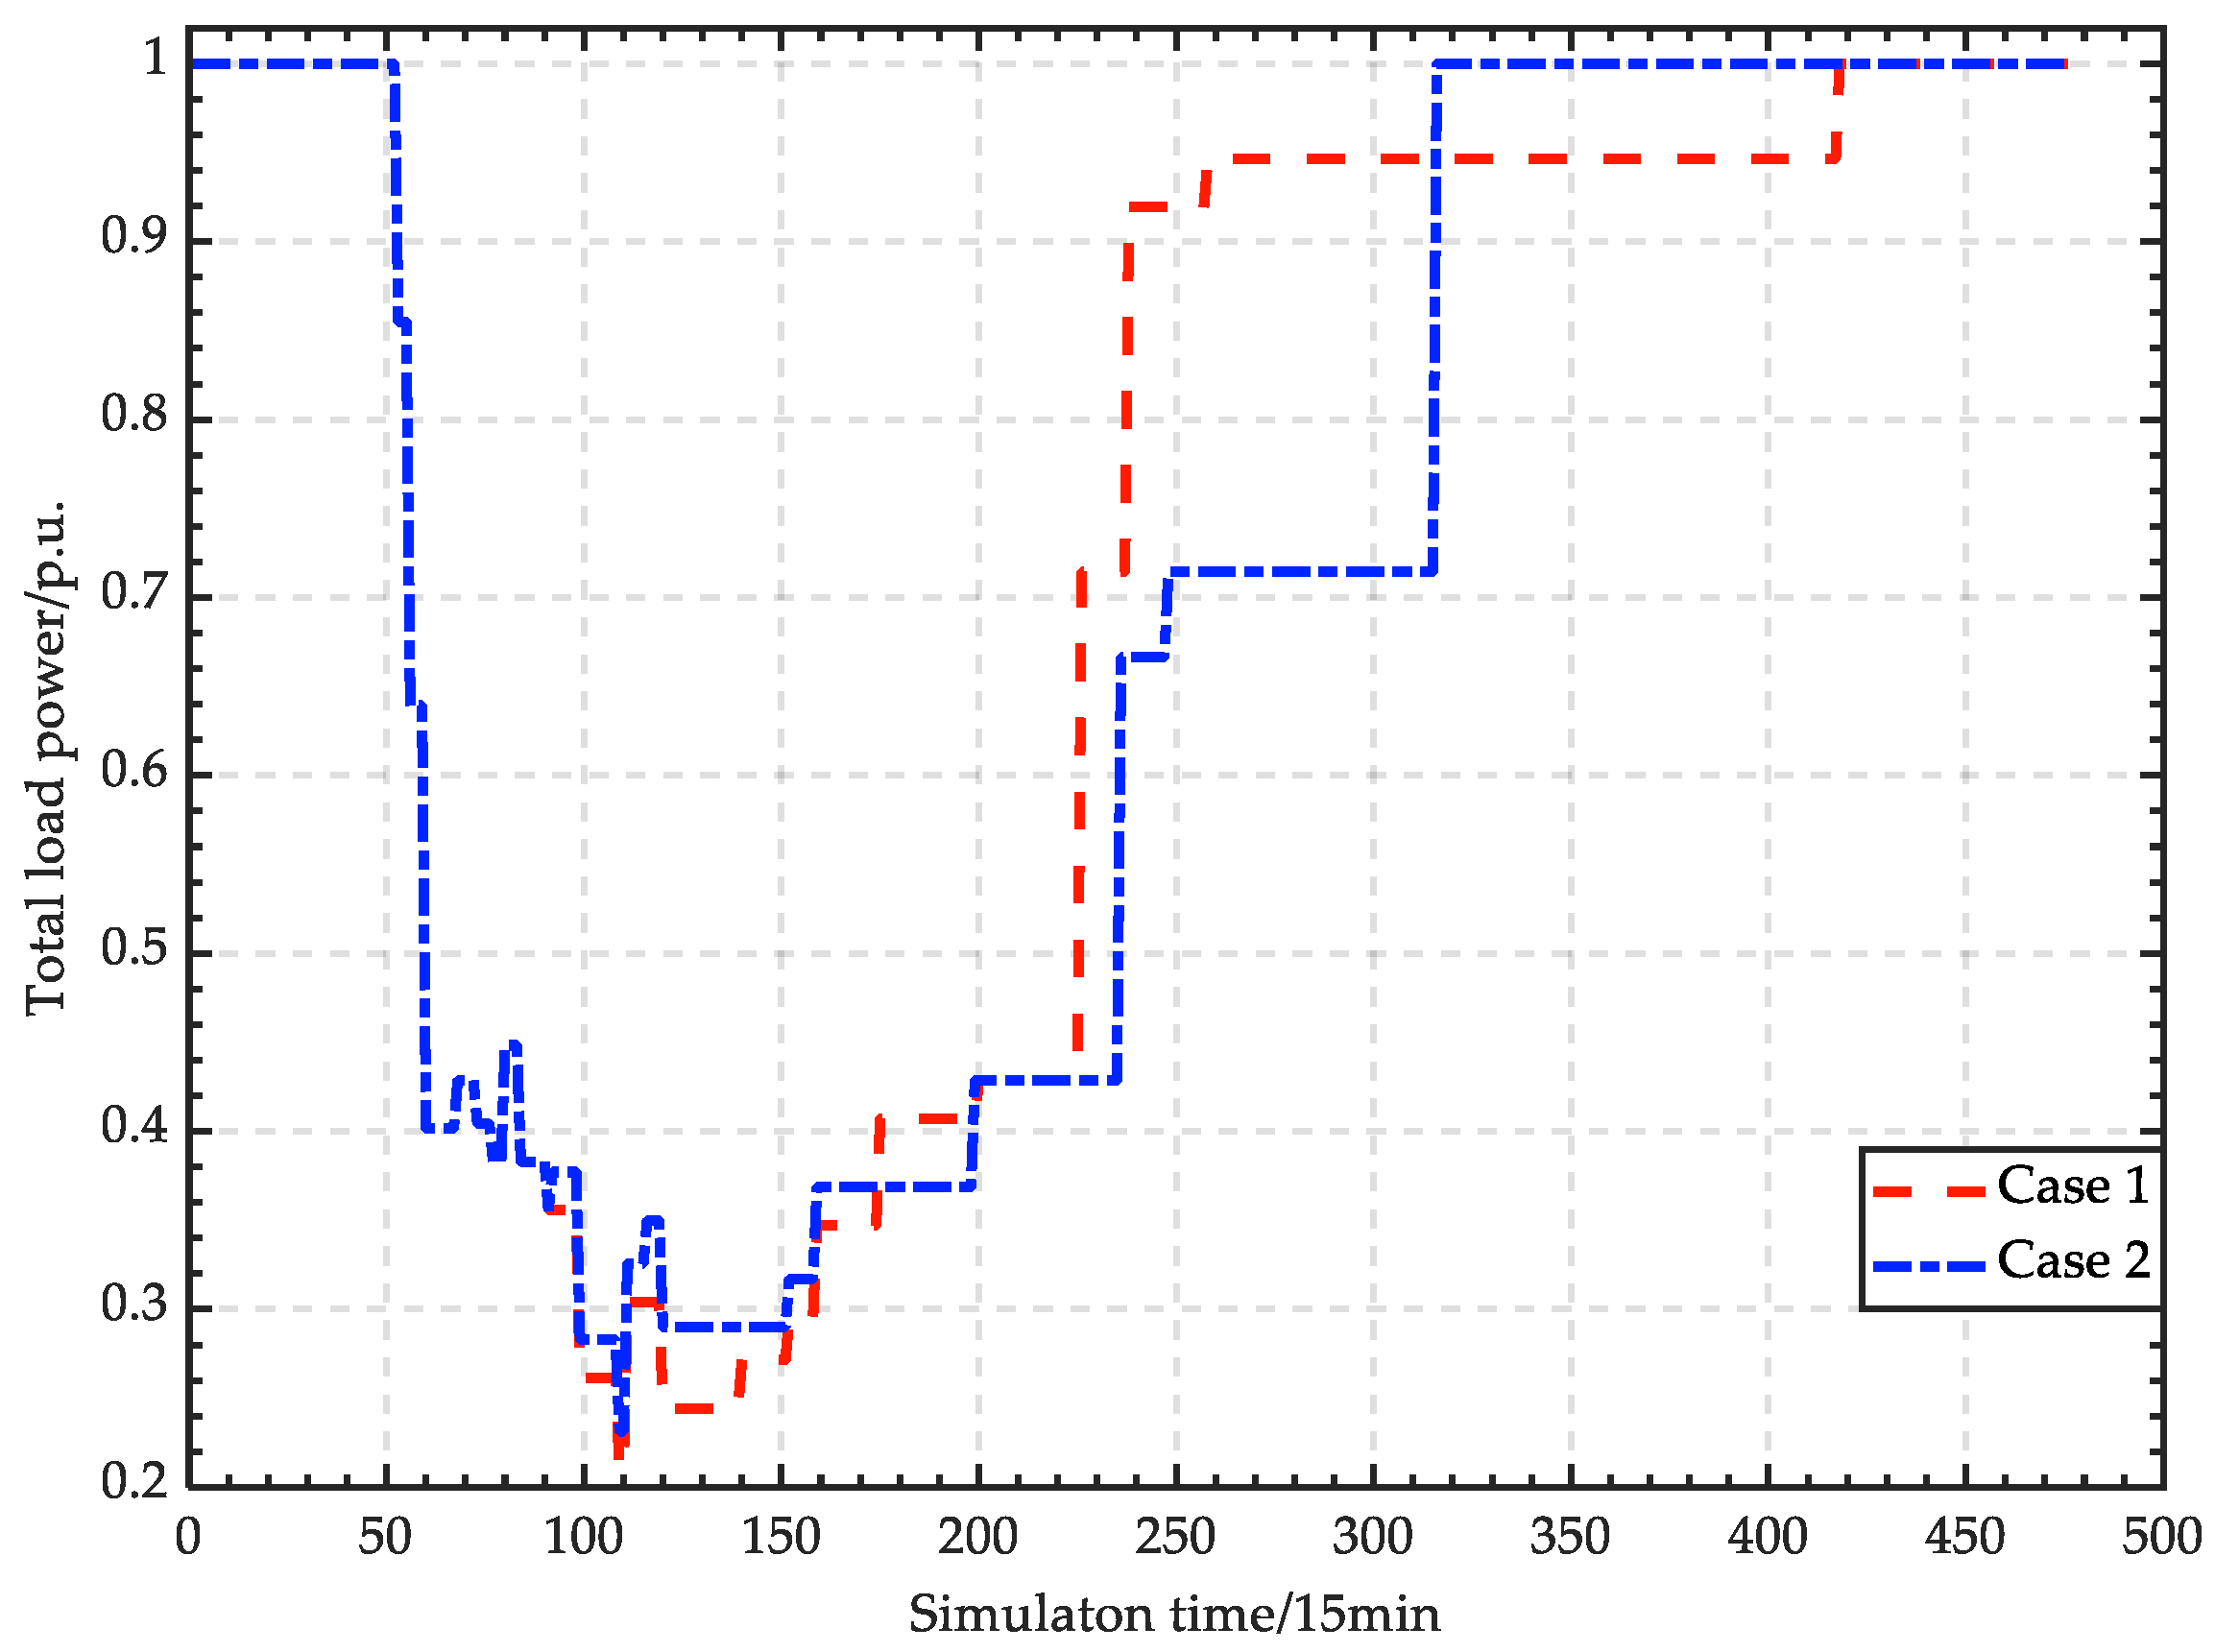
Using these settings and the proposed resilience evaluation framework, we obtained the load reduction changes of transmission and distribution systems under three example scenarios (Figure 8 and Figure 9).
As the power upper peak of the distributed generation decreased, load shedding of the whole system became more and more serious (Figure 8 and Figure 9). Increasing the outflow power’s upper peak in distributed generation reduced the load shedding caused by devastating disasters.
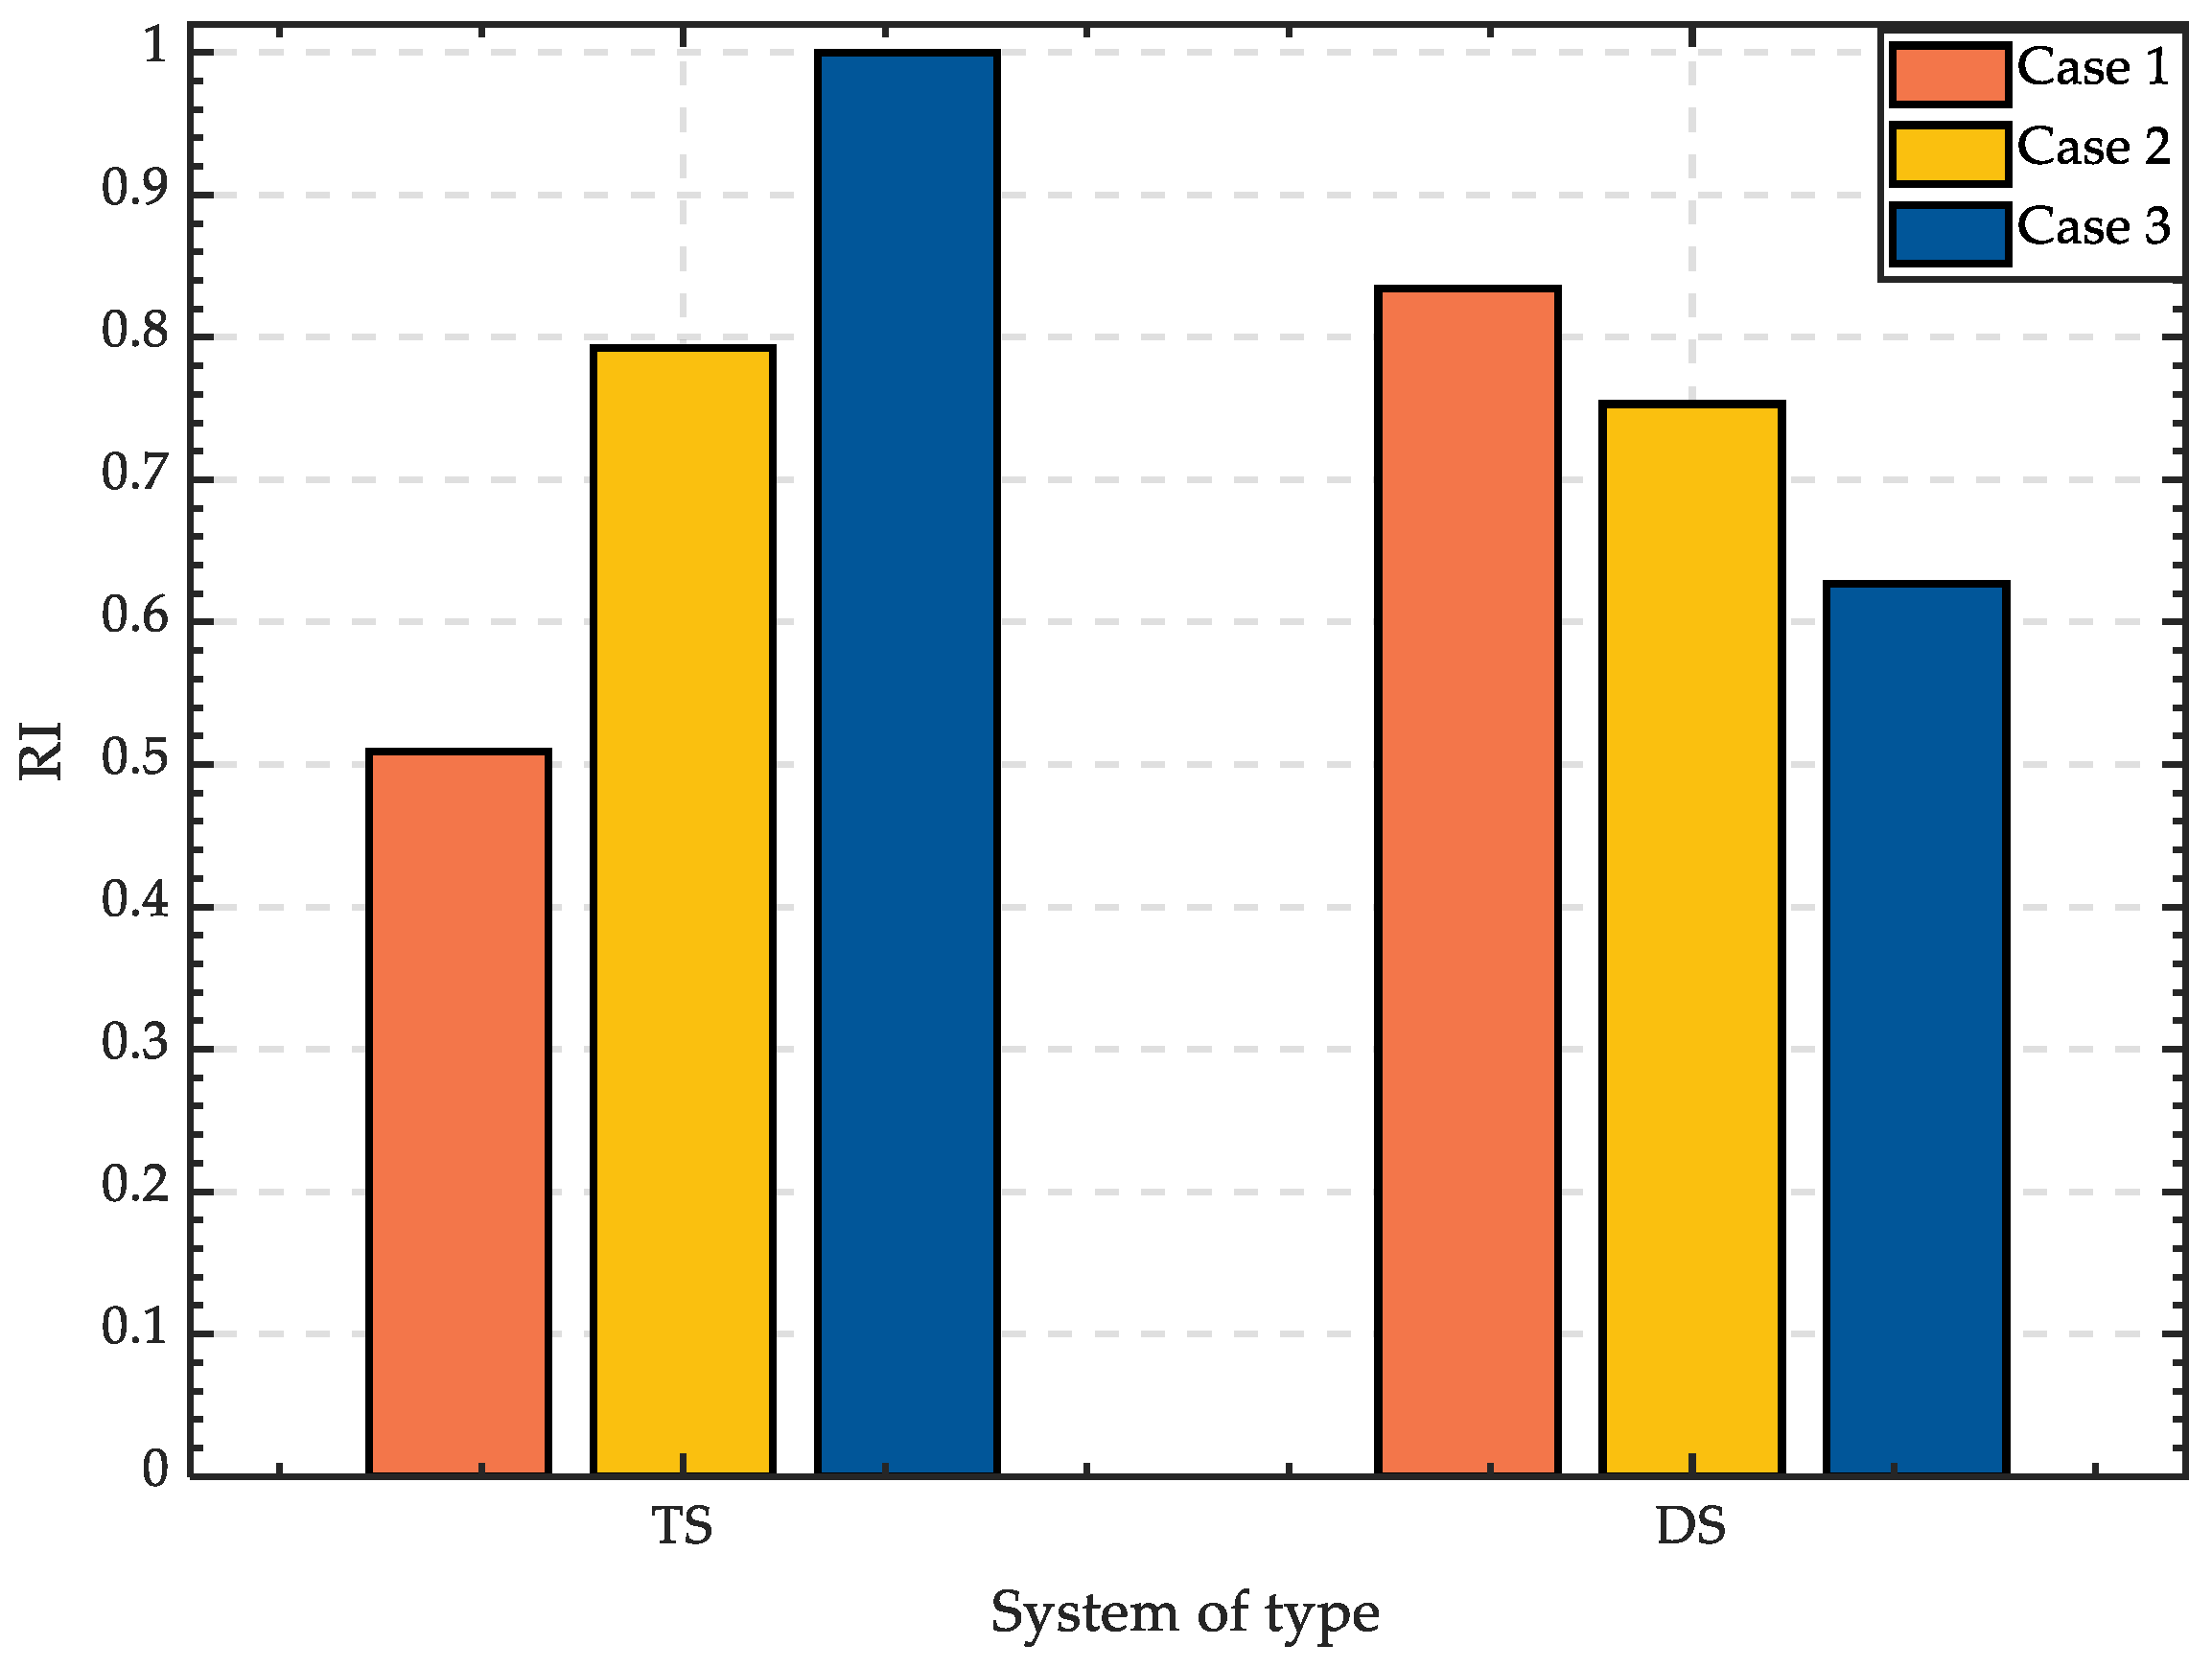
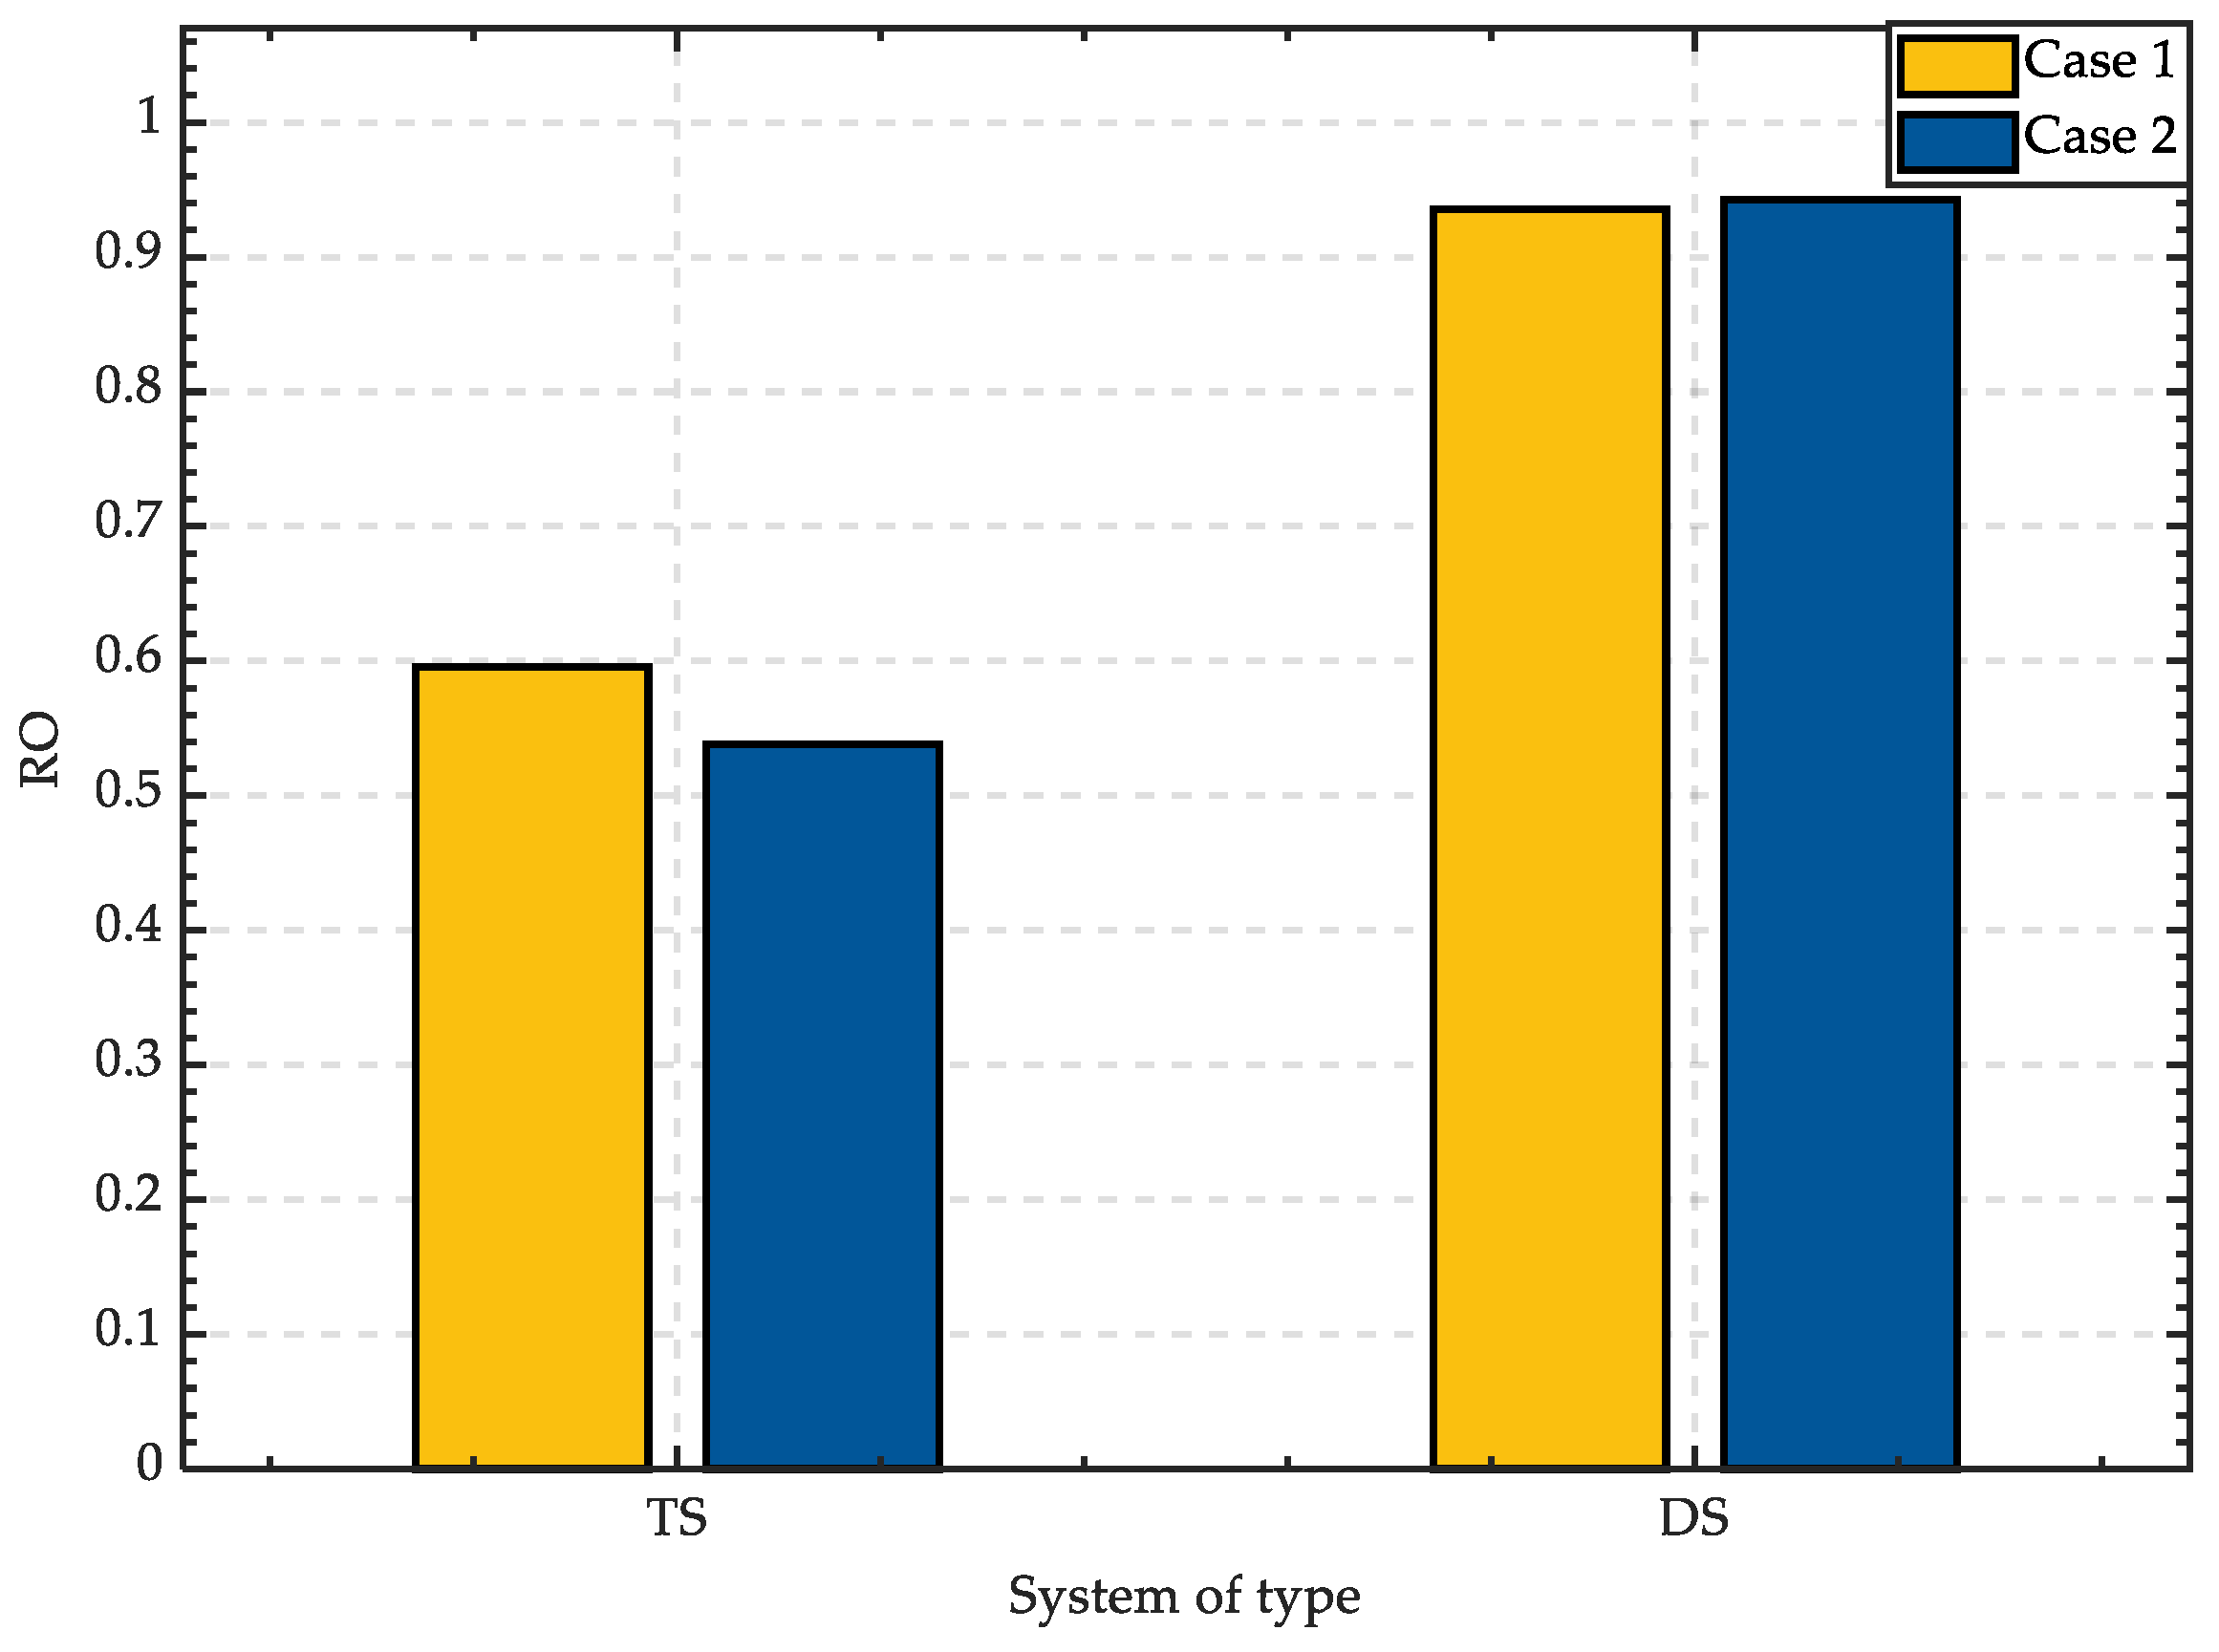
Considering the influence of changing the maximum active power output of the distributed generation, the infrastructure resilience evaluation index and system operation resilience evaluation index were obtained (Figure 10 and Figure 11). In these figures, TS is the transmission system, and DS is the distribution system.
The evaluation indices of infrastructure resilience of transmission and distribution systems in each example scenario were not much different in value (Figure 10). Because the purpose of the fault line repair strategy used in the generation of transmission and distribution system fault scenarios is to select the line with large load recovery as much as possible to repair first, more consideration was given to system operation resilience rather than infrastructure resilience. Changing the upper limit of distributed power output in the distribution system will not change the operation duration and repair duration of the transmission and distribution lines. Therefore, the infrastructure resilience evaluation indices of the transmission system and the distribution system in Figure 10 are basically the same. The reason why the infrastructure resilience evaluation indices of transmission system and distribution system were slightly different in different case scenarios is that the fault lines with long repair times but no higher load recovery than other fault lines were preferentially selected for repair, resulting in a long time for the transmission and distribution system to be in a state with a small number of normal lines. Considering that the repair time of each fault line is not much different, the repair strategy only caused a small difference in infrastructure resilience. Therefore, changing the maximum active power of the distributed generation of distribution systems had little effect on the infrastructure resilience of transmission and distribution systems.
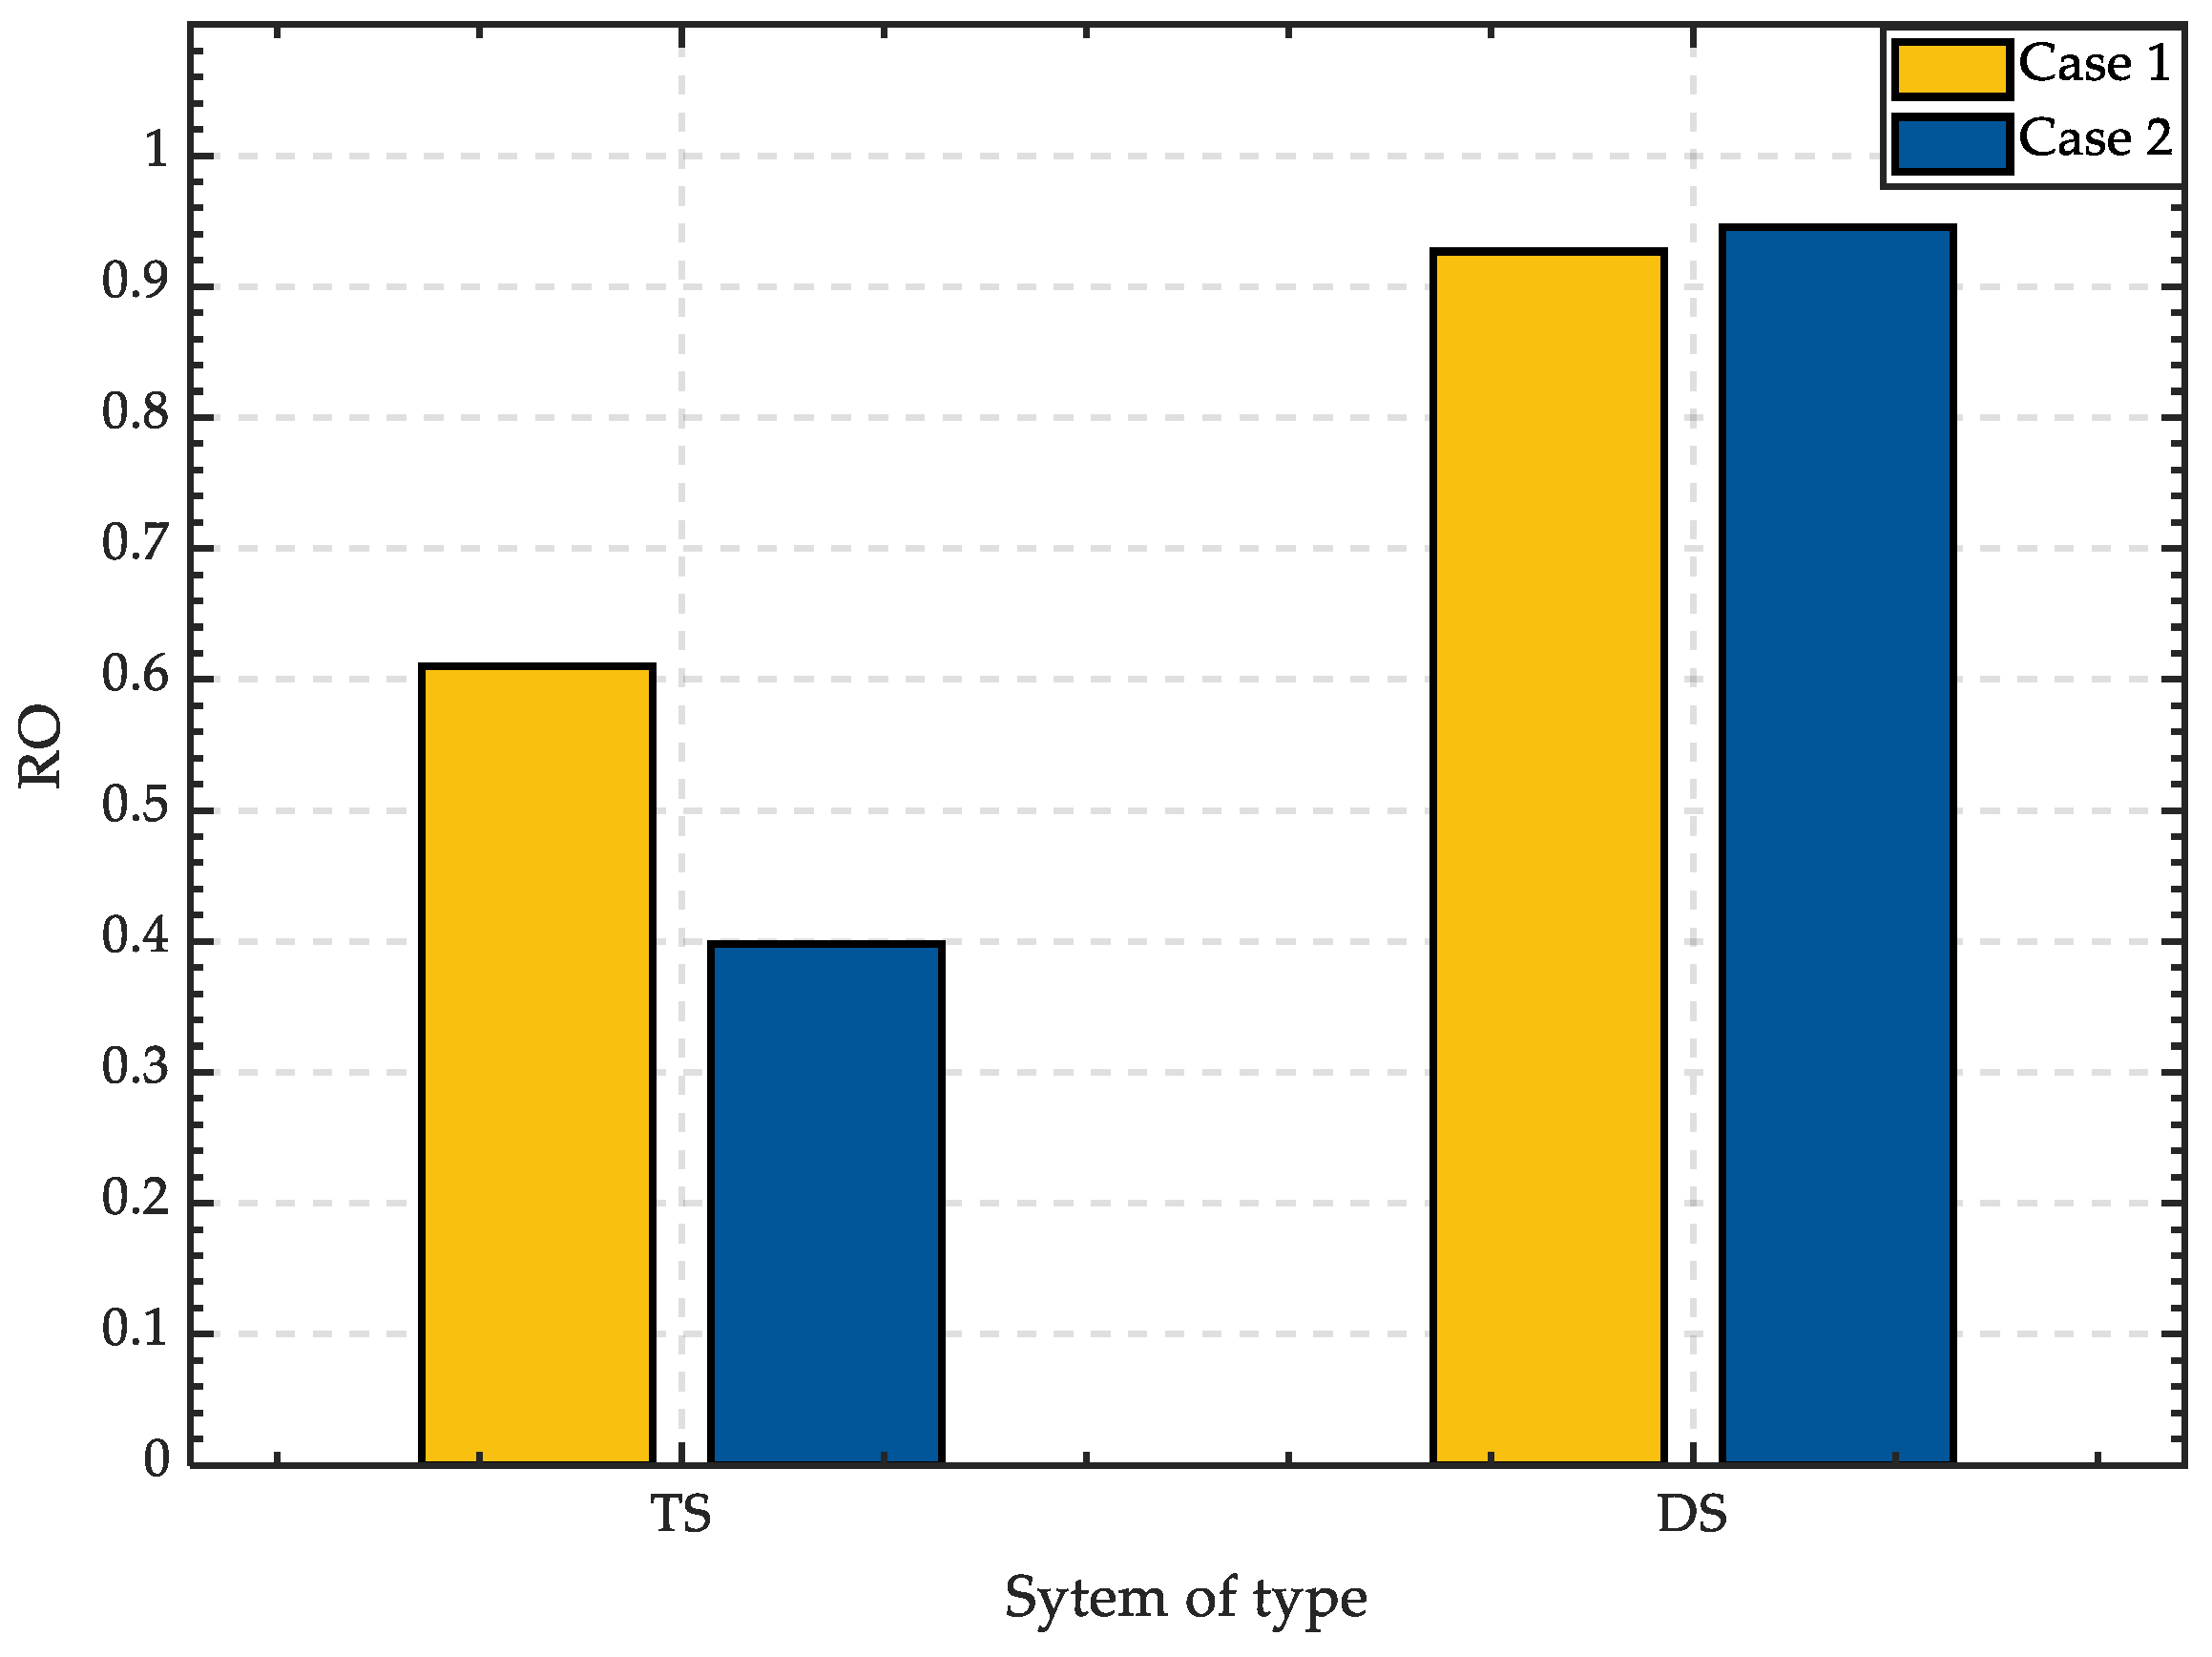
Similar to the comparison of load shedding in the systems, with the increase of the maximum outflow power from distributed generation (Figure 11), the system operation resilience evaluation index gradually increased in value, that is, increasing the largest value of the outflow active power of the distributed generation was beneficial to improving system operation resilience. Because increasing the upper limit of the distributed power output of the distribution system enhanced the ability of the distribution system to support its power loss load, considering the power interaction between the transmission system and the distribution system, increasing the upper limit of the distributed power output of the distribution system was equivalent to improving the ability of the entire transmission and distribution system to support the power loss load; thus, increasing the upper limit of the distributed power output can increase the system operation resilience evaluation index of the transmission system and the distribution system.

6.3. Influence of Transmission Line Reinforcement Strategy on Resilience Improvement

To verify the influence of the transmission line reinforcement strategy on the resilience improvement of transmission and distribution systems under ice disaster weather, the parameters of specific example scenarios are as follows.
Case 1: The transmission line reinforcement strength is equal to the base overhead line load threshold.
Case 2: The transmission line reinforcement strength is three times the base overhead line load threshold.
Case 3: The transmission line reinforcement strength is five times the base overhead line load threshold.
Using these settings in the proposed resilience evaluation framework, we obtained the load reduction changes of transmission and distribution systems under these three example scenarios (Figure 12 and Figure 13).
As the line reinforcement strength of the transmission system continued to increase, the active power load shedding at the transmission system continued to reduce (Figure 12). This indicates that increasing the line reinforcement strength of the transmission system is conducive to reducing load shedding in the transmission system caused by extreme natural disasters. Load shedding of distribution systems could not be influenced by the line reinforcement strategy (Figure 13). The load shedding of the distribution systems under Case 3 was the smallest, but the load shedding at the distribution systems under Case 2 was still greater than in Case 1.
To further study the impact of changing the line reinforcement strength of the transmission system, we calculated the infrastructure resilience evaluation index and operation resilience evaluation index according to the load shedding change in Figure 12 and Figure 13, as seen in Figure 14 and Figure 15. In these figures, TS is the transmission system, and DS is the distribution system.
With the increase of transmission line reinforcement strength, the infrastructure resilience evaluation index in the transmission system increased in value (Figure 14). Increasing the reinforcement level of the transmission line reduced the failure rate of the transmission line, thereby reducing the number of lines damaged by the transmission system during the entire disaster and improving the infrastructure resilience evaluation index of the transmission system. For the distribution system, because the distribution line was not reinforced, the number of distribution lines lost under each transmission line reinforcement level was basically the same. However, in the case of a low transmission line reinforcement level, the entire transmission and distribution system had a longer time to complete recovery from being affected by the disaster. At this time, the distribution system was compared with the distribution system in the case of high transmission line reinforcement level. In the case of a similar number of total lost lines, the line loss of the distribution system in the unit time was lighter. As shown in Figure 14, the infrastructure resilience of the distribution system decreased as the transmission line reinforcement level increased. In other words, the increase of the line reinforcement strength was conducive to the improvement of the transmission system’s infrastructure resilience, while the distribution lines are not reinforced; thus, the infrastructure resilience evaluation index is different from the transmission system in value.
Similar to the comparison of load shedding in the systems, with the increase in the line reinforcement strength of the transmission system, the operation resilience evaluation index of the transmission system gradually increased in value, and the trend of the system operation resilience evaluation index of the distribution system in value had no obvious correlation with the line reinforcement scheme of the transmission system (Figure 15). The reason is that the reinforcement level of the transmission line was improved, the failure rate of the transmission line was reduced, and the line loss of the transmission system was reduced. At the same time, the load reduction of the transmission system was reduced, and the system operation resilience of the transmission system was improved. However, for the distribution system, when the reinforcement level of the transmission line was low, the recovery time of the entire transmission and distribution system was dominated by the transmission system, which is similar to the infrastructure resilience evaluation index. At this time, the transmission and distribution system had a long time to full recovery from being affected, resulting in a reduction in the system load reduction per unit time of the distribution system under the low reinforcement level of the transmission system. Therefore, considering the same amount of load reduction, with the increase of the reinforcement level of the transmission system, the system operation resilience of the distribution system was also lower. However, considering that the power loss load of the distribution system is supplied by the distributed power supply and the transmission system, the improvement of the reinforcement level of the transmission line reduced the load reduction of the transmission system and increased the probability of the transmission system supplying the power supply support of the distribution system to a certain extent, thereby increasing the system operation resilience of the distribution system. Therefore, under the action of these two factors, the evaluation index of the operation resilience of the distribution system was obtained as shown in Figure 15. This indicates that increasing transmission line reinforcement strength is conducive to the improvement of the transmission system operation resilience.

6.4. Influence of Power Interaction between Active Distribution Systems and Transmission Systems on Resilience Improvement

With the increasing installed capacity of distributed power in the distribution system, the traditional distribution system gradually changed to an active distribution system. The direction of power flow between the transmission system and the distribution system changed from a one-way flow to a two-way flow. In this context, the distributed power in the distribution system can supply energy to the power loss load in the transmission system, thereby enhancing the resilience of the transmission system.
Next, the resilience improvement effect of the active distribution system on the transmission and distribution system was verified in example scenarios, whose specific parameters are as follows:
Case 1: Power interaction exists between the transmission system and the active distribution system during the disaster.
Case 2: There is no power interaction between the transmission system and the active distribution system during the disaster.
According to the calculation scenarios set up in Case 1 and Case 2 and combined with the proposed resilience evaluation framework for transmission and distribution systems, the load shedding changes of transmission and distribution systems in Case 1 and Case 2 were obtained (Figure 16 and Figure 17).
It can be seen from Figure 16 that the load trends of Case 1 and Case 2 were basically the same, but the load curve in Case 2 was always above the load curve in Case 1, which proves that the power interaction between the active distribution system and the transmission system was conducive to the improvement of the resilience of the transmission system. It can be seen in Figure 17 that in the load shedding stage, the load power changes of Case 1 and Case 2 were basically the same, but in the load recovery stage, the load power of Case 2 was generally higher than that of Case 1. The reason for this situation is that in the load recovery stage of Case 1, the active distribution system gave part of the electric energy to the power loss load of the transmission system, resulting in additional load shedding of the active distribution system.
Finally, according to the change in the number of non-stop lines in the transmission and distribution systems during the disaster and the changes in load shedding of the transmission and distribution system in Figure 16 and Figure 17, the infrastructure resilience evaluation index and system operation resilience evaluation index of the transmission and distribution systems in Case 1 and Case 2 were calculated, as shown in Figure 18 and Figure 19. In these figures, TS is the transmission system, and DS is the distribution system.
The infrastructure resilience evaluation indices of transmission system and distribution systems in Case 1 and Case 2 were not much different (Figure 18). The main reason for this is similar to the infrastructure resilience evaluation index of the upper limit of distributed power output of the distribution system, which is a contradiction between the repair time of fault lines and the recovery load of fault lines. In Case 1, the power transmission and distribution system considered the power interaction between the transmission system and the distribution system, and in Case 2, the power transmission range of the transmission and distribution system without considering the power interaction between the transmission system and the distribution system was different, which led to the selection of a fault line with a long repair time, resulting in the difference of the resilience evaluation index of the transmission and distribution system infrastructure. However, due to the small number of lines in the whole transmission and distribution system, the maintenance resources were limited. As a result, there was little difference in the resilience evaluation indices of transmission and distribution systems’ infrastructure in Case 1 and Case 2.
The operation resilience evaluation index of the transmission system in Case 1 is higher than that in Case 2, and the numerical results also reflect the load change in the transmission system in Figure 16 (Figure 19). The active distribution system was a new power source for the transmission system that increased the path from the power loss load of the transmission system to the power source, reduced the load shedding of the transmission system, and enhanced the operation resilience of the transmission system. For the distribution system, the numerical results also reflect the load changes of the distribution system in Figure 17. Because the distributed power supply in the distribution system provided energy for the power loss load of the transmission system, the load shedding of the distribution system increased. Therefore, the evaluation index of the operation resilience of the distribution system in Case 2 was higher than that in Case 1, which also verifies that the coupling of the active distribution system and the transmission system can indeed enhance the resilience of the transmission system in ice disaster weather.

6.5. Influence of Different Emergency Repair Strategies on Resilience Improvement

Finally, the influence of different fault line repair strategies on resilience improvement in transmission and distribution systems was verified. In practical engineering, there is often no optimal fault line repair strategy. The purpose of the fault line repair strategy needs to change according to the change in actual demand. In this section, we explain two fault line repair strategies that were adopted for transmission and distribution systems under ice disaster weather, and the advantages and disadvantages of the two repair strategies in terms of resilience improvement are compared through the proposed resilience evaluation framework. The parameters of the specific example scenarios are as follows.
Case 1: Select the fault line with the smallest load shedding of the system after recovery to repair first.
Case 2: Select the fault line with the shortest repair time to repair first.
According to the example scenarios set using the Case 1 and Case 2 parameters, combined with the proposed resilience evaluation framework of transmission and distribution system, the load shedding changes of the transmission and distribution systems under Case 1 and Case 2 were obtained (Figure 20, Figure 21 and Figure 22).
The total active power load shedding values of the transmission systems in Case 1 and Case 2 were basically the same in the load shedding stage (Figure 20). In the load recovery stage, the load level of the transmission system in Case 1 was compared with that in Case 2. The case achieved an advantage for a period of time, indicating that the repair strategy that prioritizes load recovery has the advantage of rapidly increasing the system load level, but in the final recovery stage, the load level of Case 2 recovered to a normal level before Case 1. It also shows that the repair strategy that gives priority to the shortest repair time has the advantage of the system returning to normal more quickly.
The difference between the load curtailment of the distribution systems in Case 1 and Case 2 is not as obvious as that of the transmission systems, and the repair strategy in Case 1 does not reduce the load curtailment of the distribution system in the load curtailment stage (Figure 21). The reason is that in the load curtailment stage, the fault lines preferentially restored by the repair strategy in Case 1 may take a long time to repair, and in the process of repairing the selected fault lines, new fault lines appear. As a result, the load level after the repair of the selected fault line may not reach the load level calculated when the repair strategy is adopted, which leads to the fact that the load level of the distribution system in Case 1 was lower than that in Case 2 during the load shedding stage. However, in the load recovery stage, the fault line repair strategy in Case 1 still showed its ability to quickly increase the load level. Finally, the fault line repair strategy in Case 2 relied on its ability to quickly restore the system load to the normal level; thus, the load of the distribution system returns to the normal level one step ahead of Case 1 with a weak advantage.
The total load shedding change in the transmission and distribution system had the characteristics of the load shedding change in the transmission system in Figure 20 and the load shedding change in the distribution system in Figure 21 (Figure 22). In the load shedding stage, the load shedding of the transmission systems in Case 1 and Case 2 were basically the same, and the load shedding trend of the transmission and distribution systems were similar to that of the distribution systems. In the load recovery stage, the load shedding changes of the transmission system and the distribution system were similar. The system load level in Case 1 was higher than that in Case 2 for a period of time. However, in the final recovery stage, the system load in Case 2 returned to the normal level earlier than in Case 1; thus, the load shedding changes of the transmission and distribution system are similar to those in Figure 20 and Figure 21.
Finally, according to the change in the number of non-stop lines of the transmission and distribution system during the disaster and the change in the load shedding of the transmission and distribution system, the infrastructure resilience evaluation indices and the system operation resilience evaluation indices of the transmission and distribution systems under Case 1 and Case 2 can be calculated (Figure 23, Figure 24 and Figure 25). In these figures, TS is the transmission system, and DS is the distribution system.
The infrastructure resilience evaluation index of the transmission system and distribution system in Case 2 was higher than that in Case 1 (Figure 23), which corresponds to the result that the system load in Case 2 returned to normal faster than in Case 1. From the goal of the repair strategy adopted in Case 2, it can also be seen that the priority selection of fault line repair with short repair time ensured the level of the number of non-stop lines in the rapid recovery system, and its infrastructure resilience evaluation index was also higher than in Case 1.
Due to the small number of lines in the transmission system used in this paper, the maintenance times of the transmission lines were often longer than those of the distribution lines (Figure 24). Therefore, unlike the distribution system, the load shedding amount of the transmission system used in this paper was less affected by the emergency repair strategy in the load shedding stage, whereas the emergency repair strategy of the fault line with the smallest load shedding after recovery in Case 1 restored the load to a higher level as soon as possible. Therefore, the operation resilience evaluation index of the transmission system in Case 1 was greater than that in Case 2. For the distribution system, because the additional load lost by the repair strategy in Case 1 in the load shedding stage was slightly larger than that in the load recovery stage, which was better than that in Case 2, the distribution system operation resilience evaluation index in Case 2 was slightly higher than that in Case 1.
Finally, it can be seen from Figure 25 that for the entire transmission and distribution system, the repair strategy of the fault line with the priority of minimizing the system load shedding after line recovery in Case 1 used its ability to quickly increase the load level to repair the transmission and distribution system. The operation resilience evaluation index was higher than Case 2, and the repair strategy of the fault line with the shortest repair time in Case 2 made the transmission and distribution system infrastructure resilience evaluation index in Case 2 higher than Case 1 by virtue of its ability to quickly restore the number of non-stop lines in the system. Therefore, the two fault line repair strategies rely on their own advantages to improve infrastructure resilience and system operation resilience of the transmission and distribution systems under ice disaster weather, that is, the two fault line repair strategies as resilience improvement methods improve the resilience of the transmission and distribution system from different angles. In practical engineering, according to different disaster scenarios, transmission and distribution systems may have different resilience requirements. Corresponding and reasonable resilience improvement methods or measures should be selected for different resilience requirements.

7. Conclusions

We introduced a resilience evaluation framework to analyze the influence of ice disasters or ice storms on the transmission and distribution system. First, we established the system fragility model under ice disasters to study the physical impact of ice disasters on the system. Then, we built the optimal load power shedding model of the system to quantify the influence of the transmission and distribution line faults on the whole system. Based on the two models, we generated the fault scenario set to investigate the state change in transmission and distribution lines. After this, according to the resilience change curve under devastating disasters, we proposed the resilience assessment indices under ice disaster weather to evaluate system resilience at this time. Finally, we used the transmission and distribution system coupled with the improved six-bus transmission system and two distribution systems as an example system. We validated the efficacy and rationality of the resilience evaluation framework of transmission and distribution system by four traditional resilience improvement methods. This also provides a basis for selecting an optimal method to improve the resilience for the transmission and distribution systems.

Author Contributions

Z.W.: Conceptualization, Methodology; X.M.: Data curation, Writing—Original Draft, Software; S.G.: Supervision, Writing—Review and Editing; C.W.: Validation; S.L.: Investigation. All authors have read and agreed to the published version of the manuscript.

Funding

This work was supported by the State Grid Jilin Province Electric Power Co., Ltd.—Research and Application of Power Grid Resilience Assessment and Coordinated Emergency Technology of Supply and Network for the Development of New Power System in Alpine Region (Project Number is B32342210001).

Conflicts of Interest

The authors declare no conflict of interest.

References

  1. Liu, X.; Hou, K.; Jia, H.; Zhao, J.; Mili, L.; Jin, X.; Wang, D. A Planning-Oriented Resilience Evaluation Framework for Transmission Systems Under Typhoon Disasters. IEEE Trans. Smart Grid 2020, 11, 5431–5441. [Google Scholar] [CrossRef]
  2. Yang, Y.; Tang, W.; Liu, Y.; Xin, Y.; Wu, Q. Quantitative Resilience Evaluation for Power Transmission Systems Under Typhoon Weather. IEEE Access 2018, 6, 40747–40756. [Google Scholar] [CrossRef]
  3. Espinoza, S.; Poulos, A.; Rudnick, H.; de la Llera, J.C.; Panteli, M.; Mancarella, P. Risk and Resilience Evaluation with Component Criticality Ranking of Electric Power Systems Subject to Earthquakes. IEEE Syst. J. 2020, 14, 2837–2848. [Google Scholar] [CrossRef]
  4. Panteli, M.; Pickering, C.; Wilkinson, S.; Dawson, R.; Mancarella, P. Power System Resilience to Extreme Weather: Fragility Modeling, Probabilistic Impact Evaluation, and Adaptation Measures. IEEE Trans. Power Syst. 2017, 32, 3747–3757. [Google Scholar] [CrossRef]
  5. Lian, X.; Qian, T.; Li, Z.; Chen, X.; Tang, W. Resilience Evaluation for Power System Based on Cascading Failure Graph under Disturbances Caused by Extreme Weather Events. Int. J. Electr. Power Energy Syst. 2023, 145, 108616. [Google Scholar] [CrossRef]
  6. Li, G.; Huang, G.; Bie, Z.; Lin, Y.; Huang, Y. Component Importance Evaluation of Power Systems for Improving Resilience under Wind Storms. J. Mod. Power Syst. Clean Energy 2019, 7, 676–687. [Google Scholar] [CrossRef]
  7. Panteli, M.; Mancarella, P. Modeling and Evaluating the Resilience of Critical Electrical Power Infrastructure to Extreme Weather Events. IEEE Syst. J. 2017, 11, 1733–1742. [Google Scholar] [CrossRef]
  8. Liu, X.; Hou, K.; Jia, H.; Zhao, J.; Mili, L.; Mu, Y.; Rim, J.; Lei, Y. A Resilience Evaluation Approach for Power System from Perspectives of System and Component Levels. Int. J. Electr. Power Energy Syst. 2020, 118, 105837. [Google Scholar] [CrossRef]
  9. Lu, J.; Guo, J.; Jian, Z.; Yang, Y.; Tang, W. Resilience Evaluation and Its Enhancement in Tackling Adverse Impact of Ice Disasters for Power Transmission Systems. Energies 2018, 11, 2272. [Google Scholar] [CrossRef]
  10. Lu, J.; Guo, J.; Jian, Z.; Yang, Y.; Tang, W. Dynamic Evaluation of Resilience of Power Transmission Systems in Ice Disasters. In Proceedings of the 2018 International Conference on Power System Technology (POWERCON), Guangzhou, China, 6–8 November 2018; IEEE: Guangzhou, China, 2018; pp. 7–13. [Google Scholar]
  11. Wang, Y.; Huang, T.; Li, X.; Tang, J.; Wu, Z.; Mo, Y.; Xue, L.; Zhou, Y.; Niu, T.; Sun, S. A Resilience Evaluation Framework for Distribution Systems Under Typhoon Disasters. IEEE Access 2021, 9, 155224–155233. [Google Scholar] [CrossRef]
  12. Sun, S.; Lyu, Q.; Li, G.; Lin, Y.; Bie, Z.; Wen, W. Resilience Modeling and Evaluation for Power Distribution Systems Under Typhoon Disasters. In Proceedings of the 2019 IEEE Sustainable Power and Energy Conference (iSPEC), Chengdu, China, 23–25 November 2019; IEEE: Beijing, China, 2019; pp. 2413–2418. [Google Scholar]
  13. Hou, G.; Muraleetharan, K.K.; Panchalogaranjan, V.; Moses, P.; Javid, A.; Al-Dakheeli, H.; Bulut, R.; Campos, R.; Harvey, P.S.; Miller, G.; et al. Resilience Evaluation and Enhancement Evaluation of Power Distribution Systems Subjected to Ice Storms. Reliab. Eng. Syst. Saf. 2023, 230, 108964. [Google Scholar] [CrossRef]
  14. Zhao, J.; Wu, Q.; Hatziargyriou, N.; Li, F.; Teng, F. Decentralized Data-Driven Load Restoration in Coupled Transmission and Distribution System with Wind Power. IEEE Trans. Power Syst. 2021, 36, 4435–4444. [Google Scholar] [CrossRef]
  15. Zhao, J.; Wang, H.; Liu, Y.; Wu, Q.; Wang, Z.; Liu, Y. Coordinated Restoration of Transmission and Distribution System Using Decentralized Scheme. IEEE Trans. Power Syst. 2019, 34, 3428–3442. [Google Scholar] [CrossRef]
  16. Roofegari nejad, R.; Sun, W.; Golshani, A. Distributed Restoration for Integrated Transmission and Distribution Systems with DERs. IEEE Trans. Power Syst. 2019, 34, 4964–4973. [Google Scholar] [CrossRef]
  17. Hu, B.; Li, M.; Niu, T.; Zhou, P.; Li, Y.; Xie, K.; Li, C. Hardening Planning of Overhead Distribution Lines in Typhoon-Prone Areas by Considering the Typhoon Motion Paths and the Line Load Reliability. Int. J. Electr. Power Energy Syst. 2021, 129, 106836. [Google Scholar] [CrossRef]
  18. Zhao, N.; Yu, X.; Hou, K.; Liu, X.; Mu, Y.; Jia, H.; Wang, H.; Wang, H. Full-Time Scale Resilience Enhancement Framework for Power Transmission System under Ice Disasters. Int. J. Electr. Power Energy Syst. 2021, 126, 106609. [Google Scholar] [CrossRef]
  19. Zhang, H.; Heydt, G.T.; Vittal, V.; Quintero, J. An Improved Network Model for Transmission Expansion Planning Considering Reactive Power and Network Losses. IEEE Trans. Power Syst. 2013, 28, 3471–3479. [Google Scholar] [CrossRef]
  20. Chen, X.; Wu, W.; Zhang, B. Robust Restoration Method for Active Distribution Networks. IEEE Trans. Power Syst. 2016, 31, 4005–4015. [Google Scholar] [CrossRef]
  21. Wang, J.; Zhang, Y.; Wu, S.; Sun, Y. Influence of Large-scale Ice Disaster on Transmission System Reliability. Proc. CSEE 2011, 31, 49–56. [Google Scholar] [CrossRef]
  22. Panteli, M.; Mancarella, P.; Trakas, D.N.; Kyriakides, E.; Hatziargyriou, N.D. Metrics and Quantification of Operational and Infrastructure Resilience in Power Systems. IEEE Trans. Power Syst. 2017, 32, 4732–4742. [Google Scholar] [CrossRef]
Figure 1. Power line diagram under ice disaster weather.
Energies 16 03845 g001
Figure 2. Linearization model of line capacity constraint.
Energies 16 03845 g002
Figure 3. Fault line repair strategy of a transmission and distribution system considering maintenance resupply constraints.
Energies 16 03845 g003
Figure 4. Change in power system performance function under extreme natural disasters.
Energies 16 03845 g004
Figure 5. Resilience evaluation framework for transmission and distributions system under the influence of ice disaster weather.
Energies 16 03845 g005
Figure 6. Modified power transmission and distribution system topology diagram.
Energies 16 03845 g006
Figure 7. Geographical location map of transmission system considering the influence of the disaster.
Energies 16 03845 g007
Figure 8. Load shedding of the transmission system with different distributed power outputs considered.
Energies 16 03845 g008
Figure 9. Load shedding of the distribution system with different distributed power outputs considered.
Energies 16 03845 g009
Figure 10. Considering the resilience evaluation index of transmission and distribution system infrastructure under different distributed power outputs.
Energies 16 03845 g010
Figure 11. Operating resilience evaluation index of transmission and distribution systems with different distributed power outputs considered.
Energies 16 03845 g011
Figure 12. Load shedding of the transmission system with different line reinforcement strategies considered.
Energies 16 03845 g012
Figure 13. Load shedding of the distribution system with different transmission line reinforcement strategies considered.
Energies 16 03845 g013
Figure 14. Resilience evaluation indices of transmission and distribution system foundations with different transmission line reinforcement strategies considered.
Energies 16 03845 g014
Figure 15. Operational resilience evaluation indices of transmission and distribution systems with different transmission line reinforcement strategies considered.
Energies 16 03845 g015
Figure 16. The change in load shedding in transmission systems whether there is power interaction between transmission and distribution systems during a disaster.
Energies 16 03845 g016
Figure 17. The change in load shedding in distribution systems whether there is power interaction between transmission and distribution systems during a disaster.
Energies 16 03845 g017
Figure 18. Infrastructure resilience evaluation indices of transmission and distribution systems considering whether there is power interaction between transmission and distribution systems during disasters.
Energies 16 03845 g018
Figure 19. Operational resilience evaluation indices of transmission and distribution systems considering whether there is power interaction between transmission and distribution systems during disasters.
Energies 16 03845 g019
Figure 20. Variation of transmission system load shedding under different fault line emergency repair strategies.
Energies 16 03845 g020
Figure 21. Variation of distribution system load shedding under different fault line emergency repair strategies.
Energies 16 03845 g021
Figure 22. Variation of coupled transmission and distribution system load shedding under different fault line emergency repair strategies.
Energies 16 03845 g022
Figure 23. Infrastructure resilience assessment indices of transmission systems and distribution systems under different fault line repair strategies.
Energies 16 03845 g023
Figure 24. Operational resilience assessment indices of transmission systems and distribution systems under different fault line repair strategies.
Energies 16 03845 g024
Figure 25. Resilience assessment indices of infrastructure and system operation of coupled transmission and distribution systems under different fault line repair strategies.
Energies 16 03845 g025
Disclaimer/Publisher’s Note: The statements, opinions and data contained in all publications are solely those of the individual author(s) and contributor(s) and not of MDPI and/or the editor(s). MDPI and/or the editor(s) disclaim responsibility for any injury to people or property resulting from any ideas, methods, instructions or products referred to in the content.

