Review

Addressing Multidimensional Energy Poverty Implications on Achieving Sustainable Development

by
George E. Halkos
* and
Panagiotis-Stavros C. Aslanidis
Laboratory of Operations Research, Department of Economics, University of Thessaly, 28 Octobriou 78, 38333 Volos, Greece
*
Author to whom correspondence should be addressed.
Energies 2023, 16(9), 3805; https://doi.org/10.3390/en16093805
Submission received: 28 February 2023 / Revised: 24 April 2023 / Accepted: 27 April 2023 / Published: 28 April 2023
(This article belongs to the Collection Feature Papers in Energy, Environment and Well-Being)

Abstract

:
This study examines whether shifts in the stance of policymaking can account for the observed predictability in excess energy poverty (EP) or fuel poverty (FP) levels. Energy-related poverty is a subcategory of global poverty and can be categorized into accessibility problems related to EP and affordability issues associated with FP, which have a similar but not identical meaning. Furthermore, developed and developing countries have different energy issues, as the former deal with FP and the latter with EP. However, there are discrepancies in EP not only between countries but within counties as well; for instance, there are differences in urban and rural areas too. Difficulties in energy access can be devastating for people living at risk of poverty. Social welfare, although at stake due to the energy crisis sparked at the same time as the warfare in eastern Europe. Renewables and green fossil fuels have price fluctuations, and inflation is also a stress factor in EP. Generally, solutions to EP and FP could be, inter alia, the adoption of renewables, governmental regulation, and supranational support through the green deals and sustainable development goals (SDGs). In short, the inflationary trend disequilibrium and raging war have put Agenda 2030 at stake due to the provocation of sustainability via energy-related vulnerability, insecurity, and poverty phenomena.

Graphical Abstract

1. Introduction

Energy is a pivotal element for a decent modern life, but the current energy, inflation, and war crises have augmented another problem as well—the multidimensional energy poverty. Primarily, energy-related poverty has been studied thoroughly in the UK in the 1990s and 2000s [1,2]. In the literature, the poverty associated with energy issues is called “energy poverty” (EP) and “fuel poverty” (FP) [3] (hereafter, EP will include the FP for brevity needs). However, there is a pivotal difference between the two terms, as EP is related to accessibility and FP to affordability problems [3,4,5].
According to the World Health Organization [6], the key findings on SDG 7 show that there are people without access to electricity and clean cooking that reached 789 million and 2.8 billion in 2018, respectively. Furthermore, almost 20% of the total final energy consumption of renewables was in 2017. However, what is of great importance is that from 2010 to 2017, the international financial flows towards developing countries have been doubled (from USD $10.1 billion to USD $21.4 billion), providing a helping hand to many developing countries in order to combat EP.
EP is being measured in a plethora of ways, mainly based on surveys or even the creation of expenditure-based indicators [7,8,9,10,11,12,13,14]. The reason why is going to be explained in the following section that sheds light on the approaches to EP and FP.
In order to capture the importance of energy in the modern lifestyle, several indicators have been proposed to cover this rising and alerting academic literature. Firstly, the UNDP, the UNDESA, and the WEC inaugurated in 2000 the sustainable energy development (SED) framework that takes into consideration, inter alia, affordability, economic competitiveness, and energy price issues [15]. Next in order came the energy indicators for sustainable development (EISD) [16,17,18]. On this basis, Iddrisu and Bhattacharyya introduced the sustainable energy development index (SEDI), which promoted a multidimensional perspective on SED. In the same manner, OLADE, ECLAC, and GTZ [19] included eight indicators to measure energy sustainability, whereas a more novel index was the energy development index (EDI) by the IEA [20].
Having these in mind, SED is intertwined with the stability of energy prices, but if there is instability and mainly inflationary trends in energy prices, what happens to energy poverty? Furthermore, the interconnections of EP with energy security and vulnerability are going to be clarified.
Two important issues on SED are EP and energy security [21,22,23,24,25], both of which have plenty of dimensions but different levels of monitoring: energy poverty is measured on a household level, whereas energy security has broader—regional and national—economic aspects. Accordingly, the multidimensional energy poverty index (MEPI) has been coined by Nussbaumer, Bazilian, and Modi [26] and Nussbaumer et al. [27], who enabled the monitoring of EP under a more complex theoretical and analytical background than solely uni-dimensional indicators. After these publications, an increasing trend of MEPI indices has sparked in the academic literature [28,29,30,31].
The common ground for these publications is the significance of access to clean energy sources for cooking and heating, mainly electricity, instead of rudimentary harmful sources. On this matter, a question that may come to mind is: what is the percentage of people with access to electricity?
A way of observing EP is through the monitoring of access to electricity based on people’s income. In Figure 1, it is undoubtedly shown that people with low incomes have only 4% access to electricity; on the other hand, people with high incomes attain almost five times higher access.
Energy and fuel poverties have been extensively studied in all corners of the world; however, the present study focuses mainly on countries of the Organization of Economic Cooperation and Development (OECD) and BRICS, which is the cooperation of Brazil, the Russian Federation, India, the People’s Republic of China, and South Africa. More specifically, there is a proliferation of green deals and white papers that create a framework for how to deal with EP. In the USA and in the EU, the green deals have opened a debate over the just transition towards carbon neutrality and sustainable development by adopting an approach that is either growth-centered or degrowth-oriented [33,34].
The tackling of EP has been a central theme in the European Commission (EC), as the EC develops a framework of close cooperation between all levels of administration [35]. The main target of the EC is to create a cohesive and integrated plan to cope with EP through the harmonization of data in cooperation with EUROSTAT and the European Energy Poverty Observatory (EPOV).
The EC also aims to achieve carbon neutrality by 2030 [36]. More specifically, the EC has put forward the “fit for 55” target, which aims to halve greenhouse gases (GHGs) compared to 1990 levels and attain climate neutrality by 2050 [37]. A way of observing EP is through the monitoring of access to electricity based on people’s income. All these ought to be implemented under the umbrella of the REPowerEU plan, which tries to build energy autarky [38,39,40,41] against the turbulence on energy prices due to the Russo-Ukranian conflict.
In parallel, the “30/60 goal”, or alternatively, the “dual carbon goals”, is President Xi Jinping’s commitment that China will peak carbon dioxide emissions before 2030 and reach carbon neutrality before 2060 [42]. This announcement is linked to the white paper “Energy in China’s New Era”, which tries to cope with poverty through the adoption of renewable energy sources and the creation of new green jobs [43].
From a global perspective, there are studies that have centered on affordability issues in developed countries and accessibility problems in developing countries [3,5]. The OECD studies are plentiful; hence, the categorization of the studies is going to be according to their continent.
Firstly, in North America, the main energy-related issues are mainly affordability in Canada [44,45], the USA [46,47], and Mexico [48]. Nevertheless, in South America, accessibility issues are assessed in some studies, such as in Colombia [49], Argentina [50], Latin America in general [19], and Chile [51,52,53].
In Europe, one of the earliest FP publications focused on the UK [1,54,55]. More recently, there have been significant EP studies in the UK [56,57,58,59,60], and in the EU specifically [4,12,14,61,62,63,64,65,66,67], which have monitored EP from different points of view. In more detail, in the EU, mainly affordability-focused studies took place in Ireland [68], in Germany [11], in different European countries [64], in Italy [9,10], in Portugal [69], in Lithuania and Greece [70], or in Greece exclusively [70,71,72,73,74].
Moreover, in the OECD countries in Asia, EP studies are centered on general EP issues, as with the people who live in deserts in Israel [75,76], vulnerable people in Türkiye [77,78], or even in Japan [79,80,81]. Whereas, in Oceania, FP studies are conducted in New Zealand [82] and Australia [83,84] as well.
Last but not least, the BRICS economies have a very important share of the global economy. BRICS have plenty of studies that give prominence to energy-related poverty, generally in BRICS as a comparison [85], or more specifically in Brazil [31,86,87], in China [88,89,90], in India [24,91,92,93], and in South Africa [94,95].
The central aim of the present study is to delve into the interconnections of EP and FP with other great dilemmas such as energy security and energy vulnerabilities. There is also monitoring of the multidimensionality of EP and FP under the scope of just transition and sustainable development. The following sections focus thoroughly on social exclusion, environmental pressures, and aporophobia. The research hypothesis of the review is that there is no difference between the OECD and BRICS on the matter of EP. Furthermore, the gap in the literature is the absence of a comparison of the multidimensionality of EP between international organizations such as the World Bank and the United Nations. This gap will be analyzed in Section 5, which covers the main advancements on the issue of global poverty, focusing mainly on the EP elements of global poverty and their connection with the SDGs.
The structure of the study begins with the focus on the causes and drivers of poverty (Section 3.1) and the impacts on health, psychology, and well-being (Section 3.2). Additionally, Section 4 discusses the two primary approaches to energy-related poverty: the consensual and the expenditure-based. Section 5 reviews the state-of-the-art questions over the multidimensionality of poverty, more specifically on its social (Section 5.1), technical (Section 5.2), economic (Section 5.3), institutional (Section 5.4), and environmental (Section 5.5) dimensions. Section 6 discusses three green deals and one white paper regarding the presence—or not—of energy poverty in them. Section 7 is centered on the discussion of the aforementioned conundrums and some future directions. Section 8 concludes the paper and mentions some policy implications—valuable for policymakers and academicians—with respect to the SDGs and the adverse effects of inflation, COVID-19, and war.

2. Materials and Methods

The present review tries to distinguish why EP is a problem through its historical identification. However, is there a difference between the OECD and BRICS economies on EP? This might be the research hypothesis of the present study. Accordingly, understanding EP as a conundrum might enable policymakers to cope with it more thoroughly. Hence, the present study provides Figure 2, which illustrates the structure of the present study. The conduct of the review has evaluated several publications on the matters of the direct and indirect causes or drivers of the phenomena, as well as the impacts of EP on public health, psychology, and well-being. The data for the review can be found in the following references: World Bank Group (WBG), Our World in Data (OWID), and Eurostat [32,96,97].
Furthermore, the analysis of the above issues has been put under the scope of the multidimensionality of EP. EP is multidimensional, with main social, economic, technical (urban or rural), institutional, and environmental dimensions. An understanding of multidimensionality would pave the way for policymakers to deal with it through strategies. Such strategies are the green deals that can provide a robust framework for eradicating EP.

3. Energy Poverty and Fuel Poverty

It is proper to make a distinction between what fuel poverty and energy poverty really mean: the developed countries are burdened by fuel poverty as a matter of affordability of energy/fuel utilization, while the developing countries deal with energy poverty issues as a matter of accessibility to clean energy sources [3,71,98]. The causes, drivers, and impacts of EP on human psychology and well-being are going to be clarified in the following sections.

3.1. Causes and Drivers of Poverty, Inequalities, and Vulnerability

EP has some common interlinkages with the broader notion of poverty. For instance, international organizations such as the World Bank and the United Nations have promoted multidimensional poverty indices based on energy-related, sanitation-related, and health-related issues as well. Meaning that energy deprivation has deeper roots than only addressing affordability and accessibility issues. In essence, it is the stigma of being energy/fuel poor that demoralizes a person to honestly state their living conditions and need for assistance [99,100]. Hence, a psychological aspect of energy/fuel poverty ought to be called for.
Poverty and inequalities push more people into destitution, more commonly referred to as social exclusion [39]. Typically, social exclusion in the context of EP is determined by how a person is able to attain thermal comfort and access to utilities that usher in a decent life. Poverty, inequalities, and social exclusion have been a central focus for Adam Smith, Amartya Sen, and René Lenoir [101,102,103,104], who have talked about the feeling of being ashamed and the social stigma of being poor and vulnerable, especially if you are aged, disabled, or a child. Just transition is based on the Rawlsian theory of social equity, making it a prominent debate on policymaking. Policy frameworks nowadays shed light on inter- and intra-generational equity as well as the idea of “leaving no one behind” (LNOB) [105,106,107]. The notion of EP is totally unnatural to justice, as EP makes people less happy, less free, and less likely to participate in social events due to stigma and a feeling of being marginalized [48,108].
This inspection of how poverty, inequalities, vulnerability, and social exclusion can be lessened [3,4,39,62,65] is in tandem with the matter of how the notion of just transition is attainable, which has been in the spotlight of modern scientific studies in EP [109]. In parallel, when dealing with EP, the goal is not only to reduce these phenomena, but to develop an energy-secure, safe, self-sufficient, and sustainable future [22,108].
Vulnerability to EP has also been addressed in several publications, focusing mainly on the negative externalities of climate change, first on urban agglomeration and planning issues, and second on households’ materials. Briefly, Streimikiene et al. [110] distinguished important drivers of EP in the EU as: (i) accessibility and affordability issues; (ii) low energy efficiency and high energy losses; (iii) divergence between needs due to different individual factors; and (iv) lack of information about energy-related awareness and knowledge. In more detail, there is a plethora of drivers that aggravate the energy poor/rich status of a citizen; however, three core parameters that can be addressed are: (i) income, (ii) energy efficiency, and (iii) fuel prices [3,58,111]. Other drivers of EP could be the indoor or outdoor technical aspects of households or even climatic factors [112].
It would be insufficient to measure only access to electricity when observing energy development, as it covers only the dimension of energy consumption. In Figure 3, it is clear that in OECD and BRICS countries there are differences in average per capita electricity generation, as for example in Central and Latin America, South Africa, and India, where there are even five times lower values.
Indoor technical aspects of households that can aggravate the EP status of a household are, for instance: (i) the burning of rudimentary fuels; (ii) the existence of leakages or damp on walls; and (iii) the inadequate warming (during winter months) or cooling (during summer) of households [113,114]. These issues are interlinked with EP according to people’s basic carbon needs (BCN) and their basic energy needs (BEN) based on their economic and geographic conditions [28,115].
In parallel, there are the outdoor parameters that affect households’ inner temperature and humidity. Firstly, there is the technical urban aspect of how households are being constructed, in essence: do the materials promote resilience to climate change? The EU-SILC takes into account the existence of leakages, dampness on walls, and mold as important indicators of EP [61,71,98].
Secondly, there are the environmental and purely climate change implications, which can contribute positively or negatively to EP. Climate change might aggravate the urban heat island (UHI) effect, which is the phenomenon that high temperatures sustain during the night [116]. In more detail, the UHI effect can be monitored in urban agglomerations during the summer, when the high morning temperatures are not diminishing in the night hours (when typically the temperatures are falling). Hence, there is a difference between the high temperatures in cities and the lower temperatures in rural areas, making climate change a probable aggravating parameter that augments the vulnerabilities of households in greater cities [74,117].
Thus, the territorial dimension ought to be monitored in order to alleviate the indoor (e.g., leakages) and outdoor (e.g., UHI) effects on human health. These phenomena are going to be discussed in Section 3.2 regarding the impacts and in Section 5.2 and Section 5.5 regarding the technical and environmental dimensions of these phenomena.

3.2. Impacts on Health, Psychology, and Well-Being

There is great focus on the implications of EP on public health, on an individual’s psychology, or even on their well-being. The health issues are being provoked either by indoor or outdoor parameters. For instance, the utilization of rudimentary cooking stoves or the impact of UHI might aggravate human-made infrastructure. In parallel, being unable to keep a house warm during the winter or cool during the summer might have negative impacts not only on health but on a person’s well-being in general. The problems mentioned are going to be thoroughly examined in this section.
Hence, the categorization of indoor means of cooling or heating is necessary. A way to illustrate the transition from energy-poverty-stricken countries to a more clean and sustainable future is the energy ladder [118,119,120,121]. Countries climb the energy ladder as they develop; however, there lies the conundrum for fossil fuel-rich countries, which do not adopt renewable energy methods due to their access to fossil sources [118]. The energy ladder in Figure 4 briefly illustrates several means of heating, cooling, or communication in a transitional concept from rudimentary technology (e.g., abacha (“Abacha” stove is used to burn every possible fuel and is a very rudimentary form of cooking as it was used during kerosene shortages [122]), firewood, animal waste) to middle-transitional level (e.g., charcoal, coal, kerosene) and to more eco-friendly advanced technology (e.g., liquified petroleum gas (LPG), biofuels, and electric cookers).
What really matters are the implications of EP on human health, either in developed or developing countries. A necessary theoretical background is an integral part of policymaking due to the complexity of deciding which strategy is more appropriate to deal with EP. Hence, it is important for policymakers to have choices on which eco-friendly and energy-efficient recipes are provided either for developed or developing countries.
In Figure 5, it is apparent that access to clean cooking was in an unfavorable condition, especially in rural areas. Even some OECD countries (Costa Rica and Türkiye) had almost 80% access in rural areas in 2000, or, even worse, had low access to clean cooking. For example, the rural population in Mexico with access to clean cooking has risen from about 50% in 2000 to about 60% in 2020. Similarly, the rural population in Columbia with access to clean cooking has grown from about 35% in 2000 to almost 65% in 2020. In comparison with the BRICS, there is a better performance in the OECD, as, for example, India had the least access with about 5–10% in rural areas in 2000 and reached only a bit above 50% in 2020.
The percentage of access to basic sanitation is depicted in Figure 6 and shows that there is again a discrepancy between the OECD and the BRICS. Only a few OECD countries have not reached 100% access, mainly in rural areas. Regarding the BRICS economies, Russia and Brazil will have the highest values in 2020, followed by China, South Africa, and India on average scales. The BRICS attain high levels of access to basic sanitation in urban areas, with almost 80% or more in comparison to rural areas that reach lower sanitation levels, though the rural population seems to have ameliorated its standards looking back to 2000.
EP can be detrimental, especially to rural populations, primarily due to non-modern ways of cooking food. Several studies have shown that in advanced countries, rudimentary cooking and heating methods utilize energy-inefficient coal-burning stoves [30,123,124,125]. The utilization of primitive or even transitional fuels is accompanied by the emission of harmful air pollution particles such as PM 2.5, carbon oxide (CO), and carbon dioxide (CO2) that can augment morbidity and mortality levels [23,114,126]. Whereas, people who live in cold homes might have asthma, heart diseases, or even strokes, based on the literature [62]. All these health issues have appeared due to worsening indoor air quality (IAQ).
Another issue of EP is access to basic drinking water services, which are of utmost importance not only for sustainable development but primarily for survival reasons. Hopefully, in Figure 7, both the OECD and BRICS seem to have above 95% access to basic drinking water services in 2020, making it possible to attain universal access to clean water in the upcoming years. The lower values can be spotted in India, China, and South Africa in the BRICS and in Latin America in OECD countries.
In parallel, high fuel prices make ends meet in developed countries; in addition, when a household cannot be kept cool or warm, there might be mold on the ceilings or walls. The Environmental Protection Agency (EPA) in the USA [127] noted that mold is able to produce allergens, irritants, and potentially toxic substances, which are called mycotoxins. Mold is typically derived from high humidity [73,110] and can lead to temperature-related health problems such as irritation, allergies, dermatitis, or asthma [58,59,127]. According to the American Society of Heating, Refrigeration, and Air Conditioning Engineers (ASHRAE), it is also possible that building water systems or improperly maintained air conditioning in coexistence with mold might be an indication of legionella in very rare situations and that of legionellosis (in Standard 188, it is stated that Legionellosis can provoke two different illnesses: the less severe influenza-like illness (i.e., “Pontiac fever”) and the pneumonia by the bacterium Legionella called “Legionnaires’ disease” (LD) and can cause lung diseases [128]), as in Standards 12-2020 and 188-2021 [128].
More specifically, Figure 8 depicts some health problems related to low indoor temperatures. To exemplify, lower temperatures than the safe temperature range (18–24 °C) might provoke respiratory problems (<16 °C), circulatory problems (<12 °C), or even hypothermia (5–6 °C) [58,129]. Furthermore, rising outdoor air pollution might aggravate premature mortality on a global scale [112,113], as it creates a vicious circle with poor indoor conditions.
Bearing in mind the above energy-related health issues, EP can also provoke problems in individuals’ psychology and well-being. Next in order, what happens in psychology and well-being? As mentioned before, stigma and social exclusion are some of the adverse effects of EP. Harrington [100], Boardman [99], and Hills [58] illustrated some examples of psychological and well-being problems due to EP as follows:
  • A person might express denial to accept its fuel-poor status due to its pride;
  • People conceal information during interviews;
  • People go to bed earlier (for example, at 7 o’clock) in order to not feel cold and become socially isolated;
  • People become more socially excluded as they do not welcome others to their houses and cannot keep their houses warm;
  • EP might cause asthma in children;
  • Children might not go to school for some covert reason(s) linked to EP; hence, poor educational attainment and truancy are also important matters for a kid’s educational pathway;
  • Children and retired people feel more stress, less comfort, and more depression.
  • Retired people become withdrawn and limit their expenses solely to keeping their house warm;
  • People feel that they are being “trapped in a vicious circle”.
In total, keeping a house warm adequately during the winter or cool during the summer is a matter of social acceptability. The above psychological and well-being problems aggravate physical health and mental conditions too. Hence, it is important that such conundrums be answered in order to ameliorate, firstly, the indoor conditions of house and secondly, and most importantly, the well-being of citizens.

4. Approaches on Measuring Energy and Fuel Poverty

Academic and institutional literature uses mainly two approaches when dealing with the matter of EP. More specifically, the two main approaches are the consensual and the expenditure-based approaches. These approaches establish the main methodology on which a survey, a study, an indicator, or even a framework is going to be based. Hence, it is of utmost importance that the core advantages and disadvantages of these approaches be clarified.
On the one hand, the consensual approach utilizes the results of surveys that include the self-reported responses of citizens. Then, the collected surveys are decoded and interpreted, so one can distinguish if the household is fuel- or energy-poor or not. However, what is the main reason for creating a consensual approach?
In the 1980s and 1990s, there was a debate over “who is poor?” and “how poor is too poor?”. These two questions were the central idea of a 1983 questionnaire (the Breadline Britain) that tried to create a framework for dealing with such conundrums. One of the most relevant publications that adopted a conceptual approach is the book “Poor Britain” by Mack and Lansley [130], who mentioned Professor A.H. Halsey’s quote:
“let’s vote all together on what we think constitutes poverty. If you get some kind of social consensus about that definition, then that actually fits the reality of what people experience” Mack and Lansley (pp. 47–48) [130].
In total, having the capability to gather all people and have them answer one well-structured questionnaire, it might be probable to have a universal democratically-created and socially acceptable answer to what really constitutes poverty, or, on the present study’s idea, what does energy and fuel poverty really mean? Of course, this might be impossible due to economic and time restrictions, but it is our age that could find an answer. Nevertheless, some of the disadvantages of the consensual approach, as illustrated in Table 1, are based on these assumptions.
Academic literature finds disadvantages in the subjectivity of people’s answers, which create problems with the accuracy and reliability of the results [14,54,61,98]. In addition, the binary nature of the utilized indices might not capture the depth of EP [14].
In contrast, the consensual approach focuses on “socially perceived necessities” [130], evaluates energy deprivation [131], and can delve into social exclusion and material deprivation as well [61,132]. Furthermore, the consensual approach is characterized by a simpler methodology compared to the expenditure-based approach [61] and can take into account the multidimensionality of EP [63]. In essence, while there are some unfavorable elements in the consensual approach, there are potential ideas that can make this approach go further on the measuring of EP, principally due to the inclusion of the multidimensionality of poverty.
On the other hand, the expenditure-based approach is based on the book Fuel Poverty: From Cold Homes to Affordable Warmth by Boardman [2], in which if a household’s energy-related expenses exceed 10% of its income, it is deemed as fuel poor. The utilization of a threshold is proper when using this approach; however, some dangers loom, such as the arbitrariness of the selected threshold or the selection of an arbitrary cut-off point that might have misleading results [54].
This index has been replaced by the “Low Income High Cost” (LIHC) index [59], but nowadays the “Low Income Low Energy Efficiency” (LILEE) proposed by BEIS/bre [133] has taken the place of the previous two indices in the UK. The LILEE indicates that a fuel-poor household (i) has been rated as energy inefficient and (ii) if all energy-related costs “disappear” the disposable income and render it below the poverty line.
Table 1. Comparison of the consensual and expenditure-based approaches.
Consensual ApproachExpenditure-Based Approach
AdvantagesDisadvantagesAdvantagesDisadvantages
Proper for measuring poverty intensity, if the survey uses pre-set responses to close-ended questions [14]Subjectivity creates reliability and accuracy issues [14,54,61,98,99,109]The threshold is chosen based on externally investigated levels of material and social deprivation [54]Misleading results due to arbitrary threshold and cut-off points [54,131]
Can retrieve information about social exclusion and material deprivation too [61,132]The binary nature of consensual indicators [14]Comparability if there is standardized data [54,131]Single indicators should be avoided due to multidimensionality [14,98]
Incorporates socially perceived necessities [130] Simple and quantifiable [54,61,98]Confusion if the index is purely poverty-focused or inequality-based [54,134]
Simple methodology on how to collect data [61] Availability of detailed data on housing conditions [131]Subsidies for covering disability-related needs are being expended on energy-related needs [60]
Evaluation of energy deprivation [131] Utilization of absolute or relative thresholds [61](The 10% approach has) Complex methodology [61]
It considers multidimensionality [98] Objectivity [61]Tyranny of numbers’ might mislead from the real EP households’ needs. [61,100]
Evaluation of energy deprivation [131] Takes into account monetary aspects [98]
There are several reasons for measuring EP based on expenditures. Some of the disadvantages are that there is confusion among some indices about whether they are truly poverty indices or if they belong to inequality indices [54,134]. There is also a risk that the selected expenditure-based index might rate some relatively wealthy households as fuel poor [131]. Naturally, the uni-dimensional indicators are not widely preferred [14], as they omit important aspects of EP [98].
In essence, it is the objectivity of expenditure-based indices that overcomes many problems that can appear with a consensual approach [61]. Moreover, these indices take into account monetary aspects of EP [98], making a study comparable to other studies with the same index [54,131]. The bottom line of the expenditure-based approach is its comparability to other studies due to the monetary aspects that offer a practical element to this approach.
There are also some other approaches, such as the temperature-based and the outcome-based [12,98]. In addition, there is also the direct approach, which has the advantages of transparency [54] and compatibility [14], but it is very labor-intensive [54], and households with central heating systems might appear to have distortions in the EP measurement [109]. The above approaches are significant during the construction of indices that measure the impacts and effects of EP. Bearing in mind the five aforementioned approaches, it is now possible to continue with the dimensions of EP.

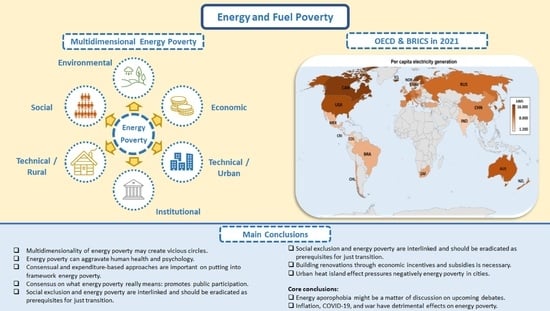
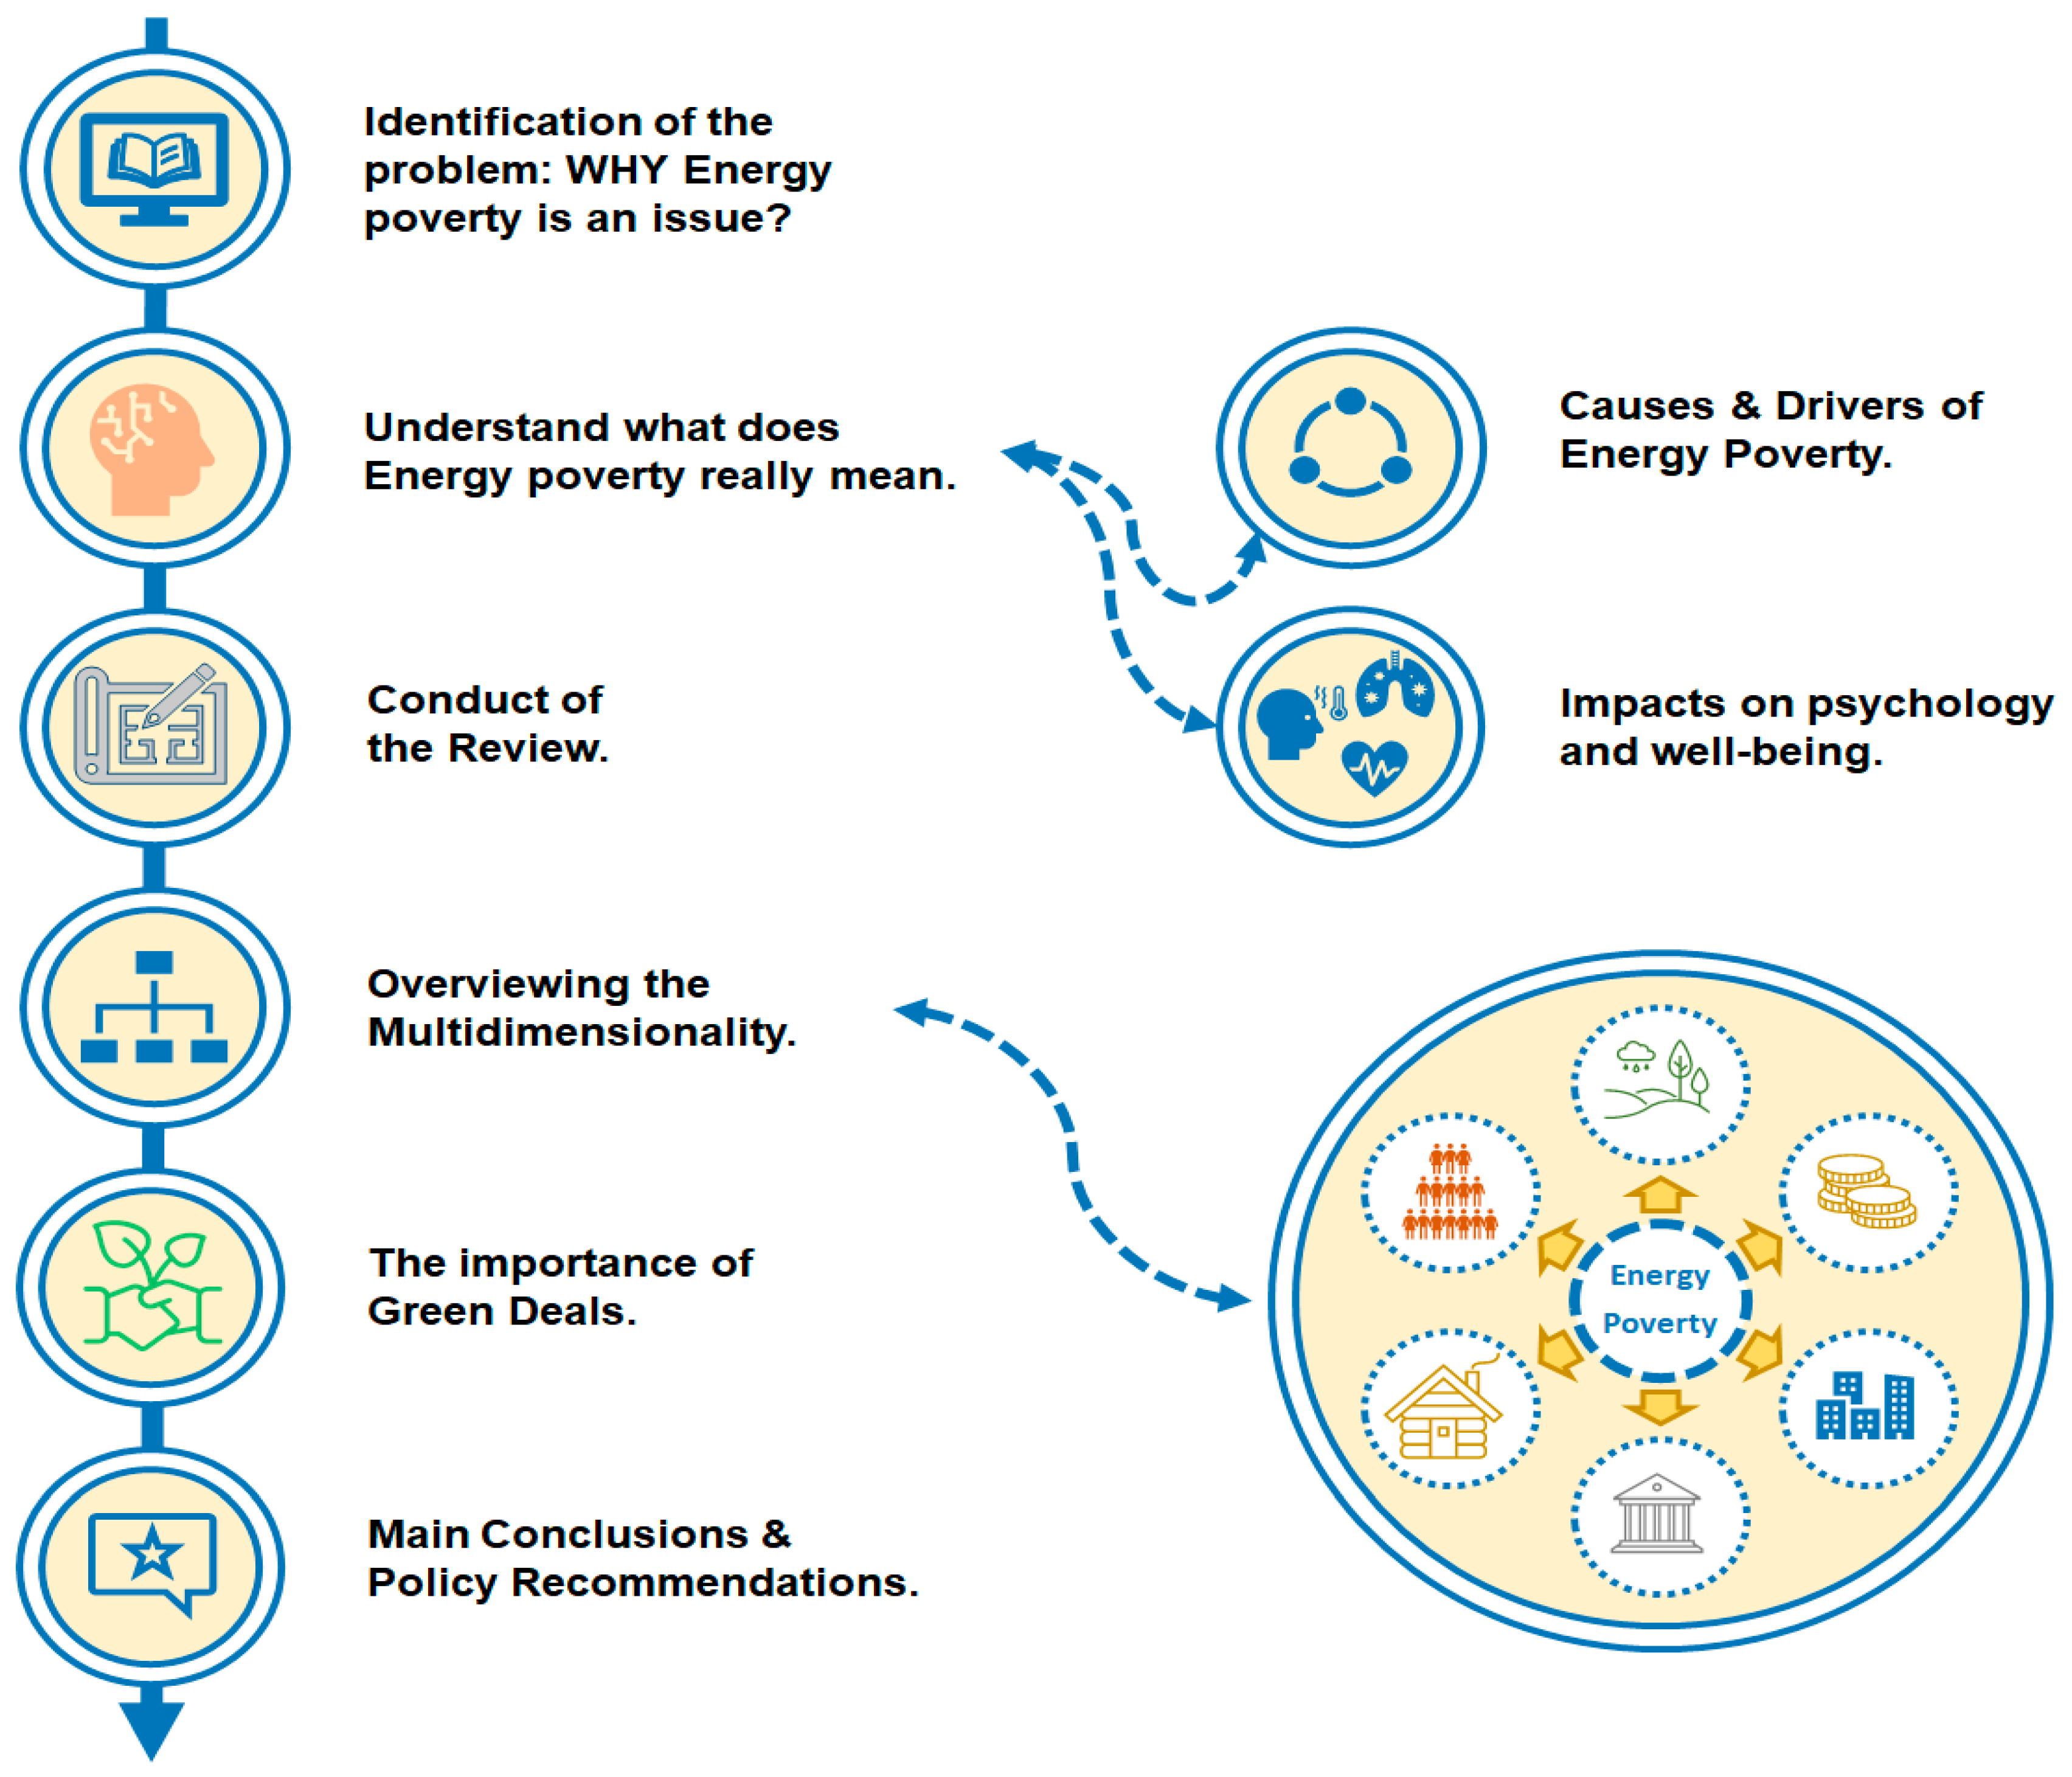
5. Overviewing the Multidimensionality

The wide notion of uni-dimensional poverty has been studied in the 20th century, even though the advent of the 21st century has brought about the necessity of measuring poverty in a multidimensional way. Multidimensional poverty has been thoroughly examined by Bourguignon and Chakravarty [135], who took into account monetary and non-monetary elements of essential living standards for a decent life.
Furthermore, Alkire and Foster [136] incorporated various socioeconomic factors because the omission of the non-monetary nature of poverty leads to misleading results. For example, the non-monetary elements of poverty were more difficult to monitor during the COVID-19 pandemic due to the complexity of the issue compared to the monetary dimension [137]. Hence, it is important that the extent (how many people EP affects?) and the depth (what is the degree to which people are affected by EP?) of the problem be measured [58,59].
The United Nations Development Programme (UNDP), in coalition with the Oxford Poverty and Human Development Initiative (OPHI) at the University of Oxford, initiated the first global multidimensional poverty index (MPI) in 2010 and the moderate multidimensional poverty index (MMPI) in 2022 [138,139]. Both MPI and MMPI consider the necessity of measuring educational, health, and sanitation issues based on ten broad deprivations [139,140,141,142]. In parallel, the World Bank created in 2018 the multidimensional poverty measure (MPM), which incorporated monetary and nonmonetary elements [137,143,144]. In Table 2, there is a comparison between the MMPI and MPM on the specific dimensions for the energy-related poverty and connections to the SDGs. SDGs 1, 6, 7, and 11 are important as they have built a framework that promotes the LNOB idea by “prioritizing interventions for the poorest of the poor” [106,141].
The multidimensionality of EP has been a central idea in recent academic literature as well as in policymaking institutions and governments [131,145,146]. Nonetheless, there is a plethora of barriers that aggravate the multidimensional nature of EP [21,23]:
  • corruption;
  • local opposition;
  • failure to include externalities;
  • political and institutional instability;
  • underinvestment in electricity infrastructure;
  • the lack of high-quality standards and certification.
With these barriers to the measurement of multidimensionality in mind, the following sections are going to reveal the inner, covert aspects of multidimensional EP. The affairs of energy security, vulnerability, and fuel or energy poverty can be depicted in Table 3. Energy security is a very debatable theme nowadays due to COVID-19, the inflation in energy prices, and war; however, the ESI [22,147,148] and AESPI [149,150] indices might provide useful information about proper and robust policies. Furthermore, the GVI [151], the GEVI [152], and the EPVI [69] indices could be very insightful for policymakers, when they deal with energy vulnerabilities in local, regional, and national study areas.
In addition, common FP indices are the 10% share of income or expenditure [2,44,68,73,153], the LIHC [59], and the LILLE [133]. In addition, the AHC [13,58] and the MIS [13,55] are very useful in providing a framework for the aforementioned three indices. Other fuel poverty indices that have provided similar but distinctive features of this phenomenon are the FPI [154], FPPRI [53], the FGT and the modified-FGT [94,156], and the MFT [146,157]. Whereas, the EP is being critically assessed by uni-dimensional, composite, or integrated indices such as the MEPI [26,27,28,29,30,31,131], HEPI [158], EPB [159], and EU-SILC indicators [62,71,98].
The arrears on utility bills and the inadequacy of keeping homes warm during the winter season are indications of FP based on EU-SILC surveys. In Figure 9, the greatest rise in homes that are inadequately kept warm is in the Western EU, where it reached 26%. On the other hand, there are decreases in this standard; more specifically, a better image of dealing with FP can be seen in the Southern, Northern, and Central and Eastern EU regions, respectively. Moreover, the arrears on utility bills between 2011 and 2021 have been cut in every EU-28 region. However, where does FP reach its greatest values? The answer is that in absolute terms, Spain, Greece, Portugal, Cyprus, Lithuania, and Bulgaria had from 21% to 32% inability to keep homes warm in 2021, next in order, regarding the utility bills. Cyprus, Spain, Hungary, Croatia, Bulgaria, and Greece had arrears that ranged from 22.8% to 49.8% in 2021.
Bearing in mind the barriers to multidimensionality and having also noted several publications with uni-dimensional or multidimensional aspects of EP, it is necessary for academic reasons to state the specific components of multidimensionality. The succeeding sections focus on the social (Section 5.1), technical (Section 5.2), economic (Section 5.3), institutional (Section 5.4), and environmental (Section 5.5) dimensions of EP.

5.1. Social Dimension

It is common in EP publications to mention phenomena such as social exclusion, which is an individual-focused approach, as EP can aggravate disabled people’s living conditions [60]. Moreover, EP might provoke social withdrawal in older people [100,162] and absenteeism in children who avoid going to school [99,162].
Social exclusion can ignite phenomena such as “aporophobia”, as described by Cortina [163]. Aporophobia derives from the Greek words “aporos” (poor) and “phobia” (fear). This term encompasses the aversion to poverty, especially when having to deal with impoverished and vulnerable people (e.g., migrants and Roma people) [164,165]. It is now time to reflect on whether this nomenclature can be specified for the energy poor too, making energy aporophobia the result of COVID-19, inflation in energy prices, and war in Eastern Europe [39].
Additionally, EP can be linked to national-focused approaches. A phenomenon that might incite greater levels of EP is energy security. Energy security destabilizes energy prices and can precipitate regional supply shortfalls, according to Bielecki [166]. Gasser [167] mentioned a wide range of typically different conflicts, such as the terrorist attacks in the USA, environmental phenomena, and the Russo-Ukraine gas dispute at the beginning of the 21st century, but all these phenomena are linked to global energy insecurity. Nowadays, the REPowerEU is trying to alleviate the Russia-Ukraine warfare impact in order to stabilize the inflationary price phenomenon and the disentanglement of EU energy security policy from Russian oil and natural gas [38,39,40,41]. Making contribution to building resilience towards EP should the conflict continue.
Hence, the social importance of energy is undoubtedly a central theme for every government, especially during an era of inflation, pandemics, and war. Policymakers ought to focus more on the safeguarding of basic human needs, the protection of infrastructure possible via subsidies, and securing energy-related sources under the scope of the SDGs in order to build resilience and cope with energy vulnerability and exposure to exogenous pressures such as the aforementioned phenomena.

5.2. Technical Dimension: Urban and Rural Aspects

Environmentally sustainable design concepts also include aspects related to the commercial and residential heating, ventilation, and air conditioning (HVAC) factors. Among several considerations, a significant topic is the monitoring of air quality throughout the design and construction stages of a building’s life. The technical dimension in this section consists of the framework provided by an international organization, the EU, and the UHI effect due to building materials and climate change.
Building resilient and sustainable cities is based on properly constructed and maintained buildings, and especially households should follow some guiding principles in order to have clean and safe HVAC conditions. A solution might be through energy audits on existing buildings through energy efficiency measures (EEMs) and energy conservation measures (ECMs) [168]. Moreover, energy audits could offer practical ways to attain climate change mitigation, specifically when provisioning cost savings for energy-vulnerable households [70,74,169].
Furthermore, the ASHRAE has focused on framing the building environment through standards and guidelines with the aim of ameliorating the IAQ. More specifically, ASHRAE [128] has standards related to building infrastructure that are related to EP as: (i) the ventilation and acceptable IAQ in residential buildings (standard 62.2-2022), (ii) energy-efficient design of low-rise residential buildings (standard 90.2-2018), and (iii) energy efficiency in existing buildings (standard 100-2018).
What happens to the energy efficiency and energy performance of buildings in the EU as part of the circular economy? The EU has also created a robust institutional framework of guidelines, regulations, and directives that formulate energy resilience based on general economic factors, but they can be directly or indirectly linked to EP. Firstly, the security of energy supply is protected by the objectives of the Energy Union, particularly the targets for 2030 [170].
Secondly, the directive 2019/944 (in articles 28 and 29) necessitates the protection of vulnerable consumers from disconnection of electricity if there are issues on: (i) the share of energy expenditure of disposable income; (ii) household’s energy efficiency; and (iii) critical dependence on electrical equipment due to a wide range of reasons (age, disability, or even if the household is in a remote area). Thirdly, the EU strategy on heating and cooling centered on the quote “big savings can be made through simple renovations”, such as the implementation of better insulation in attics or walls and the installation of double or triple glazing [129,171]. Another useful way for further upgrading a modern house might be a solution such as green roofs or well-rounded vegetation on public spaces [172], which can usher in direct or indirect positive contributions to urban sustainability.
Fourthly, the directive on energy efficiency (EED) [173] laid down principles on removing barriers in the energy market and reaching a 27–30% target of energy efficiency for 2030. Last but not least, the directive on energy performance of buildings (EPBD) [174] is linked to the circular economy and endeavors to alleviate EP and GHGs by at least 40% by 2030 in comparison with 1990 levels via green solutions such as the incorporation of renewable energy sources (some useful information is on the directive on the promotion of the use of energy from renewable sources [175]).
Comparing the OECD and BRICS on the matter of access to electricity, the BRICS had lower values (especially India and South Africa) at the beginning of the 21st century (Figure 10), whereas the OECD had almost 100% access in urban areas. It could also be noted that rural areas, even in OECD countries, had lower access to electricity; nevertheless, in 2020, all countries had ameliorated their levels on this parameter.
Another important aspect of the technical dimension is the vulnerability of buildings to climate change under the scope of UHI effect. Especially in the Mediterranean, there are three factors that create complexity that can destabilize the “urban energy balance” due to the UHI effect on urban agglomeration: (i) the morphological characteristics; (ii) how compact the households are; and (iii) how dense can the buildings be [116,117]. As stated before, the UHI is a phenomenon that describes the inability of buildings to reject the high morning temperatures during the nighttime, resulting in a non-decreasing temperature in urban environments in comparison to rural areas. Rural areas cool down faster than urban areas because there are fewer buildings in the former areas. Hence, this discrepancy creates thermal discomfort, specifically for vulnerable social groups such as the elderly and children [162]. As a result, it is difficult to attain urban sustainability based on SDG targets and principles without solving the above concerns.

5.3. Economic Dimension

Global poverty can be measured through the incorporation of monetary aspects such as income or expenditure levels. After that, by constructing poverty cut-off points that create a threshold below which a person or household can be deemed poor. Typically, such measures are created based on “a bundle of basic goods” [176] that include food needs, BENs, and BCNs. Headcount poverty, the poverty gap, or poverty severity indices are common measures of global poverty [39,139,177].
In parallel, how can pure monetary aspects be indirectly linked to energy poverty? Mirasgedis et al. [178] found that energy efficiency interventions can be impacted—positively or negatively—by employment effects. These effects have been monitored through cost-benefit analysis (CBA). Further economic aspects of EP have been noted on the EPMI index of Bollino and Botti [131] and the HER index by Sánchez-Guevara Sánchez et al. [179]. Song et al. [5] distinguished three economic-driven approaches: (i) the energy budget share, (ii) the energy consumption of people in proximity to the poverty line, and (iii) the energy demand that is extricated from income pressures. These approaches can be linked to the expenditure-based approaches that have been mentioned before in Section 4.
Electricity prices in households have risen in 2019 compared to 2009 levels in almost all groups, except for the higher prices in the BRICS and the lower prices in the OECD (Figure 11). In essence, based on 2019 maximum electricity prices, the EU and OECD had about €300/MWh, whereas in the BRICS, the maximum values were about €200/MWh. Additionally, the minimum prices in the EU are double compared to both the OECD and BRICS, making it clear that the electricity prices are lower in BRICS, followed by OECD (non-EU) countries, and with greater prices in EU member states.
Another economic aspect that ought not be neglected is the adoption of renewable energy sources for electricity, for several reasons. Firstly, the more the GDP per capita rises, the more the utilization of fossil fuels in final energy consumption is diminished, and vice versa; also, the more the renewable share is rising, the more a household can adequately be kept warm [63,71]. Secondly, it is a matter of what the state is going to subsidize; it has been proposed that the state ought to promote economic incentives and subsidies for the adoption of renewables [181]. Based on the previous publication, it was made apparent that if renewable energy adoption costs were implemented as a regressive tax, that would be detrimental for vulnerable people and would aggravate EP.
Undoubtedly, the energy and natural gas prices have augmented their interrelationships with the EP levels, as the higher expensive the prices become, the more expenses on energy-related fuels are going to be. As a result, a greater share of households ought to spend more of their income on BENs and BCNs. The following figures are going to show several alterations in retail prices, either for electricity or natural gas.
In Figure 12, in 2019, the prices of natural gas have increased in the BRICS and EU, but not in the OECD, compared to 2009. The highest rise took place in maximum EU natural gas prices, whereas the highest decrease has been noted in maximum OECD countries, making the differences in EU and OECD to be trimmed and attaining about € 120/MWh.
In essence, the economic dimension of EP is an important issue for academic society and policymakers as well. The economic dimension creates complex interconnections with the other dimensions; hence, it was important to simplify these intertwined relations on the basis of the SDG agenda.

5.4. Institutional Dimension

It is an inclusive institution (institutions can be generally categorized into inclusive (or open or democratic) and exclusive (or authoritarian), the former providing incentives and opportunities to citizens while the latter not to such an extent (for more information, please see Acemoglu and Robinson [182]) that takes people’s needs into account. Non-direct democracy might be an indication of exclusive institutions, particularly the planned economy systems, which were adopted by seemingly exclusive institutions. For example, the former socialist states were some special case studies on how much EP was apparent.
The academic literature found that former communist countries had higher levels of EP than western European democracies [4,62,153]. The reason was the transition from a controlled economy to a free market as well as the stoppage of energy subsidies in order to create commercial energy markets.
The answer to EP from an institutional perspective is the building of a self-sufficient, secure, and sustainable system. Furthermore, promotion of public participation and eradication of corruption are integral parts of the LNOB idea and sustainability.

5.5. Environmental Dimension

The environmental dimension of EP sheds light on affairs involving either indoor or outdoor pressures that destabilize a decent life full of energy self-sufficiency. For example, clean energy utilization is intertwined with EP [111,183], as shown in the energy ladder (Section 3.2). The reason why is mainly due to the emission of PM 2.5 and GHGs if rudimentary—cooking or healing—means are utilized, such as solid fuels [113,114].
Furthermore, the number of cooling degree days (CDD) and heating degree days (HDD) are decisive for a household’s proper maintenance, as they are potential indicators that show how much energy is needed to have an adequately warm (during winter) or cool (during summer) house. Nevertheless, the impact of EP can provoke destabilization of a household’s adaptive capacity during heatwaves in the summer [172,183]. This is linked to the UHI effects when, especially at night, the temperatures do not cool down due to the adjacency and density of buildings, which withhold and cannot reject the temperature related to the sun’s radiation [74,116,117].
The environmental dimension elaborates complex linkages to EP; however, the main indoor and outdoor factors that can aggravate EP, referring to the environmental dimension, are the aforementioned. Naturally, the socioeconomic dimensions can also destabilize a household’s energy efficiency through income reduction, inflation in energy retail prices, and phenomena such as social exclusion and aporophobia. As a result, the core environmental dimension is crucial for SDG policymaking, as it is an intrinsic part of just transition and sustainable development.

6. Green Deals and Their Impacts on Energy and Fuel Poverty

The present section will delve into the interlinkages of green deals related, directly or indirectly, to energy issues and specifically to EP. Since 2007, a series of discussions have ignited on the need for a new deal based on Franklin D. Roosevelt’s idea, not solely an economy-driven new deal but a “Green new deal” (GND) [184]. The idea has roots that can be found in the 1990s, but again, T. Friedman [185] in 2007 called for “ending the addiction to oil” and turning towards the adoption of renewables based on two crucial factors: government regulation and prices. Nowadays, the GND in the USA necessitates establishing energy-efficient and smart power grids that can safeguard affordability for electricity prices [34].
The GND debate has two phases: GND 1.0 and GND 2.0, which might partially deny the orthodox economic nomenclature that tries to cope with externalities, but the GND takes as a basis that “climate emergence… is part of a social crisis” [184]. This is also the basis of the question that Mastini et al. [184] posed: a GND without growth? Because it is possible that in order to achieve the targets of the GND, it might be a question of whether there should be a growth-oriented or a degrowth-oriented agenda.
In parallel, in 2019, there was the proposal of the “European green deal” (EGD), whose aim is to tackle energy poverty and promote just transition [33]. The EGD frames a series of actions that deal with affordability of energy services and prices as well as the financing of renovation schemes. Bloomfield and Steward [186] found several common grounds between the GND and the EGD; additionally, they distinguished an opportunity for the promotion of green deals in the post-COVID-19 era.
“Energy in China’s New Era” is a white paper from the Chinese Ministry of Ecology and Environment that gives prominence to the eradication of poverty and commitment to the “energy revolution”. More specifically, this is the first of the guiding philosophies on energy policies that is called “putting people first” [43]. Nonetheless, this white paper is not called a green deal, but it incorporates many elements, principles, and characteristics that a green deal has. Furthermore, China in the new era aspires to increase its energy projects, as it recognizes the energy element as a driving force that impedes poverty alleviation. These projects target the installation of photovoltaic panels; more specifically, China inaugurated solar power stations that generate almost 26.6 million kW and about 1.25 million jobs each year. In essence, relative to EP, China deals with poverty via the adoption and utilization of renewable energy sources.
Another initiative is the network of the 100 world-leading cities, the “C40” that inaugurated the “global green new deal” (GGND) [187]. The GGND endeavors to scale up actions on the climate crisis and the promotion of urban sustainability. For example, the GGND aims to phase out fossil or solid fuel heating and cooking in more detail; only one city has achieved that in 2011, but 10 cities have reached this goal in 2021. Other aspects in 2021 center on renewable energy mandates for buildings (i.e., 10/100 cities), improvement of water system efficiency (i.e., 14/100 cities), and retrofitting programs for private buildings (i.e., 26/100 cities), to name but a few. In general, the GGND aims to ameliorate of urban agglomerations and advance urban sustainability.
The present section mentions three green deals and one white paper that have common characteristics. To recapitulate, the most practical seems to be the GGND due to its applicability in the 100 leading cities that have the know-how to apply radical changes. However, the GND, the EGD, and the Chinese white paper ought to be accompanied by more detailed mentions of EP, not only on theoretical background but primarily on applicability concerns. In essence, all four frameworks are well-rounded, but it is necessary to adopt a more hands-on nature.

7. Discussion and Future Directions

EP has multifaced impacts on SED as it comprises notions such as vulnerability, deprivation, and insecurity due to accessibility and affordability issues during pandemics, inflation, and wartime. More specifically, EP drivers such as augmented energy losses due to inefficiency in building infrastructure, divergence between stakeholders’ needs, high share of energy-related expenditure in comparison to the level of disposable income, and exogenous pressures such as climate and energy crises provoke severe implication on human psychology and social wellbeing [4,71,172].
Undoubtedly, the rudimentary cooking and heating appliances might aggravate human health if there are emissions such as CO, CO2, or other GHGs [122,123,124,125]. However, this is more typical in developing countries. The developed countries cope with affordability issues that are linked to inadequacies in keeping homes warm during the winter and cool during the summer. Another indoor aspect is the appearance of mold on the walls or roofs. Mold is not totally harmful, but if there is expansion of mold, it can provoke illnesses, such as Pontiac fever, as mentioned before [128,188].
The HVAC aspects ought to follow standards provided by ASHRAE. By having well-structured HVAC elements implemented, it is possible to ameliorate indoor conditions and hence, to some extent, reduce EP. Necessary are also the directives and initiatives such as the EED and EPBD; this framework is not yet applied exclusively in the EU [173,174].
Furthermore, the UHI effect reveals interconnections between poor building performance and climate change pressures on urban areas; hence, energy audits are a novel need that ought to be clarified [116,168]. Energy audits might provide useful information on how to improve a building’s performance and conserve electricity from a circular economy perspective.
Governance policies that deal with carbon neutrality, just transition, and green deals are directly or indirectly linked with EP as well [64,109,110,145,180]. The multidisciplinary nature of EP has made it apparent in almost every policymaking agenda related to environmental problems. EP combines socioeconomic and environmental elements, as noted before.
Having in mind the research hypothesis, it has been noted that there may be no difference between the OECD and BRICS on the matter of multidimensional EP; hence, let us shed light on this hypothesis. On the pure monetary aspect of multidimensional EP, there are better conditions in BRICS compared to the OECD on the prices of electricity and natural gas for household retail prices, as shown in Figure 11 and Figure 12. The pure economic aspect is important in defining a problem, as it is easier to compare and understand. Nevertheless, multidimensional EP also takes into account access to clean drinking water services and sanitation, as shown in Figure 5, Figure 6 and Figure 7, in which the OECD performs better on all these elements that are linked to the health, psychological, and well-being aspects of a decent life. OECD countries seem to be in better condition when copying with multidimensional EP in comparison to BRICS economies. Furthermore, on the technical dimension, the percentage of people with less access to electricity can be found in BRICS, as shown in Figure 10.
A matter of great importance is the availability of data, as the current review utilizes data until 2021 in order to cover the impact of COVID-19 but cannot cover the aftermath of the pandemic. The same problem also relies on the impacts of inflation and conflicts that aggravate people’s lives to a great extent. Future directions might show a totally different image, but the polycrisis phenomena such as public health, financial, and war crises put multidimensional EP agendas on frivolous agendas—and this is a problem. Thus, the present review tries to promote the notion of multidimensional poverty at a similar weight to other crises, as people suffer from it as well and, in many times, it is a hidden problem (as hEP in Table 3). In future developments, the matter of discussion around global multidimensional poverty might be the alignment of the indices from the World Bank and the United Nations at Table 2. This might usher in better understanding between academicians and policymakers as well. Having a common global poverty index would also enable the building of a common understanding of multidimensional energy poverty.
Human development has been linked to the technological transformation and the increase in wealth since the industrial revolution [189,190], but EP has been in the academic literature almost forty-fifty years now. After all, the green deals might provide a solution to this conundrum through the implementation of the LNOB idea and by “prioritizing the poorest of the poor” under the circular economy and SDGs (1, 6, 7, and 11) scope [65,82,98,106,107,191,192].

8. Policy Implications and Conclusions

The multidimensional nature of EP is being monitored by a multidisciplinary academic literature. Social, technical, economic, institutional, and environmental elements provide necessary aspects that ought to be covered in line with multidimensional energy poverty. There are several dilemmas that should be answered in order to eradicate EP.
On a theoretical basis:
  • Consensual and expenditure-based approaches are important for framing energy poverty;
  • Temperature-based or outcome-based might be subject to inner distortional problems;
  • Consensus on what energy poverty really means: promotes public participation.
  • On an environmental basis:
  • IAQ aspects ought not to be neglected: PM 2.5 and GHG emissions due to rudimentary cooking and heating methods have detrimental effects on human health;
  • Environmental aspects such as the urban heat island effect pressures, the exogenous environment of building infrastructure, and EP are intertwined with such phenomena, especially in urban areas.
On an institutional basis:
  • Strengthening of democratic decision-making;
  • Promotion of public participation;
  • Institutional cooperation on the integration of green deal goals;
  • Copying with corruption.
On a technical basis:
  • Governmental incentives and subsidies for building renovations are necessary on a circular economy basis;
  • Urban heat island effect pressures negatively affect energy poverty in cities;
  • Adoption of renewable energy sources, possibly through microgrids;
  • Building renovations through economic incentives is necessary.
On a socioeconomic basis:
  • Social exclusion should be observed in order to minimize the psychological and mental adverse effects of social isolation;
  • Inflation due to the war ought to be restricted in order to minimize the provoked impacts on further EP;
  • Energy-related aporophobia might be a matter of discussion in upcoming debates.
On a multidimensional basis:
  • EP creates vicious circles;
  • Affordability and accessibility issues are apparent in developed and developing countries, respectively, making fuel poverty and energy poverty similar but different problems that ought to be monitored more precisely.
Briefly, energy and fuel poverty have many dimensions that should be observed before being assessed and analyzed. The book of Mack and Lansley posed the question, “how poor is too poor?” [130] and since then, the multidimensionality of energy and fuel poverty has been monitored by several academic and political institutions. As a result, a vicious energy (or fuel) poverty circle is created.
The vicious circle of high prices due to inflation creates affordability issues. Affordability problems provoke negative effects on people’s well-being as they become anxious, depressed, and self-isolated. These psychological and well-being pressures lead to social exclusion, with aporophobia being the last level of this vicious circle. However, it is the vulnerability of children and elderly people that renders energy and fuel poverty an alerting problem that must be resolved.
Especially in times of inflation, COVID-19, and war, the ramifications of these exogenous phenomena on EP and people’s lives are detrimental. Potential cooperation and integration of the green deals might offer a more cohesive policy framework in order to cope with EP. Above all, the monitoring of these poverties might offer a valuable framework to deal with global poverty too. In short, it is high time that sustainable energy development eradicates multidimensional poverty in all its forms based on the circular economy and SDGs.

Author Contributions

Conceptualization, G.E.H. and P.-S.C.A.; methodology, G.E.H. and P.-S.C.A.; validation, G.E.H. and P.-S.C.A.; formal analysis, G.E.H. and P.-S.C.A.; investigation, G.E.H. and P.-S.C.A.; resources, G.E.H. and P.-S.C.A.; data curation, G.E.H. and P.-S.C.A.; writing—original draft preparation, G.E.H. and P.-S.C.A.; writing—review and editing, G.E.H. and P.-S.C.A.; visualization, G.E.H. and P.-S.C.A.; supervision, G.E.H. All authors have read and agreed to the published version of the manuscript.

Funding

This research received no external funding.

Data Availability Statement

Data of the study can be found on: [32,96,97].

Conflicts of Interest

The authors declare no conflict of interest.

References

  1. Bradshaw, J.; Hutton, S. Social Policy Options and Fuel Povert. J. Econ. Psychol. 1983, 3, 249–266. [Google Scholar] [CrossRef]
  2. Boardman, B. Fuel Poverty: From Cold Homes to Affordable Warmth; Belhaven Press: London, UK, 1991; ISBN 9781852931391. [Google Scholar]
  3. Bouzarovski, S.; Petrova, S. A Global Perspective on Domestic Energy Deprivation: Overcoming the Energy Poverty-Fuel Poverty Binary. Energy Res. Soc. Sci. 2015, 10, 31–40. [Google Scholar] [CrossRef]
  4. Bouzarovski, S.; Petrova, S.; Sarlamanov, R. Energy Poverty Policies in the EU: A Critical Perspective. Energy Policy 2012, 49, 76–82. [Google Scholar] [CrossRef]
  5. Song, M.; Zhang, J.; Liu, X.; Zhang, L.; Hao, X.; Li, M. Developments and Trends in Energy Poverty Research—Literature Visualization Analysis Based on CiteSpace. Sustainability 2023, 15, 2576. [Google Scholar] [CrossRef]
  6. WHO. Key Findings of the Tracking SDGs 7. Available online: https://www.iea.org/reports/tracking-sdg7-the-energy-progress-report-2022/key-highlights-on-sdg-7-targets (accessed on 15 January 2023).
  7. UNECE; Eurostat; OECD. Framework and Suggested Indicators to Measure Sustainable Development. Joint UNECE/Eurostat/OECD Task Force on Measuring Sustainable Development. 2013. Available online: https://unece.org/fileadmin/DAM/stats/documents/ece/ces/2013/SD_framework_and_indicators_final.pdf (accessed on 15 January 2023).
  8. Romero, J.C.; Linares, P.; López, X. The Policy Implications of Energy Poverty Indicators. Energy Policy 2018, 115, 98–108. [Google Scholar] [CrossRef]
  9. Faiella, I.; Lavecchia, L. Energy Poverty Indicators; Elsevier Inc.: Amsterdam, The Netherlands, 2019; ISBN 9780128169520. [Google Scholar]
  10. Faiella, I.; Lavecchia, L. Energy Poverty. How Can You Fight It, If You Can’t Measure It? Energy Build. 2021, 233, 110692. [Google Scholar] [CrossRef]
  11. Heindl, P. Measuring Fuel Poverty: General Considerations and Application to German Household Data. Public Financ. Anal. 2015, 71, 178–215. [Google Scholar] [CrossRef] [Green Version]
  12. Rademaekers, K.; Yearwood, J.; Ferreira, A.; Pye, S.; Hamilton, I.; Agnolucci, P.; Grover, D.; Karásek, J.; Anisimova, N. Selecting Indicators to Measure Energy Poverty. Available online: https://trinomics.eu/wp-content/uploads/2016/06/Selecting-Indicators-to-Measure-Energy-Poverty.pdf (accessed on 30 December 2022).
  13. Moore, R. Definitions of Fuel Poverty: Implications for Policy. Energy Policy 2012, 49, 19–26. [Google Scholar] [CrossRef]
  14. Herrero, S.T. Energy Poverty Indicators: A Critical Review of Methods. Indoor Built Environ. 2017, 26, 1018–1031. [Google Scholar] [CrossRef]
  15. UNDP. Energy and the Challenge of Sustainability; United Nations Environment Programme, United Nations Department of Economic and Social Affairs, World Energy Council: London, UK, 2000; ISBN 9211261260. [Google Scholar]
  16. IEAA; UNDESA; IEA; EUROSTAT; EEA. Energy Indicators for Sustainable Development: Guidelines and Methodologies. 2005. Available online: https://www-pub.iaea.org/mtcd/publications/pdf/pub1222_web.pdf (accessed on 15 January 2023).
  17. Vera, I.; Langlois, L.M.; Rogner, H.H.; Jalal, A.I.; Toth, F.L. Indicators for Sustainable Energy Development: An Initiative by the International Atomic Energy Agency. Nat. Resour. Forum 2005, 29, 274–283. [Google Scholar] [CrossRef]
  18. Vera, I.; Langlois, L. Energy Indicators for Sustainable Development. Energy 2007, 32, 875–882. [Google Scholar] [CrossRef]
  19. OLADE; ECLAC; GTZ. Energy and Sustainable Development in Latin America and the Caribbean: Approaches to Energy Policy. 1997. Available online: https://repositorio.cepal.org/handle/11362/30858?locale-attribute=en (accessed on 15 January 2023).
  20. IRENA. World Energy Transitions Outlook: 1.5 °C Pathway. Available online: https://www.irena.org/publications/2022/mar/world-energy-transitions-outlook-2022 (accessed on 20 January 2023).
  21. Sovacool, B.K.; Mukherjee, I. Conceptualizing and Measuring Energy Security: A Synthesized Approach. Energy 2011, 36, 5343–5355. [Google Scholar] [CrossRef]
  22. Sovacool, B.K.; Mukherjee, I.; Drupady, I.M.; D’Agostino, A.L. Evaluating Energy Security Performance from 1990 to 2010 for Eighteen Countries. Energy 2011, 36, 5846–5853. [Google Scholar] [CrossRef]
  23. Sovacool, B.K.; Cooper, C.; Bazilian, M.; Johnson, K.; Zoppo, D.; Clarke, S.; Eidsness, J.; Crafton, M.; Velumail, T.; Raza, H.A. What Moves and Works: Broadening the Consideration of Energy Poverty. Energy Policy 2012, 42, 715–719. [Google Scholar] [CrossRef]
  24. Sovacool, B.K. The Political Economy of Energy Poverty: A Review of Key Challenges. Energy Sustain. Dev. 2012, 16, 272–282. [Google Scholar] [CrossRef]
  25. Gunnarsdottir, I.; Davidsdottir, B.; Worrell, E.; Sigurgeirsdottir, S. Review of Indicators for Sustainable Energy Development. Renew. Sustain. Energy Rev. 2020, 133, 110294. [Google Scholar] [CrossRef]
  26. Nussbaumer, P.; Bazilian, M.; Modi, V. Measuring Energy Poverty: Focusing on What Matters. Renew. Sustain. Energy Rev. 2012, 16, 231–243. [Google Scholar] [CrossRef] [Green Version]
  27. Nussbaumer, P.; Nerini, F.F.; Onyeji, I.; Howells, M. Global Insights Based on the Multidimensional Energy Poverty Index (MEPI). Sustainability 2013, 5, 2060–2076. [Google Scholar] [CrossRef] [Green Version]
  28. Okushima, S. Gauging Energy Poverty: A Multidimensional Approach. Energy 2017, 137, 1159–1166. [Google Scholar] [CrossRef] [Green Version]
  29. Sadath, A.C.; Acharya, R.H. Assessing the Extent and Intensity of Energy Poverty Using Multidimensional Energy Poverty Index: Empirical Evidence from Households in India. Energy Policy 2017, 102, 540–550. [Google Scholar] [CrossRef]
  30. Olang, T.A.; Esteban, M.; Gasparatos, A. Lighting and Cooking Fuel Choices of Households in Kisumu City, Kenya: A Multidimensional Energy Poverty Perspective. Energy Sustain. Dev. 2018, 42, 1–13. [Google Scholar] [CrossRef]
  31. Bezerra, P.; Cruz, T.; Mazzone, A.; Lucena, A.F.P.; De Cian, E.; Schaeffer, R. The Multidimensionality of Energy Poverty in Brazil: A Historical Analysis. Energy Policy 2022, 171, 113268. [Google Scholar] [CrossRef]
  32. OWID. Access to Energy. Available online: https://ourworldindata.org/energy-access#access-to-electricity (accessed on 10 January 2023).
  33. Von-der-Leyen, U. A Union That Strives for More: My Agenda for Europe. Eur. Crim. Law Rev. 2019, 2024, 2019. [Google Scholar]
  34. US Congress. Recognising the Duty of the Federal Government to Create a Green New Deal. Available online: https://www.congress.gov/bill/116th-congress/house-resolution/109/text (accessed on 20 February 2023).
  35. EC. Recomendation (EU) 2020/1563 on Energy Poverty. Off. J. Eur. Union. 2020. Available online: https://eur-lex.europa.eu/legal-content/EN/TXT/PDF/?uri=CELEX:32020H1563 (accessed on 27 February 2023).
  36. EC. “Fit for 55”: Delivering the EU’s 2030 Climate Target on the Way to Climate Neutrality; European Commission: Brussels, Belgium, 2021; p. 15. Available online: https://www.eesc.europa.eu/en/our-work/opinions-information-reports/opinions/fit-55-delivering-eus-2030-climate-target-way-climate-neutrality (accessed on 27 February 2023).
  37. EC. Tackling Rising Energy Prices: A Toolbox for Action and Support; European Commission: Brussels, Belgium, 2021. [Google Scholar]
  38. EC. REPowerEU Plan. Available online: https://ec.europa.eu/commission/presscorner/detail/es/ip_22_3131 (accessed on 1 February 2023).
  39. Halkos, G.E.; Aslanidis, P.C. Causes and Measures of Poverty, Inequality, and Social Exclusion: A Review. Economies 2023, 11, 110. [Google Scholar] [CrossRef]
  40. Pereira, P.; Bašić, F.; Bogunovic, I.; Barcelo, D. Russian-Ukrainian War Impacts the Total Environment. Sci. Total Environ. 2022, 837, 155865. [Google Scholar] [CrossRef]
  41. Rawtani, D.; Gupta, G.; Khatri, N.; Rao, P.K.; Hussain, C.M. Environmental Damages Due to War in Ukraine: A Perspective. Sci. Total Environ. 2022, 850, 157932. [Google Scholar] [CrossRef]
  42. Ministry of Foreign Affairs of the People’s Republic of China. Xi Jinping Attends the General Debate of the 76th Session of the United Nations General Asselmbly. Available online: https://www.fmprc.gov.cn/mfa_eng/topics_665678/kjgzbdfyyq/202109/t20210923_9591806.html (accessed on 20 February 2023).
  43. Ministry of Ecology and Environment Energy in China’s New Era. Available online: https://english.mee.gov.cn/Resources/publications/Whitep/202012/t20201222_814160.shtml (accessed on 14 February 2023).
  44. Riva, M.; Kingunza Makasi, S.; Dufresne, P.; O’Sullivan, K.; Toth, M. Energy Poverty in Canada: Prevalence, Social and Spatial Distribution, and Implications for Research and Policy. Energy Res. Soc. Sci. 2021, 81, 102237. [Google Scholar] [CrossRef]
  45. Das, R.R.; Martiskainen, M.; Bertrand, L.M.; MacArthur, J.L. A Review and Analysis of Initiatives Addressing Energy Poverty and Vulnerability in Ontario, Canada. Renew. Sustain. Energy Rev. 2022, 165, 112617. [Google Scholar] [CrossRef]
  46. Bednar, D.J.; Reames, T.G. Recognition of and Response to Energy Poverty in the United States. Nat. Energy 2020, 5, 432–439. [Google Scholar] [CrossRef]
  47. Best, R.; Sinha, K. Fuel Poverty Policy: Go Big or Go Home Insulation. Energy Econ. 2021, 97, 105195. [Google Scholar] [CrossRef]
  48. Soriano-Hernández, P.; Mejía-Montero, A.; van der Horst, D. Characterisation of Energy Poverty in Mexico Using Energy Justice and Econophysics. Energy Sustain. Dev. 2022, 71, 200–211. [Google Scholar] [CrossRef]
  49. Acuna, M.; Silva, C.; Tocaruncho, A.; Vargas, D.; Patiño, D.; Barrera, D.; Peña, J. Operational Planning of Energy for Non-interconnected Zones: A Simulation-optimization Approach and a Case Study to Tackle Energy Poverty in Colombia. Energies 2021, 14, 2789. [Google Scholar] [CrossRef]
  50. Burguillo, M.; Barisone, M.; Juez-Martel, P. Which Cooking and Heating Fuels Are More Likely to Be Used in Energy-Poor Households? Exploring Energy and Fuel Poverty in Argentina. Energy Res. Soc. Sci. 2022, 87, 102481. [Google Scholar] [CrossRef]
  51. Urquiza, A.; Amigo, C.; Billi, M.; Calvo, R.; Labraña, J.; Oyarzún, T.; Valencia, F. Quality as a Hidden Dimension of Energy Poverty in Middle-Development Countries. Literature Review and Case Study from Chile. Energy Build. 2019, 204, 109463. [Google Scholar] [CrossRef]
  52. Villalobos, C.; Chávez, C.; Uribe, A. Energy Poverty Measures and the Identification of the Energy Poor: A Comparison between the Utilitarian and Capability-Based Approaches in Chile. Energy Policy 2021, 152, 112146. [Google Scholar] [CrossRef]
  53. Bienvenido-Huertas, D.; Pérez-Fargallo, A.; Alvarado-Amador, R.; Rubio-Bellido, C. Influence of Climate on the Creation of Multilayer Perceptrons to Analyse the Risk of Fuel Poverty. Energy Build. 2019, 198, 38–60. [Google Scholar] [CrossRef]
  54. Gordon, D.; Levitas, R.; Pantazis, C.; Patsios, D.; Payne, S.; Townsend, P.; Adelman, L.; Ashworth, K.; Middleton, S.; Bradshaw, J.; et al. Poverty and Social Exclusion in Britain. Available online: https://www.jrf.org.uk/sites/default/files/jrf/migrated/files/185935128x.pdf (accessed on 30 December 2022).
  55. Bradshaw, J.; Middleton, S.; Davis, A.; Oldfield, N.; Smith, N.; Cusworth, L.; Williams, J. A Minimum Income Standard for Britain: What People Think; The Joseph Rowntree Foundation: York, UK, 2008. [Google Scholar] [CrossRef]
  56. EPAH. Introduction to the Energy Poverty Advisory Hub (EPAH) Handbooks: A Guide to Understanding and Addressing Energy Poverty Energy; EPAH: Jawa Barat, Indonesia, 2022. [Google Scholar]
  57. Gouveia, J.P.; Palma, P.; Bessa, S.; Mahoney, K.; Sequeira, M. Energy Poverty: National Indicators—Insights for a More Effective Measuring; Energy Poverty Advisory Hub (EPAH)—European Union: Brussels, Belgium, 2022; Available online: https://energy-poverty.ec.europa.eu/discover/publications/publications/energy-poverty-national-indicators-insights-more-effective-measuring_en (accessed on 27 February 2023).
  58. Hills, J. Fuel Poverty: The Problem and Its Measurement. CASE Report 69. Department for Energy and Climate Change (DECC). Centre for Analysis of Social Exclusion. The London School of Economics and Political Science. Available online: https://eprints.lse.ac.uk/39270/1/CASEreport69%28lsero%29.pdf (accessed on 30 December 2022).
  59. Hills, J. Getting the Measure of Fuel Poverty. Final Report of the Fuel Poverty Review; CASE Report, 72. Centre for Analysis of Social Exclusion, London School of Economics and Political Science: London, UK. Available online: http://eprints.lse.ac.uk/43153 (accessed on 30 December 2022).
  60. Snell, C.; Bevan, M.; Thomson, H. Justice, Fuel Poverty and Disabled People in England. Energy Res. Soc. Sci. 2015, 10, 123–132. [Google Scholar] [CrossRef]
  61. Thomson, H.; Bouzarovski, S.; Snell, C. Rethinking the Measurement of Energy Poverty in Europe: A Critical Analysis of Indicators and Data. Indoor Built Environ. 2017, 26, 879–901. [Google Scholar] [CrossRef] [Green Version]
  62. Thomson, H.; Snell, C. Quantifying the Prevalence of Fuel Poverty across the European Union. Energy Policy 2013, 52, 563–572. [Google Scholar] [CrossRef]
  63. Halkos, G.E.; Gkampoura, E.C. Evaluating the Effect of Economic Crisis on Energy Poverty in Europe. Renew. Sustain. Energy Rev. 2021, 144, 110981. [Google Scholar] [CrossRef]
  64. Stojilovska, A.; Guyet, R.; Mahoney, K.; Gouveia, J.P.; Castaño-Rosa, R.; Živčič, L.; Barbosa, R.; Tkalec, T. Energy Poverty and Emerging Debates: Beyond the Traditional Triangle of Energy Poverty Drivers. Energy Policy 2022, 169, 113181. [Google Scholar] [CrossRef]
  65. Bouzarovski, S.; Thomson, H.; Cornelis, M. Confronting Energy Poverty in Europe: A Research and Policy Agenda. Energies 2021, 14, 858. [Google Scholar] [CrossRef]
  66. Hasheminasab, H.; Streimikiene, D.; Pishahang, M. A Novel Energy Poverty Evaluation: Study of the European Union Countries. Energy 2023, 264, 126157. [Google Scholar] [CrossRef]
  67. Kyprianou, I.; Serghides, D.K.; Varo, A.; Gouveia, J.P.; Kopeva, D.; Murauskaite, L. Energy Poverty Policies and Measures in 5 EU Countries: A Comparative Study. Energy Build. 2019, 196, 46–60. [Google Scholar] [CrossRef]
  68. Healy, J.D.; Clinch, J.P. Quantifying the Severity of Fuel Poverty, Its Relationship with Poor Housing and Reasons for Non-Investment in Energy-Saving Measures in Ireland. Energy Policy 2004, 32, 207–220. [Google Scholar] [CrossRef]
  69. Gouveia, J.P.; Palma, P.; Simoes, S.G. Energy Poverty Vulnerability Index: A Multidimensional Tool to Identify Hotspots for Local Action. Energy Rep. 2019, 5, 187–201. [Google Scholar] [CrossRef]
  70. Streimikiene, D.; Kyriakopoulos, G.L.; Lekavicius, V.; Siksnelyte-Butkiene, I. Energy Poverty and Low Carbon Just Energy Transition: Comparative Study in Lithuania and Greece. Soc. Indic. Res. 2021, 158, 319–371. [Google Scholar] [CrossRef] [PubMed]
  71. Halkos, G.E.; Gkampoura, E.C. Assessing Fossil Fuels and Renewables’ Impact on Energy Poverty Conditions in Europe. Energies 2023, 16, 560. [Google Scholar] [CrossRef]
  72. Atsalis, A.; Mirasgedis, S.; Tourkolias, C.; Diakoulaki, D. Fuel Poverty in Greece: Quantitative Analysis and Implications for Policy. Energy Build. 2016, 131, 87–98. [Google Scholar] [CrossRef]
  73. Papada, L.; Kaliampakos, D. Measuring Energy Poverty in Greece. Energy Policy 2016, 94, 157–165. [Google Scholar] [CrossRef]
  74. Boemi, S.N.; Avdimiotis, S.; Papadopoulos, A.M. Domestic Energy Deprivation in Greece: A Field Study. Energy Build. 2017, 144, 167–174. [Google Scholar] [CrossRef]
  75. Shapira, S.; Shibli, H.; Teschner, N. Energy Insecurity and Community Resilience: The Experiences of Bedouins in Southern Israel. Environ. Sci. Policy 2021, 124, 135–143. [Google Scholar] [CrossRef]
  76. Teschner, N.; Sinea, A.; Vornicu, A.; Abu-Hamed, T.; Negev, M. Extreme Energy Poverty in the Urban Peripheries of Romania and Israel: Policy, Planning and Infrastructure. Energy Res. Soc. Sci. 2020, 66, 101502. [Google Scholar] [CrossRef]
  77. Dogan, E.; Madaleno, M.; Taskin, D. Which Households Are More Energy Vulnerable? Energy Poverty and Financial Inclusion in Turkey. Energy Econ. 2021, 99, 105306. [Google Scholar] [CrossRef]
  78. Kose, T. Energy Poverty and Health: The Turkish Case. Energy Sources Part B Econ. Plan. Policy 2019, 14, 201–213. [Google Scholar] [CrossRef]
  79. Okushima, S. Measuring Energy Poverty in Japan, 2004–2013. Energy Policy 2016, 98, 557–564. [Google Scholar] [CrossRef] [Green Version]
  80. Okushima, S. Understanding Regional Energy Poverty in Japan: A Direct Measurement Approach. Energy Build. 2019, 193, 174–184. [Google Scholar] [CrossRef]
  81. Castaño-Rosa, R.; Okushima, S. Prevalence of Energy Poverty in Japan: A Comprehensive Analysis of Energy Poverty Vulnerabilities. Renew. Sustain. Energy Rev. 2021, 145, 111006. [Google Scholar] [CrossRef]
  82. Clark, I.K.H.; Chun, S.; O’sullivan, K.C.; Pierse, N. Energy Poverty among Tertiary Students in Aotearoa New Zealand. Energies 2022, 15, 76. [Google Scholar] [CrossRef]
  83. Awaworyi Churchill, S.; Smyth, R. Energy Poverty and Health: Panel Data Evidence from Australia. Energy Econ. 2021, 97, 105219. [Google Scholar] [CrossRef]
  84. Awaworyi Churchill, S.; Smyth, R. Ethnic Diversity, Energy Poverty and the Mediating Role of Trust: Evidence from Household Panel Data for Australia1. Energy Econ. 2020, 86, 104663. [Google Scholar] [CrossRef]
  85. Raghutla, C.; Chittedi, K.R. Energy Poverty and Economic Development: Evidence from BRICS Economies. Environ. Sci. Pollut. Res. 2022, 29, 9707–9721. [Google Scholar] [CrossRef] [PubMed]
  86. Pereira, M.G.; Freitas, M.A.V.; da Silva, N.F. Rural Electrification and Energy Poverty: Empirical Evidences from Brazil. Renew. Sustain. Energy Rev. 2010, 14, 1229–1240. [Google Scholar] [CrossRef]
  87. Piai, J.C.; Gomes, R.D.M.; Jannuzzi, G.D.M. Integrated Resources Planning as a Tool to Address Energy Poverty in Brazil. Energy Build. 2020, 214, 109817. [Google Scholar] [CrossRef]
  88. Zhang, D.; Li, J.; Han, P. A Multidimensional Measure of Energy Poverty in China and Its Impacts on Health: An Empirical Study Based on the China Family Panel Studies. Energy Policy 2019, 131, 72–81. [Google Scholar] [CrossRef]
  89. Wang, K.; Wang, Y.X.; Li, K.; Wei, Y.M. Energy Poverty in China: An Index Based Comprehensive Evaluation. Renew. Sustain. Energy Rev. 2015, 47, 308–323. [Google Scholar] [CrossRef]
  90. Zhao, J.; Jiang, Q.; Dong, X.; Dong, K. Assessing Energy Poverty and Its Effect on CO2 Emissions: The Case of China. Energy Econ. 2021, 97, 105191. [Google Scholar] [CrossRef]
  91. Urpelainen, J. Energy Poverty and Perceptions of Solar Power in Marginalized Communities: Survey Evidence from Uttar Pradesh, India. Renew. Energy 2016, 85, 534–539. [Google Scholar] [CrossRef]
  92. Urpelainen, J. Grid and Off-Grid Electrification: An Integrated Model with Applications to India. Energy Sustain. Dev. 2014, 19, 66–71. [Google Scholar] [CrossRef]
  93. Gould, C.F.; Urpelainen, J. LPG as a Clean Cooking Fuel: Adoption, Use, and Impact in Rural India. Energy Policy 2018, 122, 395–408. [Google Scholar] [CrossRef]
  94. Ye, Y.; Koch, S.F. Measuring Energy Poverty in South Africa Based on Household Required Energy Consumption. Energy Econ. 2021, 103, 105553. [Google Scholar] [CrossRef]
  95. Ismail, Z.; Khembo, P. Determinants of Energy Poverty in South Africa. J. Energy South. Afr. 2015, 26, 66–78. [Google Scholar] [CrossRef] [Green Version]
  96. WBG. Poverty and Inequality Platform (PIP). Available online: https://pip.worldbank.org/home (accessed on 19 January 2023).
  97. Eurostat. EU Statistics on Income and Living Conditions (EU-SILC). Available online: https://ec.europa.eu/eurostat/statistics-explained/index.php?title=EU_statistics_on_income_and_living_conditions_ (accessed on 20 January 2023).
  98. Halkos, G.E.; Gkampoura, E.-C. Coping with Energy Poverty: Measurements, Drivers, Impacts, and Solutions. Energies 2021, 14, 2807. [Google Scholar] [CrossRef]
  99. Boardman, B. Quality of Life Benefits (Problems) That Are Hard to Measure. In Proceedings of the Evaluating the Co-Benefits of Low-Income Weatherisation Programmes, Dublin, Ireland, 27–28 January 2011; IEA: Dublin, Ireland, 2011. [Google Scholar]
  100. Harrington, B.E.; Heyman, B.; Merleau-Ponty, N.; Stockton, H.; Ritchie, N.; Heyman, A. Keeping Warm and Staying Well: Findings from the Qualitative Arm of the Warm Homes Project Correspondence. Health Soc. Care Community 2005, 13, 259–267. [Google Scholar] [CrossRef] [PubMed]
  101. Smith, A. An Inquiry into the Nature and Causes of the Wealth of Nations; Everyman Edition, Home University Library: London, UK, 1776. [Google Scholar]
  102. Lenoir, R. Les Exclus: Un Francais Sur Dix, 1st ed.; Seuil: Paris, France, 1974; ISBN 2-02-010769-4. [Google Scholar]
  103. Sen, A. An Ordinal Approach to Measurement. Econometrica 1976, 44, 219–231. [Google Scholar] [CrossRef]
  104. Sen, A. Poor, Relatively Speaking. Oxf. Econ. Pap. 1983, 35, 153–169. [Google Scholar] [CrossRef]
  105. Rawls, J. A Theory of Justice; Revised; The Belknap Press of Harvard University Press: Cambridge, MA, USA, 1971; ISBN 9772081415. [Google Scholar]
  106. Rosenberg-Jansen, S. No One Behind. In Energy Access and Forced Migration; Taylor and Francis: dLondon, UK, 2022. [Google Scholar] [CrossRef]
  107. UNDP. Human Development Report 2019: Beyond Income, Beyond Averages, beyond Today: Inequalities in Human Development in the 21st Century; United Nations Development Programme: New York, NY, USA, 2019; ISBN 9789211264395. [Google Scholar]
  108. Sovacool, B.K.; Heffron, R.J.; McCauley, D.; Goldthau, A. Energy Decisions Reframed as Justice and Ethical Concerns. Nat. Energy 2016, 1, 16024. [Google Scholar] [CrossRef] [Green Version]
  109. Faiella, I.; Lavecchia, L.; Miniaci, R.; Valbonesi, P. Household Energy Poverty and the “Just Transition”. In Handbook of Labor, Human Resources and Population Economics; Springer: Cham, Switzerland, 2022. [Google Scholar] [CrossRef]
  110. Streimikiene, D.; Lekavičius, V.; Baležentis, T.; Kyriakopoulos, G.L.; Abrhám, J. Climate Change Mitigation Policies Targeting Households and Addressing Energy Poverty in European Union. Energies 2020, 13, 3389. [Google Scholar] [CrossRef]
  111. Aklin, M.; Urpelainen, J. Debating Clean Energy: Frames, Counter Frames, and Audiences. Glob. Environ. Chang. 2013, 23, 1225–1232. [Google Scholar] [CrossRef]
  112. Lelieveld, J.; Evans, J.S.; Fnais, M.; Giannadaki, D.; Pozzer, A. The Contribution of Outdoor Air Pollution Sources to Premature Mortality on a Global Scale. Nature 2015, 525, 367–371. [Google Scholar] [CrossRef]
  113. Chafe, Z.A.; Brauer, M.; Klimont, Z.; Van Dingenen, R.; Mehta, S.; Rao, S.; Riahi, K.; Dentener, F.; Smith, K.R. Household Cooking with Solid Fuels Contributes to Ambient PM2.5air Pollution and the Burden of Disease. Environ. Health Perspect. 2014, 122, 1314–1320. [Google Scholar] [CrossRef] [Green Version]
  114. Pope, D.; Bruce, N.; Dherani, M.; Jagoe, K.; Rehfuess, E. Real-Life Effectiveness of ‘Improved’ Stoves and Clean Fuels in Reducing PM2.5 and CO: Systematic Review and Meta-Analysis. Environ. Int. 2017, 101, 7–18. [Google Scholar] [CrossRef]
  115. Okushima, S. Energy Poor Need More Energy, but Do They Need More Carbon? Evaluation of People’s Basic Carbon Needs. Ecol. Econ. 2021, 187, 107081. [Google Scholar] [CrossRef]
  116. Santamouris, M. Heat Island Research in Europe: The State of the Art. Adv. Build. Energy Res. 2007, 1, 123–150. [Google Scholar] [CrossRef]
  117. Curra, E.; Cecere, C.; Coch, H.; Morganti, M.; Salvati, A. Capter 9.2 Energy Behavior of Compact Urban Fabric. In Handbook of Energy Efficiency in Buildings: A Life Cycle Approach; Elsevier, Health Sciences Division, Butterworth-Heinemann Inc.: Oxford, UK, 2018; pp. 714–740. [Google Scholar]
  118. Burke, P.J. The National-Level Energy Ladder and Its Carbon Implications. Environ. Dev. Econ. 2013, 18, 484–503. [Google Scholar] [CrossRef]
  119. Kowsari, R.; Zerriffi, H. Three Dimensional Energy Profile: A Conceptual Framework for Assessing Household Energy Use. Energy Policy 2011, 39, 7505–7517. [Google Scholar] [CrossRef]
  120. Van Der Kroon, B.; Brouwer, R.; Van Beukering, P.J.H. The Energy Ladder: Theoretical Myth or Empirical Truth? Results from a Meta-Analysis. Renew. Sustain. Energy Rev. 2013, 20, 504–513. [Google Scholar] [CrossRef]
  121. Bisaga, I.; Parikh, P. To Climb or Not to Climb? Investigating Energy Use Behaviour among Solar Home System Adopters through Energy Ladder and Social Practice Lens. Energy Res. Soc. Sci. 2018, 44, 293–303. [Google Scholar] [CrossRef] [Green Version]
  122. Jewitt, S.; Atagher, P.; Clifford, M. “We Cannot Stop Cooking”: Stove Stacking, Seasonality and the Risky Practices of Household Cookstove Transitions in Nigeria. Energy Res. Soc. Sci. 2020, 61, 101340. [Google Scholar] [CrossRef]
  123. Preble, C.V.; Hadley, O.L.; Gadgil, A.J.; Kirchstetter, T.W. Emissions and Climate-Relevant Optical Properties of Pollutants Emitted from a Three-Stone Fire and the Berkeley-Darfur Stove Tested under Laboratory Conditions. Environ. Sci. Technol. 2014, 48, 6484–6491. [Google Scholar] [CrossRef] [PubMed]
  124. Gitau, K.J.; Mutune, J.; Sundberg, C.; Mendum, R.; Njenga, M. Factors Influencing the Adoption of Biochar-Producing Gasifier Cookstoves by Households in Rural Kenya. Energy Sustain. Dev. 2019, 52, 63–71. [Google Scholar] [CrossRef]
  125. Allshouse, W.B.; McKenzie, L.M.; Barton, K.; Brindley, S.; Adgate, J.L. Community Noise and Air Pollution Exposure during the Development of a Multi-Well Oil and Gas Pad. Environ. Sci. Technol. 2019, 53, 7126–7135. [Google Scholar] [CrossRef] [PubMed]
  126. WHO. Standards for Cookstove Performance: Guidance and Resources. Available online: https://apps.who.int/iris/rest/bitstreams/1480170/retrieve (accessed on 27 February 2023).
  127. EPA. A Brief Guide to Mold, Moisture, and Your Home; United States Environmental Protection Agency. Available online: https://www.epa.gov/mold/brief-guide-mold-moisture-and-your-home (accessed on 20 February 2023).
  128. ASHRAE. Standards and Guidelines. Available online: https://www.ashrae.org/technical-resources/standards-and-guidelines (accessed on 9 January 2023).
  129. MRT; FotE. The Health Impacts of Cold Homes and Fuel Poverty; Marmot Review Team for Friends of the Earth: London, UK, 2011; ISBN 978. [Google Scholar]
  130. Mack, J.; Lansley, S. Poor Britain; Allen & Unwin: London, UK, 1985; ISBN 0043360823. [Google Scholar]
  131. Bollino, C.A.; Botti, F. Energy Poverty in Europe: A Multidimensional Approach. PSL Q. Rev. 2017, 70, 473–507. [Google Scholar]
  132. Healy, J.D.; Clinch, J.P. Fuel Poverty in Europe: A Cross-Country Analysis Using a New Composite Measure; University College Dublin: Dublin, Ireland, 2002; ISBN 1393-9335. [Google Scholar]
  133. BEIS/bre. Fuel Poverty Methodology Handbook: Low Income Low Energy Efficiency (LILEE); Department for Business, Energy & Industrial Strategy: London, UK, 2022. [Google Scholar]
  134. Townsend, P. Poverty in the United Kingdom: A Survey of Household Resources and Standards of Living; Penguin Books Ltd.: Harmondsworth, Middlesex, 1979. [Google Scholar]
  135. Bourguignon, F.; Chakravarty, S.R. The Measurement of Multidimensional Poverty. J. Econ. Inequal. 2003, 1, 25–49. [Google Scholar] [CrossRef]
  136. Alkire, S.; Foster, J. Counting and Multidimensional Poverty Measurement. J. Public Econ. 2011, 95, 476–487. [Google Scholar] [CrossRef] [Green Version]
  137. WBG. Poverty and Shared Prosperity 2022: Correcting Course; World Bank Group: Washington, DC, USA, 2022; ISBN 978-1-4648-1894-3. [Google Scholar]
  138. Alkire, S.; Kovesdi, F.; Scheja, E.; Vollmer, F. Moderate Multidimensional Poverty Index: Paving the Way Out of Poverty. Available online: https://ophi.org.uk/rp59a/ (accessed on 1 January 2023).
  139. Alkire, S.; Kanagaratman, U.; Suppa, N. The Global Multidimensional Poverty Index (MPI) 2021; The Oxford Poverty and Human Development Initiative (OPHI), Oxford Department of International Development, University of Oxford: Oxford, UK, 2021. [Google Scholar]
  140. Oxford Poverty and Human Development Initiative. Global Multidimensional Poverty Index 2018: The Most Detailed Picture to Date of the World’s Poorest People; University of Oxford: Oxford, UK, 2018; ISBN 9781912291120. [Google Scholar]
  141. UNDP; OPHI. Global MPI 2020—Charting Pathways out of Multidimensional Poverty: Achieving the SDGs. 2020. Available online: https://ophi.org.uk/wp-content/uploads/G-MPI_Report_2020_Charting_Pathways.pdf (accessed on 1 January 2023).
  142. UNDP; OPHI. Global Multiidimensional Poverty Index 2022: Unpacking Deprivation Bundles to Reduce Multidimensional Poverty; United Nations Development Programme & Oxford Poverty and Human Development Initiative. Available online: https://hdr.undp.org/content/2022-global-multidimensional-poverty-index-mpi#/indicies/MPI (accessed on 15 February 2023).
  143. WBG. Poverty and Shared Prosperty 2018: Piecing Together the Poverty Puzzle; World Bank Group: Washington, DC, USA, 2018; ISBN 9781464813306. [Google Scholar]
  144. WBG. Poverty and Shared Prosperity 2020: Reversals of Fortune; World Bank Group: Washington, DC, USA, 2020; ISBN 978-1-4648-1603-1. [Google Scholar]
  145. Streimikiene, D.; Kyriakopoulos, G.L. Energy Poverty and Low Carbon Energy Transition. Energies 2023, 16, 610. [Google Scholar] [CrossRef]
  146. Pelz, S.; Pachauri, S.; Groh, S. A Critical Review of Modern Approaches for Multidimensional Energy Poverty Measurement. Wiley Interdiscip. Rev. Energy Environ. 2018, 7, e304. [Google Scholar] [CrossRef] [Green Version]
  147. Sovacool, B.K. An International Assessment of Energy Security Performance. Ecol. Econ. 2013, 88, 148–158. [Google Scholar] [CrossRef]
  148. Stavytskyy, A.; Kharlamova, G.; Komendant, O.; Andrzejczak, J.; Nakonieczny, J. Methodology for Calculating the Energy Security Index of the State: Taking into Account Modern Megatrends. Energies 2021, 14, 3621. [Google Scholar] [CrossRef]
  149. Martchamadol, J.; Kumar, S. An Aggregated Energy Security Performance Indicator. Appl. Energy 2013, 103, 653–670. [Google Scholar] [CrossRef]
  150. Martchamadol, J.; Kumar, S. The Aggregated Energy Security Performance Indicator (AESPI) at National and Provincial Level. Appl. Energy 2014, 127, 219–238. [Google Scholar] [CrossRef]
  151. Gnansounou, E. Assessing the Energy Vulnerability: Case of Industrialised Countries. Energy Policy 2008, 36, 3734–3744. [Google Scholar] [CrossRef]
  152. Gatto, A.; Busato, F. Energy Vulnerability around the World: The Global Energy Vulnerability Index (GEVI). J. Clean. Prod. 2020, 253, 118691. [Google Scholar] [CrossRef]
  153. Boardman, B. Fixing Fuel Poverty: Challenges and Solutions; Earthscan: London, UK, 2010; ISBN 9781844077434. [Google Scholar]
  154. Charlier, D.; Legendre, B. A Multidimensional Approach to Measuring Fuel Poverty. Energy J. 2019, 40, 27–53. [Google Scholar] [CrossRef]
  155. Foster, J.; Greer, J.; Thorbecke, E. A Class of Decomposable Poverty Measures. Econometrica 1984, 52, 761–766. [Google Scholar] [CrossRef] [Green Version]
  156. Simshauser, P. Vulnerable Households and Fuel Poverty: Measuring the Efficiency of Policy Targeting in Queensland. Energy Econ. 2021, 101, 105405. [Google Scholar] [CrossRef]
  157. Bhatia, M.; Angelou, N. Beyond Connections Energy Access Redefined. World Bank: Energy Sector Management Assistance Program (ESMAP). Available online: https://www.worldbank.org/en/topic/energy/publication/energy-access-redefined (accessed on 1 December 2022).
  158. Gupta, S.; Gupta, E.; Sarangi, G.K. Household Energy Poverty Index for India: An Analysis of Inter-State Differences. Energy Policy 2020, 144, 111592. [Google Scholar] [CrossRef]
  159. Meyer, S.; Laurence, H.; Bart, D.; Lucie, M.; Kevin, M. Capturing the Multifaceted Nature of Energy Poverty: Lessons from Belgium. Energy Res. Soc. Sci. 2018, 40, 273–283. [Google Scholar] [CrossRef]
  160. Betto, F.; Garengo, P.; Lorenzoni, A. A New Measure of Italian Hidden Energy Poverty. Energy Policy 2020, 138, 111237. [Google Scholar] [CrossRef]
  161. Maxim, A.; Mihai, C.; Apostoaie, C.M.; Popescu, C.; Istrate, C.; Bostan, I. Implications and Measurement of Energy Poverty across the European Union. Sustainability 2016, 8, 483. [Google Scholar] [CrossRef] [Green Version]
  162. Chard, R.; Walker, G. Living with Fuel Poverty in Older Age: Coping Strategies and Their Problematic Implications. Energy Res. Soc. Sci. 2016, 18, 62–70. [Google Scholar] [CrossRef]
  163. Cortina, A. Aporophobia: Why We Reject the Poor Instead of Helping Them/Adela Cortina; Translated by Adrian Nathan West; Princeton University Press: Princeton, NJ, USA, 2022; ISBN 9780691239422. [Google Scholar]
  164. Hellgren, Z.; Gabrielli, L. Racialization and Aporophobia: Intersecting Discriminations in the Experiences of Non-Western Migrants and Spanish Roma. Soc. Sci. 2021, 10, 163. [Google Scholar] [CrossRef]
  165. Comim, F.; Borsi, M.T.; Valerio Mendoza, O. The Multi-Dimensions of Aporophobia; Munich Personal RePEc Archive: Munich, Germany, 2020. [Google Scholar]
  166. Bielecki, J. Energy Security: Is the Wolf at the Door? Q. Rev. Econ. Financ. 2002, 42, 235–250. [Google Scholar] [CrossRef]
  167. Gasser, P. A Review on Energy Security Indices to Compare Country Performances. Energy Policy 2020, 139, 111339. [Google Scholar] [CrossRef]
  168. Balaras, C.; Daskalaki, E. Chapter 9.1 Energy Audits of Existing Buildings. In Handbook of Energy Efficiency in Buildings: A Life Cycle Approach; Elsevier, Health Sciences Division, Butterworth-Heinemann Inc.: Cambridge, UK, 2018; pp. 677–714. ISBN 978-0-12-812817-6. [Google Scholar]
  169. Papada, L.; Kaliampakos, D. Being Forced to Skimp on Energy Needs: A New Look at Energy Poverty in Greece. Energy Res. Soc. Sci. 2020, 64, 101450. [Google Scholar] [CrossRef]
  170. EU. Regulation (EU) 2019/943 on the Internal Market for Electricity (Recast). Available online: https://eur-lex.europa.eu/legal-content/EN/TXT/?uri=CELEX%3A32019R0943 (accessed on 1 February 2023).
  171. EC. An EU Strategy on Heating and Cooling 2016. Available online: https://eur-lex.europa.eu/legal-content/EN/TXT/?qid=1575551754568&uri=CELEX:52016DC0051 (accessed on 1 February 2023).
  172. Thomson, H.; Simcock, N.; Bouzarovski, S.; Petrova, S. Energy Poverty and Indoor Cooling: An Overlooked Issue in Europe. Energy Build. 2019, 196, 21–29. [Google Scholar] [CrossRef] [Green Version]
  173. EU. Directive (EU) 2018/2002 Amending Directive 2012/27/EU on Energy Efficiency. Available online: https://eur-lex.europa.eu/legal-content/EN/TXT/?uri=uriserv%3AOJ.L_.2018.328.01.0210.01.ENG (accessed on 1 February 2023).
  174. EU. Directive (EU) 2018/844 Amending Directive 2010/31/EU on the Energy Performance of Buildngs and Directive 2012/27/EU on Energy Efficiency. Available online: https://eur-lex.europa.eu/legal-content/EN/TXT/?uri=celex%3A32018L0844 (accessed on 1 February 2023).
  175. EU. Directive (EU) 2018/2001 on the Promotion of the Use of Energy from Renewable Sources (Recast). Available online: https://eur-lex.europa.eu/legal-content/EN/TXT/?uri=uriserv:OJ.L_.2018.328.01.0082.01.ENG (accessed on 1 February 2023).
  176. Ravallion, M. On Measuring Global Poverty. Annu. Rev. Econom. 2020, 12, 167–188. [Google Scholar] [CrossRef]
  177. Haughton, J.; Khandker, S.R. Handbook on Poverty and Inequality; The World Bank: Washington, DC, USA, 2009; ISBN 978-0-8213-7613-3. [Google Scholar]
  178. Mirasgedis, S.; Tourkolias, C.; Pavlakis, E.; Diakoulaki, D. A Methodological Framework for Assessing the Employment Effects Associated with Energy Efficiency Interventions in Buildings. Energy Build. 2014, 82, 275–286. [Google Scholar] [CrossRef]
  179. Sánchez-Guevara Sánchez, C.; Sanz Fernández, A.; Núñez Peiró, M.; Gómez Muñoz, G. Energy Poverty in Madrid: Data Exploitation at the City and District Level. Energy Policy 2020, 144, 111653. [Google Scholar] [CrossRef]
  180. EC. Dashboard for Energy Prices in the EU and Main Trading Partners. Available online: https://energy.ec.europa.eu/data-and-analysis/energy-prices-and-costs-europe/dashboard-energy-prices-eu-and-main-trading-partners_en (accessed on 14 February 2023).
  181. Mastropietro, P. Who Should Pay to Support Renewable Electricity? Exploring Regressive Impacts, Energy Poverty and Tariff Equity. Energy Res. Soc. Sci. 2019, 56, 101222. [Google Scholar] [CrossRef]
  182. Acemoglu, D.; Robinson, J.A. Why Nations Fail? The Origins of Power, Prosperity, and Poverty; Profile Books: London, UK, 2013; ISBN 978-0307719225. [Google Scholar]
  183. Sumiya, B. Energy Poverty in Context of Climate Change: What Are the Possible Impacts of Improved Modern Energy Access on Adaptation Capacity of Communities? Int. J. Environ. Sci. Dev. 2016, 7, 73–79. [Google Scholar] [CrossRef] [Green Version]
  184. Mastini, R.; Kallis, G.; Hickel, J. A Green New Deal without Growth? Ecol. Econ. 2021, 179, 106832. [Google Scholar] [CrossRef]
  185. Friedman, T. A Warning from the Garden. Available online: https://www.nytimes.com/2007/01/19/opinion/19friedman.html (accessed on 20 February 2023).
  186. Bloomfield, J.; Steward, F. The Politics of the Green New Deal. Polit. Q. 2020, 91, 770–779. [Google Scholar] [CrossRef]
  187. C40. C40 Annual Report 2021. Available online: https://www.c40.org/wp-content/uploads/2022/03/C40_annual_report_2021_V10.pdf (accessed on 30 December 2022).
  188. EPA. A Brief Guide to Mold, Moisture, and Your Home; U.S. Environmental Protection Agency: Washington, DC, USA, 2012. [Google Scholar]
  189. Yumashev, A.; Ślusarczyk, B.; Kondrashev, S.; Mikhaylov, A. Global Indicators of Sustainable Development: Evaluation of the Influence of the Human Development Index on Consumption and Quality of Energy. Energies 2020, 13, 2768. [Google Scholar] [CrossRef]
  190. Suganthi, L. Sustainability Indices for Energy Utilization Using a Multi-Criteria Decision Model. Energy. Sustain. Soc. 2020, 10, 16. [Google Scholar] [CrossRef]
  191. UNDP. Human Development Report 2021/2022: Uncertain Times, Unsettled Lives: Shaping Our Future in a Transforming World; United Nations Environment Programme: Nairobi, Kenya, 2022; ISBN 9789211264517. [Google Scholar]
  192. Santika, W.G.; Anisuzzaman, M.; Bahri, P.A.; Shafiullah, G.M.; Rupf, G.V.; Urmee, T. From Goals to Joules: A Quantitative Approach of Interlinkages between Energy and the Sustainable Development Goals. Energy Res. Soc. Sci. 2019, 50, 201–214. [Google Scholar] [CrossRef]
Figure 1. Percentage of the world’s population with access to electricity based on income, 2019. Source: Figure produced by the authors, relying on data from OWID [32].
Energies 16 03805 g001
Figure 2. The methodology plan of the present study.
Energies 16 03805 g002
Figure 3. Per capita electricity generation in the OECD and BRICS, 2021. Source: Figure produced by the authors, relying on data from OWID [32].
Energies 16 03805 g003
Figure 4. Energy ladder. Source: The figure was based on Kowsari and Zerriffi [119] and Bisaga and Parikh [121].
Energies 16 03805 g004
Figure 5. Percentage of the population with access to clean cooking. Note: OECD* contains all the OECD countries that have (sometimes almost) 100% access. Source: Figure produced by the authors, relying on data from WBG [96].
Energies 16 03805 g005
Figure 6. Percentage of the population with access to basic sanitation. Note: Europe* depicts the average value of the European-OECD countries. Source: Figure produced by the authors, relying on data from WBG [96].
Energies 16 03805 g006
Figure 7. Percentage of the population with access to basic drinking water services. Note: Europe* depicts the average value of the European-OECD countries. Source: Figure produced by the authors, relying on data from WBG [96].
Energies 16 03805 g007
Figure 8. Suggested temperatures at which detrimental impacts occur. Note: The primary source denotes that the graph is based on various sources. Source: Author’s edit from Figure 3.12 from Hills [58]. Crown copyright 2011.
Energies 16 03805 g008
Figure 9. Percentage change in the inability to keep homes warm and arrears on utility bills in EU-28 between 2011 and 2021. Note: The values of 2021 in the graph for Slovakia and the UK are 2020 and 2018, respectively. Source: Figure produced by the authors, relying on data from Eurostat [97].
Energies 16 03805 g009
Figure 10. Percentage of the population with access to electricity. Note: OECD* contains all the OECD countries that have 100% access. Source: Figure produced by the authors, relying on data from WBG [96].
Energies 16 03805 g010
Figure 11. Electricity household retail prices in January 2009 and 2019. Note: No values for Iceland and Australia in 2009; no values for India in 2019. Source: Figure produced by the authors, relying on data from EC [180].
Energies 16 03805 g011
Figure 12. Natural Gas Household Retail Prices in January 2009 and 2019. Note: The values for Brazil are December 2008; there are no values for Greece and Finland in 2008; no values for Mexico in 2019; and no values for Norway and Iceland for both years. Source: Figure produced by the authors, relying on data from EC [180].
Energies 16 03805 g012
Table 2. The energy poverty-related dimensions of global poverty adopted by the World Bank, UNDP, and OPHI.
SDGMultidimensional Poverty Measure (MPM)Moderate Multidimensional Poverty Index (MMPI)
Dim.ParametersDim.IndicatorA Household Is Deprived If:
Energies 16 03805 i001Access to basic InfrastructureThe household lacks access to limited-standard drinking water.Living standardsDrinking waterA household does not have access to safe piped water on the premises.
Energies 16 03805 i002The household lacks access to limited-standard sanitation.SanitationA household does not have flush toilet that is not shared with any other household.
Energies 16 03805 i003The household has no access to electricity.ElectricityA household does not have electricity or does not have access to the internet or a smartphone.
Energies 16 03805 i004 Cooking fuelA household cooks with dung, agricultural crops, shrubs, wood, charcoal, or coal.
Energies 16 03805 i005 HousingA household has inadequate housing: the floor or roof or walls are made of natural or rudimentary materials or there are more than three people per sleeping room.
Energies 16 03805 i006 AssetsA household does not own more than two assets (radio, TV, telephone, computer, animal cart, bicycle, motorbike, refrigerator, washing machine, bank account) and does not own a car or truck.
Note: Dim. indicates the dimension of poverty. Sources: [39,137,138,140,143,144].
Table 3. Selected publications on energy-related poverty, vulnerability, and security.
IndexAbbr.ExplanationSource
Energy SecurityEnergy security
index
ESIESI is a multidisciplinary index that focuses on availability and affordability issues, as well as the impacts of technological advancements, sustainable development, and governance.[22,147,148]
Aggregated energy security
Performance
indicator
AESPIAESPI is an important tool for observing and measuring the impacts of energy policies on the pathway towards sustainability. Typically, a low carbon society is associated with greater AESPI levels.[149,150]
Energy VulnerabilityComposite
Vulnerability Index
CVICVI appears to be a composite index that measures the multifaceted tiers of energy vulnerability.[151]
Global Energy
Vulnerability Index
GEVIGEVI measures a system’s exposure to negative externalities and risks. It can be a useful policy tool for copying with socioeconomic and environmental “traps”.[152]
Energy Poverty Vulnerability IndexEPVIEPVI combines gaps between socioeconomic aspects and buildings energy performance, can provide a local, regional, and national information about heating and cooling levels as well.[69]
Fuel Poverty10% share of
Income or
expenditure
10%Was utilized as the official indicator in the UK on measuring energy affordability and denotes a fuel household that consumes more of the 10% income (or expenditure) on trying to primarily achieve a comfortable level of warmth, and lately to maintain a minimum acceptable level on cooking and heating.[2,44,68,73,153]
Low Income
High Cost
LIHCThe rising fuel prices in combination with the low incomes in households renders many households as fuel poor. The LIHC replaced the 10% indicator, as the latter utilizes the arbitrary 10% level without a specific reason.[59]
After Housing CostAHCThere are many alterations of the AHC relatively to which level ought to attain regarding the national median AHC income. Many researchers select the 60% of AHC income as a central indicator.[13,58]
Minimum Income StandardMISThe MIS budgets considers a basket of products for food, clothing, and even the capability of participating in cultural events.[13,55]
Fuel Poverty IndexFPIIt is the geometric mean of a standard of living indicator, it measures house energy inefficiency and potential heating restriction.[154]
Fuel Poverty
Potential Risk Index
FPPRIThis index provides a robust framework on copying with the risk of fuel poverty. [53]
(Modified) Foster–Greer–ThorbeckeFGTAssesses the incidence, gap and severity of poverty based on the poverty index developed by Foster–Greer–Thorbecke [155].[94,156]
Basic Energy Needs and
Basic Carbon Needs
BEN
and
BCN
The index measures the basic carbon needs, which are defined as the amount of carbon emissions needed to achieve (socially and materially) adequate levels of domestic energy services.[115]
Multitier Framework for measuring energy accessMTFThe index categorized different energy services across household, productive and community needs, in parallel with issues on electricity, cooking, and heating services categorization.[146,157]
Energy PovertyMultidimensional Energy
Poverty Index
MEPIThe index incorporates basic household energy services such as ways of cooking, lighting, and services provided by appliances for universal communication and pleasant entertainment.[26,27,28,29,30,31,131]
Household Energy Poverty IndexHEPIThis index can categorize households into four categories: (i) “least energy poor”, (ii) “less energy poor”, (iii) “more energy poor”, and (iv) “most energy poor”.[158]
Energy Poverty
Barometer
EPBThis index complements three issues: (i) measured energy poverty, (ii) perceived energy poverty, and (iii) hidden energy poverty.[159]
Hidden Energy
Poverty
hEPhEP exists if: (i) energy expenditure is below a fixed threshold, (ii) total expenditure is below the relative poverty threshold, (iii) households are absolutely poor, not well insulated, and energy inefficient.[160]
Compound Energy Poverty IndicatorCEPIIt takes into account the inadequate living conditions (such as not warm or not cool, or even dark household), arrears on utility bills, and the existence of leaks by weighting them composing an index.[161]
EU Statistics on
Income and Living Conditions
EU-SICLThree main indicators: (i) inability to keep home adequately warm; (ii) arrears on utility bills; and (iii) population living in a dwelling with a leaking roof, damp walls, floors or foundation, or rot in window frames or floor.[62,71,98]
Disclaimer/Publisher’s Note: The statements, opinions and data contained in all publications are solely those of the individual author(s) and contributor(s) and not of MDPI and/or the editor(s). MDPI and/or the editor(s) disclaim responsibility for any injury to people or property resulting from any ideas, methods, instructions or products referred to in the content.

