Article

Impact of Environmental Policy Mix on Carbon Emission Reduction and Social Welfare: Scenario Simulation Based on Private Vehicle Trajectory Big Data

1
Business College, Central South University of Forestry and Technology, Changsha 410004, China
2
College of Computer Science and Electronic Engineering, Hunan University, Changsha 410082, China
*
Author to whom correspondence should be addressed.
Energies 2023, 16(15), 5839; https://doi.org/10.3390/en16155839
Submission received: 7 June 2023 / Revised: 25 July 2023 / Accepted: 5 August 2023 / Published: 7 August 2023
(This article belongs to the Collection Feature Papers in Energy, Environment and Well-Being)

Abstract

:
Analyzing and investigating the impact of implementing an environmental policy mix on carbon emission from private cars and social welfare holds significant reference value. Firstly, based on vehicle trajectory big data, this paper employs reverse geocoding and artificial neural network models to predict carbon emissions from private cars in various provinces and cities in China. Secondly, by simulating different scenarios of carbon tax, carbon trading, and their policy mix, the propensity score matching model is constructed to explore the effects of the policy mix on carbon emission reduction from private cars and social welfare while conducting regional heterogeneity analysis. Finally, policy proposals are proposed to promote carbon emission reduction from private cars and enhance social welfare in China. The results indicate that the environmental policy mix has a significant positive impact on carbon emission reduction from private cars and social welfare. Furthermore, in the regional heterogeneity analysis, the implementation of the policy mix in eastern regions has a significant positive effect on both carbon emission reduction from private cars and social welfare, while in central and western regions, it shows a significant positive impact on social welfare but has no significant effect on carbon emission reduction in the private car sector.

1. Introduction

To successfully achieve the goals of “carbon peaking” and “carbon neutrality”, it is crucial to introduce rational environmental policies that promote carbon emission reduction in the road transportation sector. As of the end of 2022, the number of private cars in China reached 229 million, accounting for 54.92% of the total motor vehicle population [1]. Among them, private cars powered by fossil fuels constitute 94.32% of the total number of cars and play a dominant role in road transportation, making them a significant source of energy consumption in urban road traffic [2]. To effectively regulate carbon emissions in the private car sector, environmental policies have been introduced such as carbon tax or carbon trading serves as a feasible means for low-carbon transformation. However, while environmental policies reduce negative externalities, they also inevitably impact residents’ utility and social welfare. This necessitates the effective evaluation and coordination of the carbon emission reduction and welfare effects of environmental policies, ensuring their sustainability and social acceptance. However, due to the random and disorderly characteristics of vehicle carbon emissions, there are challenges in the statistical data collection of transportation carbon emissions. Existing studies often employ IPCC road transport “top-down” and “bottom-up” methods or develop and apply simulation econometric models to estimate carbon emissions in the transportation sector [3,4,5]. However, the use of different modeling types and measurement methods leads to significant differences in the estimation results of transportation carbon emissions [6]. This paper utilizes vehicle trajectory big data to provide high-quality scientific data support for the analysis of carbon emission reduction pathways in road transportation.
To incentivize and guide residents to adopt energy-saving and emission-reducing behaviors, market-based environmental policy tools such as carbon tax and carbon trading have been proposed [7,8]. Carbon tax is considered beneficial by some scholars as it promotes technological innovation and behavioral changes in transportation, advocating for the green travel of residents through direct or indirect financial incentives and cost constraints [9]. However, increasing carbon taxes may lead to overexploitation of energy resources in the short term, resulting in the “green paradox” [10]. Additionally, as a tax system, carbon taxes have income distribution effects and dual dividend effects that influence macroeconomics and social welfare [11]. Apart from a carbon tax, personal carbon trading (PCT) is also seen as a potential innovative tool for achieving carbon emissions reduction by changing residents’ travel behavior in the transportation sector [12]. However, both carbon tax policy and PCT policy require further exploration in terms of their emission reduction effects, social welfare implications, public acceptance, and ease of implementation. With the development of low-carbon policy theories, it is recognized that a single carbon reduction policy cannot meet existing emission reduction needs [13], and the low-carbon policy mix can not only achieve emission reduction targets but also ensure that dispersed carbon emission sources bear the responsibility for emission reduction, resulting in better emission reduction outcomes and social welfare [14]. Sheng et al. found that the policy mix of carbon tax and carbon trading is more beneficial to China’s macroeconomy [15]. Zhao et al. compared the differences in carbon emissions and economic impacts between policy mix and single policy, and found that the policy mix formed by carbon tax and carbon trading is comprehensive in terms of price flexibility and coverage scope [16].
Based on the above studies, few scholars were able to estimate carbon emissions of private cars using real world data at the micro level. However, this paper may introduce a new estimation method by utilizing artificial neural networks based on vehicle trajectory big data to predict carbon emissions from private cars. Furthermore, by employing realistic assignments and scenario simulations, this paper analyzes the impact of the mix of carbon tax and carbon trading policy on carbon emissions reduction and social welfare in the private car sector, potentially providing a fresh perspective for introducing environmental policies in the transportation field. Therefore, this paper employs reverse geocoding and artificial neural networks to predict carbon emissions from private cars in each province and city. It then simulates differentiated policy scenarios to explore the effects of policy mix on carbon emissions reduction and social welfare. This research aims to provide reference for formulating carbon emission reduction strategies in China’s road transportation sector and contribute to the achievement of the “double carbon” goals and the development of low-carbon transportation. The remaining sections are organized as follows: Section 2 introduces the data source, research method, and model setting of this paper. Section 3 predicts the carbon emissions of private cars through neural network simulation and comparison based on the big data of vehicle trajectory. Section 4 uses a propensity score matching (PSM) model to investigate the impact of environmental policy mix on carbon emission reduction of private cars and social welfare, and carries out further regional heterogeneity analysis. Section 5 presents the discussion, conclusion, and policy proposals.

2. Research Design

2.1. Data Sources

The research data were obtained in the actual working scenario through the developed low-cost GNSS-OBD equipment [17], totaling 117,052 pieces of vehicle trajectory big data. The data collection time was from 6:00 to 12:00 on 1 July 2018. The sampling frequency was 1 Hz, the time resolution was 0.01 s, the position resolution was 0.1 m, and the average position error could be controlled within 10 m. The data mainly include vehicle information ID, trip start time, trip end time, longitude and latitude of starting point, longitude and latitude of ending point, driving distance (unit: m), travel time (unit: s), fuel consumption (unit: mL), and other information [18], as shown in Table 1. The data cover 31 provinces, autonomous regions, and municipalities of China. The locations of trajectory points were realized by inverse geocoding of latitude and longitude, and the specific addresses can be accurate to provinces, cities (districts), and roads. The remaining data came from China Statistical Yearbook 2018, combined with relevant provincial and municipal statistical yearbooks and statistical bulletins.

2.2. Research Methods

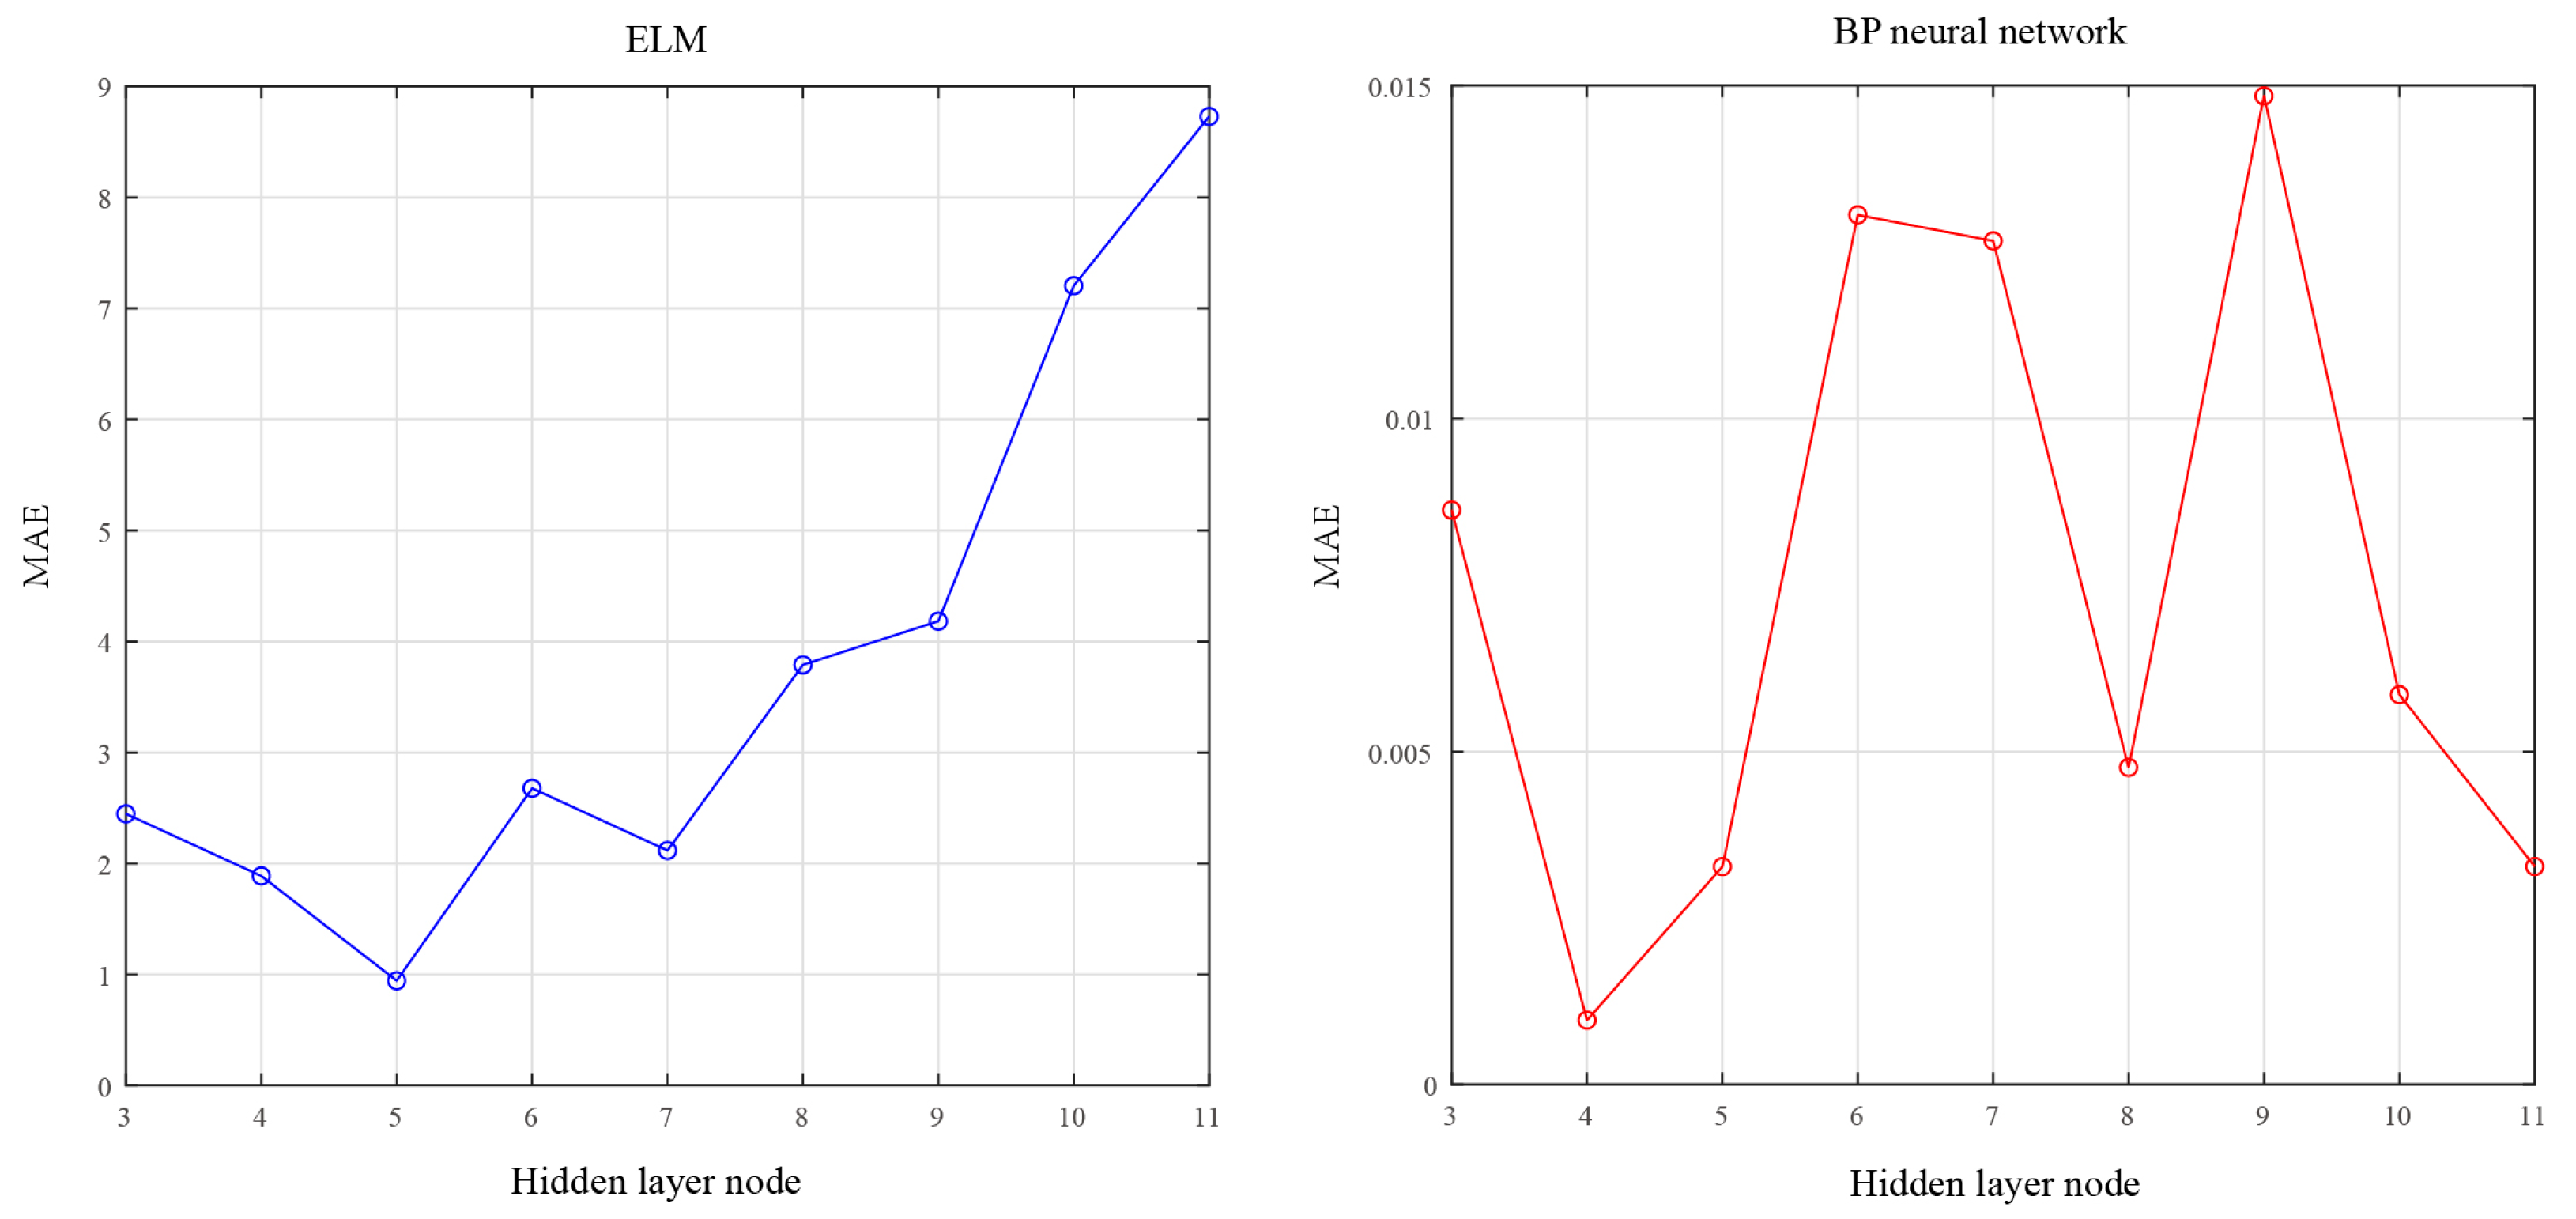
2.2.1. Artificial Neural Network

The ability of self-learning and high-speed optimizing of artificial neural networks is very important for prediction. In this paper, the carbon emissions of private cars are predicted by the travel time, driving distance, and fuel consumption of private cars. Because the mapping equation between input and output is unknown, it is difficult to model it mathematically. However, the nonlinear adaptive information processing ability of neural network can solve this kind of problem very well. Based on this, this paper first establishes a BP neural network model to predict the carbon emissions of private cars through Matlab software. A BP neural network is a feedforward neural network with reverse error propagation and excellent nonlinear mapping ability. The basic idea is a gradient descent method, whose errors are calculated by quadratic cost function [19]:
E 1 = 1 2 k = 1 n ( T k O k ) 2 ,
where T k is the expected output, O k is the neural network output, and E 1 is the prediction error. Considering the limitation of BP neural network fitting ability, this paper establishes the Extreme Learning Machine network model (ELM) for simulation and comparison. ELM is an improvement of the back propagation algorithm (BP framework), with advantages such as high learning efficiency and good generalization performance. Its core idea is to solve the output weight to minimize the error function, as follows:
min β ϵ R l × m | | h β t | | 2 ,
where h is the output matrix, t is the training goal, | | is the frobenius norm of matrix elements. In addition, expected carbon emissions from private cars are measured using the IPCC “bottom-up” approach to road transport, with the following formula:
T C O 2 = i = 1 n Q i E F i ,
where Q i is the consumption of fuel i, and E F i is the emission factor of fuel i. Since most of the fuel types of the vehicle trajectory big data collected in this paper are gasoline, only mixed with a little hybrid power, E F i is calculated using the vehicle gasoline in the 2019 Refinement to the 2006 IPCC Guidelines for National Greenhouse Gas Inventories.

2.2.2. Environmental Policy Scenario Simulation

  • Carbon tax policy scenario (hereinafter referred to as “carbon tax scenario”).
In this paper, it is assumed that the travel cost of driving cars from residents is mainly the fuel consumption, and with the introduction of carbon tax, the travel cost increases, including both fuel consumption and carbon tax. At this point, the tax impact of the carbon tax directly affects the fuel price. As fuel is a daily consumable for private car travel and a normal commodity with demand and price inversely related, changes in its price can alter consumer behavior, leading to an increase or decrease in fuel consumption, and consequently causing fluctuations in carbon emissions. Therefore, the price elasticity of fuel demand under tax impact can be represented by Equation (4):
E t a x = Q t a x Q / p t a x p ,
where E t a x is fuel demand price elasticity, Q and p are fuel demand and price in a certain period, Q t a x and p t a x are the fuel demand variation and price variation caused by carbon tax in a certain period. Assuming that there is a t:1 relationship between tax rate and fuel price, the correlation between tax impact caused by tax rate t and fuel price p is as follows:
Q t a x = E t a x × p t p × Q = E t a x × t × Q .
Based on the studies of existing scholars, the price elasticity coefficient of fuel demand in this paper is set as −0.23 [20]. Therefore, the emission reduction and resident travel costs of each province and city under the carbon tax scenario are:
R 1 i = 1 k Q t a x i × E F ,
C 1 i = 1 k x 1 i p 1 ( 1 + t ) / k ,
where R 1 i refers to the carbon emission reduction under the carbon tax scenario of the i-th province, while Q t a x i refers to the fuel consumption reduction of the i-th province. C 1 i is the average travel cost of residents in the i-th province, x 1 i is the fuel consumption of residents in the i-th province, and p 1 is the fuel price.
Under the carbon tax scenario, this paper treats fuel and other goods as two commodities. The carbon tax, being an additional tax, can be seen as an extra cost incurred by residents when consuming fuel during driving car travel. This will dampen residents’ demand for private car travel, reduce their propensity for fuel consumption, and affect their preferences and utility. According to the commodity utility function proposed by Douglas, resident utility depends on the degree of preference for fuel consumption and other commodities. In the case of a certain income, residents are willing to bear the cost of fuel consumption and taxes are also certain. Therefore, resident utility function and income constraint are:
U 2 ( x 1 , x 3 ) = x 1 α 1 x 3 1 α 1 ,
M = x 1 p 1 ( 1 + t ) + x 3 p 3 ,
where U 2 ( x 1 , x 3 ) is the residents’ utility function under the carbon tax scenario, α 1 is the residents’ preference for fuel oil, 1 − α 1 is the residents’ preference for other commodities, M is the residents’ income, x 3 is the demand for other commodities, and p 3 is the price of other commodities. Combining Equations (8) and (9), the Lagrange function is constructed as [21]:
L ( x 1 , x 2 , x 3 , λ ) = x 1 α 2 x 3 1 α 1 + λ [ x 1 p 1 ( 1 + t ) + x 3 p 3 M ] .
Combining the above Douglas function and Lagrange function, the stagnation point can be obtained:
x 1 = α 1 M p 1 ( 1 + t ) ,
x 2 = ( 1 α 1 ) M p 3 .
Substituting Equations (11) and (12) into Equation (8), the resident utility function under the carbon tax scenario can be obtained. According to the utilitarian standard, the social welfare function W 1 i for each province and city under the carbon tax scenario can be obtained by summing up Equation (13), as follows:
U 1 ( x 1 , x 3 ) = α 2 M p 1 1 + t α 2 1 α 2 M p 3 1 α 2 ,
W 1 i ( U 11 , U 1 k ) = U 1 i .
2.
Carbon trading scenario under total quantity control (hereinafter referred to as the “carbon trading scenario”).
The total carbon emissions are restricted within a certain proportion, and residents receive equal shares of free quotas under the total emission control. When residents’ carbon emissions from driving car travel do not exceed the free quota, their travel costs consist solely of fuel expenses. However, when their emissions exceed the free quota, their travel costs include both fuel expenses and carbon emission costs. Therefore, under the carbon trading scenario, the travel costs and emission reductions for residents in each province and city are as follows:
R 2 i = i = 1 k Q i E F b Q i E F ,
C 2 i = 1 k x 1 i p 1 / k       x 2 i < x 0 C 2 i = ( 1 k x 1 i p 1 + x 2 i x 0 p 2 ) / k         x 2 i > x 0 ,
where R 2 i is the carbon emission reduction of the i-th provinces and cities in the carbon trading scenario, and Q i is the benchmark fuel consumption in the no-policy scenario. b is the proportion of total quantity control. C 2 i is the average travel cost of residents in the i provinces and cities when they do not exceed the free quota under the carbon trading scenario, x 2 i is the carbon emission of residents i, and x 0 is the free quota. C 2 i is the average travel cost for residents of the i-th province when they exceed the free quota. p 2 is the price of carbon emission.
Under the carbon trading scenario, this paper treats fuel consumption, carbon emissions, and other goods as three commodities. Since carbon emissions are tradable, residents will reduce their demand for carbon emissions to seek economic benefits. This will lead to the reduction of private car travel preference and affect residents’ utility. Therefore, based on the utility function and income constraint function, the residents’ utility and income constraint under the carbon trading scenario can be expressed as follows:
U 2 ( x 1 , x 2 , x 3 ) = x 1 α 1 x 2 β 1 x 3 1 α 1 β 1 ,
M = x 1 p 1 + ( x 2 x 0 ) p 2 + x 3 p 3 ,
where U 2 ( x 1 , x 2 , x 3 ) is the resident utility function under the carbon trading scenario. x 1 is fuel consumption; x 2 is carbon emission; x 3 is the quantity of other commodities; α 1 is the preference degree of residents to fuel consumption from the perspective of carbon trading. β 1 is the degree of residents’ preference for carbon emission; 1 α 1 β 1 is the degree to which residents prefer other goods. Residents’ utility maximization is an extreme value problem under the income constraint. Lagrange function is constructed to obtain residents’ utility function. According to the utilitarian standard, the social welfare function W 2 i for each province and city can be obtained by summing up Equation (19):
U 2 ( x 1 , x 2 , x 3 ) = α 1 ( M + p 2 x 0 ) p 1 α 1 β 1 ( M + p 2 x 0 ) p 2 β 1 ( 1 α 1 β 1 ) ( M + p 2 x 0 ) p 3 ( 1 α 1 β 1 ) ,
W 2 i ( U 21 , U 2 k ) = U 2 i .
3.
Carbon tax and carbon trading policy mix scenario (hereinafter referred to as “environmental policy mix scenario”).
Residents bear the cost of fuel, additional carbon tax, and carbon emission costs when their emissions exceed the free quotas. This incentivizes residents to reduce their demand for private car travel, leading to a reduction in carbon emissions. When residents’ carbon emissions from driving car travel do not exceed the free quotas, their costs consist of fuel expenses and carbon tax. However, when their emissions exceed the free quotas, their costs include fuel expenses, carbon tax, and the additional cost of purchasing carbon emission allowances. The calculation formula is shown as follow:
C 3 i = 1 k x 1 i p 1 1 + t / k       x 2 < x 0 C 3 i = 1 k x 1 i p 1 1 + t + x 2 i x 0 p 2 / k       x 2 > x 0 ,
where C 3 i is the average cost when residents’ travel does not exceed the free quota under the policy mix scenario, and C 3 i is the average cost when residents’ travel exceeds the free quota. Under this circumstance, the carbon emission reduction can be attributed to the combined effect of two factors: firstly, the reduction in carbon emissions from residents due to the increased cost under the carbon tax scenario, and secondly, the reduction in carbon emissions resulting from the total emission control under the carbon trading scenario. The formula is as follows:
R 3 i = 1 k ( 1 b ) Q i E F + 1 b Q i E F × t × E t a x .
Under the policy mix scenario, this paper treats fuel consumption, carbon emissions, and other goods as three commodities. Residents’ decision-making regarding driving car travel takes into account the cost increase caused by carbon tax and the profit preference resulting from carbon trading. At this point, residents’ utility depends on the combined effect of these three commodities. According to the commodity utility function and income constraint function proposed by the Douglas function, the following can be derived:
U 3 ( x 1 , x 2 , x 3 ) = x 1 α 1 x 2 β 1 x 3 1 α 1 β 1 ,
M = x 1 p 1 ( 1 + t ) + ( x 2 x 0 ) p 2 + x 3 p 3 ,
where U 3 ( x 1 , x 2 , x 3 ) is the resident utility function under the policy mix scenario. The Lagrange function is constructed to obtain the resident utility function. According to the utilitarian standard, the social welfare function W 3 i for each province and city can be obtained by summing up Equation (25):
U 3 x 1 , x 2 , x 3 = α 3 M + p 2 x 0 p 1 1 + t α 3 β 3 M + p 2 x 0 p 2 β 3 1 α β M + p 2 x 0 p 3 1 α 3 β 3 ,
W 3 i ( U 3 i , U 3 k ) = U 3 i .

2.2.3. PSM

Since the variable in this paper is the result of scenario simulation analysis, the traditional linear regression model may miss relevant factors and fail to cover the covariables affecting the carbon emission reduction of private cars and social welfare, resulting in endogenous bias [22]. However, PSM uses a counterfactual framework to estimate the treatment effect, which can effectively eliminate the selective bias of confounding factors [23]. Therefore, in this paper, the sample provinces and cities with and without environmental policy mix are divided into treatment group and control group. A logit model or probit model is used to estimate the propensity score, where the propensity score is the probability of implementing policy mix in each province and city on the premise that sample feature xi is determined:
p x i = p r d i = 1 x i = e [ d i | x i ] ,
where d i is 1 when the environmental policy mix is implemented in the i-th province, and 0 otherwise. After the propensity matching score p x i , is obtained, the average treatment effects on treated (ATT) is adopted to estimate the impact of environmental policy mix on the carbon emission reduction of private cars and social welfare. The specific formula is as follows [24]:
A T T = e y 1 i y 0 i d i = 1 = e e y 1 i y 0 i d i = 1 , p x i = e { e y 1 i d i = 1 , p x i e y 1 i d i = 0 , p x i | d i = 1 } ,
where, y 1 i and y 0 i respectively represent the carbon emission reduction of private cars and social welfare under the two scenarios of implementing environmental policy mix and single environmental policy in the same province and city. After the propensity matching score is obtained, this paper uses three methods of nearest neighbor matching, radius matching, and kernel matching to analyze the overall samples.

2.3. Theoretical Analysis

Carbon tax, as a price-based policy tool that forces emission reduction backward, internalizes environmental external costs through taxation, with advantages of being adjustable, high efficiency, and low cost. Although it may have a certain negative impact on economic development in the short term, in the long run, such impact is controllable and limited [25]. Some scholars have proposed that carbon tax policy can produce double dividend effect, regressive effect, and substitution effect on carbon emission reduction and social welfare. Although the distribution effect of carbon tax may produce certain negative effects, it can effectively promote carbon emission reduction and social welfare improvement through the application of optimal tax rate [26]. In addition, although the carbon tax can promote carbon emission reduction, market resource allocation may be disturbed under government intervention. Therefore, the externality theory holds that, under the circumstance of clear property rights, taking carbon emission right as a commodity and optimizing resource allocation through a market-oriented mechanism can reduce carbon emission reduction cost, promote technological innovation, and improve the overall social welfare [27]. Carbon trading policies are generally considered to produce a constraint effect, incentive effect, and Porter effect on carbon emission reduction and social welfare [28].
With the introduction of the concept of policy mix into the research of public and innovative policies, existing studies have found that diversified carbon emission reduction policy tools and their mixed implementation have better policy effects. Rogge et al. sees policy mixes as instruments of interaction aimed at achieving goals in a dynamic environment. Compared with a single environmental policy, the mix of environmental policies can produce better emission reduction effects and social welfare [29]. Li et al. proposed that, compared with the single carbon tax policy or carbon trading policy, the implementation of mixed carbon emission reduction policies in China has a more obvious effect on reducing energy consumption and emission reduction [30]. Carbon trading is a quantitative emission reduction policy tool, while carbon tax is a price emission reduction policy tool. The mix of the two policies can realize the complementarity of coverage and price mechanism [31]. With the increase of emission reduction in the future, China should gradually introduce carbon tax policy while implementing carbon trading, so as to produce a better emission reduction effect.
Based on the above analysis, this paper believes that although the introduction of carbon tax policy in the field of private car will guide residents to reduce carbon emissions through the price mechanism, the extra tax cost will greatly affect low-income consumers, resulting in unequal distribution and the decline of social welfare. Under the carbon trading policy, although residents can obtain economic benefits by reducing carbon emissions, the carbon quota system will inevitably produce rent-seeking problems, resulting in a lack of fairness. However, the preference of high-income groups for private car travel is not constrained by economic cost, and the cost of carbon trading and emission reduction is highly uncertain. At the same time, the market price mechanism of carbon trading is completely determined by the market mechanism, which is highly volatile. The introduction of a carbon tax policy and its implementation are conducive to avoiding ineffective emission reduction caused by low carbon price, and the tax revenue can also be used for tax refund and investment in green innovation technology to promote the “welfare” of the private car field. Accordingly, the following research hypotheses are proposed in this paper:
H1. 
The implementation of policy mix facilitates the complementary relationship between coverage scope and pricing mechanisms, leading to a positive impact on reducing carbon emissions from private cars.
H2. 
The implementation of policy mix benefits from optimizing market resource allocation and promoting technological innovation, resulting in a positive impact on social welfare.

2.4. Model Construction

Before PSM matching, the psestimate command in STATA software was used to select the first-order and second-order forms of covariables to achieve the best fitting effect by comparing the maximum likelihood values of different models. With social welfare and carbon emission reduction as result variables, the model is set as follows:
m i x i t b = α 0 + α 1 x i t b + α 2 z i t b + ε ,
where x i t b are the first-order variables, z i t b are second-order covariates.

2.5. Variable Description and Descriptive Statistics

  • Dependent variable. Carbon emission reduction (red). The carbon emission reduction of private cars under the environmental policies and its mix scenario can be calculated by Formulas (6), (15) and (22) above. Social welfare (bet). The sum of all residents’ utility under environmental policies and their mix scenarios can be calculated by Formulas (14), (20) and (26) above.
  • Dummy variable. Environmental policy mix (mix). Dummy variable is defined by whether the policy mix of carbon tax and carbon trading is implemented. If it is implemented, the value is 1; otherwise, it is 0.
  • Covariable. Resident cost (cost), tax rate, total control ratio, mix of tax rate, and total control ratio (num). The resident cost can be calculated by Formulas (7), (16) and (21). In the carbon tax scenario, the tax rates are set as 0.1, 0.3, 0.5, 0.7, and 0.9, respectively. Under the carbon trading scenario, the total volume control ratio is set as 0.1, 0.3, 0.5, 0.7, and 0.9, respectively. Under the policy mix scenario, the tax rate and the total control ratio are set as the same mix, which are (0.1, 0.1), (0.3, 0.3), (0.5, 0.5), (0.7, 0.7), and (0.9, 0.9), respectively.
In order to avoid the influence of heteroscedasticity, logarithmic processing is performed on carbon emission reduction, social welfare, and resident cost according to data characteristics. The descriptive statistical structure of each variable is shown in Table 2.

3. Carbon Emission Prediction of Private Cars

3.1. Sensitivity Analysis

Sensitivity analysis is a method used to evaluate the model or system’s sensitivity degree to changes in input parameters. It aims to validate the model’s reasonableness and reliability by identifying the input parameter mix that optimizes the output results. In this paper, we conducted sensitivity analysis on the number of nodes in the hidden layer based on the empirical formula. We selected 3–11 nodes to observe the impact of the hidden layer nodes on model performance, as shown in Figure 1. The mean absolute error (MAE) of the ELM model’s prediction results ranged from 0 to 9 when the hidden layer nodes varied from 1 to 11, while the BP neural network model’s mean absolute error ranged from 0 to 0.015. Furthermore, the ELM model achieved its minimum mean absolute error of 0.992 when the hidden layer nodes were 5, whereas the BP neural network model reached its minimum mean absolute error of 0.002 with 4 hidden layer nodes. Overall, the predictive performance of the BP neural network model was significantly superior to the ELM model.

3.2. Prediction of Carbon Emission from Private Cars

This paper establishes a 3-5-1 BP neural network model to predict the carbon emissions of private cars in various provinces and cities. The steps are as follows: (1) Construct a BP neural network model with vehicle travel time, travel distance, and fuel consumption as input layers, and private car carbon emissions as the output layer. (2) Train the BP neural network model based on the vehicle trajectory big data. (3) Use the pre-trained BP neural network model for prediction. Considering the potential incompleteness in the collection of vehicle trajectory big data, this paper adopts a weighted average approach by using the proportion of collected vehicle trajectory points in each province and city and the proportion of per capita disposable income in each province and city. This weighted average is then multiplied by the predicted total national carbon emissions from private cars to estimate the final private car carbon emissions for each province and city.

4. Result Analysis

4.1. Common Support Domain Test

The common support domain test is a basic test to measure the matching effect of propensity. The larger the matching range of common support domain is, the smaller the probability of sample loss is. This paper takes nearest neighbor matching as an example and the matching results are shown in Figure 2; the y axis represents the number of samples and the x axis represents the propensity scores. Only a small number of observers are not in the common value range, which indicates that the sample loss is small and the model matching effect is better.

4.2. Balance Test

The balance test results are shown in Table 3. It can be seen that the pseudo-R2, LR statistics, and mean bias are significantly reduced after model matching, and the p value of the model is 0 before matching, with significant difference, while the p value is greater than 0.1 after matching, with no significant difference. This indicates that there is no systematic difference in covariates between the control group and the treatment group after pairing. In addition, when the standardization bias proposed by Rosenbaum and Rubin is less than 20%, the sample matching effect is good [32], and the standardization deviation after matching of all variables in the sample decreases from 83.9 to 15.3, 14.8, and 7. Therefore, the above results show that the model has a better effect after matching, the balance test is passed, and the results of different matching methods are consistent and relatively robust.

4.3. The Impact of Environmental Policy Mix on Carbon Emission Reduction and Social Welfare

Table 4 shows the average incentive effect of environmental policy mix on carbon emission reduction of private cars and social welfare. When social welfare is taken as the result variable, the three matching methods all passed the 1% significance test before and after matching, and the analysis results are robust. After controlling the relevant first-order and second-order covariates, the social welfare of the provinces and cities with the environmental policy mix under nearest neighbor matching, radius matching, and kernel matching are 3.78% (0.324/8.569), 3.91% (0.335/8.558), and 4.06% (0.347/8.546) higher than those matched provinces and cities, respectively. It shows that the implementation of environmental policy mix has a significant positive impact on improving social welfare. When carbon emission reduction is taken as the result variable, the three matching methods also pass the 1% significance test before and after matching, and the results are also robust. This indicates that the implementation of environmental policy mix has a significant negative impact on carbon emission from private cars. In addition, without matching according to the sample covariable, the average incentive effects of social welfare and carbon emission reduction between the treatment group and the control group before matching are 0.3 and 1.106, respectively, which are higher than the values after matching by the three methods: nearest neighbor matching, radius matching, and kernel matching. This will lead to deviations in the impact of environmental policy mix on carbon emission reduction of private cars and social welfare. Therefore, the propensity score matching method can eliminate the influence of other factors and further ensure the accuracy of estimation results.

4.4. Robustness Test

In order to test the robustness of the research conclusions, the following tests are carried out in this paper:
  • A bootstrap sampling method is adopted to solve the small sample bias problem, and the matching method is changed. The results obtained by the three methods of nearest neighbor matching, radius matching, and kernel matching are sampled 500 times repeatedly, as shown in Table 5. It can be seen that the average excitation effect is basically consistent with the previous results and all pass the 1% significance test.
  • Remeasure the carbon emission index of private cars. Since the collection of vehicle trajectory data in prefecture-level cities may be incomplete, there may be errors in the calculation of carbon emissions from private cars in various provinces and cities. Based on the research of existing scholars, this paper converted the private car ownership in each province and city into energy consumption, and then estimated the carbon emissions of private cars of residents in each province and city through the carbon emission coefficient of IPCC vehicle gasoline. The formula is as follows:
    e m s = p c v × a a m × a f c × n v i × e f ,
    where e m s is the carbon emissions of private cars in various provinces and cities. p c v is the number of private cars in various provinces and cities, a a m is the annual average mileage driven, a f c is the average fuel consumption per unit mileage, n v i is the calorific value of gasoline converted into standard coal, and e f is the carbon dioxide emission coefficient of gasoline. China’s annual driving distance mileage of private cars is 15,000 km, the average fuel consumption per hundred kilometers of private car is 8.6 liters, per liter motor gasoline is about 0.000748 ton [33,34]. The automotive gasoline emission coefficient provided in the IPCC Guide is 69,300 kg·TJ−1 and the net calorific value of gasoline is 44.3 TJ·Gg−1. Table 6 lists the average incentive effect of the environmental policy mix after the remeasurement of private car carbon emissions. Whether social welfare or carbon emission reduction is taken as the result variable, the three matching methods pass the significance test before and after matching, showing robustness.
  • Change the regression model. Tobit model is used for re-estimation. The regression results are shown in Table 7, which is consistent with the previous conclusions and robust.

4.5. Regional Heterogeneity Analysis

Regional heterogeneity arises from disparities in resource endowment, economic development, and other factors of different areas. To further investigate whether the implementation of environmental policy mix is influenced by regional heterogeneity, this paper examines the impact of environmental policy mix on carbon emissions reduction from private cars and social welfare, based on the geographical region division of east, center, and west of China. The results are shown in Table 8. From the perspective of the eastern region, whether using carbon emissions reduction or social welfare as outcome variables, the three matching methods—nearest neighbor matching, radius matching, and kernel matching—pass the 1% significance test before and after matching. This indicates that the implementation of environmental policy mix in the eastern region has a significant positive impact on both carbon emissions reduction of private cars and social welfare. However, in the central and western regions, when social welfare is considered as the outcome variable, the implementation of environmental policy mix shows a significant positive impact under the three matching methods. On the other hand, when carbon emissions reduction is taken as the outcome variable, the impact of environmental policy mix on carbon emission reduction does not pass the 1% significance test under any of the three matching methods. This indicates that the implementation of environmental policy mix in the central and western regions does not have a significant impact on carbon emission reduction from private cars.
What explains these effects? This paper believes that social welfare is the sum of residents’ private car travel utility under environmental policy regulation, and the implementation of carbon tax policy will change the income distribution structure, resulting in the decrease of social wages and consumption level, and the necessity to reduce private car travel and fuel consumption, which will lead to the decrease of residents’ utility and social welfare. The mix of carbon tax and carbon trading policy reduces the “regressive effect” of the single carbon tax policy. Residents can obtain economic benefits by participating in the carbon market, which makes up for the increase in residents’ private car travel costs under the carbon tax policy and improves residents’ utility and social welfare. That is, the social welfare in the field of private cars under environmental policy regulation mainly depends on the cost increase caused by carbon tax policy and the economic benefits caused by carbon trading policy, which are concentrated in the individual level of residents and affected by the sum of their income level, profit preference, and other factors, while the influence of regional differences is small. In addition, the eastern region has a developed economy, advanced technology, complete infrastructure construction and industrial system development, and less resistance to the implementation of environmental policies. At the same time, the population density in the eastern region is large and the environmental pollution problem is also prominent. At present, China has entered a stage of high-quality development and places great emphasis on environmental protection efforts. The implementation of environmental policy mix in the eastern region is supported by technological advancements, financial resources, and accompanying policies. This enables the effective utilization of multiplier effects driven by various factors, leading to a significant reduction in carbon emissions from private cars [35]. However, in the central and western regions, where economic development and per capita income levels are relatively lower, the number of private cars and carbon emissions are also relatively limited. Consequently, under the regulation of environmental policies, the reduction in carbon emissions from private cars is not significant.

5. Discussion and Conclusions

5.1. Discussion

Unlike Kakouei, Ning, and other scholars who use case study data or questionnaire survey data to estimate private car carbon emissions [36,37], based on vehicle trajectory big data, this paper utilizes artificial neural networks to predict carbon emissions from private cars. This approach places a greater emphasis on examining the perspective of private car individuals at the micro level. Furthermore, while most scholars explore the impact of environmental policies (including carbon tax or carbon trading) on private car carbon emissions using system dynamics methods and developing simulation econometric models [38,39], this paper simulates environmental policy scenarios using functions such as demand price elasticity and utility function, as well as the PSM method. This approach focuses more on analyzing individual emission reduction behavior from an economic perspective.
Additionally, through scenario analysis and the PSM method, this paper confirms the positive impact of the environmental policy mix on carbon emission reduction of private car and social welfare, aligning with the findings of Chalak, Tan, and other scholars who also observed that policy mix has a more significant contribution to carbon emission reduction and social welfare [40,41]. Moreover, Chen and others have argued that carbon emission reduction goals may not align entirely with the goal of enhancing social welfare [42]. This viewpoint aligns with the analysis results of this paper from the perspective of regional heterogeneity, highlighting the need to comprehensively consider the differences in regional economic development and resource endowments when promoting the carbon emission reduction of private cars and enhancing social welfare.

5.2. Research Conclusions

This paper aimed to achieve three research objectives. The first objective was to predict carbon emission from private cars in China. Based on vehicle trajectory big data, this study conducted a simulation comparison between the BP neural network model and the ELM network model. The results indicate that the BP neural network model performed better in predicting carbon emissions from private cars. Therefore, we chose to build a 3-5-1 BP neural network model for the prediction of private car carbon emissions.
Regarding the second research objective, the paper explored the impact of implementing policy mix on carbon emission reduction of private car and social welfare. Through using the scenario analysis and PSM method, the paper examines the impact of implementing policy mix on carbon emission reduction of private car and social welfare. The results indicate that the implementation of policy mix has a significant positive impact on the carbon emission reduction of private cars and social welfare, and the results remain robust after a series of robustness tests.
The third objective of this paper was to investigate the impact of policy mix on the carbon emission reduction of private cars from the perspective of regional heterogeneity. By dividing China into eastern, central, and western regions based on geographical region criteria, the paper examines the impact of implementing policy mix on the carbon emission reduction of private cars and social welfare in different regions. It finds that in the eastern region, the implementation of policy mix has a significant positive impact on carbon emission reduction of private cars and social welfare. On the other hand, in the central and western regions, the implementation of environmental policy mix has a significant positive impact on social welfare but does not have a significant effect on private car carbon emission reduction.

5.3. Research Contribution

The contributions of this paper are mainly reflected in three aspects. Firstly, this paper attempts to use artificial neural networks based on vehicle trajectory big data to predict carbon emissions from private cars, potentially providing a novel method for estimating carbon emissions of private cars. Secondly, the paper is based on a realistic assignment and scenario analysis, utilizing microeconomic functions such as demand price elasticity and utility functions to analyze individual residents’ preferences and emission reduction behavior. This offers a fresh perspective on exploring the impact of environmental policy mix on private car carbon emission reduction and social welfare. Thirdly, considering the differences in regional economic development and resource endowments, the paper examines the effects of implementing environmental policy mix on carbon emission reduction of private car and social welfare in the eastern, central, and western regions of China from the perspective of regional heterogeneity. This has significant practical implications for conducting differentiated research and formulating environmental regulations in the private car sector and promoting regional coordinated development.

5.4. Policy Proposals

When introducing the environmental policy mix in the private car sector, priority should be given to incorporating the carbon tax policy within the existing tax system. This approach can address challenges such as high implementation costs, uncontrollable risks, and inadequate supporting facilities associated with implementing carbon emission reduction policies. Subsequently, a gradually decreasing total control proportion in the carbon trading policy can be introduced, which will save transaction costs and enhance residents’ utility. It is possible to form the policy mix guided by carbon taxes and regulated by carbon trading, fostering mutual complementarity between coverage scope and pricing mechanisms, thereby effectively stimulating the market’s decisive role in energy conservation, carbon emission reduction, and resource optimization [43].
In addition, taking into account the regional differences in China’s eastern, central, and western regions, it is proposed to establish pilot carbon trading and carbon tax policies in the eastern region first, followed by a gradual transition to the central and western regions. Simultaneously, accelerate green technological innovations in the private car sector, promote the adoption of new energy vehicles, and improve infrastructure such as charging stations. Strengthen collaborative environmental governance among regions to maximize the guiding and regulating functions of carbon tax and carbon trading policy mix, and promote regional coordination and the achievement of the “double carbon” goals [44].
The limitations of this paper lie in its focus solely on the impact of environmental policy mix on carbon emissions and social welfare in the private car sector, without considering a system approach with other sectors (such as agriculture and heating). In the future, further exploration could be conducted on the effects of introducing environmental policy mix across multiple sectors and domains. Additionally, with the increasing number of new energy vehicles in the road transport sector, future research could incorporate the carbon emission reduction effects of new energy vehicles into scenario analyses.

Author Contributions

Writing—review & editing, W.C.; Data curation, Z.X.; Writing—original draft, X.W. All authors have read and agreed to the published version of the manuscript.

Funding

This study was supported by Low-Carbon Transition Path and Policy Mix Innovation Based on Green Governance, National Social Science Foundation of China (19CGL043).

Data Availability Statement

The data used to support the findings of this study have not been made available because of the confidentiality agreements with research collaborators. The data form part of an ongoing commercial program and study.

Conflicts of Interest

The authors declare no conflict of interest.

References

  1. Sun, X.; Zhu, B.; Zhang, S.; Zeng, H.; Li, K.; Wang, B.; Dong, Z.; Zhou, C. New indices system for quantifying the nexus between economic-social development, natural resources consumption, and environmental pollution in China during 1978–2018. Sci. Total Environ. 2022, 804, 150180. [Google Scholar] [CrossRef] [PubMed]
  2. Lin, B.; Shi, L. Do environmental quality and policy changes affect the evolution of consumers’ intentions to buy new energy vehicles. Appl. Energy 2022, 310, 118582. [Google Scholar] [CrossRef]
  3. Annadanam, S.K.; Kota, S.H. Emission of greenhouse gases and criteria pollutants from railways in India estimated using a modified top-down approach. J. Clean. Prod. 2019, 213, 610–617. [Google Scholar] [CrossRef]
  4. Shiraki, H.; Matsumoto, K.i.; Shigetomi, Y.; Ehara, T.; Ochi, Y.; Ogawa, Y. Factors affecting CO2 emissions from private automobiles in Japan: The impact of vehicle occupancy. Appl. Energy 2020, 259, 114196. [Google Scholar] [CrossRef]
  5. Saharidis, G.K.; Konstantzos, G.E. Critical overview of emission calculation models in order to evaluate their potential use in estimation of Greenhouse Gas emissions from in port truck operations. J. Clean. Prod. 2018, 185, 1024–1031. [Google Scholar] [CrossRef]
  6. Zhang, L.; Long, R.; Chen, H.; Geng, J. A review of China’s road traffic carbon emissions. J. Clean. Prod. 2019, 207, 569–581. [Google Scholar] [CrossRef]
  7. Baranzini, A.; Goldemberg, J.; Speck, S. A future for carbon taxes. Ecol. Econ. 2000, 32, 395–412. [Google Scholar] [CrossRef]
  8. Yang, L.; Li, Y.; Liu, H. Did carbon trade improve green production performance? Evidence from China. Energy Econ. 2021, 96, 105185. [Google Scholar] [CrossRef]
  9. Xie, J.; Dai, H.; Xie, Y.; Hong, L. Effect of carbon tax on the industrial competitiveness of Chongqing, China. Energy Sustain. Dev. 2018, 47, 114–123. [Google Scholar] [CrossRef]
  10. Khastar, M.; Aslani, A.; Nejati, M. How does carbon tax affect social welfare and emission reduction in Finland? Energy Rep. 2020, 6, 736–744. [Google Scholar] [CrossRef]
  11. Chen, Z.-Y.; Nie, P.-Y. Effects of carbon tax on social welfare: A case study of China. Appl. Energy 2016, 183, 1607–1615. [Google Scholar] [CrossRef]
  12. Pottier, A. Personal carbon trading: A critical review of the arguments. Rev. D’economie Polit. 2022, 132, 723–750. [Google Scholar]
  13. Botteon, M.; Carraro, C. Is the European carbon tax really effective? In The European Carbon Tax: An Economic Assessment; Springer: Berlin/Heidelberg, Germany, 1993; pp. 255–284. [Google Scholar]
  14. Harwatt, H.; Tight, M.; Bristow, A.L.; Gühnemann, A. Personal Carbon Trading and fuel price increases in the transport sector: An exploratory study of public response in the UK. Eur. Transp. 2011, 47, 47–70. [Google Scholar]
  15. Shen, J.; Zhao, C. Carbon trading or carbon tax? A computable general equilibrium–based study of carbon emission reduction policy in China. Front. Energy Res. 2022, 10, 906847. [Google Scholar] [CrossRef]
  16. Zhao, L.; Yang, C.; Su, B.; Zeng, S. Research on a single policy or policy mix in carbon emissions reduction. J. Clean. Prod. 2020, 267, 122030. [Google Scholar] [CrossRef]
  17. Huang, Y.; Xiao, Z.; Wang, D.; Jiang, H.; Wu, D. Exploring individual travel patterns across private car trajectory data. IEEE Trans. Intell. Transp. Syst. 2019, 21, 5036–5050. [Google Scholar] [CrossRef]
  18. Xiao, Z.; Li, F.; Wu, R.; Jiang, H.; Hu, Y.; Ren, J.; Cai, C.; Iyengar, A. TrajData: On vehicle trajectory collection with commodity plug-and-play OBU devices. IEEE Internet Things J. 2020, 7, 9066–9079. [Google Scholar] [CrossRef]
  19. Qin, X.; Liu, Z.; Liu, Y.; Liu, S.; Yang, B.; Yin, L.; Liu, M.; Zheng, W. User OCEAN personality model construction method using a BP neural network. Electronics 2022, 11, 3022. [Google Scholar] [CrossRef]
  20. Havranek, T.; Kokes, O. Income elasticity of gasoline demand: A meta-analysis. Energy Econ. 2015, 47, 77–86. [Google Scholar] [CrossRef] [Green Version]
  21. Chen, W.; Wu, X. Evaluating Effectiveness of Low-Carbon Transition Policy Mix Based on Urban Private Car Trajectory Data. Sci. Program. 2022, 2022, 4702095. [Google Scholar] [CrossRef]
  22. Wang, H.; Chen, Z.; Wu, X.; Nie, X. Can a carbon trading system promote the transformation of a low-carbon economy under the framework of the porter hypothesis?—Empirical analysis based on the PSM-DID method. Energy Policy 2019, 129, 930–938. [Google Scholar] [CrossRef]
  23. Fan, F.; Zhang, X. Transformation effect of resource-based cities based on PSM-DID model: An empirical analysis from China. Environ. Impact Assess. Rev. 2021, 91, 106648. [Google Scholar] [CrossRef]
  24. Vandenabeele, W. The mediating effect of job satisfaction and organizational commitment on self-reported performance: More robust evidence of the PSM—Performance relationship. Int. Rev. Adm. Sci. 2009, 75, 11–34. [Google Scholar] [CrossRef]
  25. Marron, D.B.; Toder, E.J. Tax policy issues in designing a carbon tax. Am. Econ. Rev. 2014, 104, 563–568. [Google Scholar] [CrossRef] [Green Version]
  26. Wang, H.; Li, Y.; Bu, G. How carbon trading policy should be integrated with carbon tax policy—Laboratory evidence from a model of the current state of carbon pricing policy in China. Environ. Sci. Pollut. Res. 2023, 30, 23851–23869. [Google Scholar] [CrossRef]
  27. Regan, D.H. The problem of social cost revisited. J. Law Econ. 1972, 15, 427–437. [Google Scholar] [CrossRef]
  28. Huisingh, D.; Zhang, Z.; Moore, J.C.; Qiao, Q.; Li, Q. Recent advances in carbon emissions reduction: Policies, technologies, monitoring, assessment and modeling. J. Clean. Prod. 2015, 103, 1–12. [Google Scholar] [CrossRef]
  29. Li, A.; Lin, B. Comparing climate policies to reduce carbon emissions in China. Energy Policy 2013, 60, 667–674. [Google Scholar] [CrossRef]
  30. Rogge, K.S.; Reichardt, K. Policy mixes for sustainability transitions: An extended concept and framework for analysis. Res. Policy 2016, 45, 1620–1635. [Google Scholar] [CrossRef]
  31. Ding, S.; Zhang, M.; Song, Y. Exploring China’s carbon emissions peak for different carbon tax scenarios. Energy Policy 2019, 129, 1245–1252. [Google Scholar] [CrossRef]
  32. Rosenbaum, P.R.; Rubin, D.B. The central role of the propensity score in observational studies for causal effects. Biometrika 1983, 70, 41–55. [Google Scholar] [CrossRef]
  33. Faris, W.F.; Rakha, H.A.; Kafafy, R.I.; Idres, M.; Elmoselhy, S. Vehicle fuel consumption and emission modelling: An in-depth literature review. Int. J. Veh. Syst. Model. Test. 2011, 6, 318–395. [Google Scholar] [CrossRef]
  34. Ma, J.; Zhou, S.; Mitchell, G.; Zhang, J. CO2 emission from passenger travel in Guangzhou, China: A small area simulation. Appl. Geogr. 2018, 98, 121–132. [Google Scholar] [CrossRef]
  35. Fan, J.; Zhou, L.; Zhang, Y.; Shao, S.; Ma, M. How does population aging affect household carbon emissions? Evidence from Chinese urban and rural areas. Energy Econ. 2021, 100, 105356. [Google Scholar] [CrossRef]
  36. Ning, X.J.; Zhang, J.P.; Lu, F.X.; Qin, Y.C.; Yang, S.C. Measurement the Low-Carbon Level of Residents’ Daily Travel in Zhengzhou City. In Proceedings of the 21st International Conference on Geoinformatics (Geoinformatics), Kaifeng, China, 20–22 June 2013. [Google Scholar]
  37. Kakouei, A.; Vatani, A.; Bin Idris, A.K. An estimation of traffic related CO2 emissions from motor vehicles in the capital city of, Iran. Iran. J. Environ. Health Sci. Eng. 2012, 9, 5. [Google Scholar] [CrossRef] [Green Version]
  38. Liu, Y.; Cirillo, C. Model System to Evaluate Impacts of Vehicles Purchase Tax and Fuel Tx on Household Greenhouse Gas Emissions. Transp. Res. Rec. 2015, 2503, 51–59. [Google Scholar] [CrossRef] [Green Version]
  39. Xie, F.F.; Li, X.M. A Study of Vehicle Tax Policy Adjustment Based on System Dynamics in the Background of Low-Carbon Transport. In Proceedings of the International Conference on Low-carbon Transportation and Logistics, and Green Buildings (LTLGB), Beijing, China, 12–13 October 2012; pp. 101–109. [Google Scholar]
  40. Chalak, A.; Al-Naghi, H.; Irani, A.; Abou-Zeid, M. Commuters’ behavior towards upgraded bus services in Greater Beirut: Implications for greenhouse gas emissions, social welfare and transport policy. Transp. Res. Part A-Policy Pract. 2016, 88, 265–285. [Google Scholar] [CrossRef]
  41. Tan, X.C.; Zeng, Y.; Gu, B.H.; Tang, J.; Wang, D.; Guo, J.X. Assessment of the macro-economic impacts of low-carbon road transportation policies in Chongqing, China. Adv. Clim. Chang. Res. 2020, 11, 429–441. [Google Scholar] [CrossRef]
  42. Chen, J.L.; Sun, C.Q.; Wang, Y.J.; Liu, J.L.; Zhou, P. Carbon emission reduction policy with privatization in an oligopoly model. Environ. Sci. Pollut. Res. 2023, 30, 45209–45230. [Google Scholar] [CrossRef]
  43. Sun, H.; Yang, J. Optimal decisions for competitive manufacturers under carbon tax and cap-and-trade policies. Comput. Ind. Eng. 2021, 156, 107244. [Google Scholar] [CrossRef]
  44. Yang, W.; Li, T.; Cao, X. Examining the impacts of socio-economic factors, urban form and transportation development on CO2 emissions from transportation in China: A panel data analysis of China’s provinces. Habitat Int. 2015, 49, 212–220. [Google Scholar] [CrossRef]
Figure 1. Sensitivity analysis of the number of nodes in the hidden layer.
Energies 16 05839 g001
Figure 2. Nearest neighbor matching common support domain.
Energies 16 05839 g002
Table 1. Recorded trip sample dataset.
Vehicle
ID
Trip Start
Time
Start Point LongitudeStart Point
Latitude
Trip End
Time
End Point
Longitude
End Point
Latitude
Driving
Distance
Fuel
Consumption
Travel Time
5785291 July 2018 10:15120.576
785
29.987
391
1 July 2018
10:30
120.609
898
29.972
251
4731801939
Table 2. Descriptive statistical results of variables.
VariablesSamplesMeanVarianceMinimum Maximum
num4650.50.280.10.9
mix4650.330.4701
lnred4658.131.124.6910.25
lncost4651.801.28−1.294.37
lnbet4658.690.427.759.71
Table 3. Results of balance test.
Matching MethodSamplePseudo-R2LRp ValueMean BiasStandardization Bias
Unmatched0.13680.480.00015.9083.9
Nearest neighbor matching Matched0.0041.7700.8805.30015.30
Radius matching Matched0.0041.670.8937.914.8
Kernel matching Matched0.0010.380.9962.47
Table 4. The impact of environmental policy mix.
Outcome VariableSampleTreatControlATTStandard ErrorT Value
lnbetUnmatched8.8898.5890.3000.0397.78 *
Nearest neighbor matching8.8938.5690.3240.0645.05 *
Radius matching8.8938.5580.3350.0418.11 *
Kernel matching8.8938.5460.3470.0408.67 *
lnredUnmatched8.8067.7891.0160.09910.22 *
Nearest neighbor matching8.7948.2740.5200.1363.82 *
Radius matching8.7948.2790.5150.1015.12 *
Kernel matching8.7948.2510.5430.0985.56 *
Note: * stand for 1% significance level test.
Table 5. Bootstrap sampling results.
Outcome VariableSampleATTStandard ErrorZ Valuep Value
lnbetNearest neighbor matching0.324 0.055 5.930.000
Radius matching0.335 0.043 7.830.000
Kernel matching0.347 0.040 8.650.000
lnredNearest neighbor matching0.520 0.116 4.480.000
Radius matching0.515 0.086 6.000.000
Kernel matching0.543 0.078 6.960.000
Table 6. Remeasurement results of carbon emissions from private cars.
Outcome VariableSampleTreatControlATTStandard ErrorT Value
lnbetUnmatched19.140 13.788 5.352 0.431 12.41 *
Nearest neighbor matching19.140 17.459 1.681 0.450 3.73 *
Radius matching19.140 17.604 1.536 0.341 4.51 *
Kernel matching19.140 17.423 1.717 0.341 5.04 *
lnredUnmatched11.001 10.211 0.790 0.128 6.17 *
Nearest neighbor matching11.001 10.435 0.566 0.175 3.23 *
Radius matching11.001 10.631 0.370 0.139 2.67 *
Kernel matching11.001 10.597 0.404 0.138 2.92 *
Note: * stand for 1% significance level test.
Table 7. Tobit model regression results.
(1)(2)
Variablelnbetlnred
mix2.644 *0.741 *
(0.331)(0.136)
num5.169 *−0.712 *
(0.565)(0.232)
lncost−1.951 *−0.0352
(0.0916)(0.0376)
var(e.lnbet)9.680 *
(0.635)
var(e.lnred) 1.631 *
(0.107)
Constant34.15 *10.98 *
(1.005)(0.412)
Observations465465
Note: * stand for 1% significance level test.
Table 8. Results of regional heterogeneity analysis.
RegionOutcome VariableSampleTreatControlATTStandard ErrorT Value
EastlnbetUnmatched9.1608.8830.2780.0634.44 *
Nearest neighbor matching9.1658.7140.4500.0835.41 *
Radius matching9.1908.6680.5220.0935.59 *
Kernel matching9.1658.7350.4290.0735.87 *
lnredUnmatched9.1558.1391.0160.1646.21 *
Nearest neighbor matching9.1688.3980.7700.2732.82 *
Radius matching9.1438.3130.8300.2113.94 *
Kernel matching9.1688.2700.8970.1635.49 *
CenterlnbetUnmatched8.7848.4770.3080.0545.65 *
Nearest neighbor matching8.7728.4100.3620.0794.6 *
Radius matching8.7858.4210.3640.0804.56 *
Kernel matching8.7728.5020.2700.0644.25 *
lnredUnmatched8.8247.8081.0160.1845.51 *
Nearest neighbor matching8.7338.6250.1080.1690.64
Radius matching8.5938.681−0.0890.152−0.58
Kernel matching8.7338.6710.0620.1420.44
WestlnbetUnmatched8.7118.3940.3170.0496.44 *
Nearest neighbor matching8.7138.5160.1960.0702.8 *
Radius matching8.7198.4550.2640.0554.78 *
Kernel matching8.7138.4090.3040.0506.09 *
lnredUnmatched8.4747.4571.0160.1536.66 *
Nearest neighbor matching8.4578.3000.1580.1610.98
Radius matching8.4748.2280.2460.1371.8
Kernel matching8.4578.1600.2970.1421.9
Note: * stand for 1% significance level test.
Disclaimer/Publisher’s Note: The statements, opinions and data contained in all publications are solely those of the individual author(s) and contributor(s) and not of MDPI and/or the editor(s). MDPI and/or the editor(s) disclaim responsibility for any injury to people or property resulting from any ideas, methods, instructions or products referred to in the content.

