Article

Elimination of the Ion–Molecule Association in Electrospray High-Resolution Mass Spectrometry Analyses for Petroleum Fractions

1
State Key Laboratory of Heavy Oil Processing, Petroleum Molecular Engineering Center (PMEC), China University of Petroleum, Beijing 102249, China
2
College of Science, China University of Petroleum, Beijing 102249, China
*
Author to whom correspondence should be addressed.
Energies 2023, 16(9), 3796; https://doi.org/10.3390/en16093796
Submission received: 9 March 2023 / Revised: 12 April 2023 / Accepted: 24 April 2023 / Published: 28 April 2023
(This article belongs to the Special Issue Petroleum Chemistry and Processing)

Abstract

:
Electrospray ionization (ESI) coupled with high-resolution mass spectrometry (HRMS) is rapidly developing into a powerful tool for the molecular characterization of petroleum fractions. However, the occurrence of ion–molecule aggregates seriously affects the interpretation of the mass spectrometry results. Ion–molecule aggregates are not inherent compounds in petroleum but they are produced during the analysis of petroleum samples by high-resolution mass spectrometry. Also, the classes of aggregates are the same as many compounds in petroleum. Therefore, the removal of these species is crucial, and their analysis from methods of dissociation and mechanism points of view is essential for this purpose. In this study, aggregates of a vacuum gas oil fraction were analyzed and the types were defined. The compositions of the aggregates were characterized by changing operating conditions. Several factors affecting the aggregates were evaluated by a parameter of dissociation efficiency. By establishing the operating methods, the residual content of the aggregates can be controlled by less than 1% of the total ions. The results are instructive for the molecular characterization of petroleum fractions by using mass spectrometry with ESI ionization.

1. Introduction

Electrospray ionization (ESI) is the most common ion source due to its simple structure, easy operation and low price. It is widely used to characterize petroleum fractions and it is particularly suitable for the analysis of polar compounds in petroleum [1,2,3,4]. ESI is a real “soft” ionization without any fragment ions [5,6]. It is different from other ion sources such as atmospheric pressure chemical ionization (APCI) and atmospheric pressure photoionization (APPI), refs. [7,8,9] which just produces quasi-molecular ions and decreases the requirement of mass resolution for the MS [10]. It is easy to form a stable ion flow to enlarge the dynamic range detection of the MS [11]. Most importantly, the good selectivity of ESI for polar compounds allows it to directly analyze target compounds in complex matrices [12]. The mechanism of electrospray ionization can influence the sample behavior. In this method, sample solution flows from a capillary tube with a nebulizing gas sleeve and forms electrically charged mist micro-droplets under the action of an electric field and nebulizing gas. The droplets are broken and the solvent evaporates to form ions that enter the mass spectrometer for analysis. The charged droplets ejected from the electrospray continue to evaporate solvent under the action of the drying gas, the droplets keep shrinking and their surface charge density keeps increasing. Until the Coulomb force between the charges is equal to the surface tension, the small droplet approaches the Rayleigh limit. As the solvent continues to evaporate, the surface electrostatic force of the droplet exceeds the surface tension and a Coulomb explosion occurs, producing smaller charged droplets. This process is repeated several times until the final sample ion is formed [13,14,15].
In recent years, ESI-HRMS has been increasingly explored as a way to characterize polar compounds in petroleum systems. It has been demonstrated that acid oxides can be selectively ionized and detected by it under a negative ion condition. The National High Magnetic Field Lab has obtained a series of amazing results with Fourier transform ion cyclotron resonance mass spectrometry (FT-ICR MS) for naphthenic acids [16,17]. Hughey et al. [18] demonstrated that the composition of naphthenic acids can reveal the complex history of surface contamination. Qian et al. [3] have determined detailed elemental compositions of acids by accurate negative-ion ESI-HRMS mass measurements. Almost 3000 chemical formulas containing O2, O3, O4, O2S, O3S and O4S have been identified. The biodegradation effect on naphthenic acid composition was validated by Shi [19]. Basic and neutral nitrogen-containing compounds can be detected selectively under positive-ion and negative-ion ESI, respectively, even though they are present at very low concentrations [3,4]. Neutral nitrogen compounds can indicate the migration [20] and maturation [21] of oil; as a result, geochemists are interested in them. Zhang et al. [22] investigated the distribution of neutral nitrogen compounds. Polar compounds have a significant impact on the processing performance of petroleum and the properties of petroleum products. Quantitative characterization of the molecular composition of petroleum heteroatom compounds is an urgent requirement for the development of molecular engineering-based refining technology. Although the content of polar compounds in petroleum is relatively low, heteroatomic compounds containing nitrogen, oxygen and sulfur have characteristic corrosiveness and are present in unstable forms. They can also cause catalyst deactivation during the process. Furthermore, polar compounds in petroleum may combine to form aggregates during ESI-HRMS analysis.
It is worth noting that aggregates are ion–molecule association products. They could form molecular aggregates due to ionization or the association of free molecules and ions. This shows that the occurrence of aggregates depends on the ionization process. The classes of aggregates overlap with the compounds contained in petroleum and this has widely been considered a concern for a long time. Smith et al. [23] identified multiple classes of aggregates as early as 2006, including O4, S1O4, O3, S1O3, N1O2 and N1S1O2. These types represent the species and number of heteroatoms in aggregates. Qian et al. [24] detected O4 and O6 classes of aggregates using negative-ion ESI MS. The existence of aggregates seriously misleads the molecular composition of petroleum. Especially in the analysis of crude oil by ESI high-resolution mass spectrometry, it is difficult to distinguish the signal from the original analyte and from aggregates. Although the problem of aggregates has always existed, the current reports are basically about the identification of aggregates. There is no systematic summary of the methods of association elimination. Therefore, it is necessary to establish complete methods of association elimination.
The phenomenon of association was undesired because it leads to the widely debated molecular weight distribution (MWD) in petroleum, especially when the analytes have a wide distribution mass range [25,26,27]. Also, aggregates can have a huge negative impact on the quantitative analysis of petroleum samples. Shi’s research group has been working on a quantitative analysis of the molecular composition of petroleum. A semi-quantitative analysis of the molecular compositions of the whole compounds in heavy petroleum fractions was carried out by ESI-HRMS in 2022 [28]. Mase et al. [29] achieved the semi-quantification of the N1 and N2 compound classes in plastic pyrolysis oil. However, aggregates interfere with the above work, seriously affecting the accuracy of the quantitative results. Therefore, it is necessary to establish suitable methods to eliminate aggregates.
ESI is the primary means of analyzing polar compounds. Therefore, it is also the main manner in which aggregates are produced. Kim et al. [30] compared two types of heavy oil from different refinery processes by APPI HRMS. Wang et al. [31] characterized a vacuum gas oil (VGO) and its narrow distillates by APPI HRMS. The presence of aggregates was not found in these works. This does not mean that aggregates will not be produced from other ionization sources. This work needs to be further strengthened in the future.
In this work, a VGO was characterized by negative-ion ESI Orbitrap MS. The classes of aggregates in the VGO produced during ionization were clarified. The equation of DBE for aggregates was optimized. Several factors affecting the aggregates were evaluated from two aspects. Methods of eliminating aggregates were established. The processes of association and dissociation were discussed. Dissociation efficiency can reach more than 90%. Aggregates produced in the analysis process were thoroughly removed. This work provides guidance for the elimination of aggregates which may possibly be produced from other ionization sources. It demonstrates the usefulness and practicality of the ESI-HRMS technique for petroleum.

2. Experimental Section

2.1. Sample and Reagent

Analytical-grade toluene and methanol were obtained from Beijing Chemical Reagents Company, Beijing, China. Since the analytical-grade solvents are not pure enough and contain some impurities, they do not meet the requirements for the use of high-resolution mass spectrometry. Therefore, these solvents were distillated using a B/R 9600 spanning band distillation instrument (B/R Instrument Corporation, Easton, MD, USA) before use. The PPL column was purchased from Agilent Technologies Inc., Santa Clara, CA, USA. Vacuum gas oil (VGO) and the properties of VGO were obtained from the China National Offshore Oil Corporation (CNOOC). Table 1 shows some chemical properties of VGO.

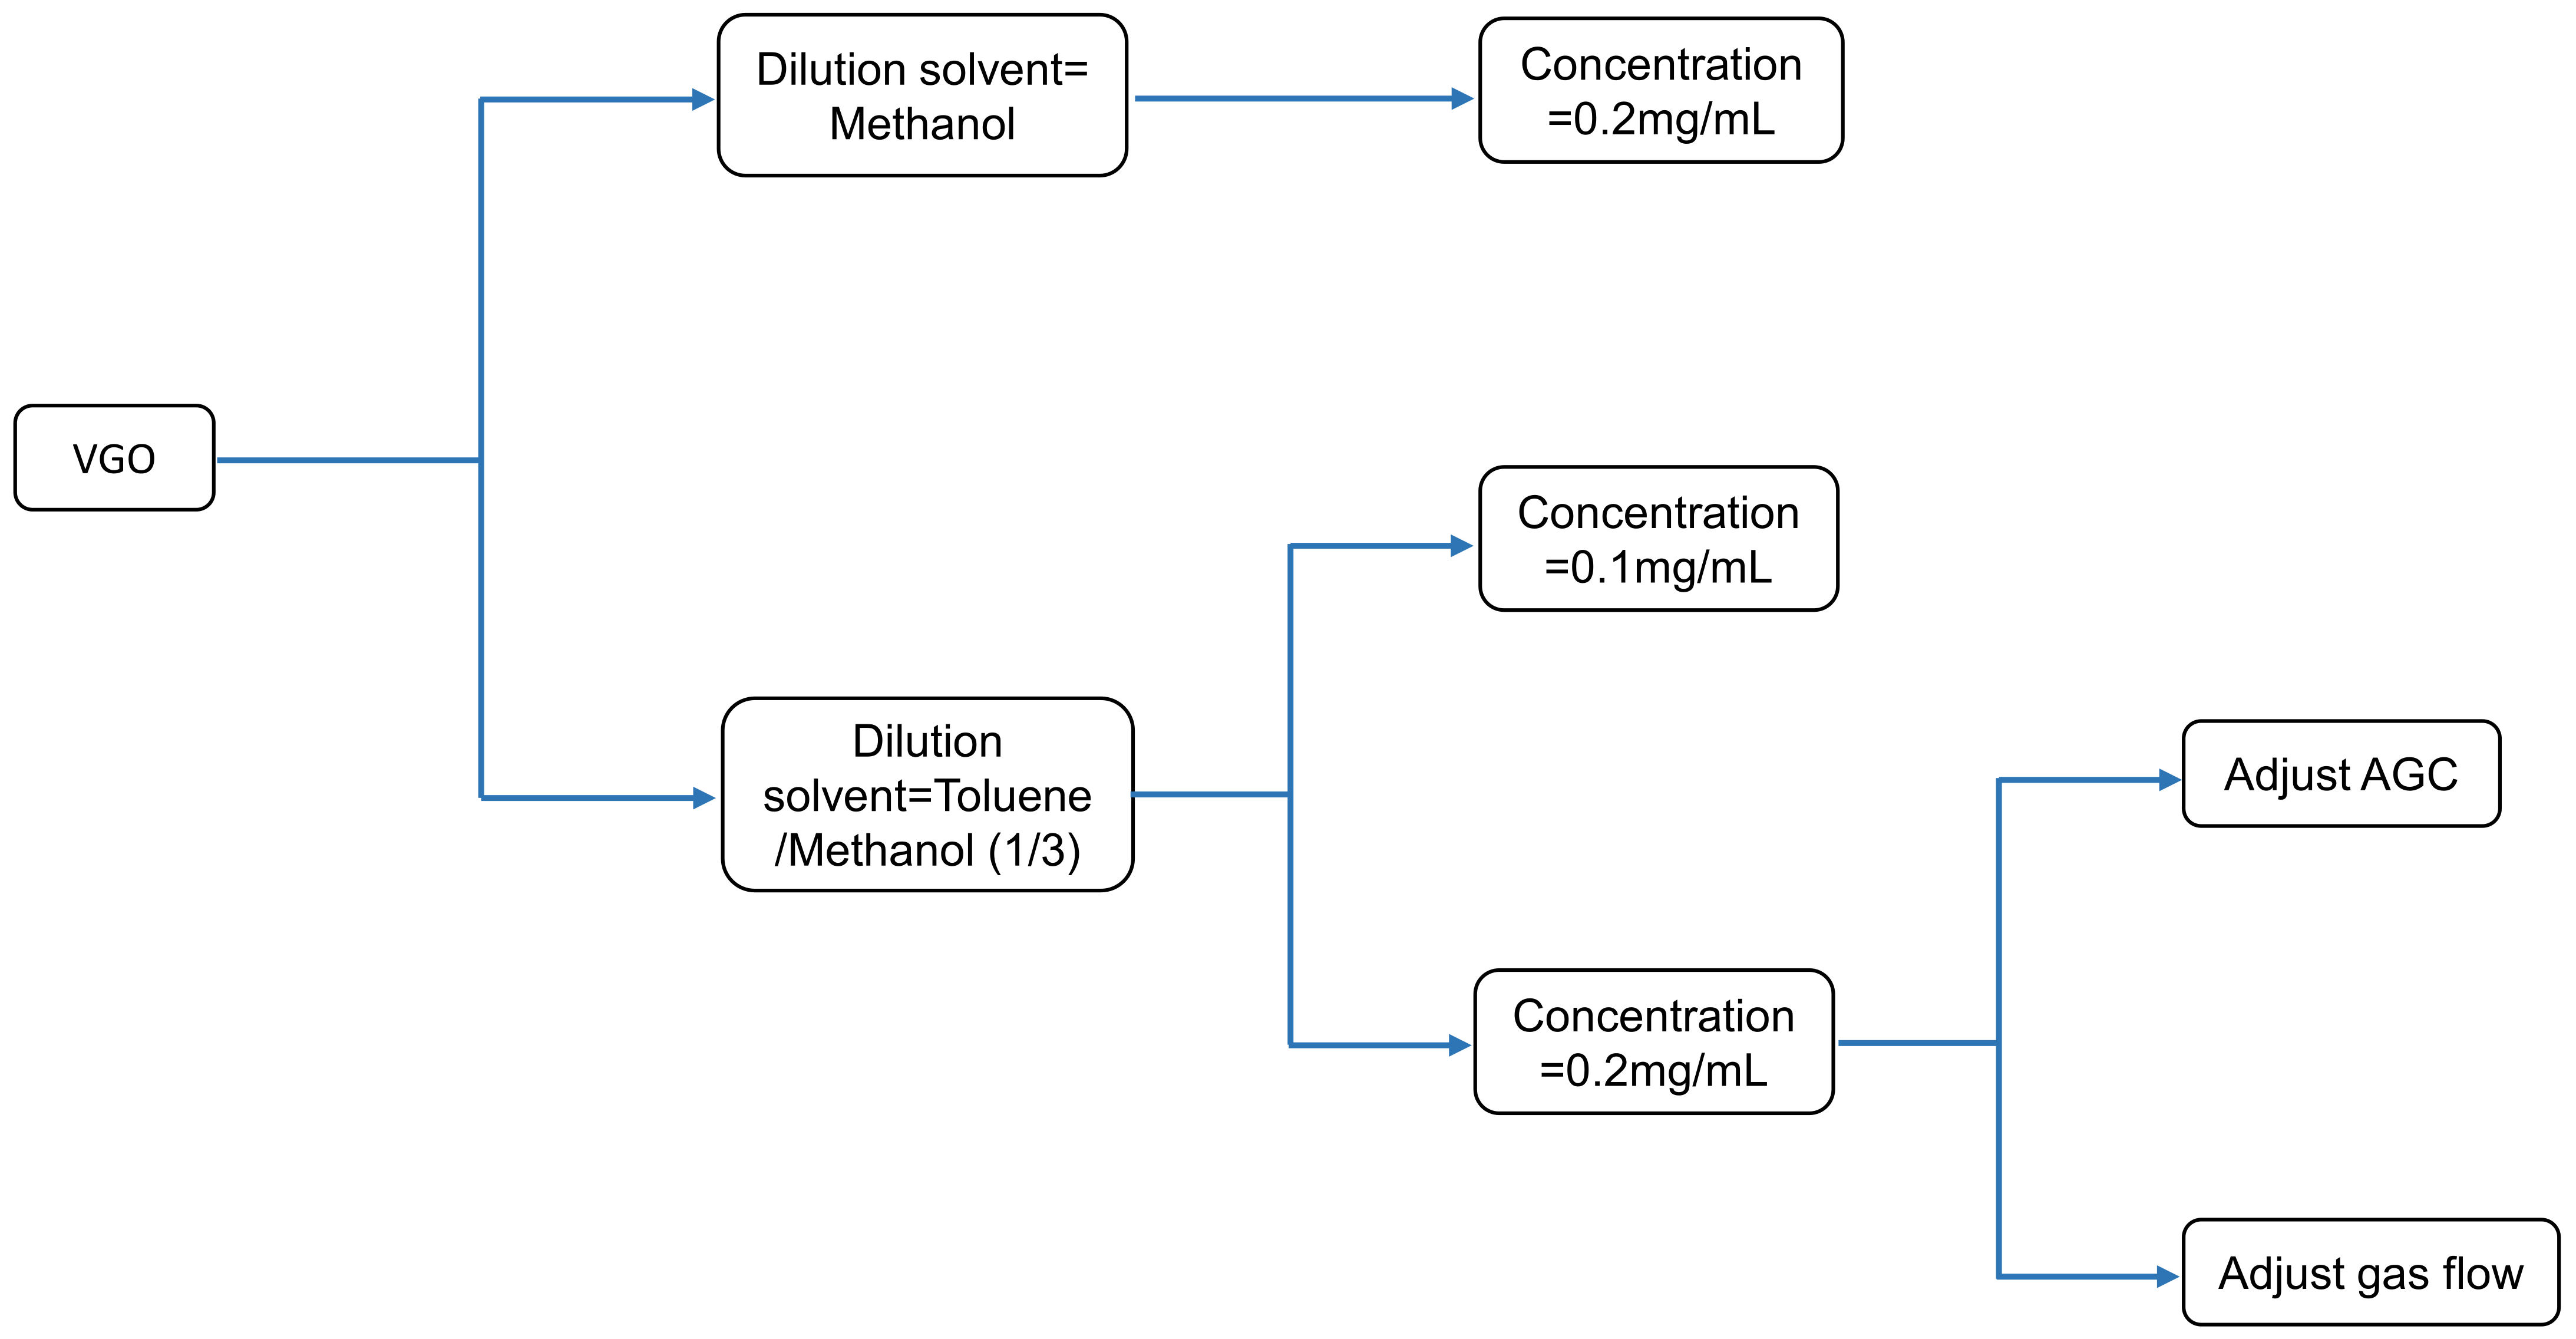
2.2. Sample Preparation and Analytical Workflow

The stock solution of VGO was prepared at a concentration of 10 mg/mL in toluene. For high resolution mass spectrometry, the sample was further diluted to a concentration of 0.2 mg/mL in toluene/methanol (1:3 v/v). According to the above steps, a sample with a concentration of 0.1 mg/mL was prepared by reducing the volume of the VGO stock solution in half. Furthermore, the sample with a concentration of 0.2 mg/mL was prepared with methanol as dilution solvent. An analytical workflow of the ESI-HRMS is shown in the Figure 1.

2.3. ESI Orbitrap MS Analysis

The analytes were characterized by an Orbitrap Fusion MS (Thermo Scientific, Waltham, MA, USA). The ion transfer tube temperature was 300 °C, the detection mass range was m/z 150–800 and the cumulative number of ions in the Ion Trap (AGC) was approximately 5 × 10⁵/1.0 × 106 within a cumulative time of 100 ms. The prepared samples were injected into the ESI through an automatic peristaltic pump at a flow rate of 8 µL/ min. The ESI was running in negative-ion mode. The spray voltages were 2.6 kV, the sheath gas flow rates were 5 and 20 arbitrary units and the auxiliary flow rates were 2 and 10 arbitrary units. The sample injection line was flushed with toluene and toluene/methanol (1:3) in sequence before analysis for each sample.

2.4. Data Processing

The MS data were calibrated and processed using Xcalibur 3.0 and the results were exported to a spreadsheet. Data analysis was performed using custom software which has been described elsewhere [32]. The double bond equivalent (DBE) represents the degree of unsaturation for compounds and it is calculated by the equation:   DBE = n C n H 2 + n N 2 + 1 , where nC is the number of carbon atoms, nH is the number of hydrogen atoms and nN is the number of nitrogen atoms. Specific quantitative information can be obtained through this calculation. Generally, we can use the DBE value to preliminarily determine the types of compounds. The DBE range of compounds in petroleum is generally around 0 to 40. When the DBE value is between 0 and 3, it is generally considered to be aliphatic compounds, while when the DBE is greater than or equal to 4, it is generally considered to be aromatic compounds. There is no clear distinction between good and bad for the difference in DBE values, and it needs to be analyzed according to the actual specific situation.

3. Results and Discussion

3.1. Discussion of Different Association Types

Figure 2 shows the broadband mass spectrum and its mass-scale expand segments. The spectrum shows an overall bimodal distribution, with the high abundance compounds in the mass distribution range of 200–350 Da being the neutral nitrides N1 class and the high abundance compounds in the mass distribution range of 350–500 Da being the acidic oxides O2 class. A distinct mass spectrum peak signal appears in the 550–750 Da distribution range. This phenomenon would affect our understanding of the analyte if it were not a compound contained in the analyte itself.
There is a clear blank area in the mass distribution of the analyte in the range of 500–550 Da, which can be understood to mean that no deprotonated ions are detected in this range. If a high mass distribution is a real presence in the analyte, this is clearly inconsistent with the “petroleum continuum concept” proposed by Boduszynski. This means that the overall molecular composition distribution is continuous in carbon number and DBE value [28,33,34,35,36]. In general, the boiling point of compounds increases with molecular weight. The distillation range of the analyte is 425–450 °C, which means that the boiling points of the various compounds in the analyte itself are approximate and there are essentially no compounds with boiling points above the distillation range. In addition, detection by Orbitrap MS in negative-ion ESI mode is essential for polar compounds in petroleum. The boiling point of polar compounds is higher than that of n-alkanes of the same carbon number. After identification of the analyte, the number of carbon atoms distributed in the high mass distribution is greater than C40 and the boiling point of n-40 is 525 °C [37], which is already well beyond the distillation range. It was therefore concluded that the high mass distribution in the analyte was due to association via the binding of small molecule compounds. Furthermore, this phenomenon is also found in other complex systems, [38] and there is a belief that this is formed by the ionization of large molecular compounds present in the analyte, which is clearly not valid for VGO, as can be seen from the above discussion.
The mass spectrum of 550–750 Da in Figure 1 shows that the aggregates mainly consist of the N1O2 class and the relative abundance of the O4 class is low. Figure 3a shows the relative abundance of N1, O2 class compounds and N1O2, O4 class aggregates in VGO. It can be seen that the relative abundance of the N1O2 class aggregates is five times higher than that of the O4 class, which is consistent with the information given in the mass spectrum in Figure 2. The relative abundance of the N1 class compounds in VGO is greater than that of the O2 class; therefore, whether it is the formation of aggregates between molecules or the binding products of molecules and ions, the N1O2 class has a greater tendency to associate than the O4 class. Previous studies have shown that when the relative abundance of O2 class compounds dominates in the analytes, the main types of aggregates are O4 and O6 classes [24]. The relative abundance of N1 class compounds in VGO was the greatest, showing that concentration is an important factor affecting the formation of aggregates, and also indicating that aggregates are not selective for ionizable molecules. There are many types of aggregates, which are basically the types of compounds inherent in petroleum, and if the analytes have a wide range of molecular weight distributions, it is difficult to distinguish between associations and dissociations. If the aggregates in the analytes are mistakenly treated as real, this can give misleading information about the molecular composition. Taking the N1O2 class aggregate as an example, its formation requires the combined action of N1 and O2 class compounds. As the aggregates gradually form, the ionizable fraction of the N1 and O2 classes are reduced and the abundance of both decreases. If the aggregates are incorrectly treated as N1O2 class compounds, the abundance of N1O2 class compounds will increase in the analytes. It follows that the formation of one type of aggregate will affect many other types of compounds.
Figure 3b and Figure 3c show that the main carbon number distribution range of the N1 class and the DBE is C17-C22 and 9–12, respectively, with the highest relative abundance of benzocarbazoles having a DBE = 12; the main carbon number distribution range of the O2 class is C19-C30 and the DBE is 2–6. Each green dot in them corresponds to the compound peak in the mass spectrum. The summation of the above data shows that the carbon number distribution range of N1 + O2 is C36-C52 with the DBE distribution range of 11–18, which coincides with the carbon number distribution and the DBE distribution range of the upper right region (Part I) in Figure 3d. The lower left circle region (Part II) in Figure 3d corresponds to the N1O2 class contained in the analyte itself, whose relative abundance is low due to the influence of Part I. Figure 3e shows the distribution of the O4 class in the analyte. The circle region shows the O4 class aggregates whose carbon number distribution greater than C35. Their carbon number distribution is centered at C46 and the DBE distribution is centered at 7. It is worth noting that the DBE equation cannot be applied directly to the aggregates. This is because it is only suitable for a single molecule, whereas the nature of aggregates entails multiple molecules, which is not a true single molecule. Calculating the aggregates directly using the DBE equation will result in a unit smaller than the true DBE values of the aggregates [23]. Thus, the formula of DBE values for aggregates is the equation: DBE = n C n H 2 + n N 2 + X , where X is the number of molecules that make up the aggregates. From this equation, it is clear that the DBE distribution center of the O4 class is 8, which is exactly twice as large as the O2 class.
Figure 3f restores the true distribution of the N1O2 class compounds in VGO. There is a clear relative abundance advantage in the region in which the carbon number distribution is C15-C25 and the DBE distribution is 10–13. This phenomenon is not present in Part I. It indicates that the origin of the two parts in Figure 3c is different. A clear relative abundance advantage of benzocarbazoles with DBE = 12 is shown in Figure 3a, but Part I does not show such a feature. This indicates that the N1 class does not associate only with the O2 class specifically, but with all classes. In this way, the absolute advantage of benzocarbazoles can be offset in the formed aggregates of N1O2; that is, the distribution features of aggregates are similar to that of O2 class compounds. It shows that the formation of aggregates involves randomness.

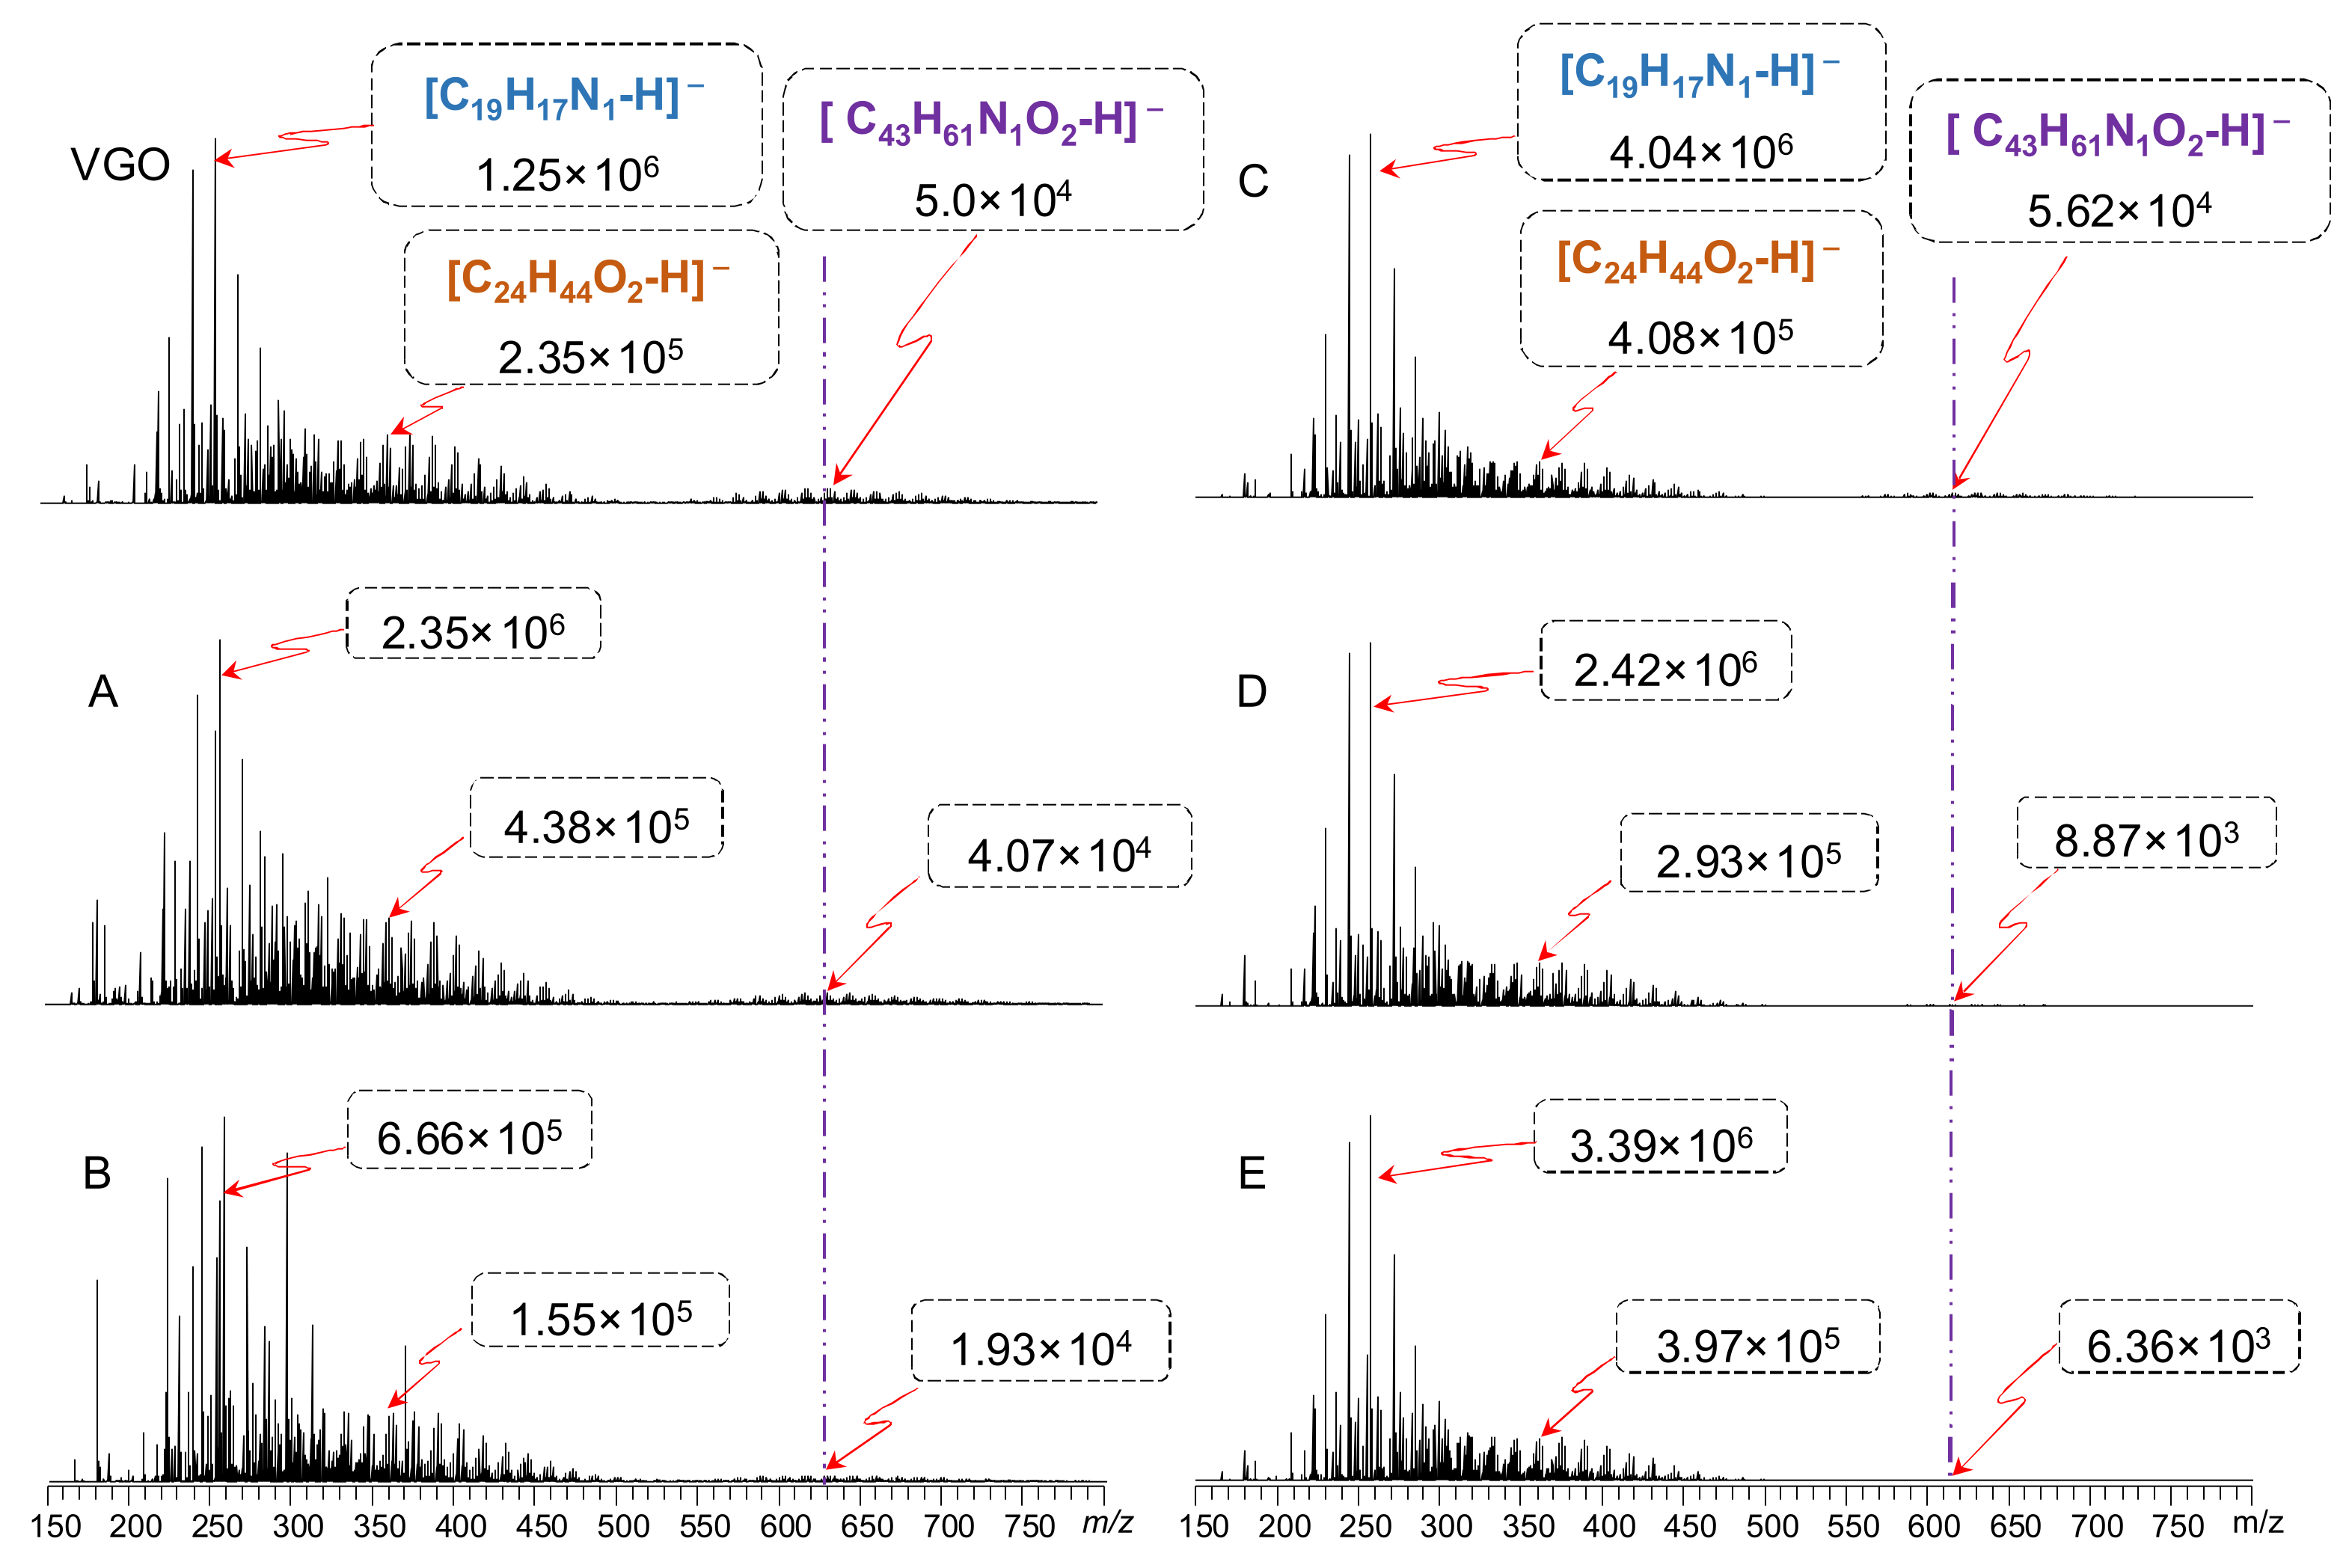
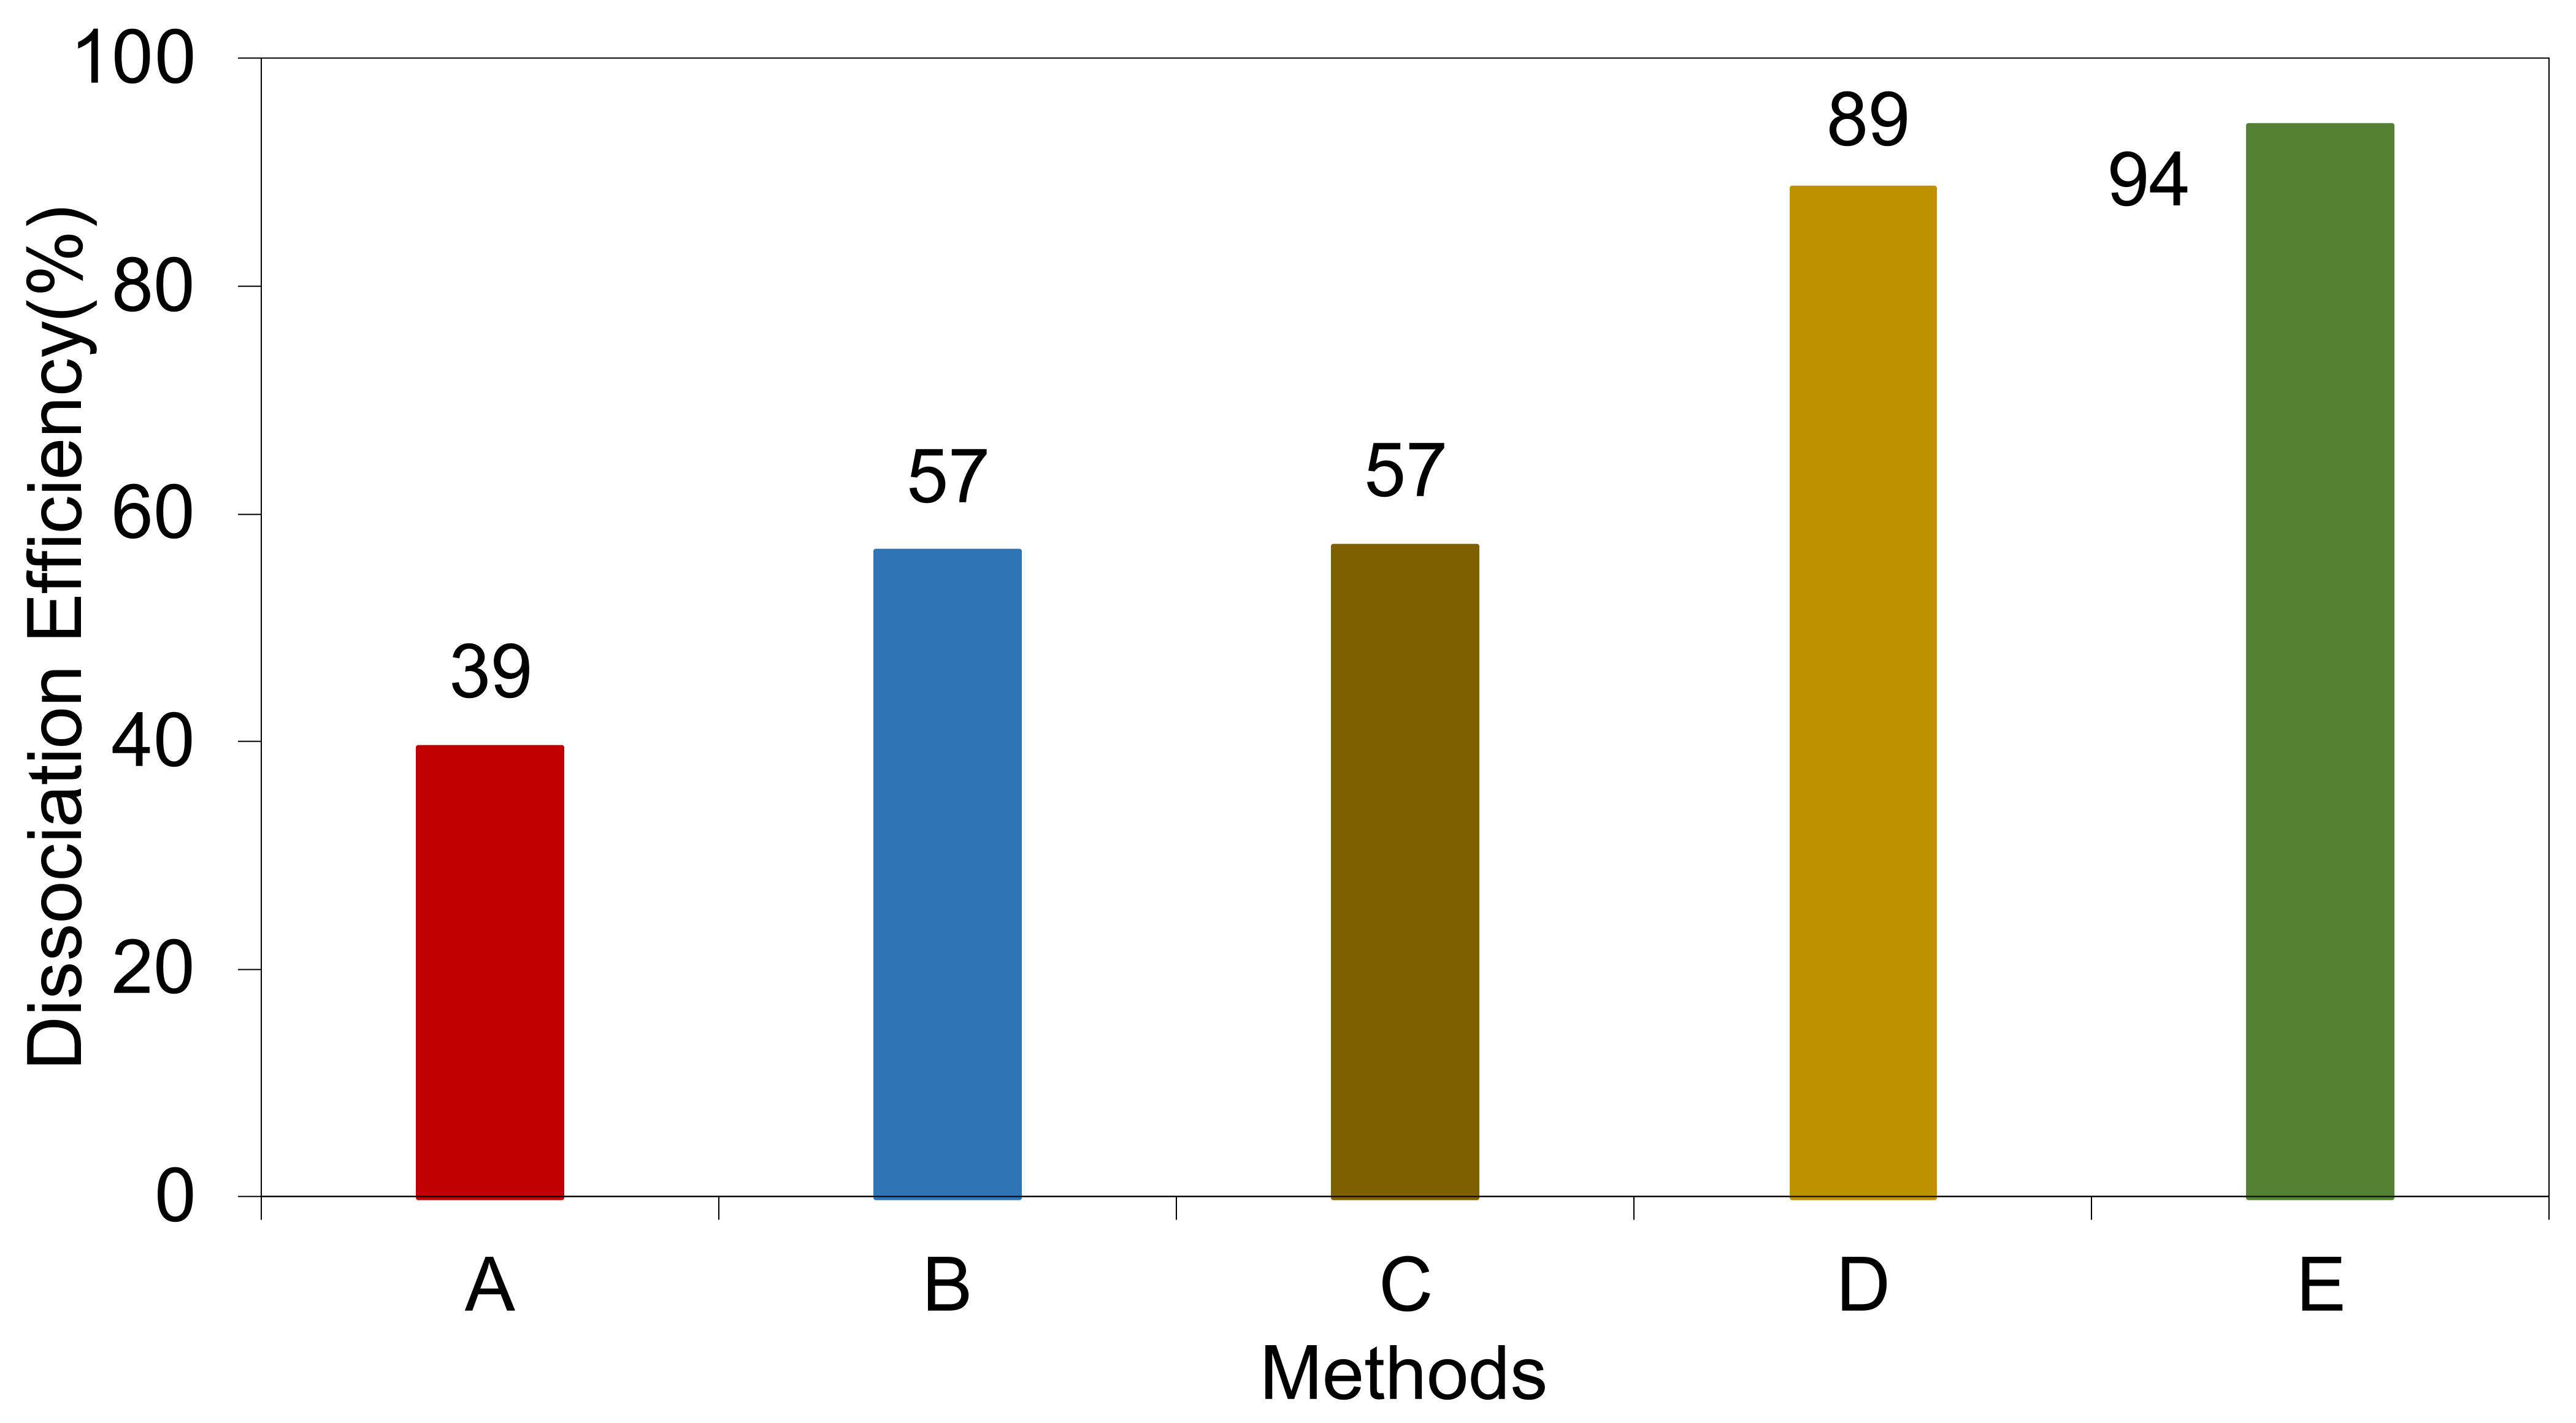
3.2. Methods of Dissociation for VGO

As shown in Table 2, several conditions affecting the aggregates are proposed. Method A increases the proton solvent ratio by replacing the commonly used toluene/methanol (1:3) solvent with a pure methanol solvent, which may increase the ionization efficiency of the analytes. Method B halves the concentration of the analytes by diluting them from the usual 0.2 mg/mL to 0.1 mg/mL, which corresponds to an increase in the proton solvent ratio. Ionization efficiency is increased and the likelihood of aggregation is reduced. Method C increases the gas flow rate, adjusting the sheath gas from 5 arbitrary units to 20 arbitrary units and adjusting the auxiliary gas from 2 arbitrary units to 10 arbitrary units. It can accelerate the volatilization of the solvent during ionization and improve the ionization efficiency of the analytes. Method D increases the value of the AGC, adjusting it from 5 × 10⁵ to 1 × 10⁶, resulting in an increase in the number of ions entering the ion trap. Method E operates both Method C and D simultaneously.
Figure 4 shows the trend of the relative abundance of N1, O2 classes compounds and N1O2 class aggregates. There is an increase in the relative abundance of the O2 class and a decrease in the relative abundance of the N1 class in methods A and B compared to VGO. This is due to the fact that in the negative ESI mode, the ionizing ability of the O2 class is superior to that of the N1 class, and as the proportion of protonated solvents increases, the O2 class continues to ionize preferentially to form deprotonated ions, the N1 class suffers from an increased ionization inhibition effect and more O2 class molecules ionize to form deprotonated ions. Due to the increased ionization efficiency of the analytes, the relative abundance of N1O2 class aggregates decreases accordingly. The significant increase in the relative abundance of the N1 class in Method C indicates that the effect of increasing the gas velocity on the ionization efficiency is more significant compared to that of increasing the proton solvent proportion, which can attenuate the effect of the O2 class on the inhibition of ionization of the N1 class. The relative abundance of the N1 class in Method D showed the same characteristics as Method C, and the relative abundance of the N1O2 class aggregates decreased significantly. However, increasing the value of AGC increases the amount of ion accumulation. It has no effect on ionization. The explanation for this is that during the accumulation process, the ions continue to move irregularly and the greater the number, the greater the chance of collisions between them. The number of aggregates decreases dramatically because they tend to disassociate after collision. This suggests that the formation of aggregates does not occur during ion transport and accumulation, but during ionization and the preceding processes. From the above discussion, it is suggested that N1O2 class aggregates are formed by the association of deprotonated N1 class ions and O2 molecules. Therefore, the increase in the relative abundance of the N1 class in Method D is caused by the increase in the number of N1 class deprotonated ions following the dissociation of N1O2 class aggregates. The relative abundance of aggregates in Method E is less than 1%, which means that compared to the main types of compounds, the residual content of aggregates in the analyte after dissociation is less than 1%. There are also other types of compounds present in the analytes. Therefore, the actual residual content of aggregates in the analytes is much lower.
Figure 5 shows the mass spectra corresponding to the different methods, indicating C19H17N1 and C24H44O2 and the corresponding formation of N1O2 class aggregates. The absolute abundance is shown below the chemical formula. It can be seen that the high-quality distribution in Methods A, B and C still show the existence of relatively obvious aggregate peaks, although the proportion of C42H61N1O2 decreased to a limited extent and the dissociation effect is not obvious. In addition, the method of dissociation by reducing the concentration (B) is not reasonable to some extent. The mass spectra showed that the relative abundance of the impurity peaks increased significantly with decreasing analyte concentrations, which affects the analysis of the analytes. The presence of the aggregate peaks is basically invisible in Methods D and E. The absolute abundance of C19H17N1, C24H44O2 and C42H61N1O2 is 2.42 × 10⁶, 2.93 × 10⁵ and 8.87 × 10³ in Method D. The abundance of C19H17N1 is 273 times higher than that of C42H61N1O2 and this ratio has been further increased in Method E, which is 533 times higher.
Figure 6 shows the dissociation efficiency of different operating methods. The dissociation efficiency is calculated by the equation: DE = I 1 I 2 I i 1 I i 2 / I 1 I 2 , where DE represents the dissociation efficiency, I1 represents the total abundance of all types of compounds in the disassociated fraction of the VGO, I2 represents the total abundance of aggregates in the VGO and i represents the different conditions. We can see that Method A has the worst dissociation effect. Methods B and C have the effect of dissociation to some extent. Their dissociation efficiency is 39% and 57%, respectively. The dissociation efficiency of Method D reached 89%, which indicates that increasing the accumulated amounts of ions is the key to solve the aggregates in VGO. Method E has the highest dissociation efficiency at 94%. This indicates that different types of conditions can be stacked, which can effectively remove the aggregates. In summary, when aggregates are generated in ESI-HRMS, we can refer to the above analysis and selectively change the conditions according to the actual situation to obtain the desired results.

3.3. Discussion of the Mechanism of Association and Dissociation

Based on the above discussion, the elimination of aggregates is mainly done in two ways. The first is controlling the source to reduce the production of aggregates. Increasing the ionization efficiency of the analytes promotes the ionization of neutral molecules and inhibits the formation of aggregates. Method A has a relatively low dissociation efficiency, indicating that simply increasing the proportion of proton solvent will result in a limited improvement in ionization efficiency. Method B improves ionization efficiency by reducing the concentration of the analytes. Concentration is an important factor affecting the formation of aggregates, with higher concentrations giving a greater chance of formation [23]. Compared to B, the ionization efficiency of C is significantly improved but has little effect on the removal of aggregates. Therefore, it is difficult to achieve the desired effect of dissociation by improving ionization efficiency alone. In addition, there are many properties of the compound itself, such as the boiling point and aromaticity, which can affect the aggregate, and intermolecular forces such as π-π bonding and hydrogen bonding can also cause the molecules to associate [39,40,41,42].
The second method involves promoting the fragmentation of aggregates. Dissociation is achieved by increasing the accumulation of ions in the ion trap and increasing the collision probability of the ions. The effect was remarkable, and the presence of aggregate peaks was essentially invisible in the mass spectra. The dissociation efficiency was 89%. Qian et al. also controlled dissociation by changing the cone and extraction voltages [24]. Increasing the accumulation of ions is not related to the ionization efficiency, which acts mainly after the creation of aggregates. It is easy to see by quantitative data analysis that this is a key tool to dissociation.
In summary, aggregates are widespread and deserve attention. Increasing the ionization efficiency of the analytes mainly affects the formation stage of the aggregates; increasing the accumulation of ions mainly demonstrates effects after the formation of the aggregates. Although their dissociation efficiencies are different, they are both crucial pathways to dissociation. This provides ideas for how to completely solve the problem of aggregates in ESI-HRMS from now on.

4. Conclusions

An analysis of the aggregates that appear during the characterization of petroleum by negative-ion ESI Orbitrap MS was carried out. The main type of aggregates formed in VGO are those of the N1O2 class, which is due to the high relative abundance of N1 class compounds. It demonstrates that the formation of aggregates is not selective for ionizable molecules. Whether it is the original molecular aggregate or the ion–molecule binding product, most of them are formed in the ionization source. Several methods were proposed to inhibit the production of aggregates. They work by enhancing the ionization efficiency of analytes, which specifically includes increasing the proportion of proton solvent, reducing the concentration of analytes and increasing the gas flow rate of sheath gas and auxiliary gas. Dissociation mainly occurs during ions transport and accumulation. By increasing the value of AGC to eliminate aggregates, the chance of collision between ions is enhanced. The dissociation efficiency for different methods was evaluated and it can reach up to 94%. The residual content of aggregates in the analyte is less than 1%. This work is currently only applicable for ESI—similar problems that may occur in other ionization sources have not been studied. Future research will continue in this direction. The study described in this paper not only provides ideas for the dissociation of other complex systems, but also lays a foundation for the quantitative analysis of petroleum molecular composition.

Author Contributions

Methodology, J.W.; Investigation, S.L.; Resources, Y.Z.; Data curation, B.Z.; Writing—original draft, Y.W.; Writing—review & editing, Y.Z.; Visualization, Y.W. All authors have read and agreed to the published version of the manuscript.

Funding

This research received no external funding.

Data Availability Statement

Data available on request from the authors.

Conflicts of Interest

The authors declare no conflict of interest.

References

  1. Rodgers, R.P.; Hendrickson, C.L.; Emmett, M.R.; Marshall, A.G.; Greaney, M.; Qian, K. Molecular characterization of petroporphyrins in crude oil by electrospray ionization Fourier transform ion cyclotron resonance mass spectrometry. Can. J. Chem. 2001, 79, 546–551. [Google Scholar] [CrossRef]
  2. Zhan, D.; Fenn, J.B. Electrospray mass spectrometry of fossil fuels11Dedicated to Professor Jim Morrison on the occasion of his 75th birthday. Int. J. Mass Spectrom. 2000, 194, 197–208. [Google Scholar] [CrossRef]
  3. Qian, K.; Robbins, W.K.; Hughey, C.A.; Cooper, H.J.; Rodgers, R.P.; Marshall, A.G. Resolution and Identification of Elemental Compositions for More than 3000 Crude Acids in Heavy Petroleum by Negative-Ion Microelectrospray High-Field Fourier Transform Ion Cyclotron Resonance Mass Spectrometry. Energy Fuels 2001, 15, 1505–1511. [Google Scholar] [CrossRef]
  4. Qian, K.; Rodgers, R.P.; Hendrickson, C.L.; Emmett, M.R.; Marshall, A.G. Reading Chemical Fine Print:  Resolution and Identification of 3000 Nitrogen-Containing Aromatic Compounds from a Single Electrospray Ionization Fourier Transform Ion Cyclotron Resonance Mass Spectrum of Heavy Petroleum Crude Oil. Energy Fuels 2001, 15, 492–498. [Google Scholar] [CrossRef]
  5. Shi, Q.; Zhang, Y.; Chung, K.H.; Zhao, S.; Xu, C. Molecular Characterization of Fossil and Alternative Fuels Using Electrospray Ionization Fourier Transform Ion Cyclotron Resonance Mass Spectrometry: Recent Advances and Perspectives. Energy Fuels 2021, 35, 18019–18055. [Google Scholar] [CrossRef]
  6. Banerjee, S.; Mazumdar, S. Electrospray Ionization Mass Spectrometry: A Technique to Access the Information beyond the Molecular Weight of the Analyte. Int. J. Anal. Chem. 2012, 2012, 282574. [Google Scholar] [CrossRef]
  7. Jin, C.; Viidanoja, J.; Li, M.; Zhang, Y.; Ikonen, E.; Root, A.; Romanczyk, M.; Manheim, J.; Dziekonski, E.; Kenttämaa, H.I. Comparison of Atmospheric Pressure Chemical Ionization and Field Ionization Mass Spectrometry for the Analysis of Large Saturated Hydrocarbons. Anal. Chem. 2016, 88, 10592–10598. [Google Scholar] [CrossRef]
  8. Thomas, M.J.; Chan, H.Y.H.; Palacio Lozano, D.C.; Barrow, M.P. Solvent and Flow Rate Effects on the Observed Compositional Profiles and the Relative Intensities of Radical and Protonated Species in Atmospheric Pressure Photoionization Mass Spectrometry. Anal. Chem. 2022, 94, 4954–4960. [Google Scholar] [CrossRef]
  9. Cho, Y.; Ahmed, A.; Islam, A.; Kim, S. Developments in FT-ICR MS instrumentation, ionization techniques, and data interpretation methods for petroleomics. Mass Spectrom. Rev. 2015, 34, 248–263. [Google Scholar] [CrossRef]
  10. Lu, J.; Zhang, Y.; Shi, Q. Ionizing Aromatic Compounds in Petroleum by Electrospray with HCOONH4 as Ionization Promoter. Anal. Chem. 2016, 88, 3471–3475. [Google Scholar] [CrossRef]
  11. Hughey, C.A.; Hendrickson, C.L.; Rodgers, R.P.; Marshall, A.G. Elemental Composition Analysis of Processed and Unprocessed Diesel Fuel by Electrospray Ionization Fourier Transform Ion Cyclotron Resonance Mass Spectrometry. Energy Fuels 2001, 15, 1186–1193. [Google Scholar] [CrossRef]
  12. Hughey, C.A.; Rodgers, R.P.; Marshall, A.G.; Qian, K.; Robbins, W.K. Identification of acidic NSO compounds in crude oils of different geochemical origins by negative ion electrospray Fourier transform ion cyclotron resonance mass spectrometry. Org. Geochem. 2002, 33, 743–759. [Google Scholar] [CrossRef]
  13. Fenn, J.B.; Mann, M.; Meng, C.K.; Wong, S.F.; Whitehouse, C.M. Electrospray Ionization for Mass Spectrometry of Large Biomolecules. Science 1989, 246, 64–71. [Google Scholar] [CrossRef]
  14. Fenn, J.B.; Mann, M.; Meng, C.K.; Wong, S.F.; Whitehouse, C.M. Electrospray ionization–principles and practice. Mass Spectrom. Rev. 1990, 9, 37–70. [Google Scholar] [CrossRef]
  15. Bruins, A.P. Mechanistic aspects of electrospray ionization. J. Chromatogr. A 1998, 794, 345–357. [Google Scholar] [CrossRef]
  16. Wu, Z.; Jernström, S.; Hughey, C.A.; Rodgers, R.P.; Marshall, A.G. Resolution of 10000 Compositionally Distinct Components in Polar Coal Extracts by Negative-Ion Electrospray Ionization Fourier Transform Ion Cyclotron Resonance Mass Spectrometry. Energy Fuels 2003, 17, 946–953. [Google Scholar] [CrossRef]
  17. Hughey, C.A.; Rodgers, R.P.; Marshall, A.G.; Rodgers, R.P.; Marshall, A.G. Acidic and neutral polar NSO compounds in Smackover oils of different thermal maturity revealed by electrospray high field Fourier transform ion cyclotron resonance mass spectrometry. Org. Geochem. 2004, 35, 863–880. [Google Scholar] [CrossRef]
  18. Hughey, C.A.; Galasso, S.A.; Zumberge, J.E. Detailed compositional comparison of acidic NSO compounds in biodegraded reservoir and surface crude oils by negative ion electrospray Fourier transform ion cyclotron resonance mass spectrometry. Fuel 2007, 86, 758–768. [Google Scholar] [CrossRef]
  19. Shi, Q. Geochemical Characterization of Petroleum Acids in Acidic Crude Oils. Ph.D. Thesis, Beijing, China, 2008. [Google Scholar]
  20. Larter, S.R.; Bowler, B.F.J.; Li, M.; Chen, M.; Brincat, D.; Bennett, B.; Noke, K.; Donohoe, P.; Simmons, D.; Kohnen, M.; et al. Molecular indicators of secondary oil migration distances. Nature 1996, 383, 593–597. [Google Scholar] [CrossRef]
  21. Oldenburg, T.B.P.; Brown, M.; Bennett, B.; Larter, S.R. The impact of thermal maturity level on the composition of crude oils, assessed using ultra-high resolution mass spectrometry. Org. Geochem. 2014, 75, 151–168. [Google Scholar] [CrossRef]
  22. Zhang, Y.; Xu, C.; Shi, Q.; Zhao, S.; Chung, K.H.; Hou, D. Tracking Neutral Nitrogen Compounds in Subfractions of Crude Oil Obtained by Liquid Chromatography Separation Using Negative-Ion Electrospray Ionization Fourier Transform Ion Cyclotron Resonance Mass Spectrometry. Energy Fuels 2010, 24, 6321–6326. [Google Scholar] [CrossRef]
  23. Smith, D.F.; Schaub, T.M.; Rahimi, P.; Teclemariam, A.; Rodgers, R.P.; Marshall, A.G. Self-Association of Organic Acids in Petroleum and Canadian Bitumen Characterized by Low- and High-Resolution Mass Spectrometry. Energy Fuels 2007, 21, 1309–1316. [Google Scholar] [CrossRef]
  24. Qian, K.; Edwards, K.E.; Dechert, G.J.; Jaffe, S.B.; Green, L.A.; Olmstead, W.N. Measurement of Total Acid Number (TAN) and TAN Boiling Point Distribution in Petroleum Products by Electrospray Ionization Mass Spectrometry. Anal. Chem. 2008, 80, 849–855. [Google Scholar] [CrossRef]
  25. Evdokimov, I.N.; Eliseev, N.Y.; Akhmetov, B.R. Initial stages of asphaltene aggregation in dilute crude oil solutions: Studies of viscosity and NMR relaxation. Fuel 2003, 82, 817–823. [Google Scholar] [CrossRef]
  26. Karaca, F.; Behrouzi, M.; Morgan, T.J.; Herod, A.A.; Kandiyoti, R. Effect of Salts on the SEC Profiles of Heavy Hydrocarbon Liquids:  New Approach with Salts Dissolved in Solvents Used for Planar Chromatography. Energy Fuels 2005, 19, 187–199. [Google Scholar] [CrossRef]
  27. Juyal, P.; Merino-Garcia, D.; Andersen, S.I. Effect on Molecular Interactions of Chemical Alteration of Petroleum Asphaltenes. I. Energy Fuels 2005, 19, 1272–1281. [Google Scholar] [CrossRef]
  28. Li, S.; Wu, J.; Wang, Y.; Li, Y.; Zhang, W.; Zhang, Y.; He, K.; Cai, C.; Bian, G.; Wang, H.; et al. Semi-quantitative analysis of molecular composition for petroleum fractions using electrospray ionization high-resolution mass spectrometry. Fuel 2023, 335, 127049. [Google Scholar] [CrossRef]
  29. Mase, C.; Maillard, J.F.; Paupy, B.; Hubert-Roux, M.; Afonso, C.; Giusti, P. Speciation and Semiquantification of Nitrogen-Containing Species in Complex Mixtures: Application to Plastic Pyrolysis Oil. ACS Omega 2022, 7, 19428–19436. [Google Scholar] [CrossRef] [PubMed]
  30. Kim, E.-K.; No, M.-H.; Koh, J.-S.; Kim, S.-W. Compositional characterization of petroleum heavy oils generated from vacuum distillation and catalytic cracking by positive-mode APPI FT-ICR mass spectrometry. Mass Spectrom. Lett. 2011, 2, 41–44. [Google Scholar] [CrossRef]
  31. Wang, W.; Liu, Y.; Liu, Z.; Tian, S. Detailed chemical composition of straight-run vacuum gas oil and its distillates as a function of the atmospheric equivalent boiling point. Energy Fuels 2016, 30, 968–974. [Google Scholar] [CrossRef]
  32. Shi, Q.; Dong, Z.; Zhang, Y.; Zhao, S.; Xu, C. Data processing of high-resolution mass spectra for crude oil and its distillations. J. Instrum. Anal 2008, 27, 246–248. [Google Scholar]
  33. Boduszynski, M.M. Composition of heavy petroleums. 2. Molecular characterization. Energy Fuels 1988, 2, 597–613. [Google Scholar] [CrossRef]
  34. Boduszynski, M.M. Composition of heavy petroleums. 1. Molecular weight, hydrogen deficiency, and heteroatom concentration as a function of atmospheric equivalent boiling point up to 1400.degree.F (760.degree.C). Energy Fuels 1987, 1, 2–11. [Google Scholar] [CrossRef]
  35. Altgelt, K.H.; Boduszynski, M.M. Composition of heavy petroleums. 3. An improved boiling point-molecular weight relation. Energy Fuels 1992, 6, 68–72. [Google Scholar] [CrossRef]
  36. Boduszynski, M.M.; Altgelt, K.H. Composition of heavy petroleums. 4. Significance of the extended atmospheric equivalent boiling point (AEBP) scale. Energy Fuels 1992, 6, 72–76. [Google Scholar] [CrossRef]
  37. Kudchadker, A.P.; Zwolinski, B.J. Vapor Pressure and Boiling Points of Normal Alkanes, C21 to C100. J. Chem. Eng. Data 1966, 11, 253–255. [Google Scholar] [CrossRef]
  38. These, A.; Reemtsma, T. Limitations of Electrospray Ionization of Fulvic and Humic Acids as Visible from Size Exclusion Chromatography with Organic Carbon and Mass Spectrometric Detection. Anal. Chem. 2003, 75, 6275–6281. [Google Scholar] [CrossRef]
  39. Andreatta, G.; Bostrom, N.; Mullins, O.C. High-Q Ultrasonic Determination of the Critical Nanoaggregate Concentration of Asphaltenes and the Critical Micelle Concentration of Standard Surfactants. Langmuir 2005, 21, 2728–2736. [Google Scholar] [CrossRef]
  40. Tanaka, R.; Sato, E.; Hunt, J.E.; Winans, R.E.; Sato, S.; Takanohashi, T. Characterization of Asphaltene Aggregates Using X-ray Diffraction and Small-Angle X-ray Scattering. Energy Fuels 2004, 18, 1118–1125. [Google Scholar] [CrossRef]
  41. Sharma, A.; Groenzin, H.; Tomita, A.; Mullins, O.C. Probing Order in Asphaltenes and Aromatic Ring Systems by HRTEM. Energy Fuels 2002, 16, 490–496. [Google Scholar] [CrossRef]
  42. Andersen, S.I.; Jensen, J.O.; Speight, J.G. X-ray Diffraction of Subfractions of Petroleum Asphaltenes. Energy Fuels 2005, 19, 2371–2377. [Google Scholar] [CrossRef]
Figure 1. Analytical workflow of the ESI-HRMS.
Energies 16 03796 g001
Figure 2. Negative-ion ESI Orbitrap mass spectrum of VGO.
Energies 16 03796 g002
Figure 3. (a) shows the relative abundance of different compound types in VGO; (b,c) are the relative abundance plots of DBE versus carbon number for N1 and O2 classes in VGO; (d,e) are the relative abundance plots of DBE versus carbon number for N1O2 and O4 classes in VGO, which include different types of aggregates; (f) only shows the aggregates of N1O2 class.
Energies 16 03796 g003
Figure 4. Relative abundance trends of different operating methods.
Energies 16 03796 g004
Figure 5. Negative-ion ESI Orbitrap mass spectra of VGO and different operating methods (AE).
Energies 16 03796 g005
Figure 6. Dissociation efficiency of different operating methods.
Energies 16 03796 g006
Table 1. Some chemical properties of VGO.
PropertiesVGO
Density (g/cm3)0.92
Viscosity (mm2/s)60.90
Acid number (mg KOH/g)2.27
Conradson carbon residue (%)<0.05
Table 2. Specific variations of different operating methods.
ReagentConcentration (mg/mL)Sheath Gas (*)Auxiliary Gas (*)AGC
VGOToluene/Methanol(1:3)0.2525 × 105
AMethanol0.2525 × 105
BToluene/Methanol(1:3)0.1525 × 105
CToluene/Methanol(1:3)0.220105 × 105
DToluene/Methanol(1:3)0.2521 × 106
EToluene/Methanol(1:3)0.220101 × 106
(*) represents arbitrary units.
Disclaimer/Publisher’s Note: The statements, opinions and data contained in all publications are solely those of the individual author(s) and contributor(s) and not of MDPI and/or the editor(s). MDPI and/or the editor(s) disclaim responsibility for any injury to people or property resulting from any ideas, methods, instructions or products referred to in the content.

