Article

WT-YOLOX: An Efficient Detection Algorithm for Wind Turbine Blade Damage Based on YOLOX

1
School of Electronic and Electrical Engineering, Shanghai University of Engineering Science, Shanghai 201620, China
2
Shanghai Media Group, Shanghai 200041, China
*
Author to whom correspondence should be addressed.
Energies 2023, 16(9), 3776; https://doi.org/10.3390/en16093776
Submission received: 15 March 2023 / Revised: 26 April 2023 / Accepted: 27 April 2023 / Published: 28 April 2023
(This article belongs to the Special Issue Wind Turbine Structural Control and Health Monitoring)

Abstract

:
Wind turbine blades will suffer various surface damages due to their operating environment and high-speed rotation. Accurate identification in the early stage of damage formation is crucial. The damage detection of wind turbine blades is a primarily manual operation, which has problems such as high cost, low efficiency, intense subjectivity, and high risk. The rise of deep learning provides a new method for detecting wind turbine blade damage. However, in detecting wind turbine blade damage in general network models, there will be an insufficient fusion of multiscale small target features. This paper proposes a lightweight cascaded feature fusion neural network model based on YOLOX. Firstly, the lightweight area of the backbone feature extraction network concerning the RepVGG network structure is enhanced, improving the model’s inference speed. Second, a cascaded feature fusion module is designed to cascade and interactively fuse multilevel features to enhance the small target area features and the model’s feature perception capabilities for multiscale target damage. The focal loss is introduced in the post-processing stage to enhance the network’s ability to learn complex positive sample damages. The detection accuracy of the improved algorithm is increased by 2.95%, the mAP can reach 94.29% in the self-made dataset, and the recall rate and detection speed are slightly improved. The experimental results show that the algorithm can autonomously learn the blade damage features from the wind turbine blade images collected in the actual scene, achieve the automatic detection, location, and classification of wind turbine blade damage, and promote the detection of wind turbine blade damage towards automation, rapidity, and low-cost development.

1. Introduction

As a green renewable energy source, wind energy is crucial to the future of renewable energy production [1]. Wind turbine blades play an important role in capturing wind energy and converting it to electricity. Due to long-term work in a complex terrain environment with many winds, sand, salt spray, and multiple disasters, the blade surface is often damaged by various media [2,3]. After the formation of damage, it will gradually expand over time, affecting the power generation efficiency and even causing safety accidents, such as blade breakage. In order to avoid such incidents, wind farms need to inspect the surface damage to wind turbine blades regularly.
The traditional methods to detect wind turbine blade damage involve manual visual inspections, which are inefficient, inaccurate, and costly [4]. With the rapid development of computer vision technology, new ideas for intelligent industrial damage detection have emerged [5]. Using a deep learning target detection algorithm to detect blade damage earlier in wind turbines allows for improving the detection efficiency and reducing the wind turbines’ maintenance costs, accounting for 25–30% of the total cost of wind energy production [6].
The current mainstream target detection algorithms can be divided into single-stage and two-stage target detection algorithms according to their design principles. The former extracts the feature information of the input image through a feature extraction network and directly completes the location information regression and its category prediction, whereas the latter generates candidate regions and classes them to complete the detection task. Due to its speed and ease of deployment, the single-stage target detection algorithm is more suitable for practical application scenarios.
The single-stage detection algorithm mainly includes the YOLO series, SSD, and FCOS. Among them, the YOLO target detection algorithm has a relatively fast detection speed, light network, and simple structure. It is currently the most widely used single-stage target detection algorithm. Sun et al. proposed the YOLOX algorithm and adopted improvements such as SimOTA and decoupling headers to improve the detection performance significantly. YOLOX includes a variety of models of different sizes. The YOLOX-S model has fewer parameters and is more suitable for application scenarios with high real-time requirements [7]. Based on the existing YOLOX model, Xu et al. introduced the MobileViT module and channel attention (ECA) module to enhance the feature extraction capability of the backbone network output and strengthen the weight of virtual channels to improve the detection accuracy of steel surface damages [8]. Shen et al. proposed a multiple attention-mechanism-enhanced (MAME)-YOLOX by introducing a CBAM attention mechanism [9] in the YOLOX backbone to allow the detection network to focus on saliency information [10]. Tang et al. improved the feature fusion network of YOLOX and proposed a predictive detection head with two residual branches to improve the detection performance of the model [11].
The above detection method can intelligently detect general damages. However, when detecting blade damages with a small size and a large scale of variation in characteristics, the poor fusion of the shallow detail features and the deep high-level semantic features cannot be deeply integrated. Furthermore, the relatively complex algorithm structure and high model training cost make it difficult to migrate and deploy the method to realistic edge network platforms.
We provide an efficient scale-aware damage detection model called WT-YOLOX, based on YOLOX, to address the abovementioned problems. Our main contributions are as follows:
  • Introducing the RepVGG into the backbone of the YOLOX so that it can be re-parameterized to further increase the network feature representation power and balance the model’s speed and accuracy;
  • A cascade feature fusion module is designed to perform a new cascade fusion of the neck’s multiscale input features, thereby enriching the deep semantic information of small targets and increasing feature utilization between the network layers;
  • The focal loss is introduced to increase the network model’s focus on difficult positive samples and its learning capacity.

2. Models and Datasets
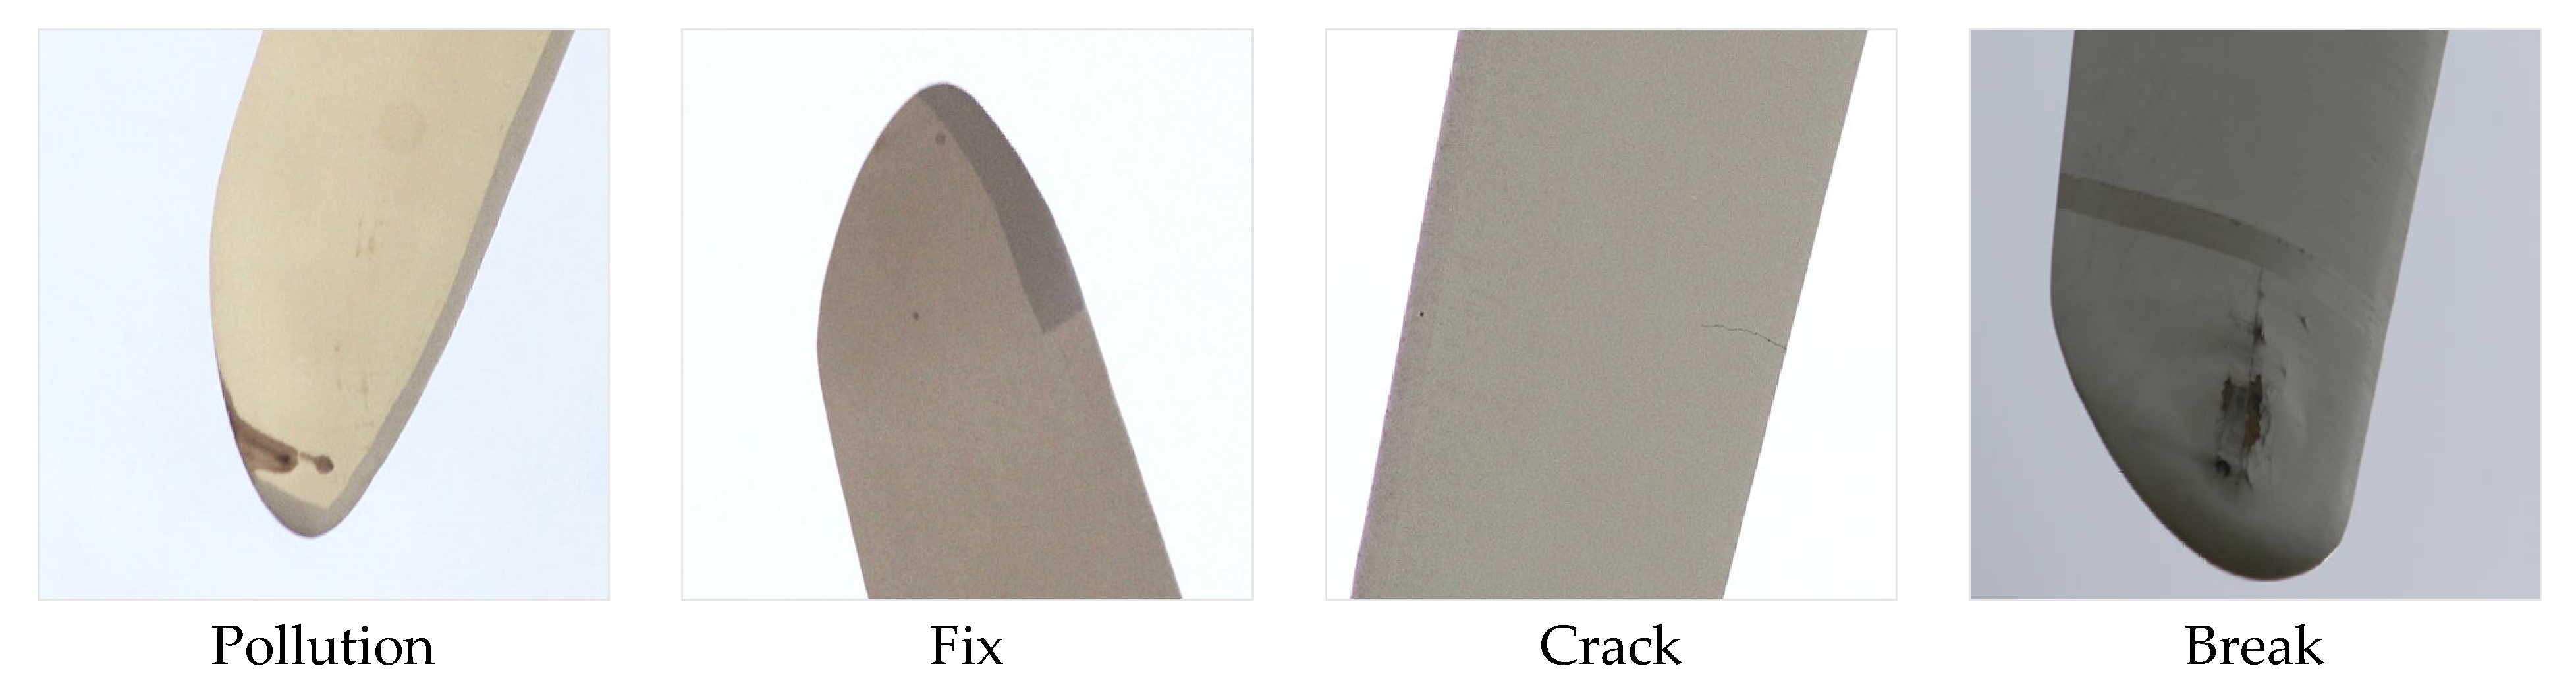
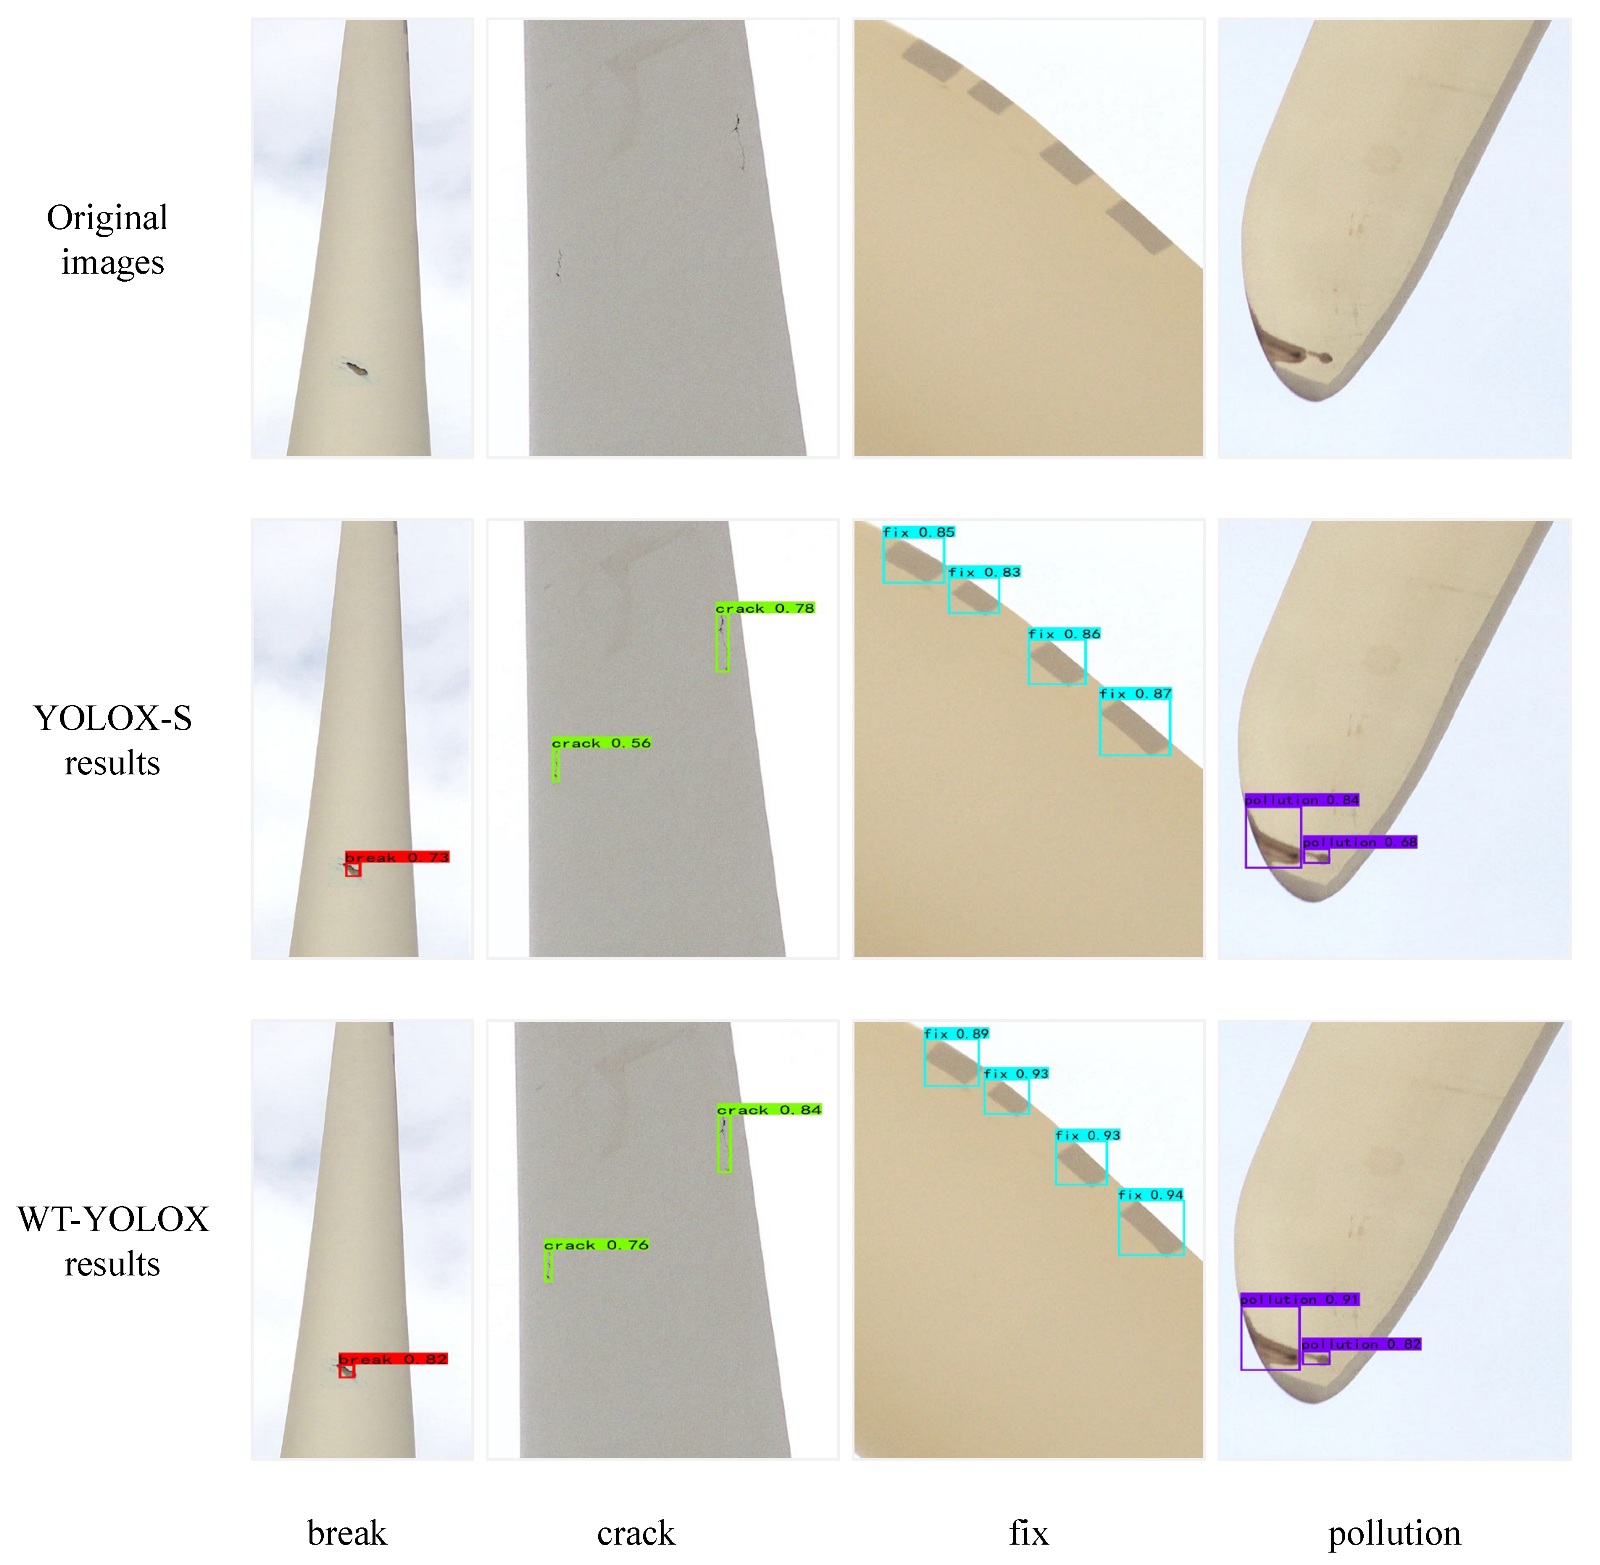
2.1. Dataset

Wind turbine blades work in areas with complex and changeable climates for a long time, and various surface damages that endanger the health of the blades will occur. The following is an introduction to the characteristics and causes of common surface damages to wind turbine blades during their operation:
  • Pollution: The long-term operation of the wind turbine will cause the body oil to flow to the blade’s surface and then volatilize to produce oil and dirt. If oil stains exist on the blade’s surface for a long time, the blade will be more susceptible to erosion by external environmental factors such as wind, sand, and rain, which will cause more severe failures;
  • Fix: In the field data collection process of the wind field, it is found that a large proportion of wind turbine blades have edge repairs, and repaired areas are more prone to damage than unrepaired areas, so they are called potential damage areas;
  • Crack: Cracks are a common surface damage type of wind turbine blades during their operation. The blades will be interacted with by inertial forces during the working process, resulting in vibration. Cracks are generally produced by vibration. The size of the crack is small when it first appears, but after years of wind, sand, rain, and lightning erosion, the size of the crack will further expand. If it cannot be found and repaired in time, it will develop into a fracture under the action of alternating loads;
  • Break: After the fan has been in continuous operation for many years, the protective layer on the surface of the blade may be broken due to wind and sand erosion, air corrosion, and strong ultraviolet radiation, resulting in wear and tear of the coating and further increasing the brittleness of the blade. Continuing to run for a long time is very likely to cause the blade to break.
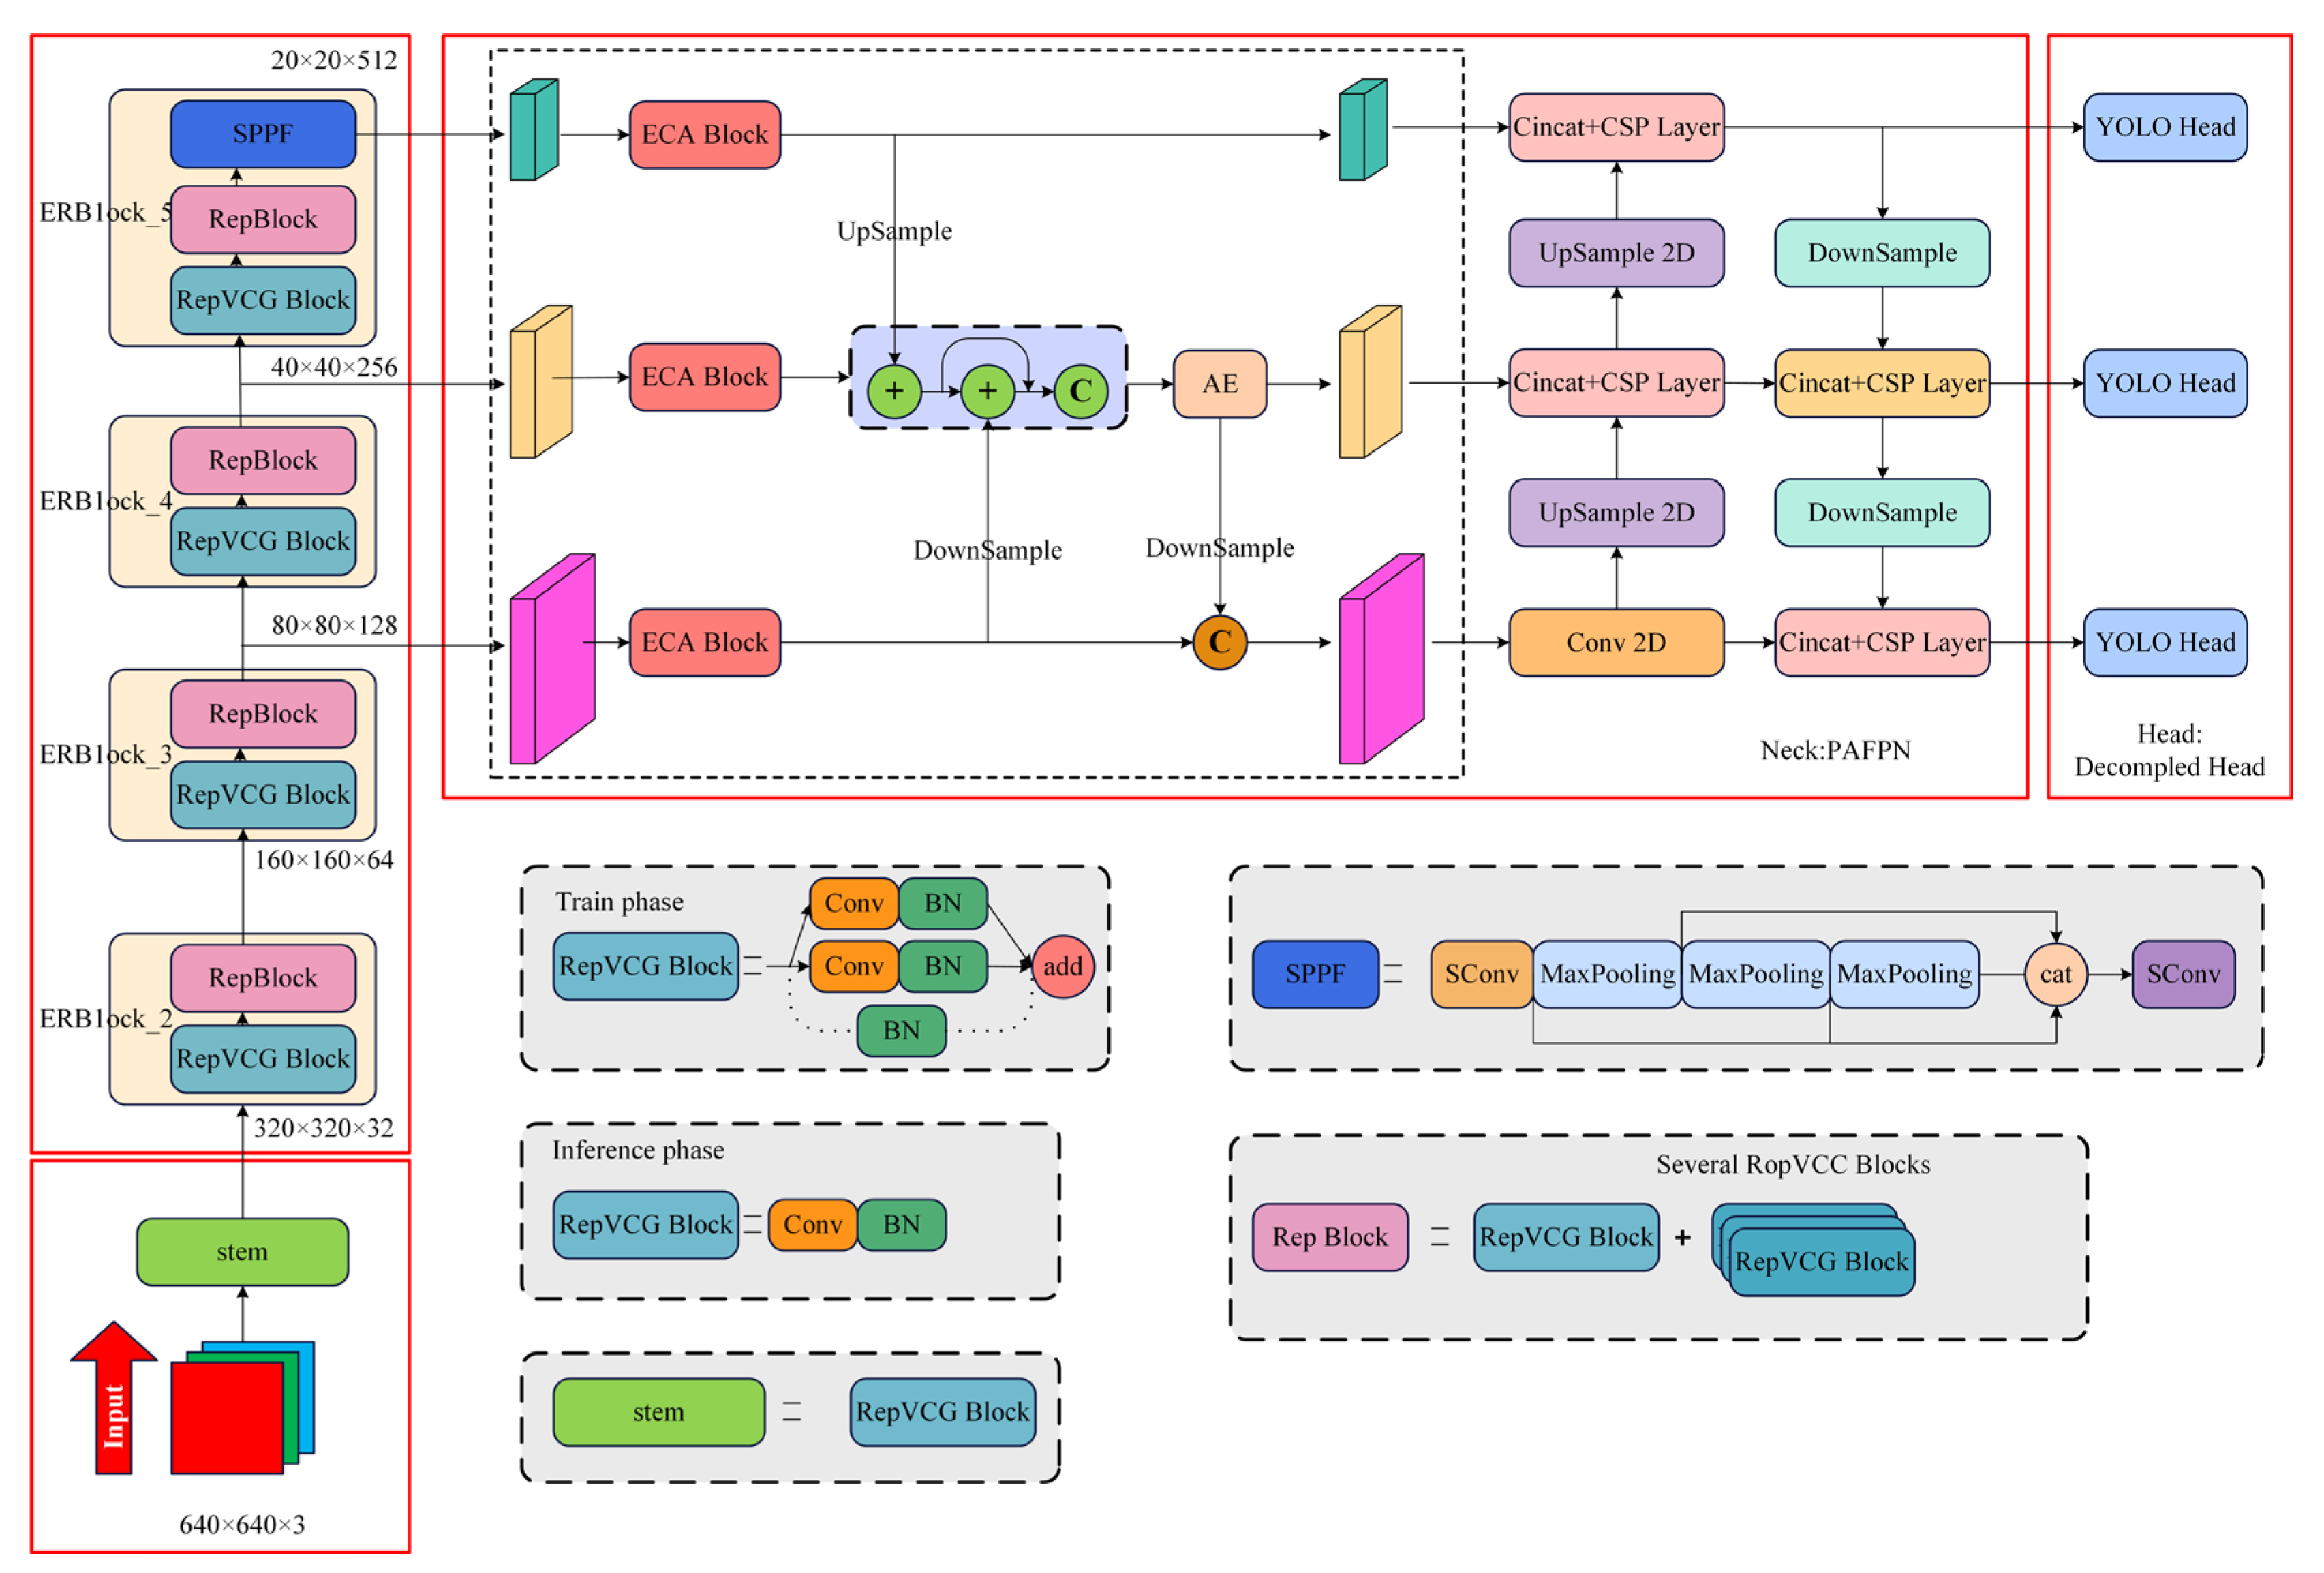
The experimental dataset was collected from a wind farm in Inner Mongolia. It contains a total of 725 color damage images with a resolution of 2560 × 1920. Firstly, the resolution of all sample images was converted to 640 × 640, and the labeling tool LabelImg was used to label and filter the image samples according to the Pascal VOC dataset format, in which there are four types of surface damage—Break, Pollution, Crack, and Fix—before finally generating an annotation file of the xml type for YOLO model training. Furthermore, we used offline data enhancement methods such as contrast, rotation angle, and flip to enrich the wind turbine blade damage data information and increase the enhanced model’s robustness and generalization. After the data enhancement, the sample data in the form of 5800 VOC sets were obtained. Table 1 displays the sample number distribution for the four damage data types and the ratio of 7:2:1 for the training, validation, and test sets, respectively. All of the models used in the experiment were trained on the training set. Sample images of each category in the dataset are shown in Figure 1. To compare the ablation experiments and other existing methods, the validation set was used.

2.2. Network Models

2.2.1. YOLOX Network Model

YOLOX uses the CSPDarknet [12] network to extract the features of the detection targets, and the neck continues the PAFPN [13] path fusion pyramid network structure of YOLOv4 [14] to fuse the model features. To more effectively balance the conflict problem between the classification and regression tasks [15], YOLOX adopts a decoupled head structure, i.e., it first reduces the channel size via convolutional dimensionality reduction, and then independently resolves the classification and regression tasks by using convolutional operations with parallel branches. In addition, YOLO uses Mosaic and MixUp augmentation strategies to enrich the data and directly predict the category information in an anchor-free way. Then, the strategies are combined with the SimOTA dynamic positive-sample label assignment strategy. Compared with other single-stage target detection algorithms, the model parameters are greatly reduced, and the network convergence speed is increased. The overall network structure diagram of YOLOX is shown in Figure 2.

2.2.2. RepVGG Network Model

The RepVGG network consists of two parts: the training phase and the inference phase [16]. Its network structure is shown in Figure 3a,c. In the training phase, parallel 1 × 1 convolutional branches and identity residual mappings are added to each 3 × 3 convolution based on the ResNet [17] multi-branch topology and residual structure to accelerate the convergence of the model, avoid the disappearance of the network gradients, and increase the model’s ability to extract features [18]. In the inference phase, the multi-branch topology in the training phase is equivalent to a single-path approach of fusing the data into a 3 × 3 convolution and ReLU activation function via structural re-parameterization to achieve an enhanced speed and accuracy tradeoff [19]. The process is shown in Figure 3b.
The process of re-referencing the RepVGG model structure is as follows [20]:
  • Parameter fusion of the BN and convolutional layers in the multi-branch residual structure is performed, as shown in Equations (1) and (2):
W i = γ i σ i W i
b i = μ i γ i σ i + β i
where W i denotes the parameters of the convolutional layer before conversion; μ i , σ i , γ i , and β i denote the mean, variance, scale factor, and offset factor of the batch normalization (BN) layer, respectively, and W i and b i denote the weight and bias of the convolution after fusion, respectively;
2.
The identity residual mapping branch equivalent to a 1 × 1 unit convolution is converted to a 3 × 3 unit convolution using a complementary zero-filling operation;
3.
The three branches’ convolution layers and bias correspondences are added together to obtain a 3 × 3 convolution.

2.3. Methods

This section introduces the proposed blade damage detection model WT-YOLOX in detail, including the introduction of its structure and its contribution. The overall network structure diagram of WT-YOLOX is shown in Figure 4. We introduce the proposed improvement strategy based on the YOLOX model.

2.3.1. Backbone Improvements

CSPDarknet uses a multi-branch parallel network structure design in which neuron node gradients are repeatedly calculated during backpropagation, which reduces the model’s inference speed and feature-learning capability. Based on the excellent characteristics exhibited by the RepVGG network, we optimized the YOLOX feature extraction network—denoted as SimRepVGG—to enhance the ability of the model to learn small target damages to meet the demand for high accuracy and speed when detecting wind turbine blade damages.
In the training phase, the primary component of SimRepVGG is the RepBlock [20], whose structure is shown in Figure 5a. Each RepBlock consists of several RepVGG blocks with a 3 × 3 convolution, parallel 1 × 1 convolution branches, and identical residual mapping. In the inference stage, each RepBlock is transformed into a RepConv layer (Conv 3 × 3) with a ReLU activation function, as depicted in Figure 5b. ReLU has a lower computational model complexity than the Mish activation function used by CSPDarknet. The enhanced SimRepVGG network, depicted in Figure 5c, increases the capacity of the backbone network to extract target features and accounts for the model detection speed, thereby facilitating the deployment of edge device models.

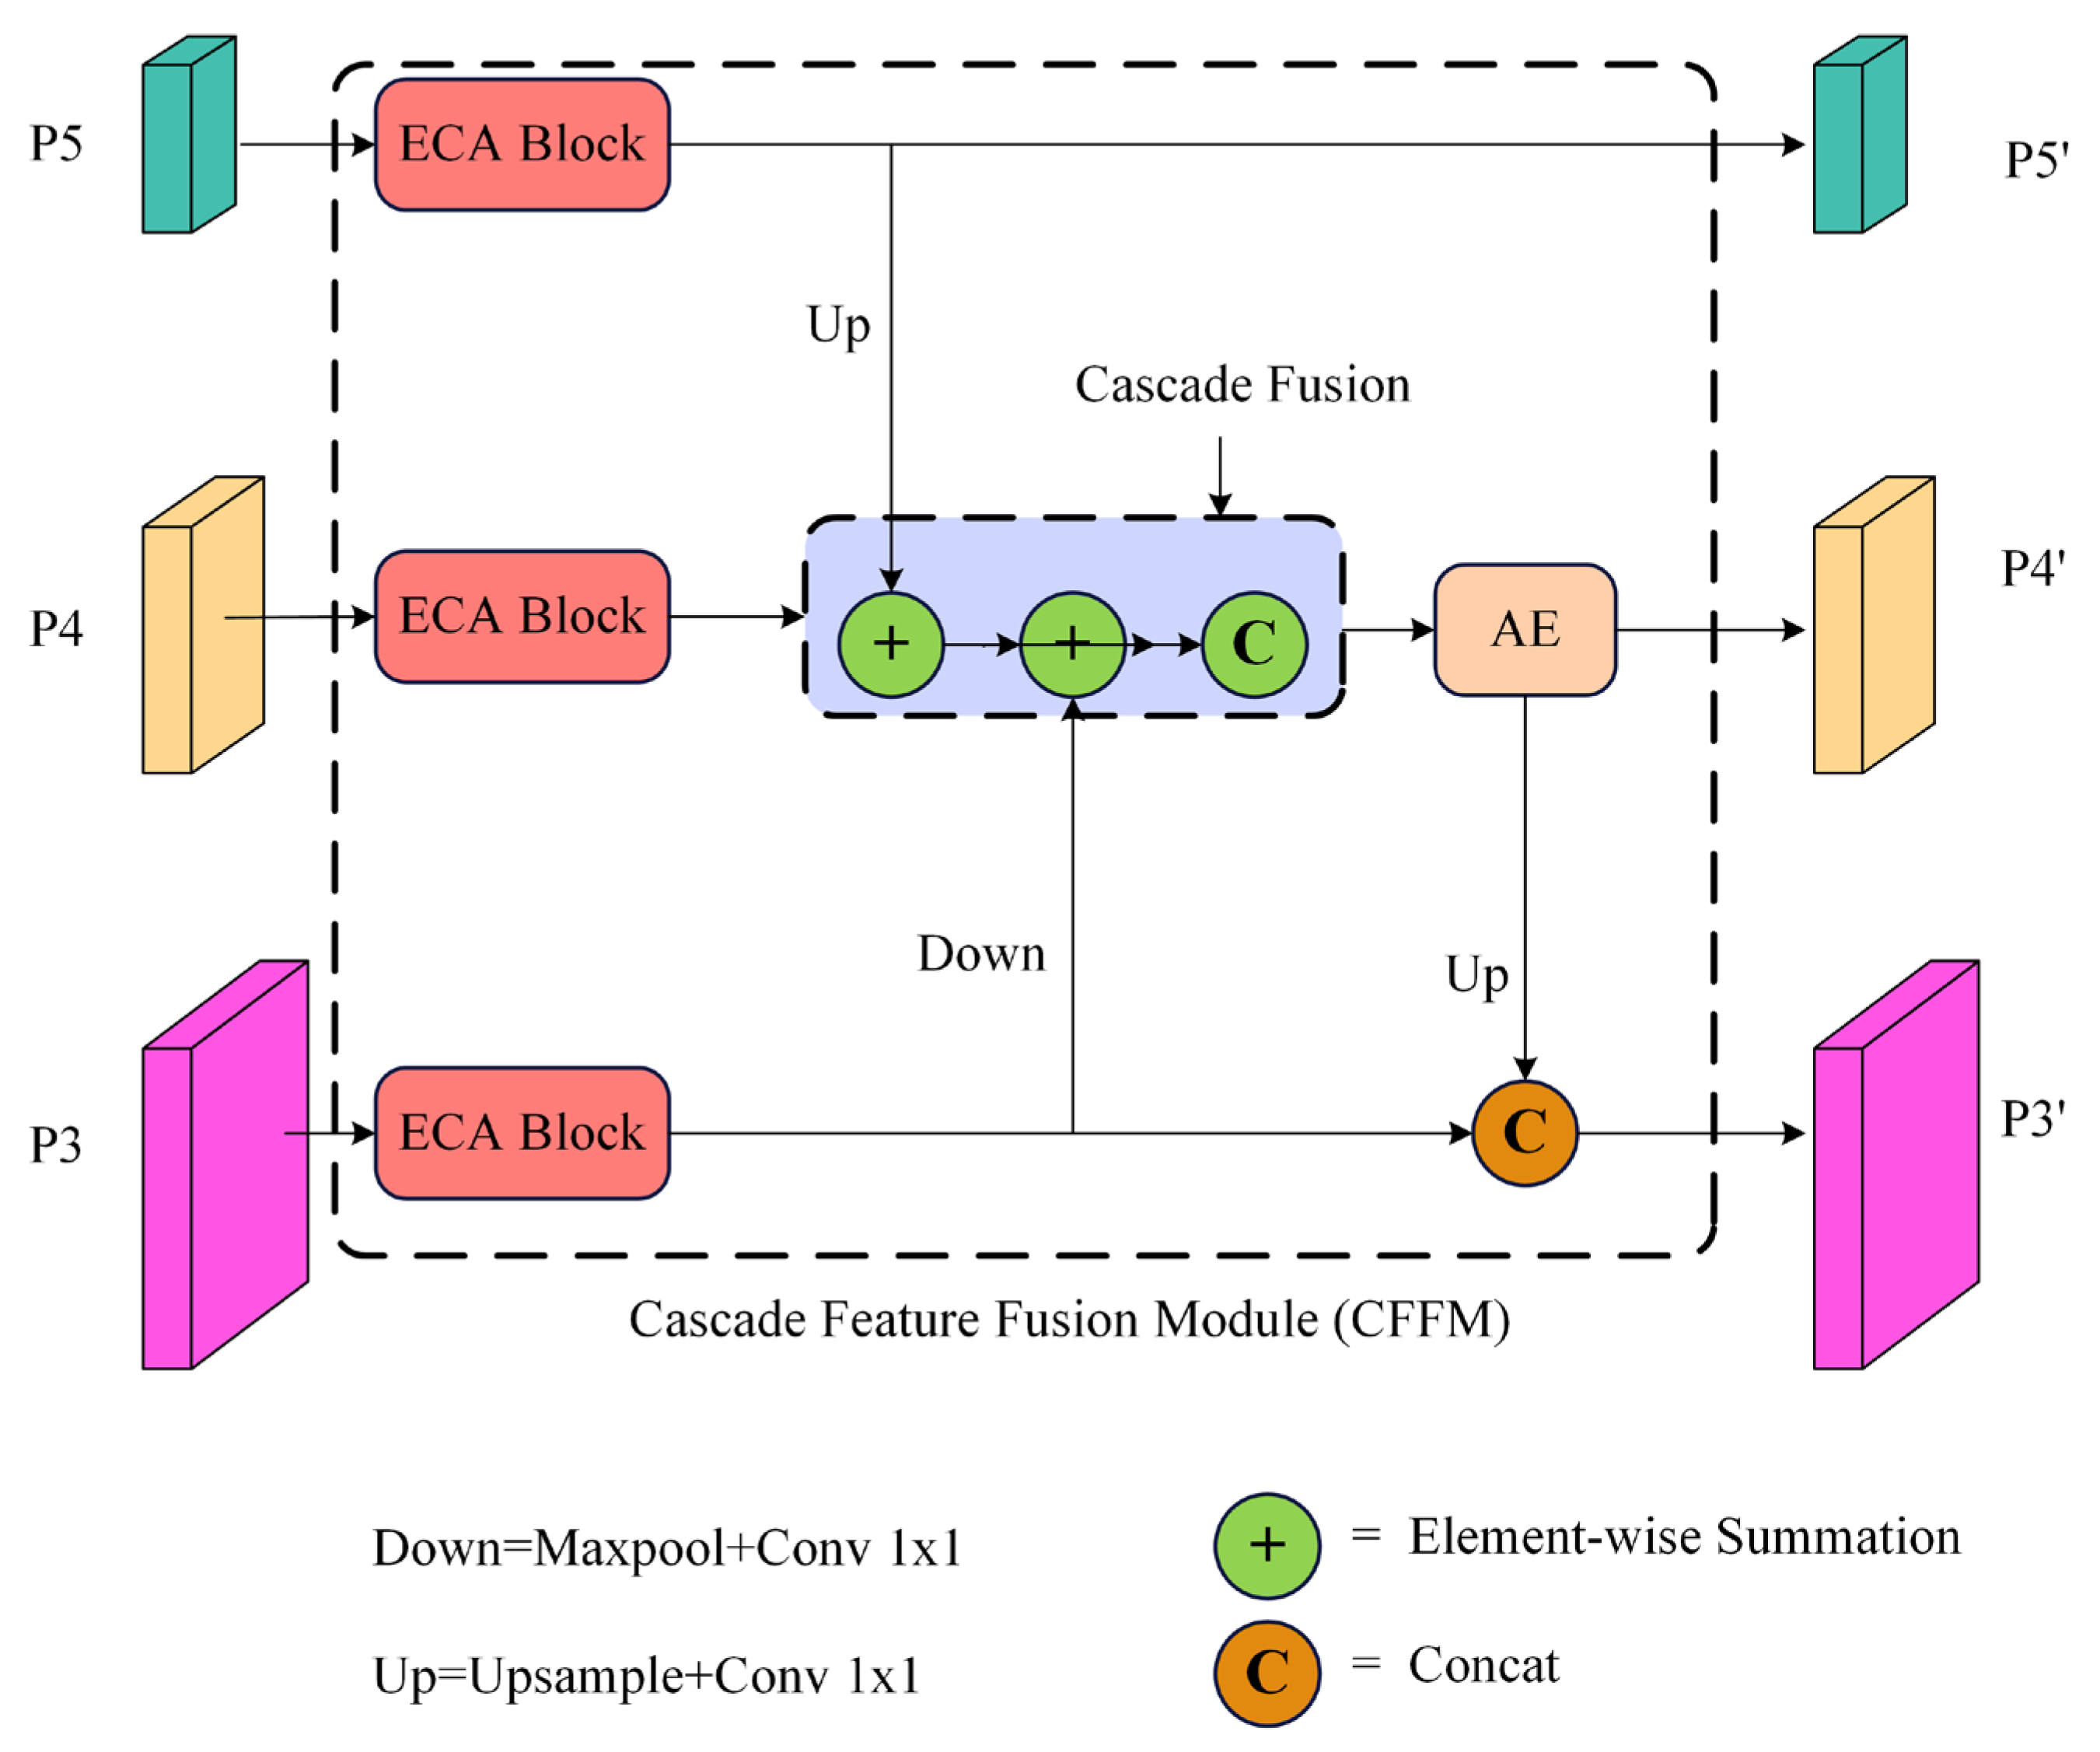
2.3.2. Neck Improvements

In the wind turbine blade damage detection task, there exist certain blade damage features that are broadly similar, with only slight differences in the details. As the depth of the network continues to increase, the semantic information contained in the feature map continues to accumulate, while the shallow representational information fades. The YOLOX-S network uses the shallow feature layer in the backbone network to connect to the neck network; however, small targets are inherently smaller in size on the map, and after the model’s downsampling process, small target feature perceptual fields are continuously amplified, so fewer and fewer features can be utilized.
To further increase the detection accuracy and enhance the ability of the backbone network to extract features, similar to the ASPP structure [21], we introduced a plug-and-play cascade feature fusion module (CFFM) at the output position of the model’s backbone feature extraction. This was performed to fully conduct a fusion of shallow detail information and deep high-level semantic information to increase the amount of useful information on blade damage features obtained by the model. Its structure is shown in Figure 6. The CFFM comprises the lightweight and efficient ECA channel attention module and the cascade interaction module.
The ECA block directly corresponds to the channel and attention weights. It achieves a local cross-channel interaction through grouped convolution and avoids a reduction in learning ability because it reduces the network’s dimensionality and enhances the model’s use of user information. After the images are extracted by using SimRepVGG’s backbone features, three sub-feature maps are generated at different scales. ECA-Net first performs the global average pooling [22] of the sub-feature maps and then directly uses the k method of adaptively selecting the size of the one-dimensional convolutional kernel for weight-sharing learning. Then, it utilizes the sigmoid activation function to obtain the weights of each channel, which enhances the features in specific regions and generates an optimized feature map to increase the capability of the model to detect small targets. Figure 7 displays the ECA structure.
In Figure 7, x is the input feature map; H , W , and C denote the height, width, and number of channels of the feature map, respectively; x ~ is the output feature map, σ is the sigmoid activation function, is element-by-element multiplication, k is the adaptive convolution kernel size, and the mapping relationship between the kernel size and the channel dimension C is shown in Equation (3):
k = ψ C = log 2 C γ + b γ o d d
In this study, we set γ and b to 2 and 1, respectively; log 2 C γ + b γ o d d indicates that the result is close to an odd number.
The model’s features were fully fused to further enhance the feature utilization between the network layers and reduce redundant information. The initial feature fusion of the three sub-feature maps of the ECA attentional feature enhancement mechanism was performed using the cascade fusion method.
Figure 8 shows the structure of the AE module, which was used to extend the dimensionality of the fused feature maps using depthwise (DW) and pointwise (PW) convolution to retain as much feature information about the target as possible [23]. DW convolution was then performed with 3 × 3 and 5 × 5 convolution kernels to obtain multisensory field feature maps, and the weights were reassigned to different feature maps by using the ECA attention mechanism. By using the ECA attention mechanism, the cascade fusion enhancement of the features was achieved by reassigning weights to the feature maps of different receptive fields. The implementation process is shown in Equations (4)–(7):
s t e p 1   =   P 4   +   U p s a m p l e P 5
s t e p 2   =   s t e p 1   +   D o w n s a m p l e P 3
P 4   =   A E C o n c a t s t e p 1 , s t e p 2
P 3   =   C o n c a t P 3 , U p s a m p l e ( P 4 )
The feature heatmap generated by the cascaded feature fusion module is shown in Figure 9. After the feature map is processed by the cascaded fusion information of the CFFM module, the network maintains more boundary information. It also focuses the network model on the center of the target, demonstrating the effectiveness of the CFFM module’s design.

2.3.3. Loss Function Improvements

The wind turbine blade damage target resembles the blade background, and when the damage scale is small, distinguishing between positive foreground samples and negative background samples is difficult [24]. During the model training, the ratio of positive to negative image samples is severely unbalanced. Many simple negative samples dominate the network’s optimization procedure, which results in the insufficient learning of the foreground positive sample targets by the model, along with low recall and unstable model performance. We present the focal losses (FLs) [25] to replace the YOLOX confidence loss cross-first function to address this problem. The FLs are defined as shown in Equations (8) and (9):
F l s   =   α 1 y ^ γ ln y ^ y = 1
F l s = 1 α y ^ γ ln 1 y ^     y = 0
where α 0,1 is the relevant balance coefficient to solve the imbalance between the positive and negative sample proportions; γ is the simple sample loss decline rate weight adjustment factor, and γ > 0; y represents the label, whereby the correct classification takes the value of 1 and is otherwise set to 0; and y ^ is the probability value that the prediction result is a certain category of damages.
To solve the category imbalance problem, the FLs dynamically adjust the loss according to the confidential information of the model. As the confidential information of the correct prediction increases, its corresponding weight loss gradually decreases. By adjusting the weight information, the model is adjusted to pay more attention to the hard-to-classify samples during the training process, thereby increasing the network’s convergence speed and recognition accuracy.

3. Results

3.1. Evaluation Metrics

Average precision (AP), mean average precision (mAP), recall, and frames per second (FPS) were selected as the main indicators of the experimental results to evaluate the model’s effectiveness in detecting faults in the wind turbine blades, as defined by Equations (10)–(12):
A P = T P T P + F P
m A P = i = 0 n A P i n , n = n u m   o f   d e f e c t s
R e c a l l = T P T P + F N
In this study, AP represents the proportion of damages correctly predicted for a particular damage type relative to the total number of damages predicted for that damage type. The category-wide average detection accuracy, mAP, is calculated by taking the mean of the average detection accuracy for all categories, where A P i is the average detection accuracy for damages in category i . mAP50 is the traditional detection standard that evaluates the accuracy of predictions with an IoU greater than 0.5 for the target to be detected in the test set. mAP is used in this study to denote mAP50. Recall represents the proportion of damages correctly predicted for a particular damage type relative to the total number of damages, and FPS represents the number of frames per second detected.
True positive (TP) represents the positive samples predicted as a positive class by the model, false positive (FP) represents the negative samples predicted as a positive class by the model, false negative (FN) represents the positive samples predicted as a negative class by the model, and n represents the object detection category set.

3.2. Experimental Setups
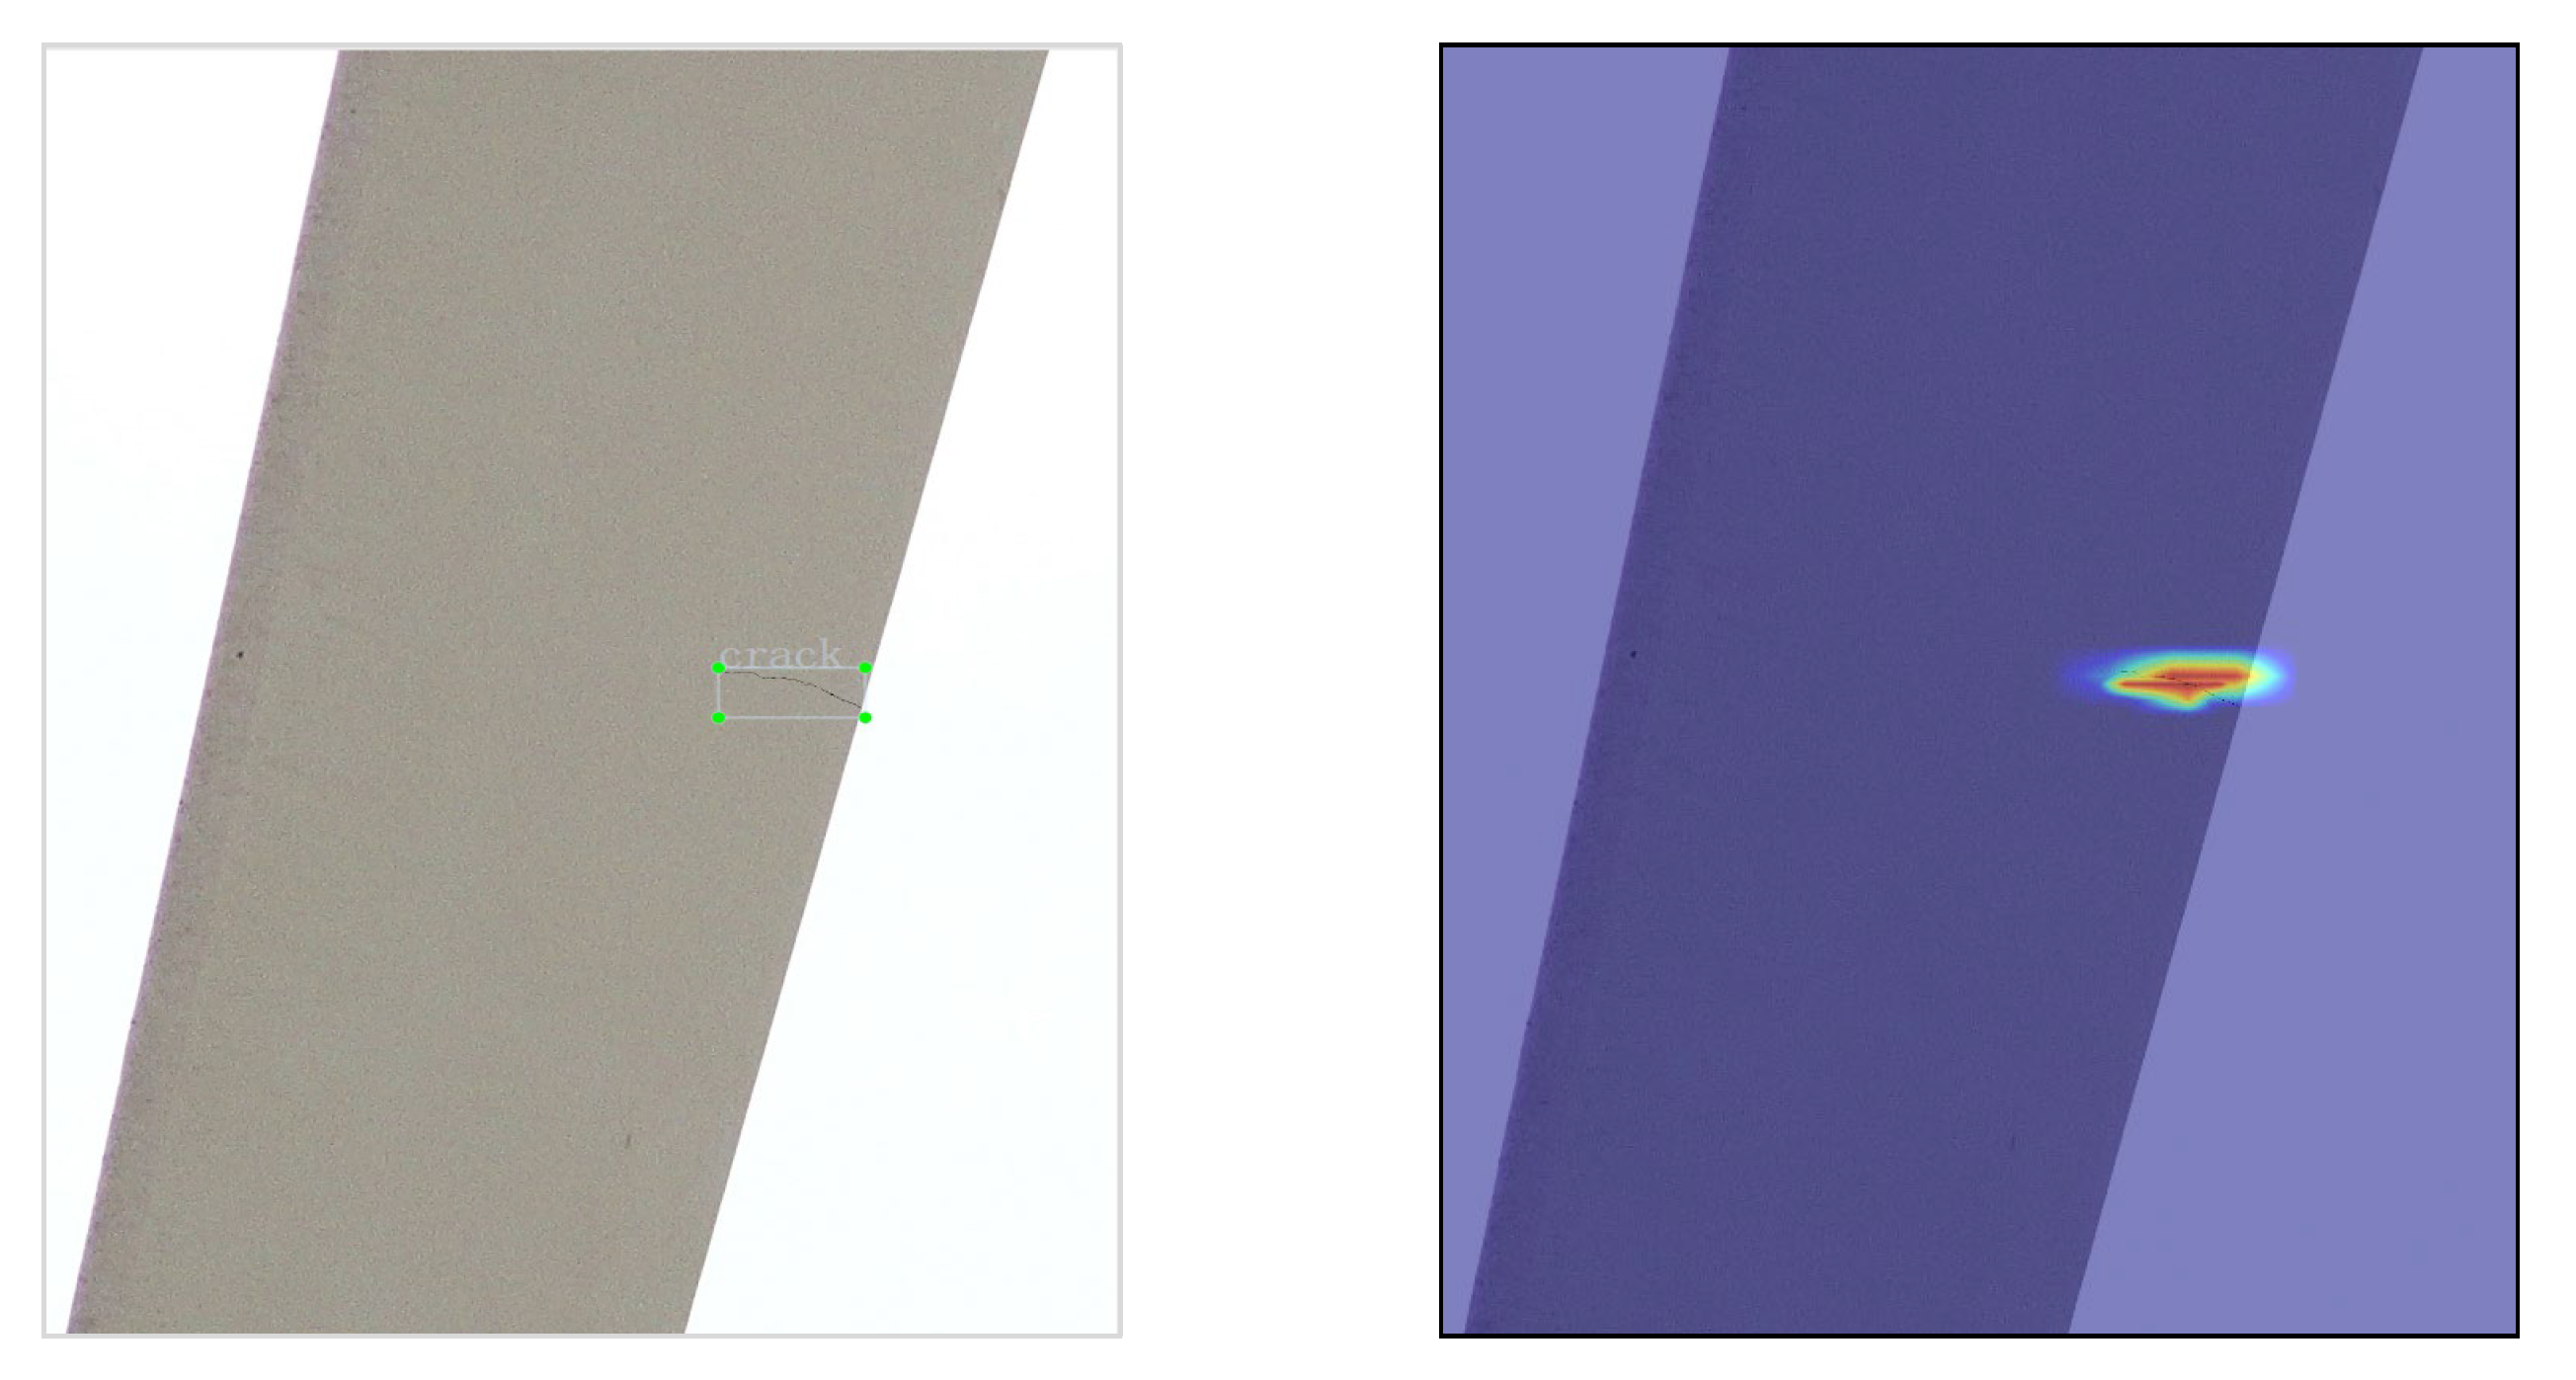
The implementation experiments were conducted in the same environment. To match the input size requirements of the different models, we evenly drew the dataset resolution from 640 × 640 in 32 steps, with uniform input sizes from 448 to 832. The relevant settings for the model during training were as follows: We let the model train for 300 epochs on an NVIDIA GeForce GTX2080Ti with a batch size of 64. To improve the model training effect, we performed a 5-epoch warm-up and used stochastic gradient descent (SGD) to increase the iteration speed of the network model; more detailed parameters were set with an initial lr = 0.01. The learning rate using the cosine lr scheme was set to lr × batch size/64, the SGD momentum to 0.9, and the weight decay to 0.0005. There may be fine-tuning of the parameter settings during training for different models.
The competitive algorithms included Faster R-CNN [26], SSD [27], YOLOv3 [28], YOLOv7 [29], and YOLOX-S. The reason for choosing the above algorithm was that Faster R-CNN is a typical representative of two-stage methods, whereas SSD, YOLOv3, YOLOv7, and YOLOX-S are representative of single-stage methods. The parameter settings of the competitive algorithms followed a unified standard.

3.3. Analysis

The values of the parameters γ and α in the focal loss were compared in the experiments. We referred to a large number of focal loss experiences in the parameter settings of γ and α in the relevant experiments of the application of the target detection algorithms, and we finally selected γ values of 1, 2, and 3, and α values of 0.25, 0.50, and 0.75—a total of nine sets of parameter combinations—and verified them on the network model. The experimental results are shown in Table 2. We found that the model had the highest detection accuracy when γ was 2 and α was 0.25.
To further verify the necessity of module enhancement on model gain and its impact on model performance, four sets of relevant ablation experiments were designed to analyze the enhancement part. Each experimental group’s fundamental training parameters were kept constant, except for the module validation. Table 3 depicts the results of the ablation experiments.
The experiments were conducted using YOLOX-S as the baseline. As shown in Table 1′s comparison of the group 1 and 2 experiments, the mAP value increased from 91.34% to 91.54% after the backbone feature extraction network was replaced with SimRepVGG. The results of the experiments demonstrated that the lightweight network RepVGG increased the model’s capacity to extract features from the backbone network. Comparing the results of the group 2 and 3 experiments revealed that the CFFM cascade feature fusion module increased the mAP value by 2.15%. This suggests that the CFFM module can successfully enhance the model’s capacity to detect targets through multiscale cascade fusion. Invoking the FL loss function increased the mAP to 94.29%, as evidenced by comparing the results of the group 3 and 4 experiments. The results showed that FLs can effectively balance the positive and negative sample distributions and increase the network’s detection accuracy for difficult samples.
To further verify the advantages of the WT-YOLOX network model for wind turbine blade damage detection, we compared the model with the current mainstream target detection models by using a homemade dataset. The results of the comparison experiments are shown in Table 4.
Compared with the two-stage mainstream detection algorithm Faster-RCNN and the single-stage detection algorithms SDD, YOLOv3, YOLOv7, and YOLOX-S, the average detection accuracy of the WT-YOLOX algorithm was higher by 20.64%, 9.39%, 4.79%, 4.09%, and 2.95%, respectively. The network model’s detection speed also increased to some extent. Table 5 shows the AP and recall of the model when detecting four different damage types to more clearly delineate the differences in performance between the enhanced and original models. The data showed that the enhanced WT-YOLOX model achieved higher values for both metrics. Figure 10 shows the detection results of YOLOX-S and WT-YOLOX in an actual wind farm scenario. In the first case, the original image of the turbine blade damage to be detected is shown, whereas in the second and third cases, the actual detection images of YOLOX-S and the modified WT-YOLOX are displayed, respectively. The detection images demonstrated that although YOLOX can detect the target, the enhanced model can detect the target more accurately.
By conducting a comparative experimental analysis, we found that the enhanced YOLOX-S network model considerably enhanced the ability of the model to detect all four damage types of wind turbine blades compared with the enhanced network. The enhanced algorithm had a more balanced detection accuracy and speed. The algorithm can easily be deployed on the mobile side, meaning that it can more efficiently meet the actual industrial inspection needs.

4. Conclusions

With many object detection engineering technologies, an improved detection algorithm WT-YOLOX is proposed, which can achieve fast and accurate blade surface damage detection.
Compared with the benchmark network YOLOX, WT-YOLOX reduces the number of network parameters and calculations in the inference stage and improves the model’s feature fusion and classification capabilities. WT-YOLOX achieved an overall average accuracy rate of 94.29% for the four blade-damage types in the dataset collected in Inner Mongolia, which is 2.95% higher than that of the YOLO-S primary network. The backbone feature extraction network of WT-YOLOX adopts a single-channel structure in the inference stage, so even if a new cascaded feature fusion module is introduced in the neck part, the inference network model parameters still need to be significantly improved. A good balance is achieved between them, which is conducive to deploying terminal detection equipment. The cascaded feature fusion module can redistribute the weights of the feature maps of different channels, strengthen the extraction of deep information from the network structure, and effectively extract many fine-grained features. Focal loss can control the weight of easy-to-classify and difficult-to-classify samples. By reducing the weight of easy-to-classify samples, we can focus more on difficult-to-classify samples during training, promoting the training of this dataset.
The algorithm in this research only uses the image data of the wind field in a single region of Inner Mongolia in the experiment, and the data environment and damage types need to be richer. In future work, more wind turbines in different regions should be inspected to enrich the blade damage data and explore more data augmentation methods that improve the algorithm model’s robustness and generalization ability.

Author Contributions

Conceptualization, Y.Y., G.W., and J.F.; methodology, Y.Y. and G.W.; validation, Y.Y. and G.W.; investigation, Y.Y.; resources, Y.Y. and G.W.; data curation, Y.Y.; writing—original draft preparation, Y.Y.; writing—review and editing, Y.Y.; supervision, G.W. and J.F. All authors have read and agreed to the published version of the manuscript.

Funding

This research was funded by ‘Smart Energy System’, grant number (20)DZ-002.

Informed Consent Statement

Informed consent was obtained from all subjects involved in the study.

Data Availability Statement

Not applicable.

Conflicts of Interest

The authors declare no conflict of interest.

References

  1. Roga, S.; Bardhan, S.; Kumar, Y.; Dubey, S.K. Recent technology and challenges of wind energy generation: A review. Sustain. Energy Technol. Assess. 2022, 52, 102239. [Google Scholar] [CrossRef]
  2. Cheng, S.; Elgendi, M.; Lu, F.; Chamorro, L.P. On the Wind Turbine Wake and Forest Terrain Interaction. Energies 2021, 14, 7204. [Google Scholar] [CrossRef]
  3. Elgendi, M.; AlMallahi, M.; Abdelkhalig, A.; Selim, M.Y. A review of wind turbines in complex terrain. Int. J. Thermofluids 2023, 17, 100289. [Google Scholar] [CrossRef]
  4. Wang, W.; Xue, Y.; He, C.; Zhao, Y. Review of the typical damage and damage-detection methods of large wind turbine blades. Energies 2022, 15, 5672. [Google Scholar] [CrossRef]
  5. Márquez, F.P.G.; Chacón, A.M.P. A review of non-destructive testing on wind turbines blades. Renew. Energy 2020, 161, 998–1010. [Google Scholar] [CrossRef]
  6. Márquez, F.P.G.; Tobias, A.M.; Pérez, J.M.P.; Papaelias, M. Condition monitoring of wind turbines: Techniques and methods. Renew. Energy 2012, 46, 169–178. [Google Scholar] [CrossRef]
  7. Ge, Z.; Liu, S.; Wang, F.; Li, Z.; Sun, J. Yolox: Exceeding yolo series in 2021. arXiv 2021, arXiv:2107.08430v2. [Google Scholar]
  8. Yi, C.; Xu, B.; Chen, J.; Chen, Q.; Zhang, L. An Improved YOLOX Model for Detecting Strip Surface Defects. Steel Res. Int. 2022, 93, 2200505. [Google Scholar] [CrossRef]
  9. Woo, S.; Park, J.; Lee, J.-Y.; Kweon, I.S. Cbam: Convolutional block attention module. In Proceedings of the European Conference on Computer Vision (ECCV), Munich, Germany, 8–14 September 2018; pp. 3–19. [Google Scholar]
  10. Shen, C.; Ma, C.; Gao, W. Multiple Attention Mechanism Enhanced YOLOX for Remote Sensing Object Detection. Sensors 2023, 23, 1261. [Google Scholar] [CrossRef] [PubMed]
  11. Tang, R.; Sun, H.; Liu, D.; Xu, H.; Qi, M.; Kong, J. EYOLOX: An Efficient One-Stage Object Detection Network Based on YOLOX. Appl. Sci. 2023, 13, 1506. [Google Scholar] [CrossRef]
  12. Wang, C.-Y.; Liao, H.-Y.M.; Wu, Y.-H.; Chen, P.-Y.; Hsieh, J.-W.; Yeh, I.-H. CSPNet: A new backbone that can enhance learning capability of CNN. In Proceedings of the IEEE/CVF Conference on Computer Vision and Pattern Recognition Workshops, Seattle, WA, USA, 14–19 June 2020; pp. 390–391. [Google Scholar]
  13. Liu, S.; Qi, L.; Qin, H.; Shi, J.; Jia, J. Path aggregation network for instance segmentation. In Proceedings of the IEEE Conference on Computer Vision and Pattern Recognition, Salt Lake City, UT, USA, 18–23 June 2018; pp. 8759–8768. [Google Scholar]
  14. Bochkovskiy, A.; Wang, C.-Y.; Liao, H.-Y.M. Yolov4: Optimal speed and accuracy of object detection. arXiv 2020, arXiv:2004.10934. [Google Scholar]
  15. Wu, Y.; Chen, Y.; Yuan, L.; Liu, Z.; Wang, L.; Li, H.; Fu, Y. Rethinking classification and localization for object detection. In Proceedings of the IEEE/CVF Conference on Computer Vision and Pattern Recognition, Seattle, WA, USA, 14–19 June 2020; pp. 10186–10195. [Google Scholar]
  16. Ding, X.; Zhang, X.; Ma, N.; Han, J.; Ding, G.; Sun, J. Repvgg: Making vgg-style convnets great again. In Proceedings of the IEEE/CVF Conference on Computer Vision and Pattern Recognition, Nashville, TN, USA, 20–25 June 2021; pp. 13733–13742. [Google Scholar]
  17. Veit, A.; Wilber, M.J.; Belongie, S. Residual networks behave like ensembles of relatively shallow networks. Adv. Neural Inf. Process. Syst. 2016. [Google Scholar] [CrossRef]
  18. He, K.; Zhang, X.; Ren, S.; Sun, J. Deep residual learning for image recognition. In Proceedings of the IEEE Conference on Computer Vision and Pattern Recognition, Las Vegas, NV, USA, 27–30 June 2016; pp. 770–778. [Google Scholar]
  19. Oyedotun, O.K.; Aouada, D.; Ottersten, B. Going deeper with neural networks without skip connections. In Proceedings of the 2020 IEEE International Conference on Image Processing (ICIP), Abu Dhabi, United Arab Emirates, 25–28 October 2020; pp. 1756–1760. [Google Scholar]
  20. Li, C.; Li, L.; Jiang, H.; Weng, K.; Geng, Y.; Li, L.; Ke, Z.; Li, Q.; Cheng, M.; Nie, W. YOLOv6: A single-stage object detection framework for industrial applications. arXiv 2022, arXiv:2209.02976. [Google Scholar]
  21. Sullivan, A.; Lu, X. ASPP: A new family of oncogenes and tumour suppressor genes. Br. J. Cancer 2007, 96, 196–200. [Google Scholar] [CrossRef] [PubMed]
  22. Lin, M.; Chen, Q.; Yan, S. Network in network. arXiv 2013, arXiv:1312.4400. [Google Scholar]
  23. Zhang, Y.-M.; Lee, C.-C.; Hsieh, J.-W.; Fan, K.-C. CSL-YOLO: A new lightweight object detection system for edge computing. arXiv 2021, arXiv:2107.04829. [Google Scholar]
  24. Zhang, R.; Wen, C. SOD-YOLO: A Small Target Defect Detection Algorithm for Wind Turbine Blades Based on Improved YOLOv5. Adv. Theory Simul. 2022, 5, 2100631. [Google Scholar] [CrossRef]
  25. Lin, T.-Y.; Goyal, P.; Girshick, R.; He, K.; Dollár, P. Focal loss for dense object detection. In Proceedings of the IEEE International Conference on Computer Vision, Venice, Italy, 22–29 October 2017; pp. 2980–2988. [Google Scholar]
  26. Girshick, R. Fast r-cnn. In Proceedings of the IEEE International Conference on Computer Vision, Santiago, Chile, 7–13 December 2015; pp. 1440–1448. [Google Scholar]
  27. Liu, W.; Anguelov, D.; Erhan, D.; Szegedy, C.; Reed, S.; Fu, C.-Y.; Berg, A.C. Ssd: Single shot multibox detector. In Proceedings of the Computer Vision—ECCV 2016: 14th European Conference, Amsterdam, The Netherlands, 11–14 October 2016; pp. 21–37. [Google Scholar]
  28. Redmon, J.; Farhadi, A. Yolov3: An incremental improvement. arXiv 2018, arXiv:1804.02767. [Google Scholar]
  29. Wang, C.Y.; Bochkovskiy, A.; Liao, H. YOLOv7: Trainable bag-of-freebies sets new state-of-the-art for real-time object detectors. arXiv 2022, arXiv:2207.02696. [Google Scholar]
Figure 1. Sample diagrams from each category of damage in the dataset. The damage types are Fix, Pollution, Crack, and Break. In order to facilitate the display of the dataset, we adjusted the image resolution.
Energies 16 03776 g001
Figure 2. Diagram of the network structure of YOLOX.
Energies 16 03776 g002
Figure 3. Building RepVGG via structural re-parameterization: (a) Training-time multi-branch architecture. (b) Structural re-parameterization of a RepVGG block. (c) Re-parameterization for a plain inference-time model.
Energies 16 03776 g003
Figure 4. Diagram of the network structure of the WT-YOLOX detector.
Energies 16 03776 g004
Figure 5. (a) The RepBlock is composed of several RepVGG blocks with ReLU activations at training; (b) the RepVGG block is converted to RepConv at inference time; (c) the SimRepVGG Backbone. Replace the ordinary Conv layer with stride = 2 in backbone with the RepConv layer with stride = 2, and the original CSP Block is redesigned as RepBlock, in which the first RepConv of RepBlock will perform channel dimension transformation and alignment.
Energies 16 03776 g005
Figure 6. Illustration of CFFM, of which the cascade fusion and AE structure are the main parts. AE stands for the split and aggregation enhancement module. The ECA block represents the channel attention block.
Energies 16 03776 g006
Figure 7. The architecture of the ECA.
Energies 16 03776 g007
Figure 8. Detail of the AE. PW and DW denote the PW convolution and DW convolution, respectively. ECA block denotes the channel attention block, and the transition layer is usually implemented by 1 × 1 convolution.
Energies 16 03776 g008
Figure 9. Illustration of a sample image from the dataset, along with the integrated feature map generated by CFFM.
Energies 16 03776 g009
Figure 10. Visualized results of YOLOX and WT-YOLOX (mAP50).
Energies 16 03776 g010
Table 1. Dataset damage types and quantity expansion.
Damage TypesBreakPollutionCrackFixTotal Number
Before182151180212725
Now14561208144016965600
Table 2. Comparison of the mAP50 results of parameters γ and α in the focal loss.
Parameter α = 0.25 α = 0.50 α = 0.75
γ  = 192.7592.8492.90
γ  = 294.2992.7692.62
γ  = 391.5491.4592.75
Table 3. Comparative results of models with different additional structures.
StrategyGroup 1Group 2Group 3Group 3
YOLOX-S
+SimRepVGG×
+CFFM××
+FLs×××
mAP50(%)91.34 (+0)91.54 (+0.2)93.69 (+2.15)94.29 (+0.6)
Params(M)9.007.4512.1512.15
FPS42.1245.8044.2843.18
Table 4. Experimental results of different models on the testing sets.
MethodsBackbonemAP50 (%)FPS
SSDVGG84.9021.10
Faster-RCNNResnet10173.658.35
YOLOv3CSPDarknet5389.5038.84
YOLOX-SCSPDarknet5391.3442.12
WT-YOLOXSimRepVGG94.2943.18
Table 5. Comparison of the AP50 and recall of WT-YOLOX with YOLOX on the dataset.
MethodsAP50Recall
YOLOX-SBreak: 0.911
Crack: 0.914
Fix: 0.937
Pollution: 0.901
Break: 0.873
Crack: 0.980
Fix: 0.994
Pollution: 0.903
WT-YOLOXBreak: 0.942
Crack: 0.954
Fix: 0.970
Pollution: 0.943
Break: 0.891
Crack: 0.968
Fix: 0.987
Pollution: 0.890
Disclaimer/Publisher’s Note: The statements, opinions and data contained in all publications are solely those of the individual author(s) and contributor(s) and not of MDPI and/or the editor(s). MDPI and/or the editor(s) disclaim responsibility for any injury to people or property resulting from any ideas, methods, instructions or products referred to in the content.

