Article

Cluster Partition Operation Study of Air-Cooled Fan Groups in a Natural Wind Disturbance

Energy and Electricity Research Centre, Jinan University, Zhuhai 519070, China
*
Authors to whom correspondence should be addressed.
Energies 2023, 16(9), 3717; https://doi.org/10.3390/en16093717
Submission received: 7 March 2023 / Revised: 17 April 2023 / Accepted: 24 April 2023 / Published: 26 April 2023
(This article belongs to the Special Issue Advanced Thermal Management for Energy Systems)

Abstract

:
This study discusses the influence of natural wind on the air flow of air-cooled condensers (ACCs) and then proposes a partition speed-regulation strategy for a fan group with enhanced generalized capability, which is of great practical significance for optimizing energy-saving operations. The stochastic time-varying features of natural wind are characterized by sine–Gaussian, Weibull, and composed winds. In a natural wind disturbance, using the Sugon Supercomputing Center, the transient numerical simulation of the dynamic evolution of the ACC flow field was found: the dynamic system of air flow is a typical time-varying nonlinear process. Cluster analysis was used to extract the nonlinear features of air flow, divide the fan group into four subregions with generalization capability, and implement a partitioned speed operation. It was found that giving priority to increasing the fan speed in the headwind partition can suppress the natural wind disturbance and improve the overall air flow, thus reducing the fan speed in the leeward partition, which reduces the overall air flow loss. The dynamic characteristics of the fan group obtained from the simulation and the proposed fan partition method can guide the optimized energy-saving operation of ACCs.

1. Introduction

Statistics from 2020 [1] showed that coal-fired power accounted for 69.6% of China’s total generation, and thermal power units are still the mainstay of power production. To accelerate the construction of a clean and low-carbon energy supply system, and to promote the clean and efficient transformation of coal-fired power generation, the China Development and Reform Commission issued a notice in 2021 on coal-fired power transformation and upgrading, which required “further reducing the energy consumption of thermal power units, vigorously promoting the optimization of the cold end of thermal power units and improving the level of energy saving and efficiency”. In China’s “Three Norths” (Northwest, North China, Northeast) water-scarce areas, large, air-cooled units [2] use axial fans to drive forced air convection in a condenser to cool the spent steam in the finned tube. The total power of the motor group is as high as 3000–10,000 MW, accounting for about 1% of the power generated by the unit. It is of great social and economic importance that the optimized operation technology of ACCs with minimal driving cost be explored to reduce the energy consumption of air-cooled islands and promote the overall clean and efficient transformation of coal power units.
The airflow characteristics of fans within an air-cooled island vary greatly at the same speed under natural wind and clustering. Compared with the centralized control of the fan group, an air-cooled, fan-group-partitioning control strategy can significantly improve energy efficiency from the secondary allocation of fan power in different regions, thereby becoming a highly expected energy-saving solution for air-cooled units [3,4,5,6]. The reasonableness of the fan-group partitions determines the energy-saving of the partition optimization strategy. The number of partitions equals the degrees of freedom in the multivariate control system and the decision dimension of the speed-regulation algorithm, which affects the complexity and workload of the controller’s online calculation. It is necessary to explore the theory and implementation method of an air-cooled fan-group partition before the modeling and controller design.
There is no airflow monitoring device for the axial flow fans of engineering air-cooled islands. To study the differences in the flow characteristics of the fan group during natural wind and cluster effects, the proposed partition strategy relies mainly on the numerical solution of the ACC aerodynamic field as described by the Navier–Stokes equation. Xiao et al. [7] simulated a cluster of a 300 MW unit under steady wind and found that increasing the fan speed in the non-side regions could increase the effective heat transfer airflow rate. Huang et al. [4,5] studied the partitioned operation of a 300 MW unit ACC under steady wind and found that the flow field was uniformly distributed through partition control without an increase in power consumption, which could increase the airflow rate and reduce the operating cost of direct air-cooled islands. In contrast to the empirical partitioning strategy of [3,4,5,6,7,8], Li et al. [9,10] used numerical simulation to analyze the gray correlation between fan power and ACC back pressure under steady wind to improve partitioning generalization. It was found that adjusting the rotational speed of fans that had a higher correlation could optimize the back pressure control performance of ACCs. Further, Bai et al. [11] used a numerical simulation to obtain the ACC operational data in a constant wind, combined with the clustering calculation to divide the fan group into seven regions, adjusting the fan speed in specific regions to reduce the back pressure of the unit.
The above studies show that the CFD results of a fan group aerodynamic field can be used as the basis for a fan group partitioned operation. Due to the mesh magnitude and time cost caused by transient simulations for a discrete grid of nearly 10 million required for CFD calculations of an ACC, the results of previous studies [3,4,5,6,7,8,9,10,11] on the partitioning of ACCs were obtained under steady-state CFD calculations on a desktop-computing platform under steady wind conditions. Natural wind, the main source of disturbance in a dynamic field, was treated as a time-invariant function. However, in natural wind over an engineered air-cooled island, velocity is transient with time and randomness. In contrast to the ideal steady-wind disturbance, analyzing the dynamic characteristics of the driving process of the axial fan group under an actual transient wind and reasonably dividing the operational region according to dynamic characteristics, are the primary problems that remain to be solved before the distributed control is applied to the site.
This paper takes a 660 MW air-cooled unit with an 8 × 7 axial flow fan group as the research object and proposes the boundary conditions to describe natural wind disturbance characteristics. The ACCs’ dynamic field mechanism model was established using the Navier–Stokes equation. Based on a supercomputing platform with 1280 CPU cores, the variable dynamic field of the fan group was calculated by a transient CFD solver. Then, the dynamic characteristics of the fan flow rate could be analyzed using the CFD result. Two clustering algorithms were proposed for the construction of the fan-group partition strategy based on dynamic flow characteristics. Finally, distributed-control speed reassignment schemes were proposed from the initial partition structure of the fan group. The results showed that the proposed partition strategy and speed-assignment scheme improved the energy-saving performance of the axial fan group under dynamic conditions. The ability of the cluster-partitioning method to generalize disturbances in a random transient wind was verified. This study provides a theoretical and practical framework for the energy-saving control of air-cooled units. The remainder of this paper is organized as follows: Three transient natural wind models and the 600 MW direct air-cooled island model are described in Section 2. The clustering algorithm is described in Section 3, which analyzes the dynamic flow characteristics of an ACC in three kinds of natural wind disturbances and obtains the partition strategies of the fan group using clustering algorithms and evaluation metrics. Section 4 analyzes the dynamic flow characteristics of an ACC, proposes 12 fan-speed redistribution strategies and analyzes the air flow rate of each strategy. Lastly, some conclusions are proposed in Section 5.

2. Natural Wind Models and Numerical Models

2.1. Stochastic Wind Speed Model for Natural Wind

In this paper, the sine–Gaussian, Weibull and composed wind speed models were adopted to simulate the actual measured wind speed of the power plant, as shown in Figure 1.

2.1.1. Sine–Gaussian Wind-Speed Model

The sine–Gaussian wind-speed model is composed of a sine wind speed and a Gaussian noise wind speed, which can be calculated by the following formula:
v s g = v s + v g
v s = A sin ( 2 π ω t ) + B
where vs is the sine wind speed at time t; A = 1; ω = 1/20; B = 5; t ∈ [1, 2, 3, …]; and vg is generated using the Box–Muller [12] method for Gaussian random noise.

2.1.2. Weibull Wind-Speed Model

The Weibull distribution is considered to be a probabilistic model with a simple form and a reasonable fit to actual wind speed distribution [13], the wind speed of which can be calculated as follows:
v w = c w × [ ( l n ( 1 U ) ) 1 / k s ]
c w = v ¯ Γ ( 1 + 1 / k s )
k s = ( σ v ¯ ) 1.086 ( 1 k s 10 )
Γ ( 1 + 1 / k s ) = ( 0.568 + 0.434 k s ) 1 / k s
where U is a random number obeying uniform distribution in the range of [0, 1]; v ¯ is the mean wind speed; σ is the standard deviation of wind speed; cw is the scale parameter; and ks is the shape parameter.

2.1.3. Composed Wind-Speed Model

The composed model [14] decomposes wind speed into four components: basic wind speed vwb; gust wind speed vwg; ramping wind speed vwr; and noise wind speed vwn. The combined wind speed vcw was calculated using the following equation:
v c w = v w b + v w g + v w r + v w n
where vwb is the average wind speed. The gust wind speed vwg formula is as follows:
v w g = { 0 t < t 1 G G m a x 2 [ 1 cos 2 π ( t t 1 G t 2 G t 1 G ) ] t 1 G < t < t 2 G 0 t > t 2 G
where Gmax is the peak gust; t1G is the start time of the gust; t2G is the end time of the gust; and t is the running time. The asymptotic wind speed vwr can be calculated as follows:
v w r = { 0 t < t 1 R R m a x [ 1 t t 2 R t 1 R t 2 R ] t 1 R < t < t 2 R 0 t > t 2 R
where Rmax is the maximum value of the ramping wind; t1R is the start time; and t2R is the end time of the ramping wind speed. The noise wind speed vwn can be calculated as follows:
v w n = 2 i = 1 n [ S v ( ω i ) Δ ω ] 1 / 2 cos ( ω i t + ϕ i )
S v ( ω i ) = 2 K N F 2 | ω i | π 2 [ 1 + ( F ω i μ c π ) 2 ] ( 4 / 3 )
ω i = ( i 0.5 ) Δ ω
where ωi is the angular frequency of the i-th component; Δω is the discrete interval of the random component; ϕi obeys a uniform probability distribution in [0, 2π]; KN is the plane dilation factor; F is the disorder scale factor; μc is the wind speed at the reference height; and Sv(ωi) is the amplitude of the i-th random component.

2.2. Numerical Model of the Aerodynamic Field of the Air-Cooled Array

A 660 MW direct air-cooled unit was taken as the research object of this paper. Its air-cooled array consisted of 8 rows of cooling unit columns, with 7 cooling units in each column for 56 axial fans in total. The fan numbers are shown in Figure 2, and fan performance parameters in Table 1.
Assuming incompressible air, the Navier–Stokes equation describes the flow of air driven by the axial fan as follows:
{ ρ t + ( ρ u ) = 0 t ( ρ u ) + ( ρ u u ) = p + [ μ ( u + u T ) ] + ρ g t ( ρ E ) + [ ( ρ E + p ) u ] = ( κ e f f T ) + S E
where t is time; ρ is density; μ is dynamic viscosity; u is velocity vector; p is pressure; g is the gravitational acceleration vector; E is energy; κ e f f is the effective conductivity; ρ g is external force term; and SE is energy source term.
The air-cooled axial fan was treated as a fan model, which provided the pressure-rise value ∆p as the source term of Equation (13) as determined by Equation (14). According to the fan similarity law [15], combined with the actual operating data in the field for correction, Equation (14) was obtained as
Δ p = p T O T ( U F U r a t e ) 1.55
where pTOT is the rated full pressure of the fan; UF is the target fan speed; and Urate is the rated fan speed.
The finned tube bundle pressure constraint was treated as a radiator model and the flow through the finned tube pressure rise ∆p, determined by Equation (15), was also used as the pressure-source term in Equation (13):
Δ p = k L 1 2 ρ v 2
where kL is the loss function, which is simplified to the polynomial function formula
k L = n = 1 N r n v n 1
where rn is the polynomial coefficient; r1 = 71.689; r2 = −31.707; r3 = 4.798. The heat flux q from the radiator to the air was
q = h ( T s T a )
where Ts is the steam condensing temperature, and Ta is the air temperature downstream of the radiator. The convective heat transfer coefficient h can be specified as a polynomial function:
h = n = 1 N h n v n 1
where h1 = 536.993, h2 = 2016.089, h3 = −97.77205.
The RNG (Renormalization Group) k-ω turbulence model [16] was used to describe air-fluid turbulence as follows:
t ( ρ k ) + x i ( ρ k u i ) = x j [ ( μ + μ t σ k ) k x j ] + G k ρ ε
t ( ρ ε ) + x i ( ρ ε u i ) = x j [ ( μ + μ t σ ε ) ε x j ] + C 1 ε ε k G k C 2 ε * ρ ε 2 k
μ t = ρ C μ k 2 ε
G k = μ t ( u i x j + u j x i ) u i x j
C 2 ε * = C 2 ε + C μ η 3 ( 1 η / η 0 ) 1 + β η 3
η = G k ρ C μ
where k and ε are the turbulent kinetic energy and turbulent kinetic energy dissipation rates, respectively; μi is the xi direction velocity component; ρ is density; Cμ = 0.0845; C1ε = 1.42; C2ε = 1.68; β = 0.012; η0 = 4.38; and σk = σε = 0.7194.
The 8 × 7 air-cooled island computational domain model was built with ANSYS ICEM® 19, Canonsburg, PA, USA and then the meshes of the inner and outer regions of the array were encrypted in a 3D coordinate system as shown in Figure 3. The size of the whole calculation domain was 2000 × 600 × 600 m, where Xmax was +1803 m and Xmin was −197 m; Ymax was +560 m and Ymin was −40 m; Zmax was +345 m and Zmin was −255 m. All fans were verified for grid independence at rated speed, and the irrelevance index was axial fan inlet air flow. When the number of meshes were 6.8 million, 8.5 million, and 10.4 million, the deviation of the irrelevance index of all fans was within 1.5%; finally, the number of 8.5 million meshes was selected for calculation.
ANSYS Fluent® 19 was used to complete the numerical calculations. As shown in Figure 3, the boundary conditions of the calculation domain were set: the natural wind inlet was the velocity inlet, and the three randomly varying natural wind speeds shown in Figure 1 were set by a UDF (user-defined function). The natural wind outlet was the pressure outlet; the lowest end of the flow field was set as the no-slip wall; the highest end and both sides were set as the symmetry surface; and the fan speed was controlled by the UDF. The transient calculation method was used with a time step of 0.01 s. The SIMPLE strategy [17] was used to decouple the pressure and velocity for the second-order windward format [18], and the Green–Gauss Node-Based method [19] was used to complete the spatial–temporal discretization of the Navier–Stokes equations. The residual of the energy equation was less than 10−6, and the residuals of the other variables were less than 10−3. The “mass flow rate” data of ANSYS Fluent® for each axial fan inlet were extracted and analyzed.
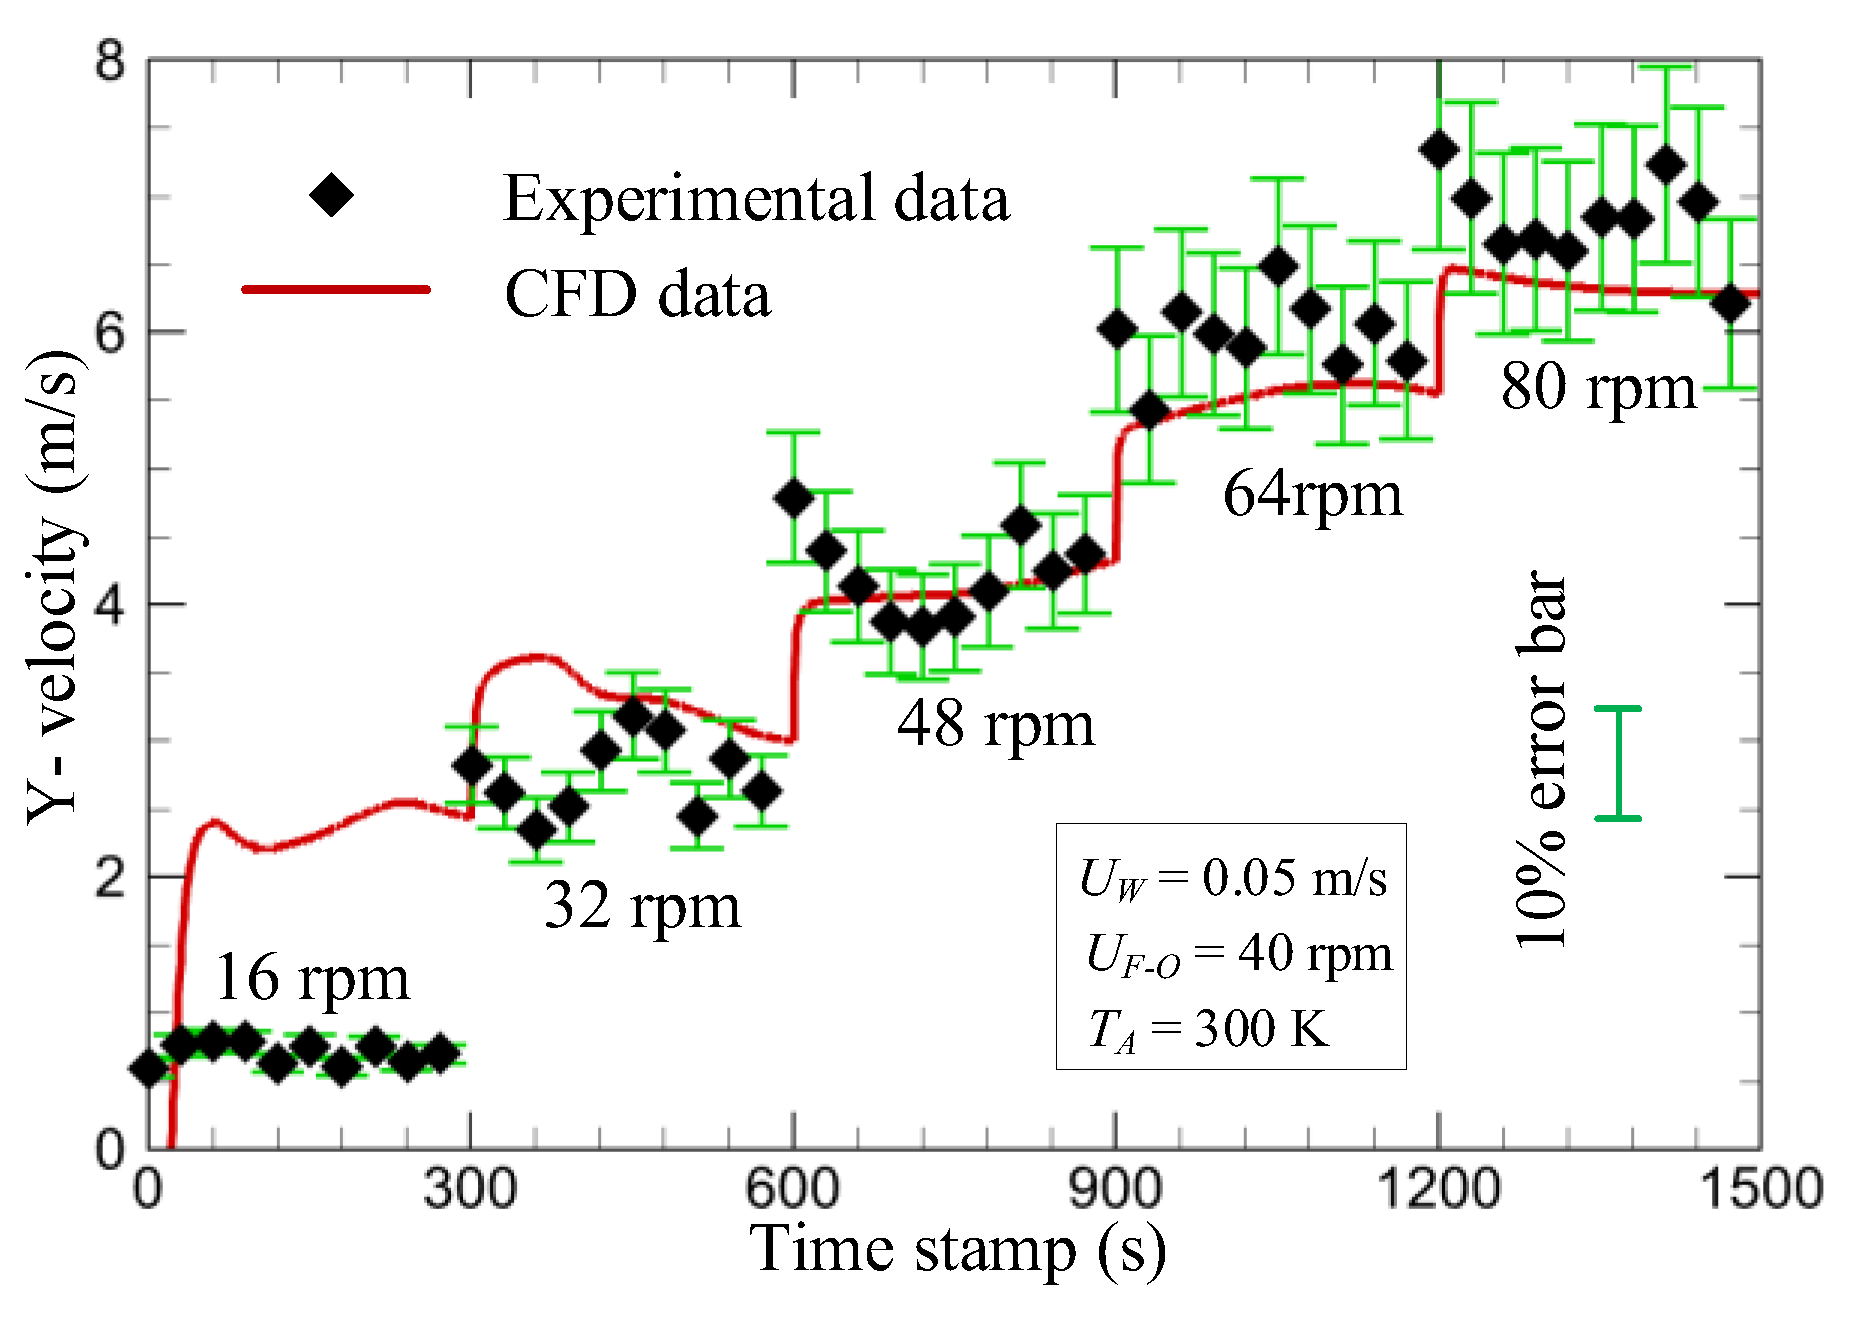
To verify the effectiveness of the numerical model of the air-cooled island, the CFD data of the simulation model for 8 × 7 air-cooled No. 44 as shown in Figure 2 were compared with the experimental data at the same location in the actual site. Specifically, the simulation model was set at an ambient temperature of 300 K and the inlet wind speed of the computational domain was 0.05 m/s. The actual experiments were conducted in an environment similar to the simulation model. The y-velocity of the No. 44 fan in the simulation model was taken as the CFD data. The average y-velocity of eight anemometers was taken as the experimental data per second. These anemometers were installed at the fan outlet in the same location as No. 44 fan in the simulation model. In both the simulation and actual experiments, the fan speed was sequentially adjusted to 16, 32, 48, 64, and 80 rpm, and each speed condition was operated for 300 s. Figure 4 shows the comparison of CFD data with the experimental data for 1500 s.
As shown in Figure 4, the deviation between the CFD data and the experimental data was less than 10%, except for the 16 rpm speed of the fan. The numerical solution of air-cooled island agreed well with the measured data. Therefore, the effectiveness of the mathematical model and numerical method of the air-cooled island were verified.
In this paper, 15 CFD cases were carried out on the Sugon supercomputing platform of the National Supercomputing Center, with a Hygon 7285 CPU, using 20 node resources and 1280 CPU cores. Each case simulated the physical system running for 1800 s. Three cases were used in Section 4.1, and 12 were used in Section 4.2.

3. Clustering Analysis

To make the fan group partition speed controller robust to the time-varying disturbance of natural wind, it was necessary to explore the nonlinear characteristics of the fan-group flow dynamic characteristics. The clustering algorithms described the similarities and differences in the relationships between individual fans. The clustering evaluation metric was used to evaluate the clustered partitioning results in three natural winds. Then, the generalization of the partitioning results was analyzed.

3.1. Agglomerative Hierarchical Clustering

The fan group was partitioned by the clustering algorithm, which was based on the time domain feature of mass flow rate and the frequency domain feature of the amplitude and phase of the bispectrum.
The time domain characteristics of the i-th fan use the mass flow rate Li obtained from the transient numerical simulation solution, such as Li = { L i 1 , L i 2 , …, L i t }. Therefore, the time-domain characteristics of 56 fans in one case can be expressed as L = {L1, L2, …, L56}.
The frequency domain characteristics of the i-th fan used the weighted sum of amplitude and phase after normalization as follows:
f i = α A i + ( 1 α ) P i
where Ai and Pi are initialized using a similar equation to formula (16), and α is the weighting factor. Therefore, the frequency domain characteristics fi = { f i 1 , f i 2 , …, f i t } of 56 fans in one case can be expressed as f = {f1, f2, …, f56}.
Agglomerative hierarchical clustering (AHC) [20] was one of the clustering algorithms, and the algorithm flow was as follows:
(1) The feature vectors were normalized, and each fan was treated as a subregion.
The normalized equation for the air flow rate at moment t of the n-th fan was as follows:
L n ( t ) = L n ( t ) L ¯ ( t ) s ( t )
where L ¯ ( t ) . is the mean value of the mass flow rate of the fan group at time t, and s(t) is the standard deviation of the mass flow rate of the fan group at time t.
(2) The similarity between sub-regions was calculated separately.
The sum of the squares of deviations [21] calculated the similarity between subregions i and j with the following equation:
E i , j = E k E i E j
E i = i c i t [ L i ( t ) L ¯ i ] 2
E j = j c j t [ L j ( t ) L ¯ j ] 2
E k = k c k t [ L k ( t ) L ¯ k ] 2
where Li(t), Lj(t) and Lk(t) are the mass flow rates of fans in subregions ci, cj and ck at moment t; ck is cicj; and L ¯ i , L ¯ j and L ¯ k are the average mass flow rates of ci, cj and ck, respectively.
(3) The two sub-regions with the largest similarity were then merged.
(4) Steps (2) and (3) were iterated until they reached the preset number of sub-regions to end the algorithm.

3.2. Clustering Evaluation Metric

The clustering metric was evaluated as the classification results of unlabeled samples. In this paper, the CH index was defined as the ratio of the sum of between-cluster dispersion and within-cluster dispersion [22], where dispersion is defined as the Euclidean distance. The CH index had a larger value when the density within the subregion and the dispersion between the subregions were high. For a dataset with n samples and clustering results in kc subregion, the CH index was calculated using the following formula:
C H = t r ( B k ) t r ( W k ) × n k c k c 1
where tr(Bk) is the trace of the subinterval variance matrix Bk; tr(Wk) is the trace of the variance matrix Wk within the subinterval; and Bk, Wk are defined as follows:
W k = i = 1 k x G i ( x c i ) ( x c i ) T
B k = i = 1 k n i ( c i c ) ( c i c ) T
where Gi is the set of fans belonging to the i-th subregion; ci is the center point of the i-th subregion; c is the center point of the dataset; and ni is the number of fans in the i-th subregion.

4. Results and Discussion

4.1. Analysis of Dynamic Characteristics of Fan Group Flow

Using the Sugon supercomputing platform, transient numerical calculations were performed on the computational domain shown in Figure 3, where the mass flow rates of air-cooled fans were obtained in three kinds of natural wind disturbances.

4.1.1. Time Domain Analysis of Flow Characteristics

The average mass flow rates of the fan group in the three wind-speed models are shown in Figure 5. The degradation of the fan-driven air flow performance in the first row of the windward side caused by hot air reflow formed in the aerodynamic field under the influence of natural wind is obvious. The reflow occurred in the red rectangle of the CFD visualization results in Figure 6. Concerning the temperature cloud inside the air-cooling unit in the three rows, the first row was the most affected by the reflow and hot air filled the whole air-cooling unit interior. As shown in Figure 6, the influence of the vortex that appeared at the oval in the figure gradually increased from the upstream to the downstream direction of the natural air. The average mass flow rate was higher on the outside of the first rand second rows than on the inside, and lower from the third row to the seventh row than on the inside.
To analyze the transient law of the mass flow rate of the fan group in the natural wind disturbance, Figure 7 was analyzed with the mass flow rate of the fourth column fans in the 980–1000 s range. The results showed that the mass flow rate of seven fans swung synchronously without delay with the change of natural wind, the direction of Fan74 transient was opposite to other wind directions, and the sensitivity of Fan14 to Fan64 to natural wind gradually decreased, but the sensitivity of Fan74 was higher than Fan54 and Fan64.

4.1.2. Bispectrum Analysis of Flow Characteristics

In this paper, in addition to the time domain analysis, the bispectrum theory in the frequency domain was introduced to analyze the dynamic characteristics of the fan group. The bispectrum [23] is a commonly used method in higher-order statistics for nonlinear systems, which describes the nonlinear characteristics of a system as follows:
c 3 x ( τ 1 , τ 2 ) = E { x ( t ) x ( t + τ 1 ) x ( t + τ 2 ) }
S 3 x ( ω 1 , ω 2 ) = τ 1 = + τ 2 = + c 3 x ( τ 1 , τ 2 ) e [ j ( ω 1 τ 1 + ω 2 τ 2 ) ]
where x(·) is the time signal; c3x is the third-order cumulative quantity; and S3x is the bispectrum, which is a function of the frequency independent variables ω1 and ω2, which reflect the interrelationship between the signal frequencies ω1, ω2 and ω1 + ω1.
Figure 8 shows the bispectrum amplitude graph corresponding to the time series of the fourth column of fans shown in Figure 6. In the three types of wind speed disturbance, spectral peaks appeared in the bispectrum of each fan, so the dynamic response of the fan to the natural wind had a nonlinear character [24]. This was caused by the fact that the fans were disturbed by natural wind and the mutual coupling between the fans so that the air flow did not satisfy superposition or homogeneity. Therefore, the number of spectral peaks and the frequency of spectral peaks in the fourth column are different. In Fan34 and Fan44 in Figure 8a, the number of spectral peaks appearing in dual frequency coordinates were obviously different compared with that of the other fans, indicating that the dynamic characteristics of these two fans were completely different. However, in Figure 8c, Fan34 and Fan44 have similar spectral peaks. Such differences and similarities in dynamic characteristics between individual turbines cannot be effectively identified in the time domain sequence (Figure 6), which explains why bispectrum analysis was introduced in this paper.

4.2. Results of Cluster Analysis

In this section, AHC and K-mean++ [25] were used first to obtain the different number of partitions for two characteristics of mass flow rate at the sine–Gaussian wind speed and to determine the partitioning of regions based on the CH indices in Table 2. Then, two clustering algorithms were used to obtain the different number of partitions for two other natural wind speeds with the time-domain characteristics of the mass flow rate in Table 3.
First, by setting the boundary conditions of Figure 3 as a sine–Gaussian wind speed, the mass flow rate of 56 turbines in 1800 s was obtained through transient numerical simulation. Two clustering algorithms were used to obtain partition strategies with different numbers of sub-regions based on the time and frequency domain features of the mass flow rate. The CH indices of these partitions are shown in Table 2, which shows that the CH indices of the partitioning strategy of the fan group into four subregions that had time domain features were larger than those that had frequency domain features. In the clustering results of the time domain, the CH index reached its maximum value of 228 when the fan group was divided into four sub-regions. In this result, the visualization of the partitioning strategy of the fans group into four subregions It was consistent with the law of steady-state partitioning in [11] and can be seen in Figure 9. Visualization of the partitioning strategy of the four subregions with frequency domain features is shown in Figure 9b. Considering the CH index and the symmetry of the subregion distribution, Figure 9a was chosen as the partitioning strategy of the fan group in this paper and renumbered as shown in Figure 10.
Second, to verify that the chosen partition strategy (Figure 10) could generalize natural wind speed disturbance by setting the boundary conditions of Figure 3 as Weibull and composed wind speed, two kinds of mass flow rates for 56 turbines in 1800 s were obtained through transient numerical simulation. As shown in Table 3, these were the CH indices of different results of the two cluster algorithms based on the time domain feature of mass flow rate. The results indicated that both clustering algorithms achieved the highest CH indices (252.5 and 239.17) when dividing the fan groups into four subregions. In these results, the visualizations of these two partitioning strategies are consistent with the result of Figure 10.
Figure 11 shows the visualization of the fans in the mean mass flow rate and standard deviation of mass flow rate under the three natural winds. First, it shows a significant difference between the four subregions in this section. Based on the flow characteristic analysis in Section 4.1, it could be concluded that the clustering algorithm mainly divided the fan groups based on the contribution of individual fans to the overall flow performance of the air-cooled island, where the contribution was ranked as A < B < C < D. Second, in Figure 11, the standard deviation of the mass flow rate of each fan in subregions A and B was the largest and the mass flow rate was the smallest. The fans belonging to subregions A and B were most sensitive to natural wind disturbance, and these fans were affected by both the hot air reverse flow and vortex. Finally, the standard deviation of the mass flow rate of fans belonging to subregions C and D was similar, but the mass flow rate of fans in subregion C was smaller than for subregion D. When combined with Figure 10, the fans in subregion C surrounded those in subregion D in the inner circle of the air-cooled island, effectively suppressing the influence of natural wind and the backflow on subregion D.
In this section, clustering algorithms were used to obtain partition strategies for fan groups in different types of natural wind disturbances. By comparing the time-domain and frequency-domain results with different partition numbers and evaluating the partition effects based on the CH index, the partition results were found to be the same. This confirmed that the partition strategy obtained in this section had a generalization ability for natural wind disturbances.

4.3. The Strategy of Rotational Speed Reassignment and Analysis of Results

4.3.1. Individual Regional Speed Adjustment Strategies and Results

Based on the four operating subregions A, B, C, and D shown in Figure 10, the case1 speed condition in Table 4 was the rated operating condition for the fan group, in which the four fan subregions had the same speed of 60 rpm; total power consumption was 2835 kW; and the total average air flow rate of the fan group was 21,708 kg/s.
The rotational speed of the four fan subregions was adjusted sequentially to 70 and 40 rpm according to the speed strategy listed in Table 4. To quantify the causal relationship between the fan group partitioning strategy and the cooling air flow, ηf was defined as the incremental ratio of motor power consumption to mass flow rate:
η f = Δ Q Δ P f
where ΔQ is the increment of mass flow rate after fan group speed adjustment, and ΔPf is the increment of motor power consumption after fan group speed adjustment.
Figure 12 shows the average mass flow rates of the fans in the four subregions obtained by numerical simulation after adjusting the fan speed according to Table 4. From the figure, it can be seen adjusting the rotational speed in regions A and B had less of an effect on air flow from regions C and D. When raising the rotational speed in both regions, the effect of natural wind disturbance can be suppressed. Raising the rotational speed in region C would increase the average air flow in region D, but at the same time intensifying the clustering effect and decreasing the average mass flow rate in region B. Region D had less of an effect on the performance of the other three subregions.
The increments of motor power consumption and total mass flow, and the ηf values after adjusting the speed in regions A, B, C and D are given in Table 5. It shows that the ηf values were 4.28, 3.99, 3.01, and 0.33 after the speed was increased. This indicated that increasing the rotational speed of the fans in regions A and B improved fan-group performance more effectively. When increasing the fan speed in region D, the air flow gain was small. Reducing the fan speed in regions A, B, C, and D resulted in ηf values of 7.66, 7.06, 4.92, and 3.07, respectively. This indicated that reducing the fan speed in region D minimized the total mass flow rate loss of the fan group. In conclusion, when the mass flow rate of the fan group needed to be increased, priority was given to increasing fan speed in region A and B. When it was necessary to reduce the energy consumption of an ACC, priority was given to reducing fan speed in region D.

4.3.2. Power Consumption Invariant Speed Adjustment Strategy and Results

According to the rule in Section 4.3.1, the total power consumption of the motor cluster was constantly maintained, and the subregions’ speeds were further adjusted according to the strategy shown in Table 6. The average mass flow rate of the fan cluster was obtained as shown in Figure 13, and the total mass flow rate increment of the fan group was obtained as shown in Table 7. It was shown that case13 had the best performance, in which the speed of regions A and B was raised to 70 rpm while the speed of region D was reduced to 46.89 rpm. The total average air flow rate of the fan group increased by 677 kg/s. As a result, increasing fan speed in the region with the greatest improvement in fan-group performance, and reducing fan speed in the region that had the least impact on performance loss can maximize overall performance of the fan group driving the air flow.

5. Conclusions

In this work, the transient numerical simulation of an ACC was completed on the Sugon supercomputing platform. The flow dynamic characteristics of the fan group in three types of natural wind disturbances and 12 different speed strategies were analyzed. The following conclusions were drawn:
  • It was found that the fan flow rate varied synchronously with wind speed according to the time domain analysis of the air flow rate of the fan group. The dynamic response of the fan group to the random disturbance of natural wind was a time-varying nonlinear process according to the bispectral analysis.
  • A fan group partition strategy was proposed by a clustering algorithm based on the numerical simulation results in three types of natural winds, and the average CH index was 236.88. This partition strategy had an excellent generalization ability for different natural wind disturbances.
  • After the clustering algorithm determined the fan group partition strategy, the ηf values obtained from adjusting the fan speed in individual regions were found to maximize fan cluster performance by preferentially suppressing natural wind disturbance and reducing the fan speed on the leeward side. Further, the maximum increased total average mass flow rate of 677 kg/s was achieved by keeping the fan group’s power consumption unchanged through a cooperative speed adjustment of the fan group subregions, which verified the feasibility of the energy-saving operation of an ACC partition.
The proposed strategy of the speed assignment of the fan group provided a direct simulation result basis for the optimal energy-saving operation of an air-cooled island in a thermal power unit. However, owing to the time limitation of computing resources, the partitioned operation of a fan group under the continuous dynamic adjustment of a rotational speed was not simulated, and the partition strategy under the simultaneous disturbance of natural wind speed and direction was not proposed. This will be the focus of a future study.

Author Contributions

Conceptualization, G.Z. and H.D.; methodology, G.Z. and H.D.; software, G.Z.; validation, G.Z; formal analysis, G.Z; investigation, G.Z. and W.W.; resources, H.D.; data curation, G.Z. and W.W.; writing—original draft preparation, G.Z.; writing—review and editing, H.D. and Y.C.; visualization, G.Z. and W.W.; supervision, H.D. and Y.C.; project administration, H.D.; funding acquisition, H.D. All authors have read and agreed to the published version of the manuscript.

Funding

This research was funded by The Optimization and Operation of Air-Cooled Condenser for Unit 1 of Baicheng Power Plant (Grant No. 410011JX20200024).

Data Availability Statement

Not applicable.

Conflicts of Interest

The authors declare no conflict of interest.

References

  1. Fu, Y.; Lei, Y.; Liu, M.; Wang, J.; Yan, J. Performance Evaluation on Multi-Pressure Cold-End Systems of Thermal Power Plants with Different Inlet temperatures. Proc. CSEE 2022, 42, 229–238. (In Chinese) [Google Scholar]
  2. Deng, H.; Liu, J. Performance Prediction of Finned Air-Cooled Condenser Using a Conjugate Heat-Transfer Model. Appl. Therm. Eng. 2019, 150, 386–397. [Google Scholar] [CrossRef]
  3. Liu, L.; Du, X.; Xi, X.; Yang, L.; Yang, Y.; Xu, Z. Experiments on Divisional Regulation of Fan Cluster for Direct Air-Cooled Power Generating Units. Proc. CSEE 2013, 33, 71–77. (In Chinese) [Google Scholar]
  4. Huang, W. Performance Optimization of Direct Dry Cooling System Based on Flow Field Organization of Fan Array in Power Station. Ph.D. Thesis, North China Electric Power University, Beijing, China, 2021. [Google Scholar]
  5. Huang, W.; Chen, L.; Yang, L.; Du, X. Energy-Saving Strategies of Axial Flow Fans for Direct Dry Cooling System. Energies 2021, 14, 3176. [Google Scholar] [CrossRef]
  6. Luo, Z.; Liu, J.; Huusom, J.K. Energy-efficient operation of a direct air-cooled condenser based on divisional regulation. Int. J. Refrig. 2021, 132, 233–242. [Google Scholar] [CrossRef]
  7. Xiao, L.; Ge, Z.; Du, X.; Yang, L.; Xu, Z. Operation of air-cooling CHP generating unit under the effect of natural wind. Appl. Therm. Eng. 2016, 107, 827–836. [Google Scholar] [CrossRef]
  8. Zhou, L.; Qiao, J.; Zhang, S. Numerical simulation research on the economic operation of the fan cluster for air-cooled island. J. North China Electr. Power Univ. Nat. Sci. Ed. 2011, 38, 61–65. (In Chinese) [Google Scholar]
  9. Li, J.; Bai, Y.; Li, B. Operation of air cooled condensers for optimized back pressure at ambient wind. Appl. Therm. Eng. 2018, 128, 1340–1350. [Google Scholar] [CrossRef]
  10. Li, J.; Li, B.; Wan, X.; Zhang, C. Research on the Operating Method of Back Pressure of Direct Air-Cooled Unit Based on CFD and Grey Correlation. Proc. CSEE 2017, 37, 5049–5057. (In Chinese) [Google Scholar]
  11. Bai, Y.; Li, J.; Zhang, C.; Wan, X. Numerical Simulation Divisional Study of Direct Air-Cooled Units Based on Cluster Analysis. J. North China Electr. Power Univ. Nat. Sci. Ed. 2019, 46, 91–102. (In Chinese) [Google Scholar]
  12. Lee, D.-U.; Villasenor, J.; Luk, W.; Leong, P. A hardware Gaussian noise generator using the Box-Muller method and its error analysis. IEEE Trans. Comput. 2006, 55, 659–671. [Google Scholar] [CrossRef]
  13. Seguro, J.V.; Lambert, T.W. Modern Estimation of the Parameters of the Weibull Wind Speed Distribution for Wind Energy Analysis. J. Wind Eng. Ind. Aerodyn. 2000, 85, 75–84. [Google Scholar] [CrossRef]
  14. Anderson, P.M.; Bose, A. Stability Simulation Of Wind Turbine Systems. IEEE Trans. Power Appar. Syst. 1983, PAS-102, 3791–3795. [Google Scholar] [CrossRef]
  15. Sun, Y. Operation Optimization of Fans in Direct Dry Cooling System. Master’s Thesis, North China Electric Power University, Beijing, China, 2015. [Google Scholar]
  16. Orszag, S.A.; Yakhot, V.; Flannery, W.S.; Boysan, F.; Choudhury, D.; Maruzewski, J.; Patel, B. Renormalization Group Modeling and Turbulence Simulations. In Proceedings of the International Conference on Near-Wall Turbulent Flows, Tempe, AZ, USA, 15 March 1993. [Google Scholar]
  17. Doormaal, J.V.; Raithby, G.D. Enhancements of the SIMPLE Method for Predicting Incompressible Fluid Flows. Numer. Heat Transf. Appl. 1984, 7, 147–163. [Google Scholar]
  18. Barth, T.; Jespersen, D. The Design and Application of Upwind Schemes on Unstructured Meshes. In Proceedings of the 27th Aerospace Sciences Meeting, Reno, NV, USA, 9 January 1989. [Google Scholar]
  19. Rausch, R.; Yang, H.; Batina, J. Spatial Adaption Procedures on Unstructured Meshes for Accurate Unsteady Aerodynamic Flow Computation. In Proceedings of the 32nd Structures, Structural Dynamics, and Materials Conference, Baltimore, MD, USA, 8 April 1991. [Google Scholar]
  20. Johnson, S.C. Hierarchical Clustering Schemes. Psychometrika 1967, 32, 241–254. [Google Scholar] [CrossRef] [PubMed]
  21. Ward, J.H. Hierarchical Grouping to Optimize an Objective Function. J. Am. Stat. Assoc. 1963, 58, 236–244. [Google Scholar] [CrossRef]
  22. Calinski, T.; Harabasz, J. A Dendrite Method for Cluster Analysis. Comm. Stats. Theory Methods 1974, 3, 1–27. [Google Scholar] [CrossRef]
  23. Yan, K.; Liu, Y.; Xu, H.; Zhou, Y. Fault Feature Extraction of Large Steam Turbine Based on Bispectra Analysis of Vibration Signal. Proc. CSEE 2010, 30, 98–103. [Google Scholar]
  24. Kong, Z. Nonlinear Characteristics Diagnosis of Thermal Control System Based on Higher-order Statistics Analysis. Master’s Thesis, North China Electric Power University, Beijing, China, 2010. [Google Scholar]
  25. Arthur, D.; Vassilvitskii, S. K-Means++: The Advantages of Careful Seeding. In Proceedings of the Eighteenth Annual ACM-SIAM Symposium on Discrete Algorithms, Stanford, CA, USA, 7 January 2007. [Google Scholar]
Figure 1. Time-series figure of three natural wind speed models: (a) sine–Gaussian wind speed; (b) Weibull wind speed; (c) composed wind speed.
Energies 16 03717 g001
Figure 2. Axial flow fan numbering graph.
Energies 16 03717 g002
Figure 3. Three-dimensional numerical calculation domain model of 8 × 7 air-cooled island of 660 MW unit: (a) computational domain and boundary conditions; (b) ACCs.
Energies 16 03717 g003
Figure 4. Comparison between CFD data and experimental data.
Energies 16 03717 g004
Figure 5. The average mass flow rate of fans in three wind models: (a) sine–Gaussian wind speed; (b) Weibull wind speed; (c) composed wind speed.
Energies 16 03717 g005
Figure 6. Horizontal streamlines and temperature contour of ACC at 1000 s in three wind models: (a) sine–Gaussian wind speed; (b) Weibull wind speed; (c) composed wind speed.
Energies 16 03717 g006
Figure 7. The time series of fan air flow in the fourth column under three wind models: (a) sine–Gaussian wind speed; (b) Weibull wind speed; (c) composed wind speed.
Energies 16 03717 g007
Figure 8. The fourth column fans bispectrum amplitude graph under three wind models: (a) sine–Gaussian wind speed; (b) Weibull wind speed; (c) composed wind speed. The spectral peaks in the figure are surrounded by equal amplitude lines.
Energies 16 03717 g008aEnergies 16 03717 g008b
Figure 9. The fan group is divided into four subregions: (a) the partitioning strategy under time domain; (b) the partitioning strategy under frequency domain. The same color means that the fans are in the same subregion.
Energies 16 03717 g009
Figure 10. Numbers of four subregions. The same color means that the fans are in the same subregion, and A, B, C and D are the names of the four subregions.
Energies 16 03717 g010
Figure 11. Results of clustering algorithm in four subregions under three natural wind speeds: (a) sine–Gaussian wind speed; (b) Weibull wind speed; (c) composed wind speed. A, B, C and D are the names of the four subregions in Figure 9.
Energies 16 03717 g011
Figure 12. The average mass flow rate of four regions for the case of single partition speed regulation.
Energies 16 03717 g012
Figure 13. Average mass flow rate of the four subregions for the power consumption invariant case.
Energies 16 03717 g013
Table 1. Performance specification of fans.
ParameterValue
Number of fans56
Fan diameter (m)9.144
Rotational speed of fan (r/min)80
Volumetric flow rate (m3/s)540
Total power consumption of axial flow fans (kW)6720
Total pressure of fan (Pa)100
Table 2. The CH index of time and frequency feature clustering results under the sine–Gaussian wind speed. “T” represents the results of time domain features, and “F” represents the results of frequency domain feature.
Type of ResultNumber of Subregions
3456
T-Kmeans++184.50228.00213.02202.34
F-Kmeans++152.95135.45127.51129.04
T-AHC184.50215.51198.82202.34
F-AHC142.15125.68116.50116.79
Table 3. The CH value of different clustering algorithms under two natural wind speeds. “W” represents the results under Weibull wind speed, and “C” represents the results under composed wind speed.
Type of ResultNumber of Subregions
3456
W-Kmeans++191.72239.17228.71214.10
W-AHC184.11239.17228.71214.10
C-Kmeans++221.53252.50229.92224.81
C-AHC221.53246.94223.83217.62
Table 4. Adjusting the speed distribution of a single partition.
CaseRotational Speed of A Subregion (rpm)Rotational Speed of B Subregion (rpm)Rotational Speed of C Subregion (rpm)Rotational Speed of D Subregion (rpm)
case160606060
case270606060
case340606060
case460706060
case560406060
case660607060
case760604060
case860606070
case960606040
Table 5. The ΔPf, ΔQ, and ηf for the single partition speed regulation.
CaseTotal Average Mass Flow Rate (kg/s)ΔPf (kW)ΔQ (kg/s)ηf
case121,708
case222,727238.0810194.28
case319,525−285.04−21837.66
case422,658238.089503.99
case519,697−285.04−20117.06
case623,677654.7219693.01
case717,853−783.86−38544.92
case821,887535.61790.33
case919,742−641.34−19663.07
Table 6. Fan speed distribution under unchanged power consumption.
CaseThe Rotational Speed of A Subregion (rpm)The Rotational Speed of B Subregion (rpm)The Rotational Speed of C Subregion (rpm)The Rotational Speed of D Subregion (rpm)
case1070606054.26
case1160706054.26
case12707049.8260
case1370706046.89
Table 7. Total average mass flow rate and increment of the power consumption invariant case.
CaseTotal Average Mass Flow Rate (kg/s)ΔQ (kg/s)
case121,708
case1022,137430
case1122,070362
case1221,76456
case1322,385677
Disclaimer/Publisher’s Note: The statements, opinions and data contained in all publications are solely those of the individual author(s) and contributor(s) and not of MDPI and/or the editor(s). MDPI and/or the editor(s) disclaim responsibility for any injury to people or property resulting from any ideas, methods, instructions or products referred to in the content.

