
Investigation on Effective Thermal Conductivity of Fibrous Porous Materials as Vacuum Insulation Panels’ Core Using Lattice Boltzmann Method

Abstract
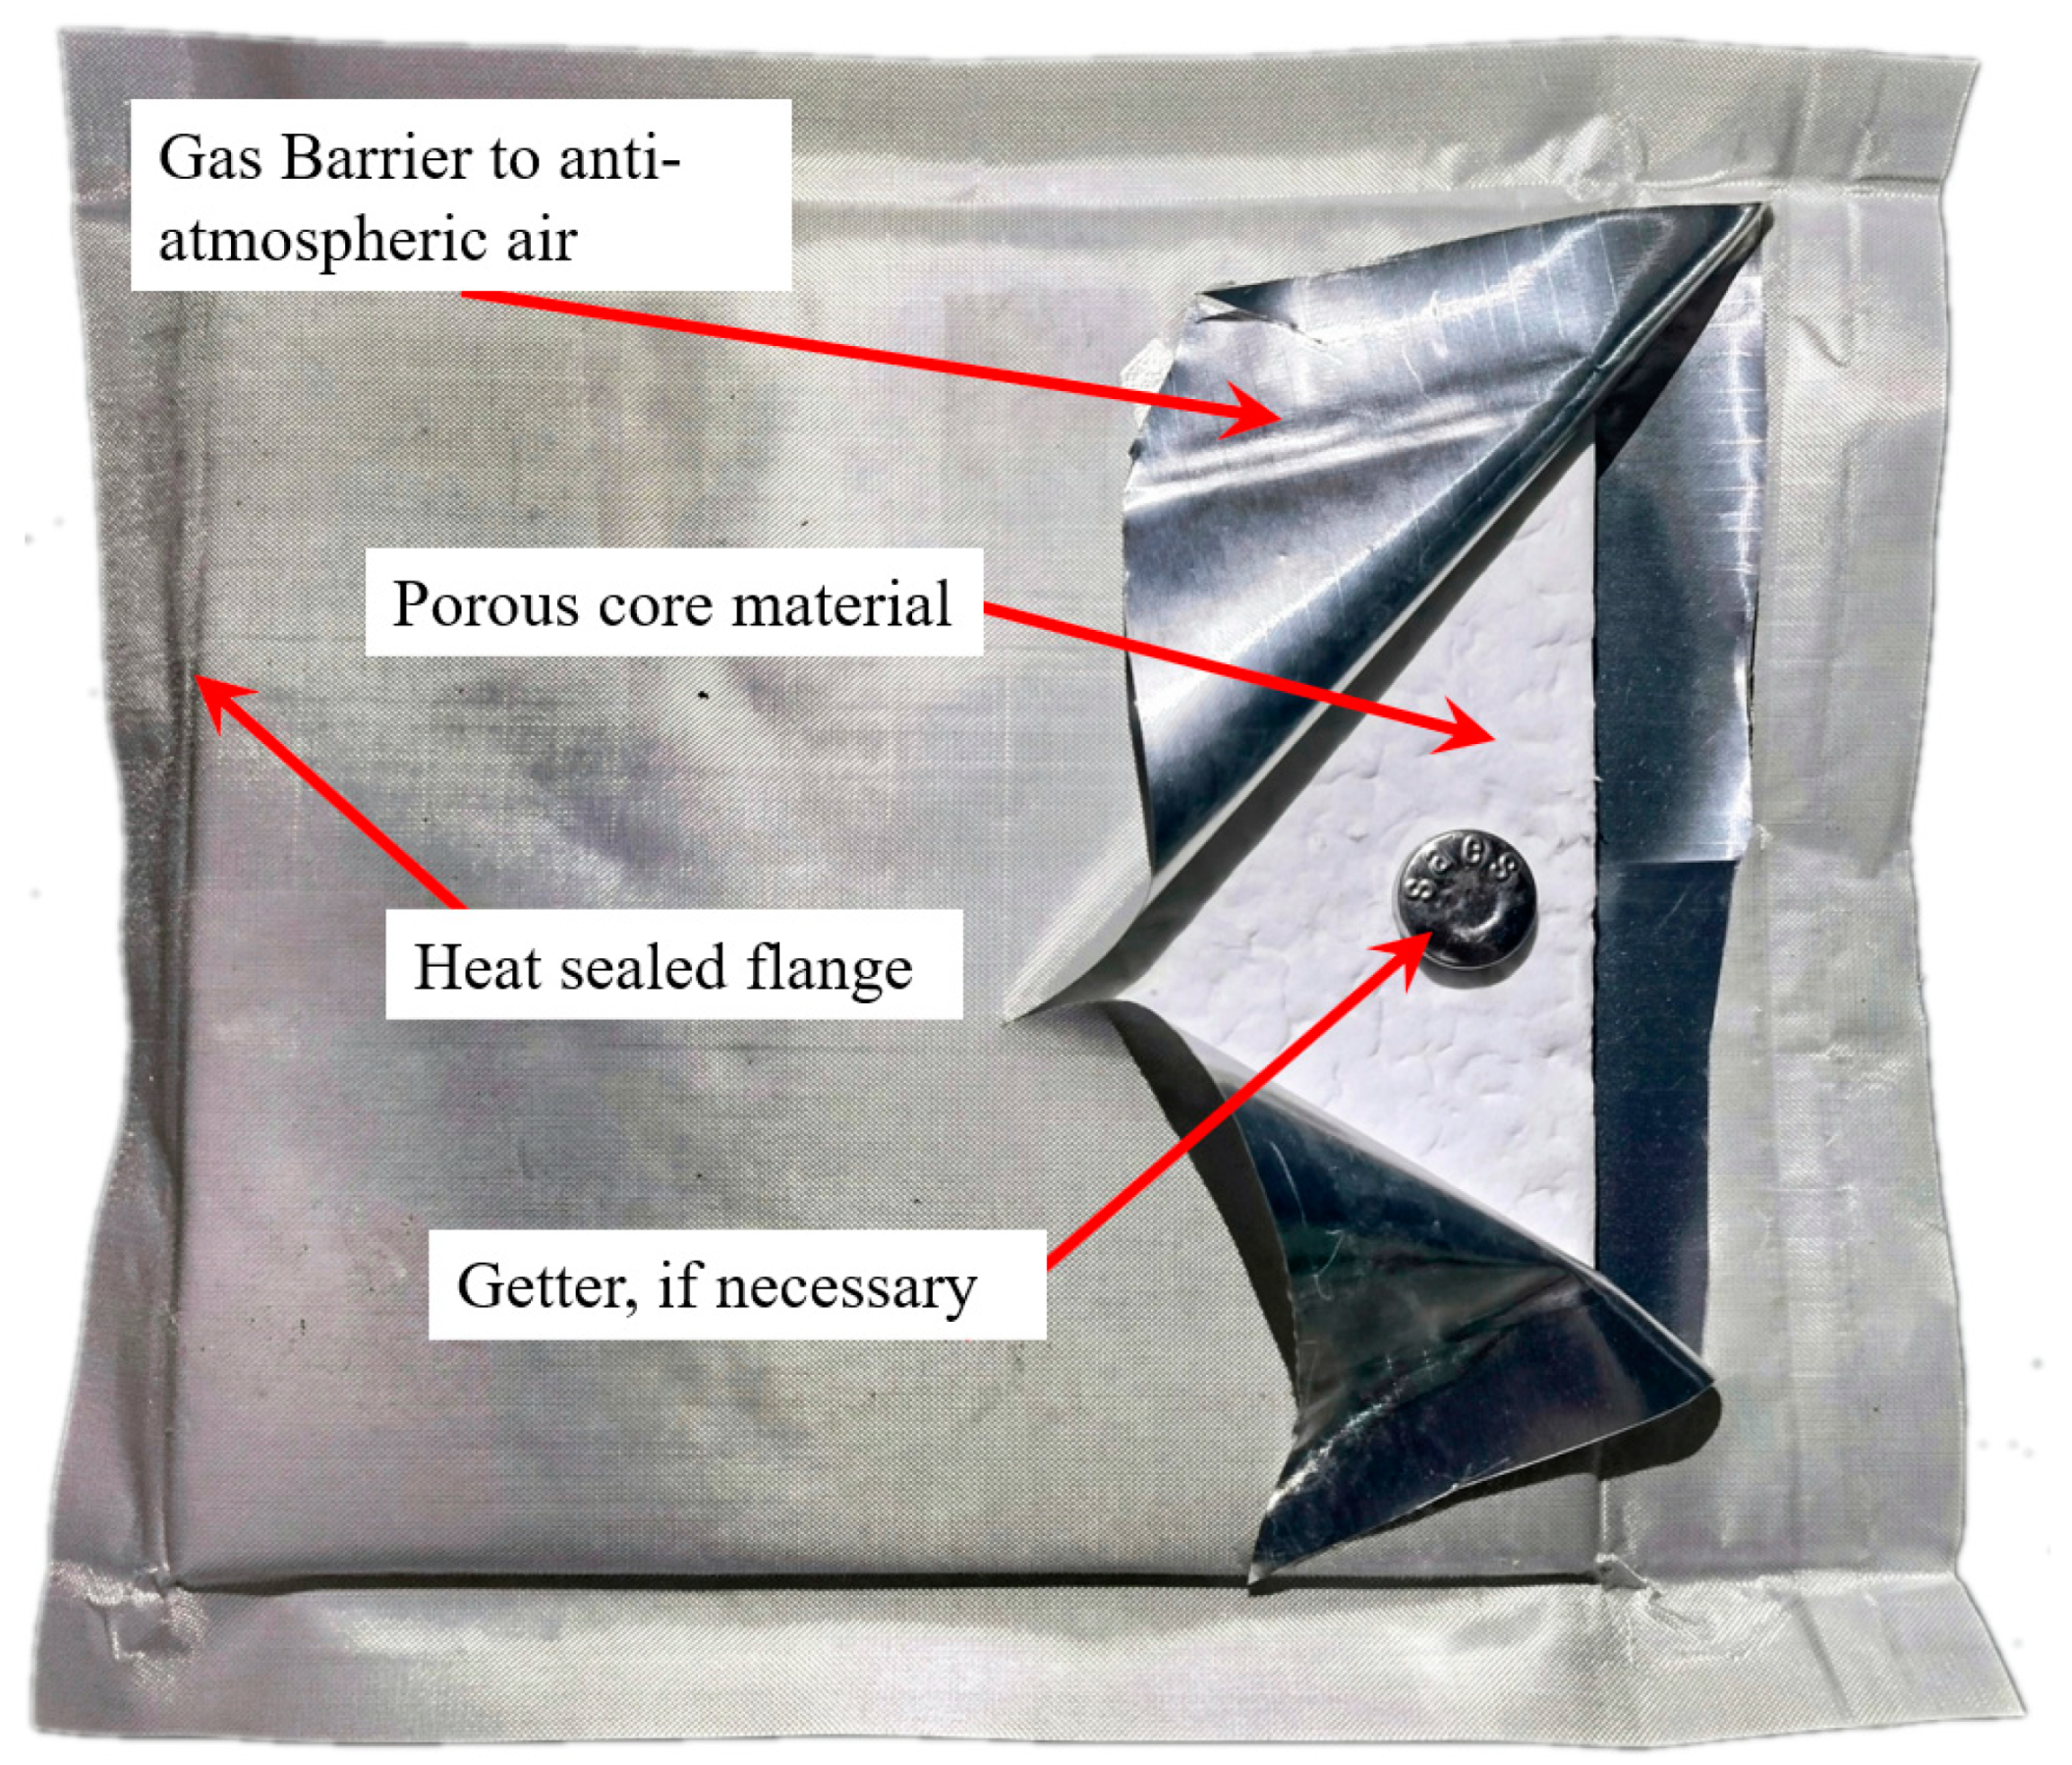
:1. Introduction
2. Model and Methods
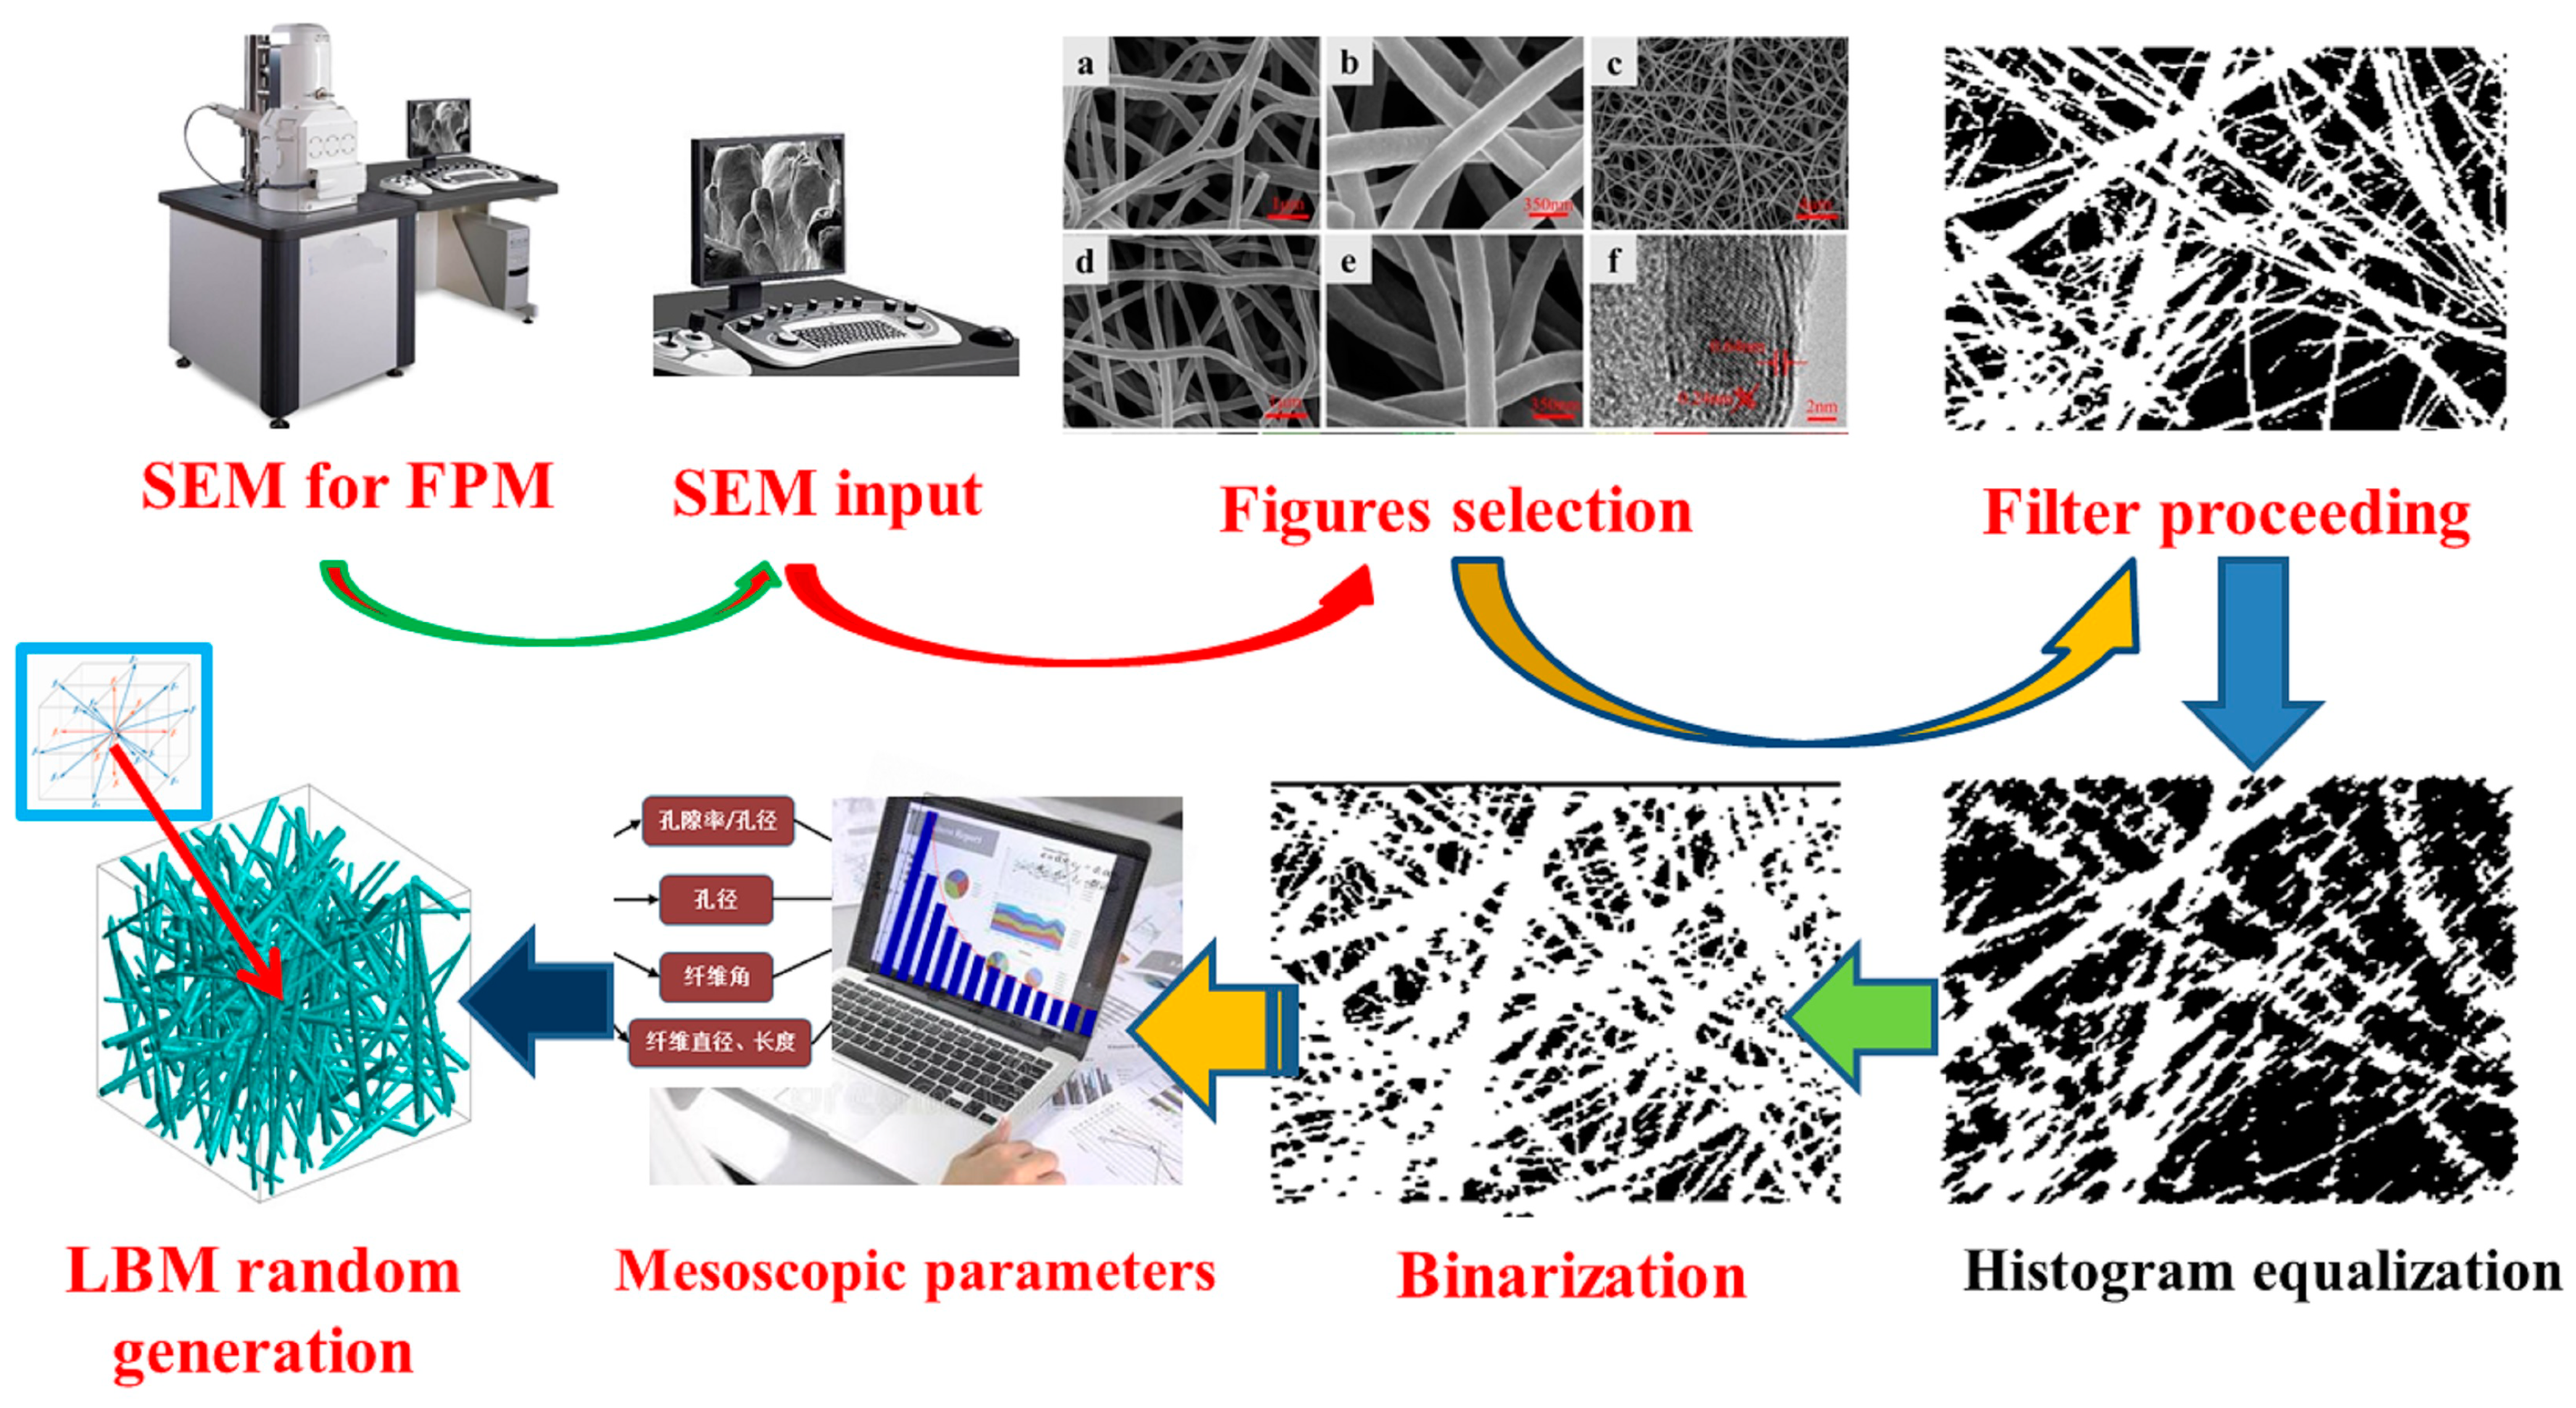
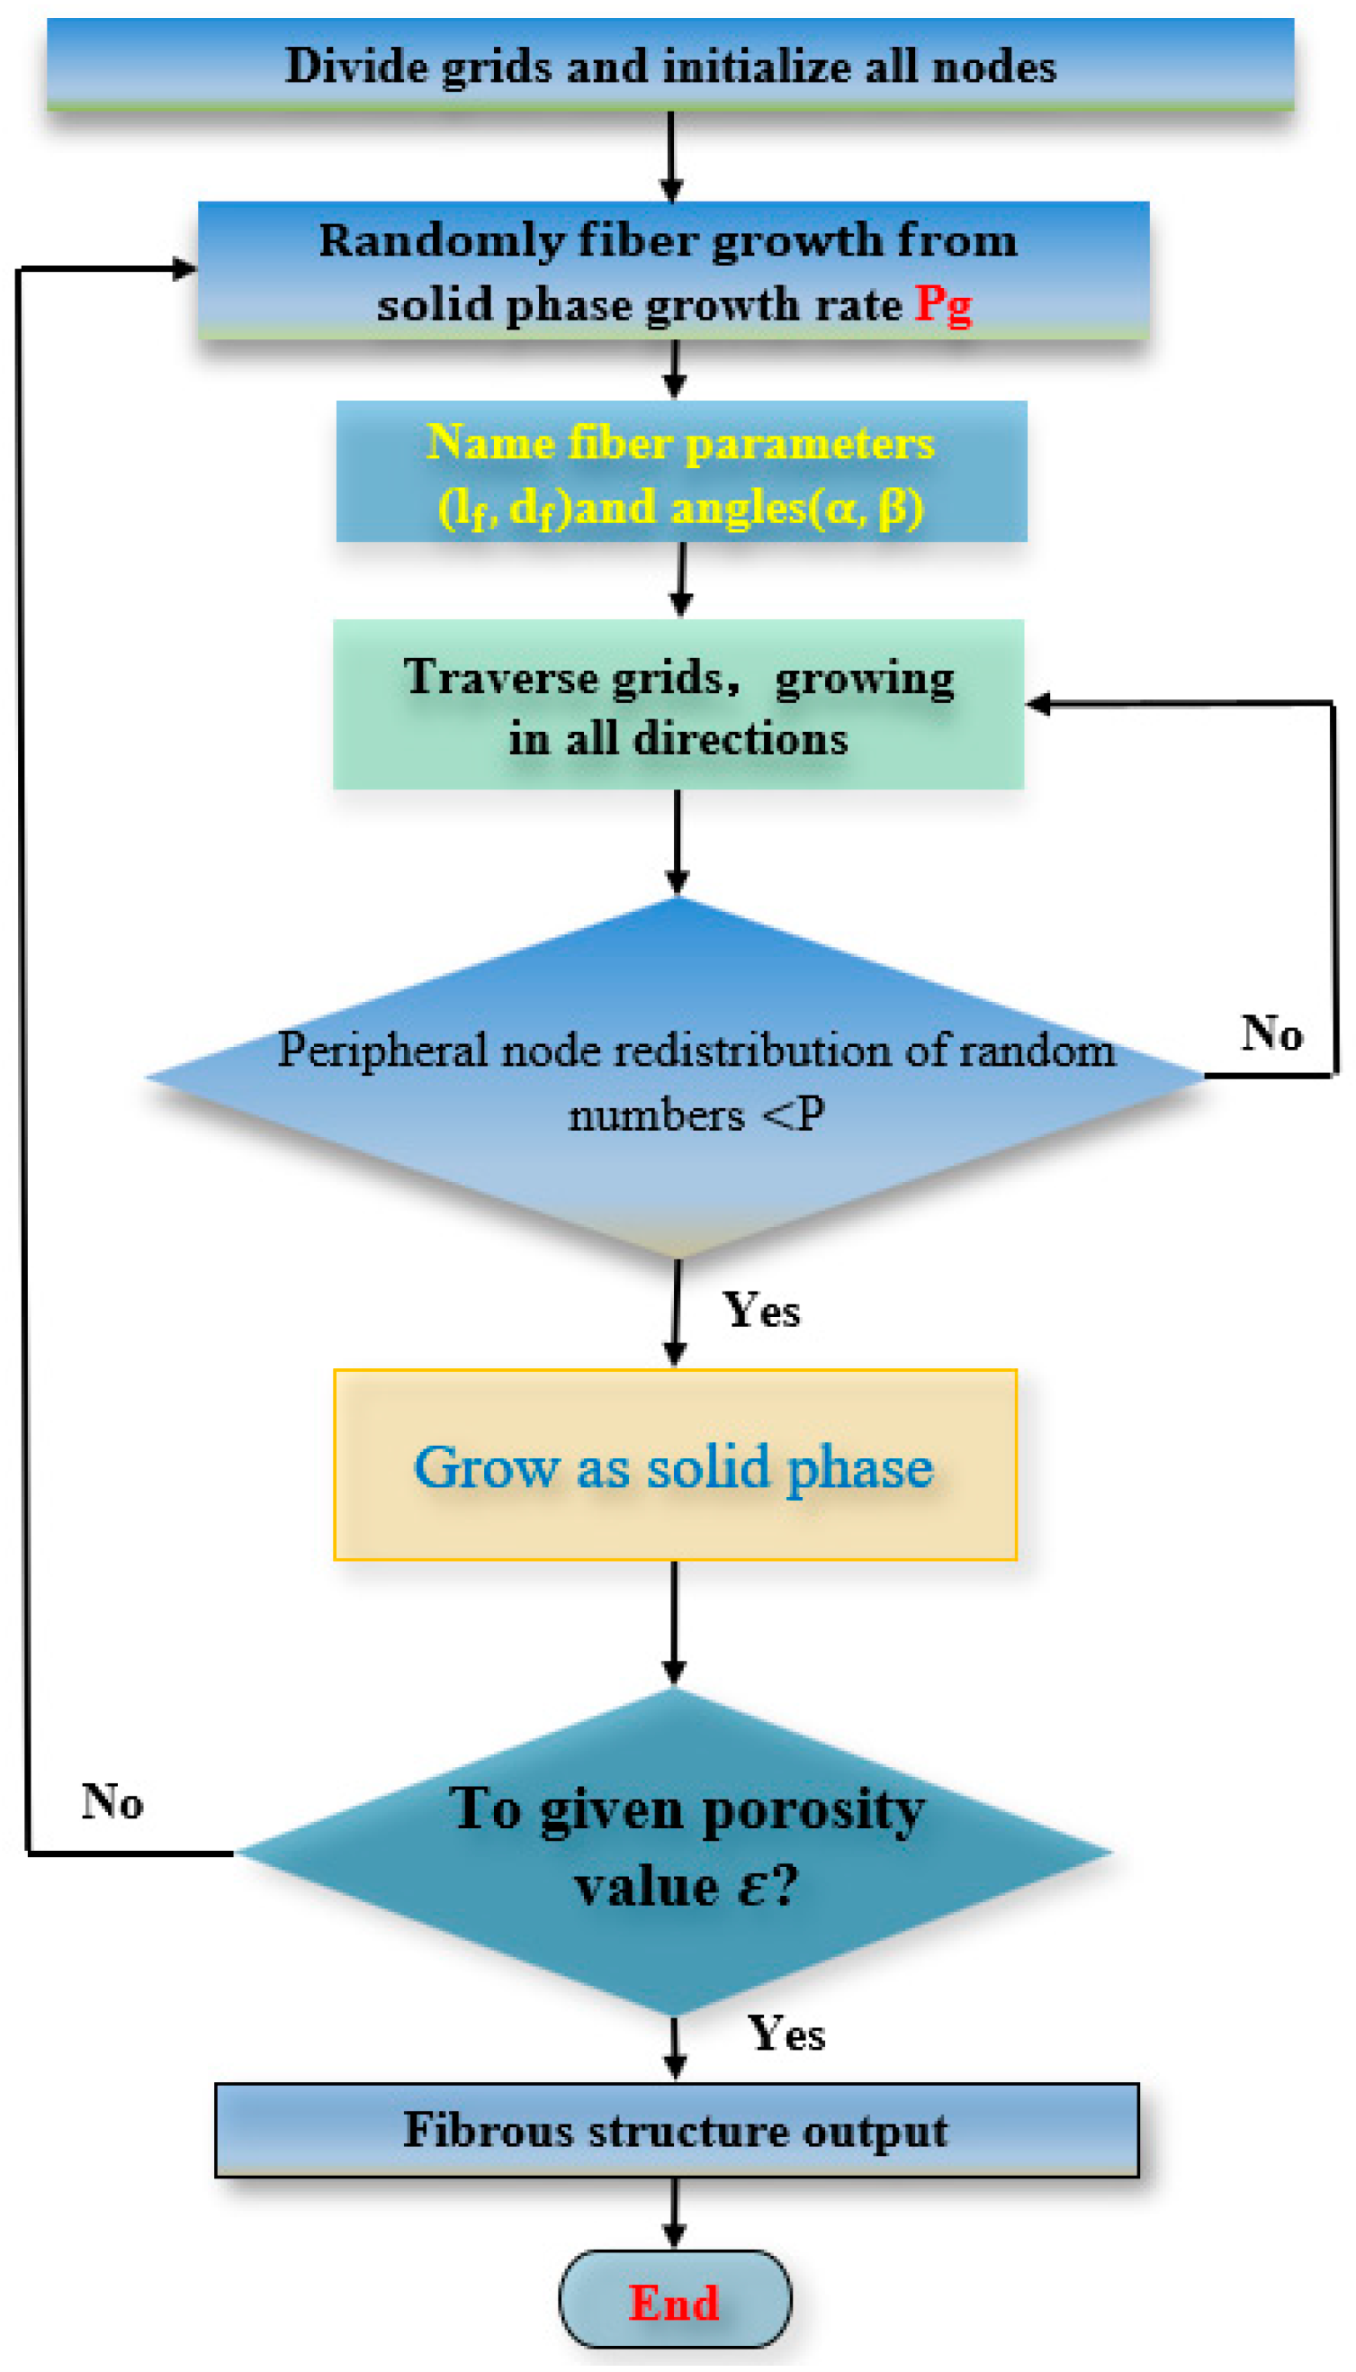
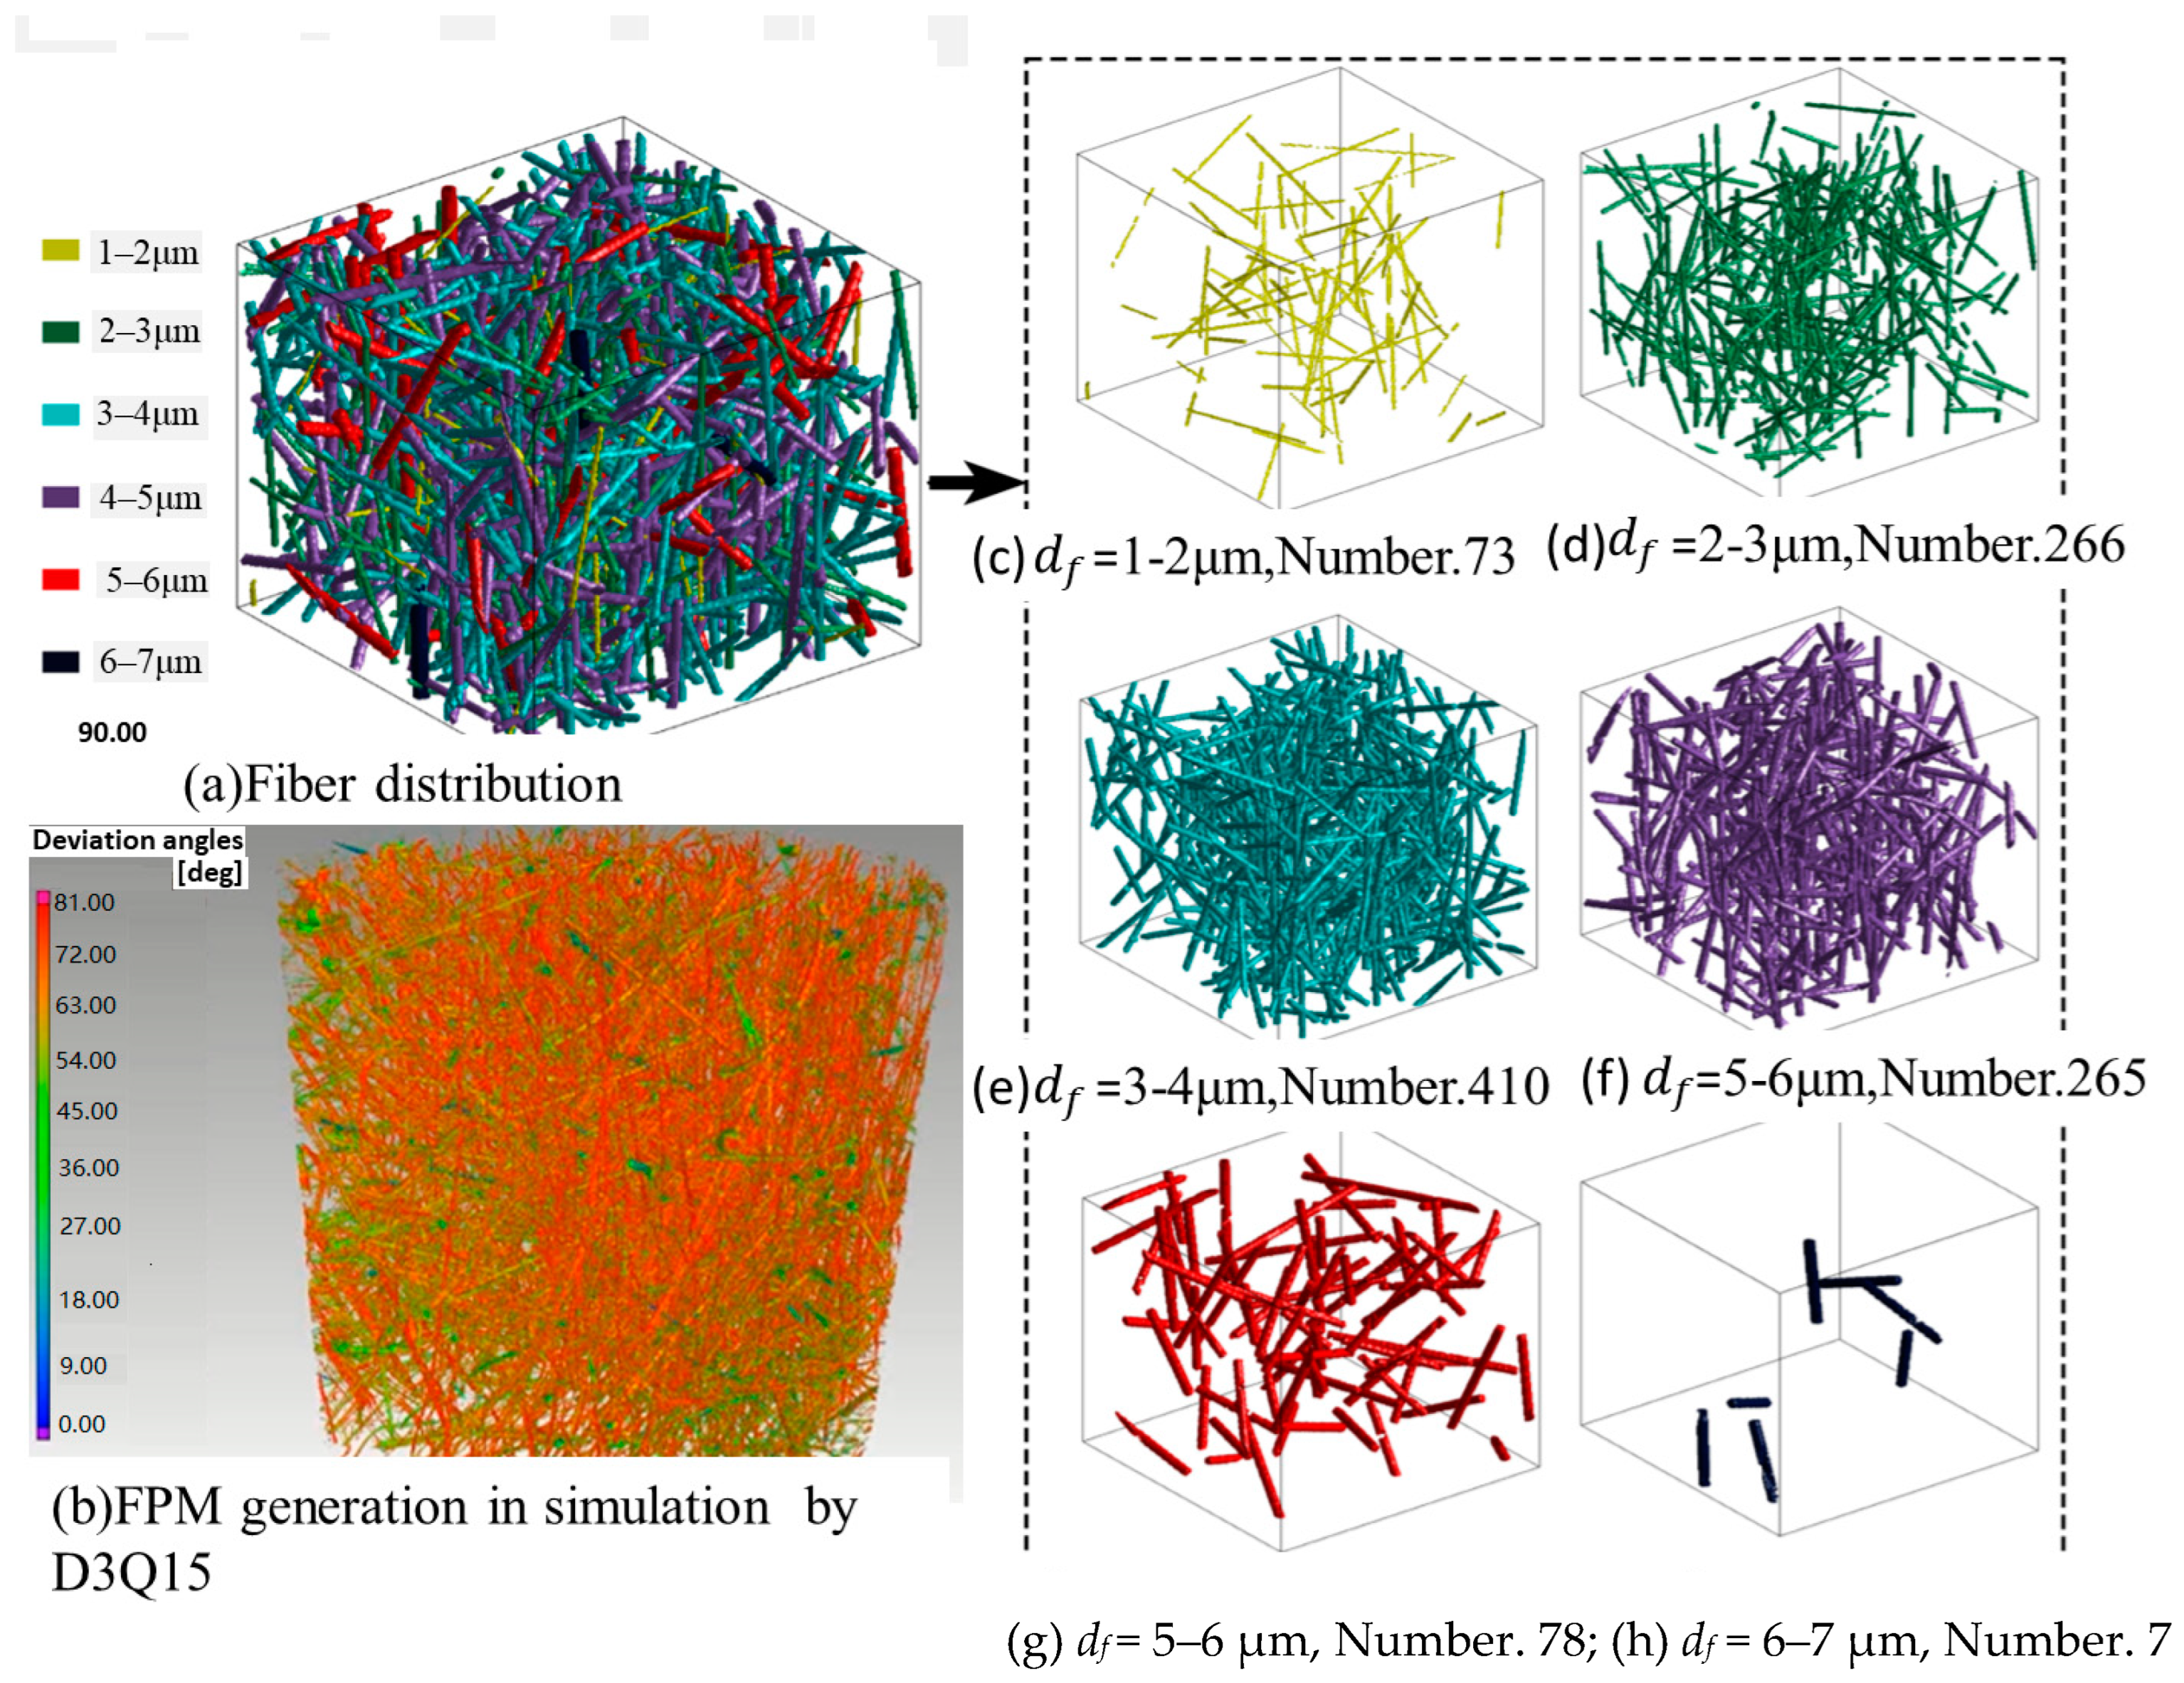
2.1. Geometry Generation Approach
2.2. ETC with LBM in Simulation
2.2.1. Energy Equations
2.2.2. Radiation Equations
2.2.3. ETC
2.3. Variables in Simulation
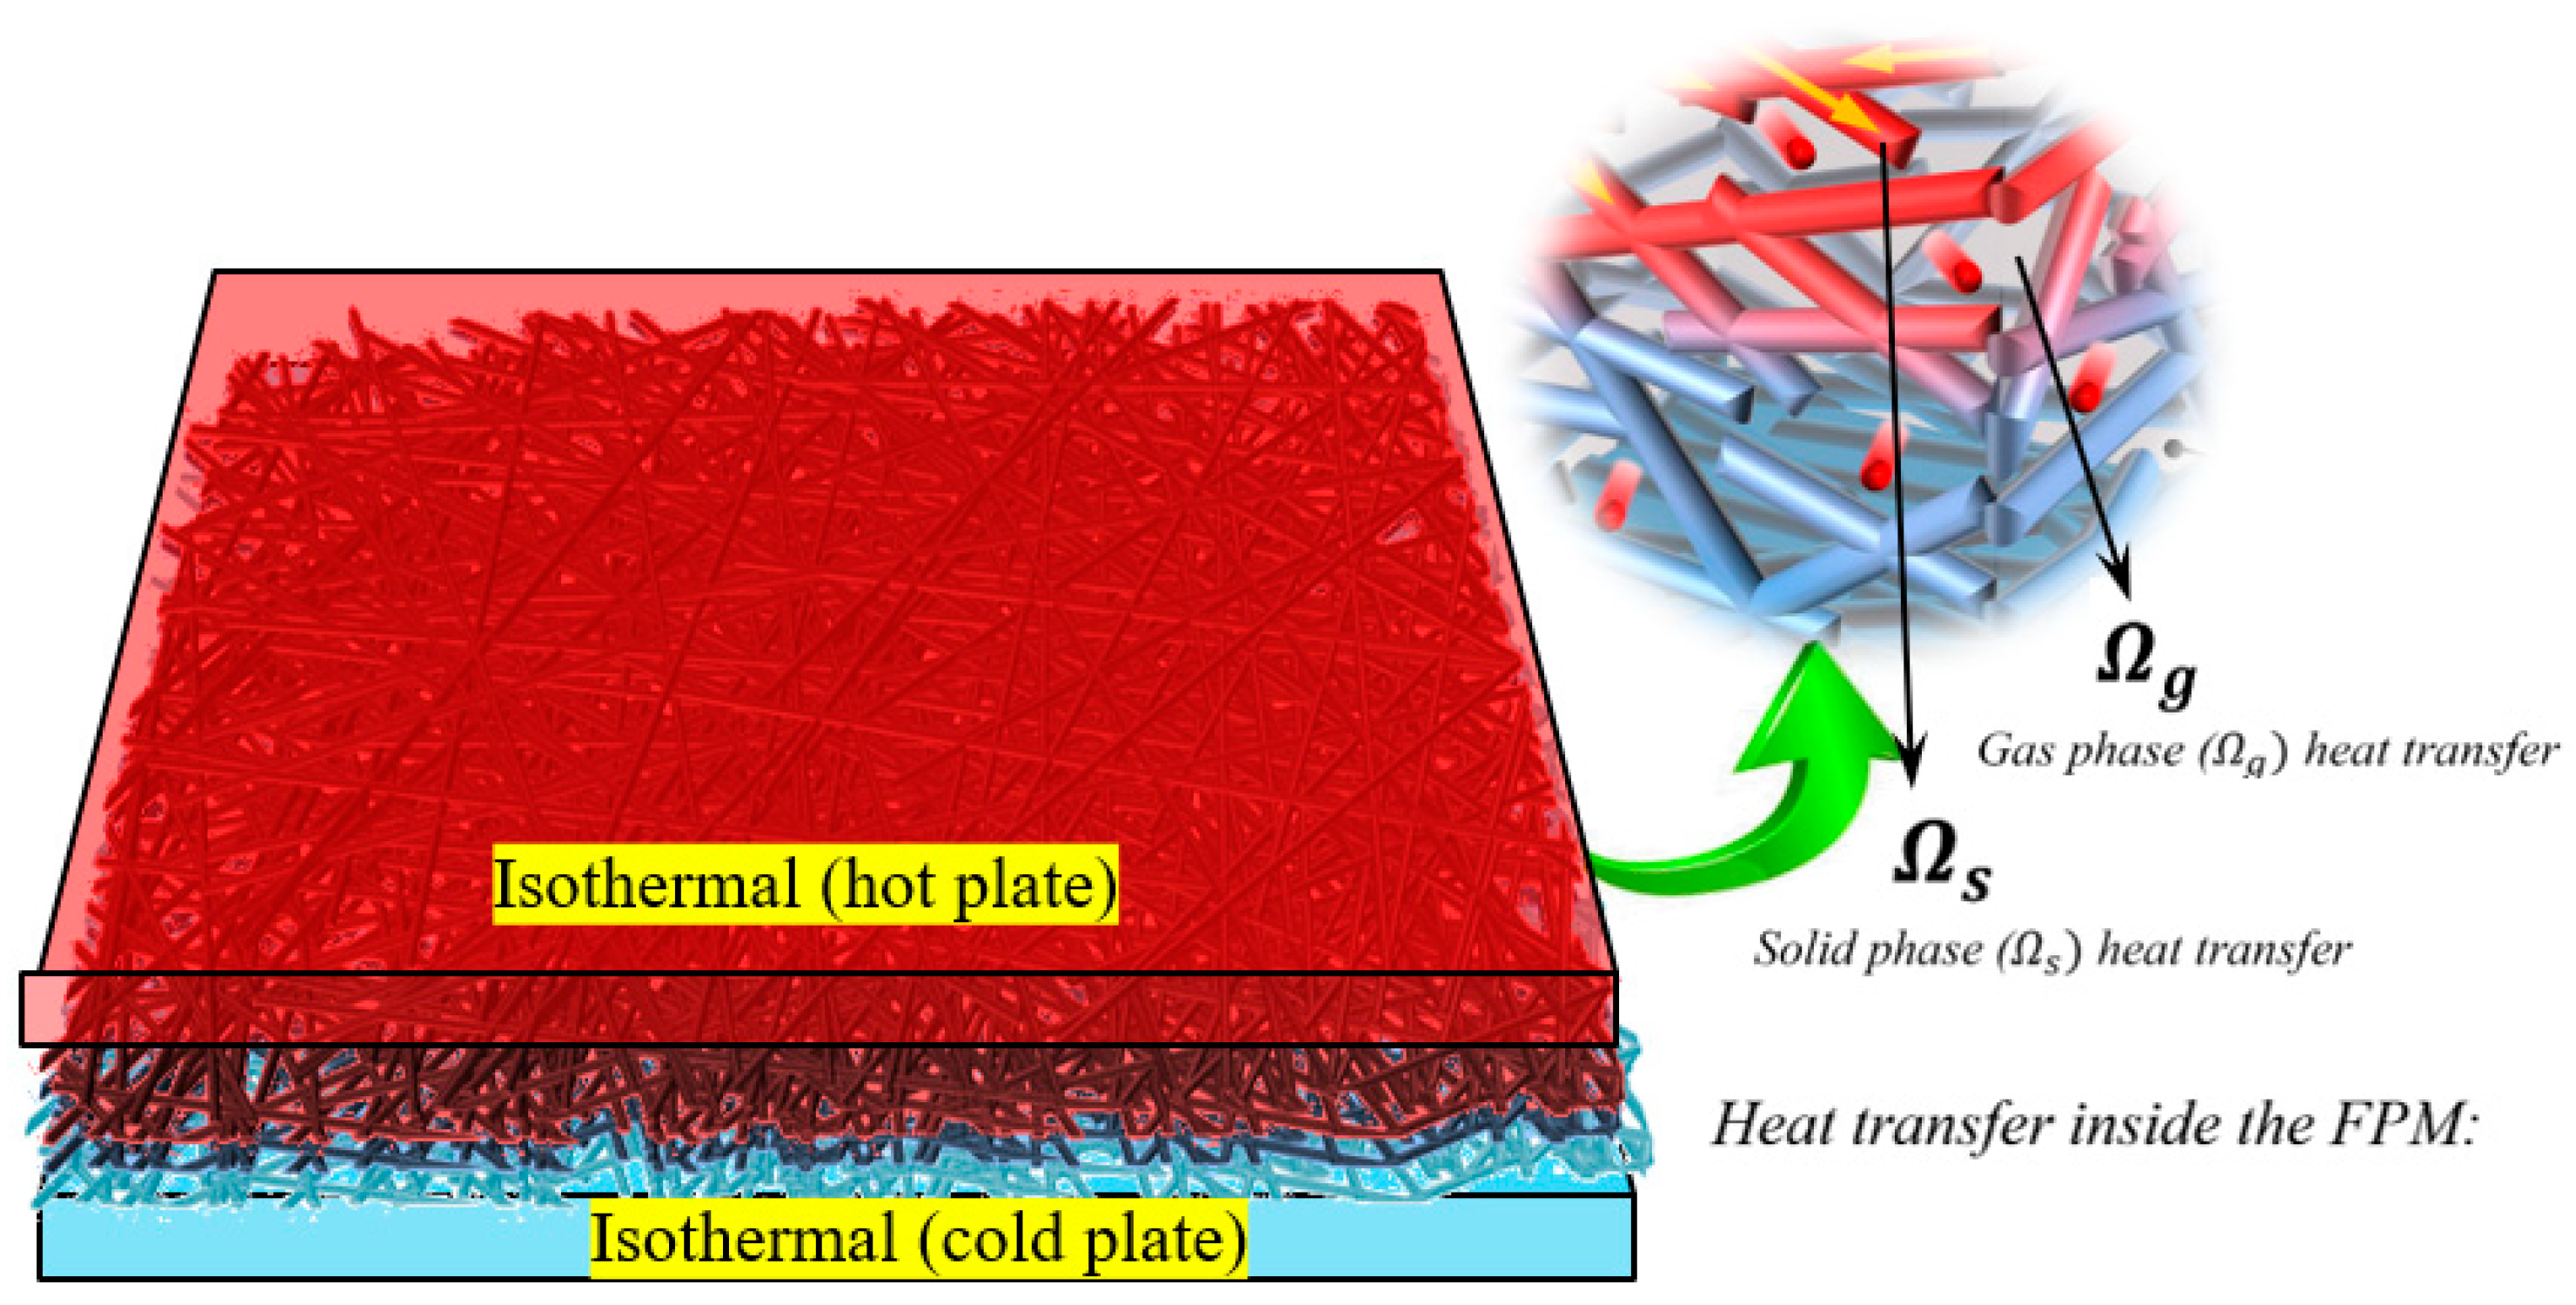
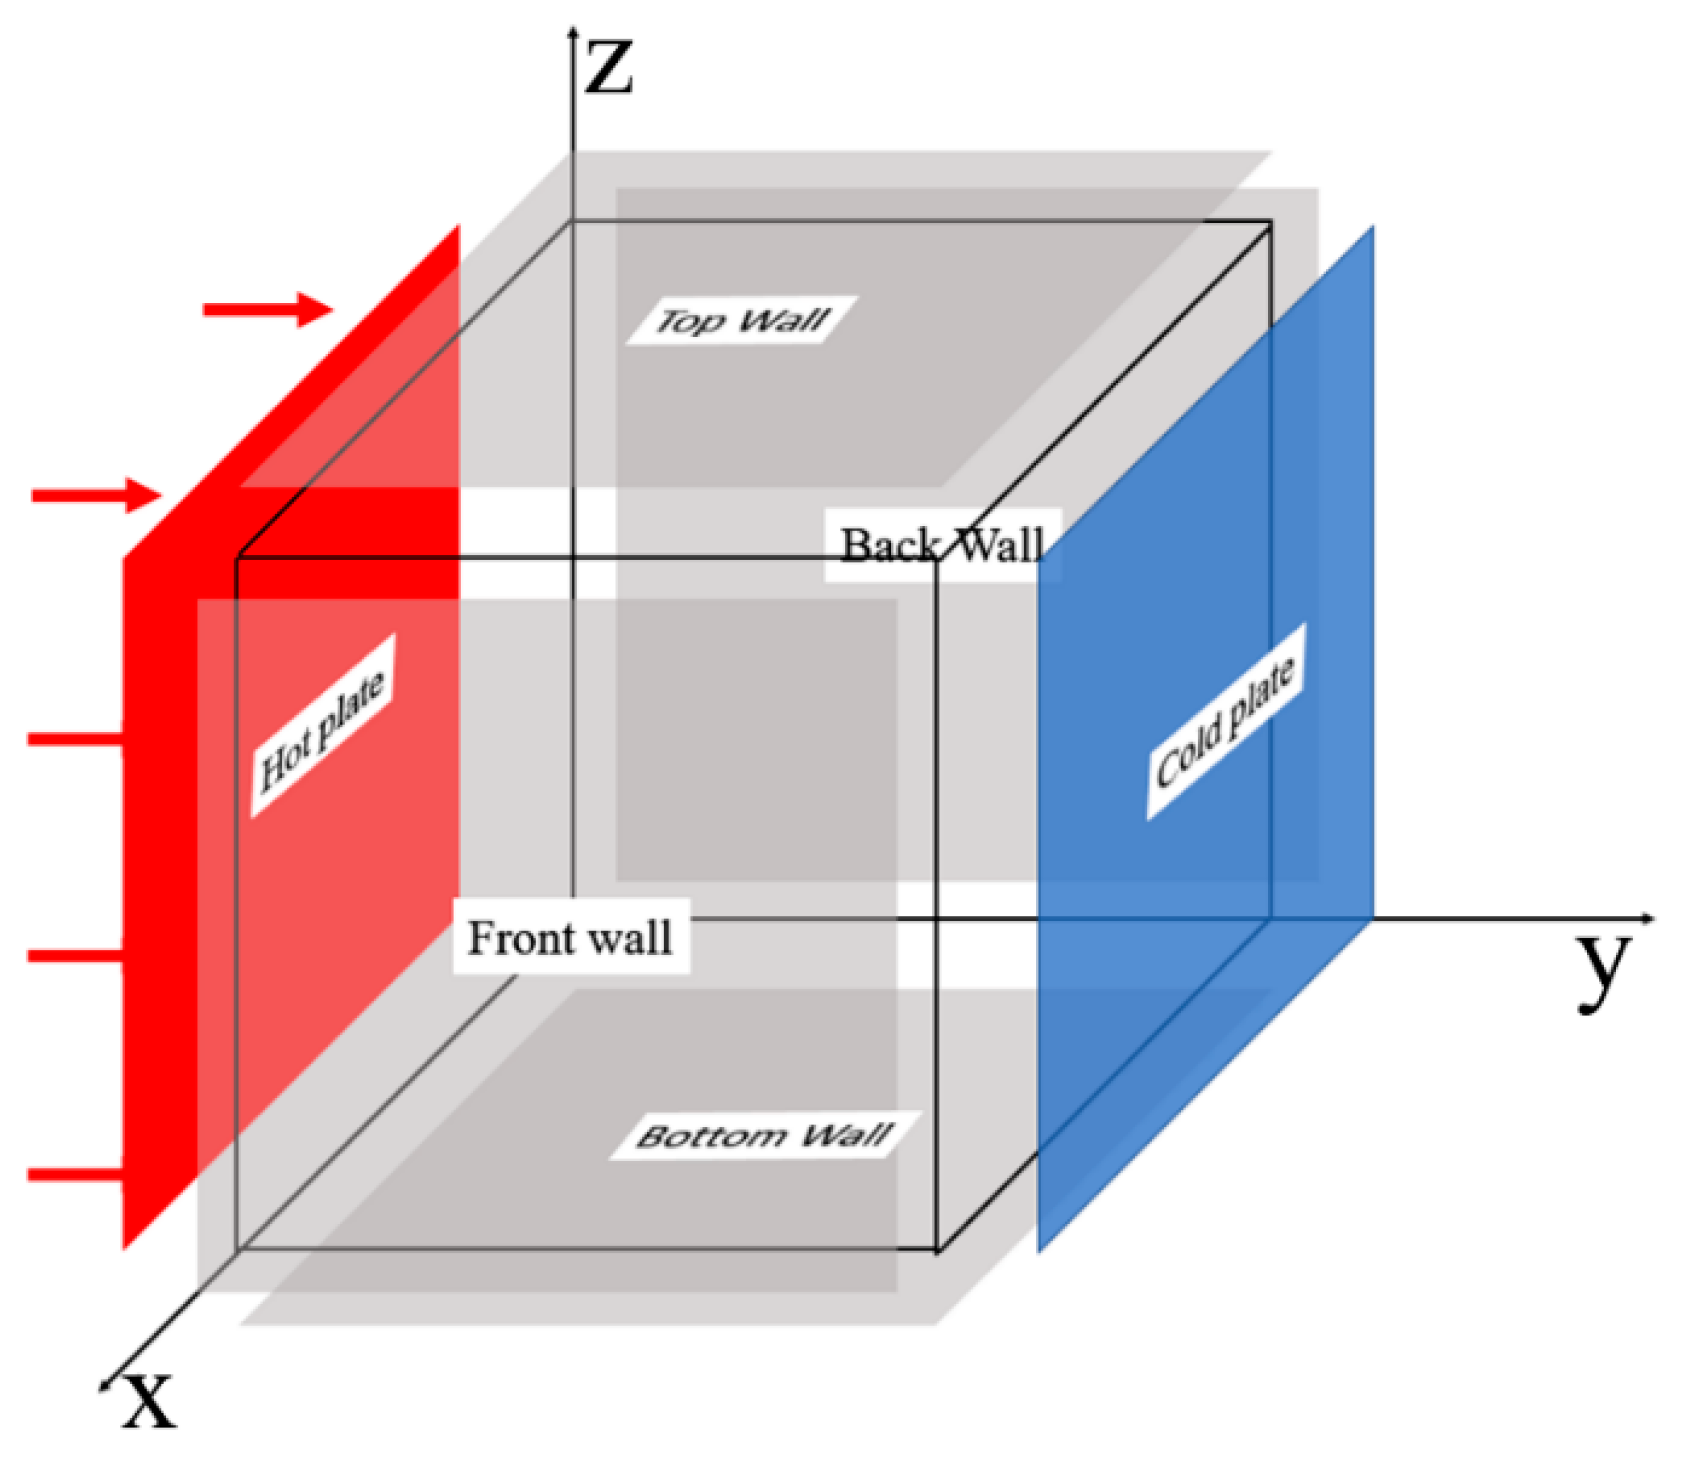
2.4. Thermal Boundary
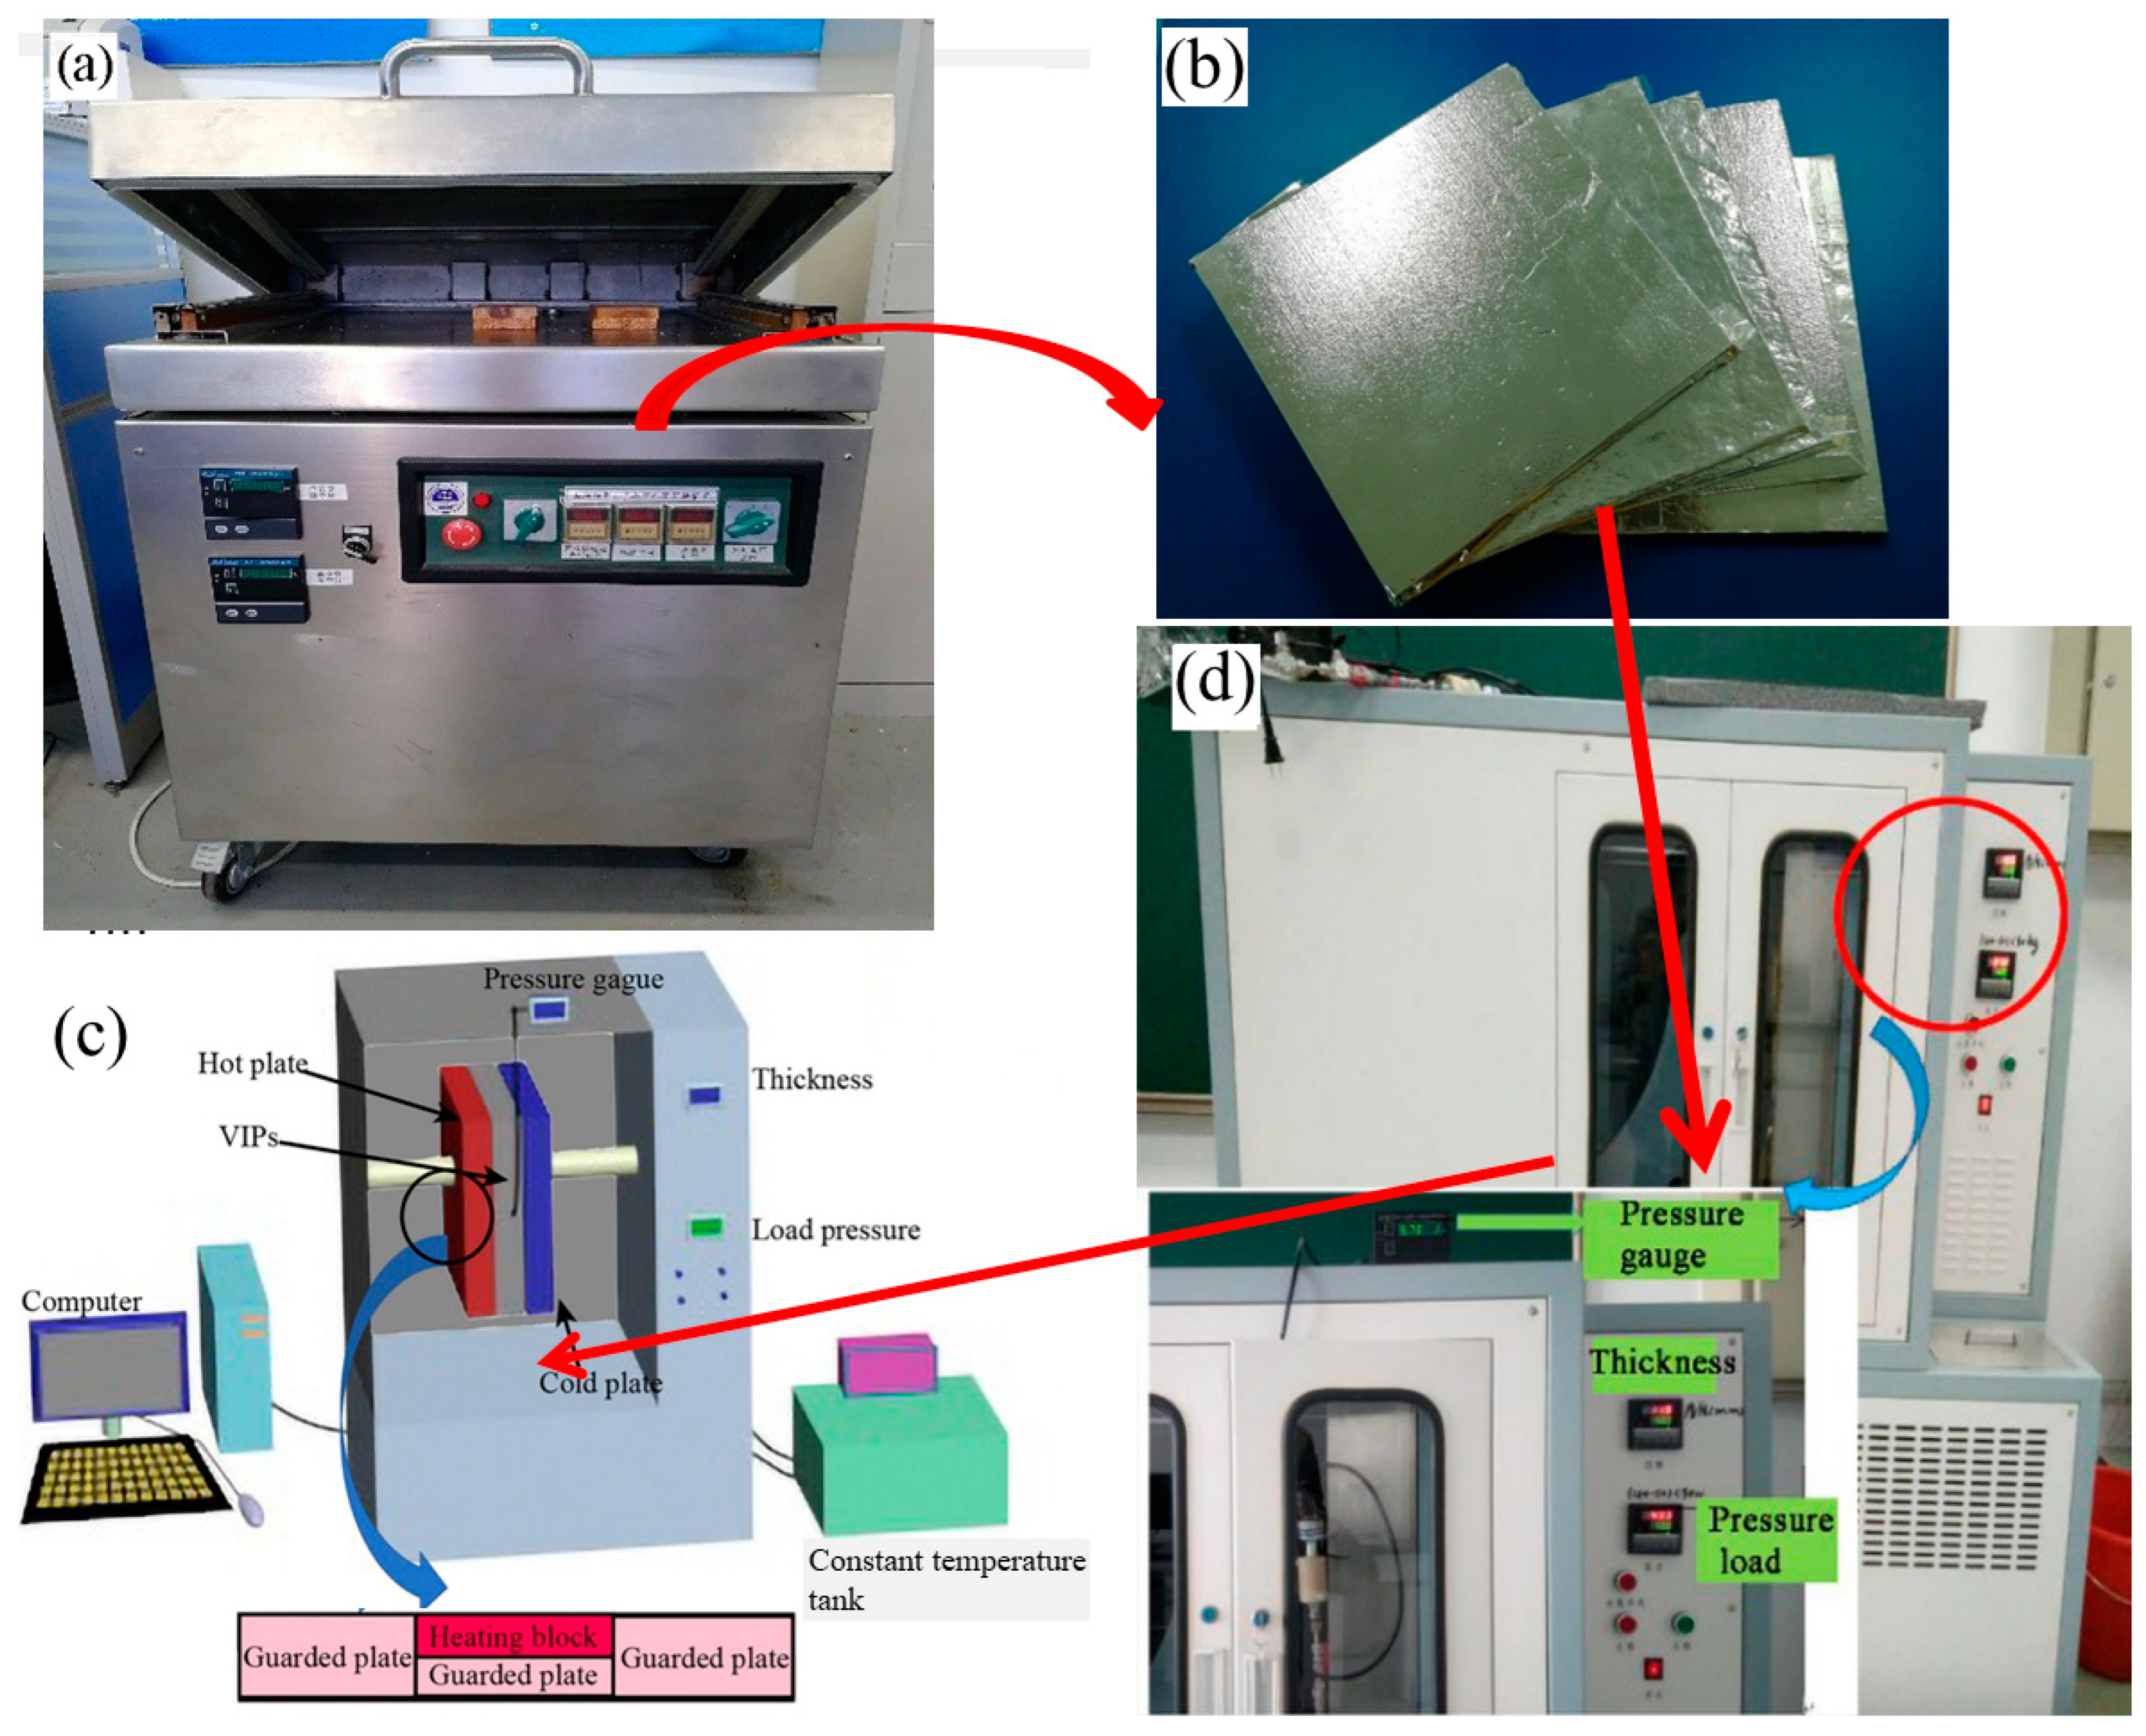
2.5. Measurement Device
3. Results and Discussion
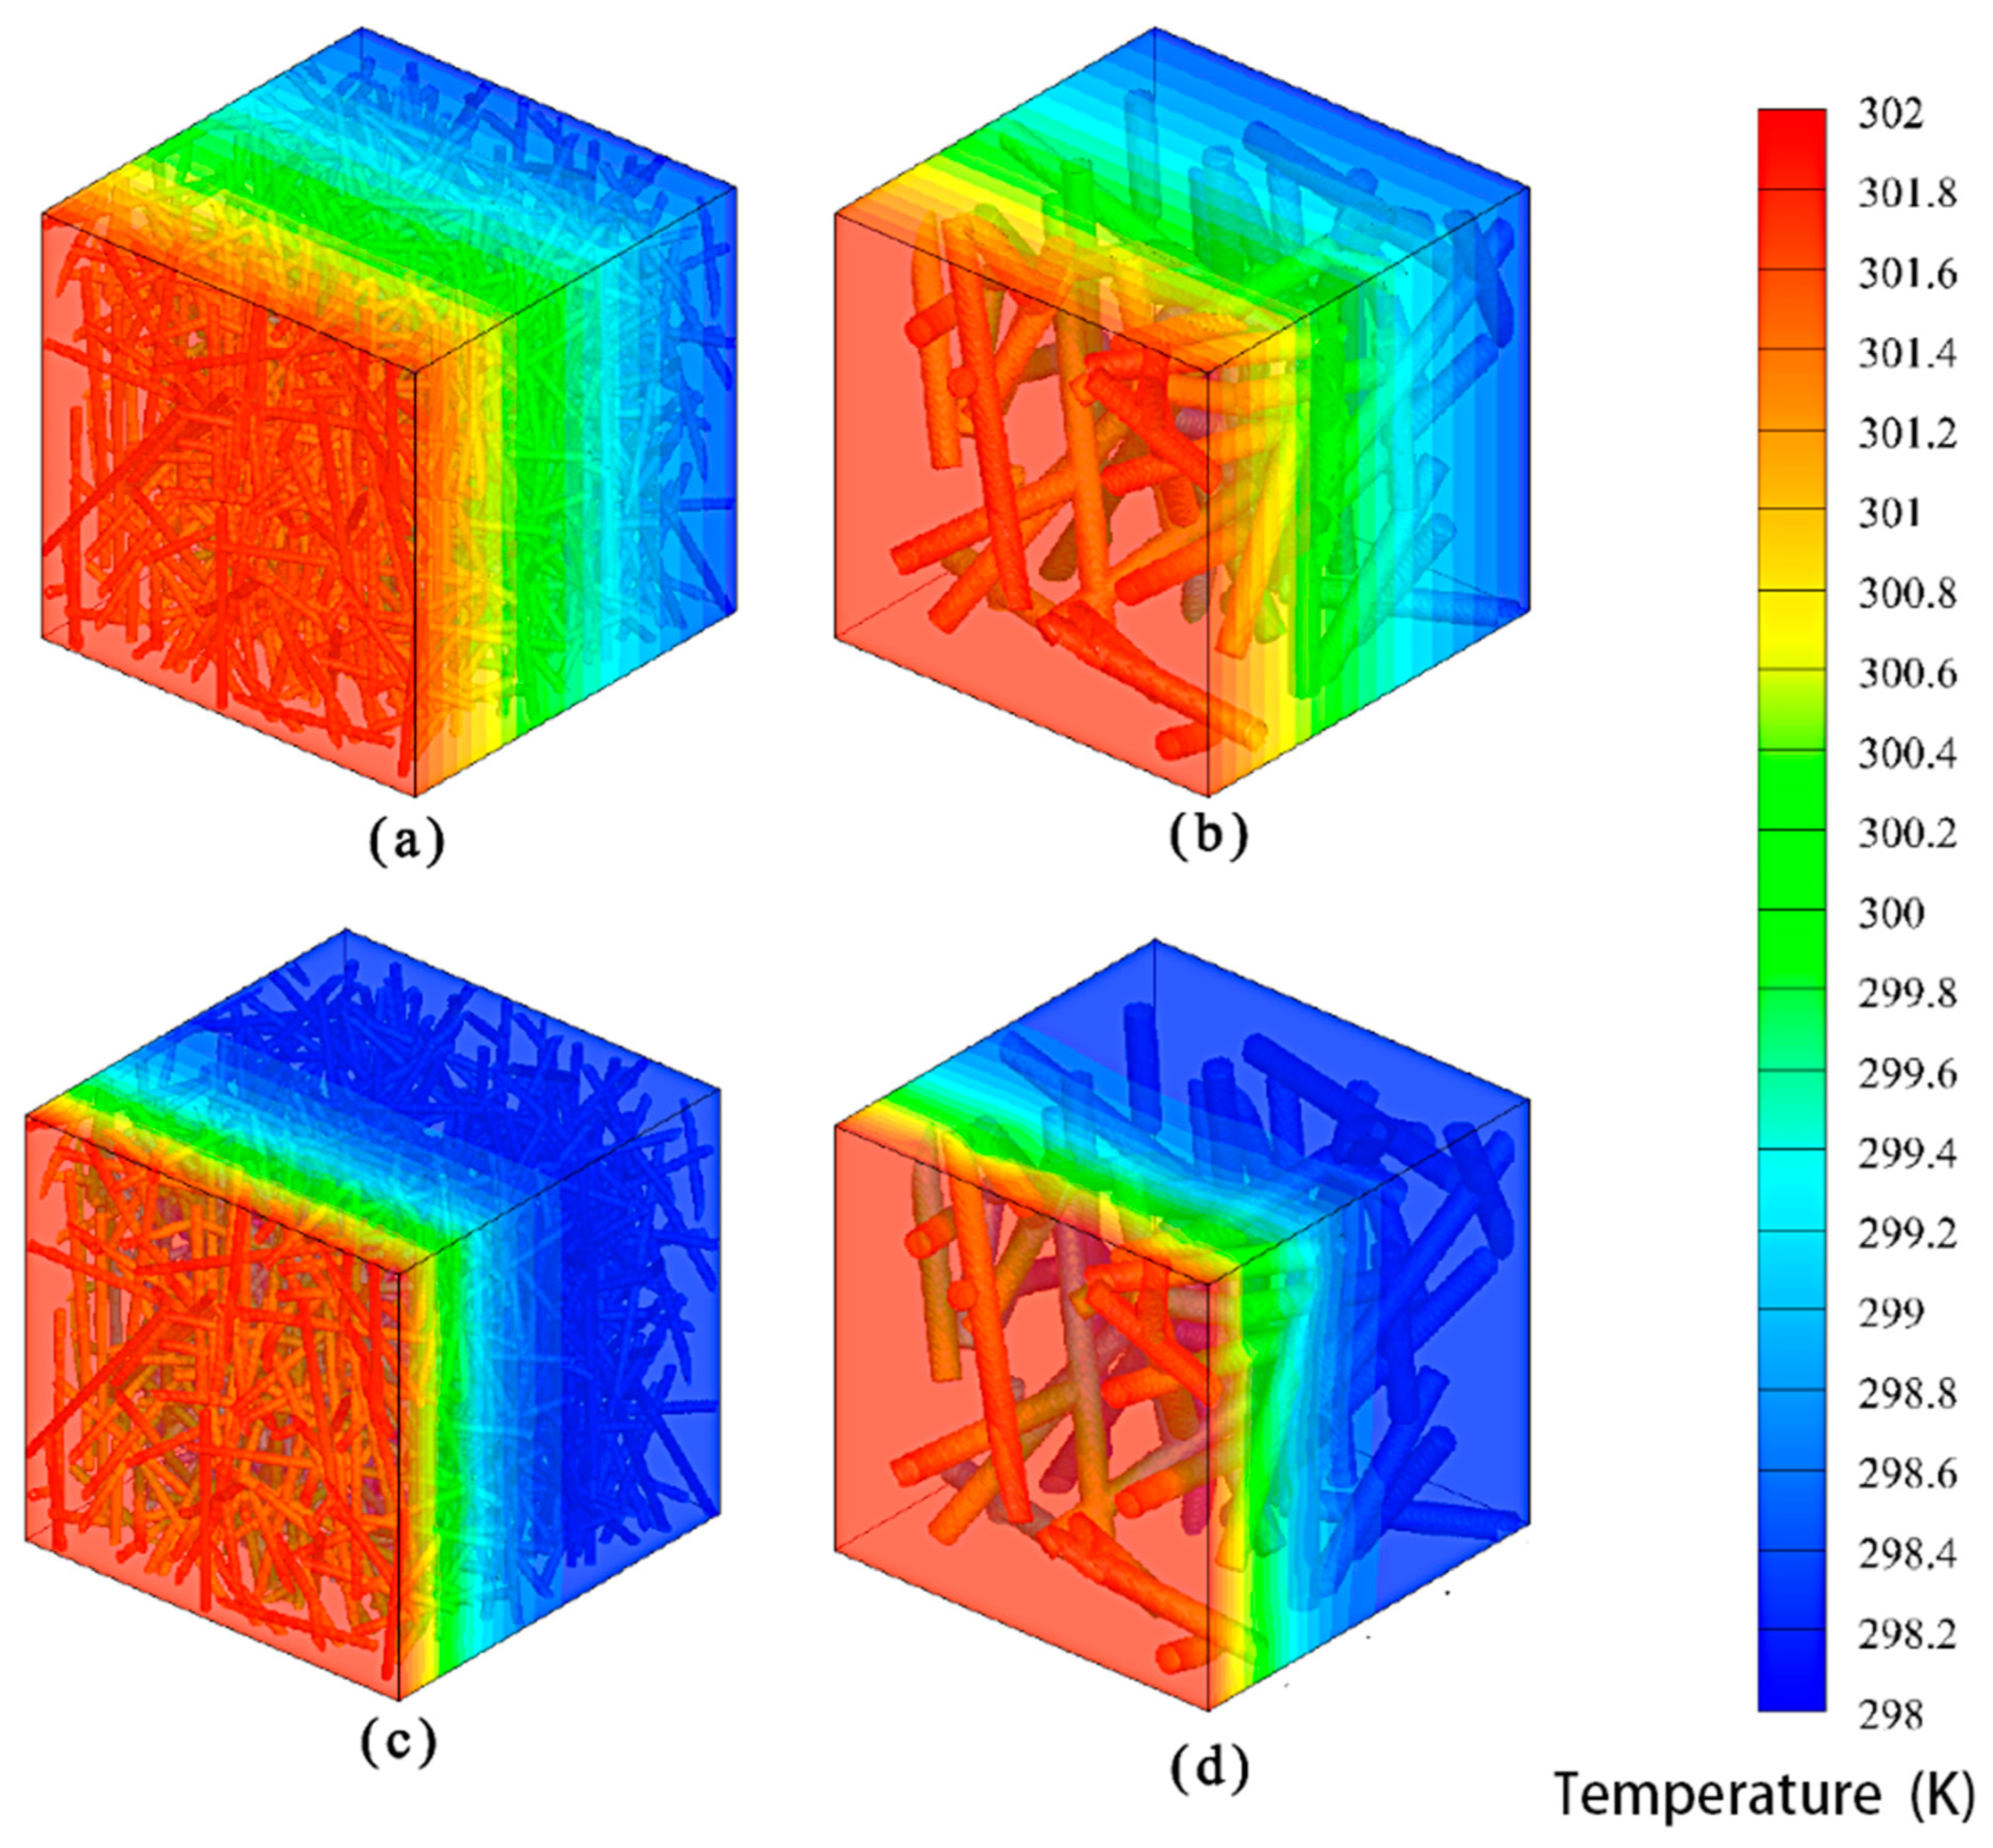
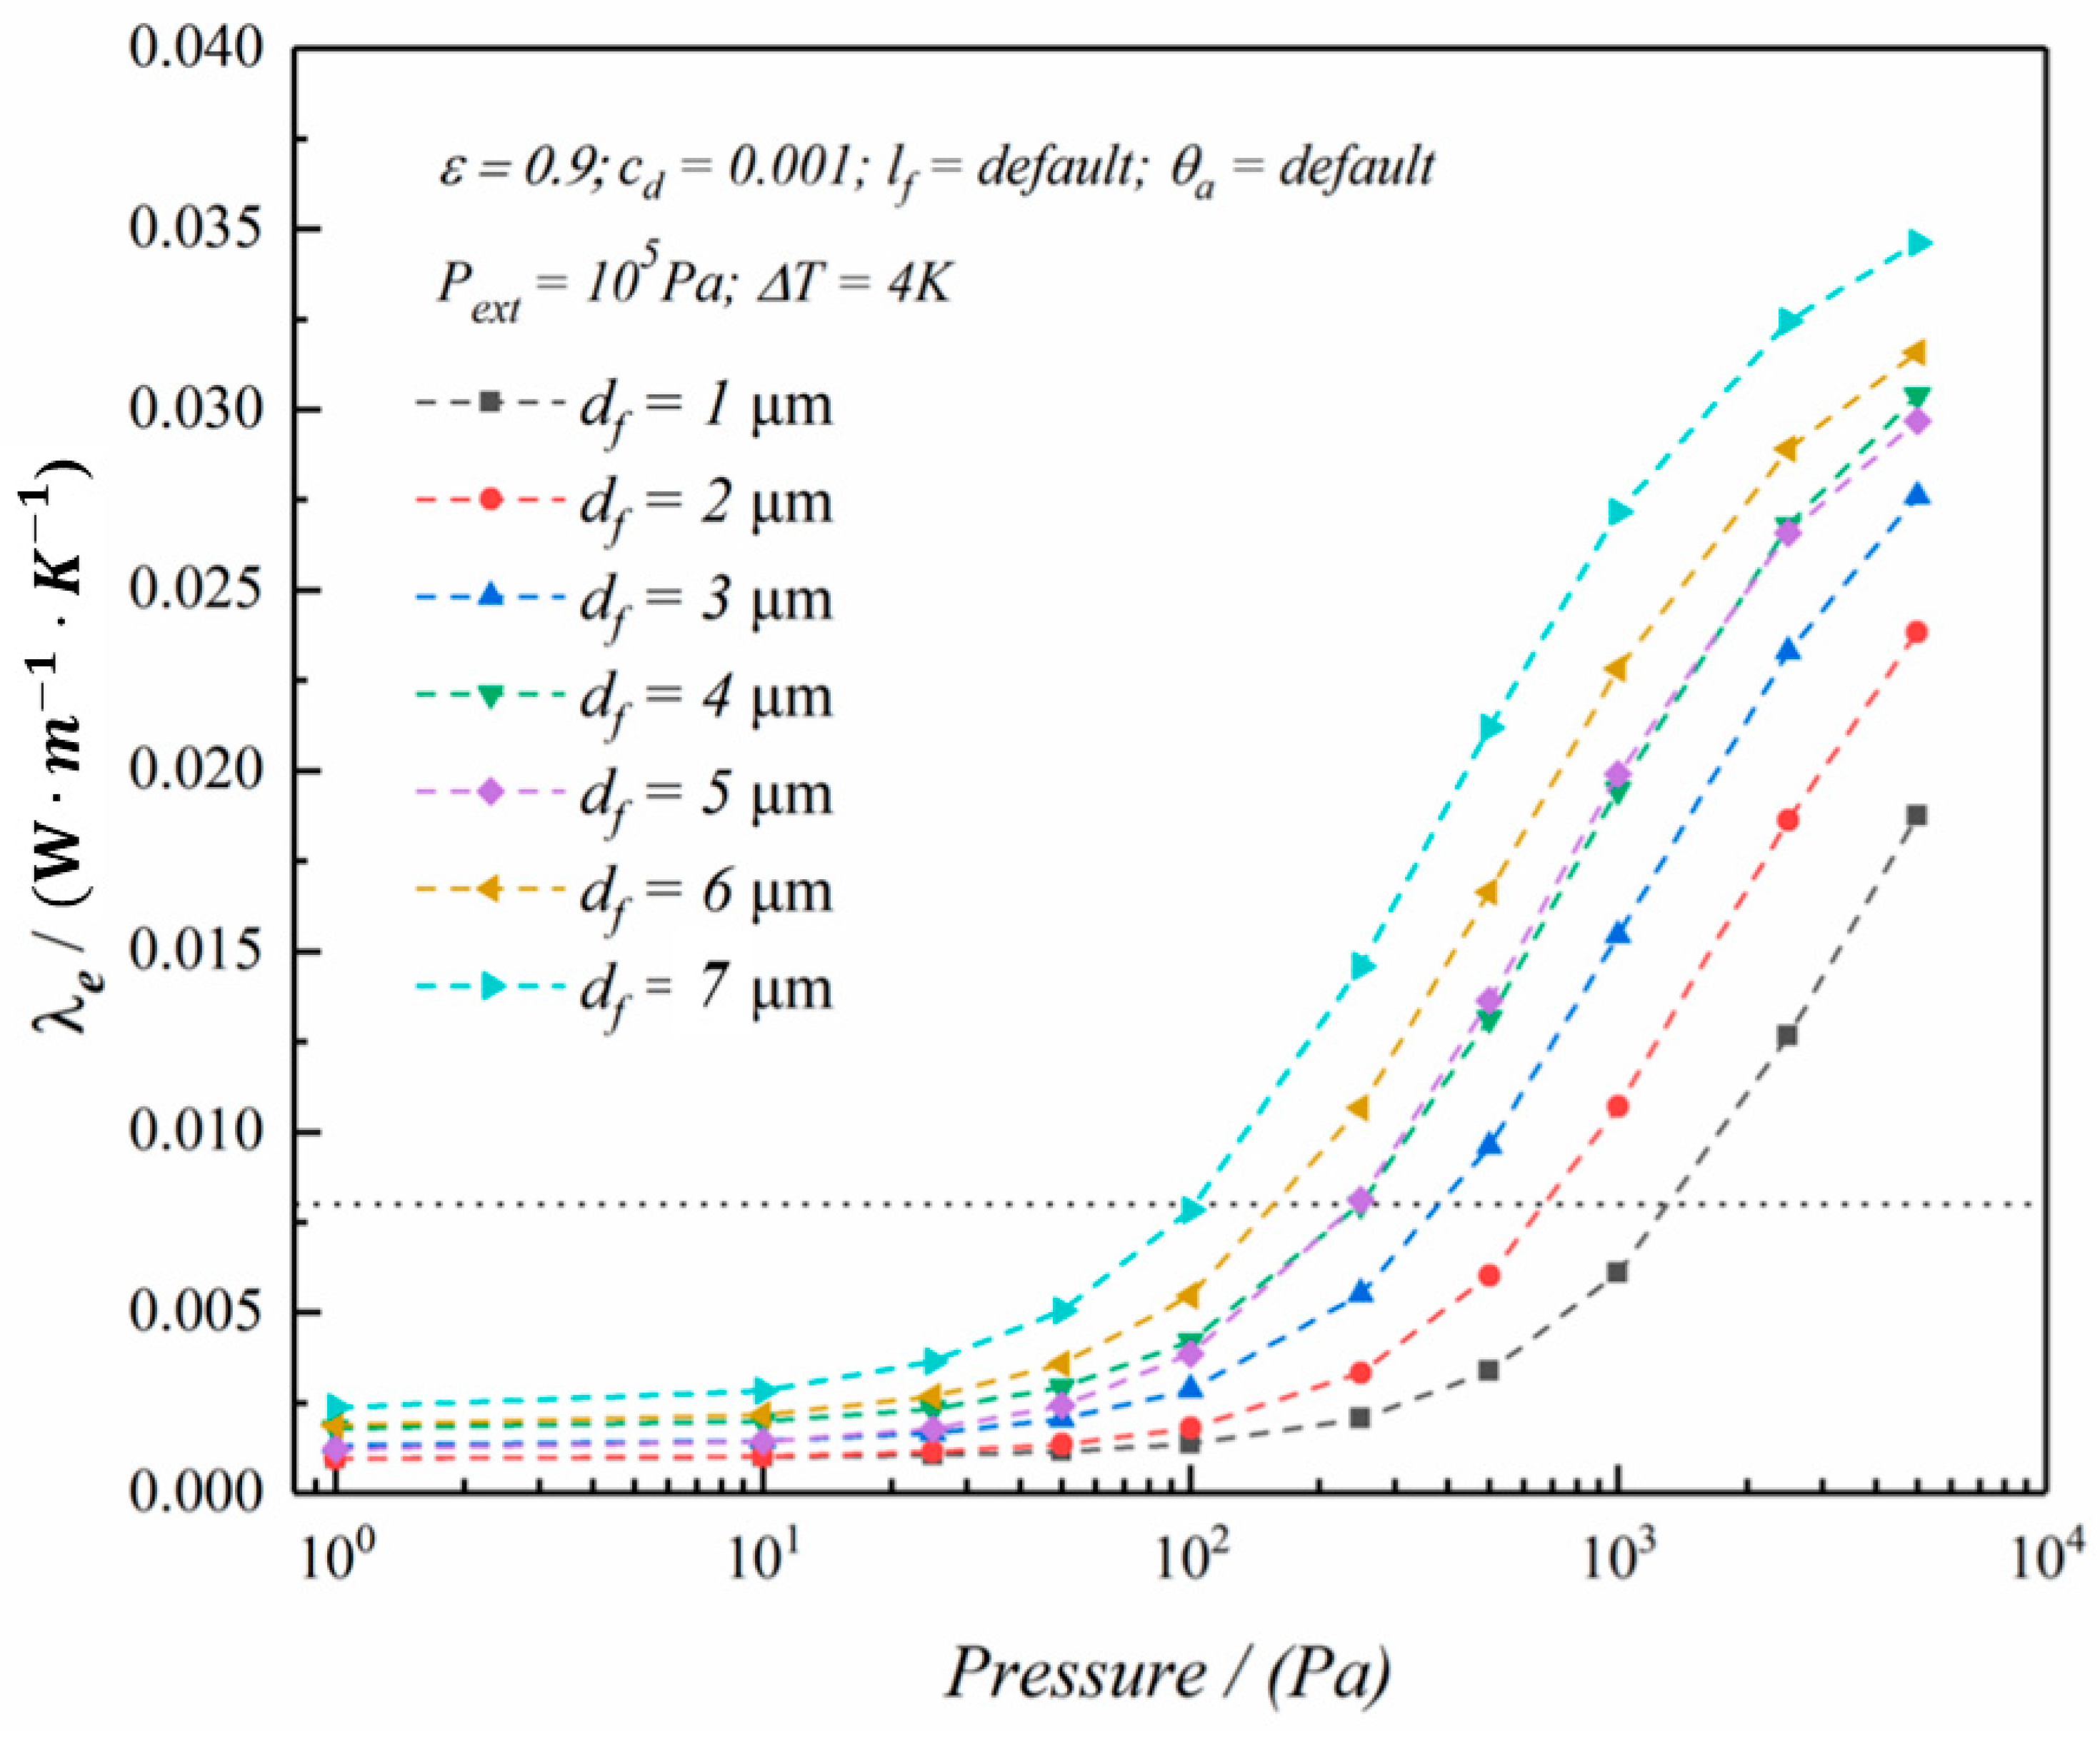
3.1. ETC Versus Gas Pressure and Fiber Diameter
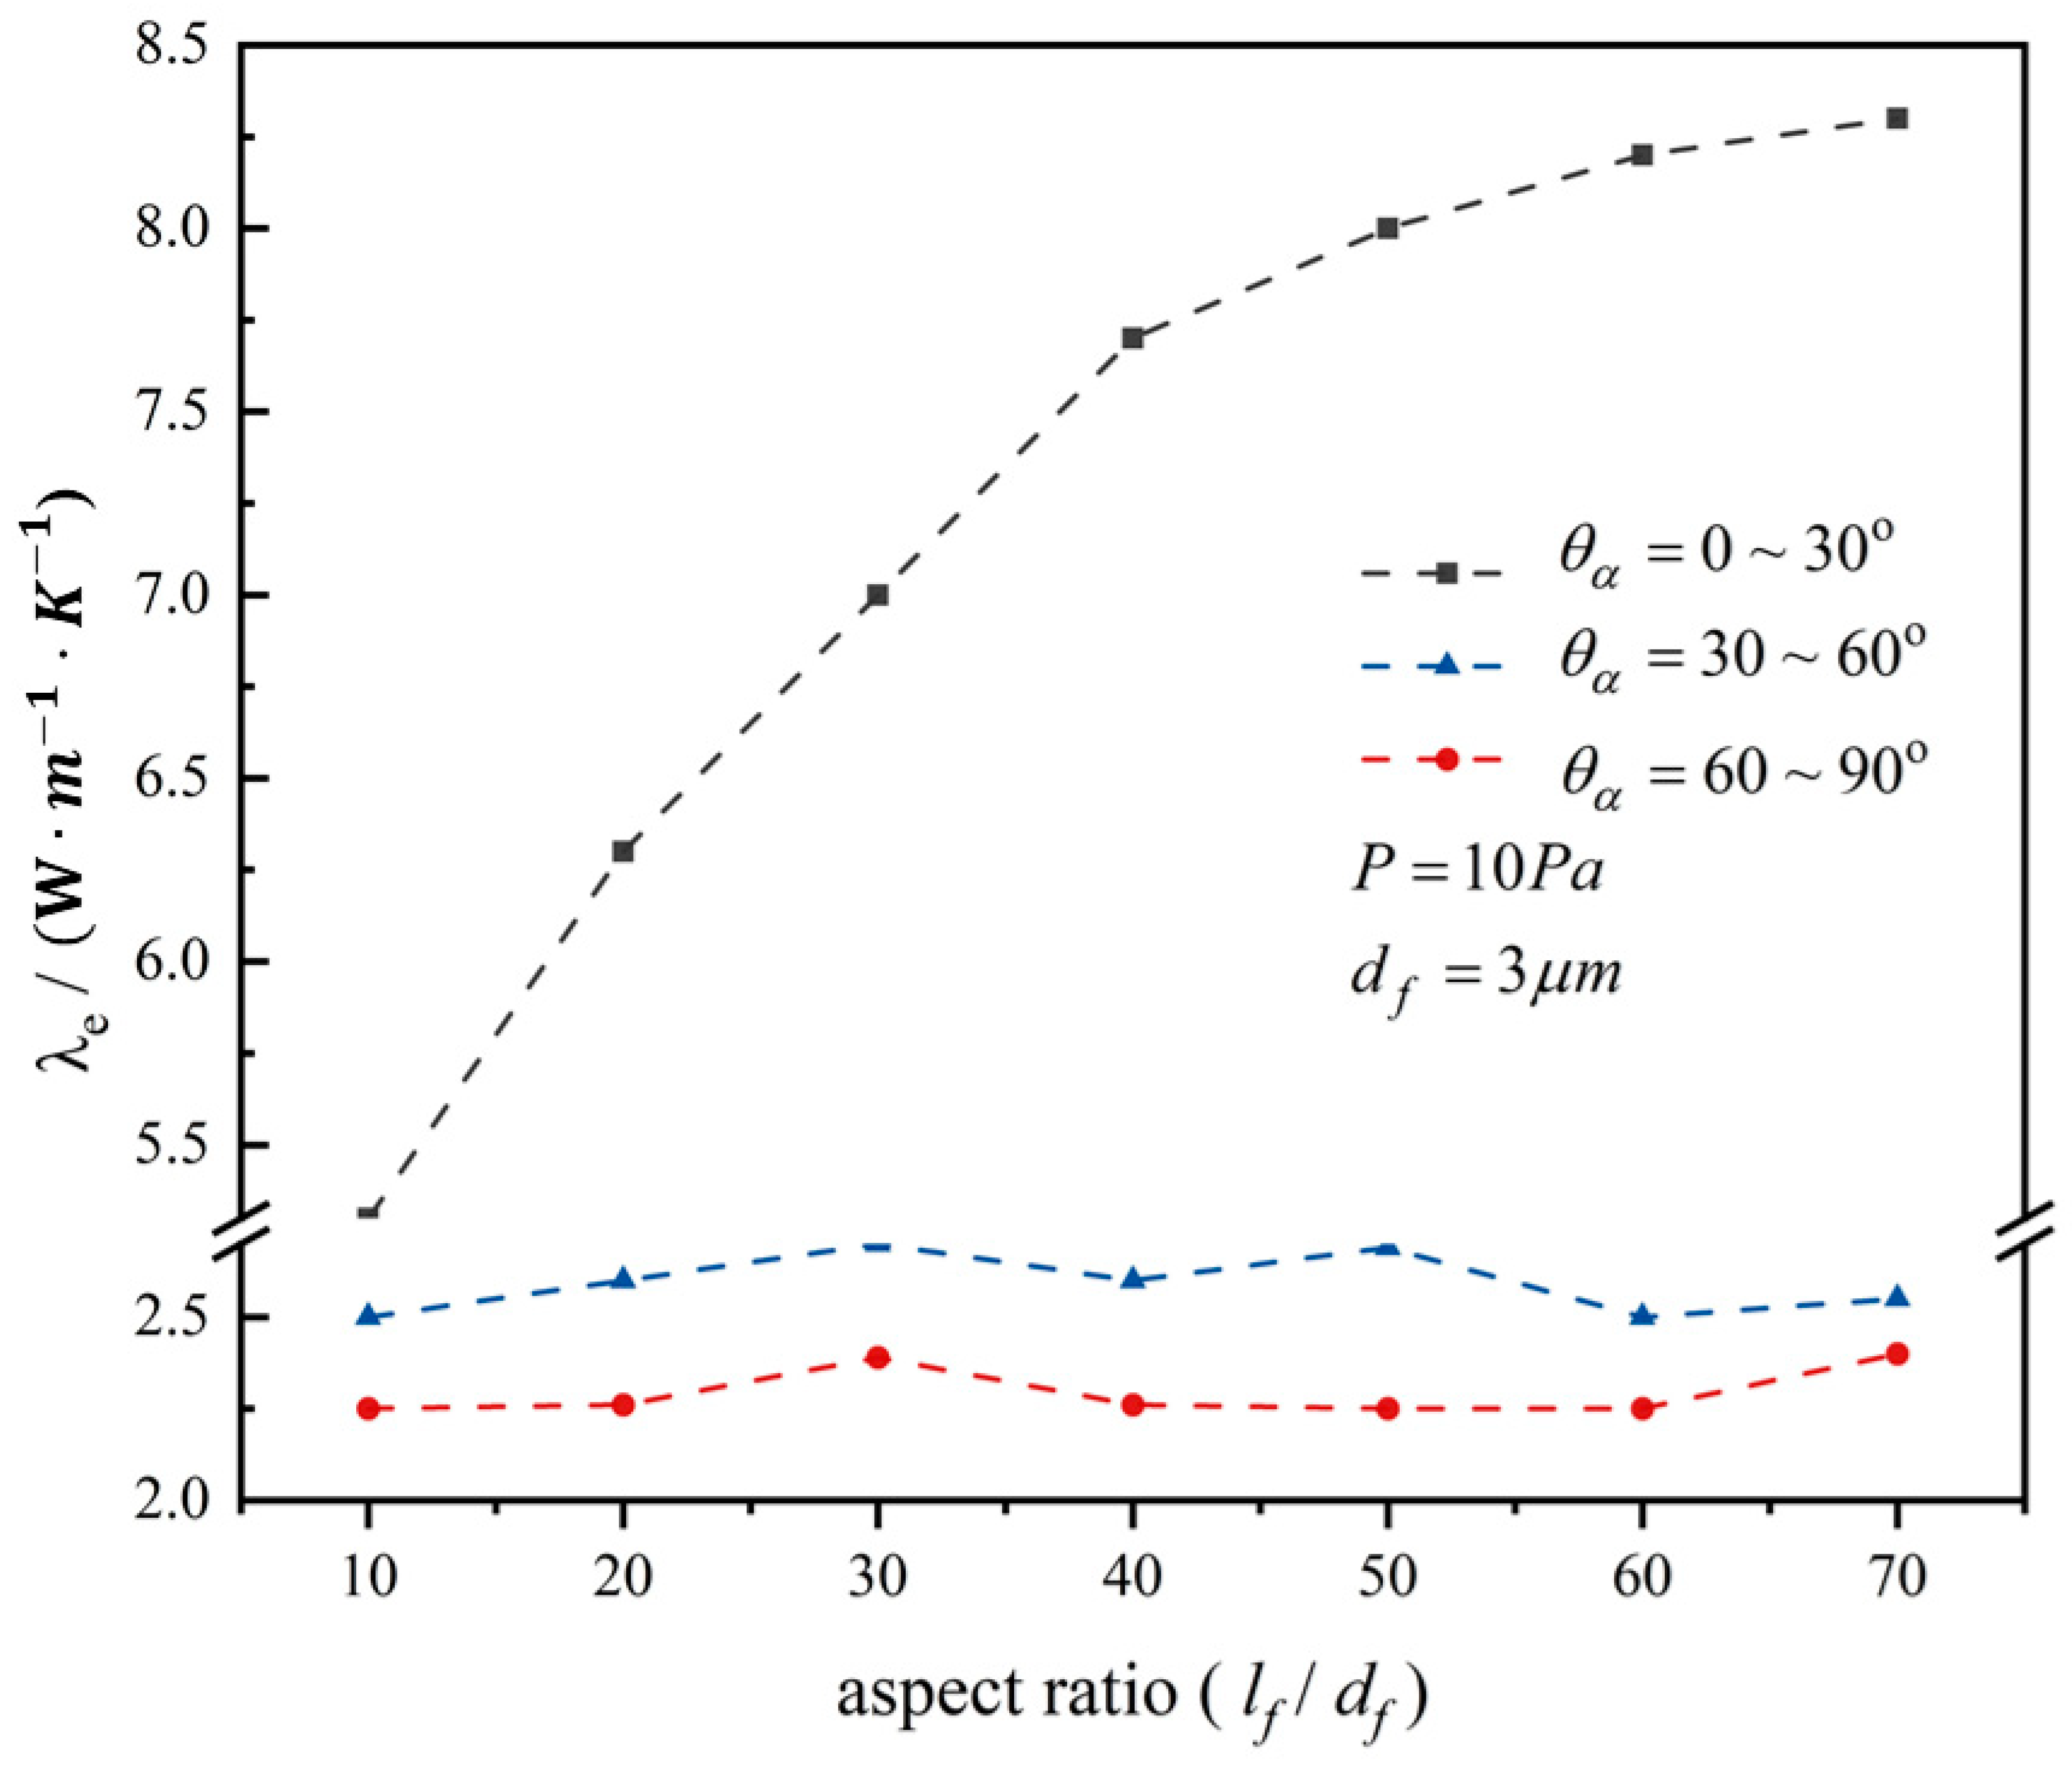
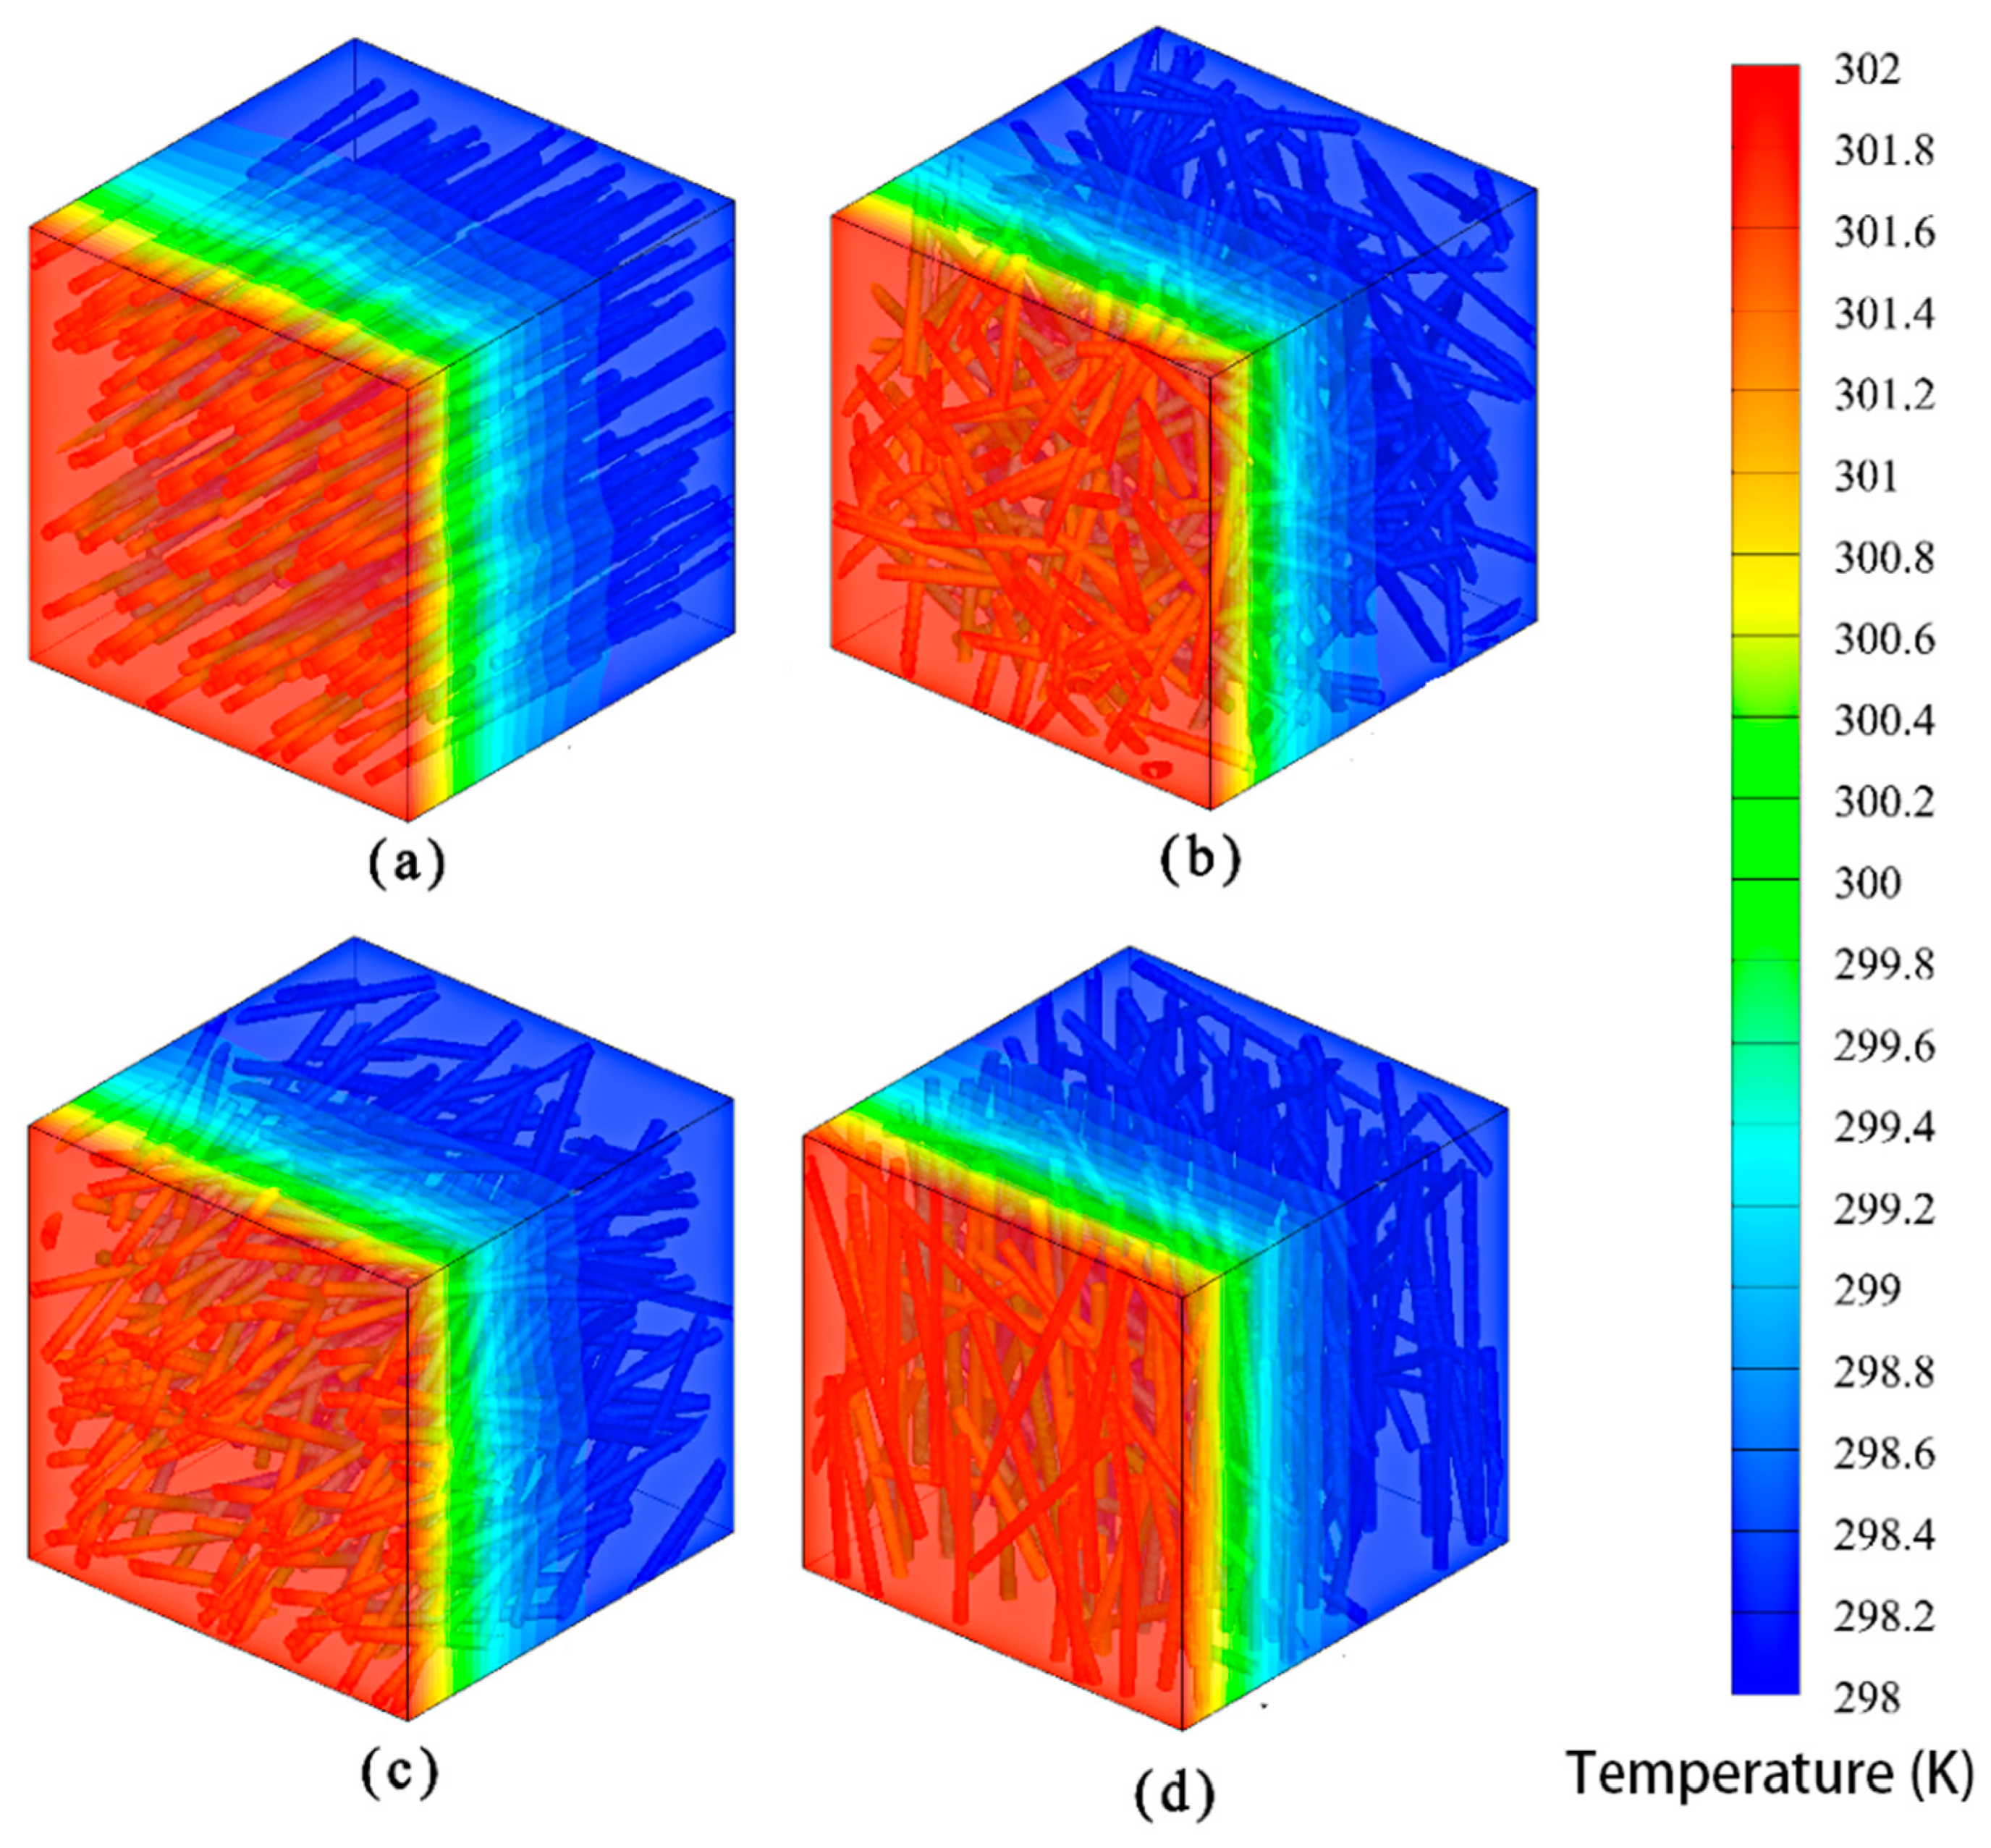
3.2. The Effect of Orientation Angle on ETC
4. Conclusions
- (1)
- The influences of five microstructure parameters, that is, the generation probability of nucleus growth, fiber length, diameter, coincidence rate, and orientation angle on ETC, are highlighted;
- (2)
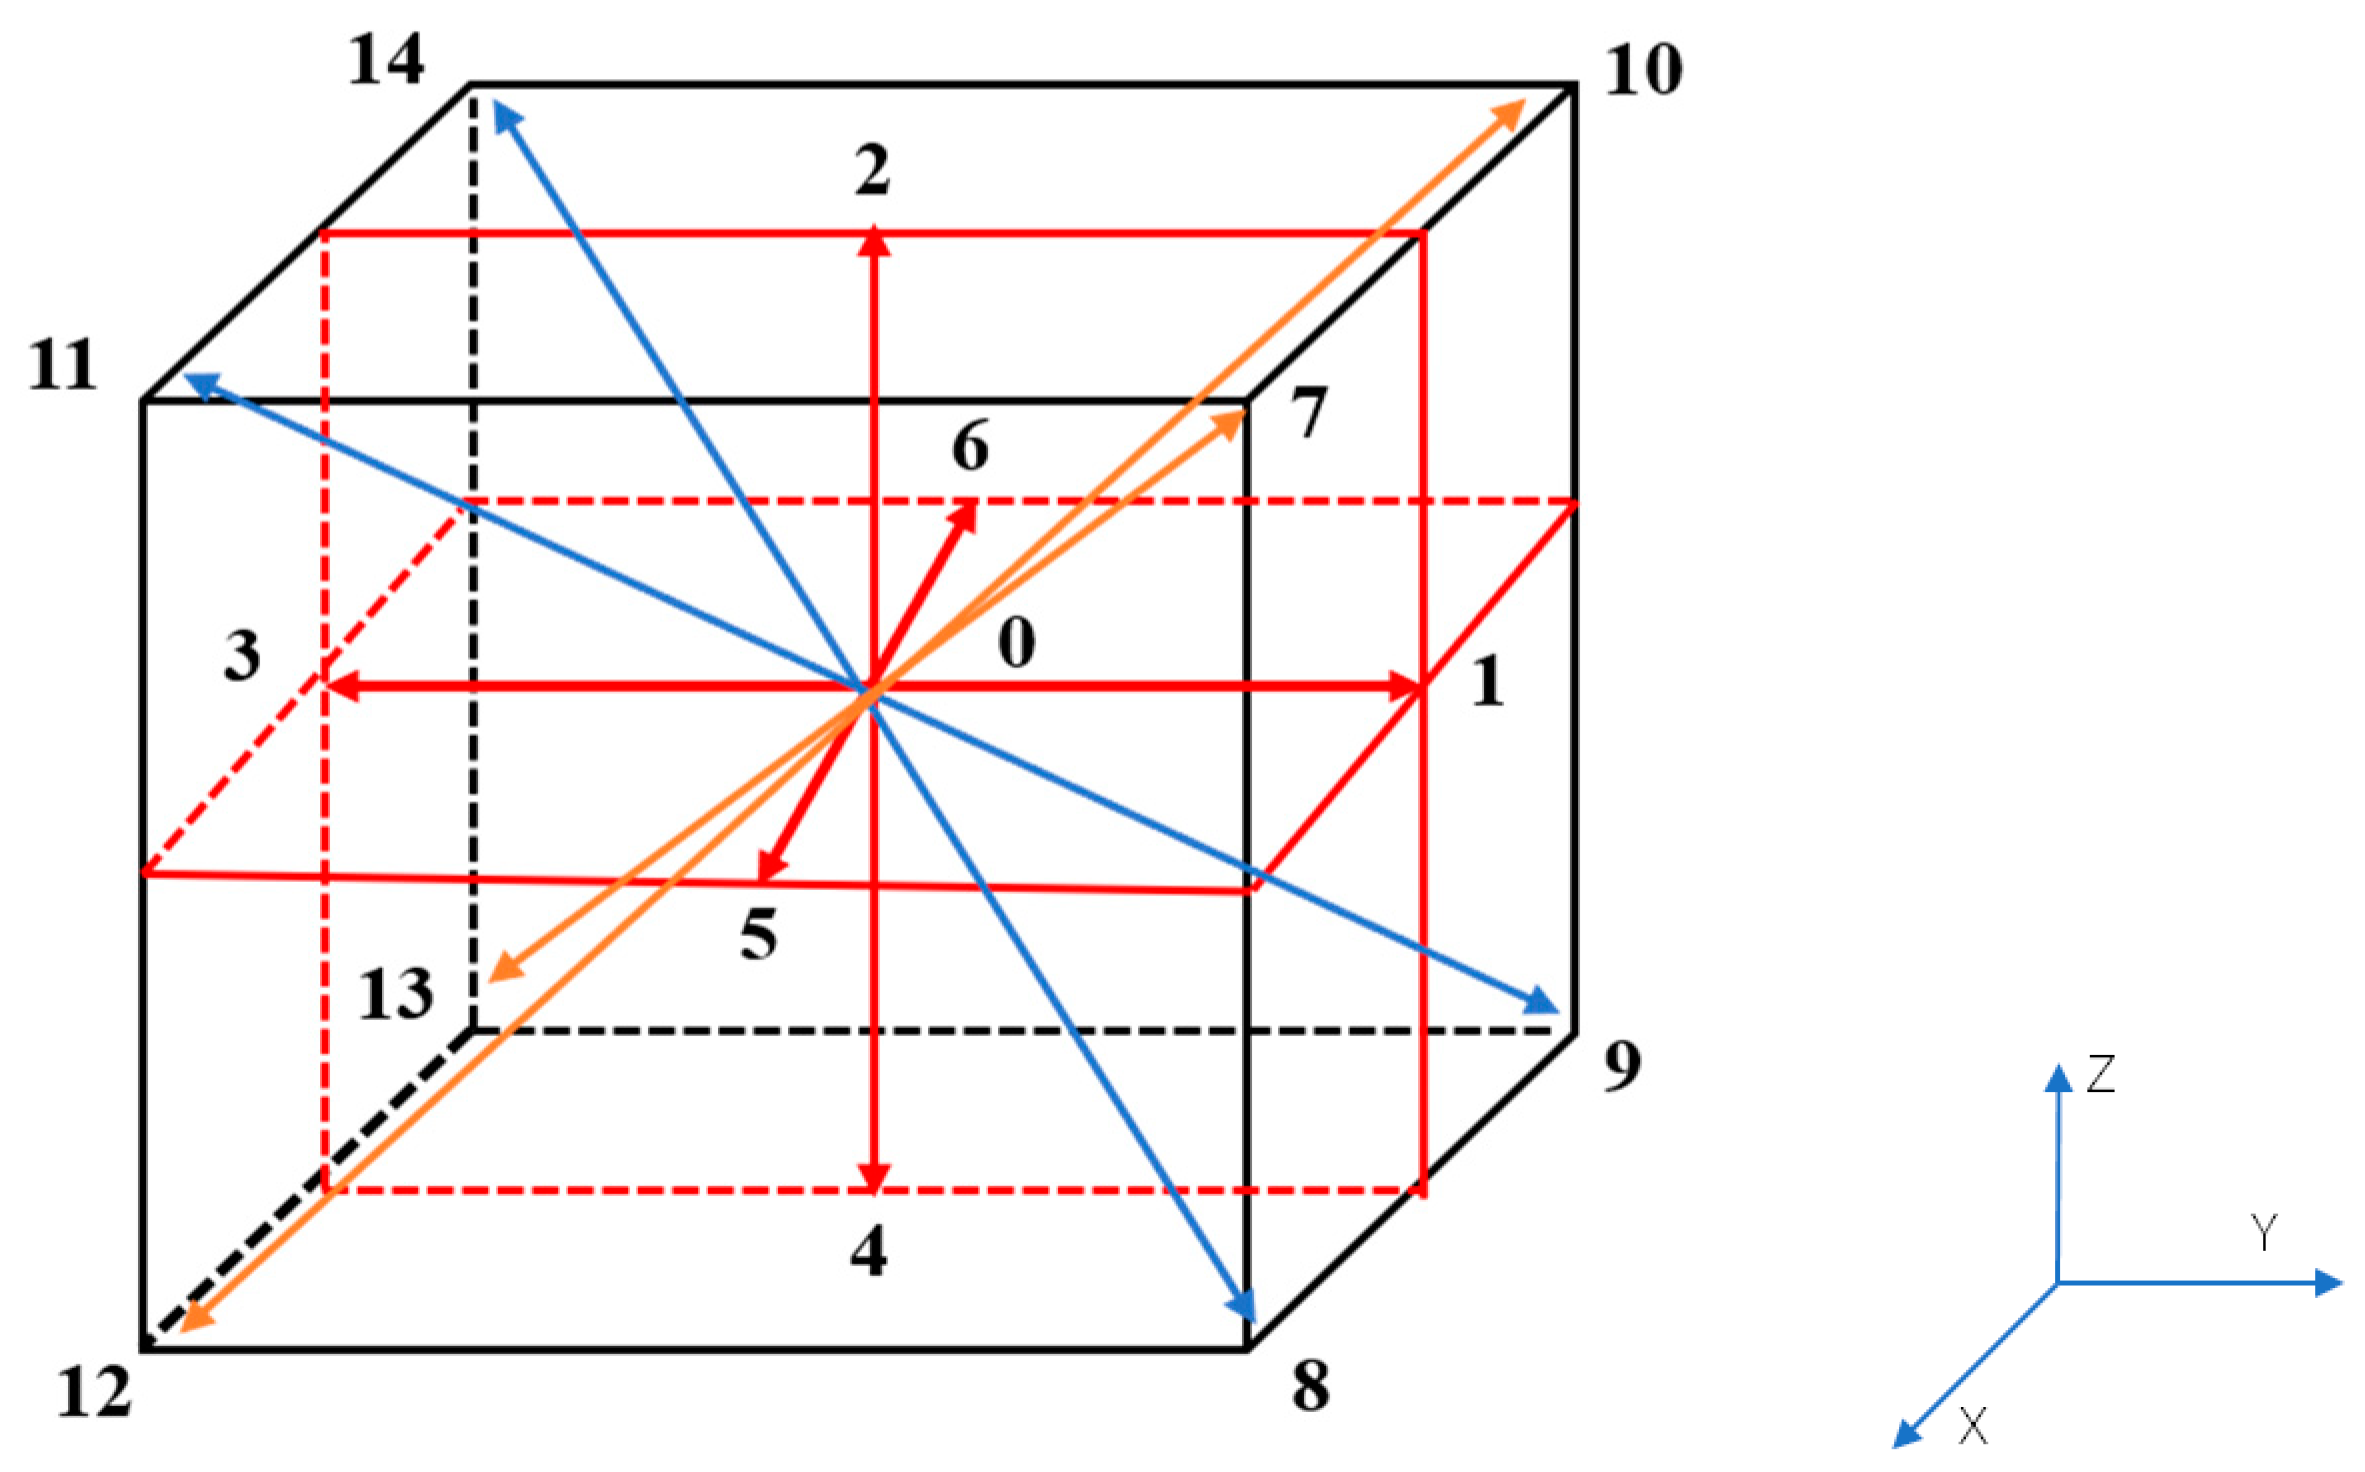
- Based on five structural parameters, an improved generation approach, D3Q15-LBM, was deduced. The model is validated with influences of different microstructure parameters;
- (3)
- The effects of microstructure parameters were numerically analyzed, and the model was validated. It indicated that an FPM structure with a finer diameter and smaller pore size had a more excellent ability to maintain a lower ETC in a higher vacuum. The ETC was also affected by the orientation angles of fibers. The more the heat transfer direction is inconsistent with the length direction of the fiber, the better the adiabatic performance is;
- (4)
- The reliability of the model is verified by comparison with the experimental values. Additionally, a suggestion was made that low ETC of VIPs by optimizing the microstructure of FPM and increasing the vacuum can be obtained. The work is a reference to optimize the FPM core of VIPs.
Author Contributions
Funding
Data Availability Statement
Acknowledgments
Conflicts of Interest
Nomenclature
| ETC/ | effective thermal conductivity, |
| FPM | fibrous porous medium |
| thermal conductivity, | |
| lattice number of corresponding dimension | |
| core growth coordinate | |
| core distribution probability | |
| angle between z-axis and fiber, | |
| angle of fiber with y-axis in Z plane, | |
| fiber length, | |
| characteristic size of cells, | |
| normal distance, | |
| axial distance, | |
| orientation angle, | |
| solid thermal conductivity, | |
| gas thermal conductivity, | |
| convection thermal conductivity, | |
| radiation thermal conductivity, | |
| coupling thermal conductivity, | |
| leakage thermal conductivity, | |
| free space gas thermal conductivity, | |
| density, | |
| diameter of the air molecules, | |
| porosity | |
| fiber diameter, | |
| T | temperature, K |
| gas pressure, | |
| discrete direction | |
| location vector | |
| discrete velocity | |
| t | discrete time |
| local equilibrium function | |
| weight coefficient | |
| local temperature, | |
| dimensional relaxation time | |
| c | lattice sound speed |
| energy transfer efficiency | |
| Knudsen number | |
| Boltzmann constant, | |
| temperature evolution function | |
| plate distance, | |
| temperature difference, | |
| heat flux, | |
| specific heat capacity, | |
| external pressure, Pa | |
| time step, usually given as 1 |
References
- Fang, K.; Li, C.; Tang, Y.; He, J.; Song, J. China’s pathways to peak carbon emissions: New insights from various industrial sectors. Appl. Energy 2021, 306, 118039. [Google Scholar] [CrossRef]
- NDRC. The People’s Republic of China Second Biennial Update Report on Climate Change; China Planning Press: Beijing, China, 2018. Available online: https://english.mee.gov.cn/Resources/Reports/reports/201907/P020190702568751604320.pdf (accessed on 30 December 2018).
- Fang, K.; Zhang, Q.; Long, Y.; Yoshida, Y.; Sun, L.; Zhang, H.; Dou, Y.; Li, S. How can China achieve its Intended Nationally Determined Contributions by 2030? A multi-criteria allocation of China’s carbon emission allowance. Appl. Energy 2019, 241, 380–389. [Google Scholar] [CrossRef]
- Mallapaty, S. How China could be carbon neutral by mid-century. Nature 2020, 586, 482–483. [Google Scholar] [CrossRef]
- Mora, C.; Rollins, R.L.; Taladay, K.; Kantar, M.; Chock, M.K.; Shimada, M.; Franklin, E.C. Bitcoin emissions alone could push global warming above 2 °C. Nat. Clim. Chang. 2018, 8, 931–933. [Google Scholar] [CrossRef]
- McGlade, C.; Ekins, P. The geographical distribution of fossil fuels unused when limiting global warming to 2 °C. Nature 2015, 517, 187–190. [Google Scholar] [CrossRef]
- The State Council of China. Report on the Work of the Government. 2020. Available online: http://english.www.gov.cn/premier/news/202005/30/content_WS5ed197f3c6d0b3f0e94990da.html (accessed on 30 May 2020).
- Jiang, J.; Ye, B.; Liu, J. Peak of CO2 emissions in various sectors and provinces of China: Recent progress and avenues for further research. Renew. Sustain. Energy Rev. 2019, 112, 813–833. [Google Scholar] [CrossRef]
- Liu, Z.; Guan, D.; Wei, W.; Davis, S.J.; Ciais, P.; Bai, J.; Peng, S.; Zhang, Q.; Hubacek, K.; Marland, G.; et al. Reduced carbon emission estimates from fossil fuel combustion and cement production in China. Nature 2015, 524, 335–338. [Google Scholar] [CrossRef] [PubMed]
- Song, J.; Yang, W.; Wang, S.; Wang, X.; Higano, Y.; Fang, K. Exploring potential pathways towards fossil energy-related GHG emission peak prior to 2030 for China: An integrated input-output simulation model. J. Clean. Prod. 2018, 178, 688–702. [Google Scholar] [CrossRef]
- Gallagher, K.S.; Zhang, F.; Orvis, R.; Rissman, J.; Liu, Q. Assessing the Policy gaps for achieving China’s climate targets in the Paris Agreement. Nat. Commun. 2019, 10, 1256. [Google Scholar] [CrossRef] [PubMed]
- Viebahn, P.; Vallentin, D.; Höller, S. Prospects of carbon capture and storage (CCS) in China’s power sector—An integrated assessment. Appl. Energy 2015, 157, 229–244. [Google Scholar] [CrossRef]
- Pan, X.; Wang, H.; Wang, L.; Chen, W. Decarbonization of China’s transportation sector: In light of national mitigation toward the Paris Agreement goals. Energy 2018, 155, 853–864. [Google Scholar] [CrossRef]
- Kan, A.; Zheng, N.; Zhu, W.; Cao, D.; Wang, W. Innovation and development of vacuum insulation panels in China: A state-of-the-art review. J. Build. Eng. 2022, 48, 103937. [Google Scholar] [CrossRef]
- Chen, X.; Shuai, C.; Wu, Y.; Zhang, Y. Analysis on the carbon emission peaks of China’s industrial, building, transport, and agricultural sectors. Sci. Total. Environ. 2019, 709, 135768. [Google Scholar] [CrossRef] [PubMed]
- Lu, J.; Kan, A.; Zhu, W.; Yuan, Y. Numerical investigation on effective thermal conductivity of fibrous porous medium under vacuum using Lattice-Boltzmann method. Int. J. Therm. Sci. 2020, 160, 106682. [Google Scholar] [CrossRef]
- Simmler, H.; Brunner, S. Vacuum insulation panels for building application: Basic properties, aging mechanisms and service life. Energy Build. 2005, 37, 1122–1131. [Google Scholar] [CrossRef]
- Mao, S.; Kan, A.; Zhu, W.; Yuan, Y. The impact of vacuum degree and barrier envelope on thermal property and service life of vacuum insulation panels. Energy Build. 2019, 209, 109699. [Google Scholar] [CrossRef]
- Alam, M.; Singh, H.; Limbachiya, M. Vacuum Insulation Panels (VIPs) for building construction industry—A review of the contemporary developments and future directions. Appl. Energy 2011, 88, 3592–3602. [Google Scholar] [CrossRef]
- Kan, A.; Mao, S.; Wang, N.; Shi, B. Simulation and Experimental Study on Thermal Conductivity of Nano-Granule Porous Material Based on Lattice-Boltzmann Method. J. Therm. Sci. 2019, 30, 248–256. [Google Scholar] [CrossRef]
- Wang, M.; Wang, X.; Wang, J.; Pan, N. Grain size effects on effective thermal conductivity of porous materials with internal thermal contact resistance. J. Porous Media 2013, 16, 1043–1048. [Google Scholar] [CrossRef]
- Tugnoli, A.; Moricone, R.; Scarponi, G.E.; Cozzani, V. Effective thermal conductivity of fibrous fireproofing materials. Int. J. Therm. Sci. 2018, 136, 107–120. [Google Scholar] [CrossRef]
- Xiao, T.; Guo, J.; Yang, X.; Hooman, K.; Lu, T.J. On the modelling of heat and fluid transport in fibrous porous media: Analytical fractal models for permeability and thermal conductivity. Int. J. Therm. Sci. 2021, 172 Pt A, 107270. [Google Scholar] [CrossRef]
- Wang, M.; Wang, J.; Pan, N.; Chen, S. Mesoscopic predictions of the effective thermal conductivity for microscale random porous media. Phys. Rev. E 2007, 75, 036702. [Google Scholar] [CrossRef]
- Mendes, M.A.; Ray, S.; Trimis, D. A simple and efficient method for the evaluation of effective thermal conductivity of open-cell foam-like structures. Int. J. Heat Mass Transf. 2013, 66, 412–422. [Google Scholar] [CrossRef]
- Lin, Y.; Yang, C.; Zhang, W.; Fukumoto, K.; Saito, Y.; Machida, H.; Norinaga, K. Estimation of effective thermal conductivity in open-cell foam with hierarchical pore structure using lattice Boltzmann method. Appl. Therm. Eng. 2022, 218, 119314. [Google Scholar] [CrossRef]
- Wei, G.; Liu, Y.; Zhang, X.; Yu, F.; Du, X. Thermal conductivities study on silica aerogel and its composite insulation materials. Int. J. Heat Mass Transf. 2011, 54, 2355–2366. [Google Scholar] [CrossRef]
- Bi, C.; Tang, G.H.; Hu, Z.J.; Yang, H.L.; Li, J.N. Coupling model for heat transfer between solid and gas phases in aerogel and experimental investigation. Int. J. Heat Mass Transf. 2014, 79, 126–136. [Google Scholar] [CrossRef]
- Farahani, M.V.; Hassanpouryouzband, A.; Yang, J.; Tohidi, B. Heat Transfer in Unfrozen and Frozen Porous Media: Experimental Measurement and Pore-Scale Modeling. Water Resour. Res. 2020, 56, e2020WR027885. [Google Scholar] [CrossRef]
- Qu, Z.G.; Fu, Y.D.; Liu, Y.; Zhou, L. Approach for predicting effective thermal conductivity of aerogel materials through a modified lattice Boltzmann method. Appl. Therm. Eng. 2018, 132, 730–739. [Google Scholar] [CrossRef]
- Ross-Jones, J.; Gaedtke, M.; Sonnick, S.; Rädle, M.; Nirschl, H.; Krause, M.J. Conjugate heat transfer through nano scale porous media to optimize vacuum insulation panels with lattice Boltzmann methods. Comput. Math. Appl. 2018, 77, 209–221. [Google Scholar] [CrossRef]
- Guo, C.; Nian, X.; Liu, Y.; Qi, C.; Song, J.; Yu, W. Analysis of 2D flow and heat transfer modeling in fracture of porous media. J. Therm. Sci. 2017, 26, 331–338. [Google Scholar] [CrossRef]
- Gaedtke, M.; Wachter, S.; Kunkel, S.; Sonnick, S.; Rädle, M.; Nirschl, H.; Krause, M.J. Numerical study on the application of vacuum insulation panels and a latent heat storage for refrigerated vehicles with a large Eddy lattice Boltzmann method. Heat Mass Transf. 2019, 56, 1189–1201. [Google Scholar] [CrossRef]
- Wu, Y.; Shi, Y.; Cai, N.; Ni, M. Thermal Modeling and Management of Solid Oxide Fuel Cells Operating with Internally Reformed Methane. J. Therm. Sci. 2018, 27, 203–212. [Google Scholar] [CrossRef]
- Liu, J.; Liu, S.; Sun, S.; Zhou, W.; Schlaberg, I.H.I.; Wang, M.; Yan, Y. Tomographic data fusion with CFD simulations associated with a planar sensor. J. Therm. Sci. 2017, 26, 175–182. [Google Scholar] [CrossRef]
- Mink, A.; Thäter, G.; Nirschl, H.; Krause, M.J. A 3D Lattice Boltzmann method for light simulation in participating media. J. Comput. Sci. 2016, 17, 431–437. [Google Scholar] [CrossRef]


| Items | Condition | Lbm Solution |
|---|---|---|
| Hot Plate | Isothermal boundary () | The nonequilibrium distribution Bounce-back rule |
| Cold Plate | Isothermal boundary () | The nonequilibrium distribution bounce-back rule |
| Top Wall | Adiabatic (q = 0) | Neumann boundary |
| Bottom Wall | Adiabatic (q = 0) | Neumann boundary |
| Front Wall | Adiabatic (q = 0) | Neumann boundary |
| Back Wall | Adiabatic (q = 0) | Neumann boundary |
| Specimen | 1 | 2 | 3 | 4 | 5 |
|---|---|---|---|---|---|
| Items | |||||
| Initial air pressure/Pa | 0.1 | 1 | 10 | 100 | 1000 |
| Measured ETC/ | 2.68 | 2.96 | 3.19 | 5.84 | 14.63 |
| Predictive ETC/ | 2.61 | 2.83 | 2.94 | 4.86 | 10.44 |
| error | 0.03 | 0.04 | 0.08 | 0.17 | 0.29 |
Disclaimer/Publisher’s Note: The statements, opinions and data contained in all publications are solely those of the individual author(s) and contributor(s) and not of MDPI and/or the editor(s). MDPI and/or the editor(s) disclaim responsibility for any injury to people or property resulting from any ideas, methods, instructions or products referred to in the content. |
© 2023 by the authors. Licensee MDPI, Basel, Switzerland. This article is an open access article distributed under the terms and conditions of the Creative Commons Attribution (CC BY) license (https://creativecommons.org/licenses/by/4.0/).
Share and Cite
Chen, B.; Kan, A.; Chen, Z.; Zhang, J.; Yang, L. Investigation on Effective Thermal Conductivity of Fibrous Porous Materials as Vacuum Insulation Panels’ Core Using Lattice Boltzmann Method. Energies 2023, 16, 3692. https://doi.org/10.3390/en16093692
Chen B, Kan A, Chen Z, Zhang J, Yang L. Investigation on Effective Thermal Conductivity of Fibrous Porous Materials as Vacuum Insulation Panels’ Core Using Lattice Boltzmann Method. Energies. 2023; 16(9):3692. https://doi.org/10.3390/en16093692
Chicago/Turabian StyleChen, Bangqi, Ankang Kan, Zhaofeng Chen, Jiaxiang Zhang, and Lixia Yang. 2023. "Investigation on Effective Thermal Conductivity of Fibrous Porous Materials as Vacuum Insulation Panels’ Core Using Lattice Boltzmann Method" Energies 16, no. 9: 3692. https://doi.org/10.3390/en16093692