3.1. Drying Kinetics
Table 2 indicates the drying air conditions for each proposed case, as well as the initial mass (m
0), initial water mass (m
w0), equilibrium mass (m
e) and dry mass (m
d) of the samples. From the analysis of the
Table 2, it is observed that the values of relative humidity of the drying air for the first two cases, which were carried out in LABFILM, are lower than the values obtained in the other cases, which were carried out in TECNOMAT. This outcome occurred because the LABFILM has a dehumidifier and two air conditioning units that remained on during the experiments, while the drying experiments at the TECNOMAT were carried out without a dehumidifier and with the air conditioning devices turned off.
It is also observed that, for the same laboratory, the higher the temperature of the drying air, the lower the air relative humidity. This result is in line with expectations since the increase in temperature implies an increase in the saturation vapor pressure, increasing the capacity of the air to retain water in the vapor state (humidity).
From the analysis of
Table 2, it is also noticed that even respecting the same time interval between the removal of the sample from the mold and the beginning of the drying experiment, there is a reasonable difference in the initial masses of the samples (m
0). In absolute terms, the maximum difference between the masses of the samples is 2230 g, comparing Cases 2 and 3. In percentage terms, the mass of sample 3 corresponds to 87.69% of the mass of sample 2. This outcome could have occurred for three main reasons: dimensional differences in the molds of the parts, the time the samples remained in the molds and differences in the composition of the slip (raw material) in each of the samples, given that the collections were carried out in different weeks. The average initial mass of the samples in the four experiments and the respective standard deviation was 16,590 ± 902 g.
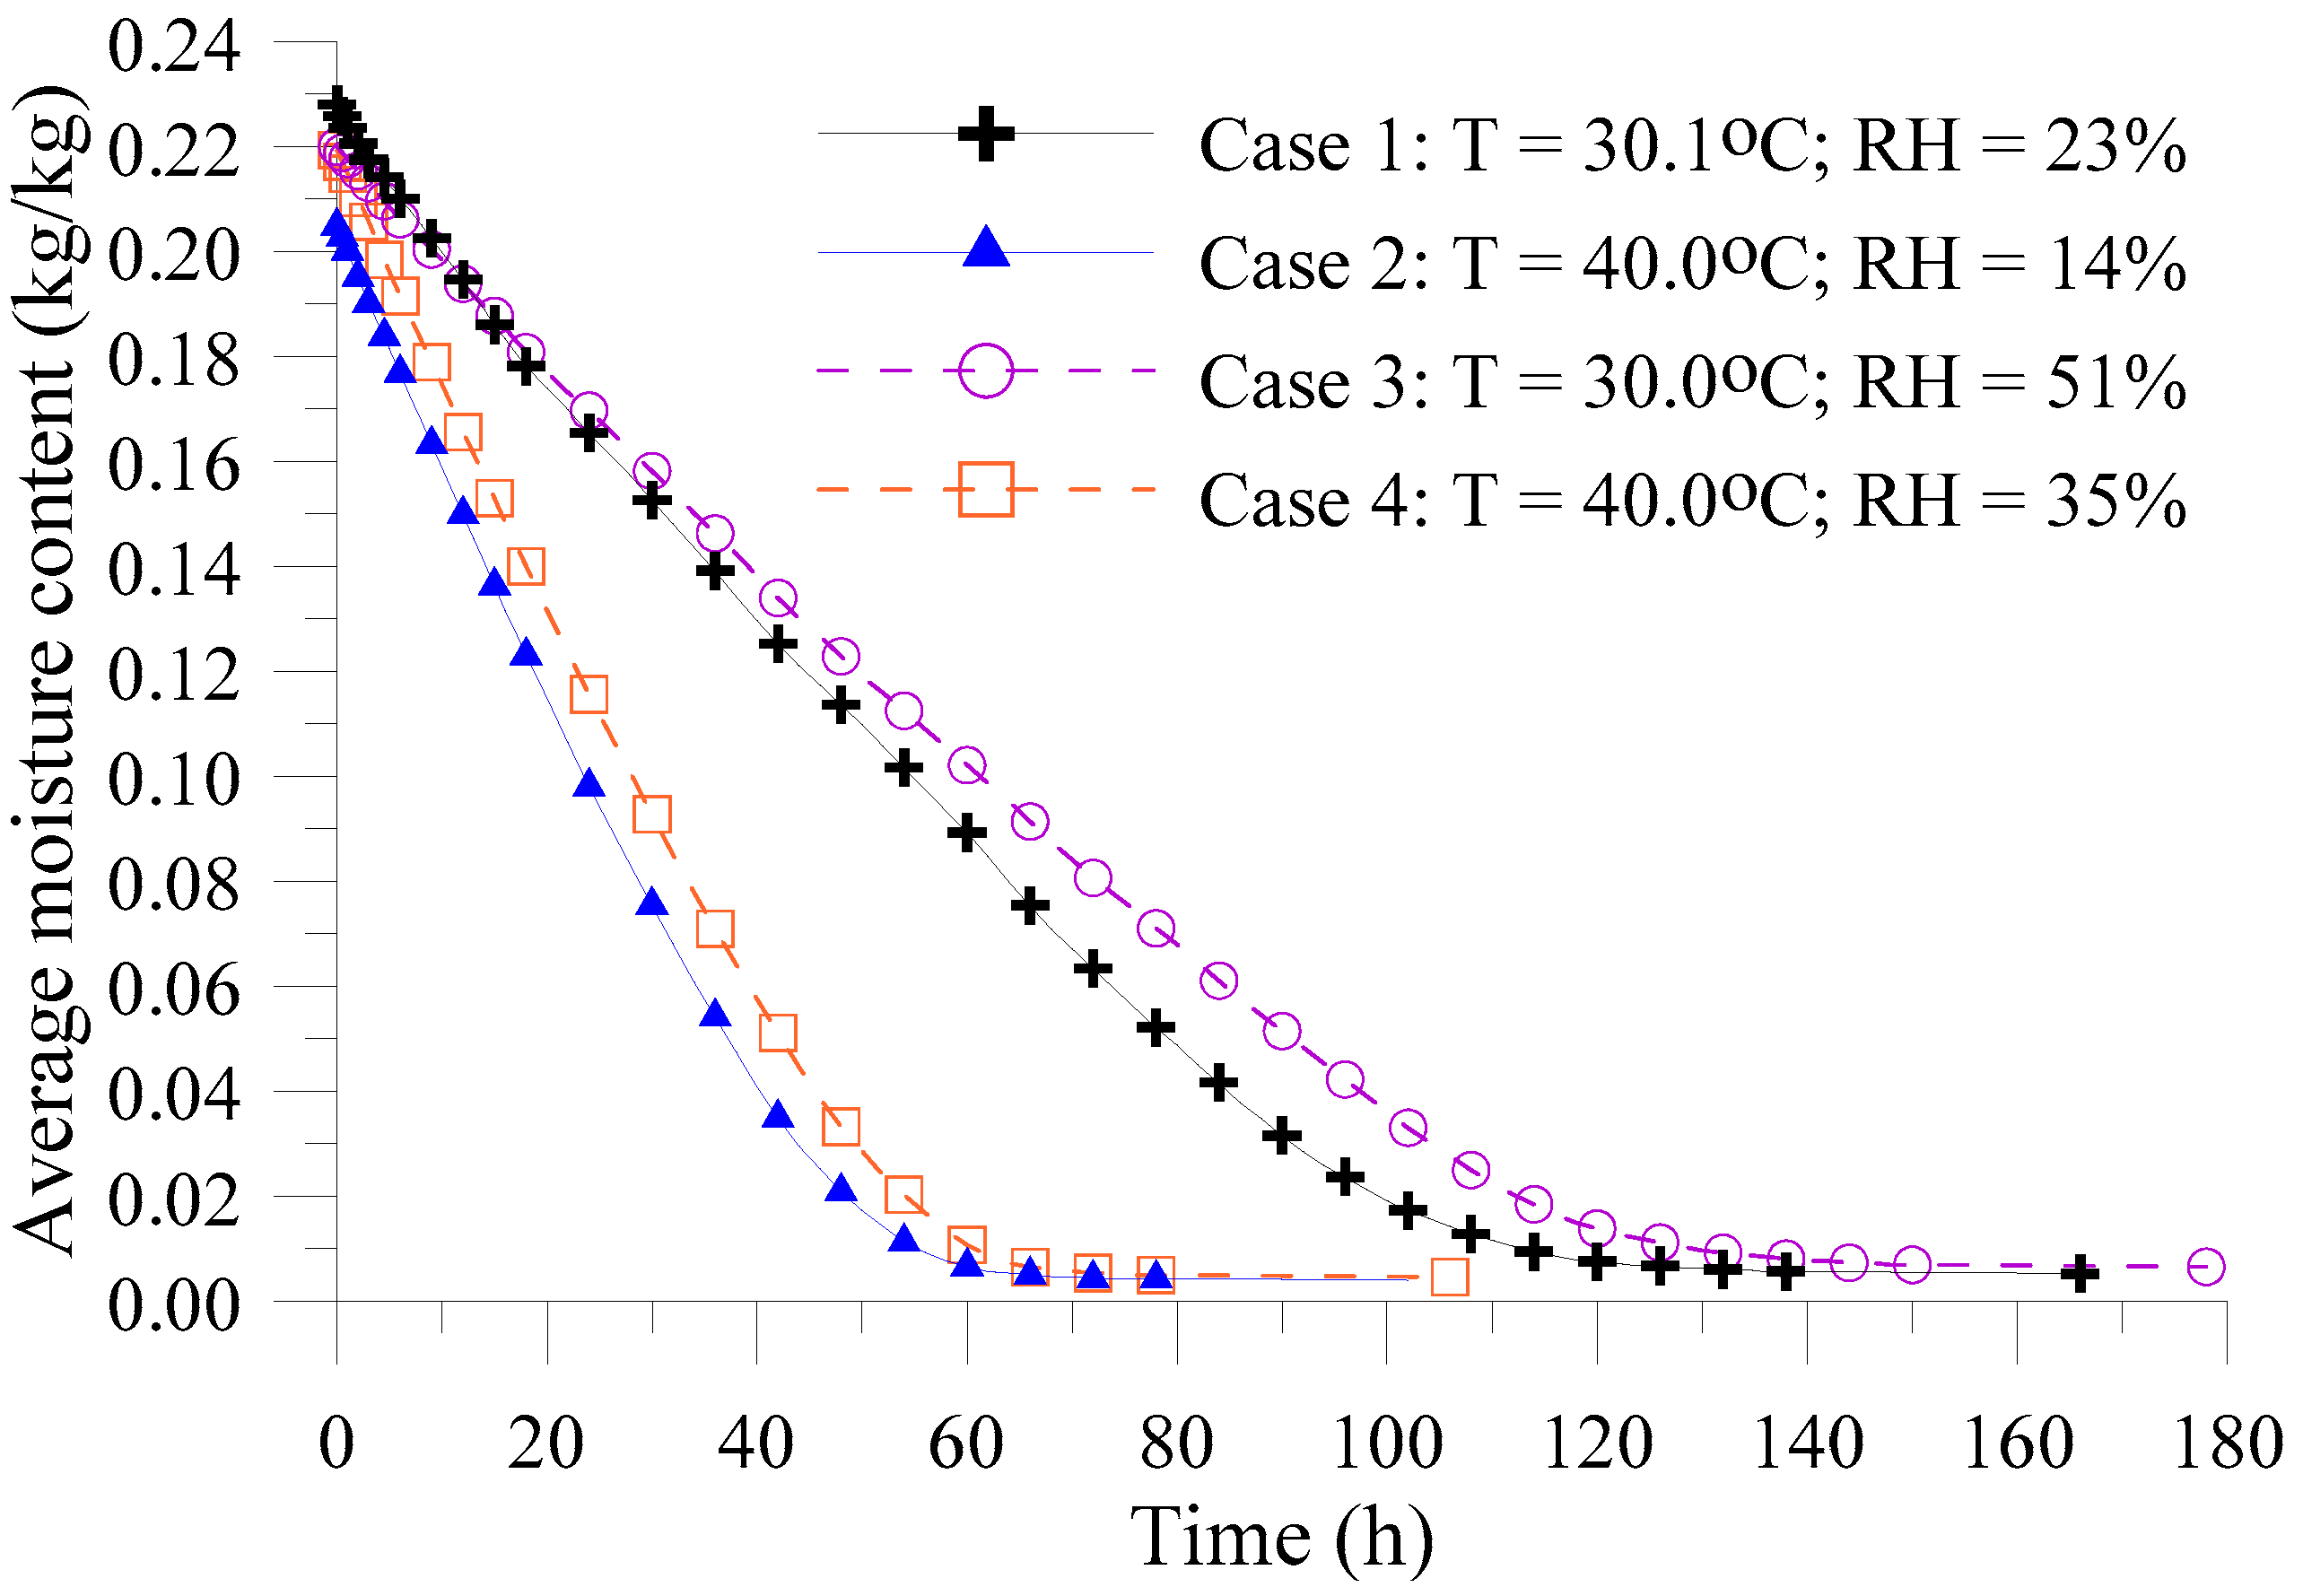
Figure 5 shows the comparison between the average moisture content of the samples as a function of time for all the experiments. Such results are important to understand the drying kinetics of sanitary toilets for different conditions of air temperature and relative humidity.
From the analysis of
Figure 5, it is observed that drying occurred more quickly for the experiment with higher temperature (40 °C) and lower relative humidity (14%) of the drying air (Case 2), i.e., the moisture content reduced from its initial value to the equilibrium value in a shorter time. The case with the second fastest drying was that carried out in the TECNOMAT (highest relative humidity) with a temperature of 40 °C (Case 4). Next, there are Cases 1 (T = 30.1 °C; RH = 23%) and 3 (T = 30 °C; RH = 51%).
These results show that the drying air temperature is not the only factor that influences the drying kinetics. The air relative humidity is a parameter of fundamental importance in the drying of ceramic materials. The reduction in relative humidity favors the mass transfer of water from the interior of the piece to the drying air as a result of the higher water evaporation rate on the surface.
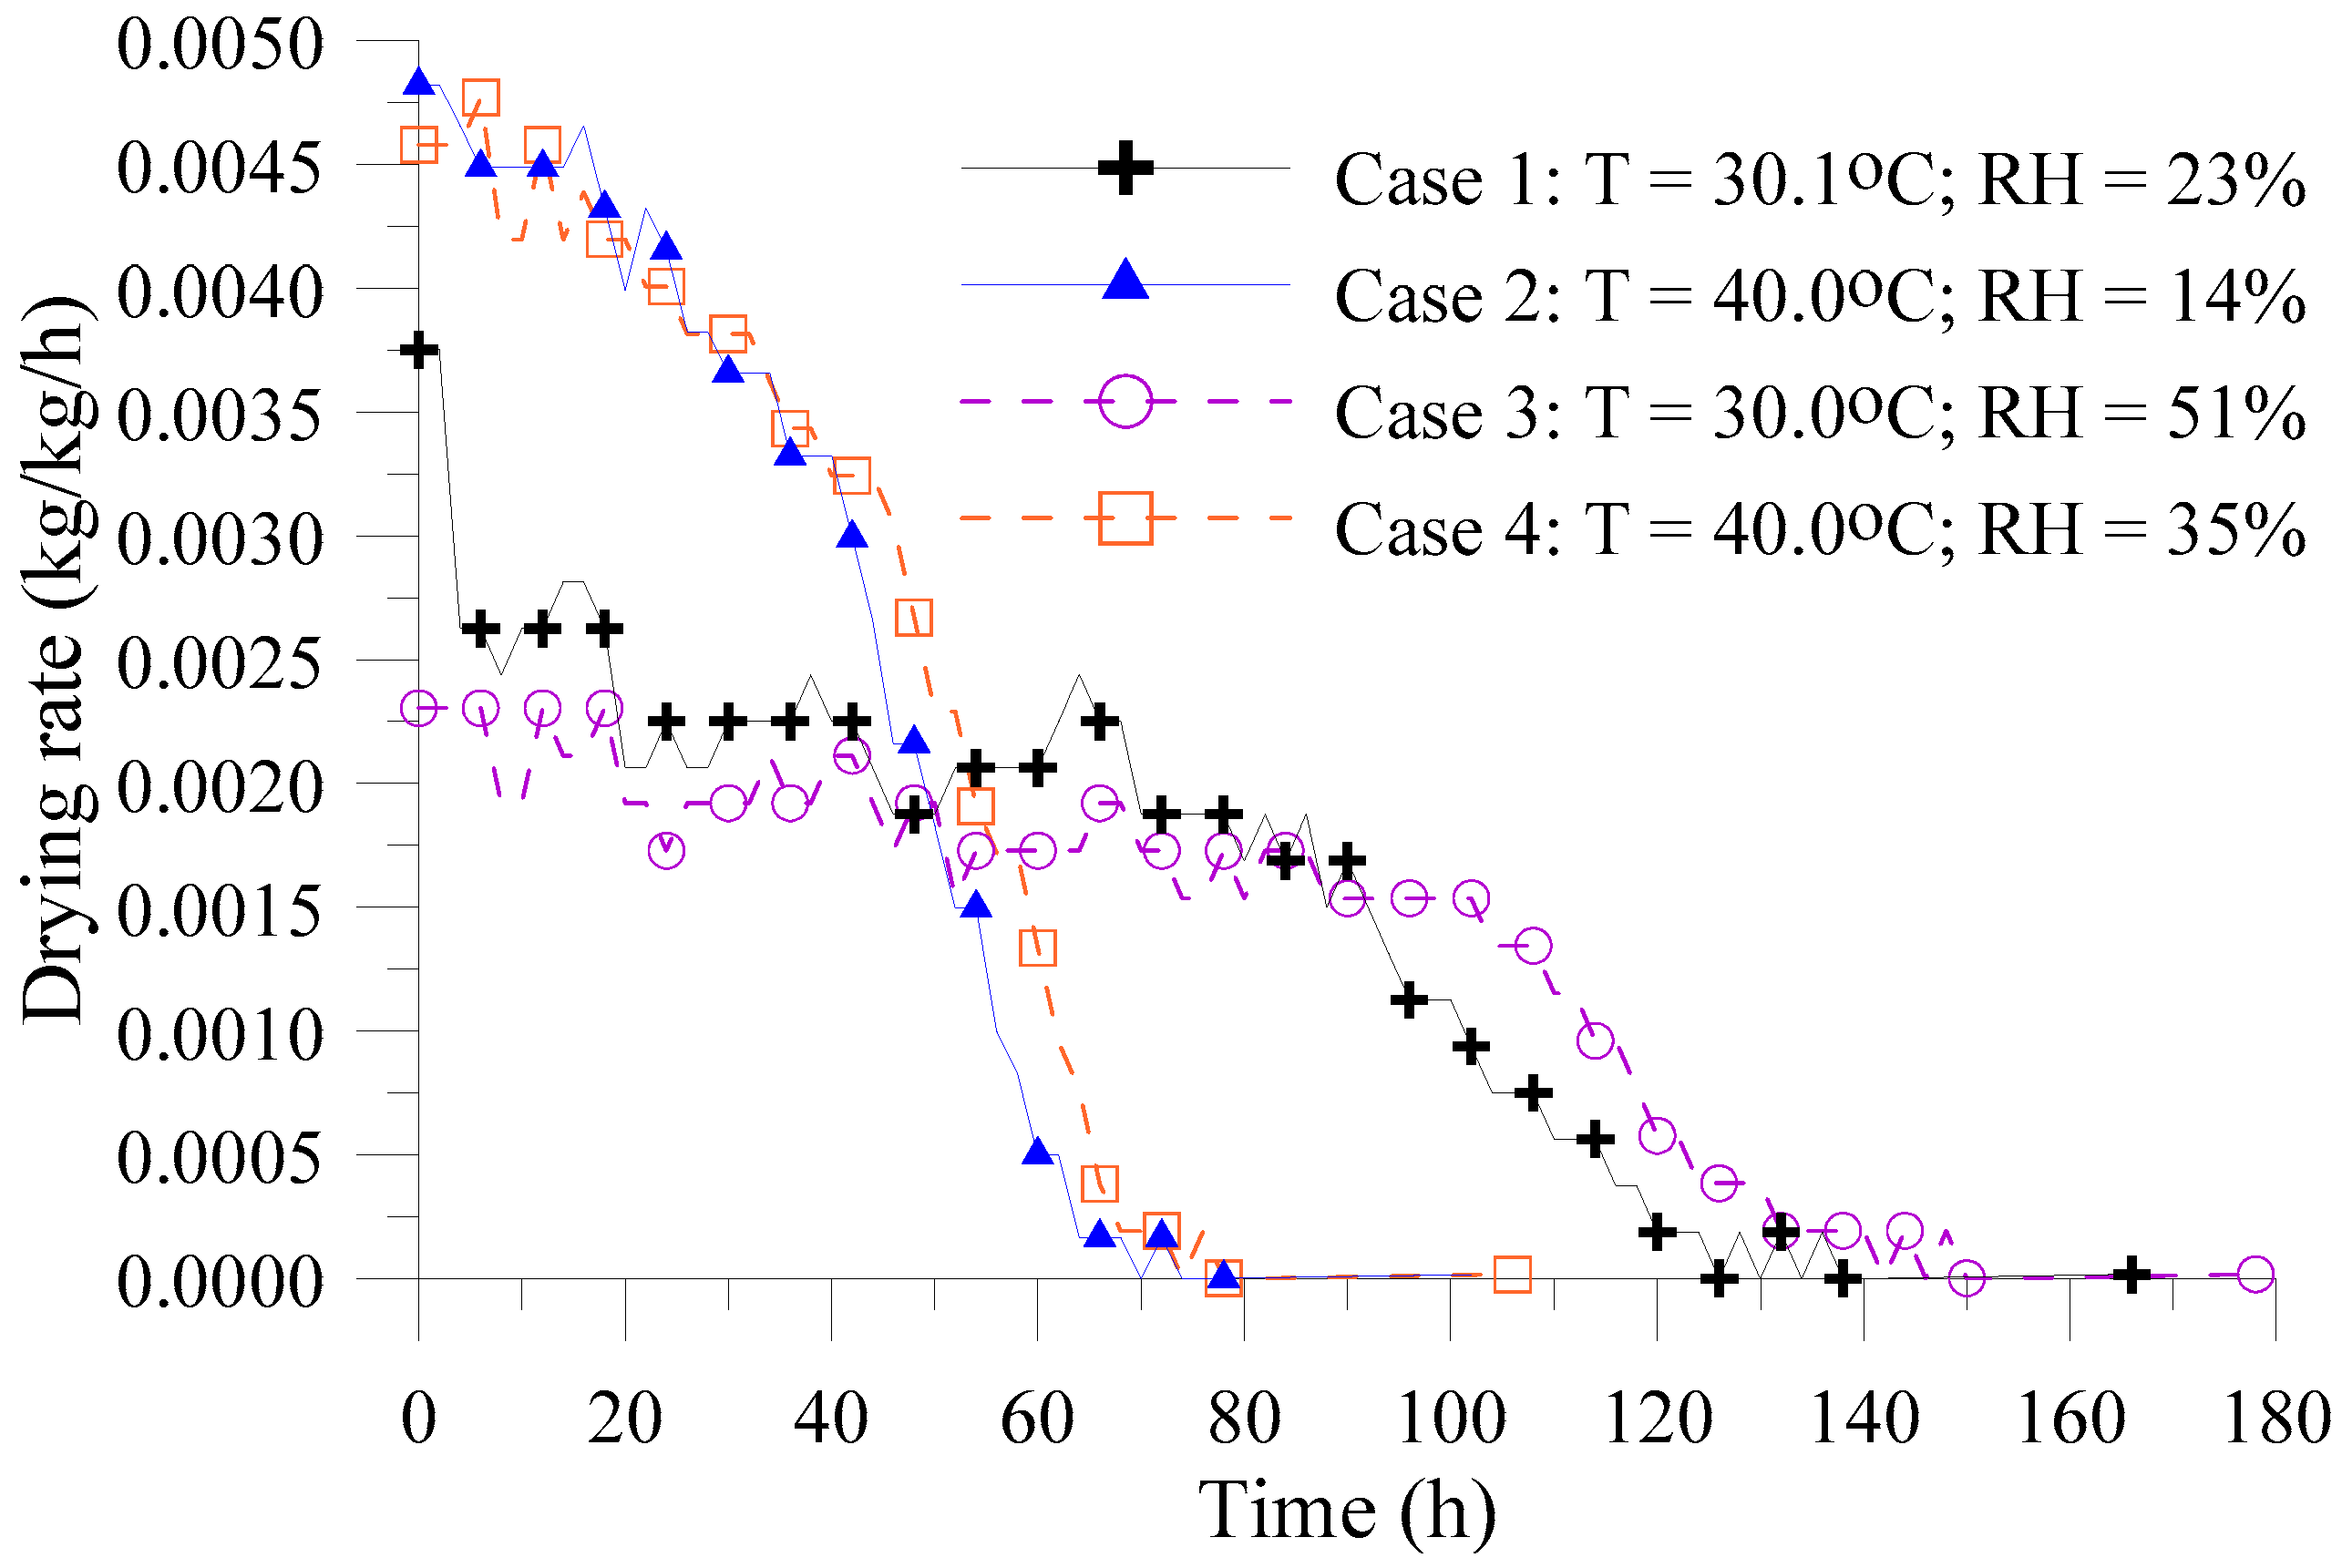
Analyzing the average moisture content curves as a function of time for each of the analyzed cases, there is a feeling of a linear relationship between the two variables in the initial moments of the process, which would indicate the first drying stage, in which the water evaporation rate from the product does not change with time. However, when analyzing the drying rate curves as a function of time (
Figure 6), it is observed that the drying rate is already decreasing with time in the initial moments of the process, although more accentuated decays are observed, in general, in the second half of the drying experiment. In the final moments of the drying process, a curvilinear decay of the drying rate as a function of time is observed, tending to zero when approaching the hygroscopic equilibrium condition.
The lack of a constant drying rate period was also reported in the literature for drying ceramic bricks [
8,
36], industrial ceramic blocks [
5,
35] and sisal fiber [
40] with drying air temperatures varying between 50 and 100 °C. However, for such cases, the most accentuated decay of the drying rate with time occurred in the initial moments of the process. Reasons for this outcome are the lower values of initial moisture content of the samples and the higher values for drying air temperature, material composition, volumetric shrinkage behavior and part geometry, which are all factors that influence the effective mass diffusivity of the product.
Analyzing
Figure 6, we observe the proximity between the drying rates for Cases 2 and 4 during practically the entire process. Cases 1 and 3 also show similar drying rates during most of the process.
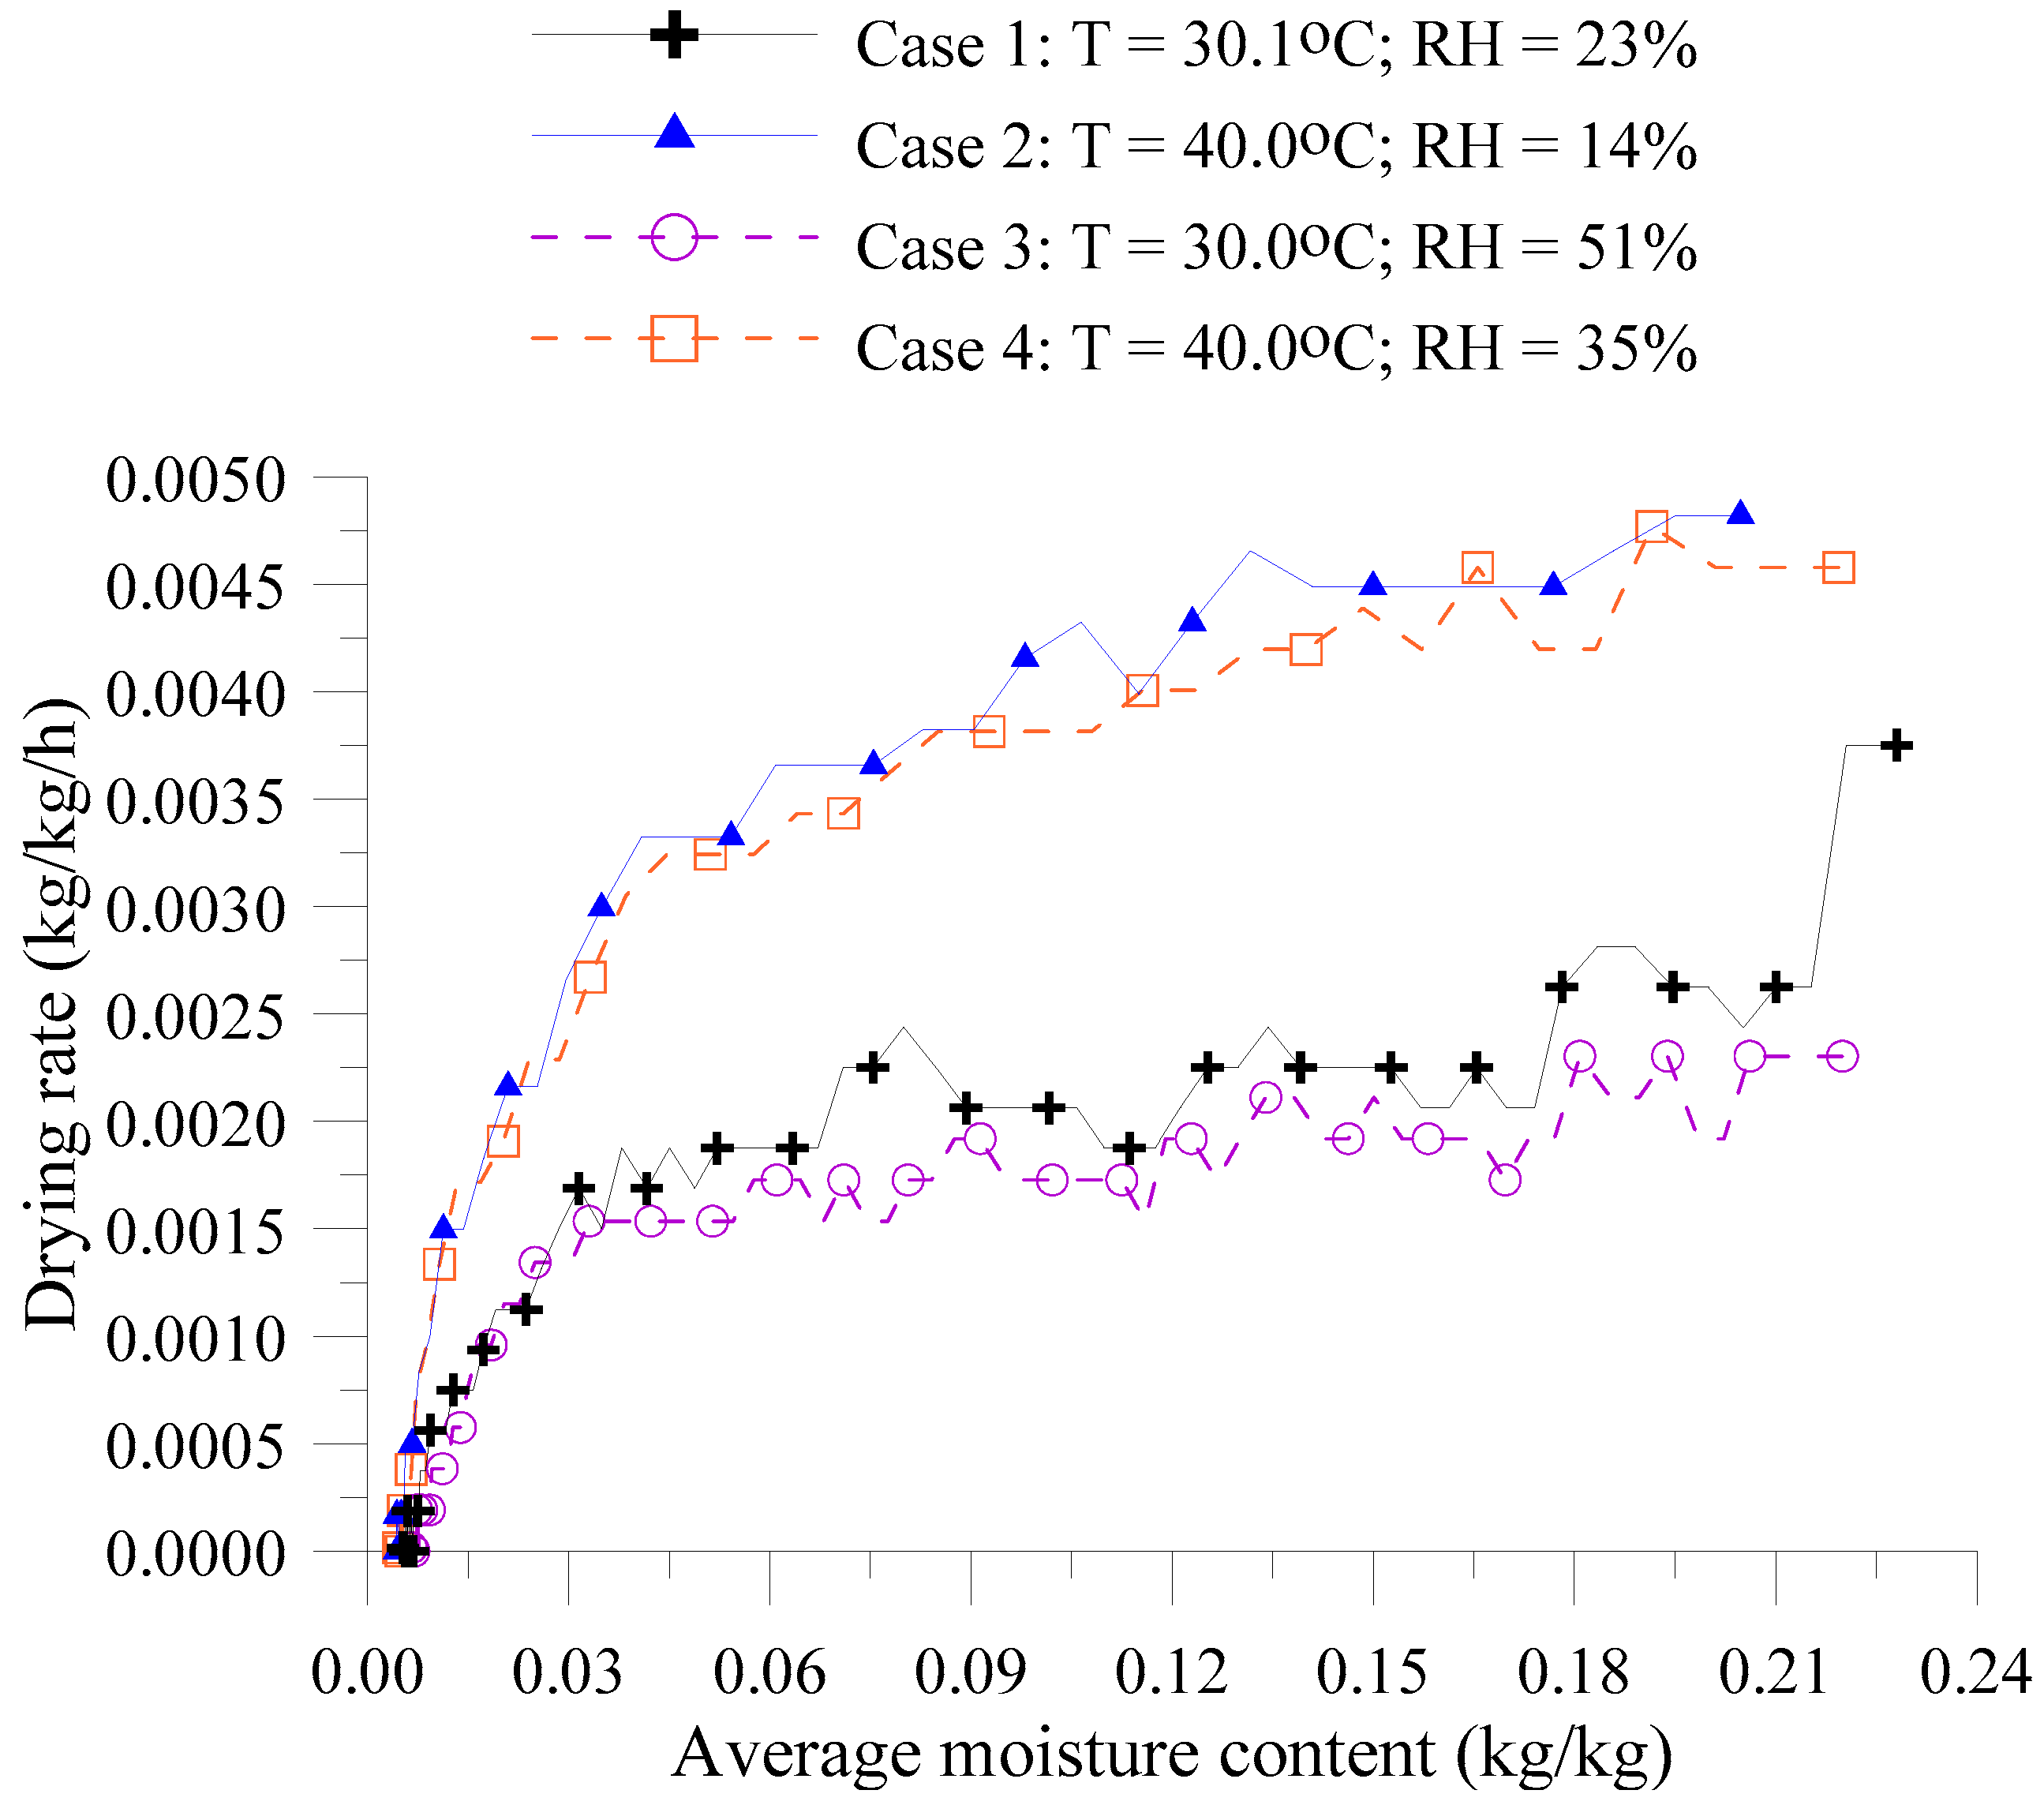
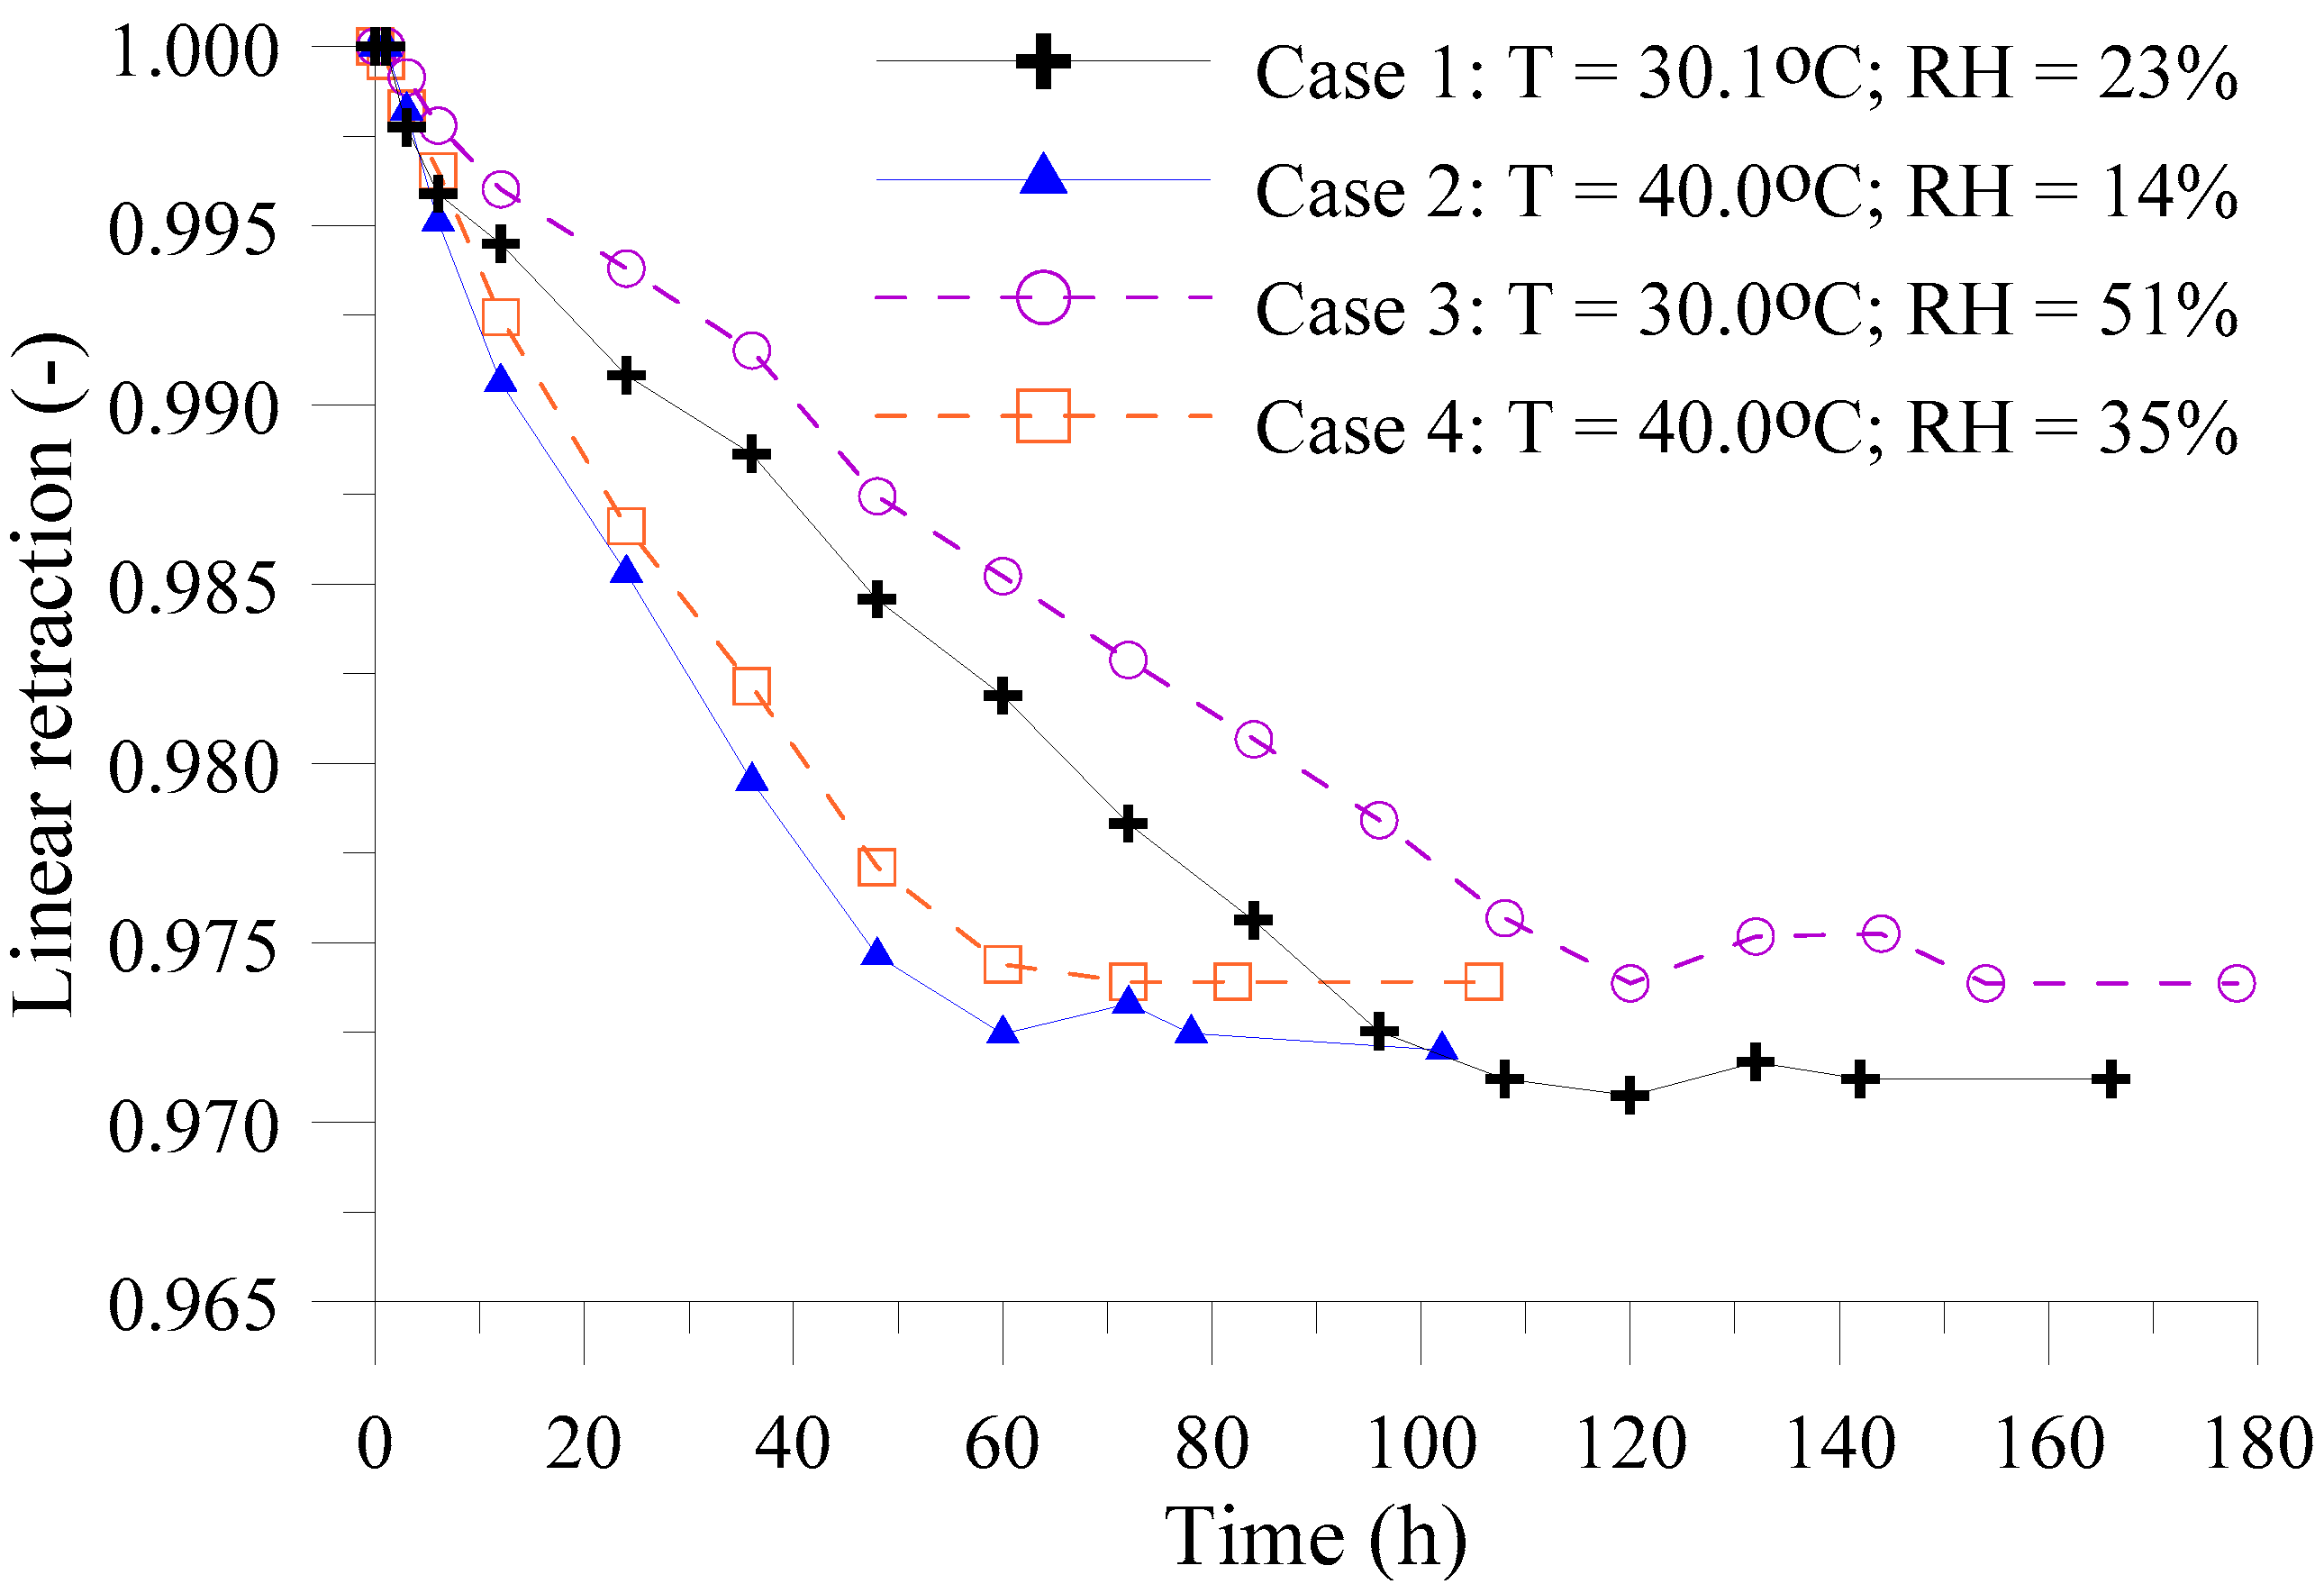
Figure 7 illustrates the comparison between the drying rates of the samples as a function of the average moisture content for all analyzed cases. It is noticed that, for all experiments, there is a more accentuated decay in the drying rate when the average moisture content of the sample approaches to 0.03 kg/kg.
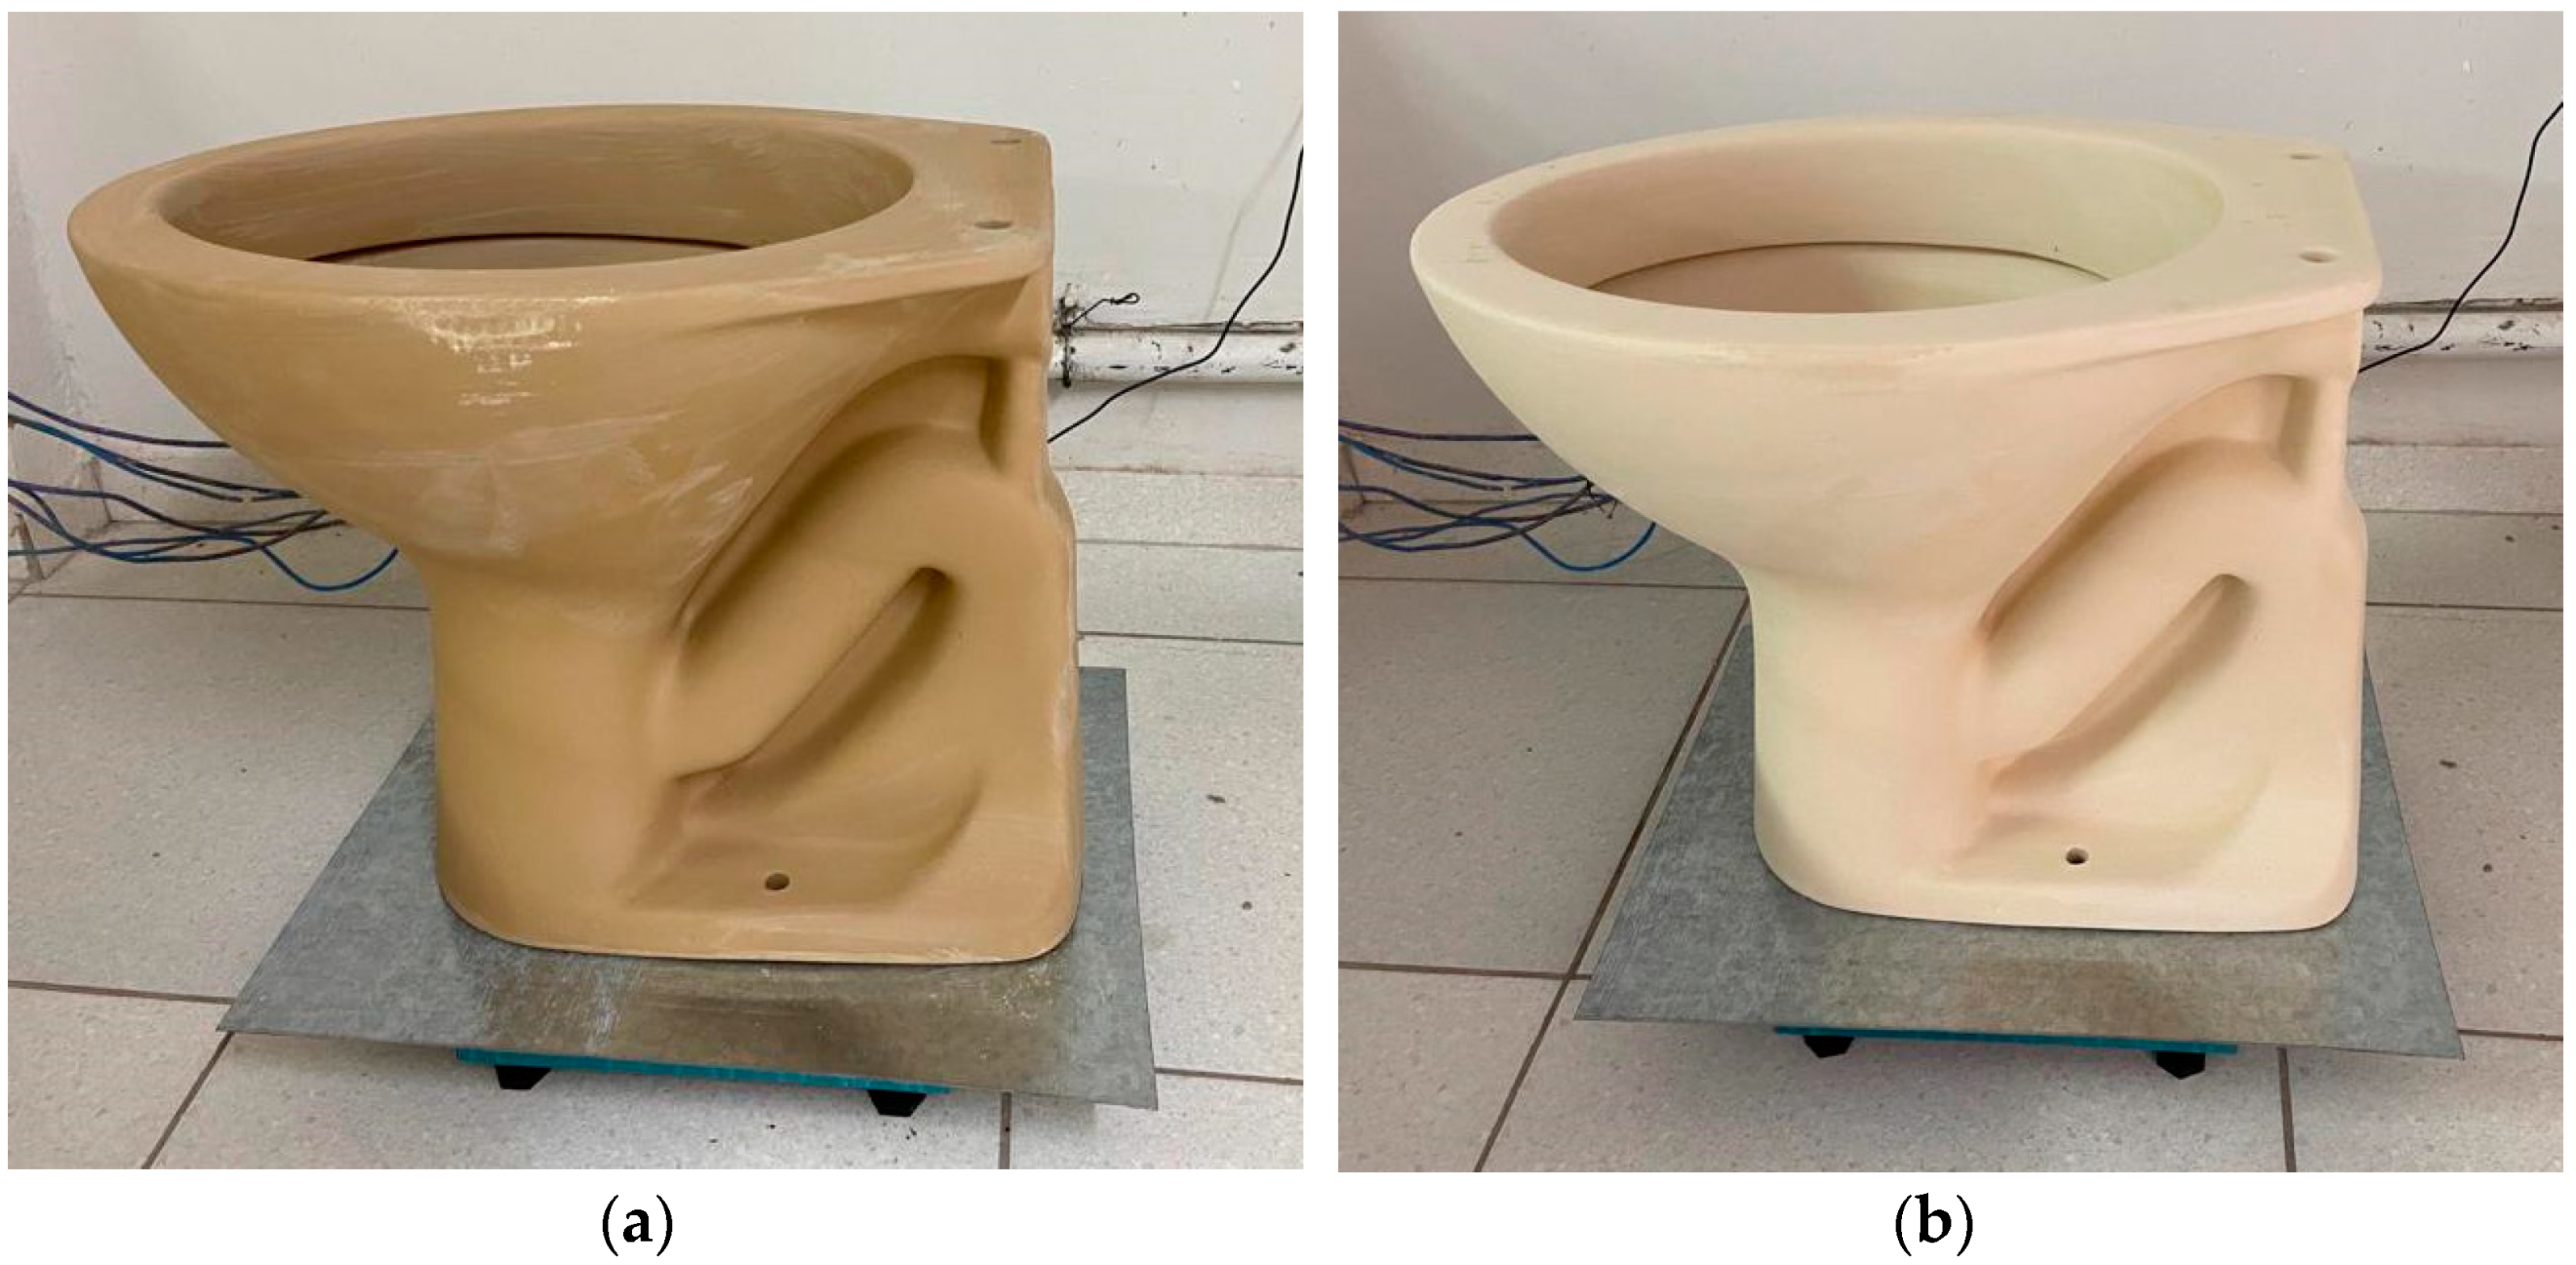
Figure 8 show images of the sample used in Case 3 at the beginning and end of the drying process. It is possible to observe a change in the color of the piece due to the loss of moisture and heating during the experiment. However, no cracks or fissures were observed as a result of the drying process. This result is in line with expectations, as these defects only occur when temperature gradients and moisture content in the part are high; for ceramic materials, the tendency is for this to happen at higher drying air temperatures and lower air relative humidity. These results corroborate those obtained by Silva [
36], who only observed small cracks in hollow ceramic bricks for temperatures above 80 °C, and Silva [
35], who reported small cracks in industrial hollow ceramic blocks for temperatures above 60 °C.
3.2. Heating Kinetics
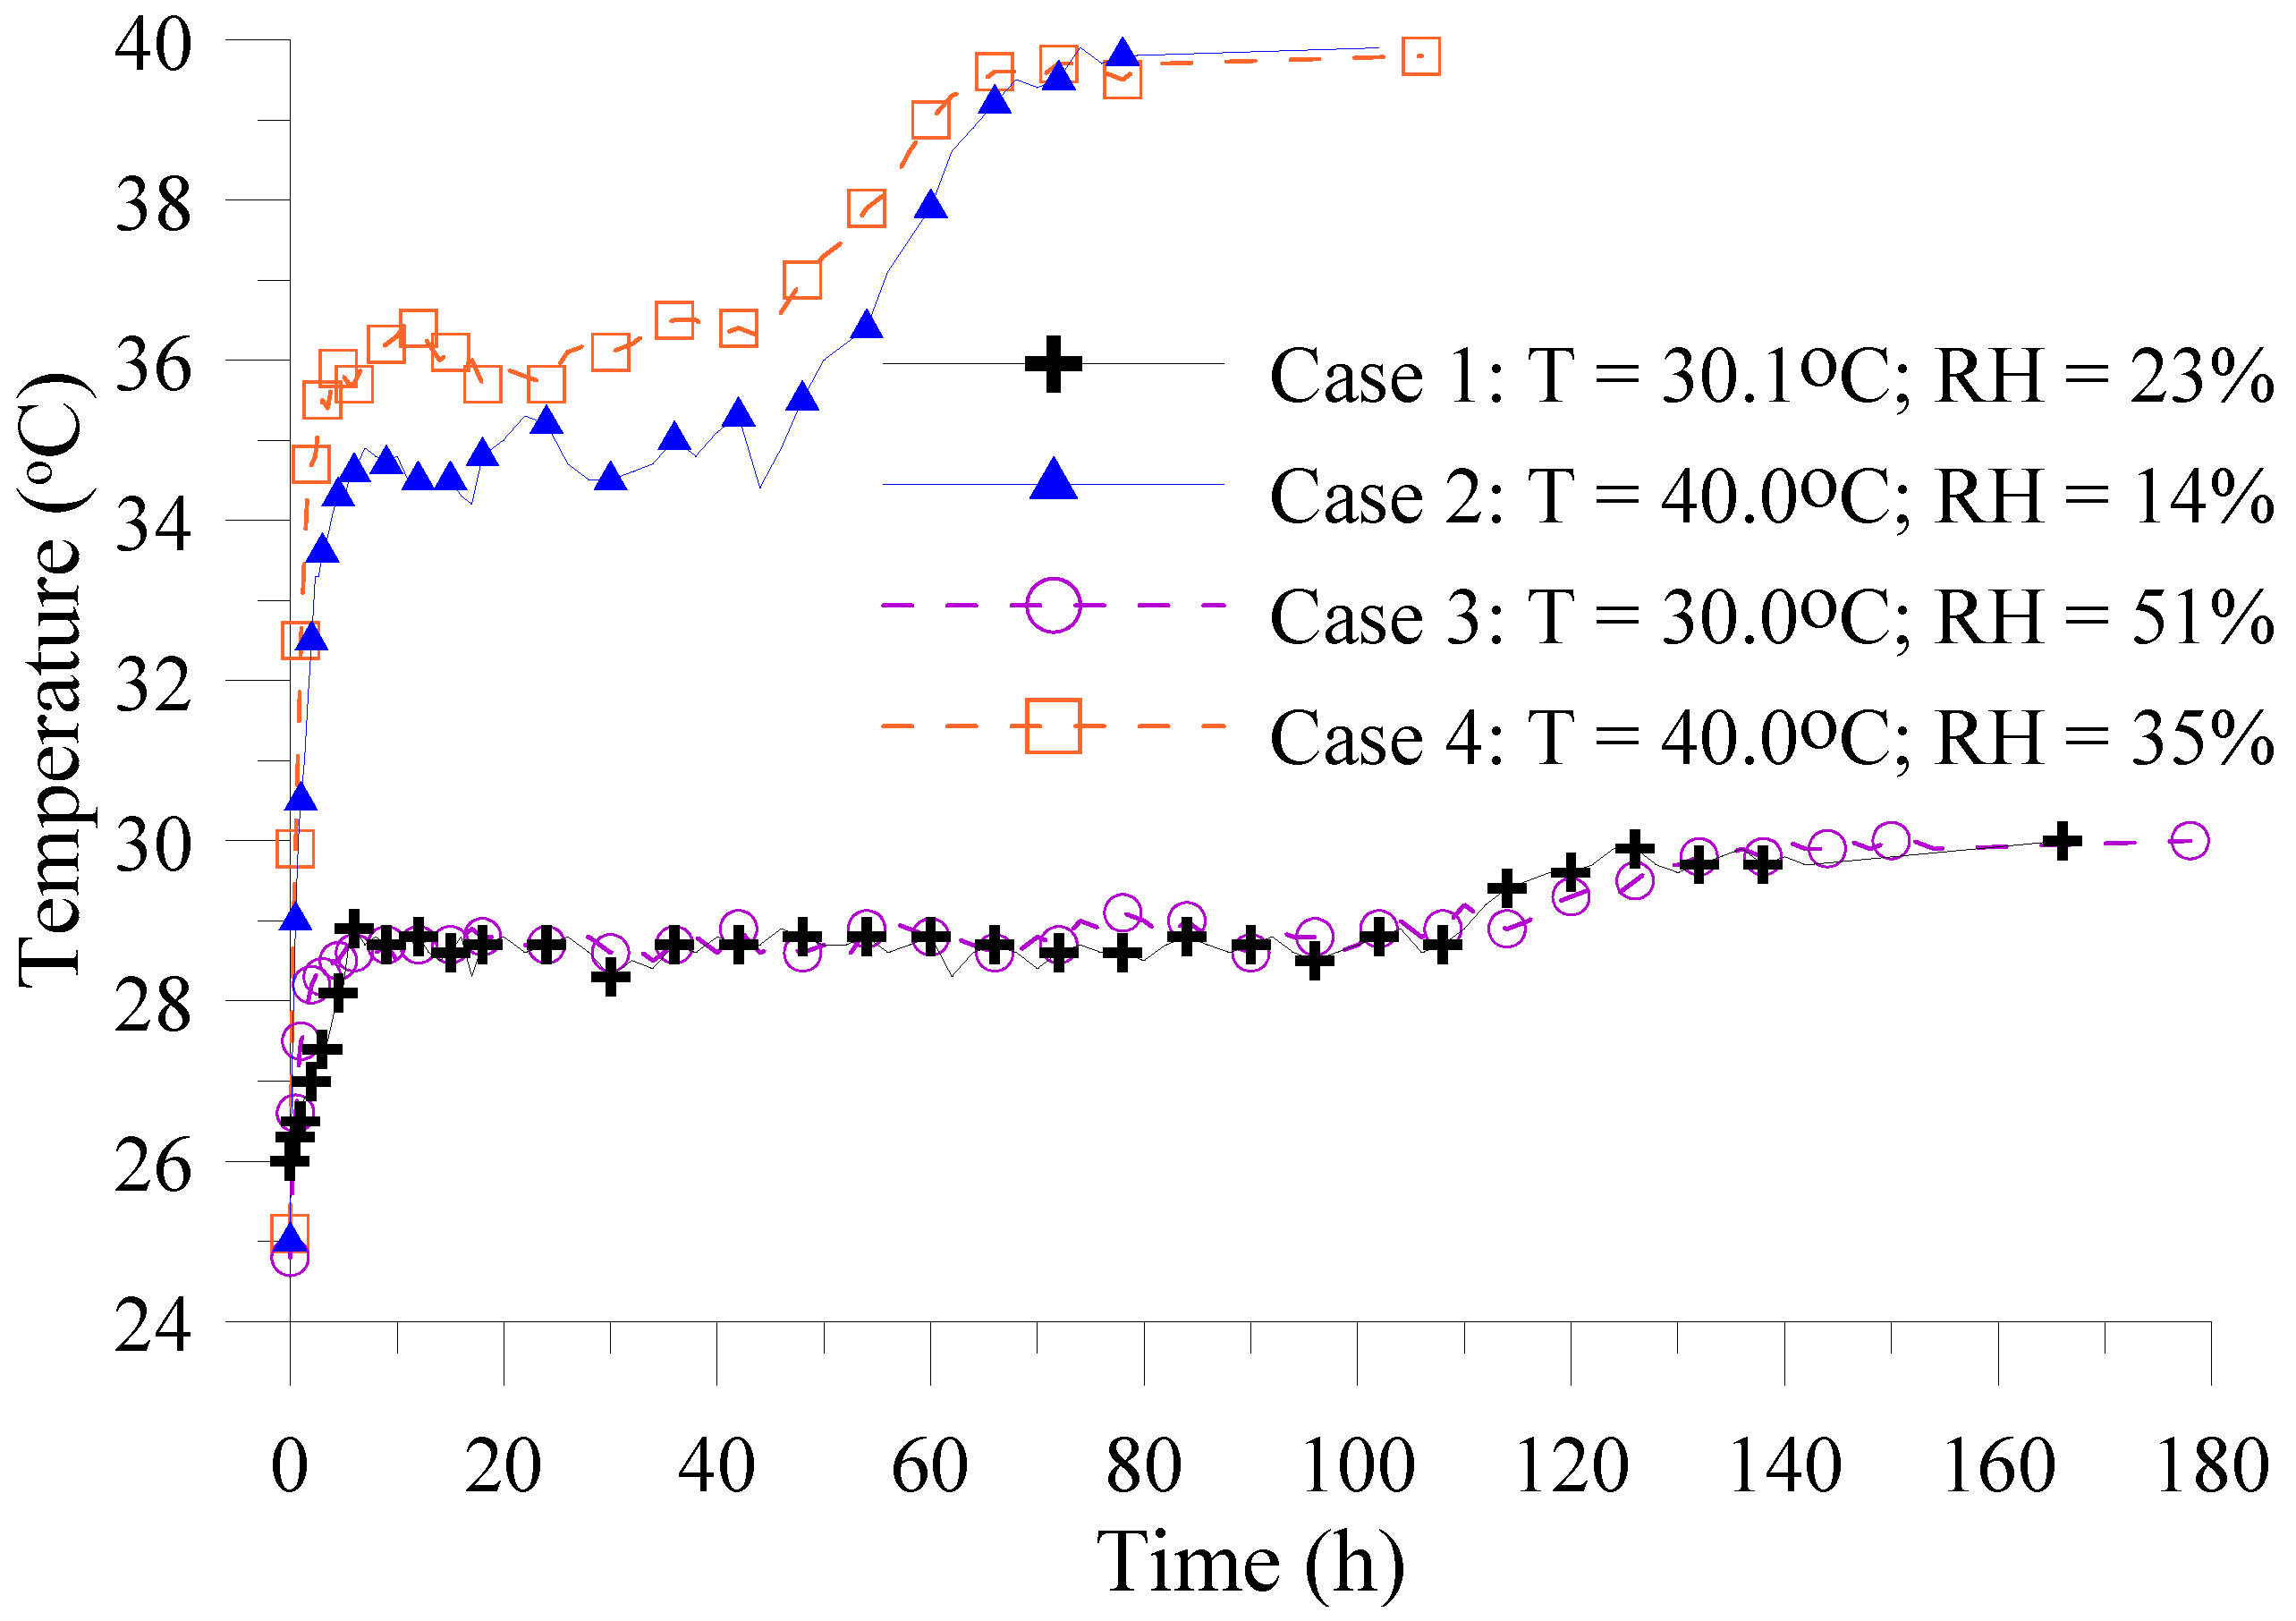
From
Figure 9, which illustrates the surface temperature of the sample as a function of time, it can be seen that, for all the cases analyzed, the surface temperature of the sample increases rapidly from its initial value to an intermediate value, while between the initial temperature and the drying air temperature, it remains oscillating at this intermediate value for a good part of the experiment; only at the end of the process does its value approach the temperature of the drying air, i.e., the thermal equilibrium condition.
From observations made during the experiments, it was noticed that the surface temperature increased again at the moment when the change in the color of the sample became more evident, which was already in the final stage of the drying process. Thus, it is reasonable to assume that the change in sample color modified the emissivity of the material, which was a variable that directly influenced the temperature read using the digital infrared thermometer. Moreover, at this drying moment, the sample was almost dried and the energy absorbed by it was used almost in totality as sensible heat to increase its temperature.
The sharp increase in the surface temperature of the samples in the initial moments of the drying processes is a characteristic of the first falling-rate period, being one more indication that, in the experiments carried out, there was no first stage of drying. The constant drying-rate period occurs at constant temperature with values equal to the wet bulb temperature of the drying air.
Among the experiments carried out at 40 °C, it can be seen that the intermediate temperature at which its value oscillated was higher for the case with higher relative humidity (Case 4). In addition, it is observed that both the cases reached the upper temperature level at approximately the same instant of time. The experiments carried out with a temperature of 30 °C showed very similar behavior throughout the entire experiment, both in terms of the intermediate temperature value and in the instant when the upper temperature level was reached.
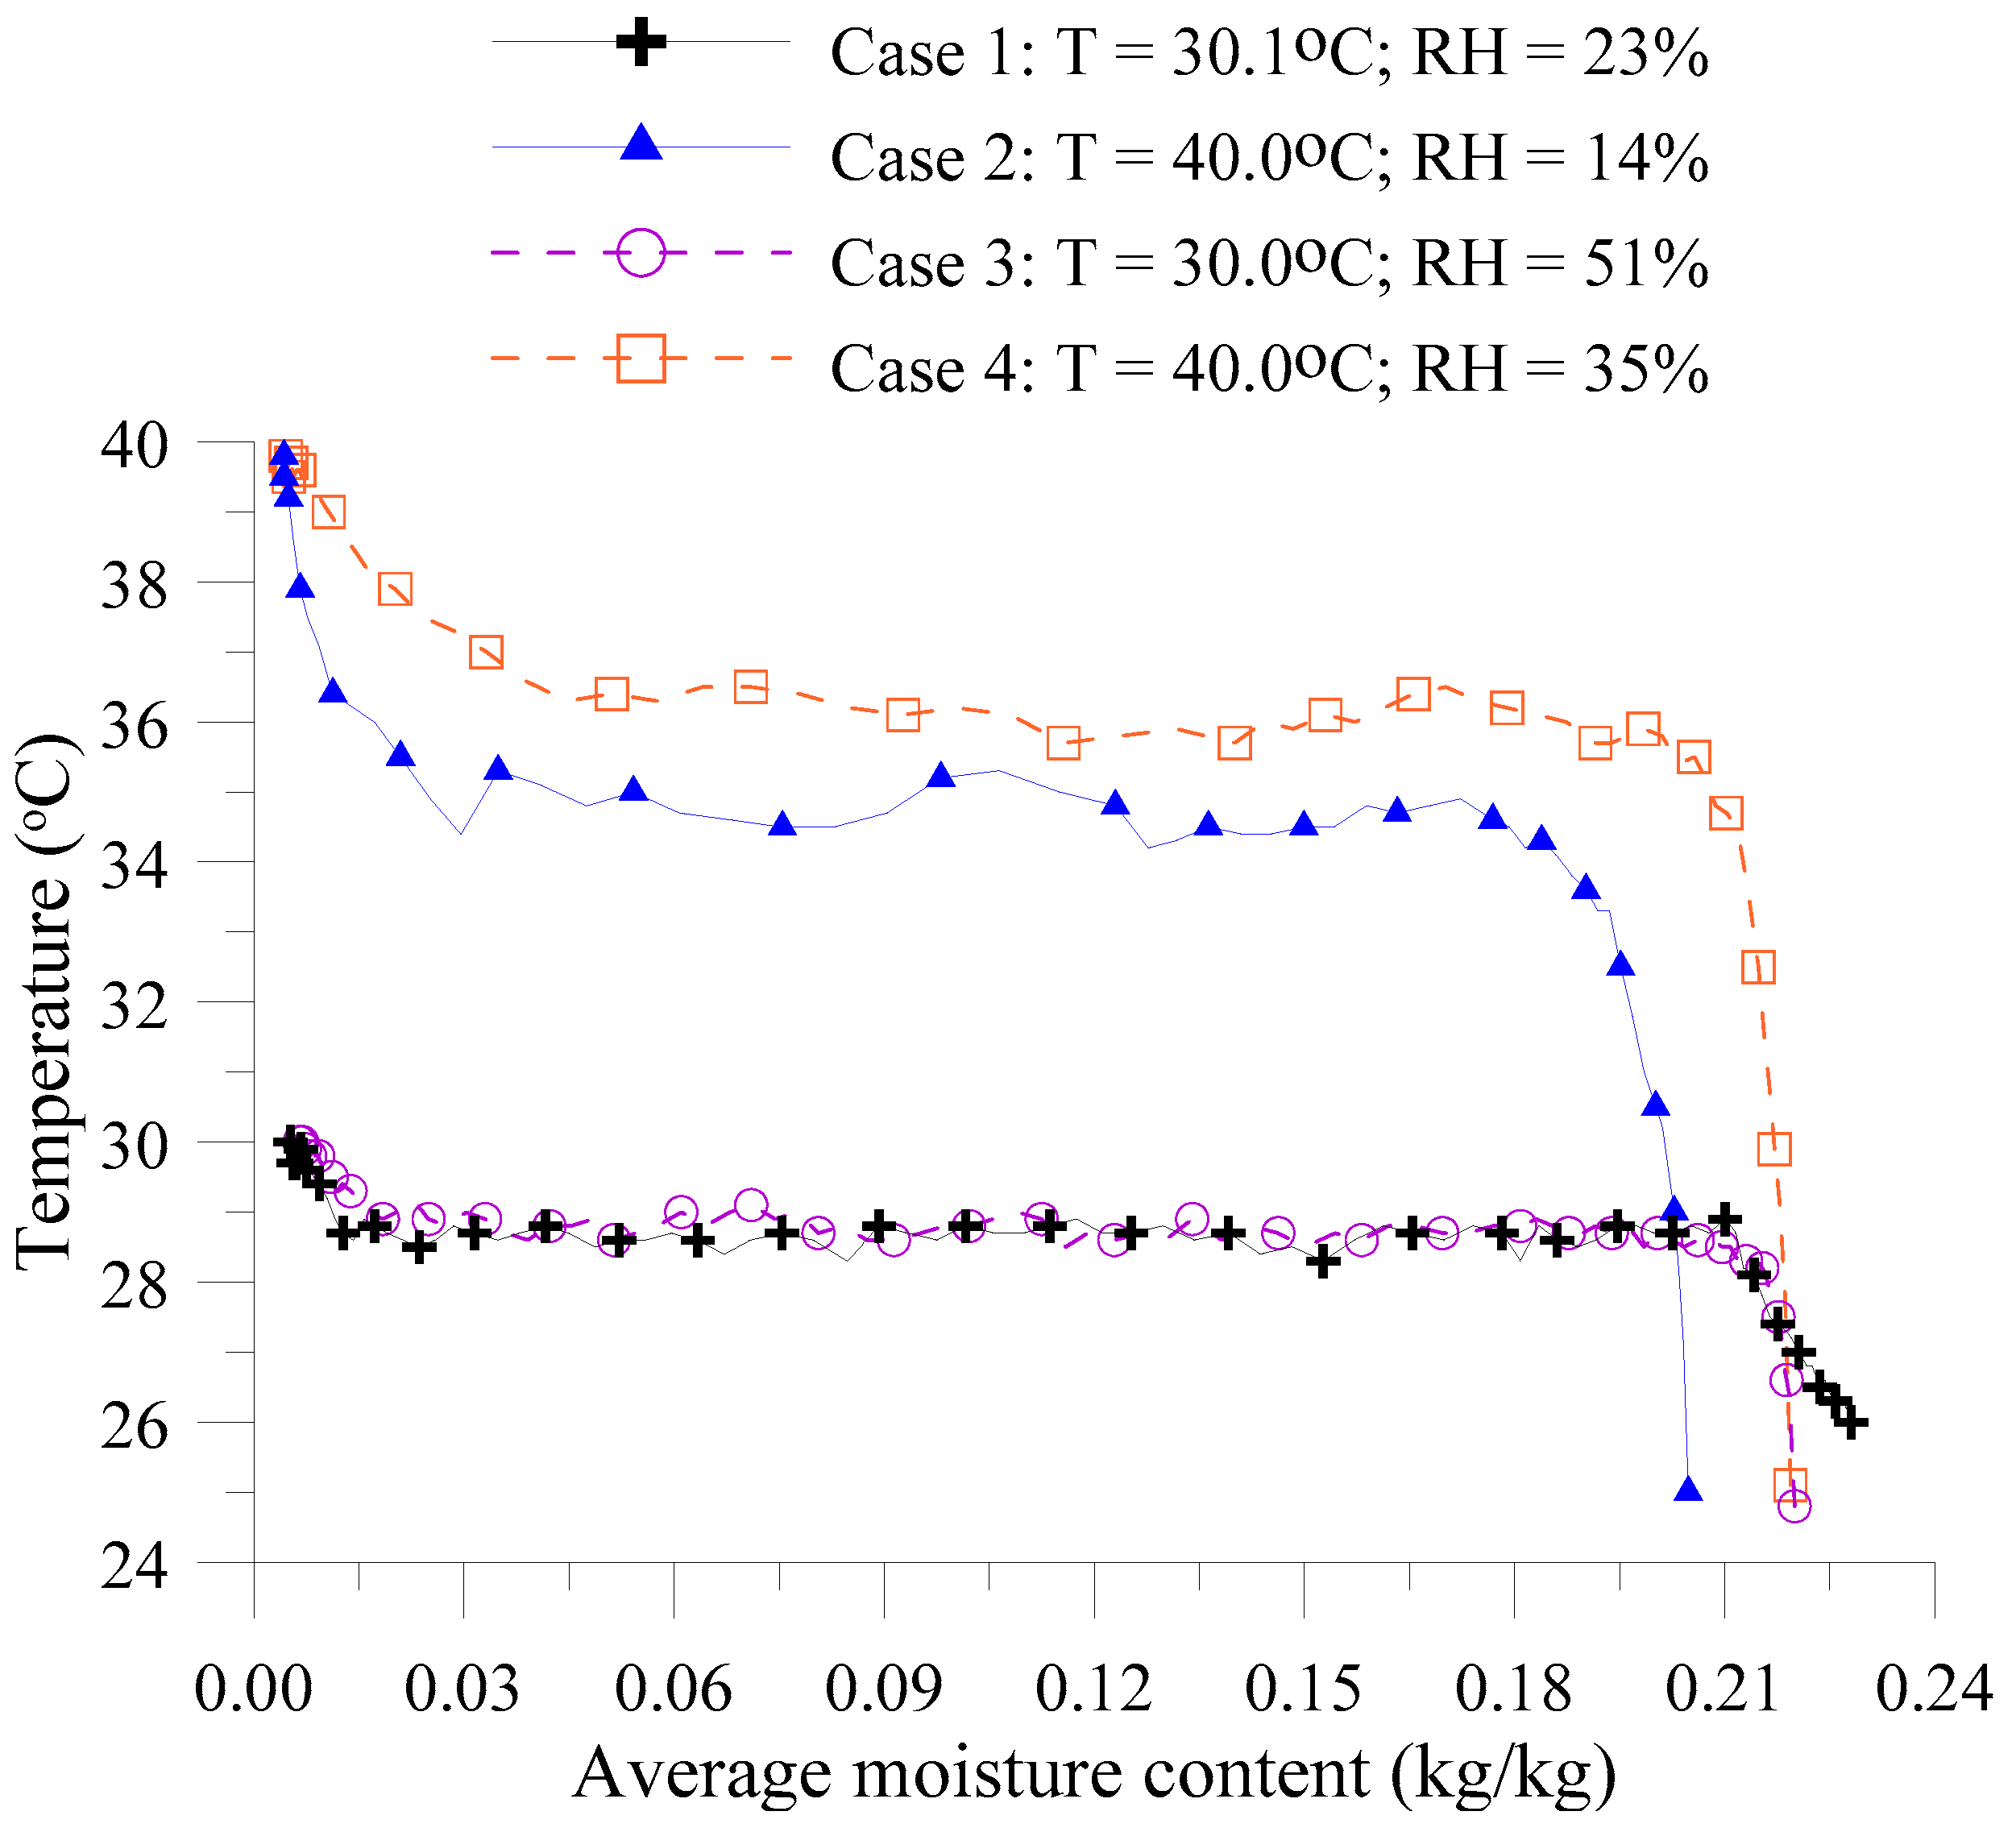
Figure 10 shows the comparison between the surface temperatures of the samples as a function of the average moisture content for all analyzed cases. Once again, it is evident that the surface temperature of the sample increases rapidly from its initial value to an intermediate value, with a small variation in the average moisture content, and remains at this level until the average moisture content reaches a value close to 0.03 kg/kg. From this drying moment, the temperature increases again, approaching the temperature of the drying air.
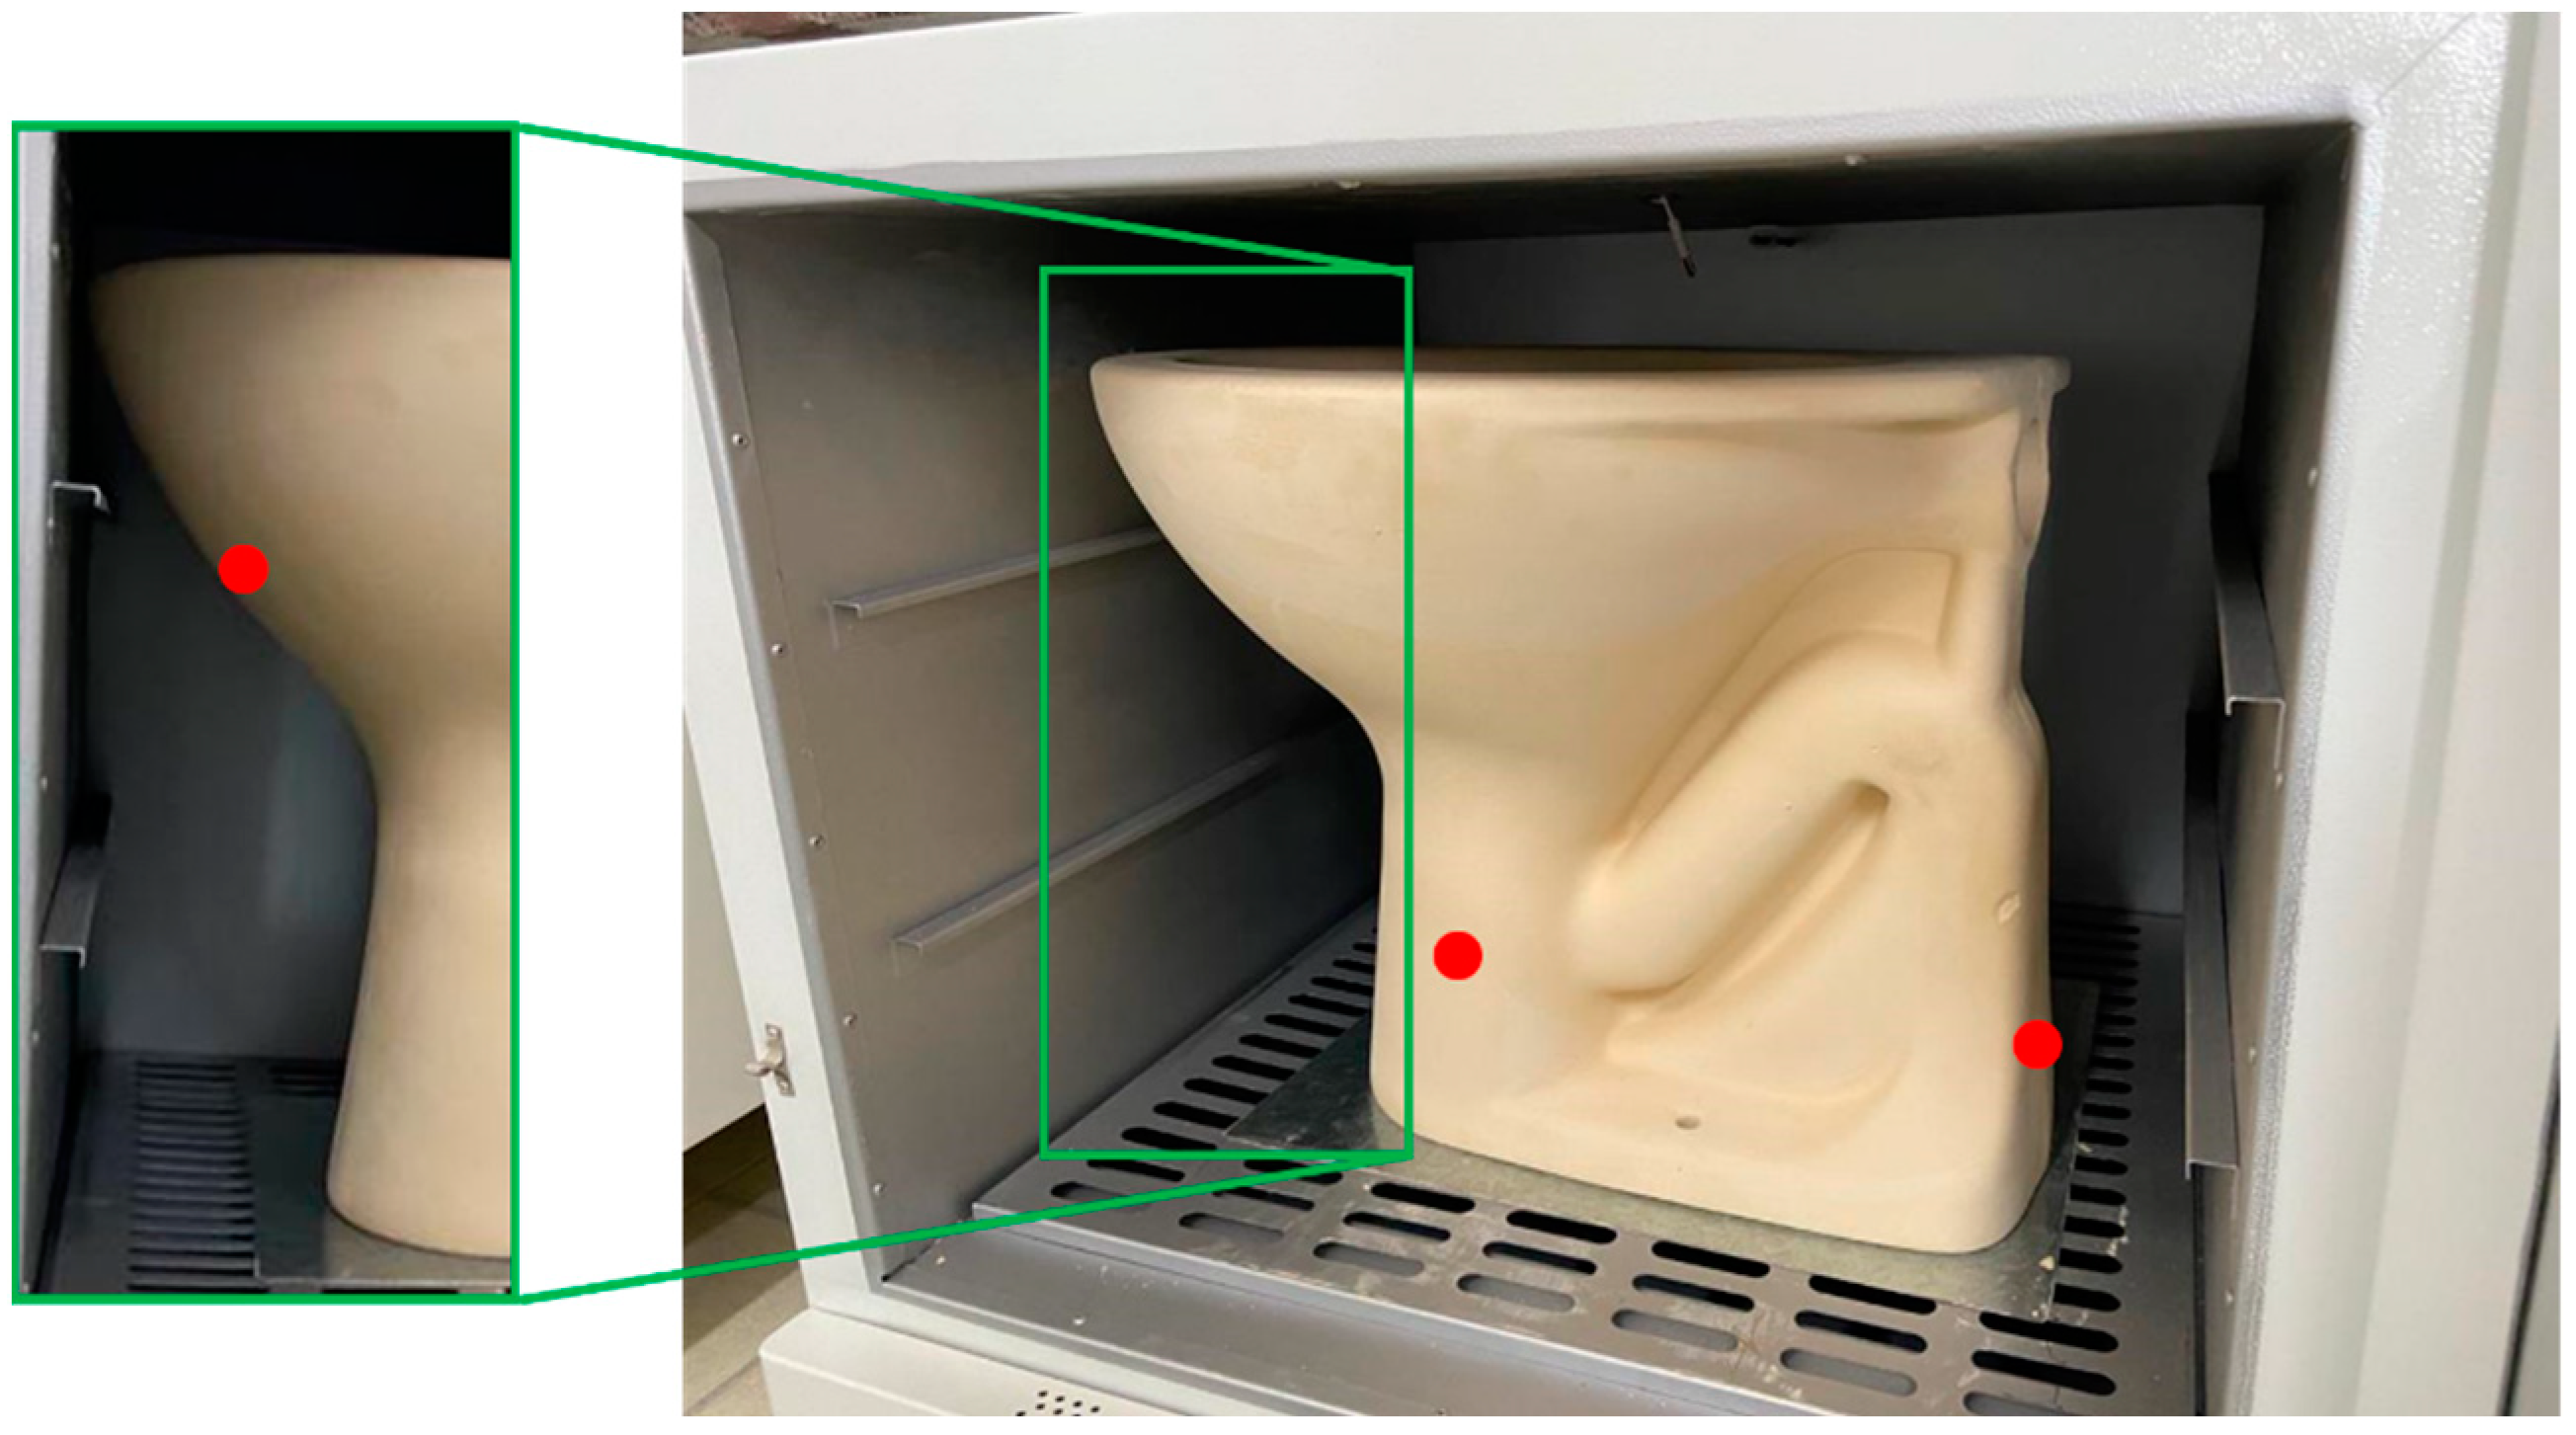
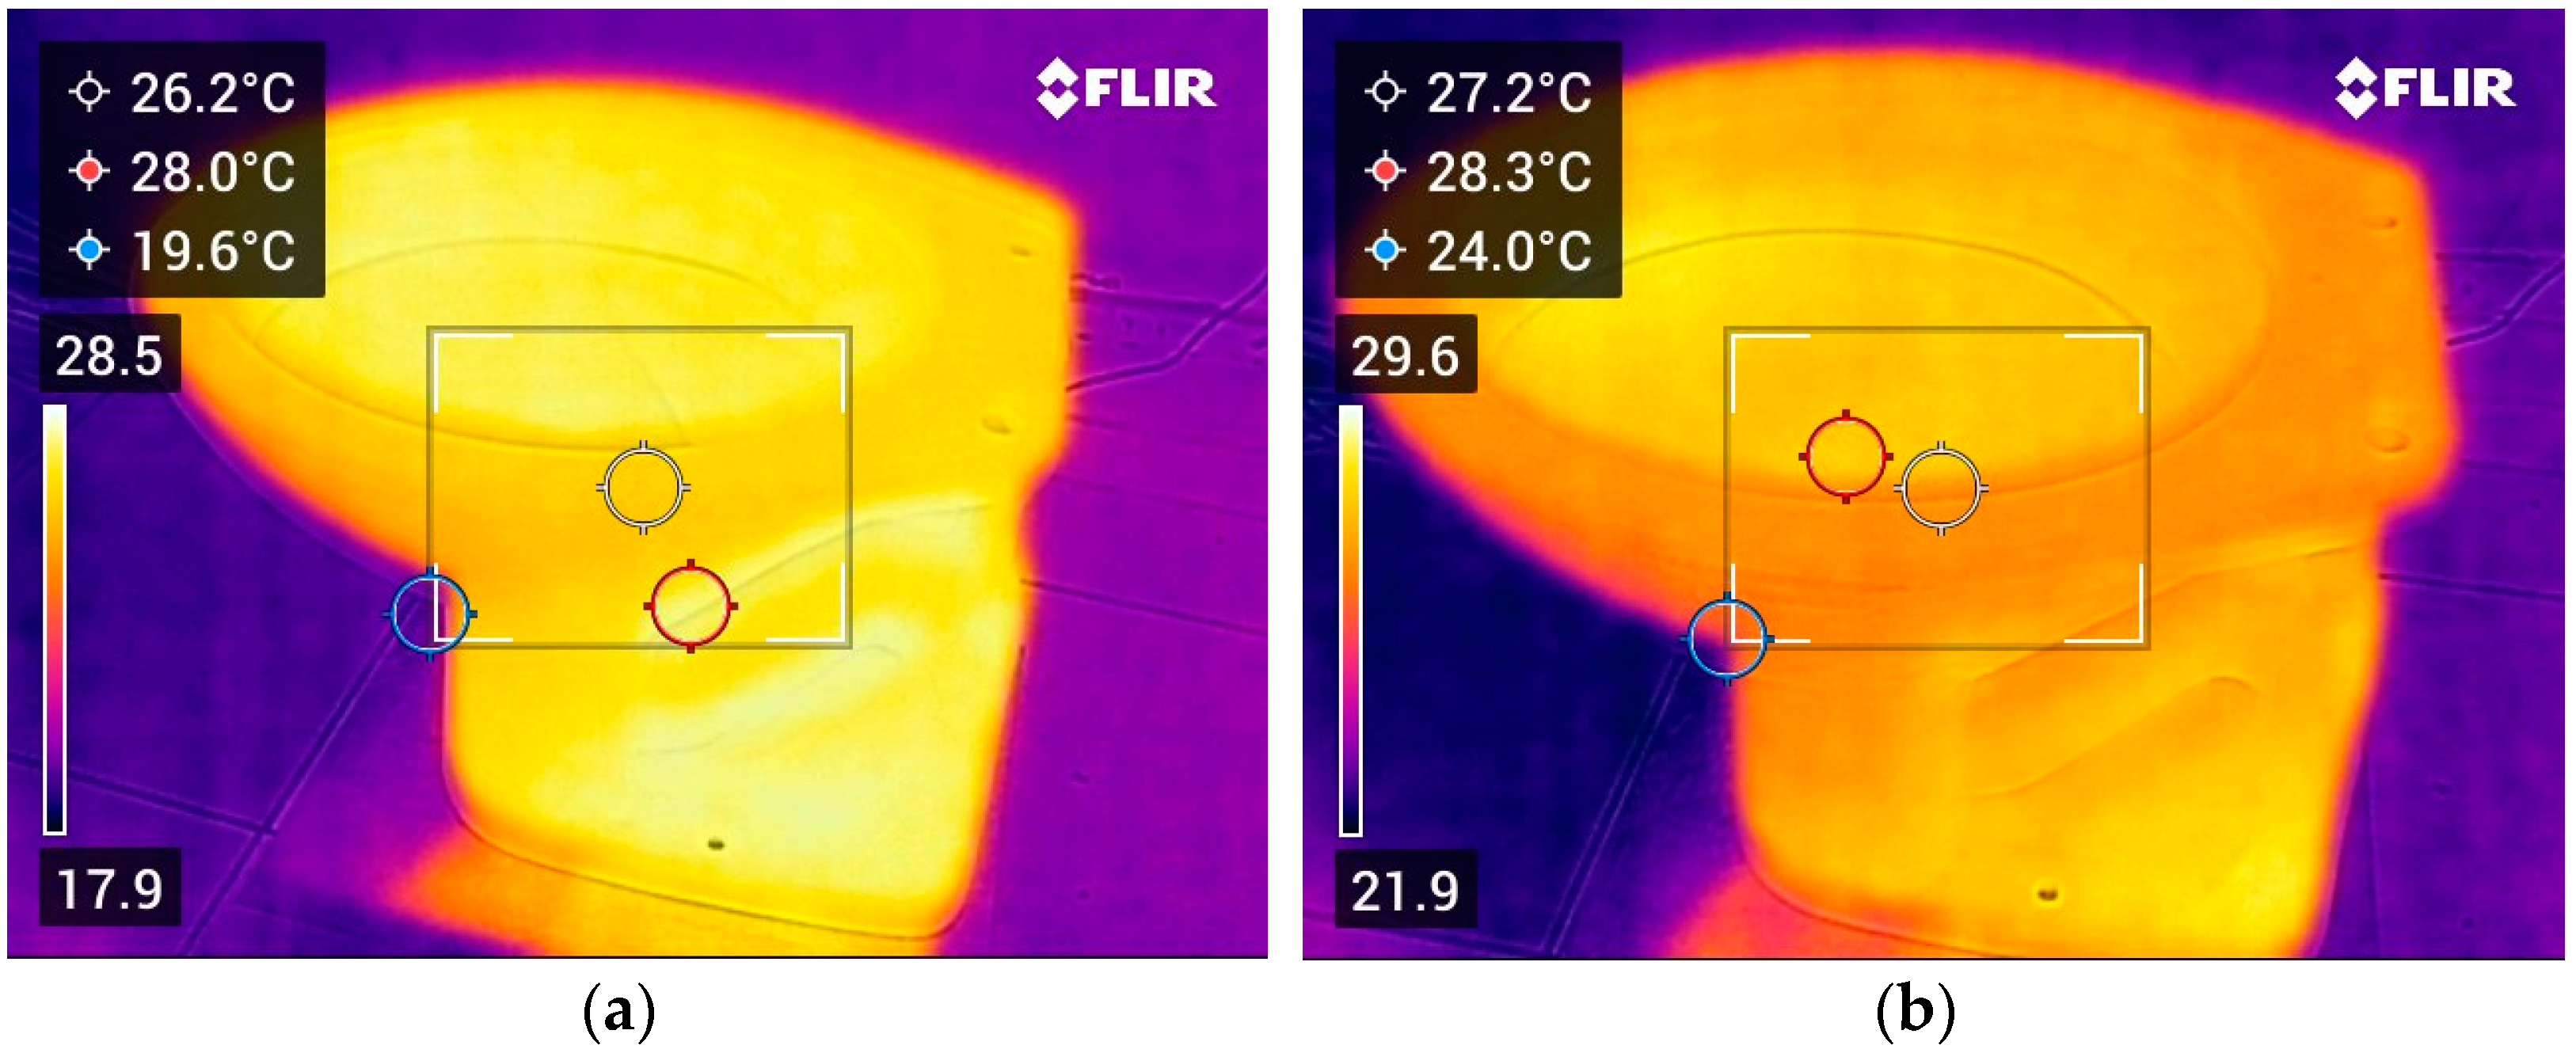
Figure 11 shows the thermograms obtained in two instants of time for Case 3 (LABFILM; T = 30.0 °C; RH = 51%). The first time instant was at the intermediate temperature level (t = 36 h), while the second time instant was at equilibrium condition (t = t
e = 178 h). In the thermogram, it is possible to identify the temperature variations in different points of the parts. From the analysis of the
Figure 11, it can be noticed that the temperatures obtained are slightly below the values presented previously for surface temperature. This result occurred because the measurements used to create the graphs of surface temperature versus time were taken using a digital infrared thermometer when the sample was inside the oven, while the images shown in
Figure 11 were obtained from a thermographic camera with the sanitary toilet in the digital scale for weighing. In the time interval between removing the toilet from the oven, placing it on the scale, closing the oven door and writing down the mass before taking the photo, there is a heat transfer from the sample to the environment, reducing its temperature.
Table 3 indicates the initial moisture content (M
0), the equilibrium moisture content (M
e), the time needed to reach the equilibrium condition (t
e) and the equilibrium surface temperature (θ
e) for each of the experiments. It is observed that despite the identical time interval between removing the sample from the mold and the beginning of the drying experiment, which was approximately two and a half hours, there is a reasonable difference in the initial moisture content of the samples.
The highest initial moisture content was observed for the sample used in Case 1, with a value of 0.22806, while the lowest value was observed for Case 2, with a value of 0.20479; this variation represents a difference of 0.02327 in absolute terms and 11.20% in percentage terms. Comparing these results with the results presented in
Table 2, it is noticed that higher values of initial moisture content are not associated with higher values of initial mass.
The reasons for the different values obtained for the initial moisture content are the possible different air conditions in the casting sector of the partner company during the steps of filling the mold, draining the excess slip and removing the parts from the mold; the rest period of the part in the mold; and mold moisture absorption efficiency. The final factor, according to Cavalcante [
4], tends to decrease with the increase in cycle counts.
Upon examining
Table 3, it is evident that the higher the temperature inside the oven, the shorter the time needed to reach the equilibrium condition (t
e), and that, for two experiments carried out at the same temperature, the time was shorter for lower values of relative humidity. In this way, the ascending order of the total drying time for the experiments was 2-4-1-3.
It is observed that the difference between the total drying time for the experiments carried out at a temperature of 40 °C was only four hours. As for the experiments carried out with a temperature of 30 °C, the difference in the total drying time was 12 h. This result indicates that relative humidity has a greater influence on the total drying time for a temperature of 30 °C. Such differences in the values of the total drying time, identified between experiments carried out at the same temperature, would be greater if the values of initial moisture content (M0) were closer.
It can be seen that the ascending order of the equilibrium moisture content (Me), i.e., 2-4-1-3, was equal to the ascending order of the time to reach the equilibrium condition (te), i.e., the higher the drying air temperature, the lower the value of Me, and for the same temperature, the lower the relative humidity, the lower the value of Me.
Table 4 indicates the time interval required to reduce the moisture content from 0.20 to 0.15 (Δt
M = 0.20→0.15), from 0.20 to 0.10 (Δt
M = 0.20→0.10), from 0.20 to 0.05 (Δt
M = 0.20→0.05) and from 0.20 to 0.01 (Δt
M = 0.20→0.01). Normally, companies in the sanitary ware sector define a fixed time, based on experience, for which each type of product must remain in the pre-drying sector before moving to the drying stage. Usually, this time varies from one to three days, depending on the type of product [
41]. A better way to manage this process would be to define the ideal moisture content in which the product should be dried at a high temperature, for example, when its value is equal to 0.15. Based on the desired moisture content and the air conditions in the environment where the drying at low temperatures is being carried out, it is possible to estimate how long the product should remain in the pre-drying sector before being transferred to drying at high temperatures.
In this way, it is possible to adapt the pre-drying time of the product depending on the air conditions in the environment, which can vary significantly at different times of the year, to verify if there is poor control of the process parameters. In addition, this methodology serves as a decision-making tool to obtain a shorter operating time in the pre-drying sector, providing a reduction in energy consumption.
The same ascending order that was observed for the total drying time can also be observed for the time intervals required to reduce the average moisture content from 0.20 to 0.15, 0.10, 0.05 and 0.01, i.e., Cases 2-4-1-3. In this way, the higher the temperature inside the oven, the shorter the time intervals required to reduce the average moisture content from 0.20 to 0.15, 0.10, 0.05 and 0.01, while for two experiments carried out at the same temperature, the time intervals are shorter for lower values of air relative humidity.
Comparing the time intervals for experiments carried out at the same temperature, it is noticed that there is a greater proximity between the cases carried out at 40 °C than the cases carried out at 30 °C, as well as between the varied total drying times (te).


 ,
, 


