

Integration Optimization of Integrated Solar Combined Cycle (ISCC) System Based on System/Solar Photoelectric Efficiency
1
Key Laboratory of Power Station Energy Transfer Conversion and System, Ministry of Education, National Thermal Power Engineering & Technology Research Center, School of Energy, Power and Mechanical Engineering, North China Electric Power University, Beijing 102206, China
2
China Academy of Building Research, Beijing 100013, China
*
Author to whom correspondence should be addressed.
Energies 2023, 16(8), 3593; https://doi.org/10.3390/en16083593
Submission received: 29 March 2023
/
Revised: 16 April 2023
/
Accepted: 19 April 2023
/
Published: 21 April 2023
(This article belongs to the Topic Energy Saving and Energy Efficiency Technologies)
Abstract
:Integrated solar combined cycle (ISCC) systems play a pivotal role in the utilization of non-fossil energy; however, the efficient application of solar energy has emerged as a primary issue in the study of ISCC systems. Therefore, it is extremely urgent to propose the best optimization scheme for ISCC under different operating conditions. In this paper, according to the idea of temperature matching and cascade utilization, the optimization of the ISCC system is carried out with the genetic algorithm for the whole working conditions, and the optimization schemes with the highest photoelectric efficiency and system efficiency under different working conditions are derived. In comparison with two optimization schemes with different objective functions, the conclusion can be drawn that: At 100% gas turbine load—30% DNI and 100% gas turbine load—100% DNI working conditions, respectively, the maximum system efficiency of 56.32% and the maximum solar photoelectric efficiency of 35.5% are attained. With the decreasing of gas turbine load, the solar energy integration position will gradually change from the topping cycle to the bottom cycle; with the gas turbine load variation from 100% to 75%, the optimal photoelectric efficiency model prefers two-stage integration, and up to 141.3 MW of solar energy could be integrated, which is greater than the maximum value of 127.1 MW for the optimal system efficiency model. Regarding the heat collection choice of bottom cycle, the optimal photoelectric efficiency model prefers the high-pressure boiler (HPB), while the optimal system efficiency model prefers the high-pressure superheater (HPS). The comparison between the optimal solution and the actual cases confirms the correctness of the optimization results and provides guidance for the subsequent ISCC study.
1. Introduction
To cope with the increasing energy shortage and environmental pollution, countries around the world have set increasingly stringent carbon emission policies and strive to meet the ultimate target of carbon neutrality in the coming decades [1]. Therefore, efficient use of non-fossil energy sources is becoming increasingly significant. However, independent renewable energy systems suffer from bottlenecks, such as high volatility, high investment costs and low efficiency. To address this inherent drawback, a coupled renewable energy and fossil energy power generation system can not only alleviate the impact of non-fossil energy on grid load, but also lower the investment threshold of renewable energy. More importantly, relying on fossil energy systems with higher initial parameters means higher power generation efficiency can be achieved.
In order to utilize solar energy resources more effectively, solar energy is coupled with the conventional fossil energy system, which not only shares part of the power equipment of the fossil energy system, but also improves the thermodynamic parameters of solar power generation. The complementary system, with the solar energy coupling into gas-steam combined cycle, is called the integrated solar combined cycle (ISCC) system. This concept was firstly proposed by Luz Solar International Company [2]. Solar energy can be integrated into the topping Brayton cycle to preheat the compressed air, and can also partially replace any stages of heat exchangers in bottom Rankine cycles to heat the working medium. At present, some ISCC plants have been constructed and are operating in USA, Morocco, Algeria, Egypt, Iran and other countries [3].
In recent years, there has been a lot of research on ISCC systems. Some scholars [4,5] have studied the thermodynamic and economic performance of ISCC systems, and the advantages of the system, in terms of economy, investment and carbon emissions, are illustrated. Behar et al. [6] addressed the technical route and research status of the ISCC which integrated with a parabolic trough solar collector (PTC). Okoroigwe et al. [7] presented the current status of ISCC systems integrated with solar towers (ST) and analyzed the technical impediments to the practical application of these complementary integration systems. Zhang et al. [8] established the dynamic model of the ISCC system and proposed the stable operation strategies with DNI change for two different types of ISCC systems: with and without energy storage. Ameri et al. [9] studied the thermodynamic performance, thermo-economic and life cycle assessment of the ISCC system, and analyzed the percentage of exergy loss of each major component, which reflected the low environmental impact of the ISCC system. Horn et al. [10] conducted an economic assessment of the ISCC system to be set up in Egypt, and obtained the net present value (NPV) of the power plant, the levelized electricity cost (LEC), the incremental solar cost and the solar electricity productions; then, a sensitivity analysis of the LEC, with the discount rate, the investment fees, the grant disbursement and the gas price variation, was done. Duan et al. [11] established an off-design operating condition model of the ISCC system, and investigated the system characteristics of ISCC under different environmental conditions and regulation modes.
Owing to the great volatility of solar energy, and the fact that it can be integrated into different components of the ISCC system in a variety of methods, means that there are a variety of solar integrated ISCC schemes; as such, there are many differences between different schemes in performance, cost, etc. In order to study a better integration scheme, some scholars have conducted comparative studies between them. Elmohlawy et al. [12] studied two different layouts of the ISCC system and concluded that the output power of the bottom cycle ramped up to approximately 43 MW, which was approximately 8% of the overall ISCC, while the annual thermal performance of the ISCC system was also given. Nezammahalleh et al. [13] compared three different systems: an ISCC system with direct steam generation (DSG), a solar electric generating system (SEGS), and an ISCC system with heat transfer fluid (HTF), and the result indicated that the LEC of ISCCS-DSG is lower than those of the other two systems, due to lower investment fees and superior thermoelectric efficiency. Montes et al. [14] compared the performance of the same ISCCS-DSG system in two regions with different climatic conditions: Las Vegas and Almeria, and found that, although the higher temperature in Las Vegas affected the performance of the benchmarking system, the better irradiation intensity which, coupled into the ISCC system, compensated for this deficiency, and the results showed that the cost of photoelectricity at Las Vegas was lower than that at Algeria. Franchini et al. [15] have studied the photoelectric efficiency of ISCC-PTC and ISCC-ST, and the analysis revealed that the annual photoelectric efficiency of ISCC-ST was greater than that of ISCC-PTC because it could achieve higher collector efficiency. Rovira et al. [16] investigated the performance differences between two types of ISCC systems: ISCCS-DSG and ISCCS-HTF, in which solar energy was integrated in four different solar integration layouts, respectively, and the analysis revealed that the best performance of the ISCC layout was ISCC-DSG, in which solar energy was integrated in the evaporation area. Elmorsy et al. [17] conducted a comparison of the four solar thermal collector technologies of ISCC systems: DSG, linear Fresnel collectors, ST, and PTC, and the results showed that the ISCC system integrated with Fresnel collector achieved the highest exergetic efficiency and the lowest cost of electricity generation.
However, a comparative study between only a few cases does not fundamentally address the question of how to make efficient use of solar energy in complementary systems. Some scholars have established a generic thermodynamic model of the ISCC system and defined a mathematical expression for the impact on the original GTCC due to the integration of solar energy using the formula derivation method, a generalized generic ISCC performance evaluation index was given [18,19]. Some other scholars optimized the ISCC system model in terms of performance, economics, carbon emissions, operational flexibility, etc., with optimization algorithms such as genetic algorithm (GA), particle swarm optimization (PSO), gravitational search algorithm (GSA), etc. Brodrick et al. [20,21] have optimized the ISCC system with the objective function of profit, power generation and maximum solar integration share, with constant collector temperature or constant power generation. This optimization study helped to enhance the operational flexibility of this system. Immediately afterwards, the above scholars carried out a multi-objective optimization of the ISCC system with net present value and carbon emissions as the objective functions, and an optimal integration scheme considering these two objective values was carried out. Shaaban [22] established a thermodynamic model of the ISCC generating system equipped with the multi-stage flash (MSF) desalination system; furthermore, a multi-objective optimization of the system, regarding power generation and desalination capacity, was performed, and the optimization system was capable of producing 16,364.2 m3/day of water and 126.2 MW of electricity. Nabati et al. [23] conducted a thermo-economic investigation of ISCC, and used GA to optimize the thermodynamic parameters, and solar field to reduce annual operating costs (1.1 M$/year) and increase the bottom cycle power production (16.8 MW). Baghernejad et al. [24] adopted GA to optimize the exergoeconomic investigation of the ISCC system, with the objective function of investment cost and exergy destruction cost. The optimal scheme decreased the electricity cost of the topping and bottom cycle by 1.17% and 7.1%, respectively. Mabrouk et al. [25] applied a mixed optimization strategy integrating PSO and GSA to optimize the ISCC-PTC system, using thermoelectric efficiency and photovoltaic efficiency as the objective functions, and the optimal integration scheme was obtained.
Although a wide range of optimization studies have been done for ISCC systems, most of them are based on certain cases with respect to operational characteristics and economics, and the comparative studies on performance are only limited to certain cases, which a lack of generality and universality, and cannot completely obtain the optimal integration scheme.
For ISCC systems, many different integration schemes with different allocation ratios and integration positions of solar energy can be listed. To find the optimal solution among numerous schemes, this paper proposes a general optimization method for solar energy integration schemes on the basis of the principle of thermodynamics and the idea of temperature matching and cascade utilization. This method takes photoelectric efficiency and system efficiency as the objective functions, and utilizes a genetic algorithm to optimize the complementary system performance with different DNI irradiations and different gas turbine (GT) loads. The distribution ratios of solar thermal energy in the complementary system under the integration scheme with the optimal objective function are derived, providing guidance for the selection of the integration scheme of the ISCC system.
2. System Description
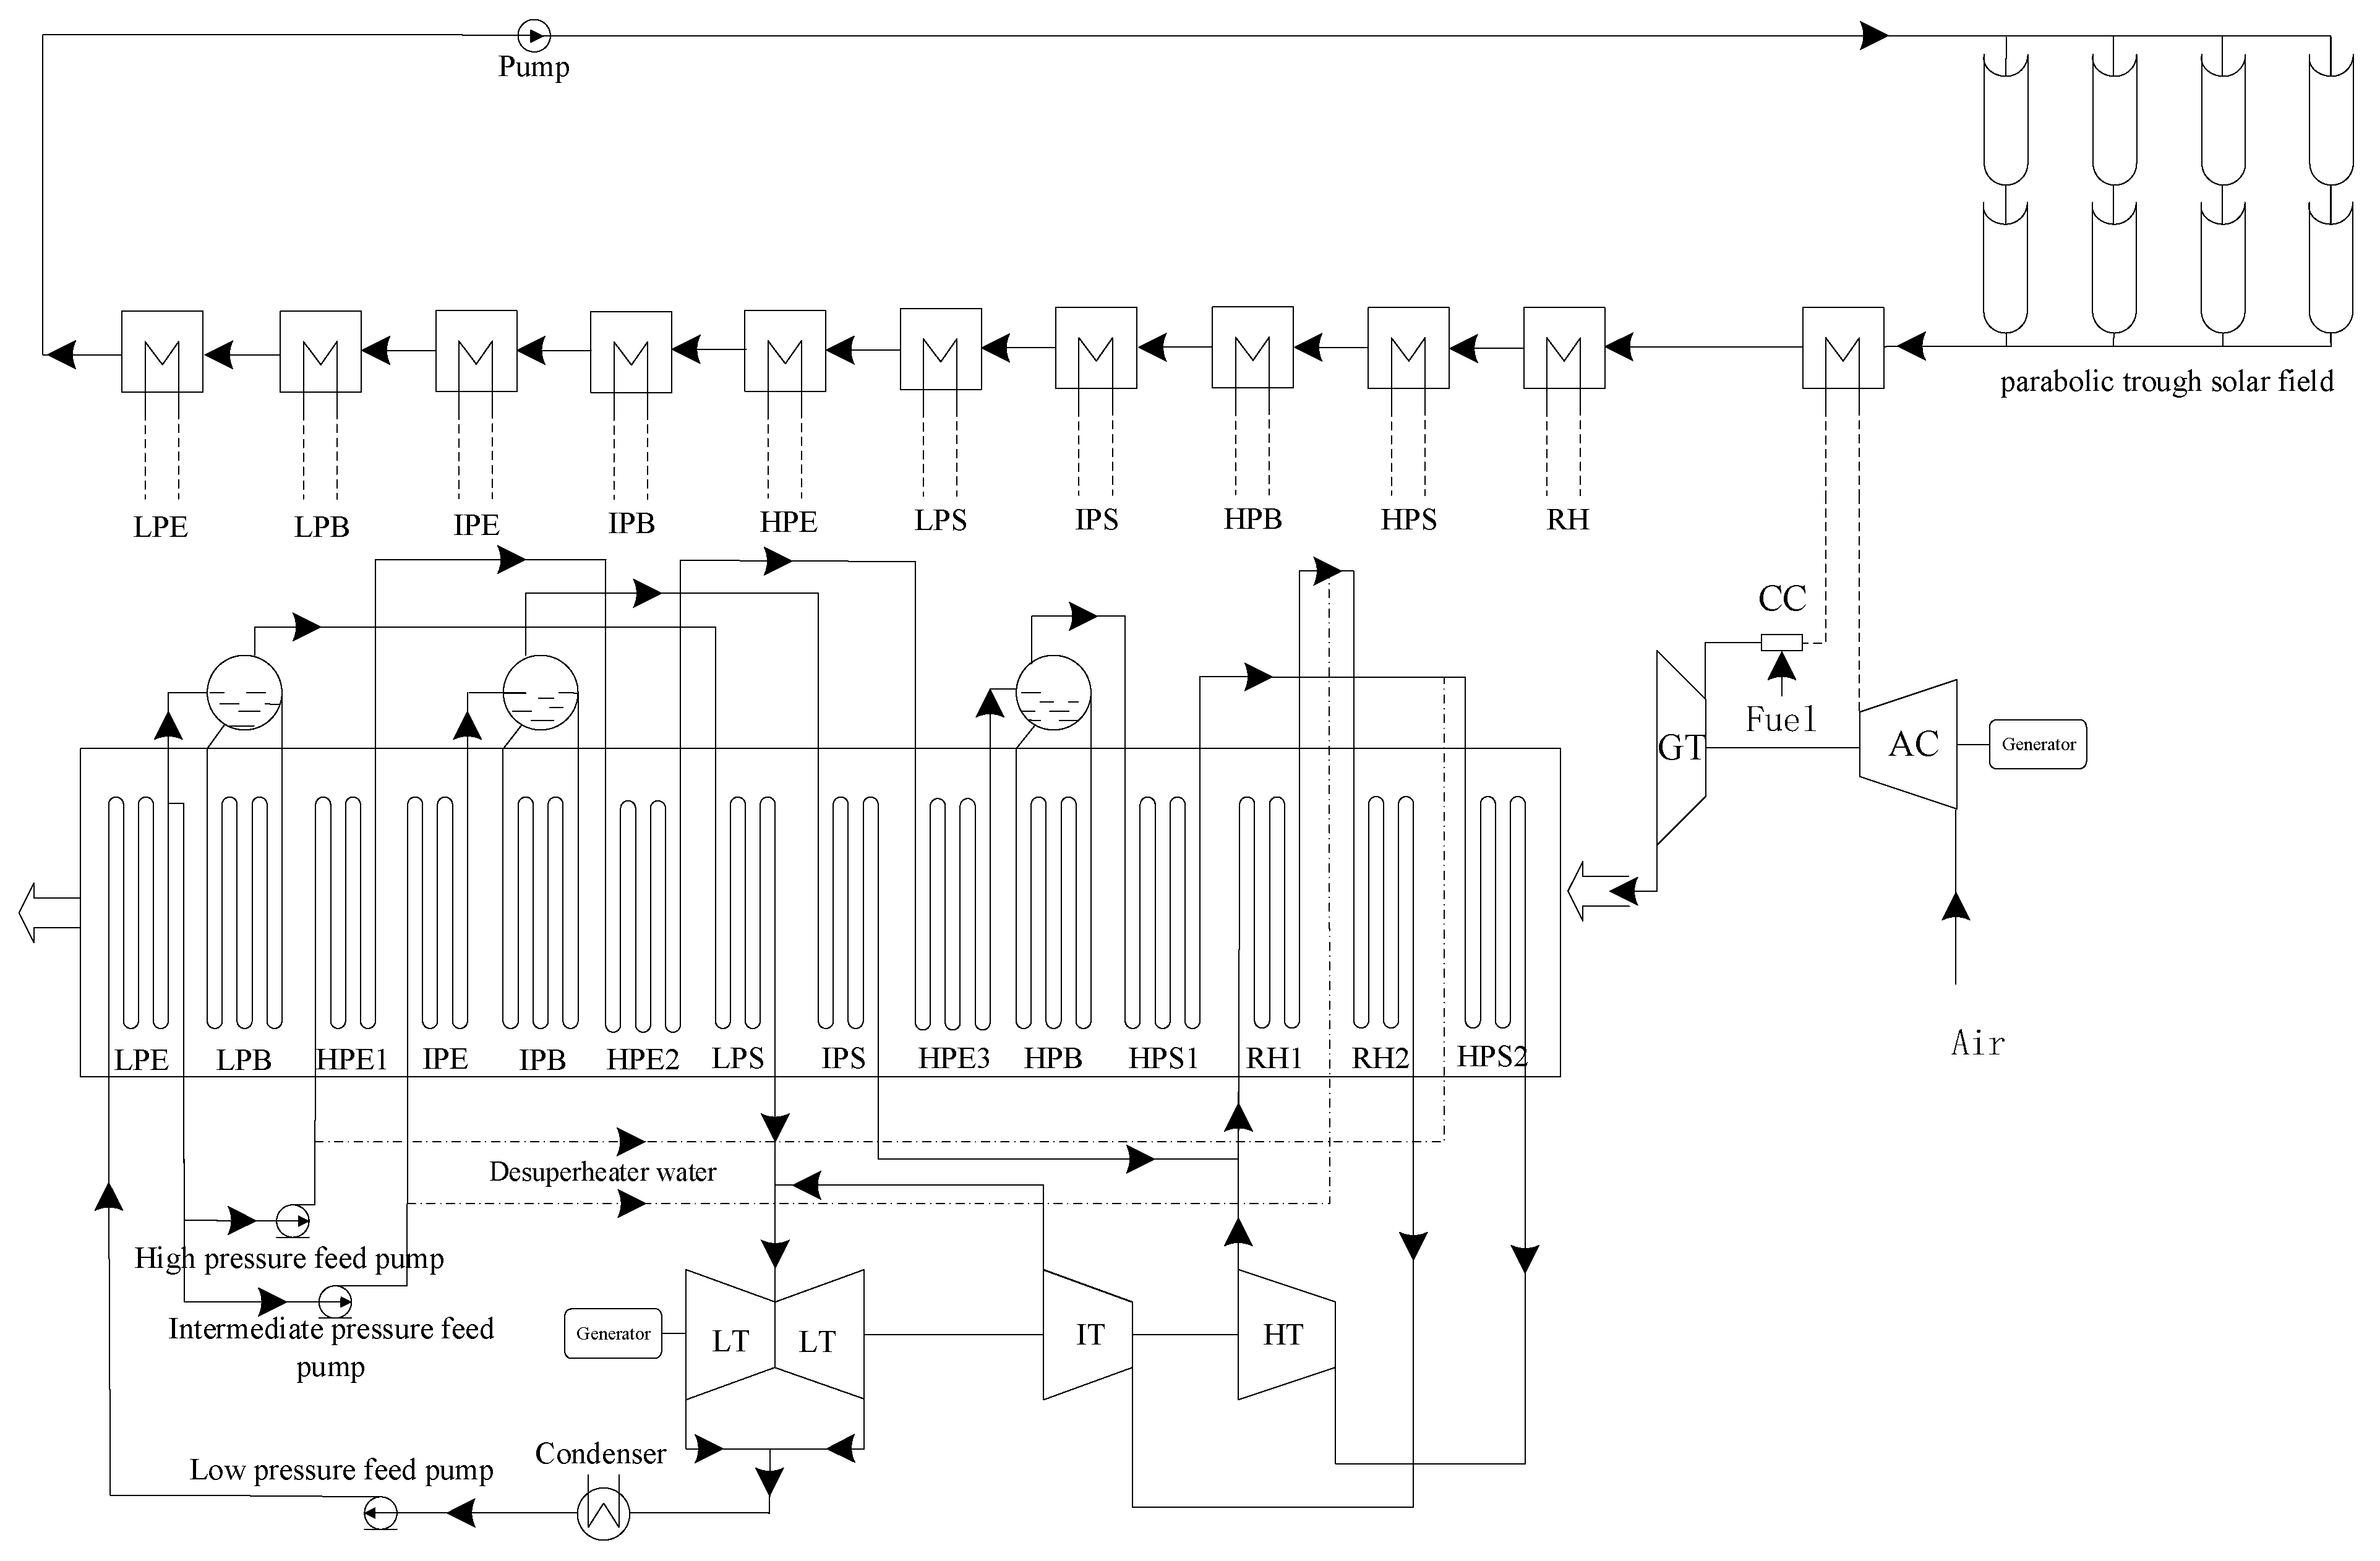
Figure 1 demonstrates the flow sheet of a common ISCC system. The complementary system is made up of two subsystems: the solar collector system, and the gas turbine combined cycle (GTCC) system, where solar energy is integrated into the conventional GTCC by the form of thermal energy, partially replacing the heating process of some heat exchangers, followed by the transformation of this thermal energy to electric power in the power subsystem. The working mediums during the solar heating process include steam, air, molten salt, HTF, etc., and the solar collecting method is either solar tower or trough solar collector.
3. Design Conditions and Mathematical Model of Subsystem
3.1. Design Conditions and Mathematical Model of GTCC System
In this paper, a GTCC unit with F-class gas turbine is selected for simulation. The gas turbine is PG9351FA, manufactured by the General Electric Corporation of United States, and it mainly consists of an 18-stage axial flow compressor, 18 low-NOX combustion chambers, and a three-stage extracted air-cooled gas turbine. The gas turbine has a single-shaft structure and is directly connected to the generator; the units of the Rankine cycle include the horizontal, triple-pressure, single-reheat, non-supplementary firing heat recovery steam generator (HRSG), produced by Harbin Boiler Company and designed by Alstom, and the D10 triple-pressure, single-reheat steam turbine with double cylinders and double exhaust steam; the fuel is natural gas, and its components are listed in Table 1.
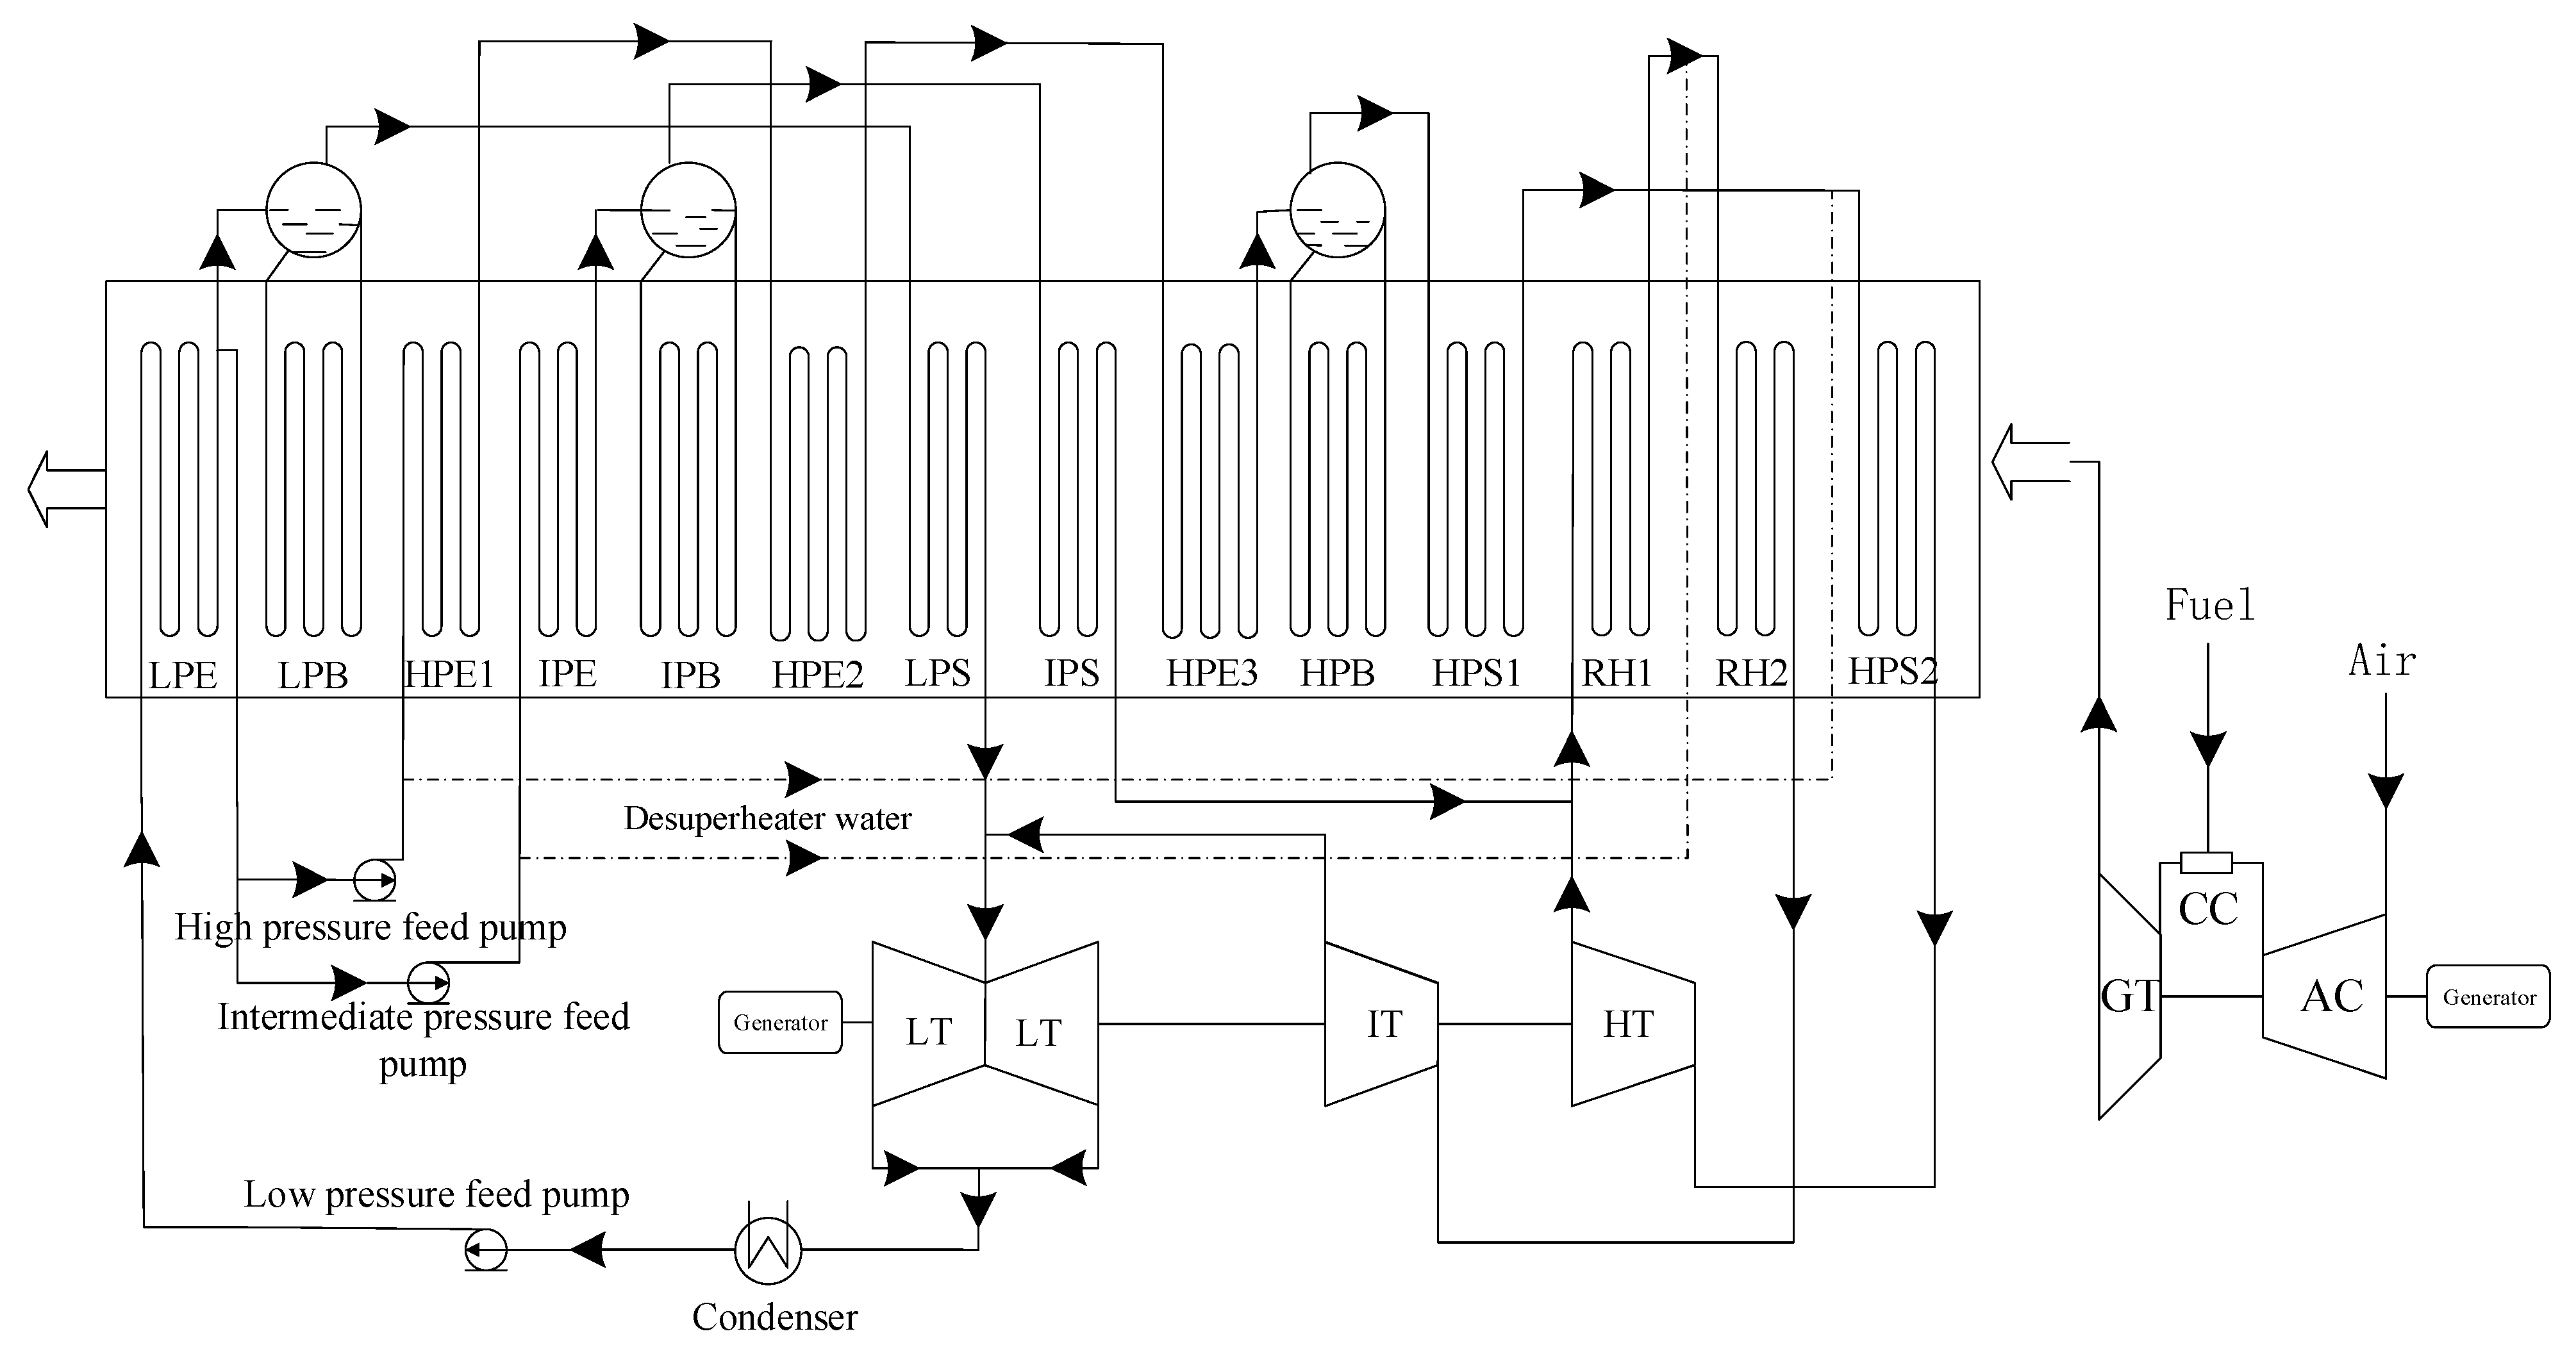
Due to the high initial temperature of the gas turbine inlet, and to ensure that the gas turbine blades are not over-tempered, air is extracted from the 9th, 13th, 15th and 18th stages of the compressor and injected into the gas turbine, at all levels of the rotor and stator blades, to cool the blades, and the cooling air volume is set with reference to the volume of the F-class unit in the literature [20], i.e., the total cooling air volume makes up 18.45% of the total air inlet volume, and the proportion of cooling air in the first stage of the stator blades is 8%; the pinch point temperature difference and approach point temperature difference in the bottom cycle are set as 15 °C and 8 °C, respectively; the pressure loss of each heating exchanger in the bottom cycle is set as 0.05 bar. EBSILON commercial software is utilized for modeling and calculation of the GTCC system, on account of the parameters of the design conditions. The GTCC flow diagram is displayed as Figure 2 below, and the design specifications of the GTCC unit are given in Table 2, Table 3 and Table 4.
3.2. Off-Design Simulation of GTCC System
According to the EBSILON simulation results of the design condition, the modeling and calculation of the off-design condition are studied. It is known that there are various regulation modes for GTCC off-design conditions, and different regulation modes signify different performance change trends.
In this paper, the regulation mode ”T3-T4-F”, which is commonly used in the actual operation of GTCC power plants, is chosen to perform off-design operations.
The compressor characteristic curves are calculated by referring to the graphical results in the literature [26], and the compressor isentropic efficiency is corrected according to the change of inlet guide vane (IGV) angle:
where, represents the isentropic efficiency of the compressor; represents the magnitude of variation for the compressor IGV angle; and the superscript represents the state point corresponding to the original compressor characteristic line.
The total amount of cooling air is corrected with respect to the design operating conditions [27]:
where, and are the cooling air mass flow rates of the off-design and design working conditions, kg/s, respectively; and are the compressor outlet pressures of the off-design and design conditions, MPa, respectively; and and are the compressor outlet temperatures of the off-design and design working conditions, K, respectively.
The combustion chamber efficiency is assumed to be constant, and the pressure loss changes with respect to the mass flow rate of the combustion chamber:
where, is the pressure drop at the inlet and outlet of the combustion chamber, MPa; is the mass flow rate of the combustion chamber, kg/s; and the superscript is the design operating condition.
The gas turbine efficiency of each stage is revised by the empirical formula based on off-design operating conditions [28]:
where, and are the gas turbine efficiencies of the off-design and design conditions, respectively; and are the gas turbine rotation speeds of the off-design and design conditions, r/min, respectively; and are the gas turbine inlet temperatures of the off-design and design conditions, K, respectively; and are gas turbine expansion ratios of the off-design and design conditions, respectively; represents the constant coefficient, which is chosen as 2.083; , where is the adiabatic index; and subscript represents the stagnation state.
Considering the temperature limit of the gas turbine blade, the limit point of exhaust gas temperature T4, under off-design working conditions, is set to 656 °C. For the purpose of maintaining the performance of the bottom cycle at low load, generally, the work medium of the bottom cycle under off-design operating conditions will choose the operation mode of sliding pressure first, and then fixed pressure. The sliding pressure operation is executed when the main steam pressure is greater than 45% of the design pressure, and the constant pressure operation is executed when it is lower than 45% of the design pressure. Because the operation mode of T3-T4-F will cause an increase in the exhaust gas temperature, in order to maintain a constant main steam parameter (656 °C), the main steam and reheated steam are cooled down by the desuperheater water injection, which is diverted from the high-pressure feedwater. The steam turbine thermodynamic parameters under off-design operation are calculated based on the Flugel formula [29], and the steam turbine efficiency is regulated according to the EBSILON built-in correction formula for off-design operation [30]:
where, is the steam turbine efficiency; is the mass flow rate of steam in the steam turbine, kg/s; and the subscript is the design working condition state point.
3.3. Solar Collector System Model
In this paper, a parabolic trough solar collector system is selected for solar collection, the LS-2 model manufactured by LUZ corporation is chosen for the trough parabolic concentrator, the Schott-PTR70 type collector is chosen for the vacuum collector, and the collector is arranged horizontally in a north-south direction; the influence of atmospheric attenuation loss on the optical efficiency is ignored during the program calculation; the ratio of collector availability is defined as 100%; the shadow and blocking loss, collector interception loss and cosine loss are not constants, they are all related to the height and azimuth angle of the solar radiation; and the design parameters of the solar collector are shown in Table 6.
3.4. ISCC System Model
The GTCC system and the solar collector system mentioned above are combined to form the ISCC system model. The geographic coordinates of the meteorological data are selected for a certain year in Dunhuang, Gansu Province, which is located at 94.15 degrees east longitude and 40.13 degrees north latitude, in northwestern China.
As can be seen from Figure 1, solar energy can be integrated into the topping Brayton cycle to preheat the compressed air and reduce the fuel consumption; it can also be integrated into the bottom Rankine cycle to partially or completely replace the single-stage or multi-stage heat exchangers, which can increase the working medium mass flow and the thermal performance of the bottom cycle. Due to the high temperature at the compressor outlet of the topping Brayton cycle, the HTF can no longer meet the heating requirements; the solar collector system uses molten salt (60% NaNO3 + 40% KNO3) as the heat transfer medium instead. In order to allow more solar energy to replace the topping cycle fuel to heat the air, the molten salt outlet temperature is set at an upper temperature of 600 °C.
4. Integrated Optimization Methods of the ISCC System
Different integration schemes have different effects for the thermal performance of the ISCC system. In order to derive the optimal integration scheme for system efficiency and photoelectric efficiency between different integration schemes, this paper uses EBSILON software to establish the ISCC system model and performance simulation calculations, and optimization for off-design operating conditions are also carried out. The optimization process is accomplished by EBSILON’s own genetic algorithm optimization toolbox. The system efficiency and photoelectric efficiency are used as the two objective functions for the optimization calculation, and their calculation expressions are shown below:
where, and are the solar photoelectric efficiency and system efficiency of ISCC system, respectively; , and are the output powers of the ISCC system, the reference GTCC system and the solar output power in the ISCC system, MW, respectively; is the direct normal irradiance of solar power, W/m2; is the total net aperture area of the parabolic trough solar collector, m2; and are the fuel mass flow rates of ISCC system and the reference GTCC system, kg/s, respectively; is the lower heating value of fuel, kJ/kg; and is the heat received by the solar collector, MW.
In the general integration model of the ISCC system shown in Figure 1, the replaceable heat exchange parts of the solar heat exchanger are arranged and numbered in order of temperature ranges, and a total of 11 virtual heat exchangers, including air preheater (AP), reheater (RH), high-pressure superheater (HPS), high-pressure boiler (HPB), intermediate-pressure superheater (IPS), low-pressure superheater (LPS), high-pressure economizer (HPE), intermediate-pressure boiler (IPB), intermediate-pressure economizer (IPE), low-pressure boiler (LPB) and low-pressure economizer (LPE), can be obtained, and the solar energy will be integrated into the system according to a fixed distribution ratio. In case the heat transfer ratio of solar heat exchangers at each level is taken as a variable in the optimization process, the optimization objective function can be expressed as:
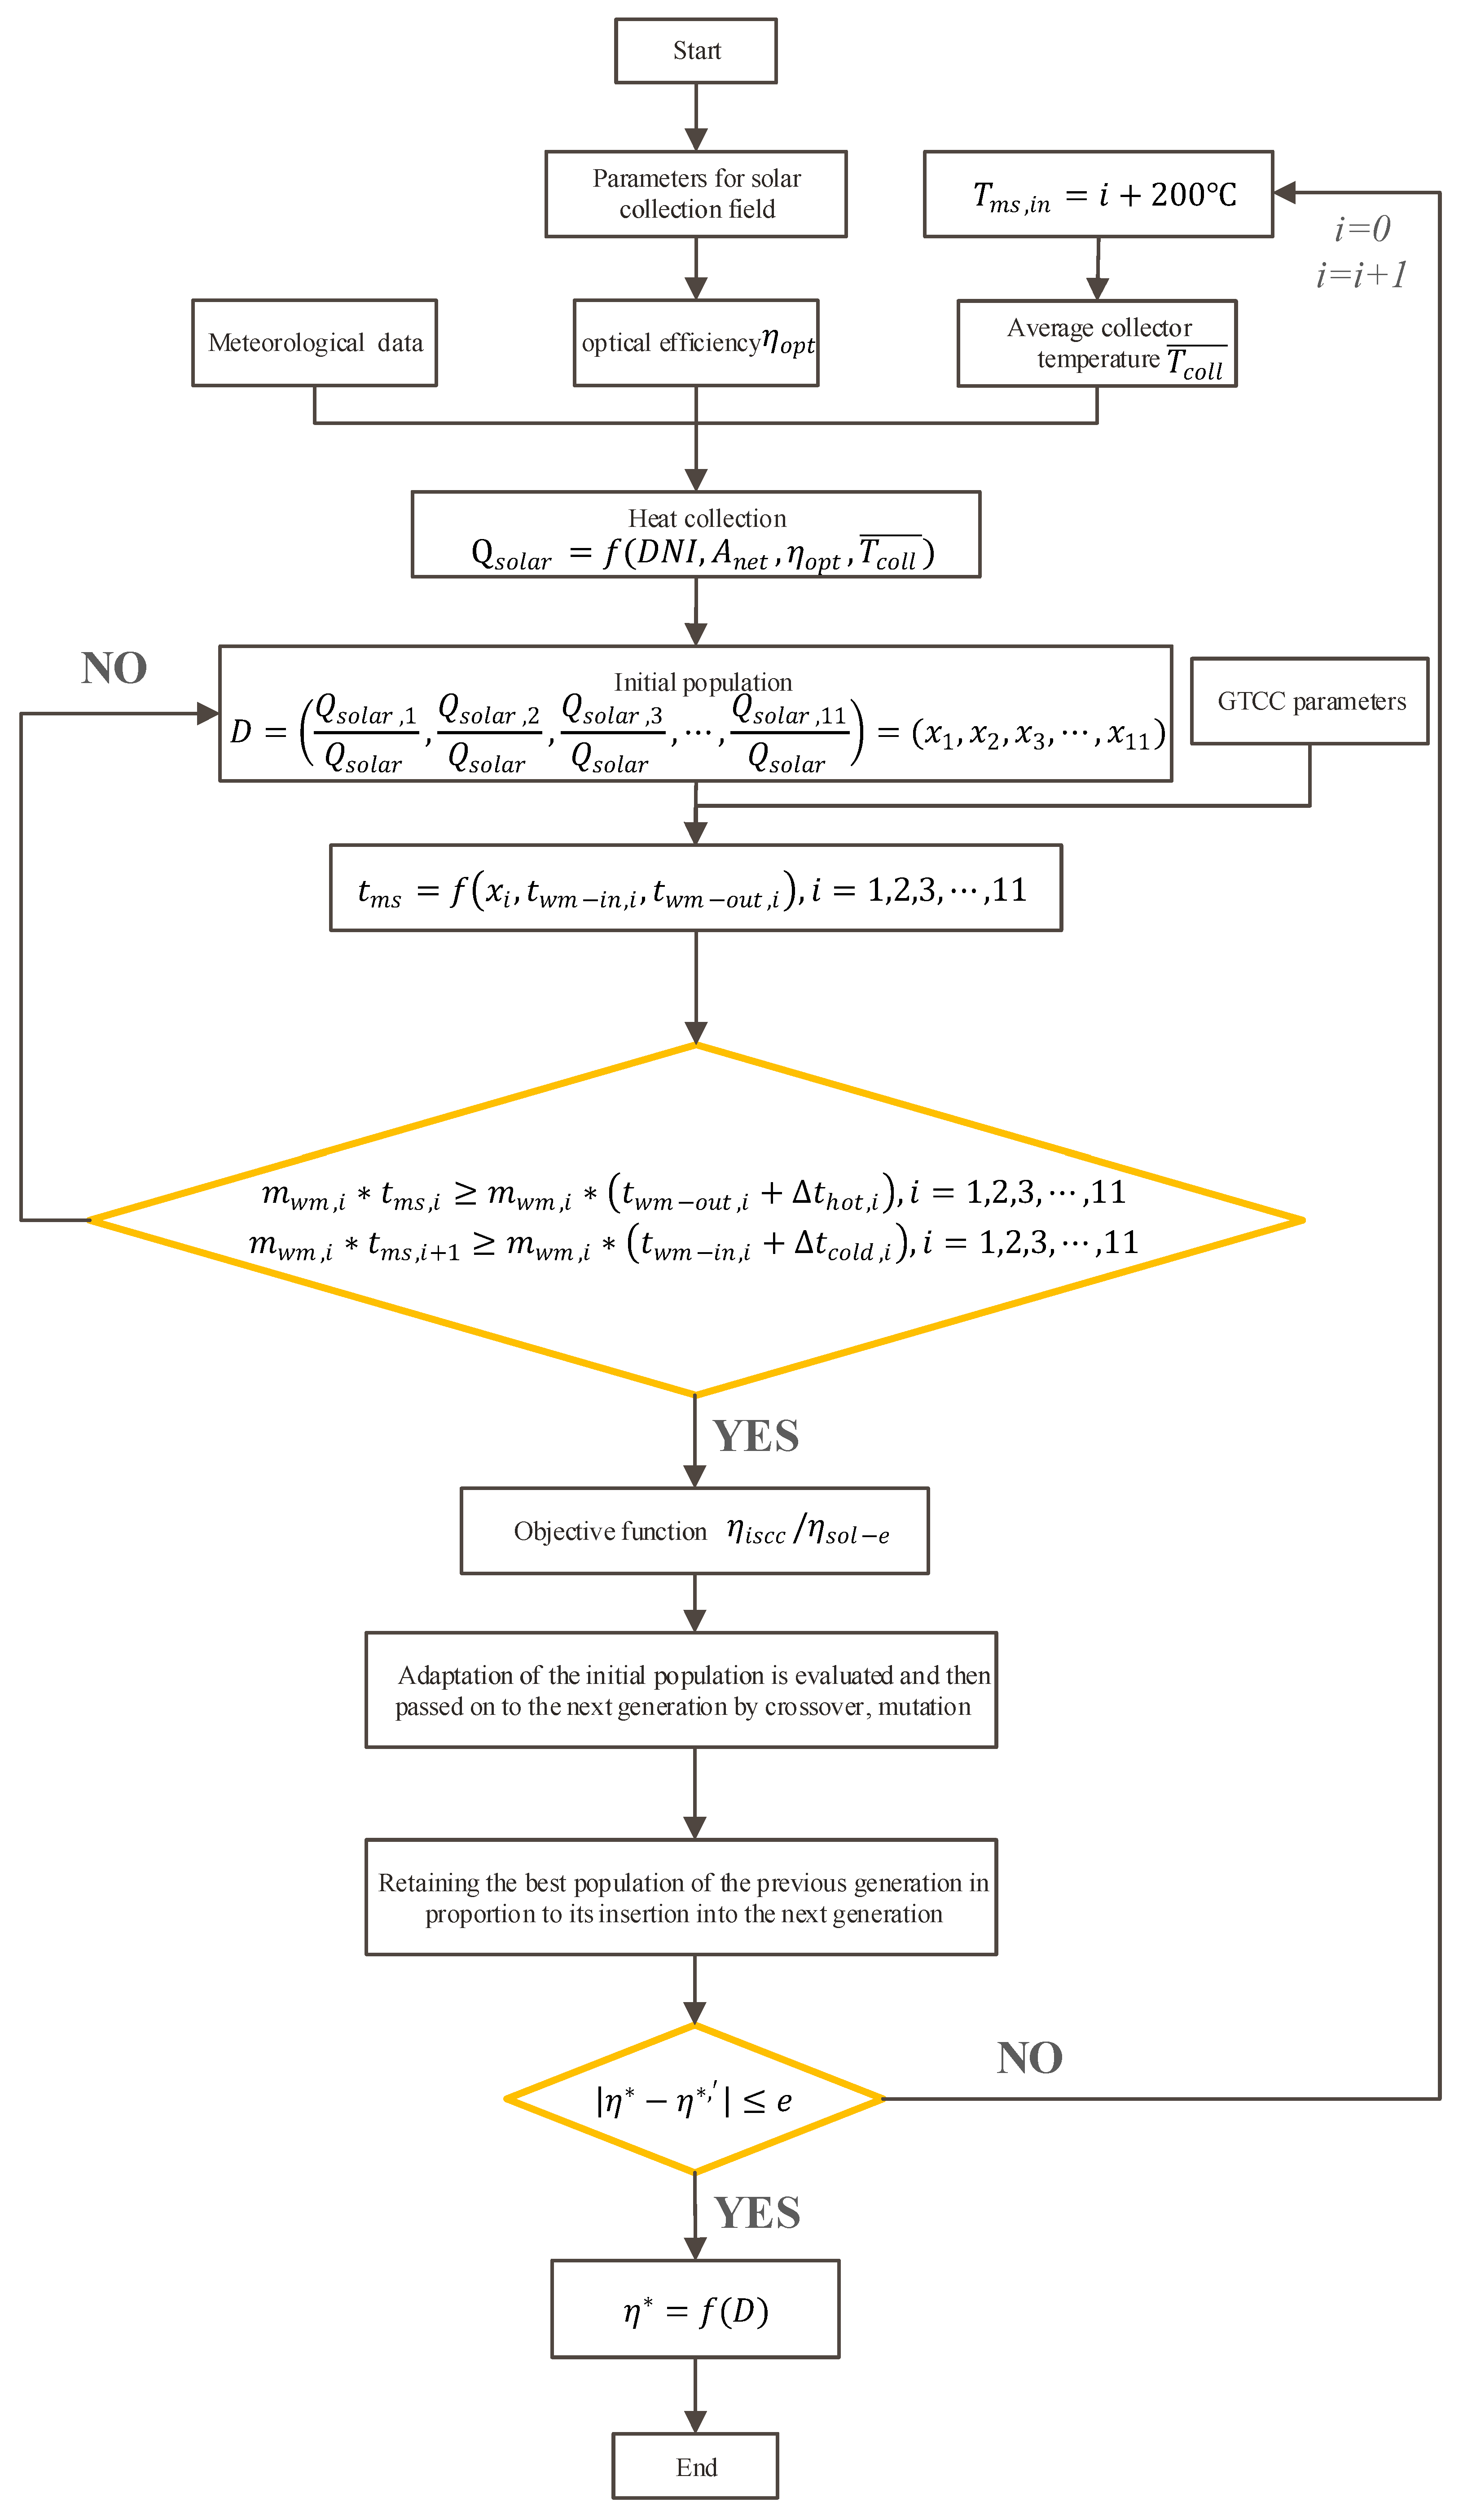
where, represents any efficiency objective function; represents the vector of heat collection ratios corresponding to these 11 different virtual heat exchangers; represent the proportions of the heat collection of 11 virtual heat exchangers AP, RH, HPS, HPB, IPS, LPS, HPE, IPB, IPE, LPB and LPE to the total solar heat collection, correspondingly; is the mass flow rate of the working medium that makes heat exchange with molten salt in corresponding virtual heat exchanger, kg/s; is the inlet temperature of molten salt In corresponding virtual heat exchanger, K; and are the temperatures of the outlet and inlet of the heat-absorbing working medium in corresponding virtual heat exchanger, K, respectively; and and are the cold and hot terminal temperature differences in corresponding virtual heat exchanger, K, respectively. Equation (10) requires a reasonable terminal difference setting for the heat transfer process of the virtual heat exchanger, which assures that the optimization process can be carried out successfully, even if a specific virtual heat exchanger is not utilized in the heat transfer process. In other words, even if the heat-absorbing working medium mass flow rate is 0, Equation (10) can still be satisfied. The optimization flow chart is shown in Figure 3.
5. Results and Analysis
5.1. Optimization Results under Different Working Conditions
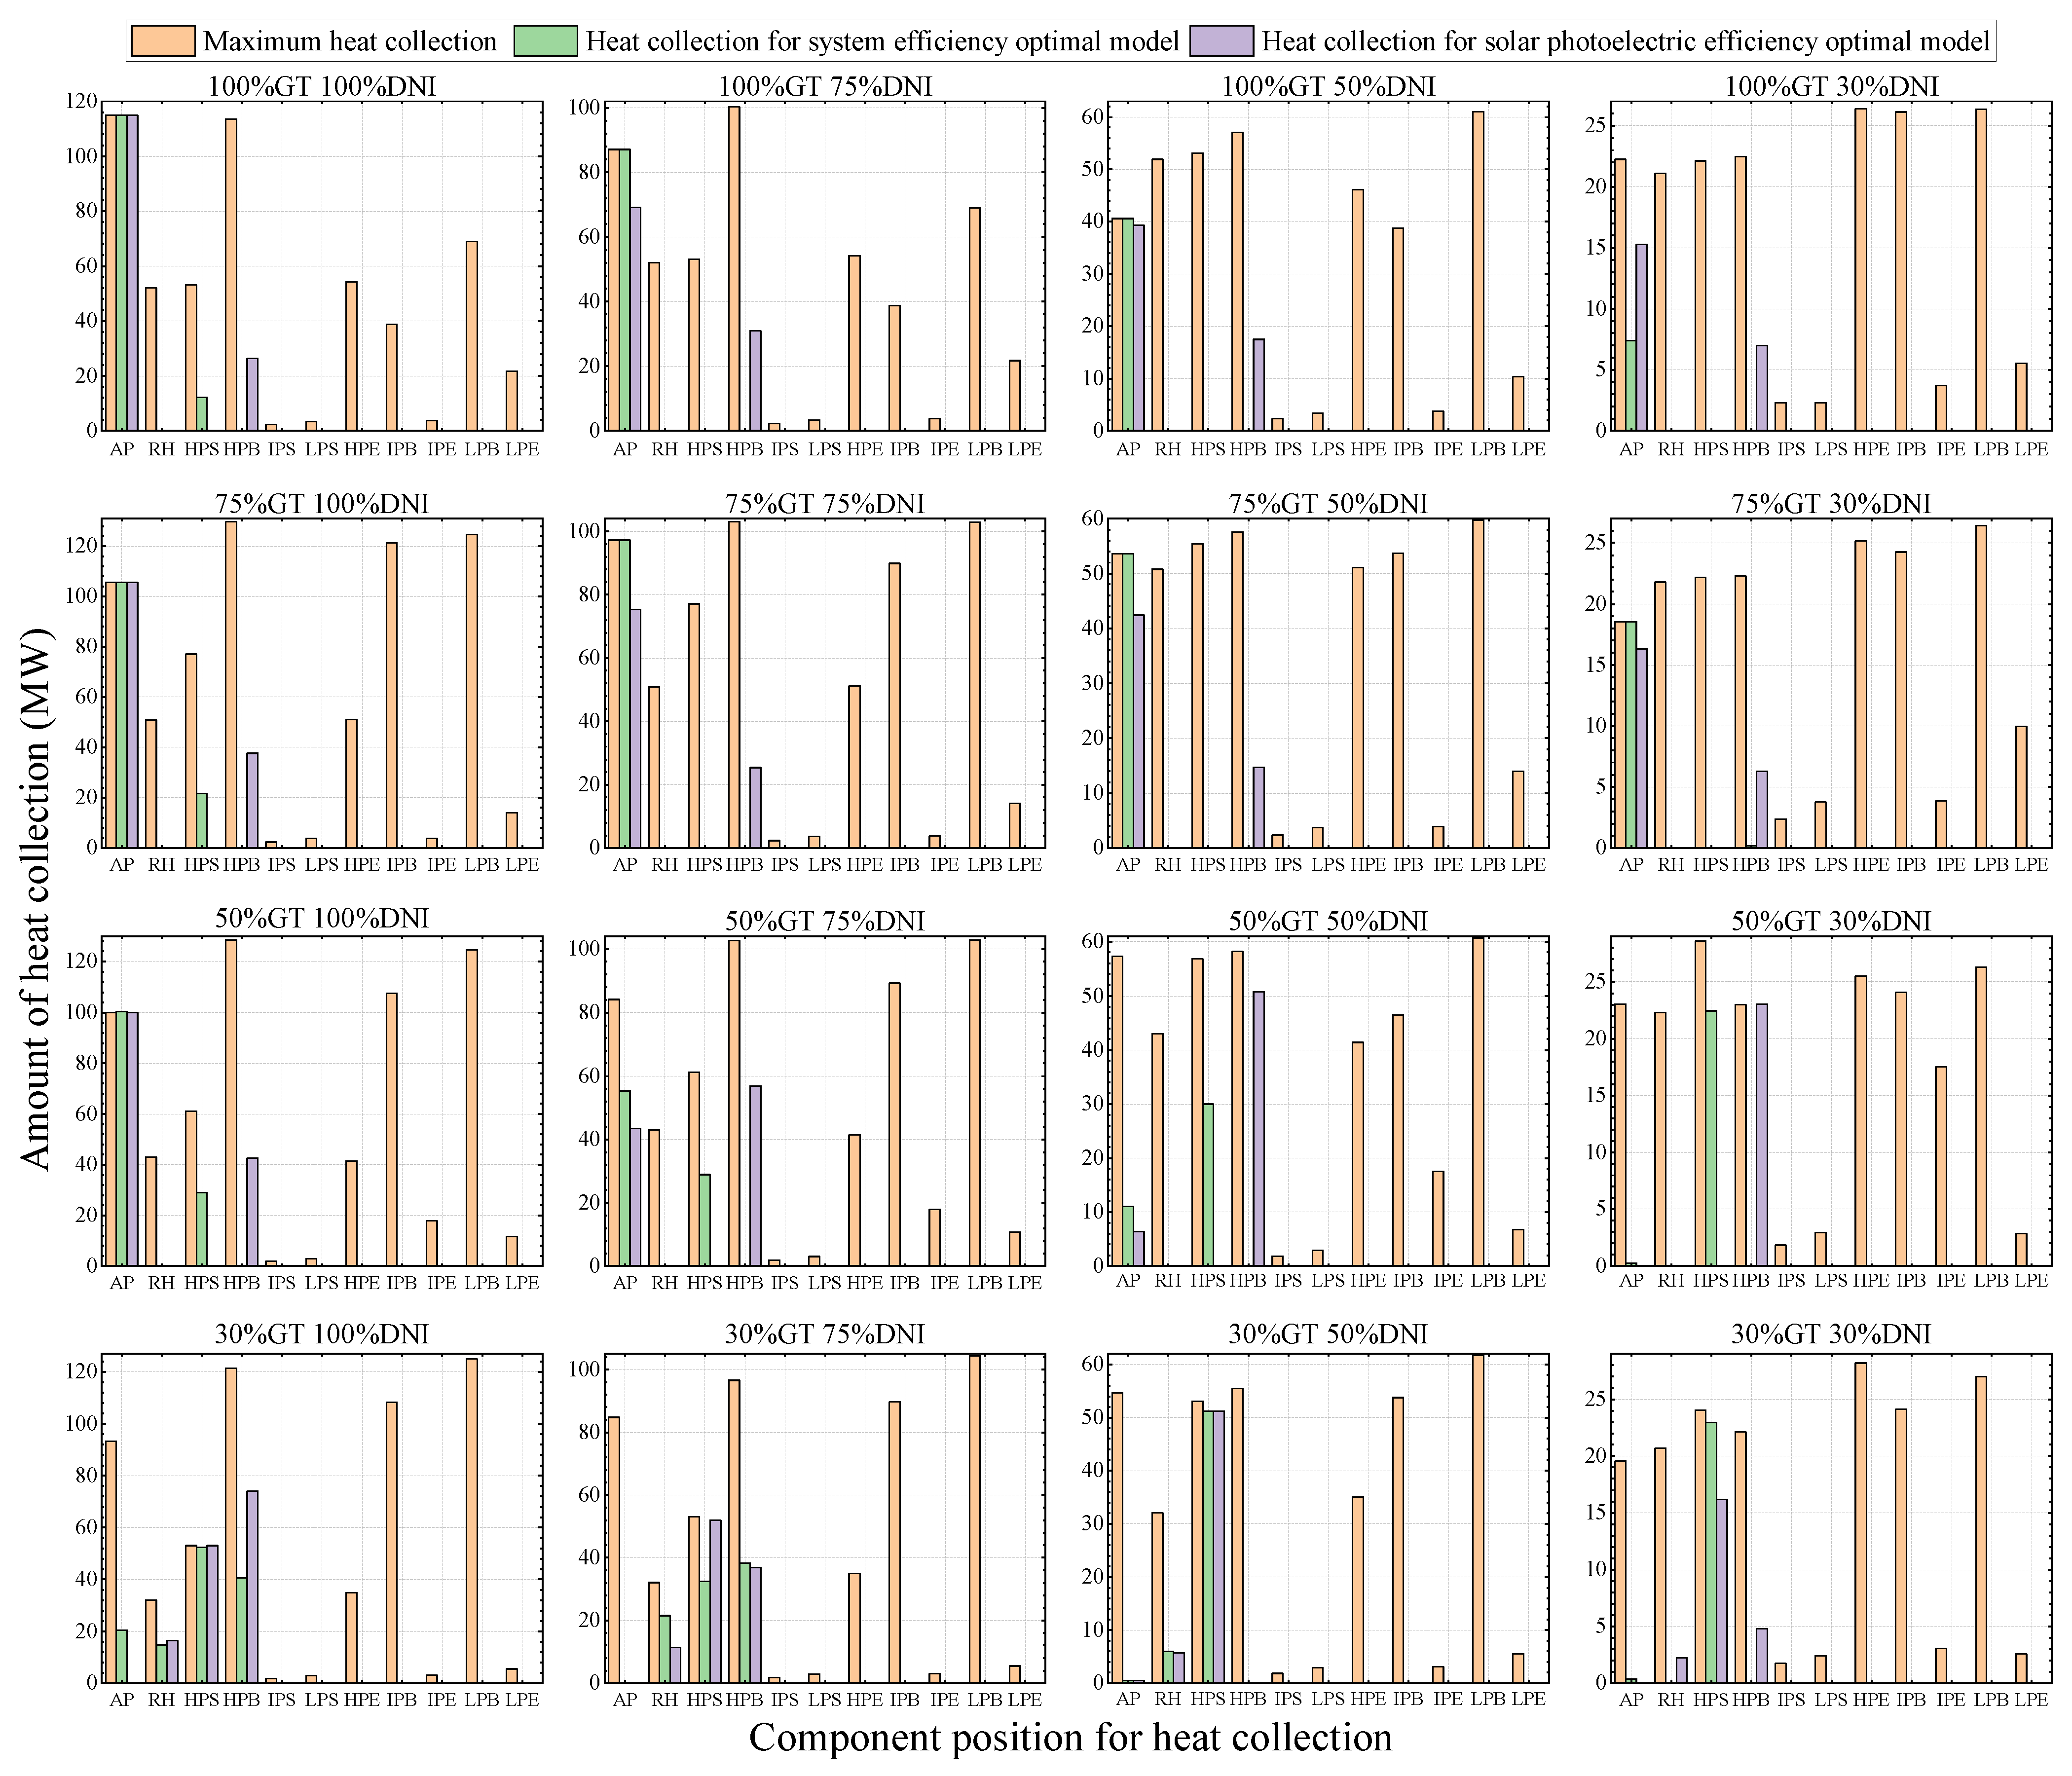
The ISCC system model is optimized by the GA toolbox in EBSILON, and the optimal integration schemes of system and photoelectric efficiencies under different working conditions are derived. The heat collection quantities of each heat exchanger are plotted as shown in Figure 4, where the orange strips stand for the maximum integration capacity of each heat exchanger under different operating conditions, while the light green and lavender strips are the energy distribution of the solar energy integrated in each heat exchanger under the optimal system efficiency and solar photoelectric efficiency models, respectively.
As can be seen from Figure 4, under all operating conditions, the optimum solar photoelectric efficiency model can integrate more solar energy up to 141.3 MW, as opposed to the maximum value of 127.1 MW for the optimal system efficiency model, mainly due to the fact that the system efficiency calculation does not consider the solar-to-heat conversion process, while the solar photoelectric efficiency is directly influenced by the photothermal efficiency, and higher photothermal efficiency means that more solar energy can be integrated.
5.2. Comparative Analysis of Optimization Models Based on Two Different Objective Functions
5.2.1. Similarities between Optimization Models Based on Two Different Objective Functions
The heat collection proportions of different heat exchangers are shown in Table 7 and Table 8. As can be seen from these two tables and Figure 4, there is a convergence between the optimal integration scheme of solar photoelectric efficiency and system efficiency in a number of changing trends.
Firstly, with the decreases of gas turbine load and DNI, the solar integration position will gradually shift from the topping cycle to the bottom cycle; in the case of gas turbine load variation from 100% to 75%, the topping cycle is still the focus position of integration, and, in some cases, the solar energy is totally integrated into the topping cycle for the optimum system efficiency model.
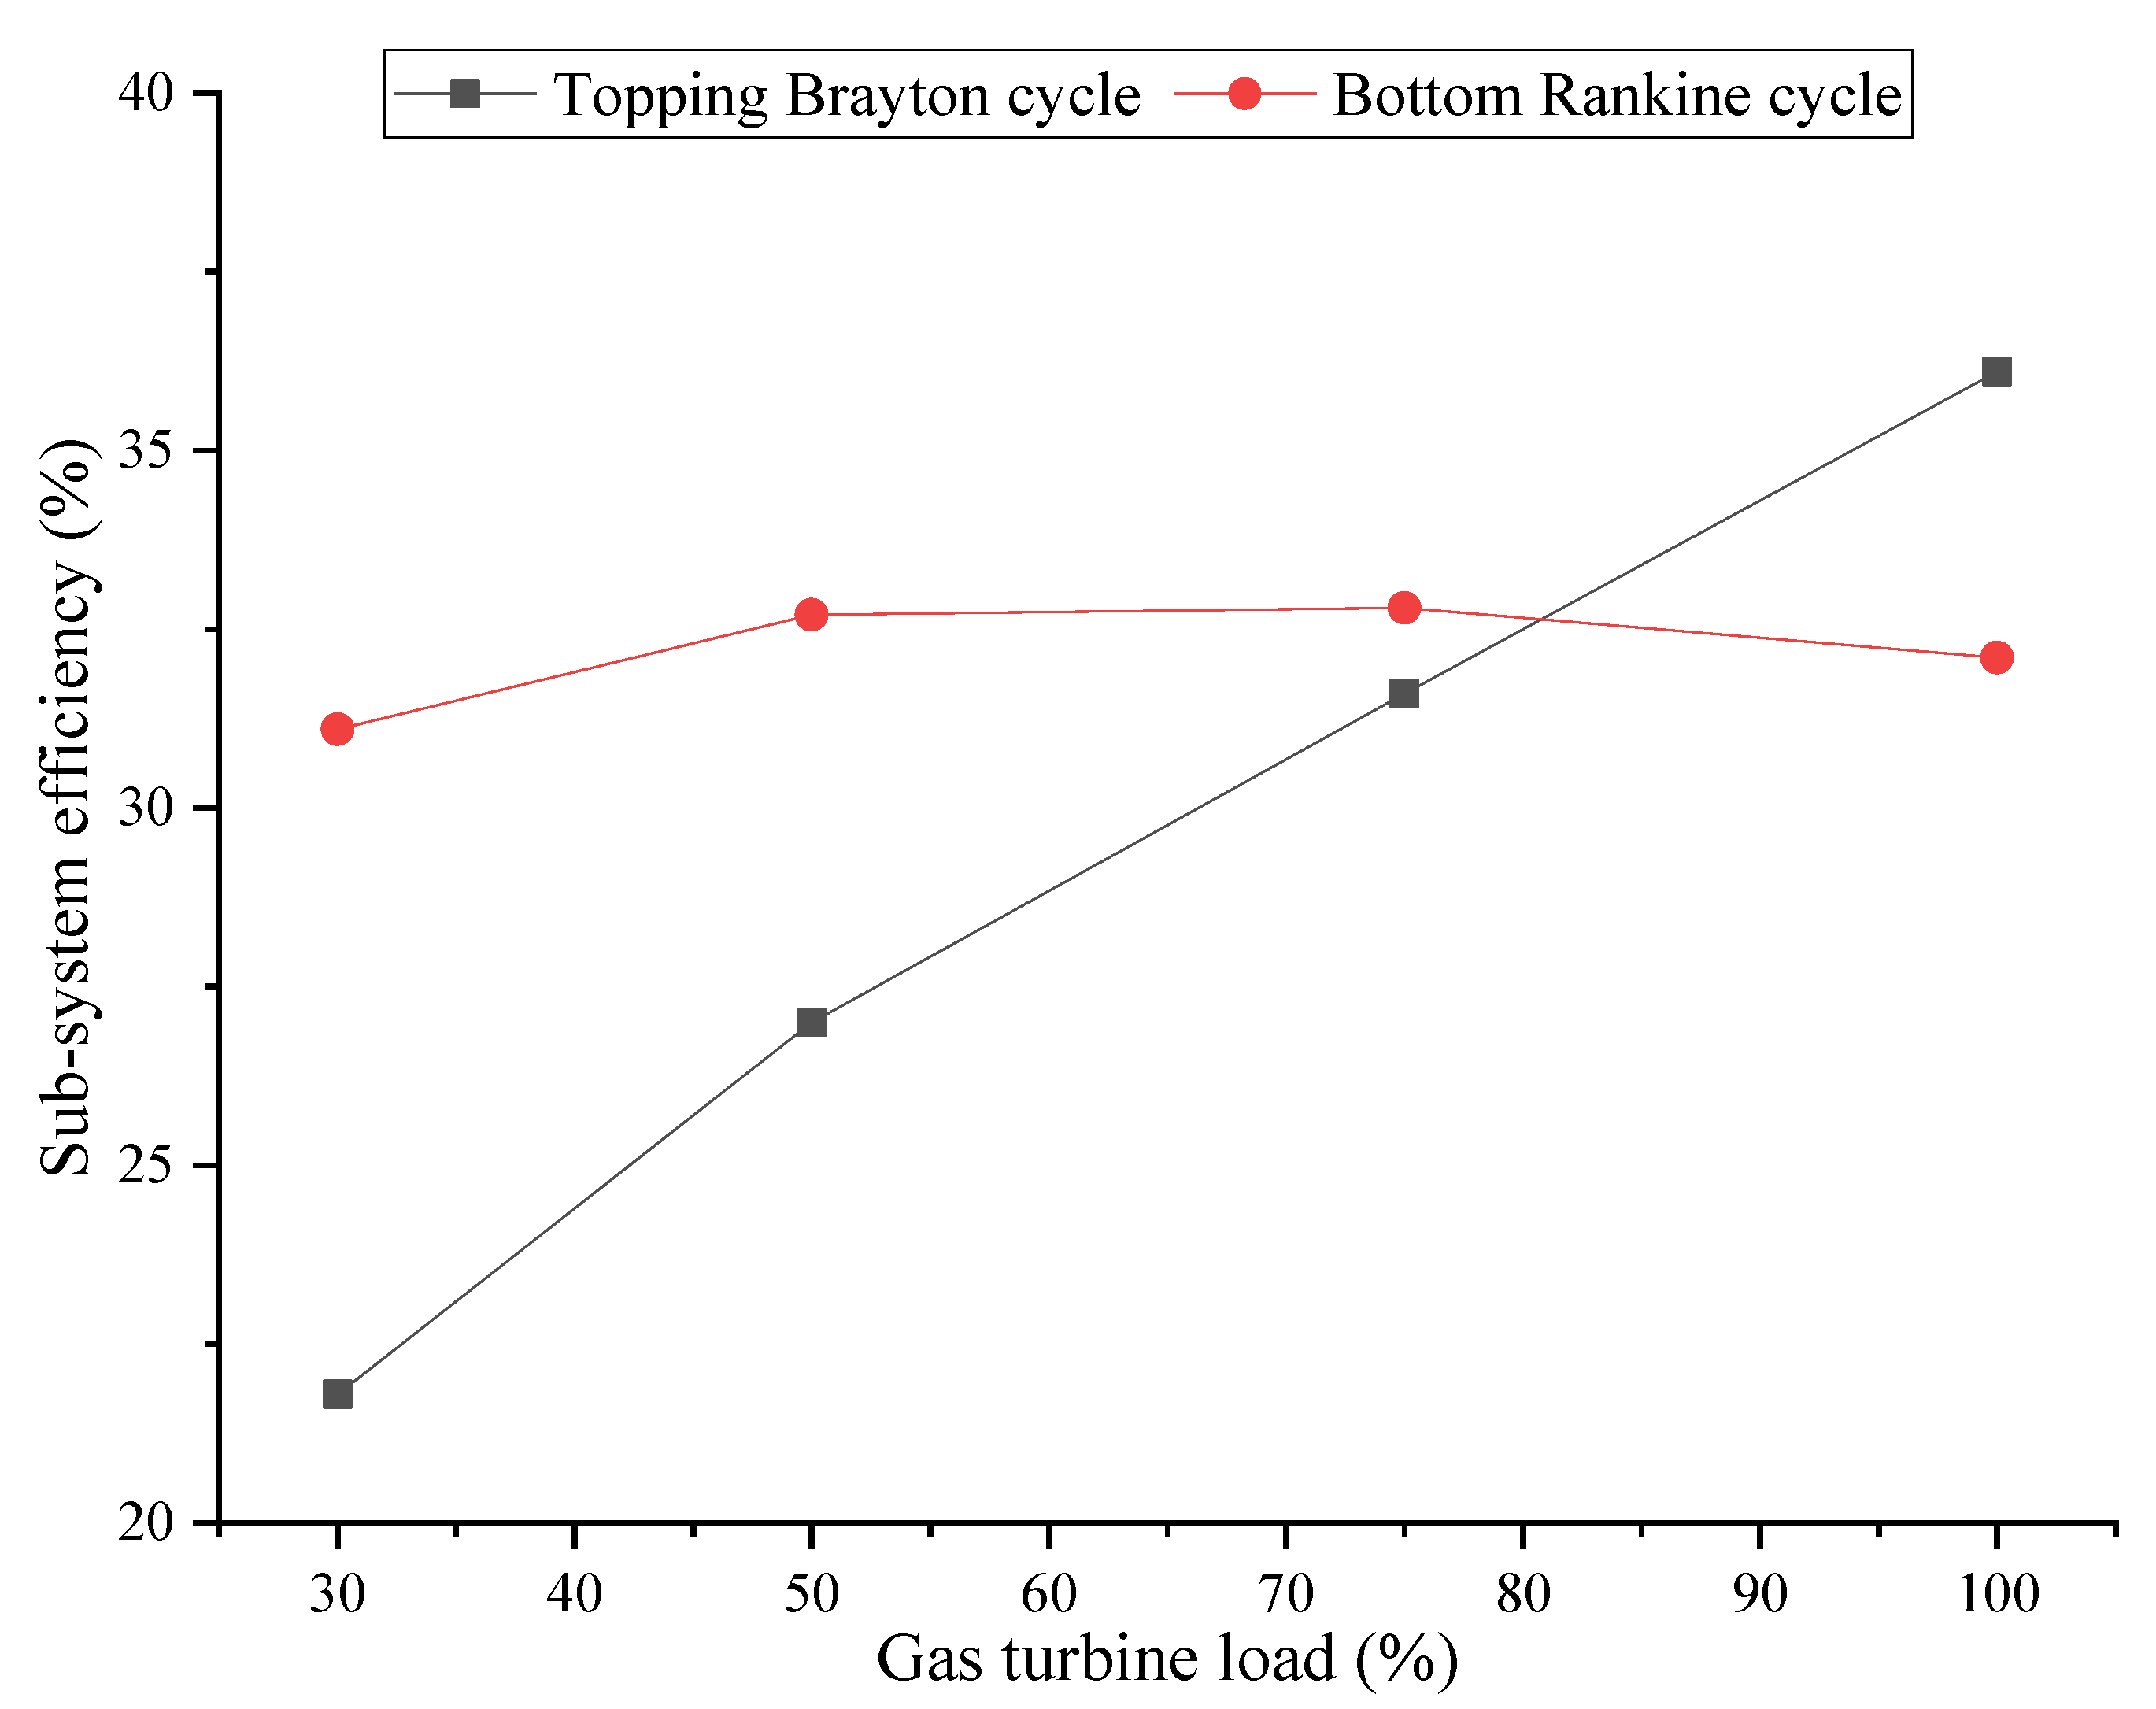
Later, as the gas turbine load reduces to 50%, the solar integration proportion of bottom cycle increases with the reduction of DNI, especially at 50% GT-30% DNI and 30% GT-30% DNI conditions, where solar energy is almost wholly integrated in the bottom cycle. For the ISCC system, the improvement of efficiency is closely related to the distribution of heat collection, and such a changing trend is mainly due to the inconsistency between the topping cycle and bottom cycle efficiency during the process of variable load of the GTCC system, and the changing trends of the topping Brayton cycle and bottom Rankine cycle efficiency with load of the GTCC system are shown in Figure 5. At high GT loads, the efficiency of the topping Brayton cycle is obviously greater than that of the bottom Rankine cycle; however, as the GT load decreases, the efficiency of the topping Brayton cycle decreases rapidly, while the efficiency of the bottom cycle is affected by the regulation mode (T3-T4-F), showing a trend of increasing followed by decreasing, and its efficiency decreases more smoothly than that of the topping cycle. From the perspective of efficiency improvement, the heat from solar collectors tends to be integrated into the more efficient subsystem, so, as the GT load decreases, solar energy tends to be integrated into the more efficient bottom cycle.
Whereas, for the operating conditions at 30% GT load, the integration position of the bottom cycle will be redistributed: most often, the heat collection energy is preferentially integrated in the HPS with the higher initial steam parameters, followed by the RH and HPB parts.
5.2.2. Differences between Optimization Models Based on Two Different Objective Functions
Nevertheless, the optimal models for solar photoelectric efficiency and system efficiency still have significant differences in terms of integration position and proportion.
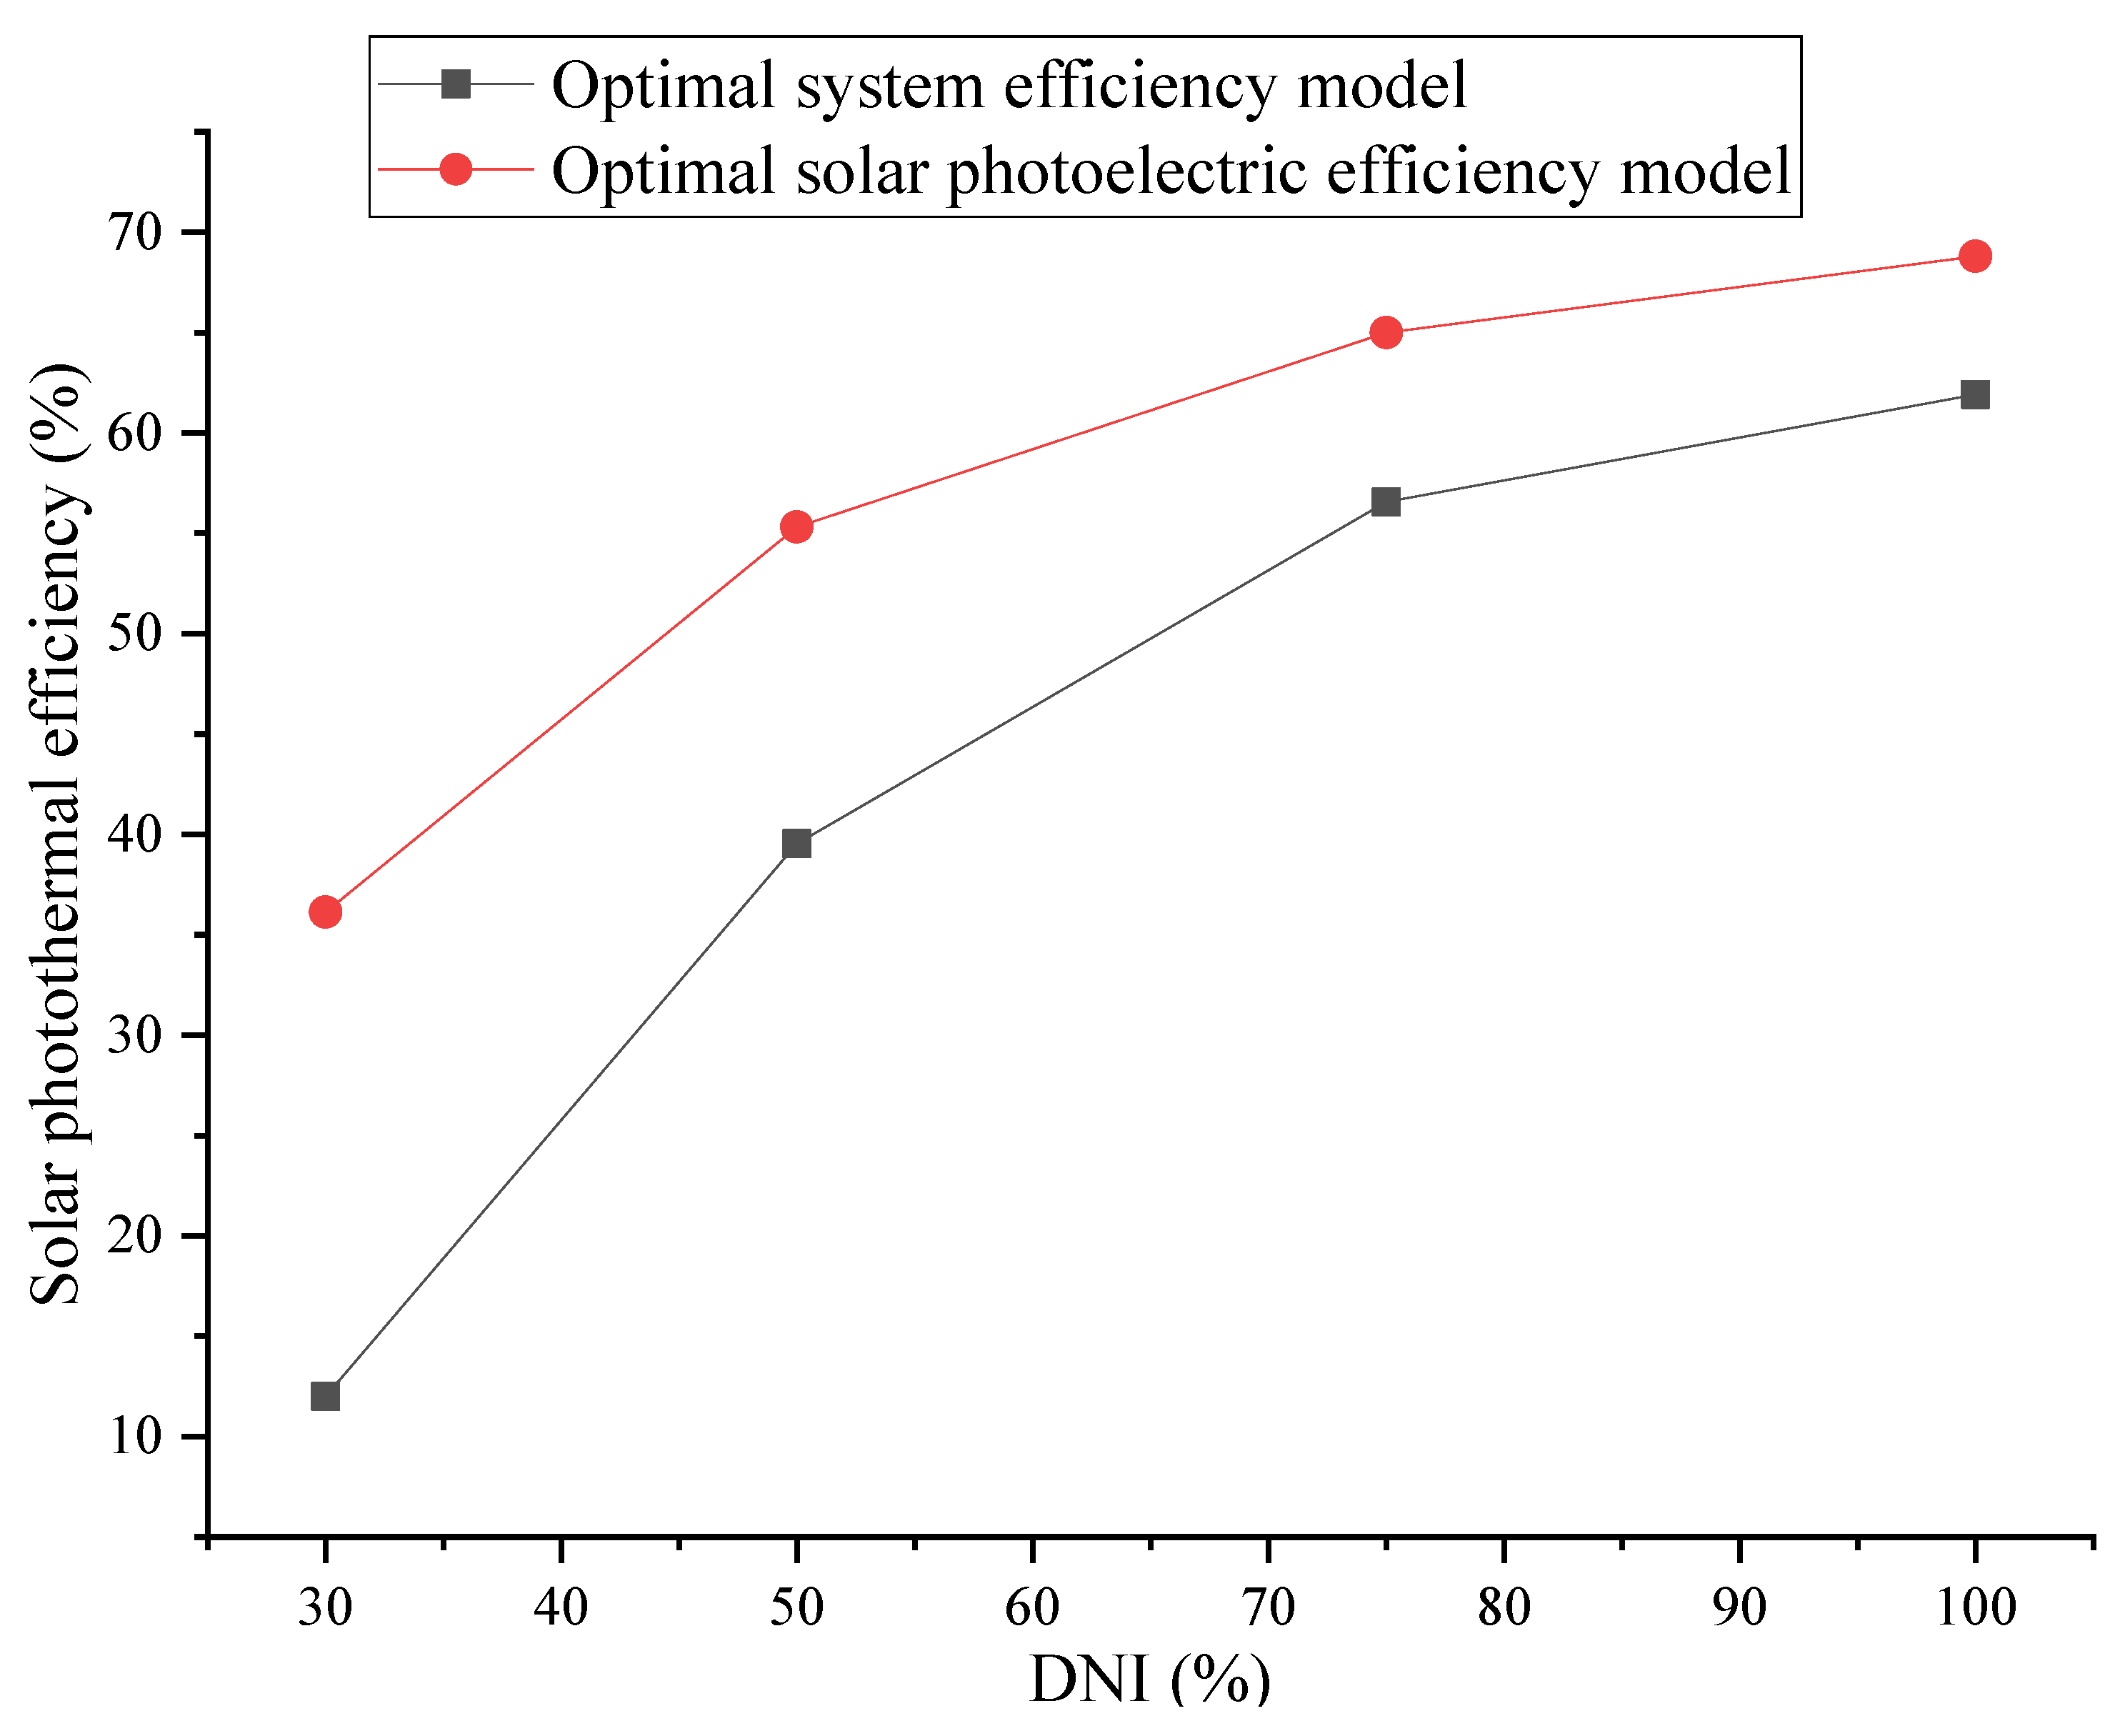
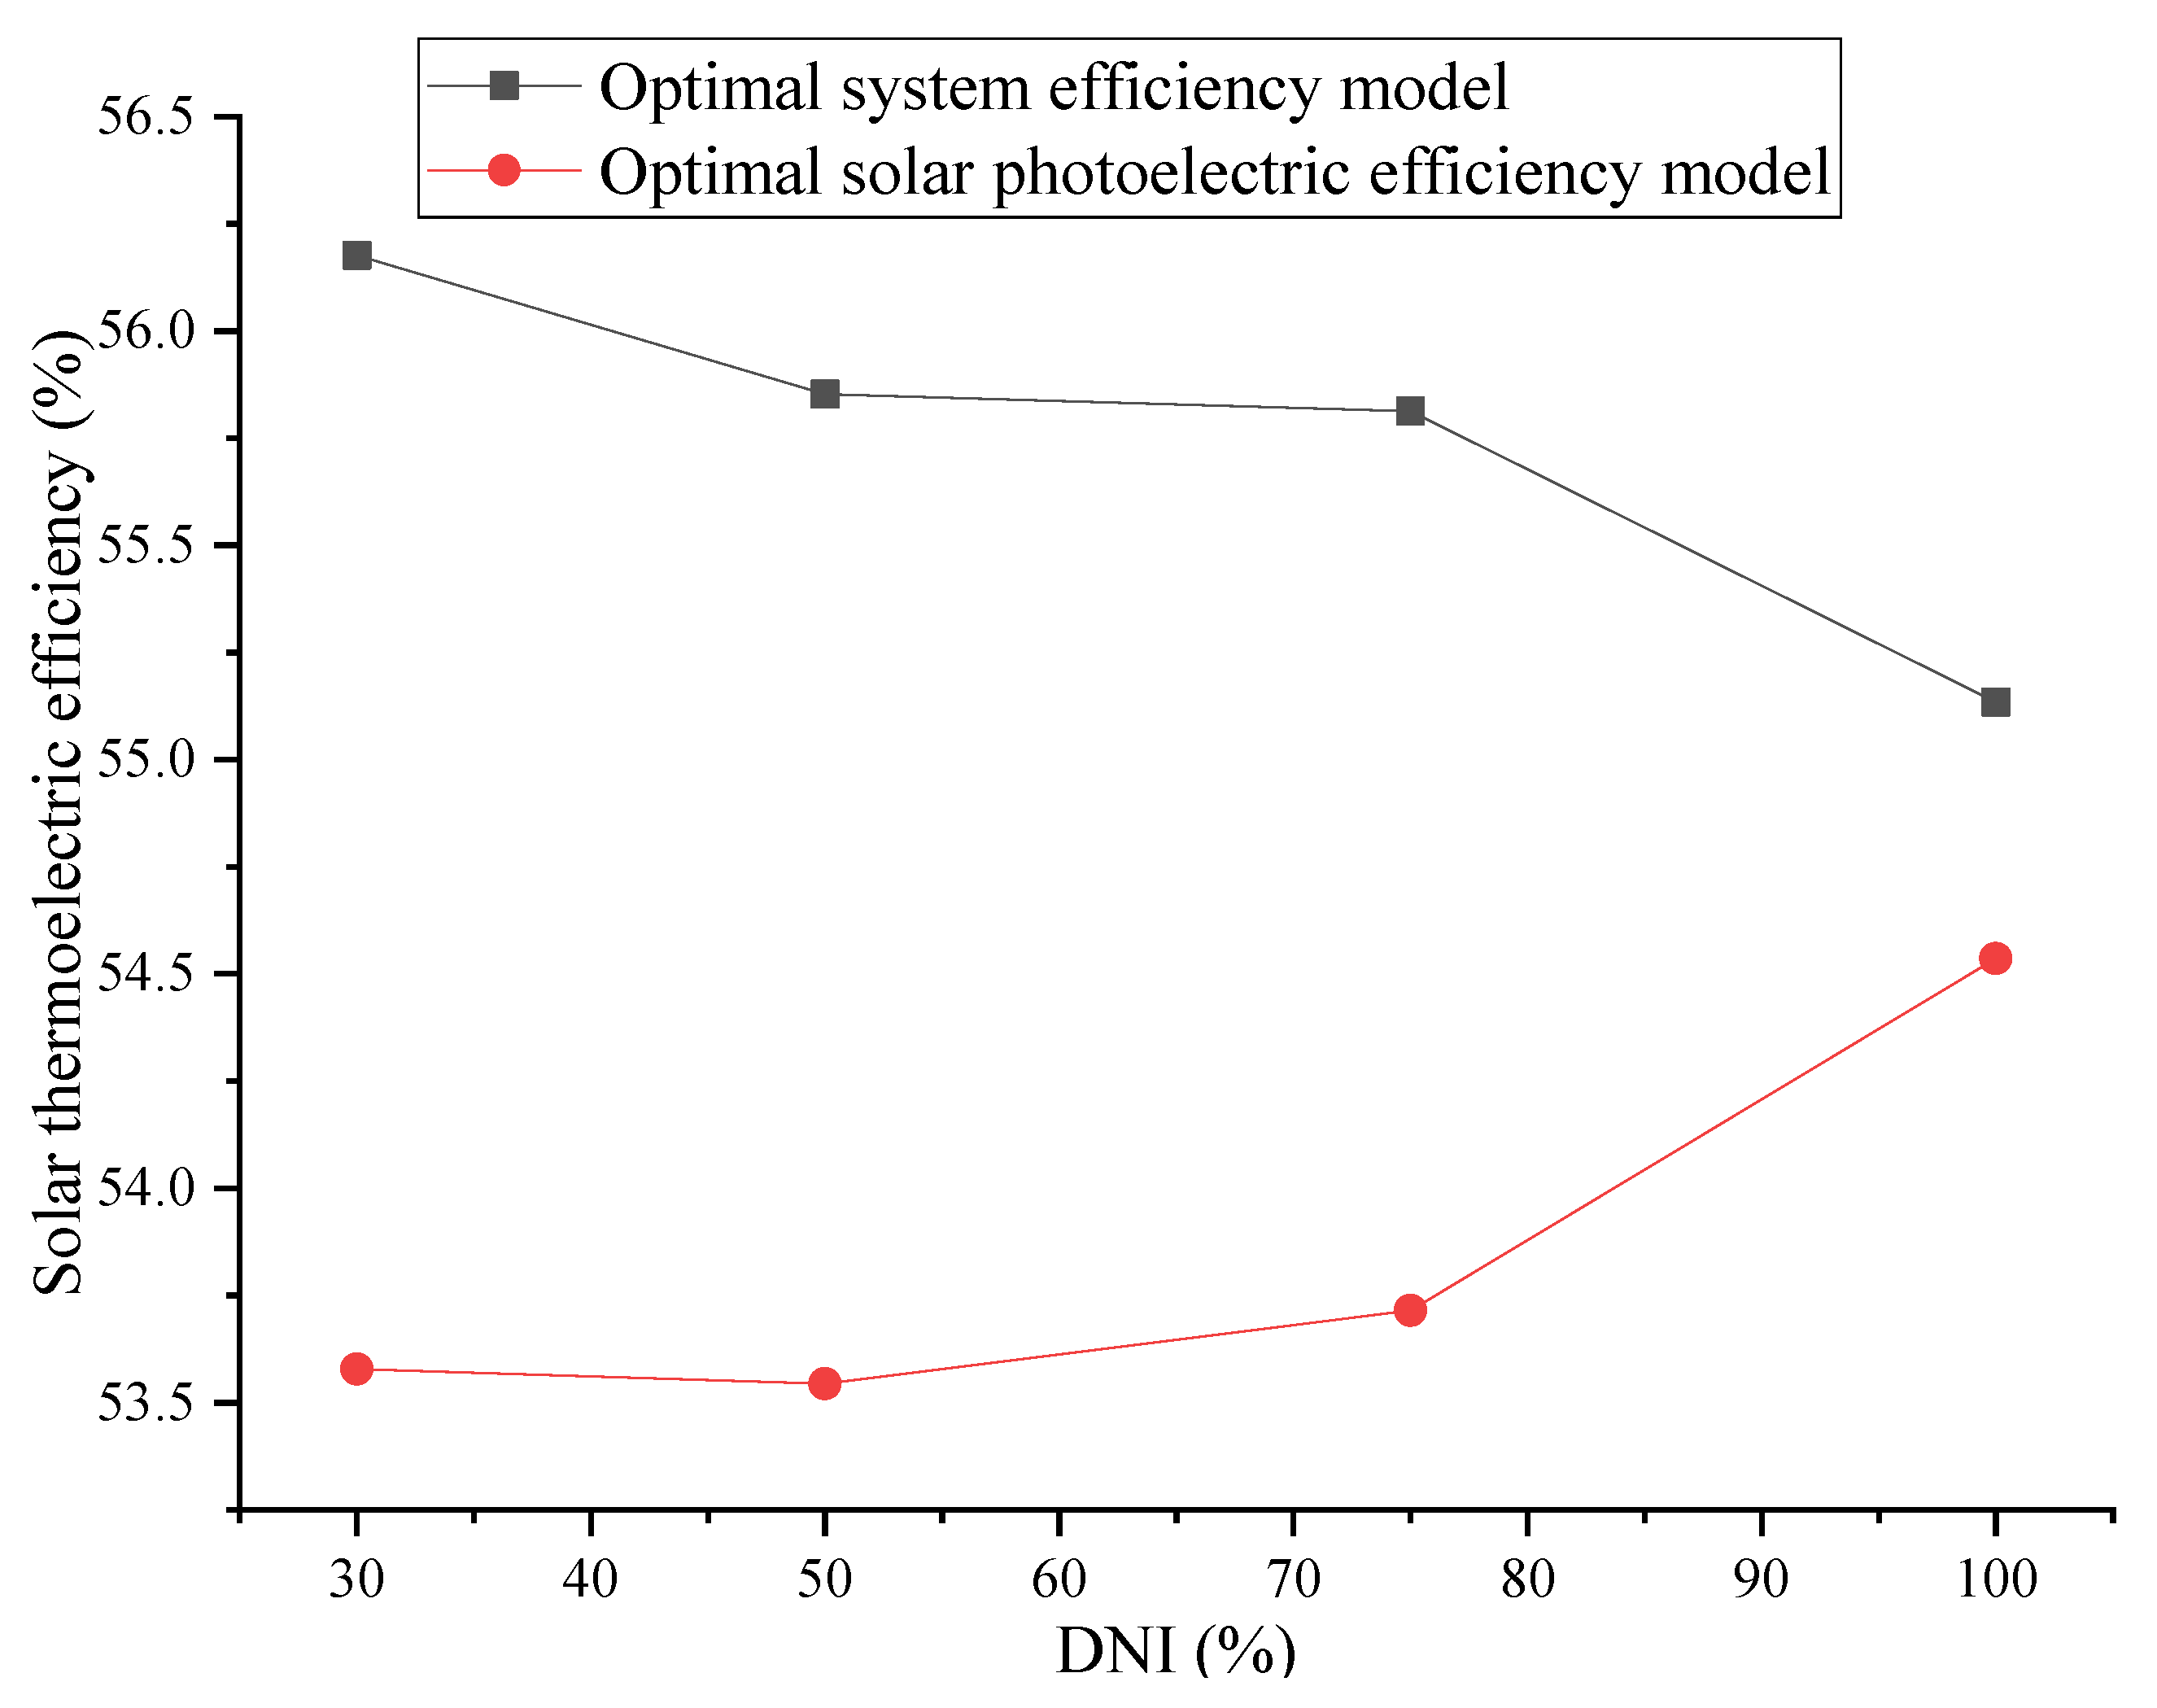
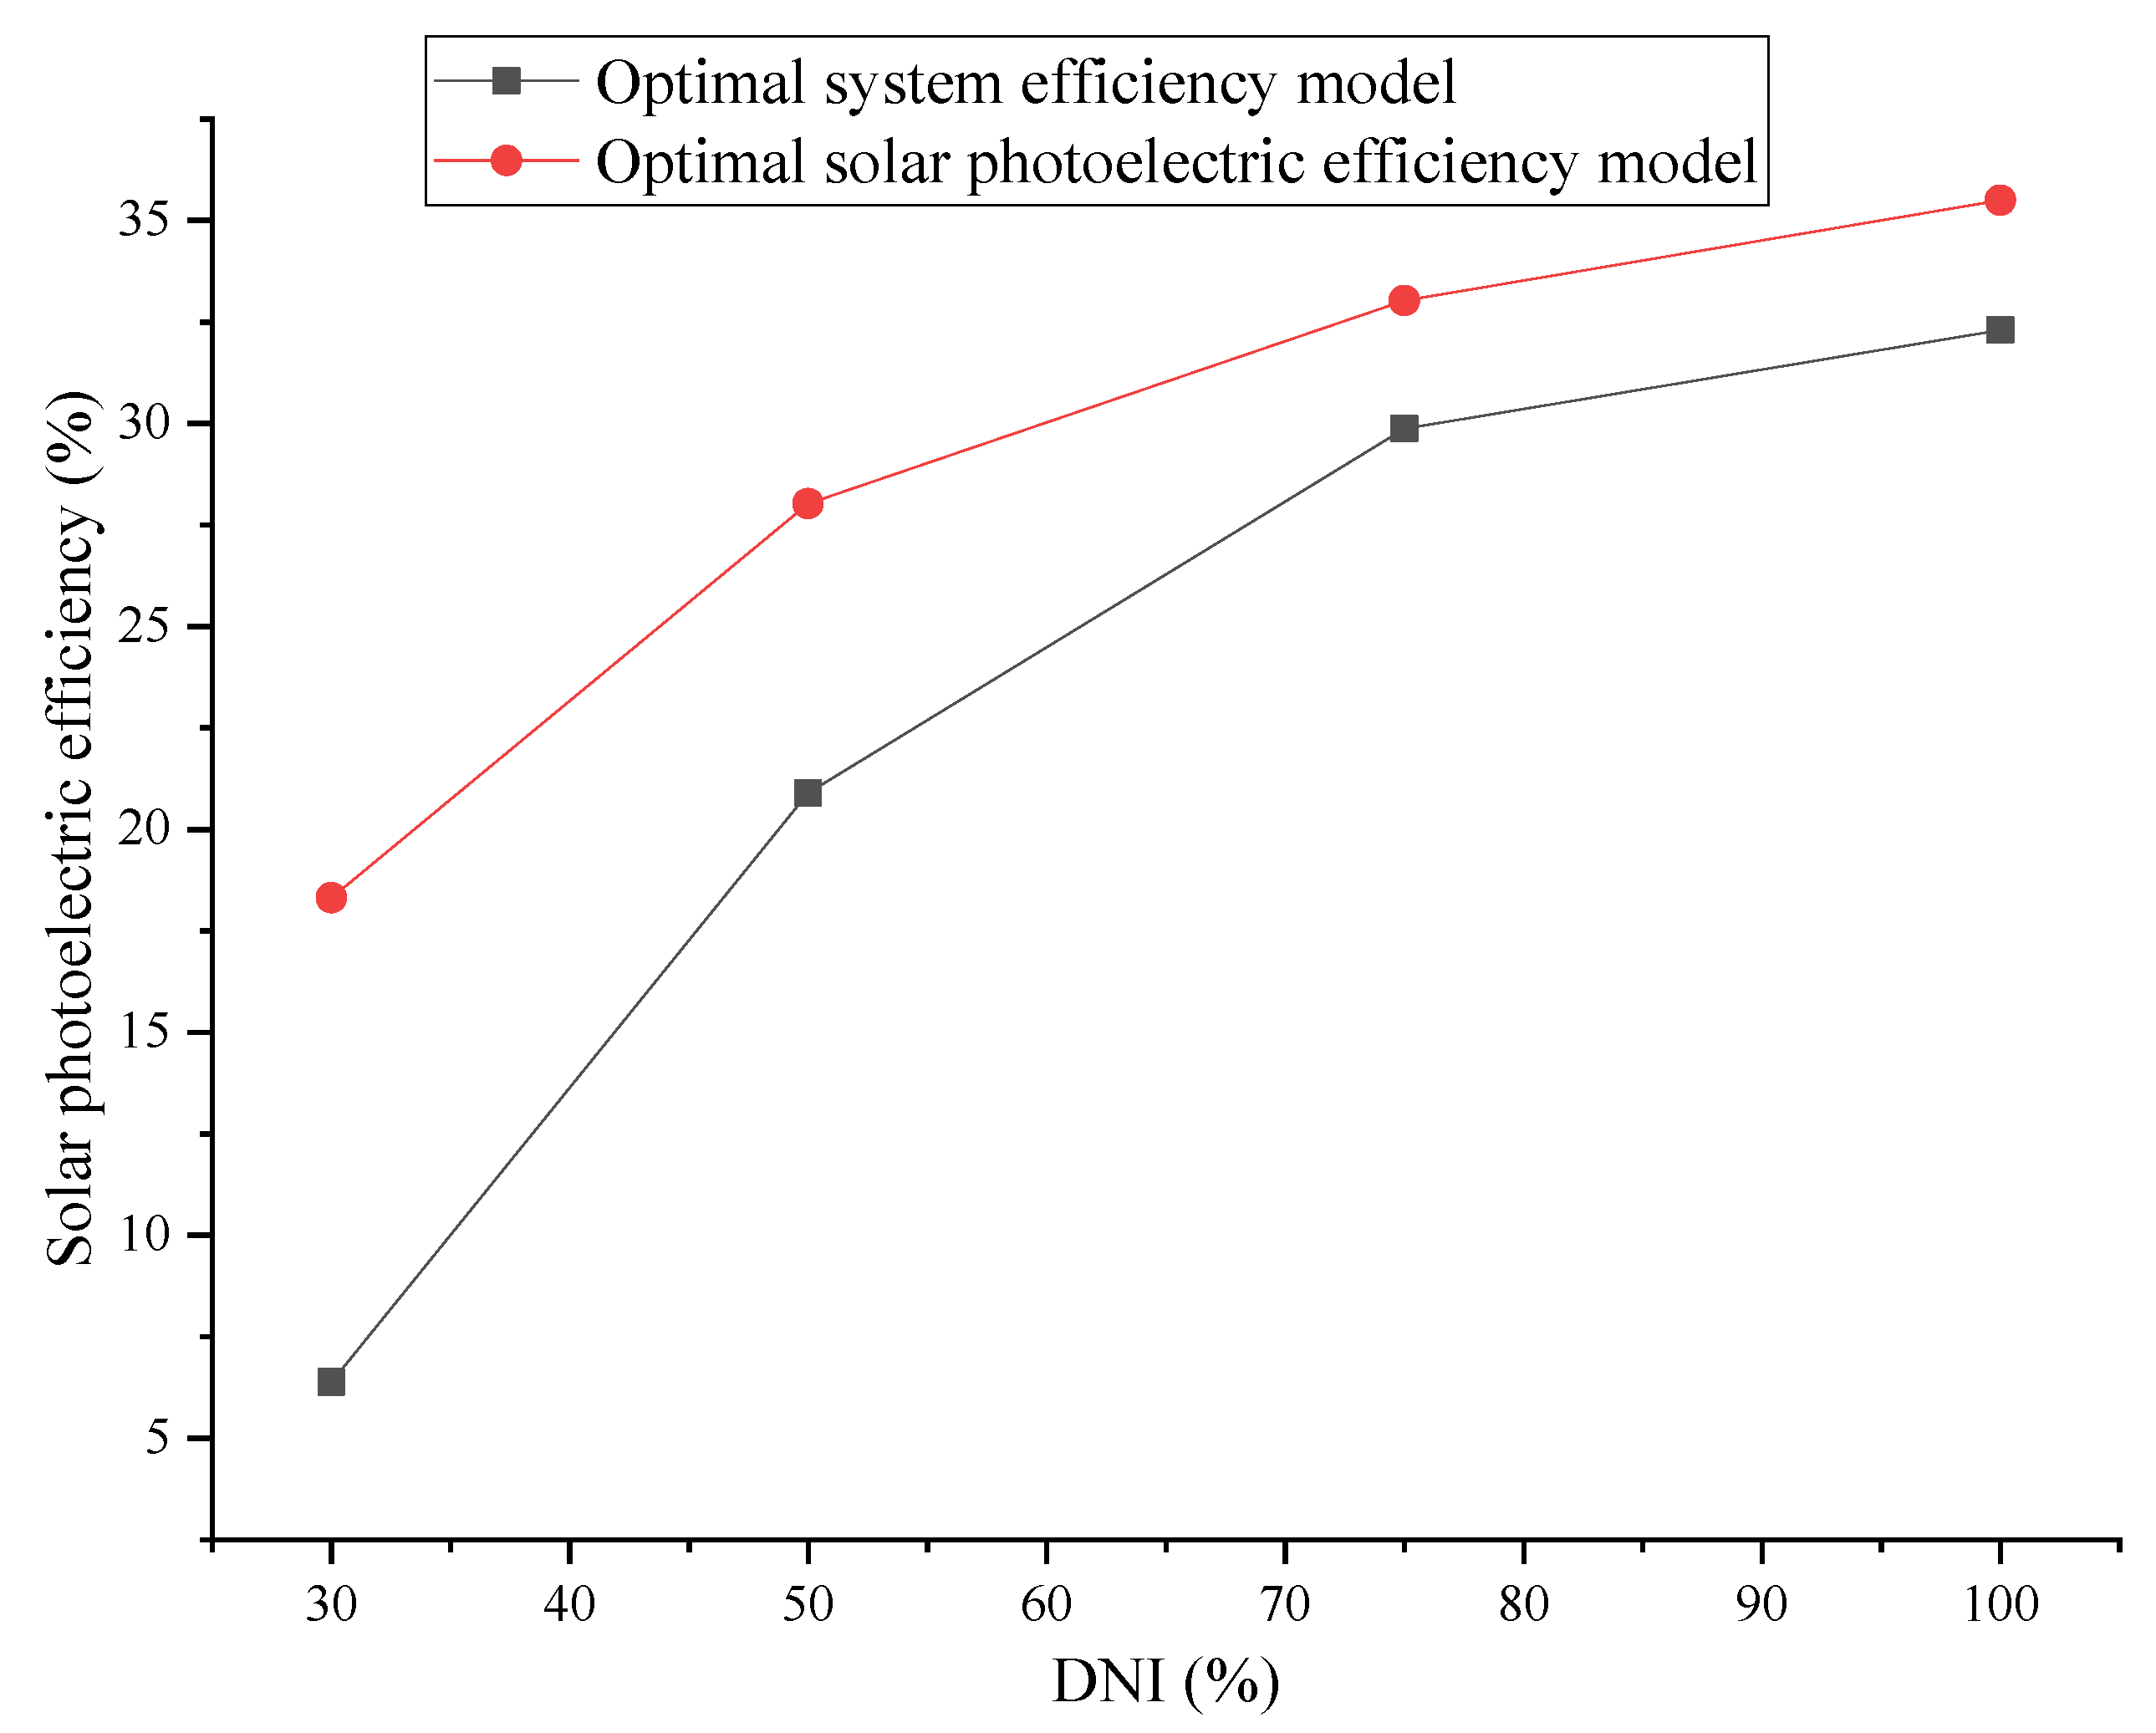
On the one hand, in the case of high gas turbine load variation from 100% to 75%, the optimal model for solar photoelectric efficiency always indicates a certain proportion of solar energy integration in the topping and bottom cycle, which is different from the optimal model for system efficiency: before reaching the ultimate limit of integration in the topping cycle, solar energy is only integrated in the topping cycle in preference to the bottom cycle. After all, the initial parameters of the work medium in the topping cycle are greater than that of the bottom cycle under the high load of the gas turbine; besides, the solar energy can be involved in the whole thermodynamic process of the ISCC system. In comparison, the two-stage integration scheme of the optimal solar photoelectric efficiency model can achieve the lower heat collection temperature; hence, improving the photothermal efficiency directly affects the photoelectric efficiency. Taking the models with optimal system efficiency and solar photoelectric efficiency under the design load conditions as an example, the trends of photothermal efficiency, thermoelectric efficiency and photoelectric efficiency with the reduction of DNI are shown in Figure 6, Figure 7 and Figure 8. Benefiting from a lower heat collection temperature, the optimal photoelectric efficiency model has a higher photothermal efficiency than the optimal system efficiency model. Meanwhile, it also leads to lower thermoelectric efficiency, though the photoelectric efficiency is greatly influenced by the photothermal efficiency, because the order of magnitude of the change in the photothermal efficiency is much larger than that of the thermoelectric efficiency, which decreases more smoothly. For the optimal solar photoelectric efficiency model, the photothermal efficiency decreases from 68.8% to 36.1% during the DNI fluctuate from 100% to 30%; whereas, the thermoelectric efficiency only decreases from 54.54% to 53.58% under that fluctuation of DNI.
On the other hand, in the case of gas turbine load variation from 100% to 50%, these two optimal system models show different preferences for the solar integration position of the bottom cycle. The optimal model for system efficiency prefers to be integrated in the HPS, while the other one prefers to be integrated in the HPB. Generally speaking, the main steam has the greatest capacity to do work in the Rankine cycle, so HPS in the bottom cycle is chosen to be integrated preferentially in the optimal system efficiency model, which can maximize the output power; furthermore, the system efficiency can be improved. For the model with optimal solar photoelectric efficiency, the optimization process must take into account the participation of photothermal efficiency; so, a lower heat collection temperature brings greater photothermal efficiency, which is conducive to improving solar photoelectric efficiency. Therefore, HPB becomes the best alternative to HPS, which can effectively reduce the heat collection temperature and improve the photothermal efficiency, while ensuring the priority integration of a higher-pressure section with better performance.
5.3. Variation of Optimization Results with DNI Fluctuations
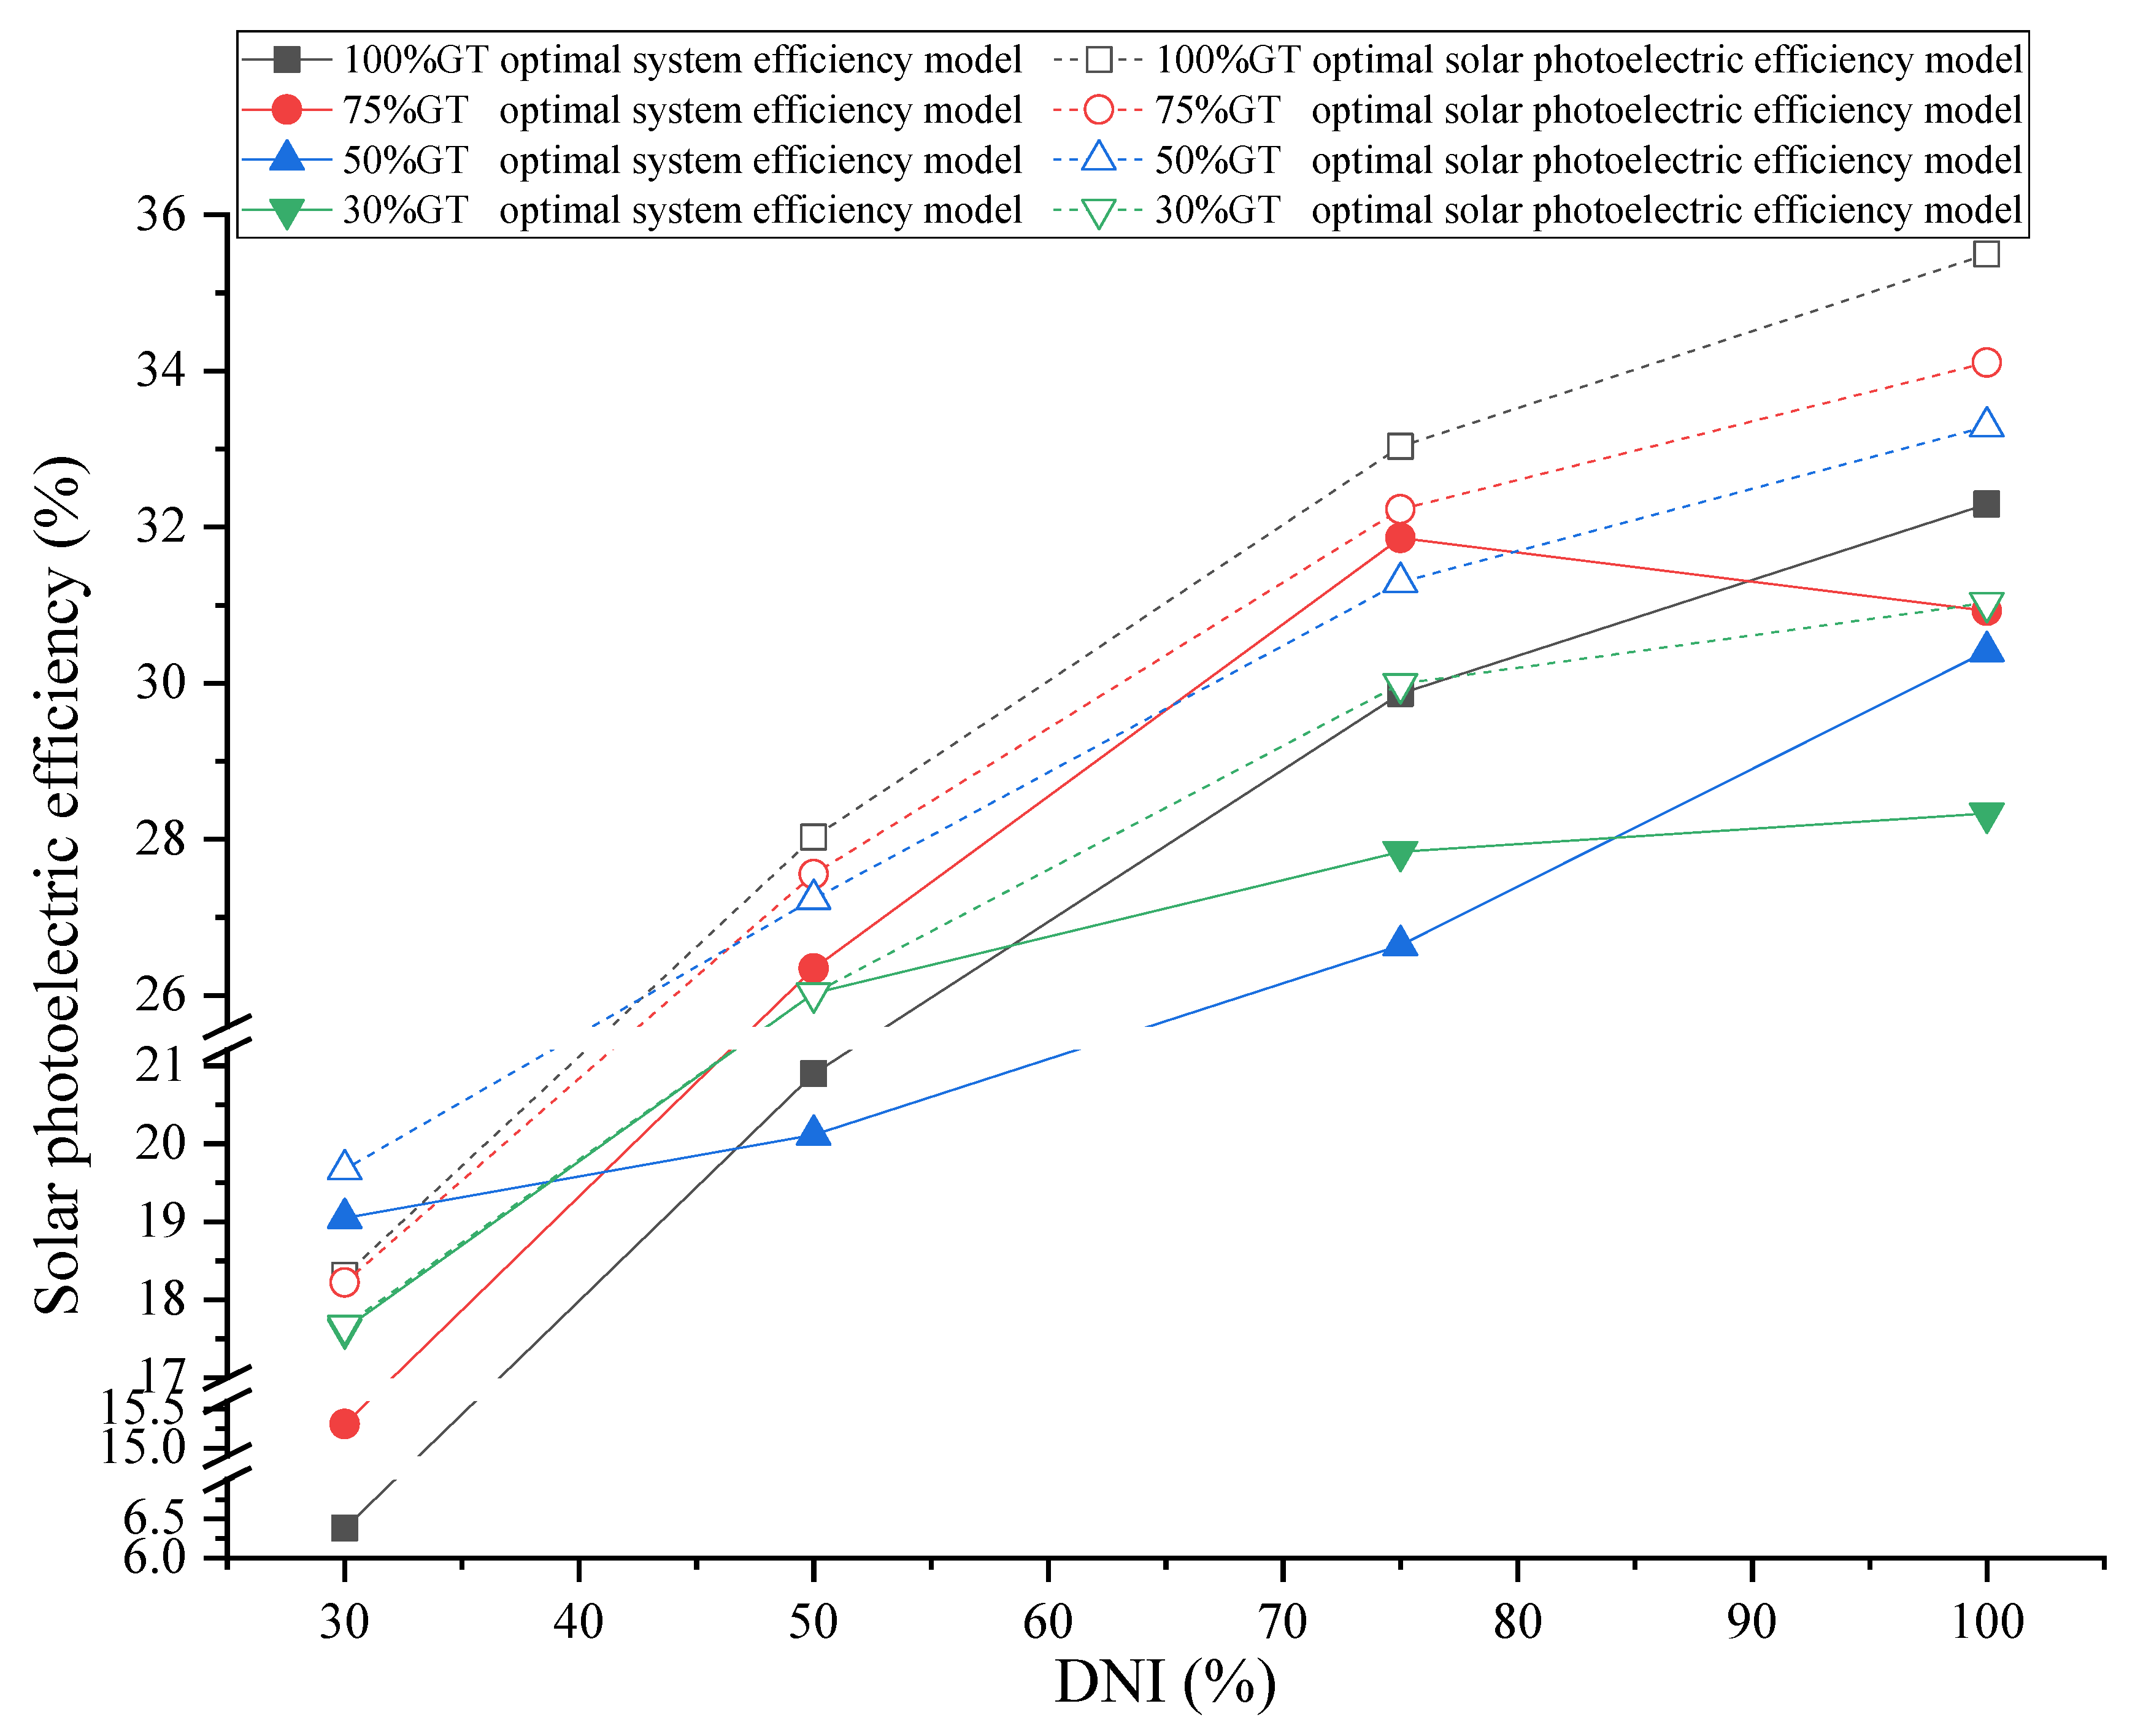
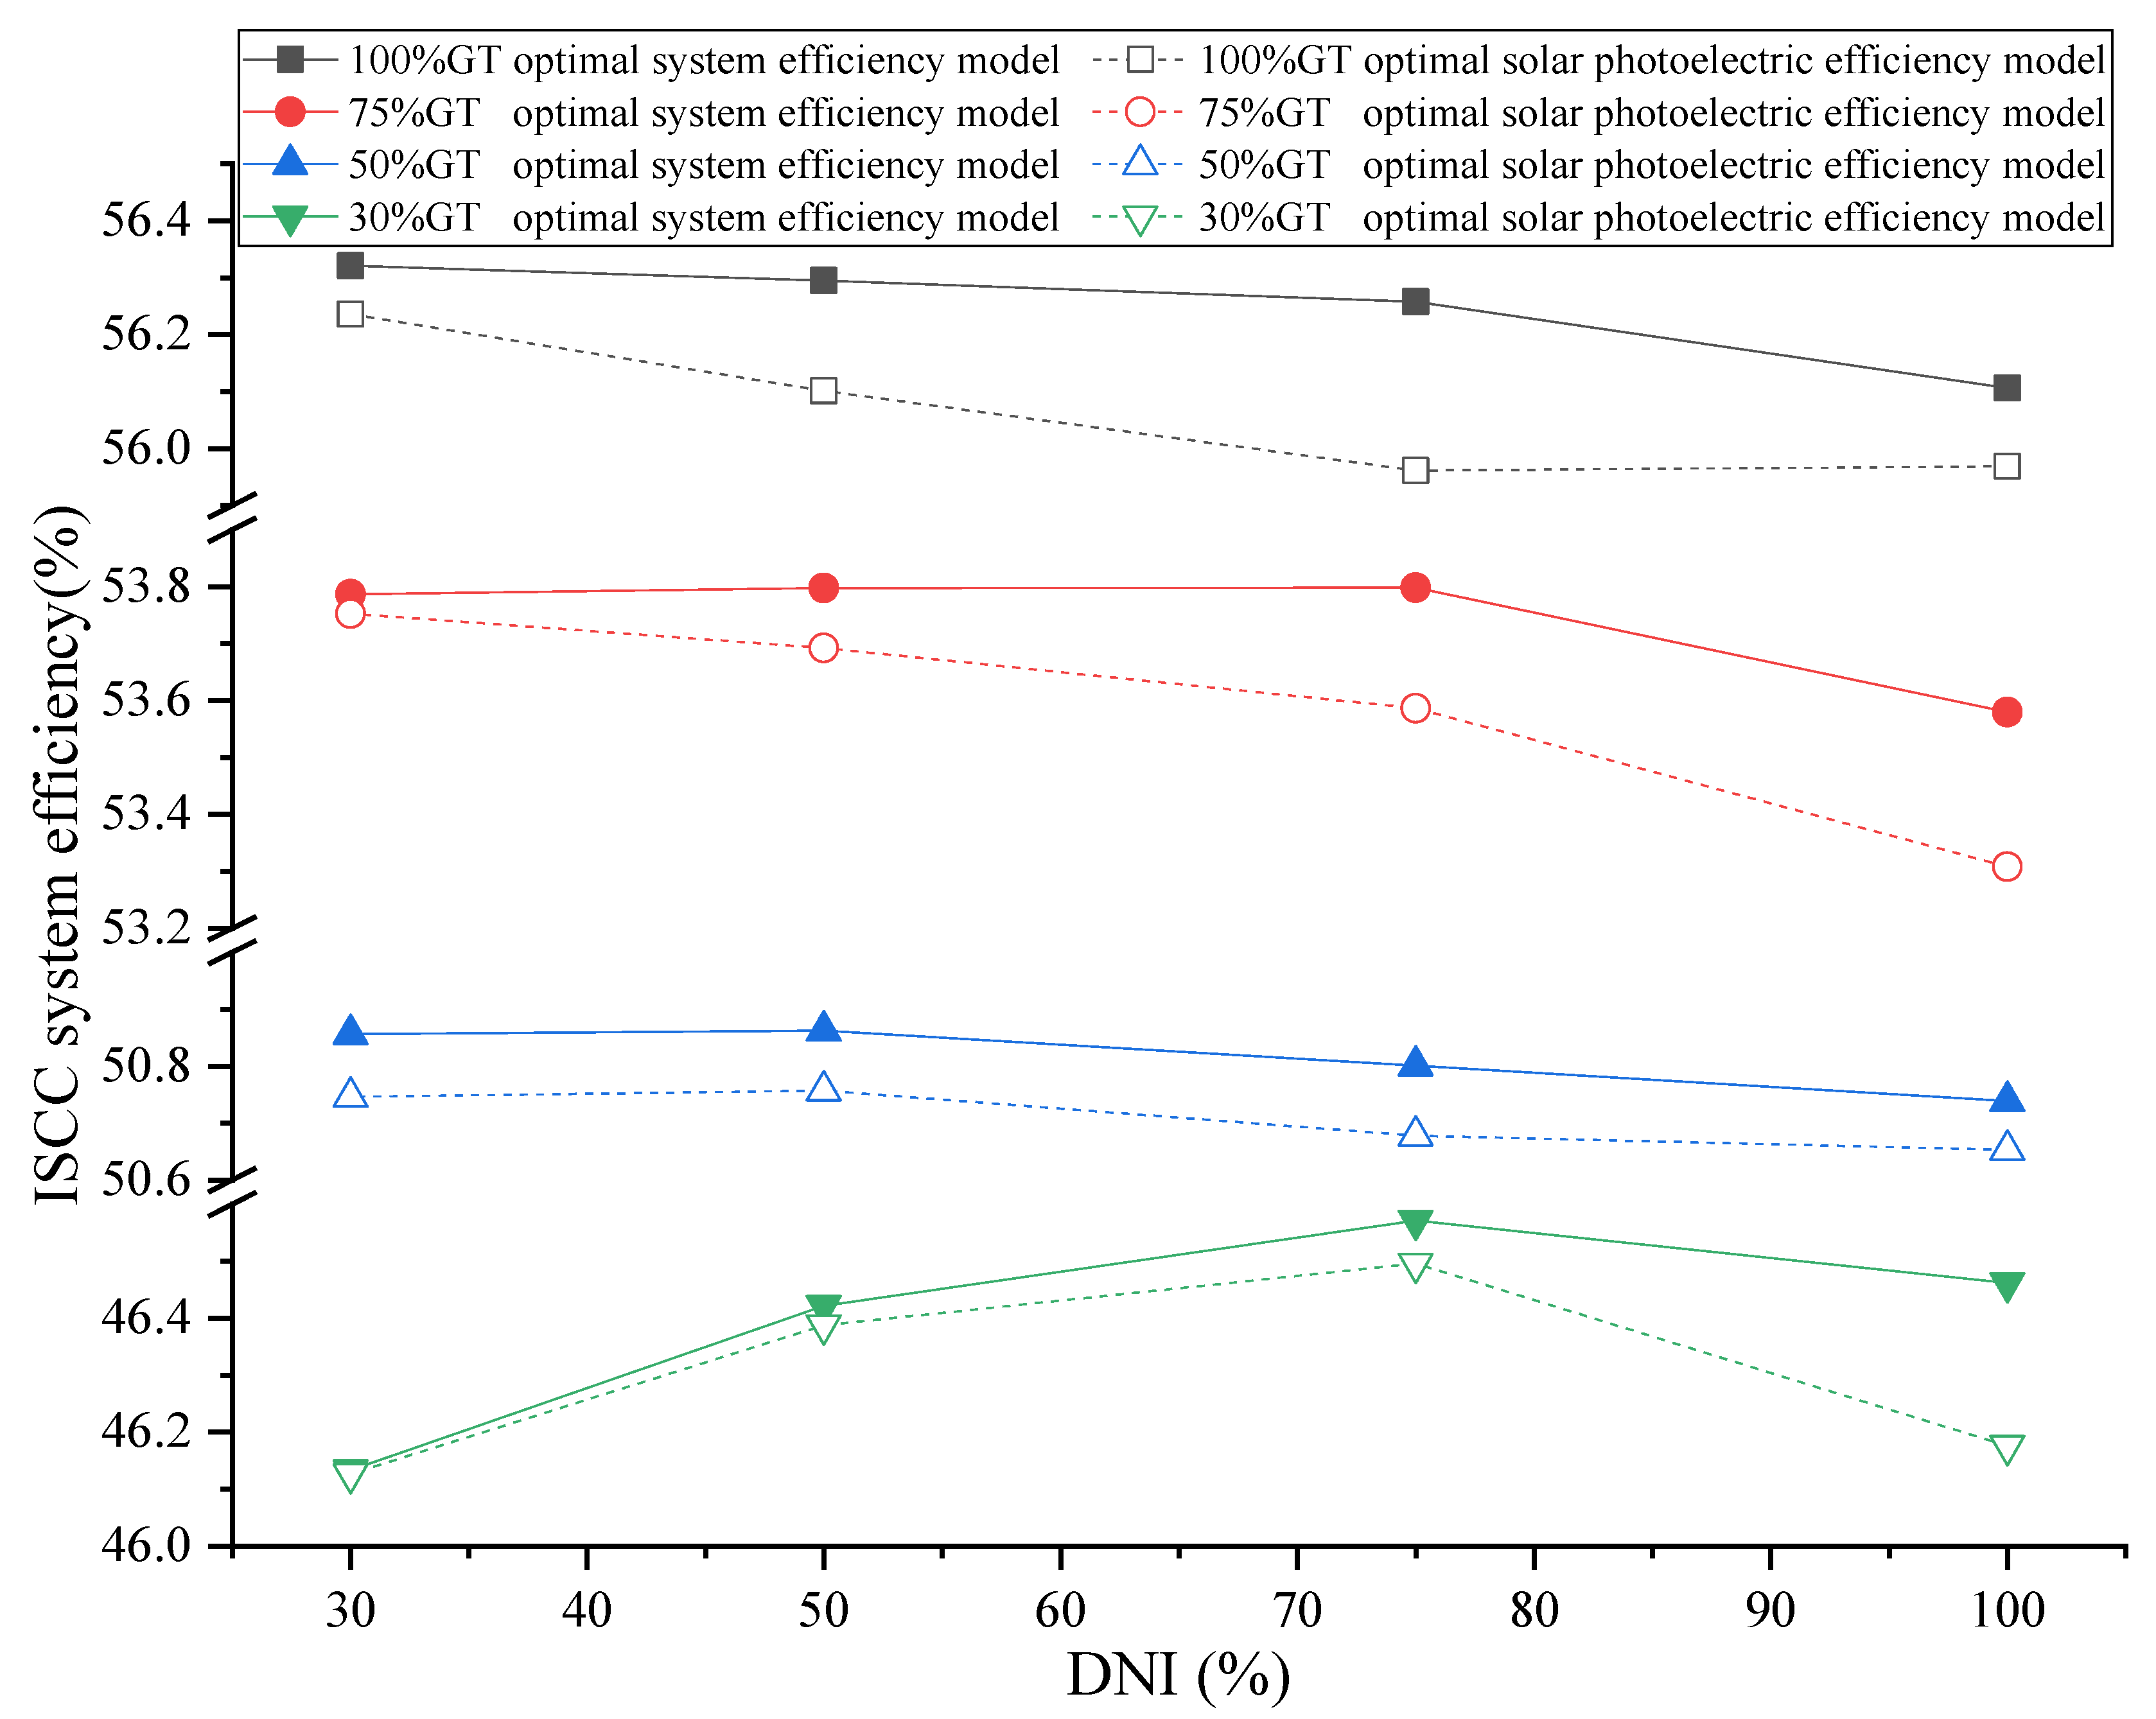
The efficiency variations of the two objective functions with fluctuations in DNI are shown in Figure 9 and Figure 10, and the highest solar photoelectric efficiency of 35.5% is achieved under 100% GT-100% DNI condition, while the highest system efficiency of 56.32% is achieved under 100% GT-30% DNI condition. As can be seen, the system efficiency changes mainly with the variation of the gas turbine load, and is slightly affected by the fluctuation of DNI, which is opposite to the photoelectric efficiency, which changes dramatically and is mainly affected by the fluctuation of DNI. In addition, in the case of gas turbine load variation from 100% to 50%, the system efficiency of the two optimal models increases slightly with the reduction of DNI,.It is known that the greater the amount of solar energy collected, the greater the amount of fuel saved, which will change the composition of the gas turbine exhaust gas. This will lead to a reduction in the gas turbine exhaust gas mass flow rate and enthalpy. Furthermore, the output power of the bottom cycle will be slightly reduced, thus influencing the ISCC system efficiency.
5.4. Comparison with Specific Cases
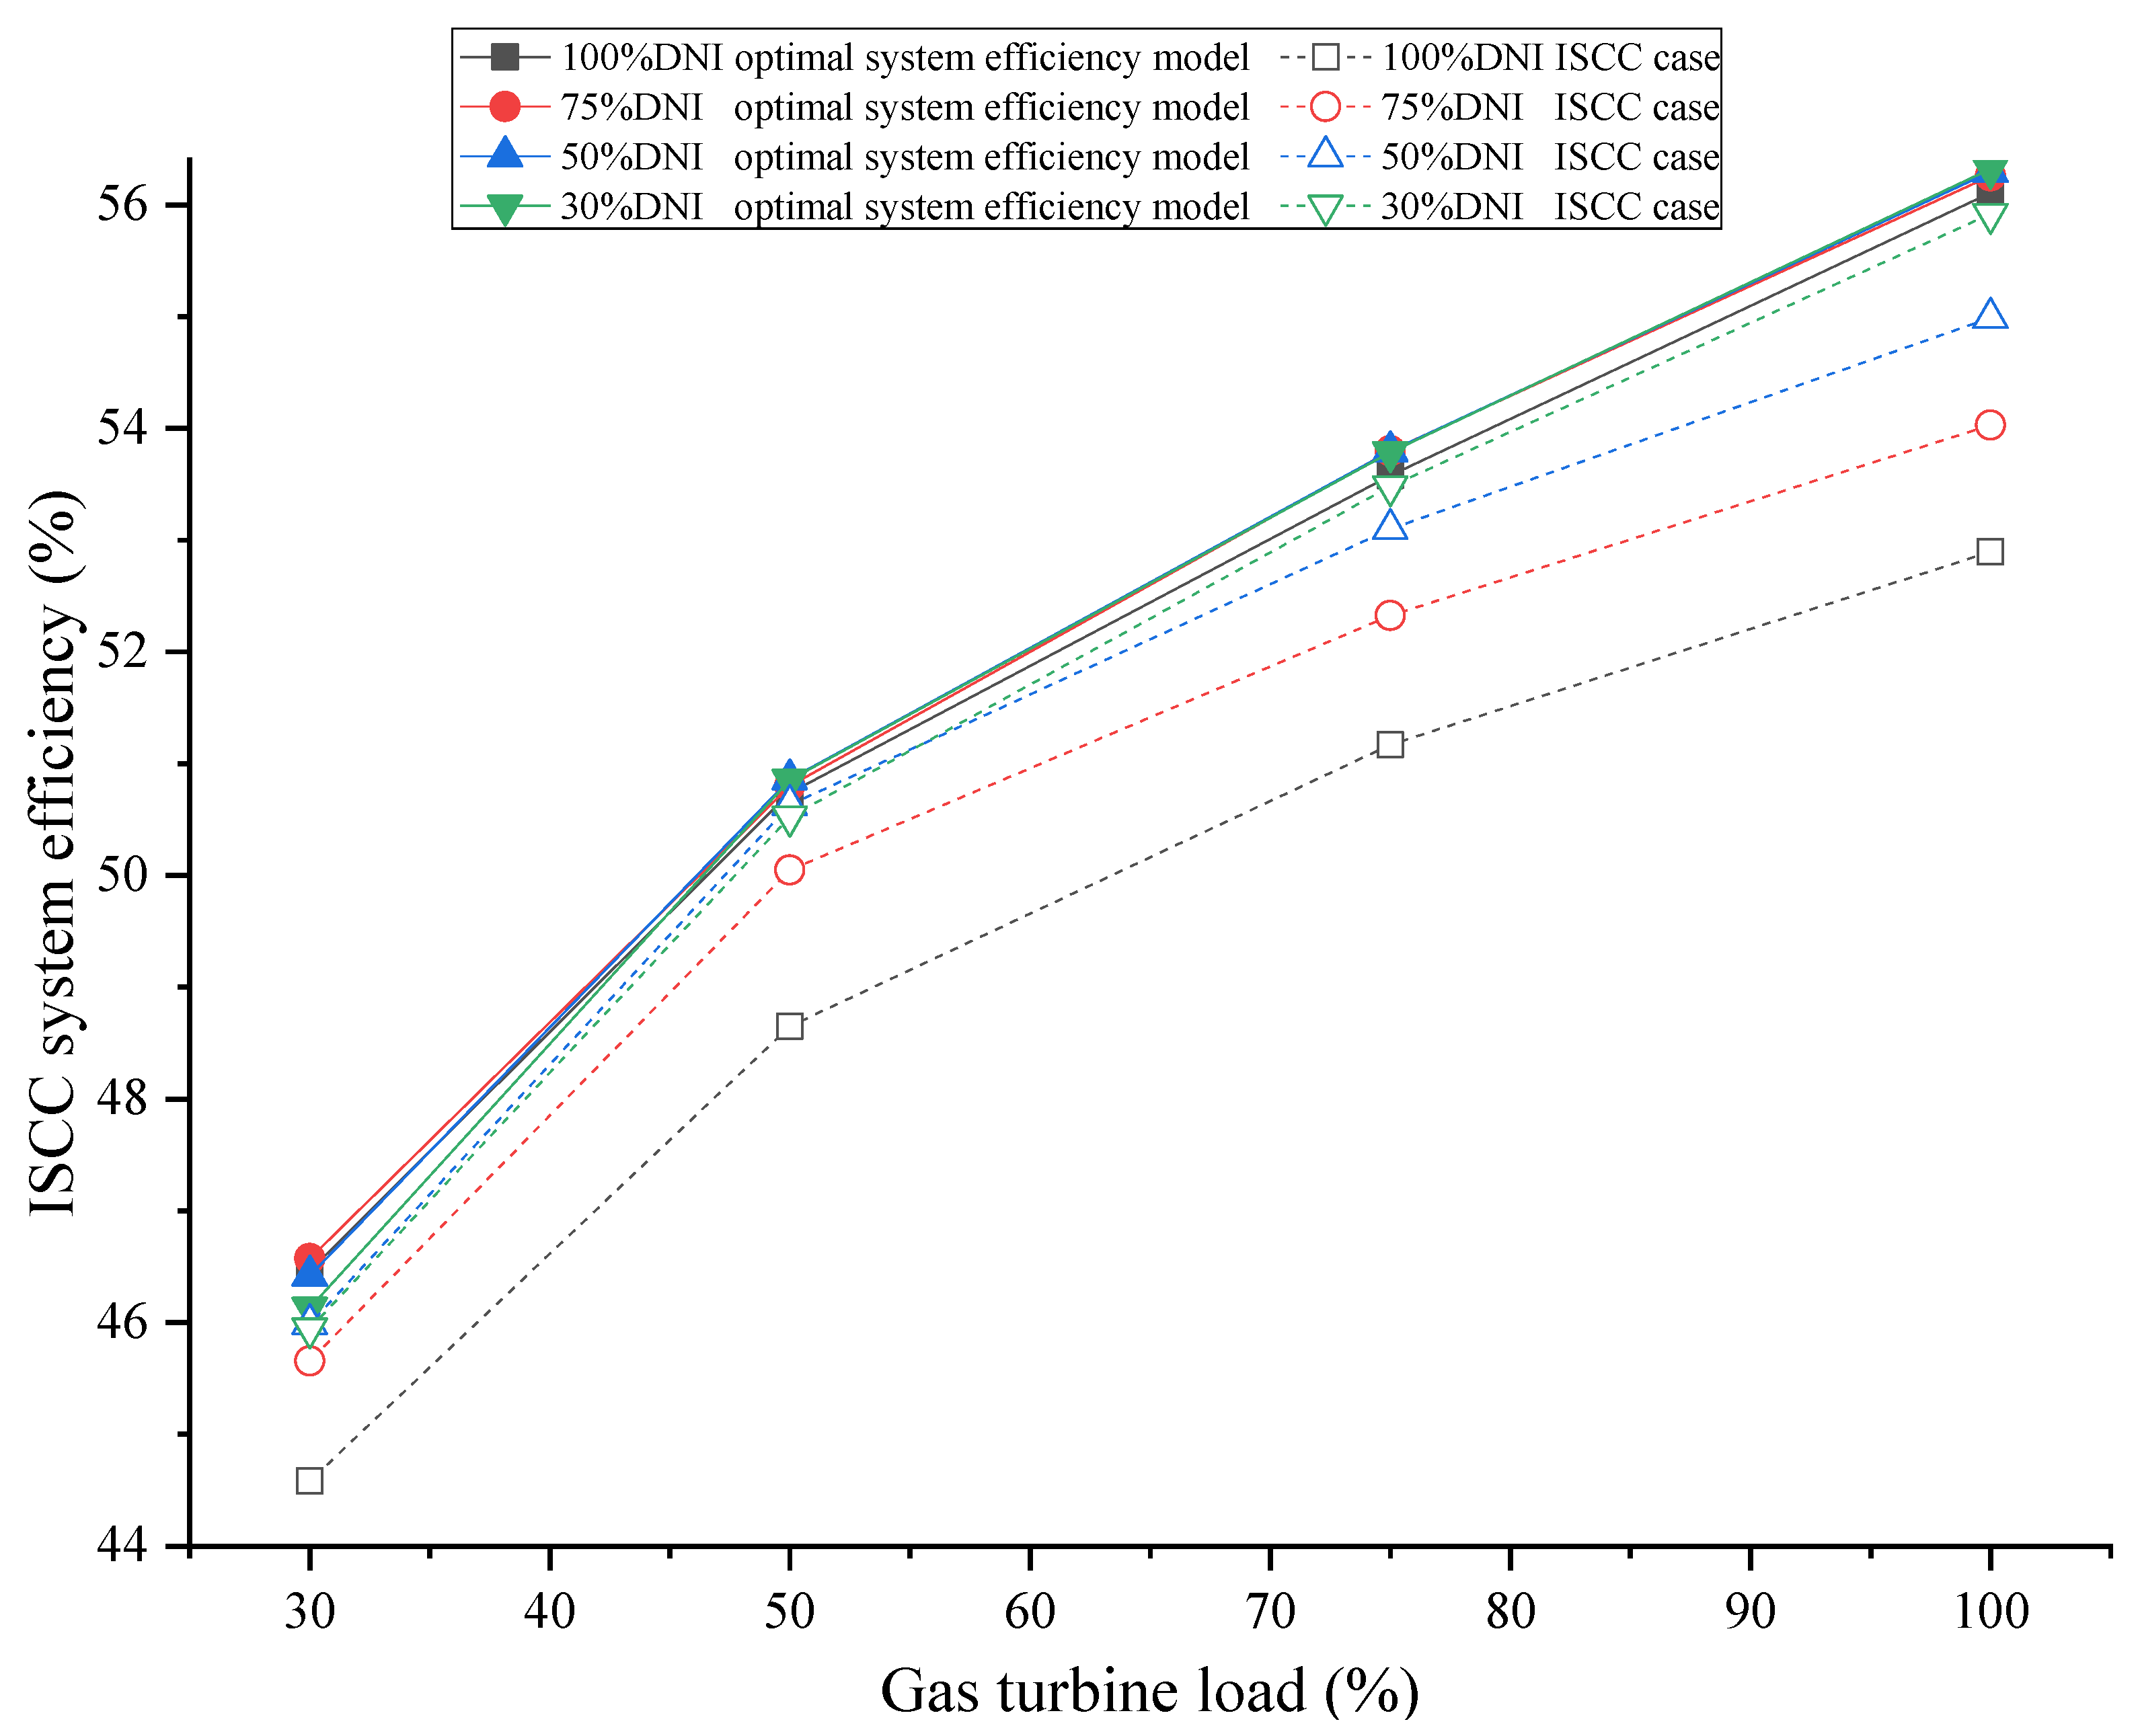
The ISCC with solar energy integrated with the HPB of the bottom cycle mentioned in the literature [31] was chosen as the comparison group for the optimum system efficiency model, and these two system efficiency values, based on different DNI and gas turbine loads, are compared, and the results are displayed in Figure 11. As can be clearly seen, the system efficiency values of the comparison group are lower than those of the optimum system efficiency model under all operating conditions.
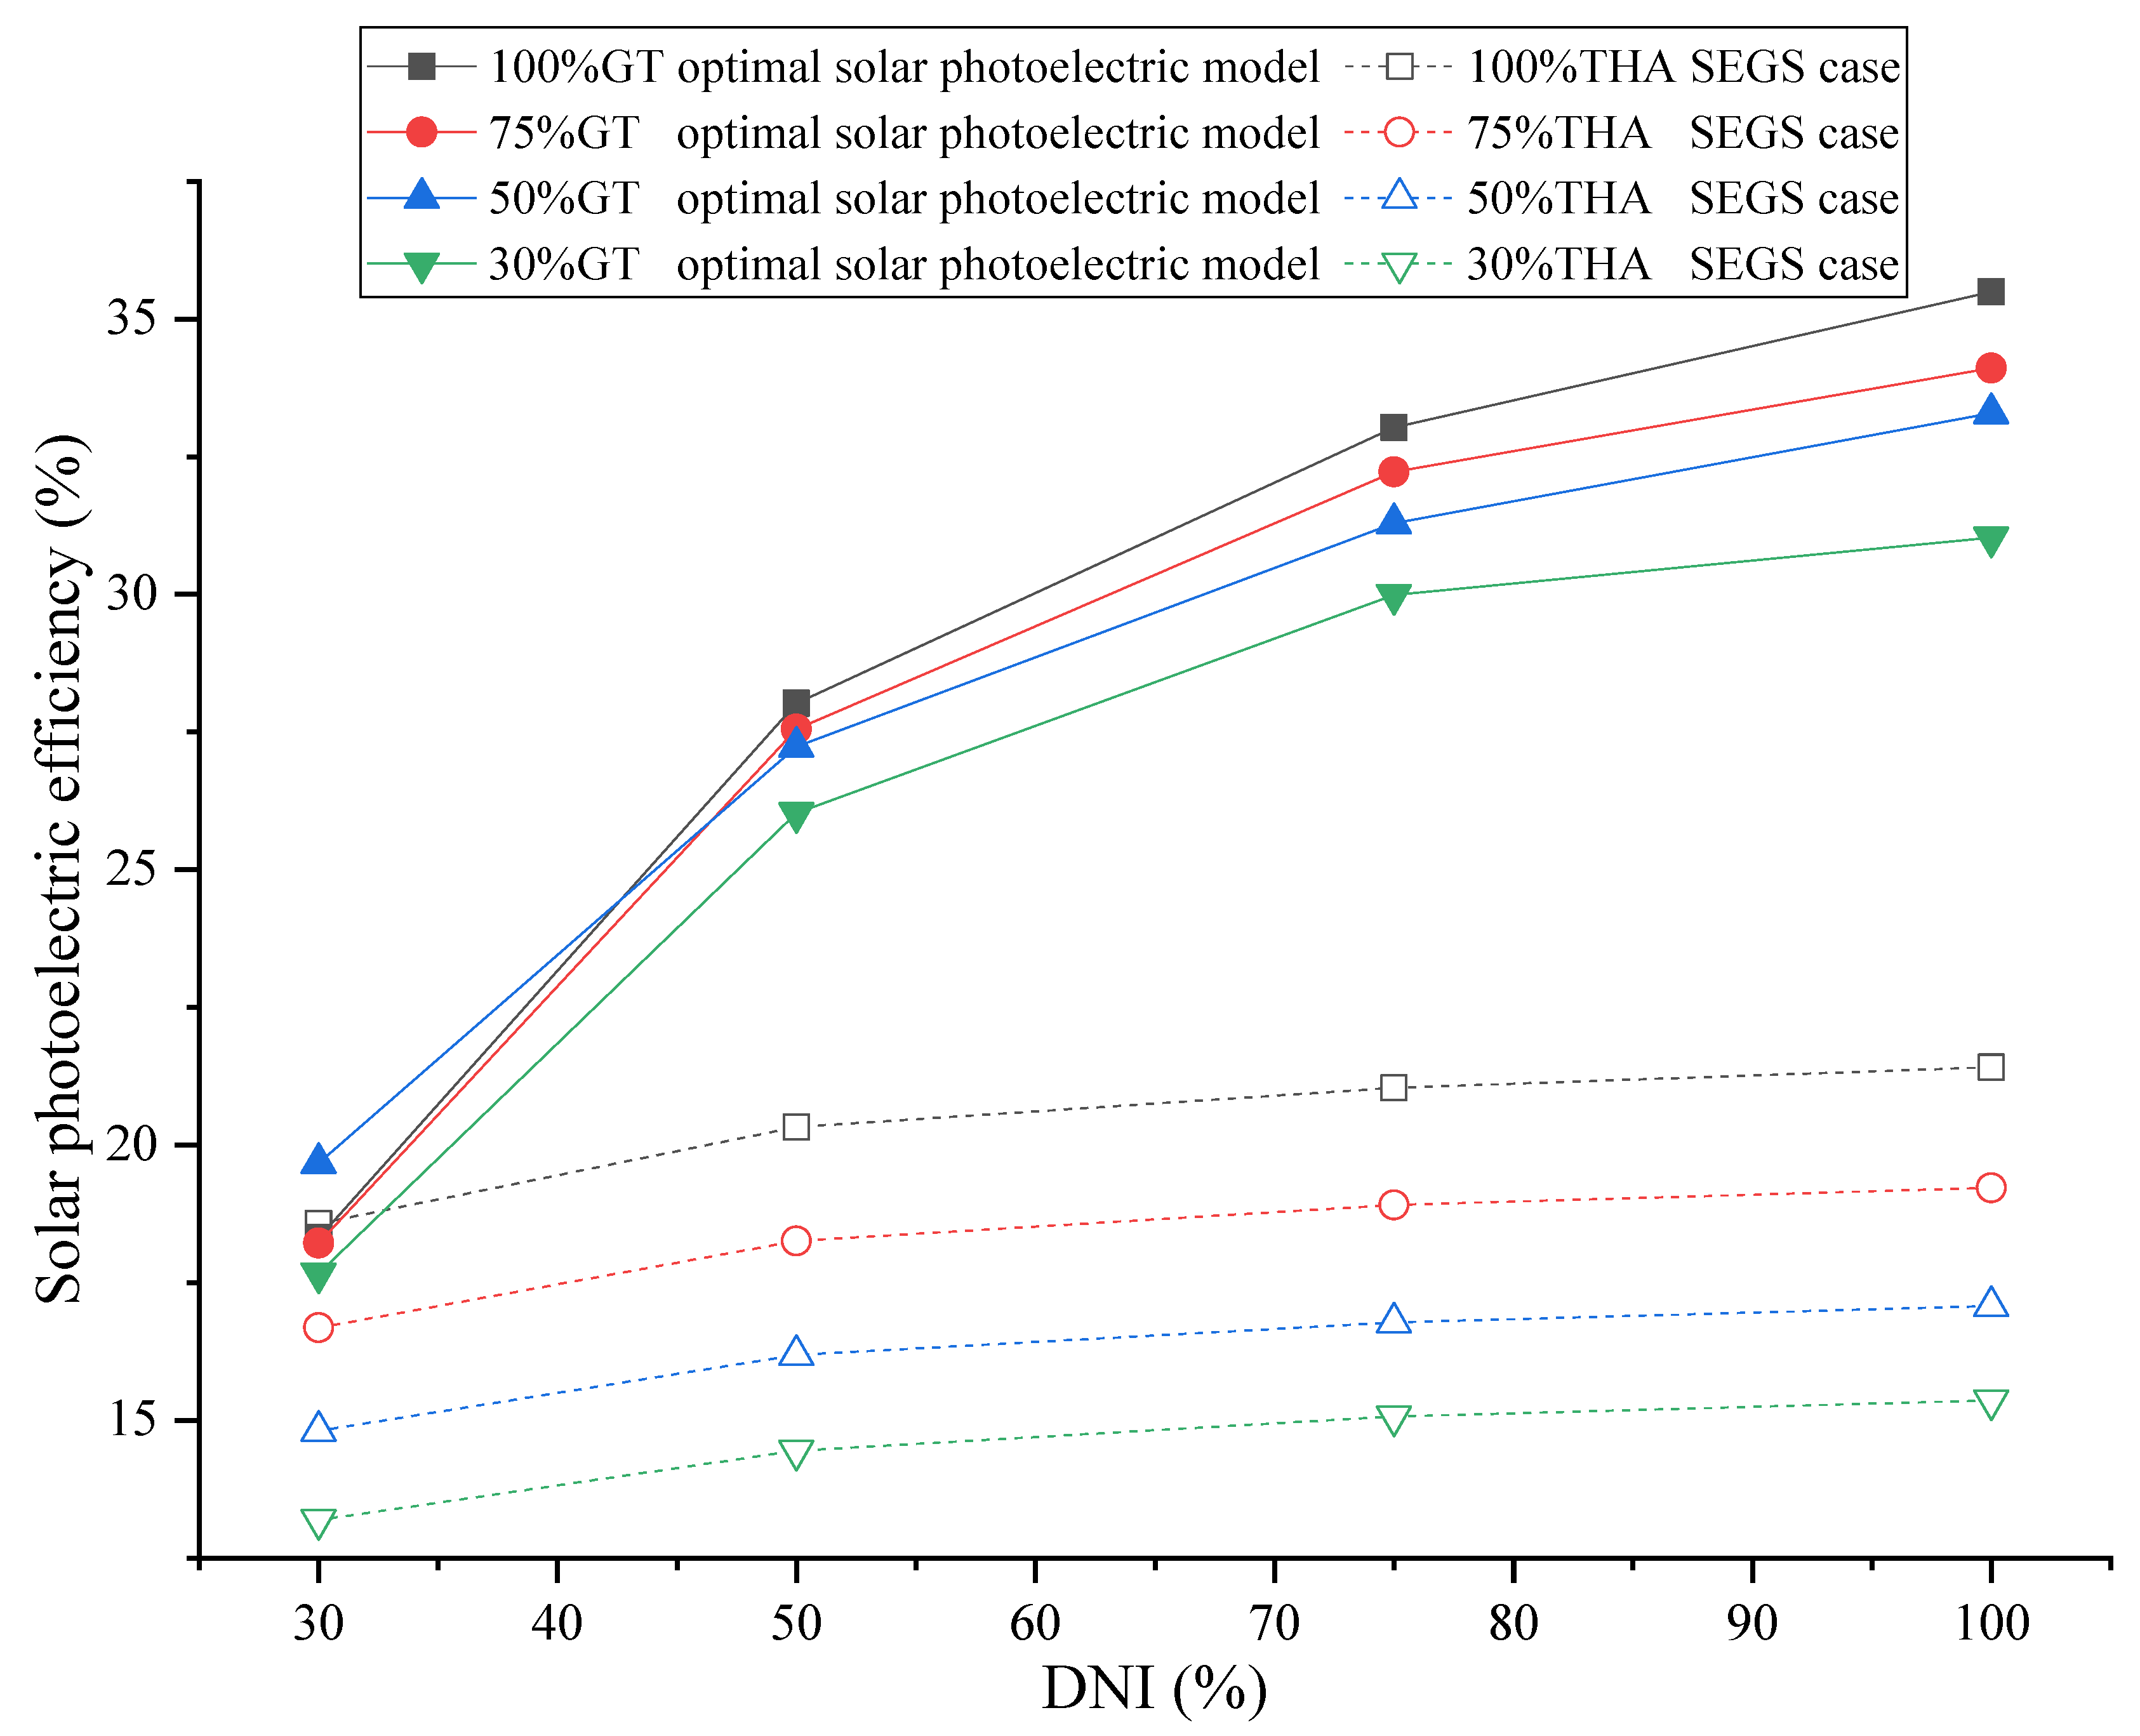
Likewise, the SEGS system described in the literature [32] is chosen as the comparison group for the optimal solar photoelectric model. The solar photoelectric efficiency values of the two groups based on different operating conditions are shown in Figure 12. It can be seen that the photoelectric efficiencies of the optimal model are also ahead of those of the comparison group, due to the greater initial parameters and the high efficiency of the basis GTCC system.
6. Conclusions
In this paper, a general ISCC system optimization method with the system efficiency and the photoelectric efficiency as the objective functions is proposed, while the optimal integration schemes under different operating conditions are worked out. The comparisons between the optimal scheme and the actual cases are also studied. Thefollowing conclusions can be reached:
- Based on the idea of temperature cascade utilization, the GA is applied to find the optimal distribution ratio for the 11 virtual heat exchangers in the ISCC system, and the optimal integration schemes of these two types of objective functions under different working conditions are derived.
- As the gas turbine load reduces, the solar integration position of the two optimal solutions will gradually transfer from the topping Brayton cycle to the bottom Rankine cycle. Specially, in the case of 50% gas turbine load, with the reduction of DNI, the heat collection ratio of the bottom cycle will become more and more considerable, until it is fully integrated into the bottom cycle.
- In comparison with the optimal system efficiency model, the optimal photoelectric efficiency model integrates more solar energy and prefers two-stage integration at high loads. Moreover, the HPB is a more preferential choice for the bottom-cycle heat exchanger, which differs from the optimal system efficiency model, which prefers the HPS instead.
- For the optimal system efficiency model, the gas turbine load is more significant for the system efficiency while, for the optimal photoelectric efficiency model, DNI is more significant for the photoelectric efficiency.
- The comparison with actual cases shows that the system efficiency and the photoelectric efficiency are much greater than those of the un-optimized ISCC system and the SEGS system, respectively. These optimized solutions can provide guidance for future ISCC system selection.
Author Contributions
Z.Z.: Methodology, Software, Writing. L.D.: Supervision, Writing-Reviewing and Editing. Z.W.: Data curation, Validation. Y.R.: Supervision, Editing. All authors have read and agreed to the published version of the manuscript.
Funding
This research was funded by the National Natural Science Foundation of China (No. 52090064), the Science Fund for Creative Research Groups of the National Natural Science Foundation of China (No. 51821004) and the Fundamental Research Funds for the Central Universities (No. 2018QN024).
Data Availability Statement
Data is contained within the article.
Conflicts of Interest
The authors declare no conflict of interest.
Nomenclature
| Mathematical symbols: | |
| Constant coefficient | |
| Total net aperture area of the parabolic trough solar collector, m2 | |
| Magnitude of variation for the compressor IGV’s angle | |
| Vector of heat collection ratios corresponding to the 11 different virtual heat exchangers | |
| Pressure drop at the inlet and outlet of the combustion chamber, MPa | |
| Mass flow rate of steam in the steam turbine, kg/s | |
| Flow rate of the combustion chamber, kg/s | |
| Cooling air mass flow rates, kg/s | |
| Mass flow rate of the working medium in corresponding virtual heat exchanger, kg/s | |
| Fuel mass flow rate of ISCC system, kg/s | |
| Fuel mass flow rate of reference GTCC system, kg/s | |
| Gas turbine rotation speed, r/min | |
| Compressor outlet pressures, MPa | |
| Heat received by solar collector, MW | |
| Inlet temperature of molten salt in corresponding virtual heat exchanger, K | |
| Temperature of the outlet of the heat-absorbing working medium in corresponding virtual heat exchanger, K | |
| Temperatures of the inlet of the heat-absorbing working medium in corresponding virtual heat exchanger, K | |
| Gas turbine inlet temperature, K | |
| Compressor outlet temperature, K | |
| Cold terminal temperature differences in corresponding virtual heat exchanger, K | |
| Hot terminal temperature differences in corresponding virtual heat exchanger, K | |
| Output power of ISCC system, MW | |
| Output power of reference GTCC system, MW | |
| Solar output power in the ISCC system, MW | |
| Greek letters: | |
| Isentropic efficiency of compressor | |
| System efficiency of ISCC | |
| Photoelectric efficiency of ISCC | |
| Steam turbine efficiency | |
| Gas turbine efficiency | |
| Gas turbine expansion ratio | |
| Adiabatic index | |
| Superscripts: | |
| Compressor state point corresponding to the original compressor characteristic line | |
| Design operating condition point | |
| Stagnation state | |
| Subscripts: | |
| Gas turbine | |
| Design condition | |
| Design working condition state point | |
| Abbreviations: | |
| AP | Air preheater |
| DNI | Direct normal irradiance |
| DSG | Direct steam generation |
| GA | Genetic algorithm |
| GSA | Gravitational search algorithm |
| GT | Gas turbine |
| GTCC | Gas turbine combined cycle |
| HPB | High pressure boiler |
| HPE | High pressure economizer |
| HPS | High pressure superheater |
| HRSG | Heat recovery steam generator |
| HTF | Heat transfer fluid |
| IGV | Inlet guide vane |
| IPB | Intermediate pressure boiler |
| IPE | Intermediate pressure economizer |
| IPS | Intermediate pressure superheater |
| ISCC | Integrated solar combined cycle |
| LEC | Levelized electricity cost |
| LHV | Lower heating value of fuel |
| LPB | Low pressure boiler |
| LPE | Low pressure economizer |
| LPS | Low pressure superheater |
| MSF | Multi-stage flash |
| NPV | Net present value |
| PSO | Particle swarm optimization |
| PTC | Parabolic trough solar collector |
| RH | Reheater |
| SEGS | Solar electric generating system |
| ST | Solar towers |
References
- Han, Y.B.; Cao, H.M. Technical Approaches and Policy Recommendations for the Synergistic Development of Fossil Energy and Renewable Energy in China. Energy China 2014, 36, 25–29. [Google Scholar]
- Johansson, T.B. Renewable Energy, Sources for Fuels and Electricity; Island Press: Washington, DC, USA, 1993; Chapter 5; pp. 234–235. [Google Scholar]
- Jubran, B.; Dalia, A.; Echeverri, P. Integrated Solar Combined Cycle Power Plants: Paving the way for thermal solar. Appl. Energy 2016, 169, 927–936. [Google Scholar]
- Dersch, J.; Geyer, M.; Herrmann, U.; Jones, S.A.; Kelly, B.; Kistner, R.; Ortmanns, W.; Pitz-Paal, R.; Price, H. Trough integration into power plants-a study on the performance and economy of integrated solar combined cycle systems. Energy 2004, 29, 947–959. [Google Scholar] [CrossRef]
- Rovira, A.; Abbas, R.; Sánchez, C.; Muñoz, M. Proposal and analysis of an integrated solar combined cycle with partial recuperation. Energy 2020, 198, 117379. [Google Scholar] [CrossRef]
- Behar, O.; Khellaf, A.; Mohammedi, K.; Ait-Kaci, S. A review of integrated solar combined cycle system (ISCCS) with a parabolic trough technology. Renew. Sustain. Energy Rev. 2014, 39, 223–250. [Google Scholar] [CrossRef]
- Okoroigwe, E.; Madhlopa, A. An integrated combined cycle system driven by a solar tower: A review. Renew. Sustain. Energy Rev. 2016, 57, 337–350. [Google Scholar] [CrossRef]
- Zhang, N.; Duan, L.; Huang, C.; Hou, H.; Yu, G.; Ding, Z.; Wang, J.; Qu, J. Operation strategy and dynamic performance study of integrated solar combined-cycle system. Energy Convers. Manag. 2021, 228, 113716. [Google Scholar] [CrossRef]
- Ameri, M.; Mohammadzadeh, M. Thermodynamic, thermoeconomic and life cycle assessment of a novel integrated solar combined cycle (ISCC) pow er plant. Sustain. Energy Technol. Assess. 2018, 27, 195–205. [Google Scholar]
- Horn, M.; Fuhring, H.; Rheinlander, J. Economic analysis of integrated solar combined cycle power plants A sample case: The economic feasibility of an ISCCS power plant in Egypt. Energy 2004, 29, 935–945. [Google Scholar] [CrossRef]
- Duan, L.; Wang, Z.; Guo, Y. Off-design performance characteristics study on ISCC system with solar direct steam generation system. Energy 2020, 205, 118044. [Google Scholar] [CrossRef]
- Elmohlawy, A.E.; Ochkov, V.F.; Kazandzhan, B.I. Study and Analysis the Performance of Two Integrated Solar Combined Cycle. Energy Procedia 2019, 156, 79–84. [Google Scholar] [CrossRef]
- Nezammahalleh, H.; Farhadi, F.; Tanhaemami, M. Conceptual design and techno-economic assessment of integrated solar combined cycle system with DSG technology. Sol. Energy 2010, 84, 1696–1705. [Google Scholar] [CrossRef]
- Montes, M.J.; Rovira, A.; Muñoz, M.; Martínez-Val, J.M. Performance analysis of an Integrated Solar Combined Cycle using Direct Steam Generation in parabolic trough collectors. Appl. Energy 2011, 88, 3228–3238. [Google Scholar] [CrossRef]
- Franchini, G.; Perdichizzi, A.; Ravelli, S.; Barigozzi, G. A comparative study between parabolic trough and solar tower technologies in Solar Rankine Cycle and Integrated Solar Combined Cycle plants. Sol. Energy 2013, 98, 302–314. [Google Scholar] [CrossRef]
- Rovira, A.; Montes, M.J.; Varela, F.; Gil, M. Comparison of Heat Transfer Fluid and Direct Steam Generation technologies for Integrated Solar Combined Cycles. Appl. Therm. Eng. 2013, 52, 264–274. [Google Scholar] [CrossRef]
- Elmorsy, L.; Morosuk, T.; Tsatsaronis, G. Comparative exergoeconomic evaluation of integrated solar combined-cycle (ISCC) configurations. Renew. Energy 2022, 185, 680–691. [Google Scholar] [CrossRef]
- Zhang, Z.W.; Sun, J.; Wang, R.L.; Wei, J.J. Comprehensive evaluation of integrated solar combined cycle system regarding fuel-savability under unified framework. Appl. Therm. Eng. 2021, 199, 117539. [Google Scholar] [CrossRef]
- Zhang, Z.; Duan, L.; Wang, Z.; Ren, Y. General performance evaluation method of integrated solar combined cycle (ISCC) system. Energy 2022, 240, 122472. [Google Scholar] [CrossRef]
- Brodrick, P.G.; Brandt, A.R.; Durlofsky, L.J. Operational optimization of an integrated solar combined cycle under practical time-dependent constraints. Energy 2017, 141, 1569–1584. [Google Scholar] [CrossRef]
- Brodrick, P.G.; Brandt, A.R.; Durlofsky, L.J. Optimal design and operation of integrated solar combined cycles under emissions intensity constraints. Appl. Energy 2018, 226, 979–990. [Google Scholar] [CrossRef]
- Shaaban, S. Performance optimization of an integrated solar combined cycle power plant equipped with a brine circulation MSF desalination unit. Energy Convers. Manag. 2019, 198, 111794. [Google Scholar] [CrossRef]
- Nabati, A.M.; Sadeghi, M.S.; Naserabad, S.N.; Mokhtari, H.; Izadpanah, S. Thermo-economic analysis for determination of optimized connection between solar field and combined cycle power plant. Energy 2018, 162, 1062–1076. [Google Scholar] [CrossRef]
- Baghernejad, A.; Yaghoubi, M. Exergoeconomic analysis and optimization of an Integrated Solar Combined Cycle System (ISCCS) using genetic algorithm. Energy Convers. Manag. 2011, 52, 2193–2203. [Google Scholar] [CrossRef]
- Mabrouk, M.T.; Kheiri, A.; Feidt, M. A systematic procedure to optimize Integrated Solar Combined Cycle power plants (ISCCs). Appl. Therm. Eng. 2018, 136, 97–107. [Google Scholar] [CrossRef]
- Li, Y.Y.; Zhang, G.Q.; Bai, Z.W.; Song, X.W.; Wang, L.G.; Yang, Y.P. Backpressure adjustable gas turbine combined cycle: A method to improve part-load efficiency. Energy Convers. Manag. 2018, 174, 739–754. [Google Scholar] [CrossRef]
- Palmer, C.A.; Erbes, M.R.; Pechtl, P.A. Gatecycle performance analysis of the LM2500 gas turbine utilizing low heating value fuels. ASME Cogen Turbo Power 1993, 8, 69–76. [Google Scholar]
- Zheng, J.; Zhang, G.; Xu, Y. Analysis of Topping and Bottoming Cycle Parameters on the Performance of the Combined Cycle at Design/Off-design Condition. In Proceedings of the CSEE, Guangzhou, China, 12 March 2016; Volume 36, pp. 6418–6431. [Google Scholar]
- Wang, L. Study on Simulation Model for Flue Gas Compression Unit of 300 MW Oxy-Coal Fired Boiler Unit. Ph.D. Thesis, North China Electric Power University, Baoding, China, 2015. Available online: https://kns.cnki.net/kns8/Detail?sfield=fn&QueryID=44&CurRec=32&DbCode=CMFD&dbname=CMFD201601&filename=1015651723.nh (accessed on 16 April 2016).
- SOFBID. EBSILON Professional. Available online: http://www.sofbid.com (accessed on 14 April 2019).
- Zhang, Z.; Duan, L.; Wang, Z.; Ren, Y. Study on off-design characteristics of integrated solar combined cycle system on typical days. J. North China Electr. Power Univ. 2022, 49, 45–58. [Google Scholar]
- Wang, J.; Duan, L.; Yang, Y.; Yang, Z.; Yang, L. Study on the general system integration optimization method of the solar aided coal-fired power generation system. Energy 2019, 169, 660–673. [Google Scholar] [CrossRef]
Figure 1.
Flow diagram of a common integrated solar combined cycle (ISCC) system.

Figure 2.
Flow diagram of a common gas turbine combined cycle (GTCC) system.

Figure 3.
Optimization calculation flow chart of ISCC system.

Figure 4.
The energy distribution and the maximum integration capacity for each heat exchanger based on the optimal system/solar photoelectric efficiency under different GT load and DNI conditions.
Figure 4.
The energy distribution and the maximum integration capacity for each heat exchanger based on the optimal system/solar photoelectric efficiency under different GT load and DNI conditions.

Figure 5.
Trend of topping/bottom cycle efficiency with GT load reduction in GTCC system.

Figure 6.
Trend of solar photothermal efficiency with DNI reduction for the optimal model of system/solar photoelectric efficiency under design load.
Figure 6.
Trend of solar photothermal efficiency with DNI reduction for the optimal model of system/solar photoelectric efficiency under design load.

Figure 7.
Trend of solar thermoelectric efficiency with DNI reduction for the optimal model of system/solar photoelectric efficiency under design load.
Figure 7.
Trend of solar thermoelectric efficiency with DNI reduction for the optimal model of system/solar photoelectric efficiency under design load.

Figure 8.
Trend of solar photoelectric efficiency with DNI reduction for the optimal model of system/solar photoelectric efficiency under design load.
Figure 8.
Trend of solar photoelectric efficiency with DNI reduction for the optimal model of system/solar photoelectric efficiency under design load.

Figure 9.
Trend of ISCC solar photoelectric efficiency with fluctuation of DNI.

Figure 10.
Trend of system efficiency with fluctuation of DNI.

Figure 11.
System efficiency of ISCC for the optimization model and comparison group from Zhang et al. [31].
Figure 11.
System efficiency of ISCC for the optimization model and comparison group from Zhang et al. [31].

Figure 12.
Solar photoelectric efficiency of ISCC for the optimization model and comparison group.


Table 1.
Fuel components.
| Composition | Volume Fraction/% |
|---|---|
| CH4 | 97.6 |
| CO2 | 0.65 |
| C2H6 | 0.62 |
| N2 | 0.45 |
| C3H8 | 0.41 |
| C4H10 | 0.21 |
| C6H14 | 0.05 |
| C5H12 | 0.01 |
Table 2.
Design parameters of gas turbine.
| Parameters | Values | |
|---|---|---|
| Lower heating value of fuel/(kJ/kg) | 48,685 | |
| Compressor | Pressure ratio | 15.4 |
| Pressure loss of inlet/% | 0.61 | |
| Mass flow rate of the inlet/(kg/s) | 645 | |
| Mass flow rate of cooling air/(kg/s) | 119 | |
| Temperature of the outlet/°C | 399.079 | |
| Isentropic efficiency/% | 89 | |
| Mass flow rate of fuel/(kg/s) | 14.399 | |
| Combustion chamber | Pressure loss/% | 3.5 |
| Heat loss rate/% | 0.5 | |
| Gas turbine | Inlet turbine temperature/°C | 1327 |
| Outlet turbine Temperature/°C | 608.553 | |
| Isentropic efficiency (first/second/third stage)/% | 90/90/90.8 | |
| Pressure loss of the outlet/% | 1.32 | |
| Topping Brayton cycle | Output power/MW | 253.03 |
| Power generation efficiency/% | 36.1 | |
| Rotation speed/(r/min) | 3000 |
Table 3.
Design parameters of steam turbine.
| Parameters | Values | |
|---|---|---|
| Steam turbine | Mass flow rate of the steam (HP/IP/LP)/(kg/s) | 76.343/87.99/100.738 |
| Temperature of superheated steam (HP/IP/LP)/°C | 567.5/567.5/313.8 | |
| Pressure of steam (HP/IP/LP)/MPa | 9.91/2.15/0.37 | |
| Exhaust pressure of low-pressure cylinder/MPa | 0.0076 | |
| Isentropic efficiency/% | 93 | |
| Bottom Rankine cycle | Output power/MW | 141.825 |
| Power generation efficiency/% | 32.1 | |
| Rotation speed/(r/min) | 3000 |
Table 4.
Design parameters of GTCC.
| Parameters | Values |
|---|---|
| Output power of GTCC/MW | 394.856 |
| Power generation efficiency of GTCC/% | 56.3 |
| Mechanical losses of GTCC/% | 1 |
| Generator loss of GTCC/% | 1 |
Table 5.
Validation of model against GTCC case from Li et al. [26].
Table 5.
Validation of model against GTCC case from Li et al. [26].
| Parameters | Values (Simulation) | Values (Li et al.) | Relative Deviation |
|---|---|---|---|
| Compressor mass flow rate/(kg/s) | 645 | 645 | 0.00% |
| Fuel mass flow rate/(kg/s) | 14.399 | 14.44 | 0.28% |
| Compressor outlet temperature/°C | 399.079 | 391 | 2.07% |
| Compressor pressure ratio | 15.4 | 15.4 | 0.00% |
| Temperature of the gas turbine inlet/°C | 1327 | 1327 | 0.00% |
| Gas turbine power/MW | 253.03 | 259.63 | 2.54% |
| Main steam temperature/°C | 567.5 | 567.5 | 0.00% |
| Main steam pressure/MPa | 9.91 | 9.91 | 0.00% |
| Reheat steam temperature/°C | 567.5 | 567.3 | 0.04% |
| Reheat steam pressure/MPa | 2.15 | 2.15 | 0.00% |
| Reheat steam mass flow rate/(kg/s) | 87.99 | 86.6 | 1.61% |
| Steam turbine power/MW | 141.825 | 146.34 | 3.09% |
| Combined cycle power/MW | 394.856 | 405.97 | 2.74% |
Table 6.
Design parameters of parabolic trough solar collector.
| Parameters | Values | |
|---|---|---|
| Design direct normal irradiance (W/m2) | 800 | |
| Ambient temperature (°C) | 15 | |
| Trough Mirror | Number (pcs) | 1000 |
| Width (m) | 5.76 | |
| Length (m) | 47.1 | |
| Row spacing (m) | 17.28 | |
| Optical active portion of aperture (%) | 94.61 | |
| Reflectance (%) | 92 | |
| Mirror cleanliness factor (%) | 95 | |
| Piping heat losses (W/m2) | 20 |
Table 7.
The integration proportions of different work conditions based on the maximum system efficiency.
Table 7.
The integration proportions of different work conditions based on the maximum system efficiency.
| AP | RH | HPS | HPB | Other Heat Exchangers | ||
|---|---|---|---|---|---|---|
| 100% GT | 100% DNI | 0.904357 | 0 | 0.095643 | 0 | 0 |
| 75% DNI | 1 | 0 | 0 | 0 | 0 | |
| 50% DNI | 1 | 0 | 0 | 0 | 0 | |
| 30% DNI | 1 | 0 | 0 | 0 | 0 | |
| 75% GT | 100% DNI | 0.830195 | 0 | 0.169805 | 0 | 0 |
| 75% DNI | 1 | 0 | 0 | 0 | 0 | |
| 50% DNI | 1 | 0 | 0 | 0 | 0 | |
| 30% DNI | 0.990915 | 0 | 0 | 0.009085 | 0 | |
| 50% GT | 100% DNI | 0.776085 | 0 | 0.223915 | 0 | 0 |
| 75% DNI | 0.657299 | 0 | 0.342701 | 0 | 0 | |
| 50% DNI | 0.268662 | 0 | 0.731338 | 0 | 0 | |
| 30% DNI | 0.010834 | 0 | 0.989166 | 0 | 0 | |
| 30% GT | 100% DNI | 0.159736 | 0.116135 | 0.408062 | 0.316067 | 0 |
| 75% DNI | 0.000282 | 0.233038 | 0.351694 | 0.414986 | 0 | |
| 50% DNI | 0.008171 | 0.104183 | 0.887646 | 0 | 0 | |
| 30% DNI | 0.01711 | 0 | 0.98289 | 0 | 0 |
Table 8.
The integration proportions of different work conditions based on the maximum solar photoelectric efficiency.
Table 8.
The integration proportions of different work conditions based on the maximum solar photoelectric efficiency.
| AP | RH | HPS | HPB | Other Heat Exchangers | ||
|---|---|---|---|---|---|---|
| 100% GT | 100% DNI | 0.813551 | 0 | 0 | 0.186449 | 0 |
| 75% DNI | 0.69097 | 0 | 0 | 0.30903 | 0 | |
| 50% DNI | 0.692545 | 0 | 0 | 0.307455 | 0 | |
| 30% DNI | 0.686256 | 0 | 0 | 0.313744 | 0 | |
| 75% GT | 100% DNI | 0.737077 | 0 | 0 | 0.262923 | 0 |
| 75% DNI | 0.747527 | 0 | 0 | 0.252473 | 0 | |
| 50% DNI | 0.742428 | 0 | 0 | 0.257572 | 0 | |
| 30% DNI | 0.721517 | 0 | 0 | 0.278483 | 0 | |
| 50% GT | 100% DNI | 0.701552 | 0 | 0 | 0.298448 | 0 |
| 75% DNI | 0.433287 | 0 | 0 | 0.566713 | 0 | |
| 50% DNI | 0.112109 | 0 | 0 | 0.887891 | 0 | |
| 30% DNI | 3.75 × 10⁻⁶ | 0 | 0 | 0.999996 | 0 | |
| 30% GT | 100% DNI | 0.001262 | 0.114353 | 0.36898 | 0.515404 | 0 |
| 75% DNI | 0.001708 | 0.114586 | 0.516652 | 0.367055 | 0 | |
| 50% DNI | 0.008042 | 0.100204 | 0.891754 | 0 | 0 | |
| 30% DNI | 2.42 × 10⁻⁷ | 0.095901 | 0.696455 | 0.207644 | 0 |
Disclaimer/Publisher’s Note: The statements, opinions and data contained in all publications are solely those of the individual author(s) and contributor(s) and not of MDPI and/or the editor(s). MDPI and/or the editor(s) disclaim responsibility for any injury to people or property resulting from any ideas, methods, instructions or products referred to in the content. |
© 2023 by the authors. Licensee MDPI, Basel, Switzerland. This article is an open access article distributed under the terms and conditions of the Creative Commons Attribution (CC BY) license (https://creativecommons.org/licenses/by/4.0/).
Share and Cite
MDPI and ACS Style
Zhang, Z.; Duan, L.; Wang, Z.; Ren, Y. Integration Optimization of Integrated Solar Combined Cycle (ISCC) System Based on System/Solar Photoelectric Efficiency. Energies 2023, 16, 3593. https://doi.org/10.3390/en16083593
AMA Style
Zhang Z, Duan L, Wang Z, Ren Y. Integration Optimization of Integrated Solar Combined Cycle (ISCC) System Based on System/Solar Photoelectric Efficiency. Energies. 2023; 16(8):3593. https://doi.org/10.3390/en16083593
Chicago/Turabian StyleZhang, Zuxian, Liqiang Duan, Zhen Wang, and Yujie Ren. 2023. "Integration Optimization of Integrated Solar Combined Cycle (ISCC) System Based on System/Solar Photoelectric Efficiency" Energies 16, no. 8: 3593. https://doi.org/10.3390/en16083593
Note that from the first issue of 2016, this journal uses article numbers instead of page numbers. See further details here.