Article

Solar Electric Vehicles as Energy Sources in Disaster Zones: Physical and Social Factors

1
Faculty of Engineering, University of Miyazaki, Miyazaki 889-2192, Japan
2
Faculty of Regional Innovation, University of Miyazaki, Miyazaki 889-2192, Japan
*
Author to whom correspondence should be addressed.
Energies 2023, 16(8), 3580; https://doi.org/10.3390/en16083580
Submission received: 3 March 2023 / Revised: 18 April 2023 / Accepted: 18 April 2023 / Published: 20 April 2023
(This article belongs to the Collection Renewable Energy and Energy Storage Systems)

Abstract

:
Electric vehicles (EVs) have the advantage of being resilient to natural disasters. However, users hesitate to donate electricity when they lose the chance to recharge at the utility. Solar electric vehicles (SEVs) save energy through vehicle-integrated photovoltaics (VIPV) and make it possible to voluntarily donate excess energy, thus maintaining facility resilience. Given that the supply of solar energy to VIPV systems is not continuous and is difficult to forecast, the contribution of VIPV to the resilience of the larger energy system has been called into question. This is the first study in which the potential of VIPV to maintain utility resilience is investigated in the context of physical factors, such as irradiance, and social factors. The actual energy yield of a VIPV car was determined using an advanced 3D solar irradiation model under a nonuniform shading distribution, with validation from actual measures of solar irradiance on five orthogonal sides of the car body. The Monte Carlo method was used to model the complex factors in VIPV energy storage and energy donations under different scenarios. Depending on the climate, population density, and shading environment, the voluntary contribution of stored electricity in SEV is sufficient to provide disaster relief support.

1. Introduction

The contribution of photovoltaic and storage technologies to energy resilience (in the aftermath of natural disasters) has been discussed as an advantage of energy microgrids in various settings and configurations; for example, Zhang analyzed resilience potential in terms of the size of the batteries [1], Laws examined a building microgrid [2], and Galvan examined rooftop applications [3].
Transportation is essential for disaster resilience, and robust transportation systems have been studied; for example, Elluru et al. (2019) analyzed robust logistics networks [4] and Murray-Tuite (2006) quantitatively analyzed the recovery of transportation after extreme events [5]. The combination of electricity as an energy lifeline and transportation as a physical lifeline has been enhanced by battery-powered electric vehicles (BEVs).
The automobile battery in solar electric vehicles can be viewed as a form of energy resilience [6]. However, there are a number of issues to be resolved when adding a vehicle battery to the electrical utility systems, as summarized by Mohammad et al. (2022) [7]; for example, the impact of charging stations on the grid [8], the peak shift using car batteries [9], mitigating the harmful effects of PV penetrating the grid [10], and, as proposed by Slavatti et al. (2020), the optimization of vehicle integration into the grid [11].
Another possibility is the connection of BEV batteries to systems that are much smaller than the regional grid; for example, connecting BEVs to residential buildings, known as vehicle-to-home (V2H) systems. Recently, there have been a number of improvements to V2H: Abdalla et al. demonstrated cost optimization of power load flattening in V2H systems (2020) [12], Ali et al. improved the inverter of an EV charger (2021) [13], and Wang et al. optimized the schedule of a V2H system (2022) [14].
It has been reported that the resilience of vehicles in buildings improves with PV charging [15]. Sulaeman et al. (2021) compared the AC and DC power systems of buildings with PV and storage systems [16], and Vermeer et al. (2020) forecasted PV power generation to improve building energy systems with PV and storage [17]. Recently, an “Internet of Energy” (IoE) approach, akin to the Internet of Things, has been explored in the context of electric vehicles in distributed energy systems; see, for example, Nefedov et al. (2018) [18].
Analysis of the energy balance is realistic in small networks. Cieslik et al. (2021) showed the advantage of electric vehicles in filling the supply imbalance of PV [19], and Antić et al. explored low-voltage networks [20]. The community-based scenarios described in the present study are based on the analysis by Strielkowski [21]. In such applications, the PV charging stations act as an interface between vehicles and utilities. The connection of EVs to PV charging stations has been recognized as beneficial for resilience. Several studies have been conducted to optimize the operations and solve various issues. The combination of EV and PV charging stations contributes to the system while reducing carbon emissions and flattening grid demand. A comparison with the use of vehicle-integrated photovoltaics (VIPV) is also examined. Recent work in this field includes optimal planning of PV charging stations [22], financial issues (in the United States) [23], and the development of an optimization algorithm for PV charging while considering its ecological impacts [24]. Mohammed et al. (2022) combined a day-ahead weather forecast for the optimal operation of a PV charging station [25], and Petrusic and Janjic (2021) expanded these to charging stations for hybrid vehicles [26]. Additional innovations include a multi-agent particle swarm optimization algorithm [27], minimizing the cost of battery integration [28], and a process for forecasting Evs [29]. Zhang et al. (2019) applied PV charging stations to e-bikes [30], and Ghosh demonstrated that EVs have the advantage of a smaller CO2 footprint [31].
Compared to a BEV-based resilient system, the first advantage of a PV-based system is the lower risk of an empty battery. Once a car battery is completely discharged, the opportunity to donate energy has been lost. Another consideration is the efficient conveyance to the usage point, which is also supplied by solar energy.
The issues mentioned above, especially with respect to charging systems, may be resolved by VIPV [32,33]. Several car manufacturers have succeeded in developing demonstration cars (Figure 1), including Ford [34], Toyota [35], Karma [36], Hanergy [37], and Nissan [38].
Vehicle manufacturers have begun equipping trucks and heavy-duty vehicles with photovoltaic modules [39,40,41], including the calculated diesel-equivalent payback time [39] and the yield potential [40]. In 2017, Mallon et al. analyzed the potential application of PV on buses [41].
Several demonstration programs have validated that PV can be an energy source for EVs [42,43,44]. Matsuda et al. (2017) reported the first VIPV test using crystalline Si solar cells as an alternate fuel [42]. The advantages of VIPV have been reported by NEDO [43]. Masuda et al. encouraged the development of high-efficiency solar cells in VIPV [44]. The expected new market for VIPV is 50 GW/year [45]. Several innovative designs of SEVs have been proposed by university education programs [46,47].
A number of design advances have been made; for example, the introduction of lightweight PV modules [48], the design of interconnections [49], and vehicle patterns [50]. Sato et al. developed stretchable nicro-scale concentrator for SEV application [51], Mallon discussed the advantages of battery lifetime [41], Araki et al. seeked for possibility of static concentrator for VIPV [52] and Pinto explored the range extension of VIPV [53]. The overall state of VIPV technology has been reviewed by Conti [54]. The vehicle manufacturers Lightyear [55] and Sono Motors [56] are poised to create a new market for the VIPV.
VIPV presents little or no risk of damage to the utility. In contrast to a single, centralized PV system, which may be partially or completely destroyed in a natural disaster, mobile VIPV units can move to new areas for PV generation. As well, VIPV units carry both energy and goods, such as humanitarian relief supplies, to affected areas.
Although SEVs equipped with VIPV have overcome issues related to battery charging, many technological challenges remain, including standardization [57], VIPV-specific technologies [58], and integration [59]. Each of these challenges is addressed in our study (see Methods).
In the analysis of SEV and VIPV, in contrast with infrastructure-based resilience, such as V2X storage, including PV charging stations, the rules of proportion and averaging need to be considered. The yield of VIPV is almost independent of the climate but depends on the degree of shade in areas where vehicles are driven. This is far from simple averaging. The use of the stored energy in SEVs also depends on the driver’s intention. The impacts of these factors are nonlinear, and a direct simulation is required. These unexpected events were modeled using probability.
Previous studies on the use of PV for resilience relying on fixed-tilt systems anticipated the energy supply to facilities using typical and representative climate and irradiation datasets. In contrast, VIPV and SEVs must be considered as uncertain and unstable energy sources. The Monte Carlo method, which is useful for complicated and probability-based modeling, is the best approach to modeling these mobile systems.
In addition, an advanced 3D solar irradiation model was developed under a nonuniform shading distribution to assess the energy yield of VIPV. The model was validated by monitoring the solar irradiance on five orthogonal sides of the car body. The energy yield by the VIPV was modeled and calculated by considering the distribution of the shading probability in three zones (open, residential, and building zones).
The possibility of voluntary contributions to the common good is an advantage of VIPV in terms of resilience. The likelihood and potential resilience impacts were quantitatively analyzed using the Monte Carlo method.

2. Methods

2.1. Resilience Scenario

PV systems can supply varying amounts of energy depending on their location. In addition, depending on the location, the required types and densities of disaster-prevention equipment and facilities vary. Unlike the simulation of the energy calculation of the PV on vehicles and the charging operation of EVs by PV charging stations, the energy supply at the resilience center must be estimated based on the worst-case scenario; in other words, unanticipated events and sometimes obstacles stemming from selfish human behavior. Resilience scenarios may vary according to the magnitude and type of natural disasters and regional constraints.
For simulations of such unknown and varied cases, a Monte Carlo simulation based on the characteristics of the natural disaster (place, date/time, etc.), and the degree and extent of human activities will be helpful.
A typical scenario may be as follows:
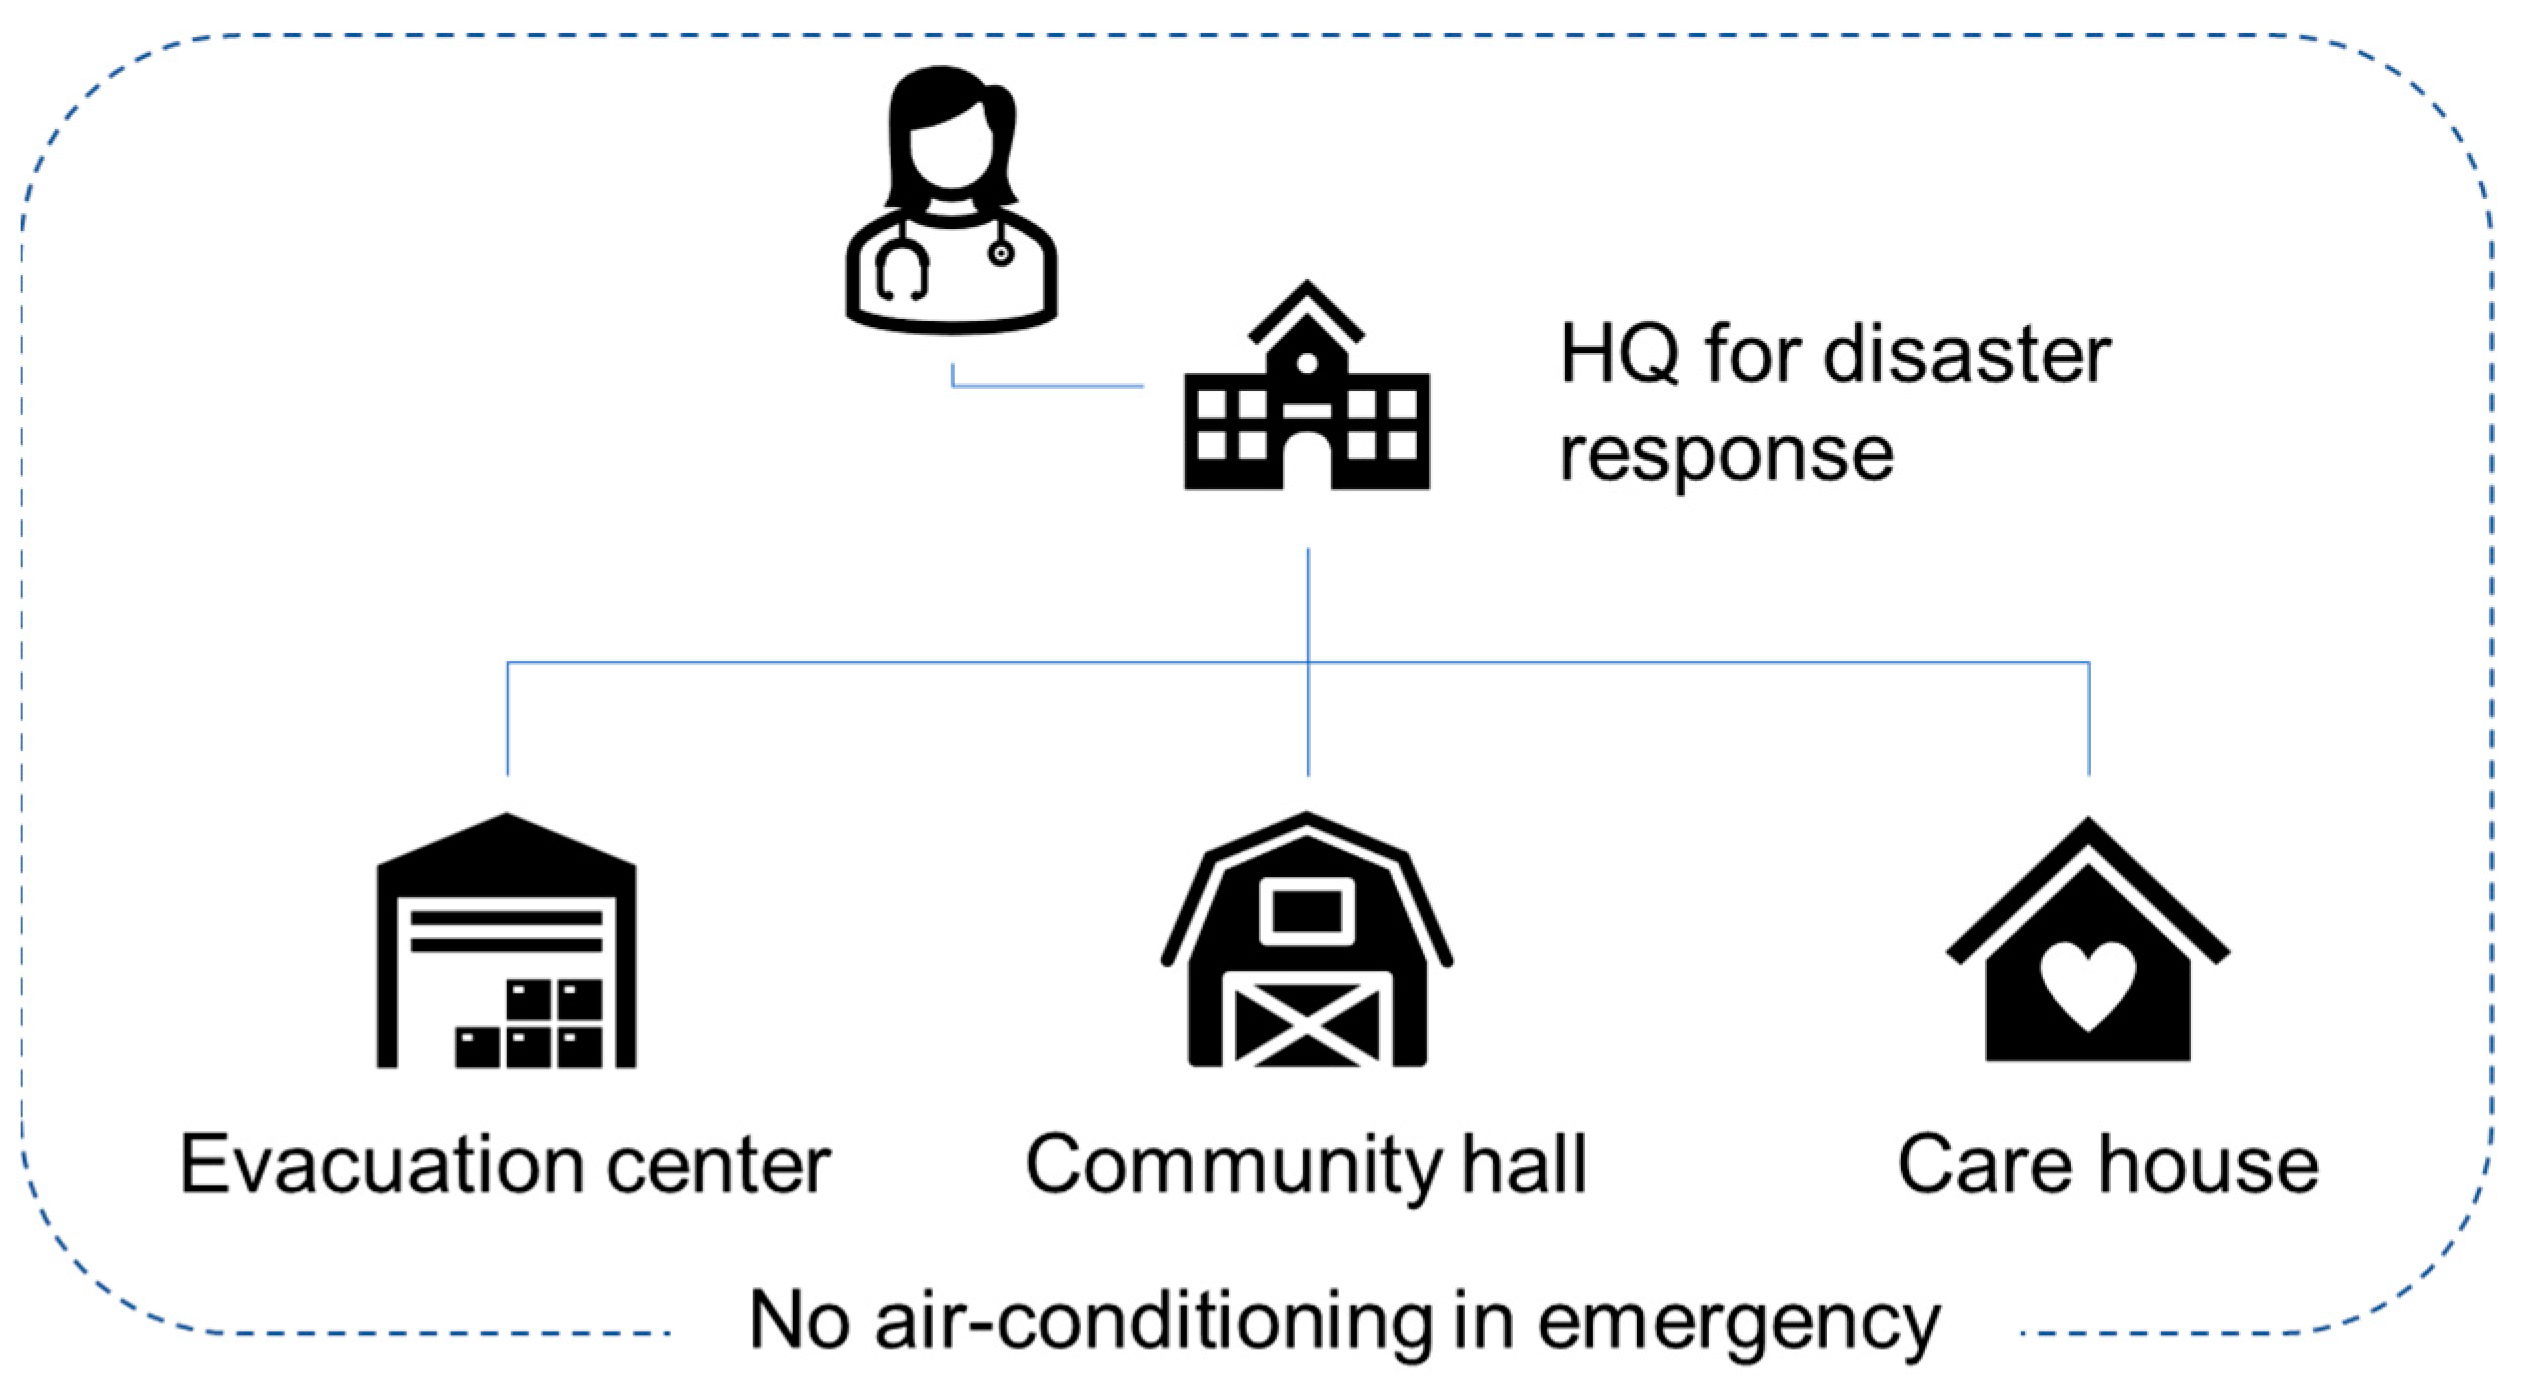
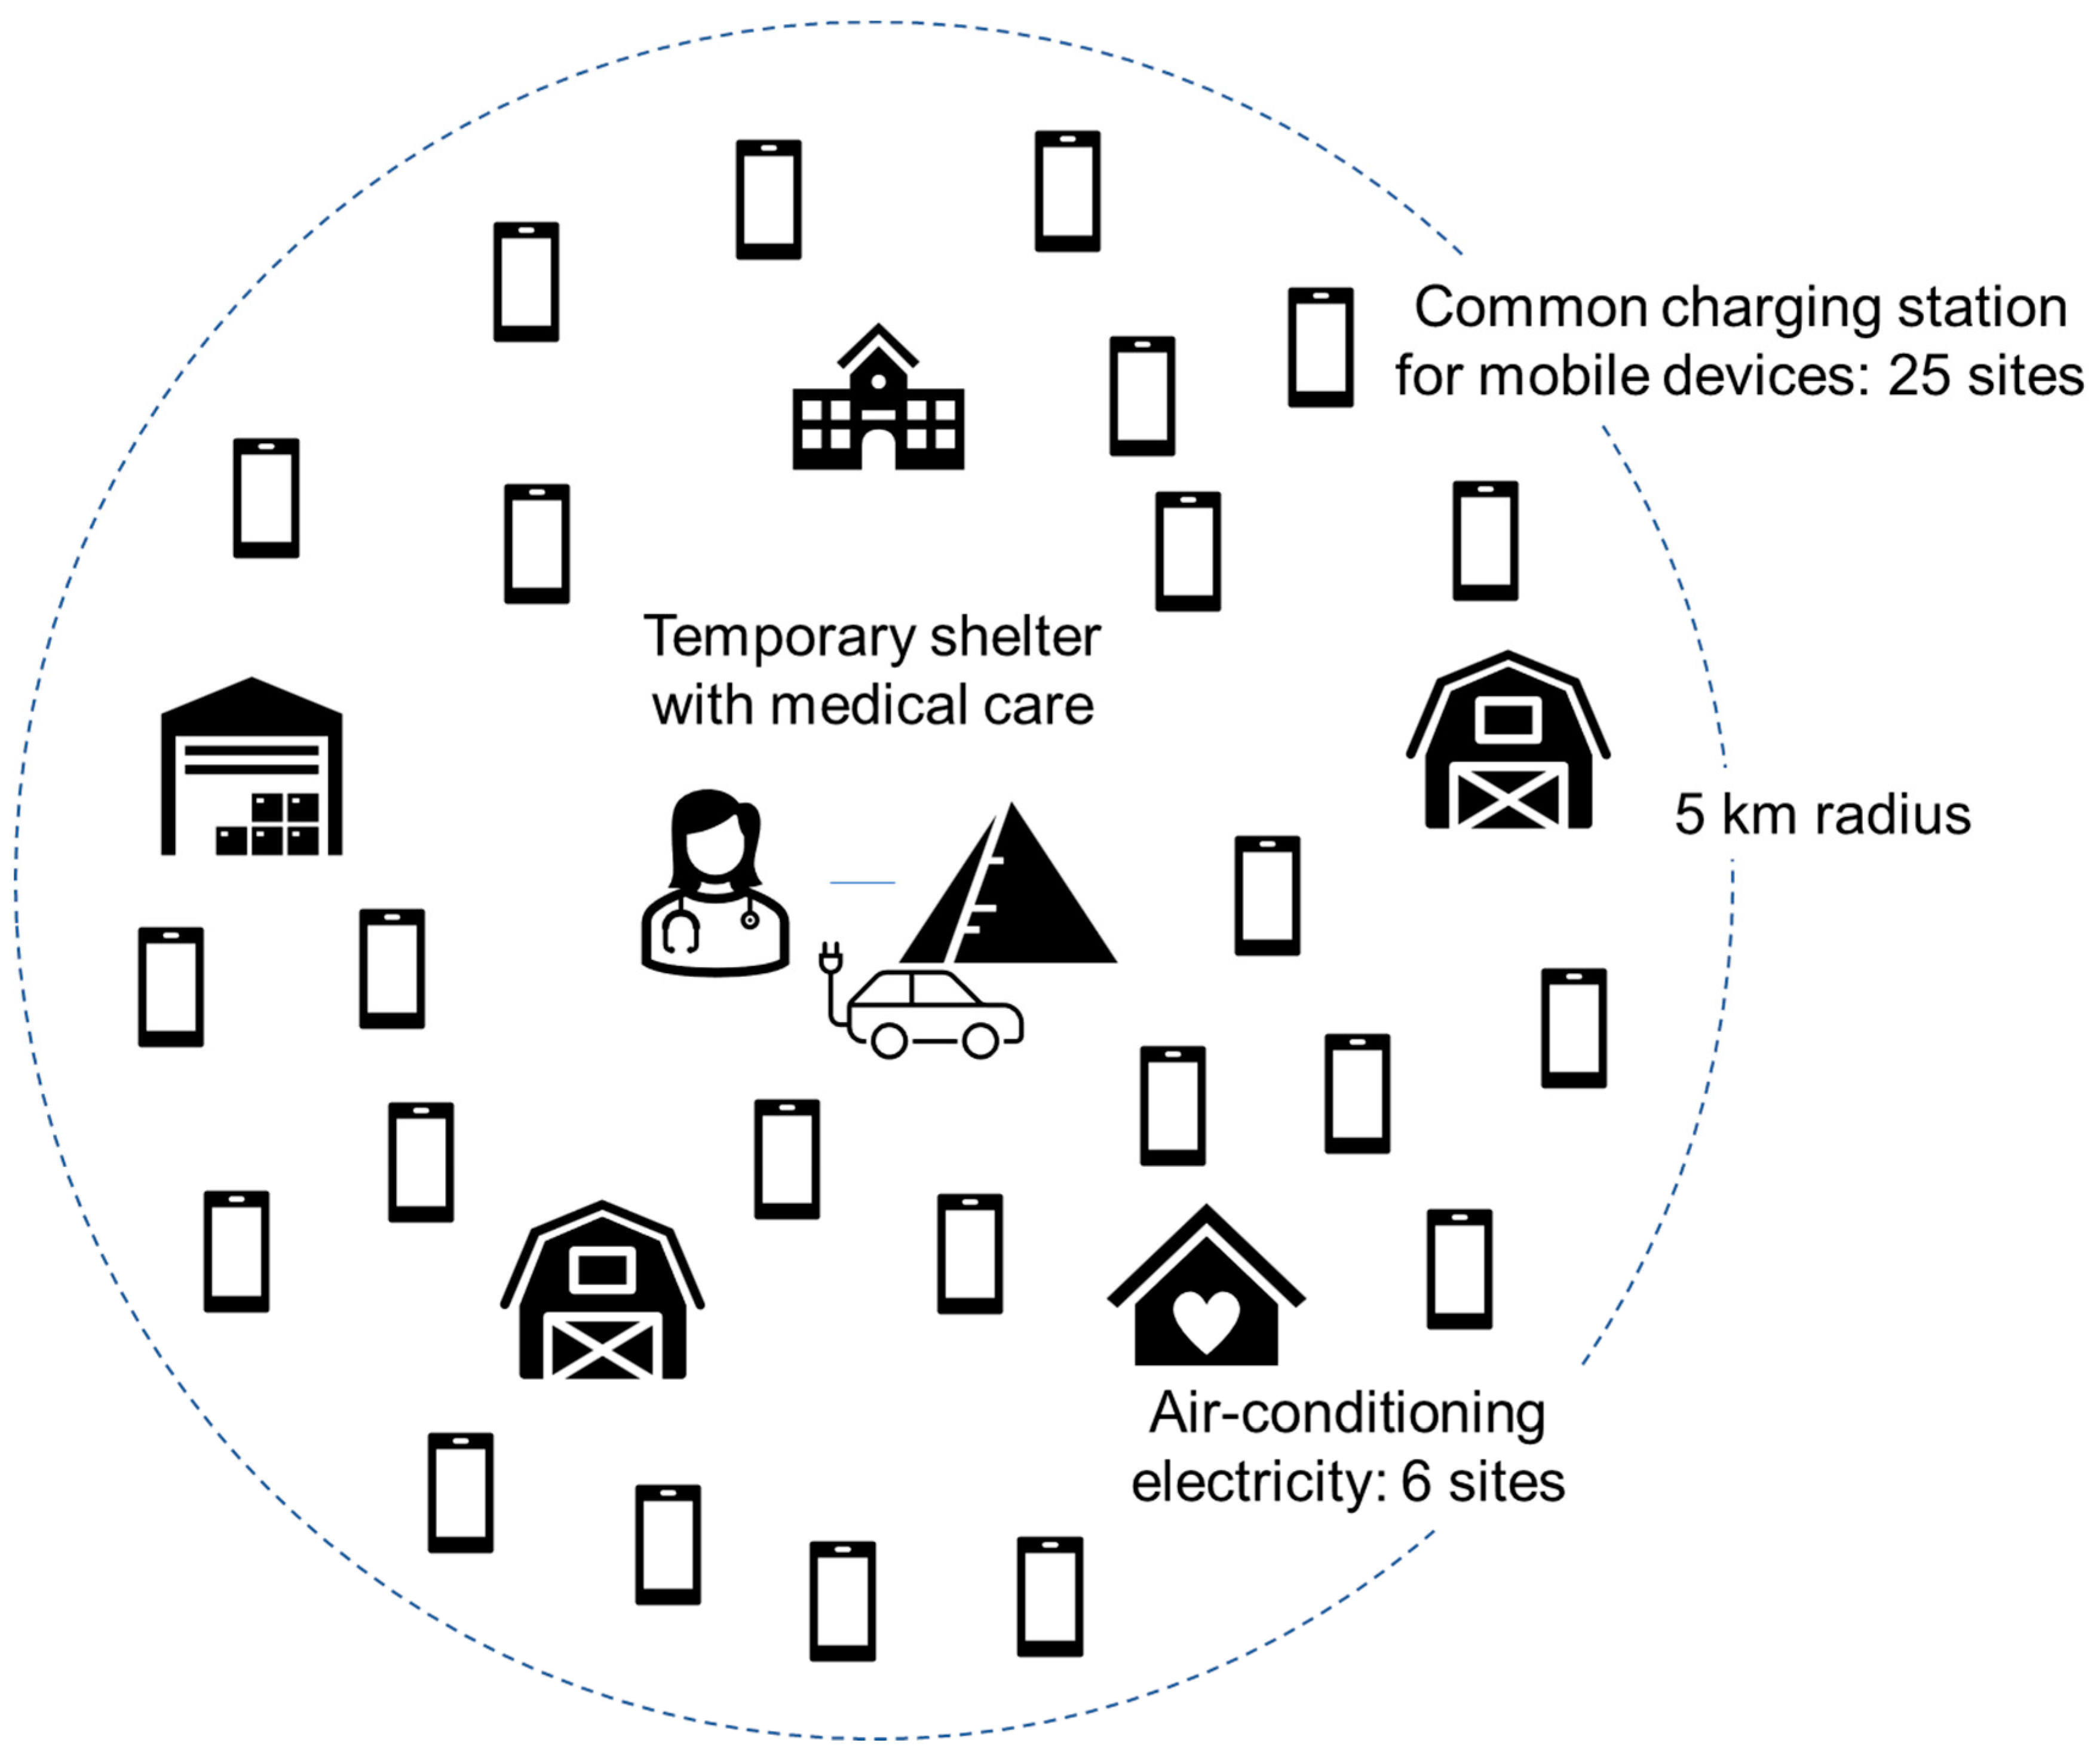
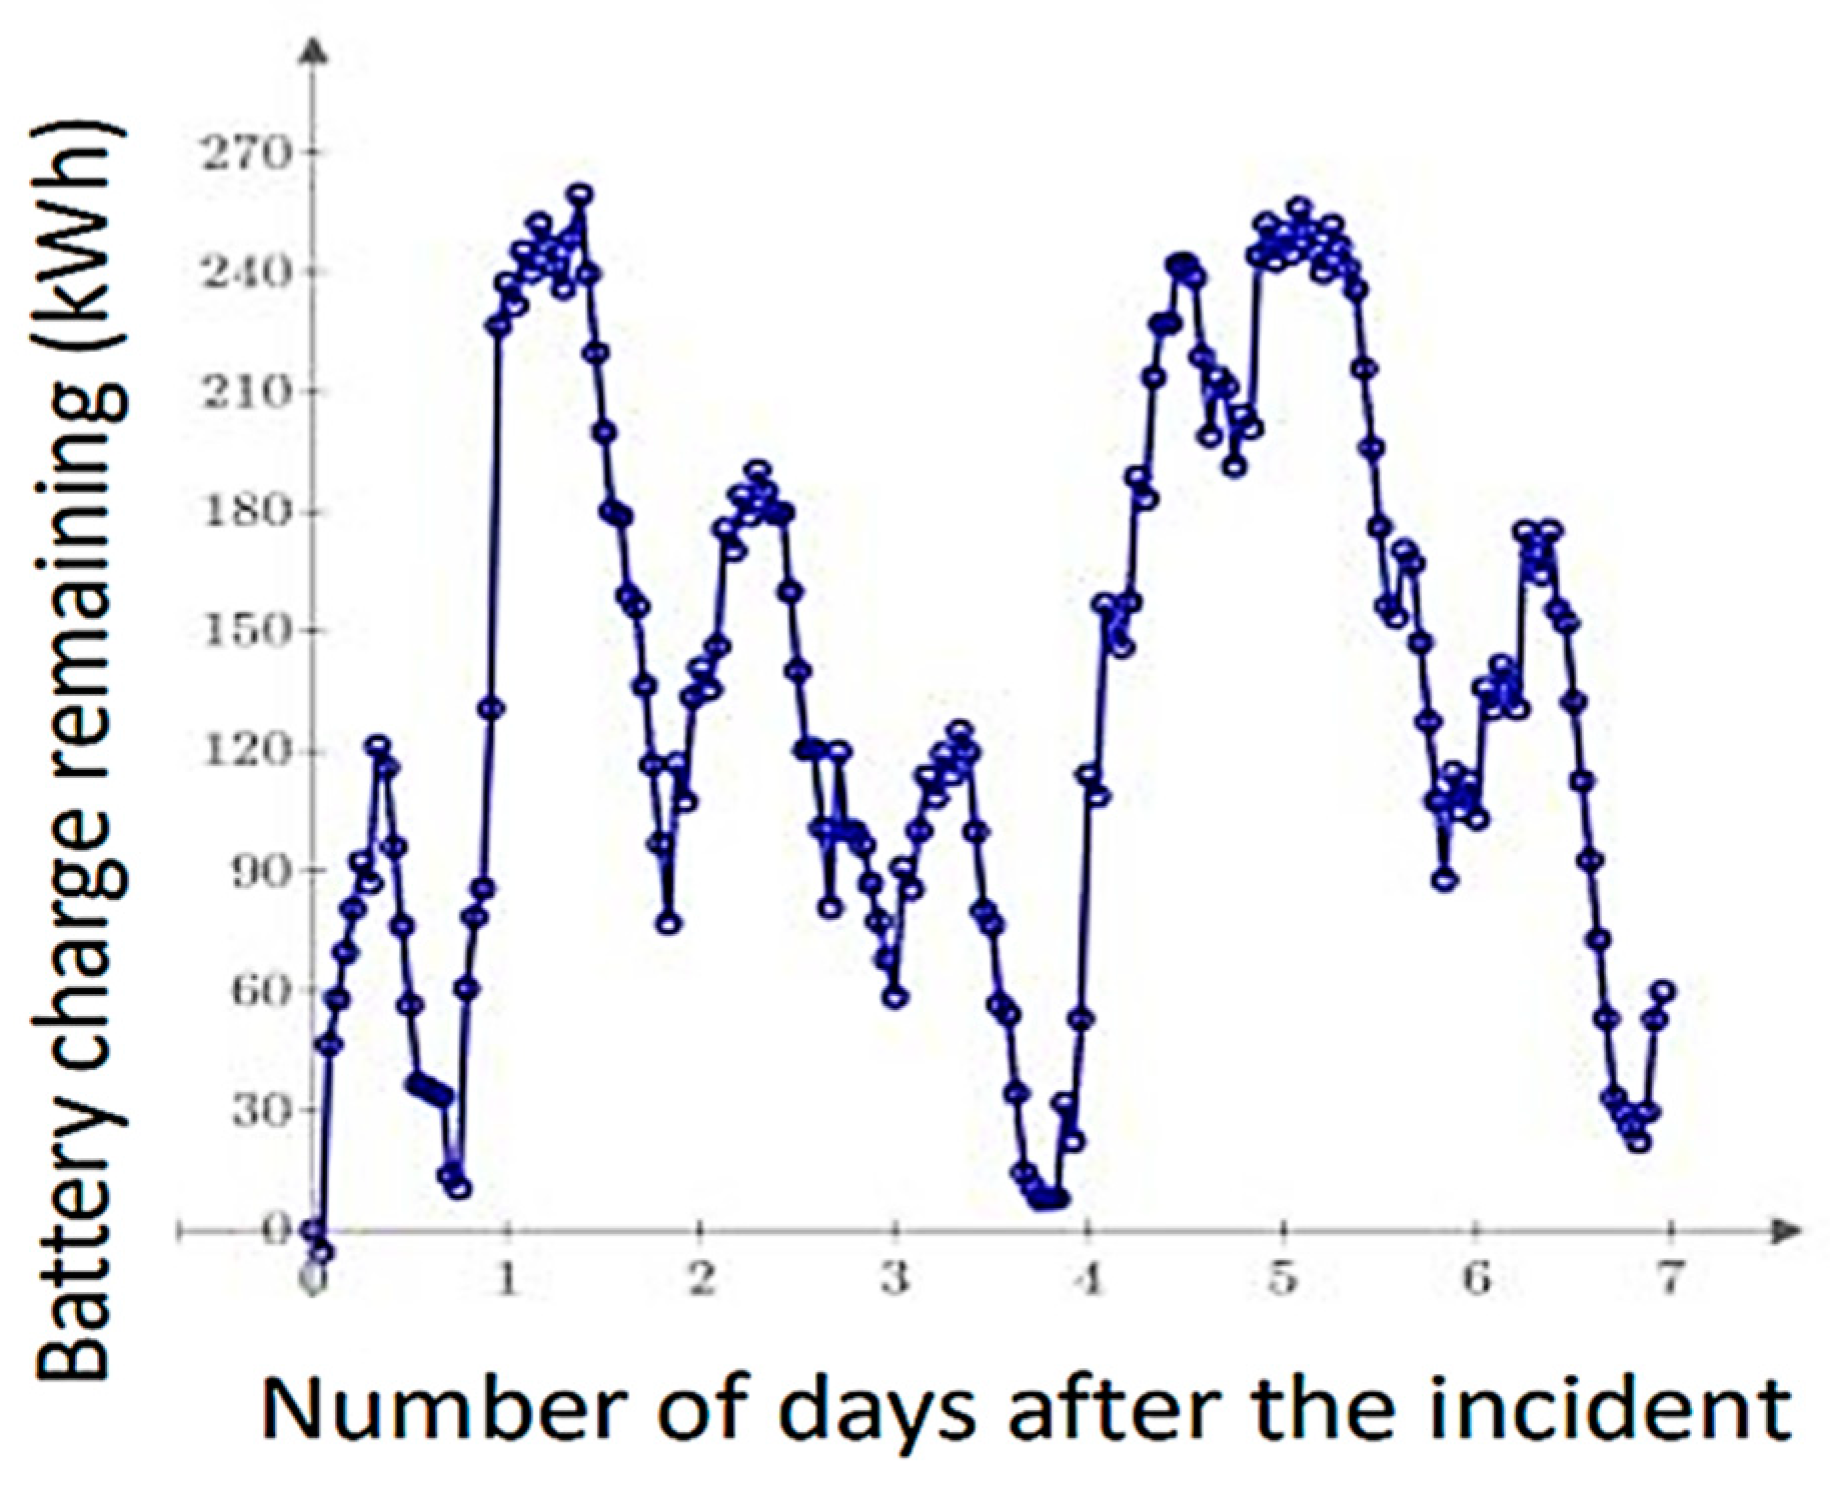
  • A significant earthquake occurs in a scenario city (“PV City”) (radius 5 km). In the first few hours, the PV City local government transitions schools, community centers, and care centers to evacuation centers equipped with spot coolers at six locations (4 hp each). In addition, the PV City local government calls for temporary first-aid stations and multiple charging stations for mobile devices for local people to help access disaster information over and above access to conventional disaster infrastructure. The number of temporary charging stations accessible within a 1 km walk is 25. Because such facilities require electricity, the PV City local government calls for a voluntary donation of electricity from PV-equipped vehicles; a certain percentage of drivers check the charging status (SoC) of their vehicles (every hour), and if SoC is over 90%, they decide to go to one of the use points and provide electricity until the charge of the battery falls to 50% (vehicle batteries are recharged by PV on vehicles). Other efforts are in place to help keep disaster prevention equipment and facilities functioning. Seven days later, the PV City local government is notified that regional lifelines have been restored.
Question: Can the PV City supply enough energy until the external lifeline is restored (with xx% of continuous supply of the required energy)?

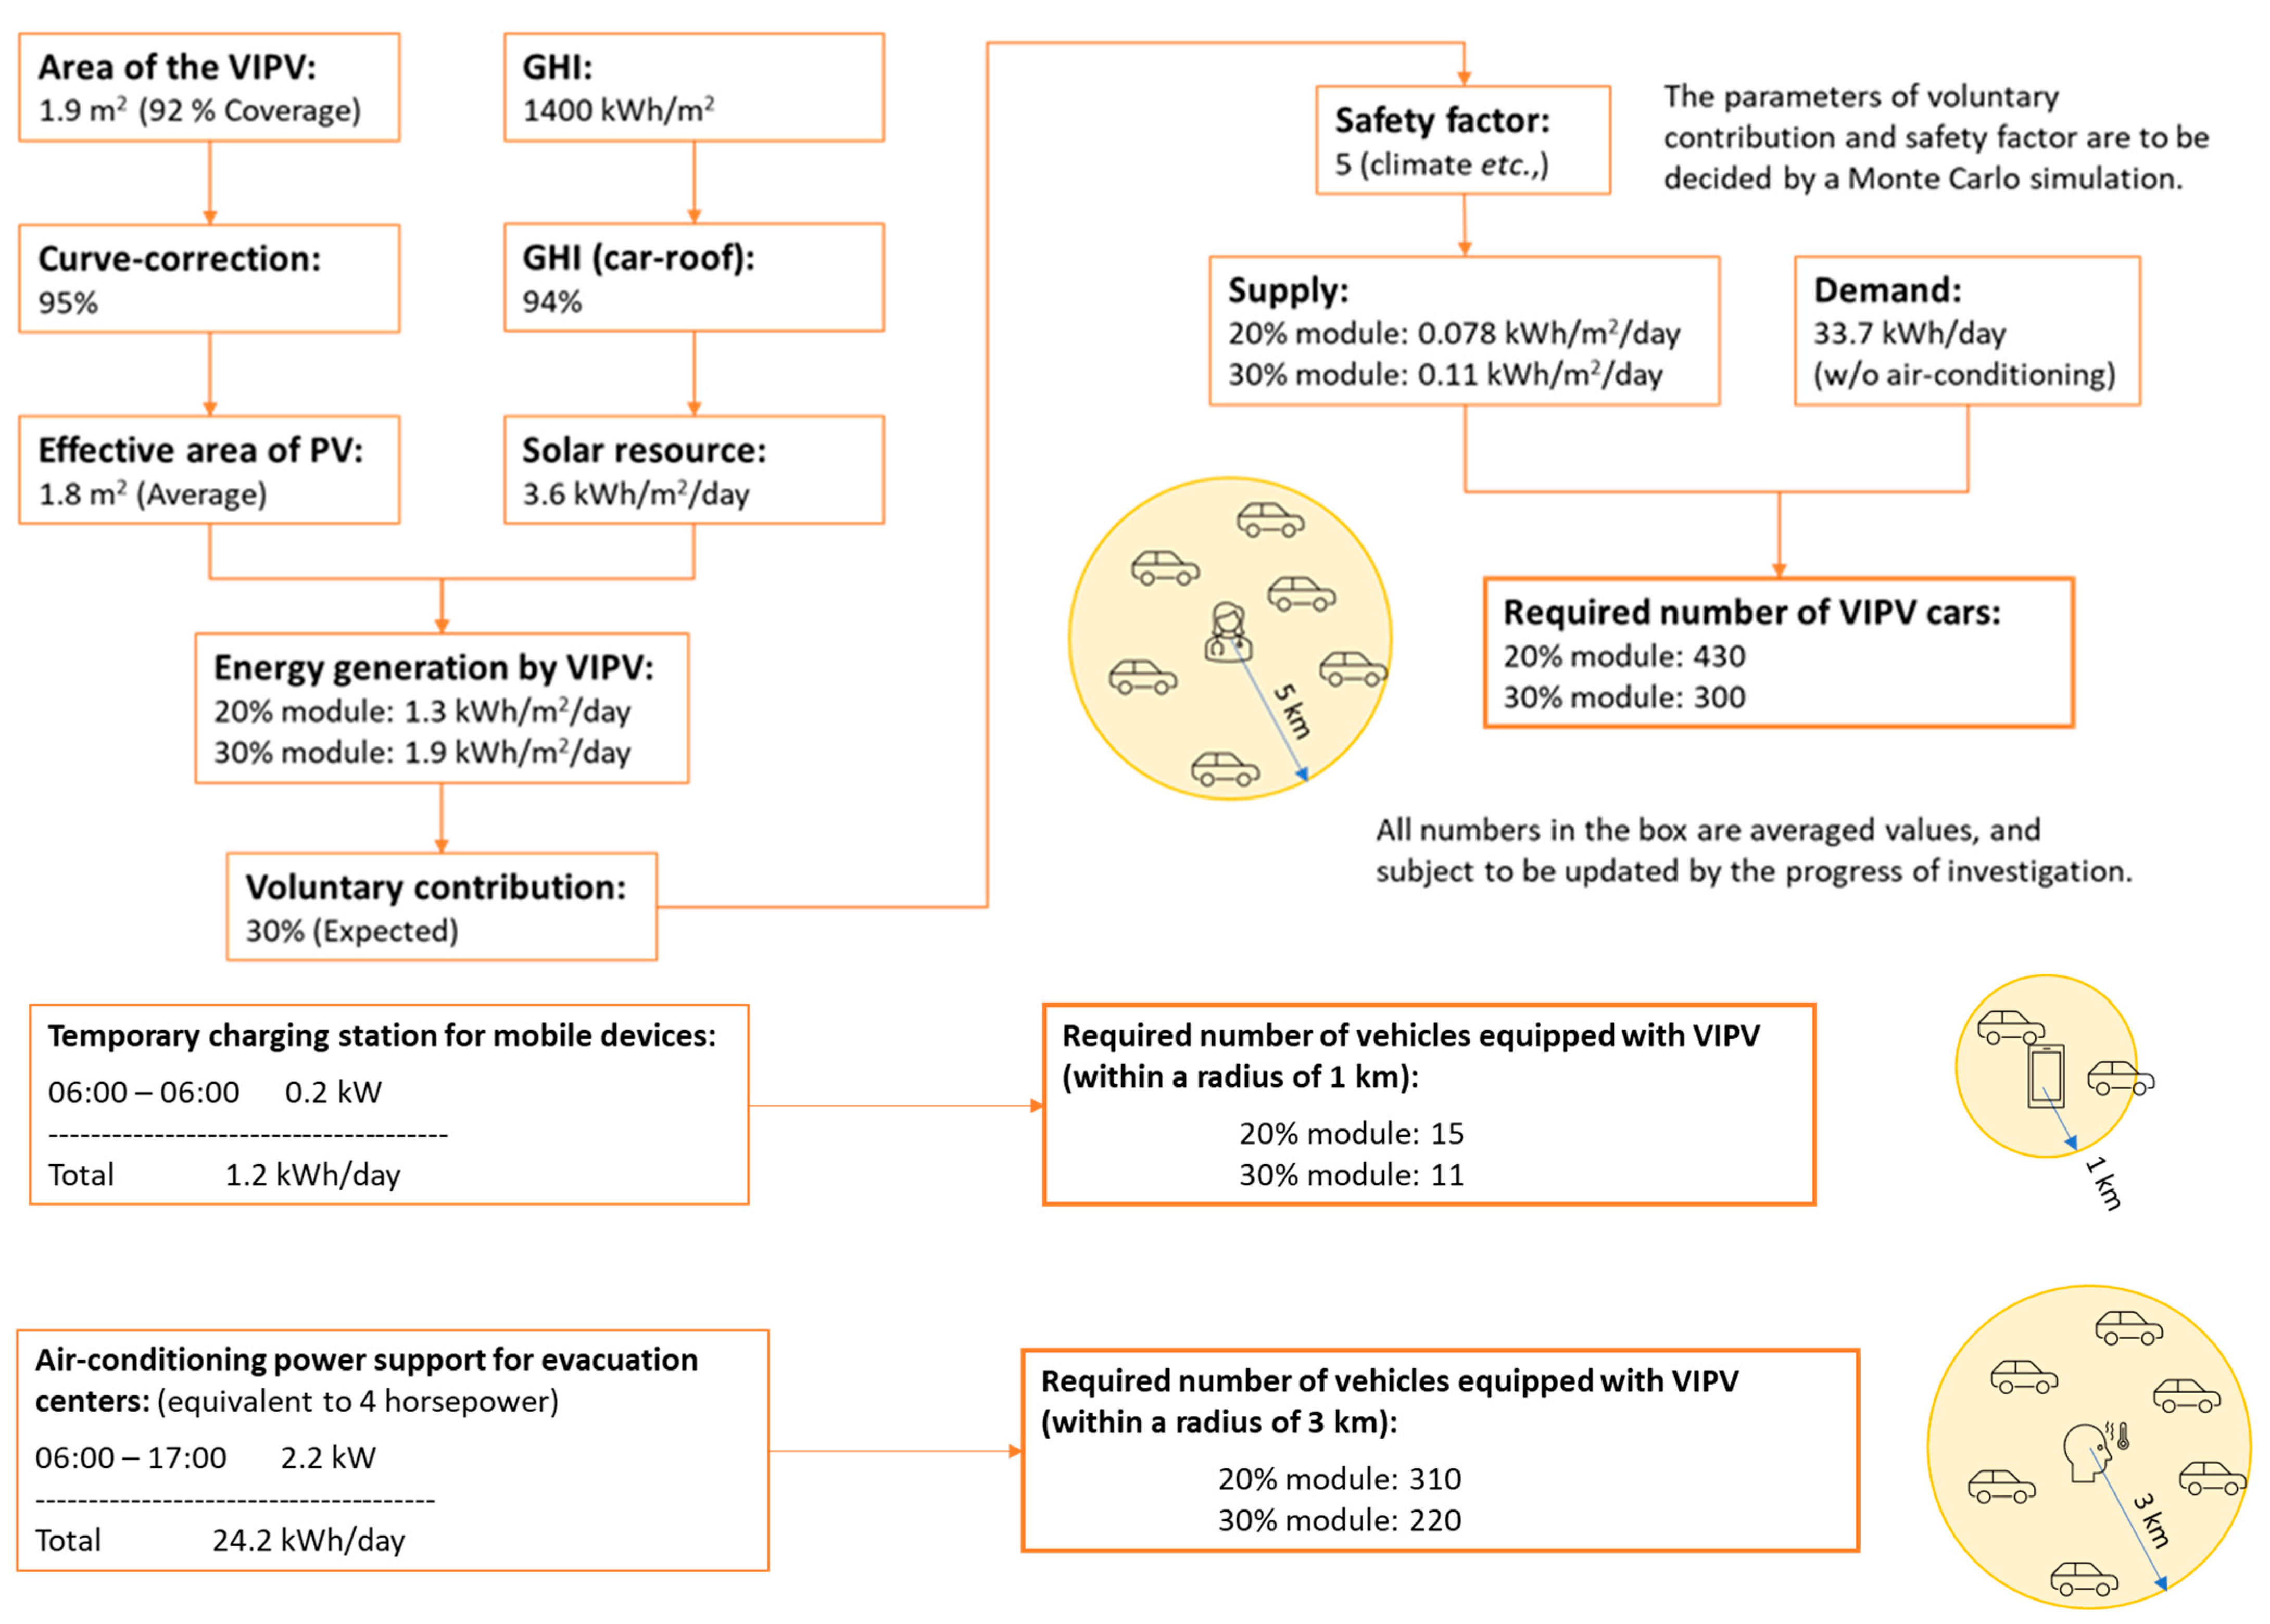
2.2. Demand—Supply Balance

One of the golden rules of resilience is the balance between demand and supply. The supply of VIPV must not be less than the energy demand of resilient facilities. Unlike typical PV models, the resilience model developed in this study is based on the premise that energy needs occur unexpectedly, as a result of natural disasters, and the worst-case scenario must be assumed. Given that social activities affect energy distribution, human activity patterns must also be included in any resilience model.
On the demand side, the following issues need to be considered:
  • Energy requirements of critical facilities, like headquarters of the disaster response and evacuation centers (based on conventional infrastructure);
  • Establishment of temporary evacuation centers essential and suitable for energy supply from VIPV; and
  • The need for air conditioning in hot weather (a critical need that is usually ignored in conventional disaster response planning).
On the supply side, the following issues need to be considered:
  • The density and distribution of the SEV;
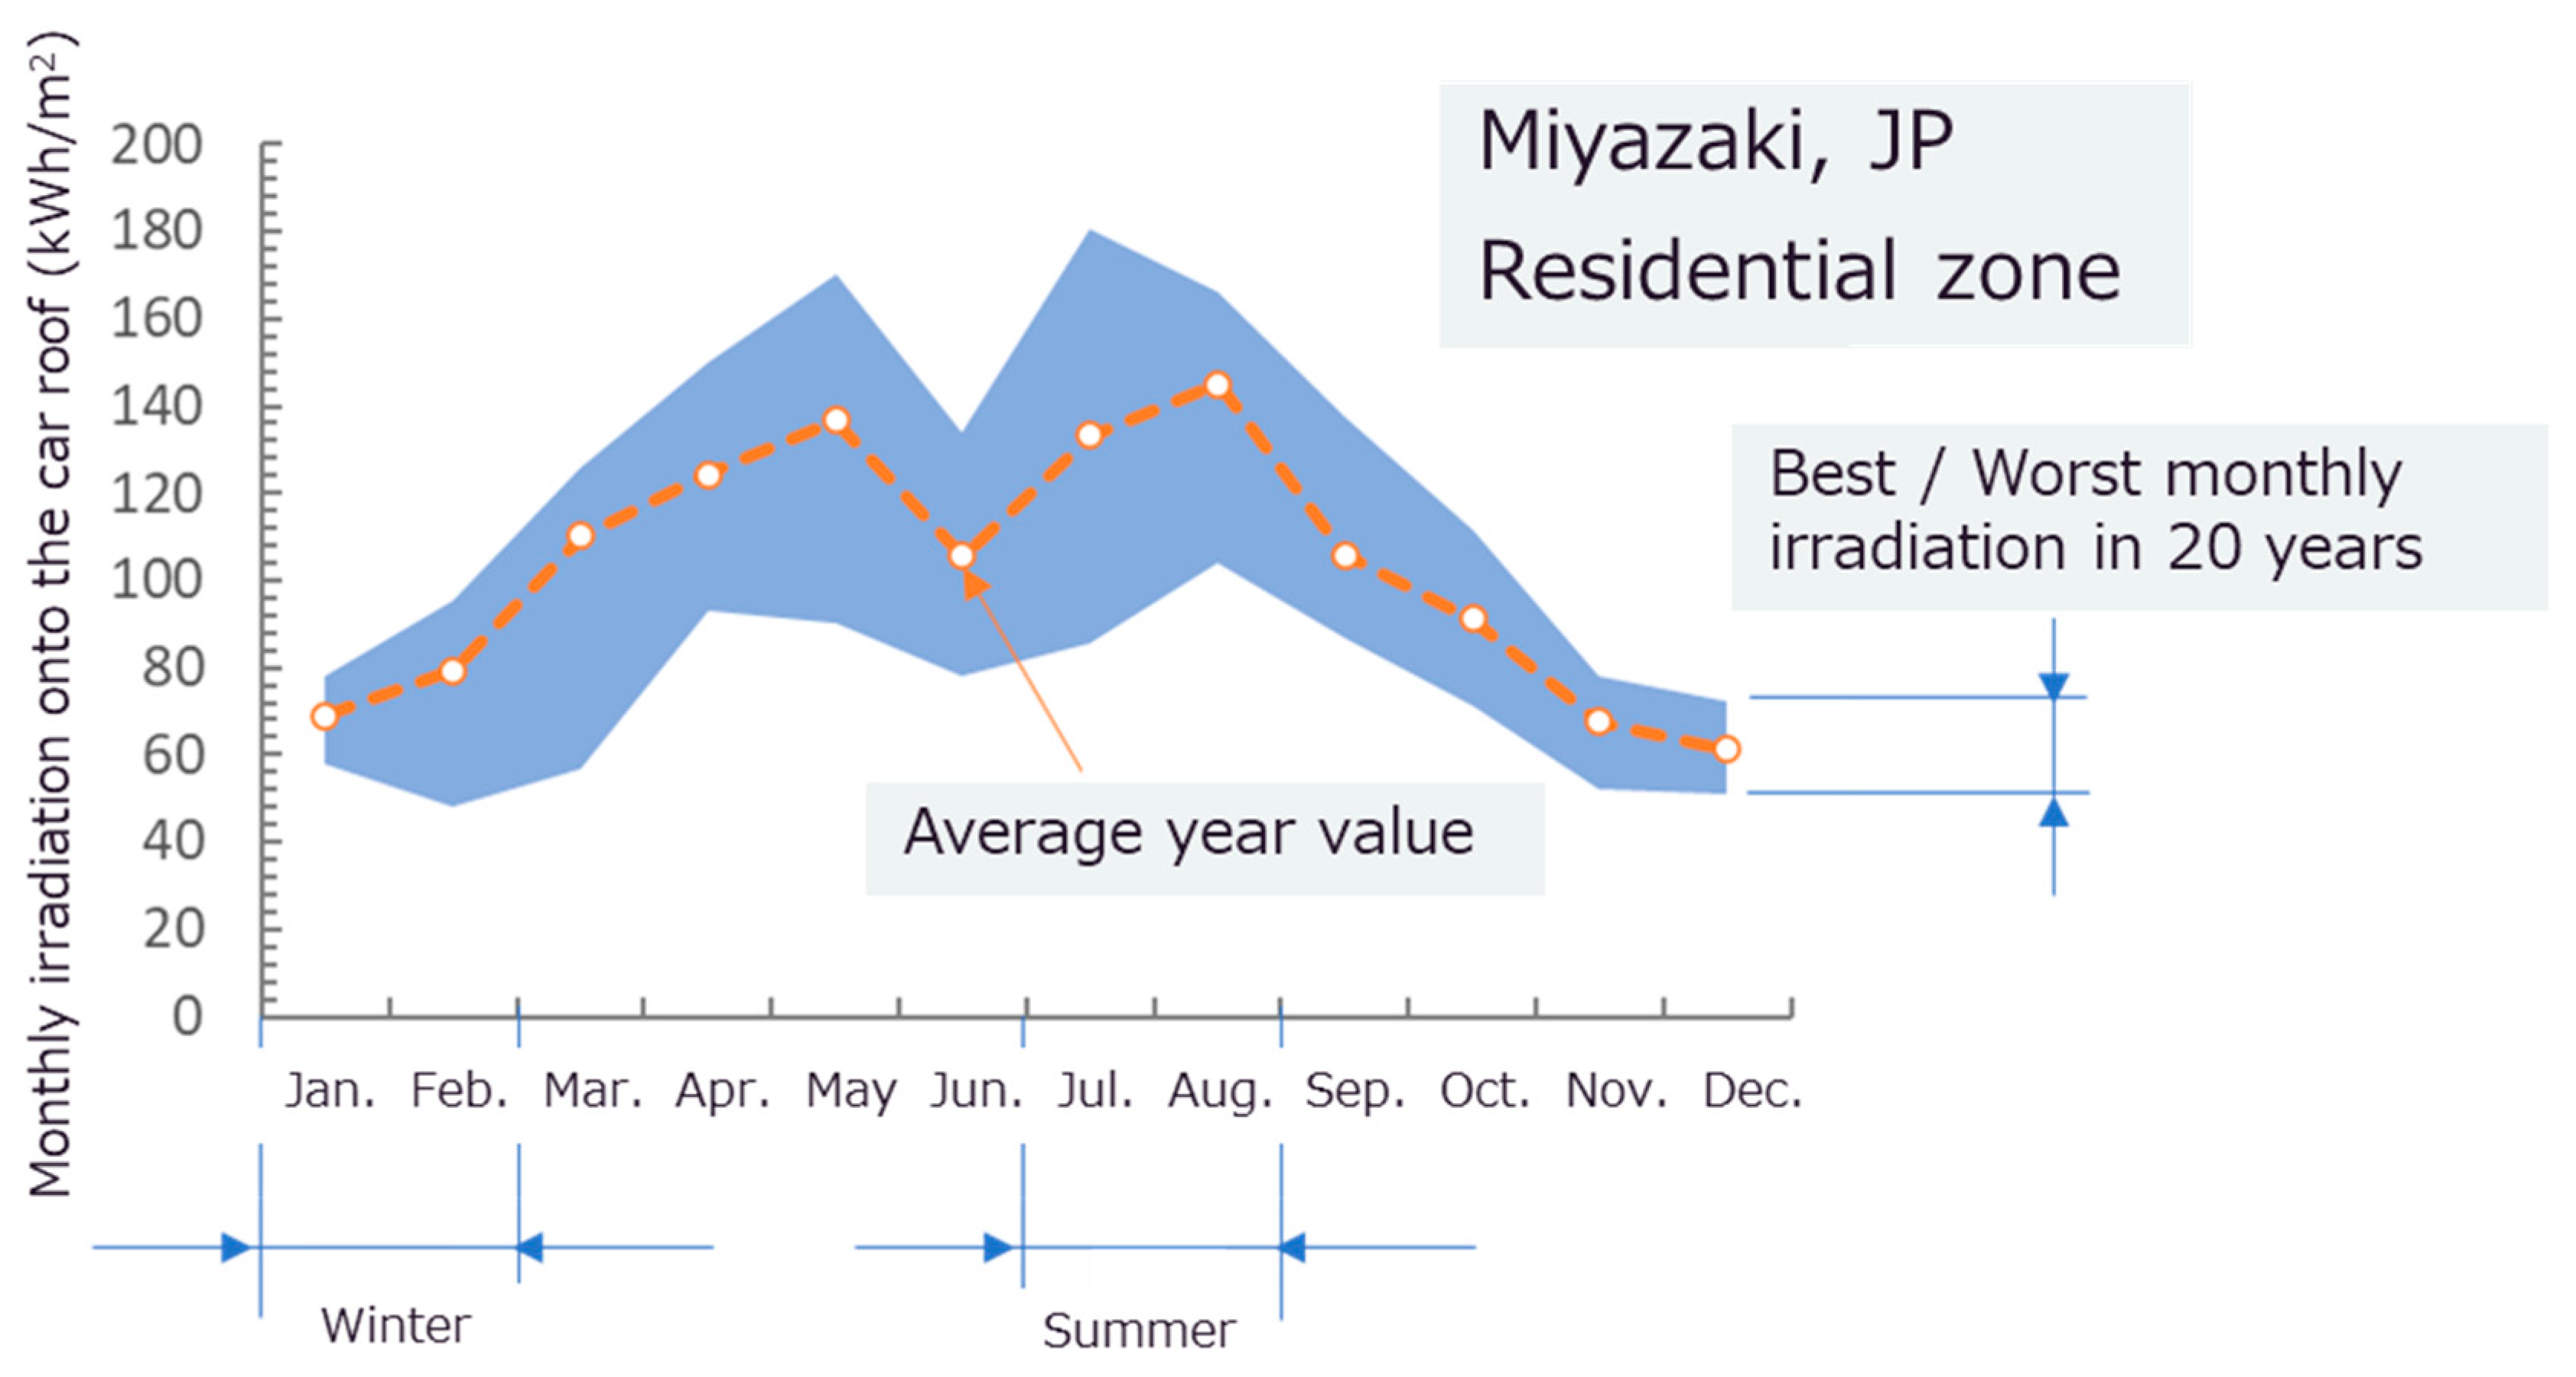
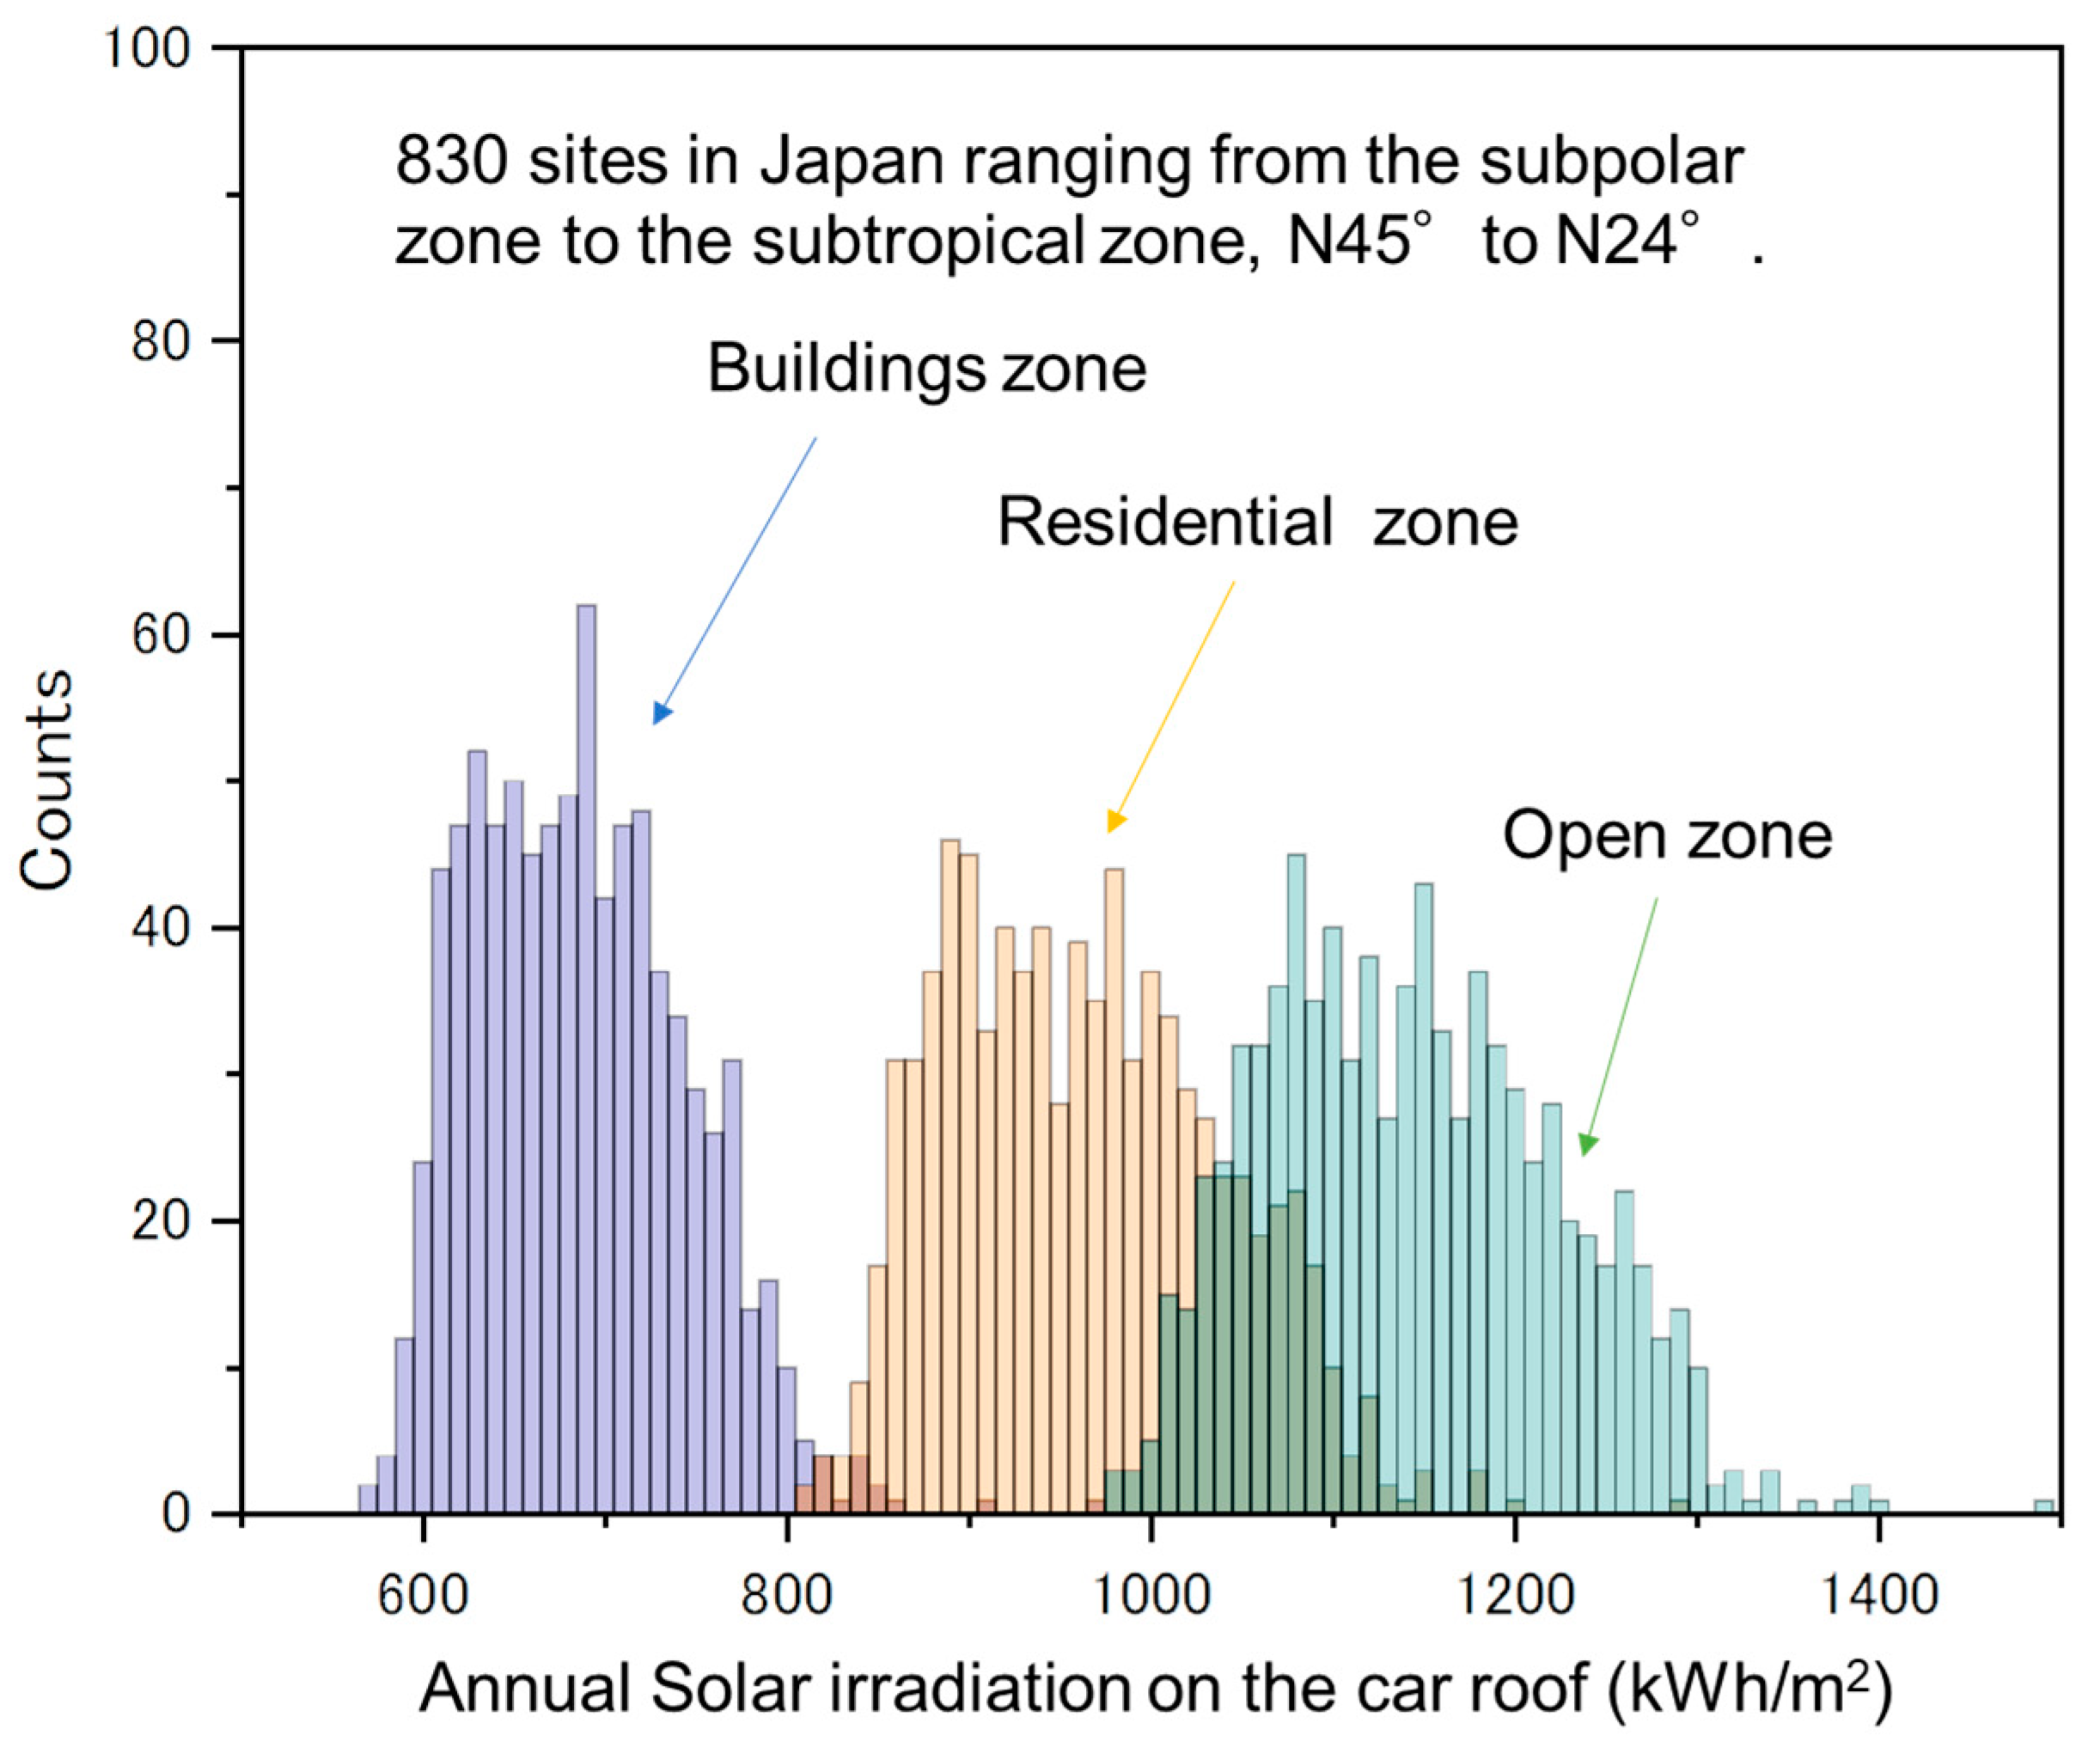
  • Distribution of solar irradiance and climate;
  • VIPV-specific losses;
  • Energy consumption by SEV to carry the donated energy to the saving points and return; and
  • Voluntary donation of VIPV energy to shared facilities (probabilities, conditions, and incentives).

2.3. Demand Model

Energy resilience in the context of disaster response has been frequently discussed by policymakers and is well documented in Japan. The response plans include a designated headquarters for the coordinated disaster response in an area, along with evacuation centers, community halls, and care homes. Each of these facilities uses diesel generators and fixed-tilt PVs as part of the resilience infrastructure (Figure 1, Table 1 and Table 2).
The standard design of resilience facilities does not include air conditioning, and air conditioning is not often included in non-medical evacuation facilities, given the extra cost of diesel generators or portable PV systems. However, there is increasing awareness that air conditioning is also crucial, given the increased mortality rate associated with heatstroke. Typically, the standard plan for disaster response does not accommodate the charging of mobile devices.
Accordingly, the following three temporal facilities and functions would be required in a post-disaster scenario, and each could utilize voluntarily contributed VIPV energy (Figure 2 and Table 3):
  • Temporary shelter with medical care;
  • Mobile device charging station within walking distance; and
  • Backup power for air conditioning.

2.4. Supply Model

The performance and power generation of VIPV are complex and beyond the scope of a simple extension of the fixed-tilt installation of photovoltaic modules. The surrounding shading objects influence the solar irradiance on the vehicle body, and its impact varies depending on the section of the body; for example, on the left or right side of the vehicle.
The following aspects affect the solar irradiance and resulting performance of the VIPV system:
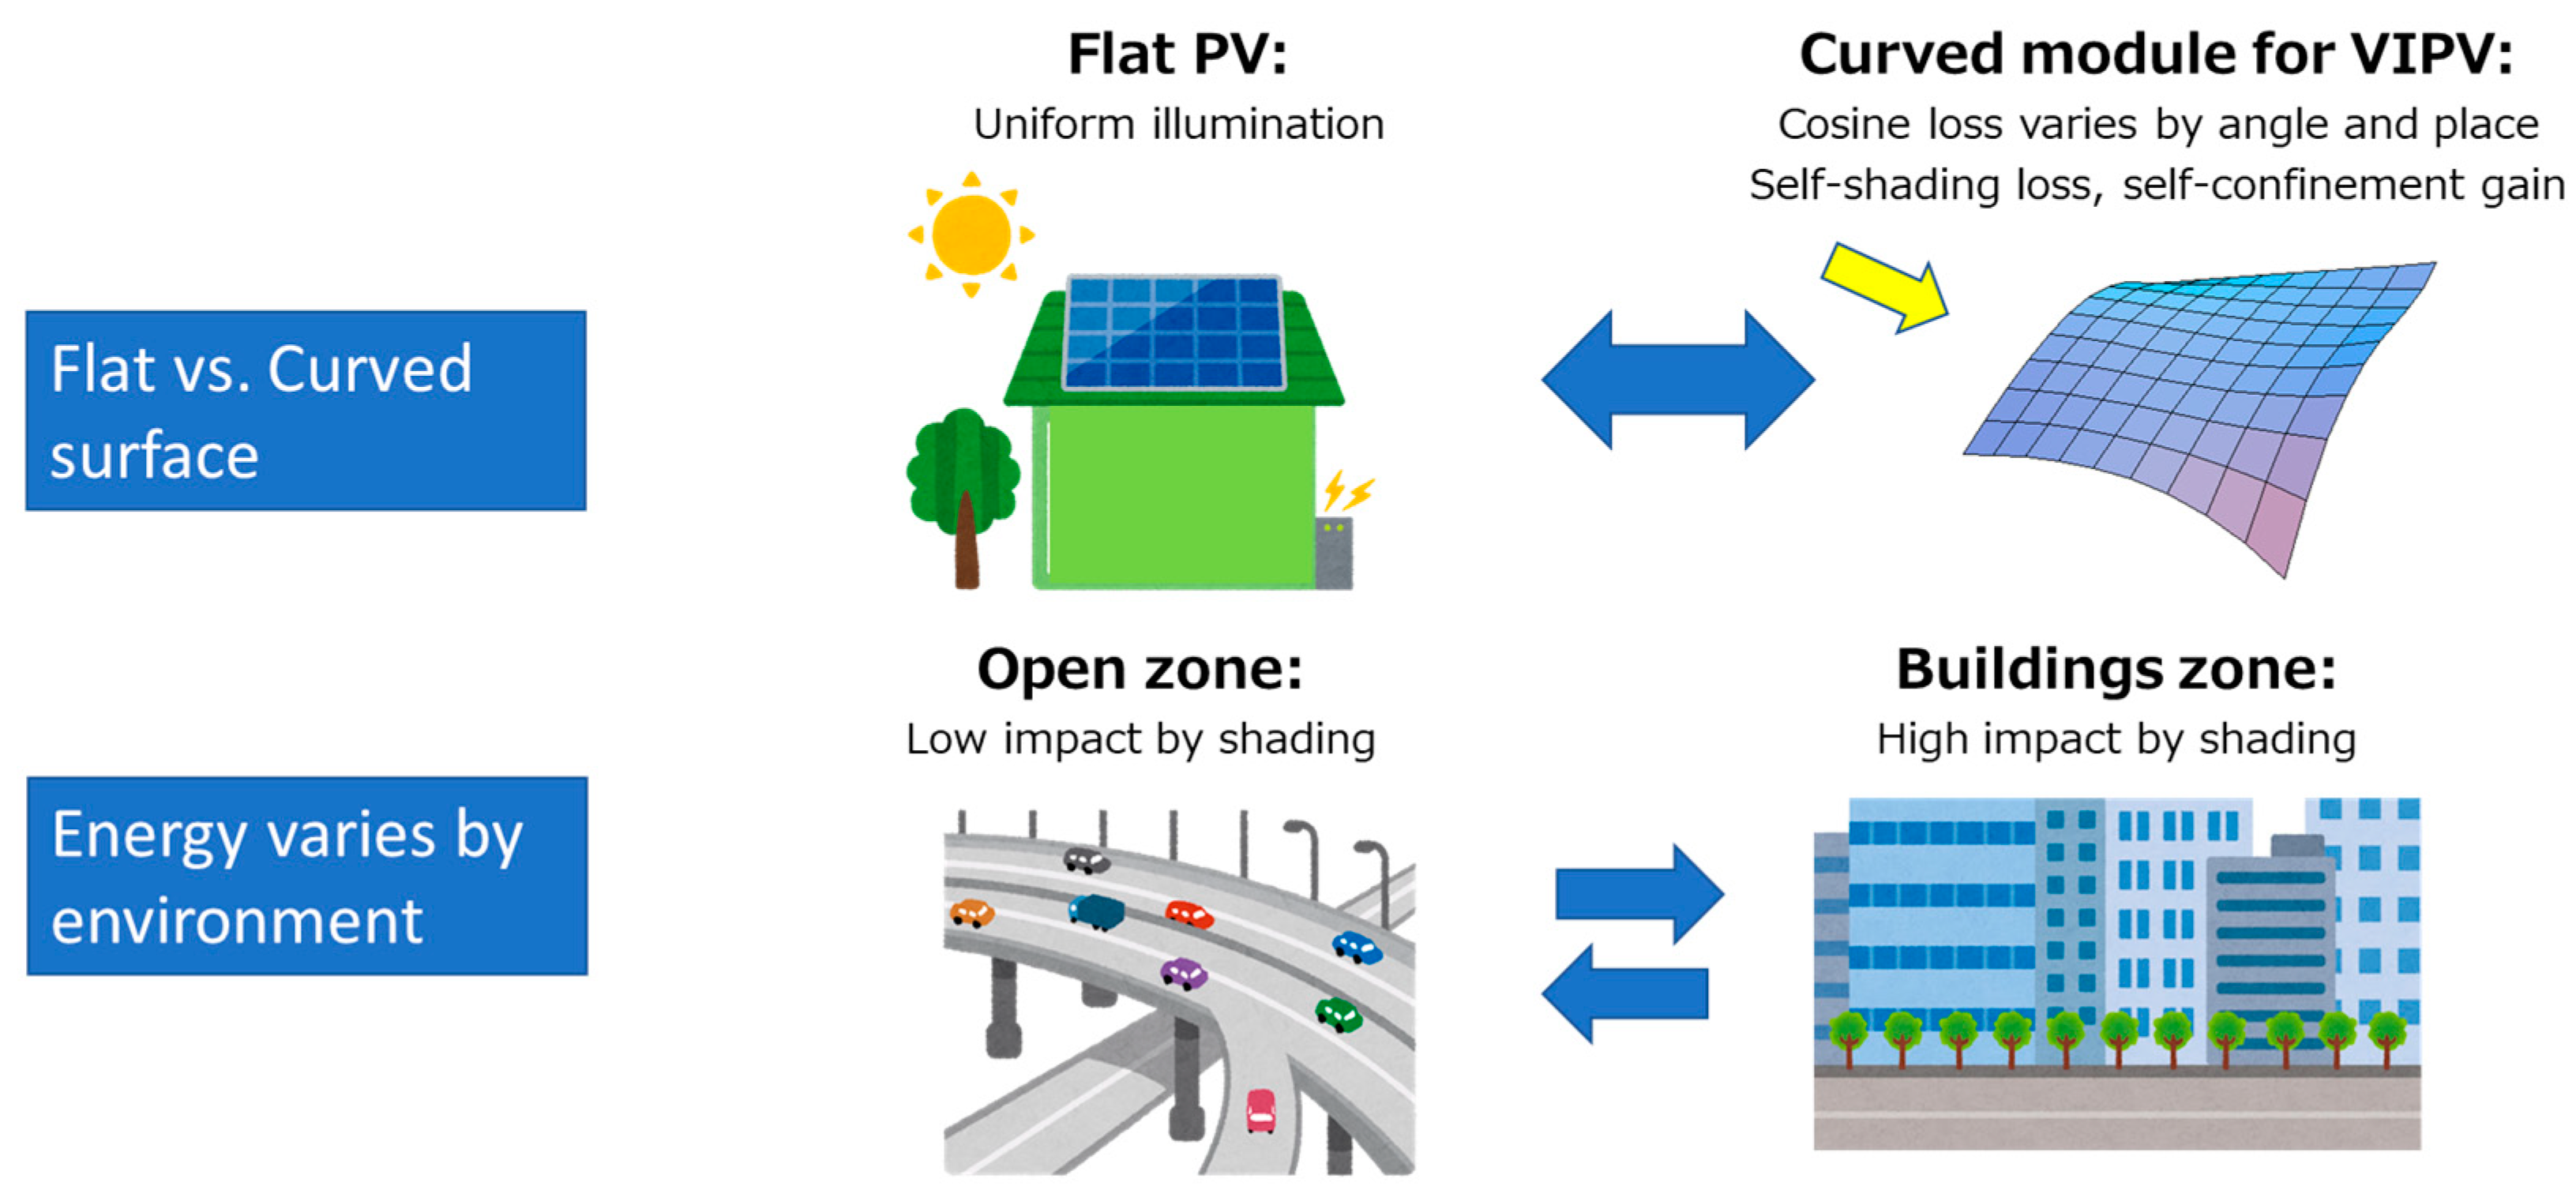
  • The orientation angle of the VIPV is not fixed but, rather, frequently changes during driving;
  • A moving VIPV has a higher probability of shading than does a fixed-station PV;
  • Although the shading objects, such as street trees and traffic signals, are relatively small, they have some effect on VIPV performance;
  • Curved surfaces of the vehicle;
  • The impacts mentioned above interact and depend on the vehicle’s local coordinates;
  • Rapid solar irradiance fluctuation, generally in milliseconds, results from dynamic partial shading;
  • Rapid fluctuations in the solar spectrum; and
  • Temperature variation between parking and driving.
The difference in power generation from a standard stationary PV system must be known in order to calculate the energy yield of the VIPV based on the following points:
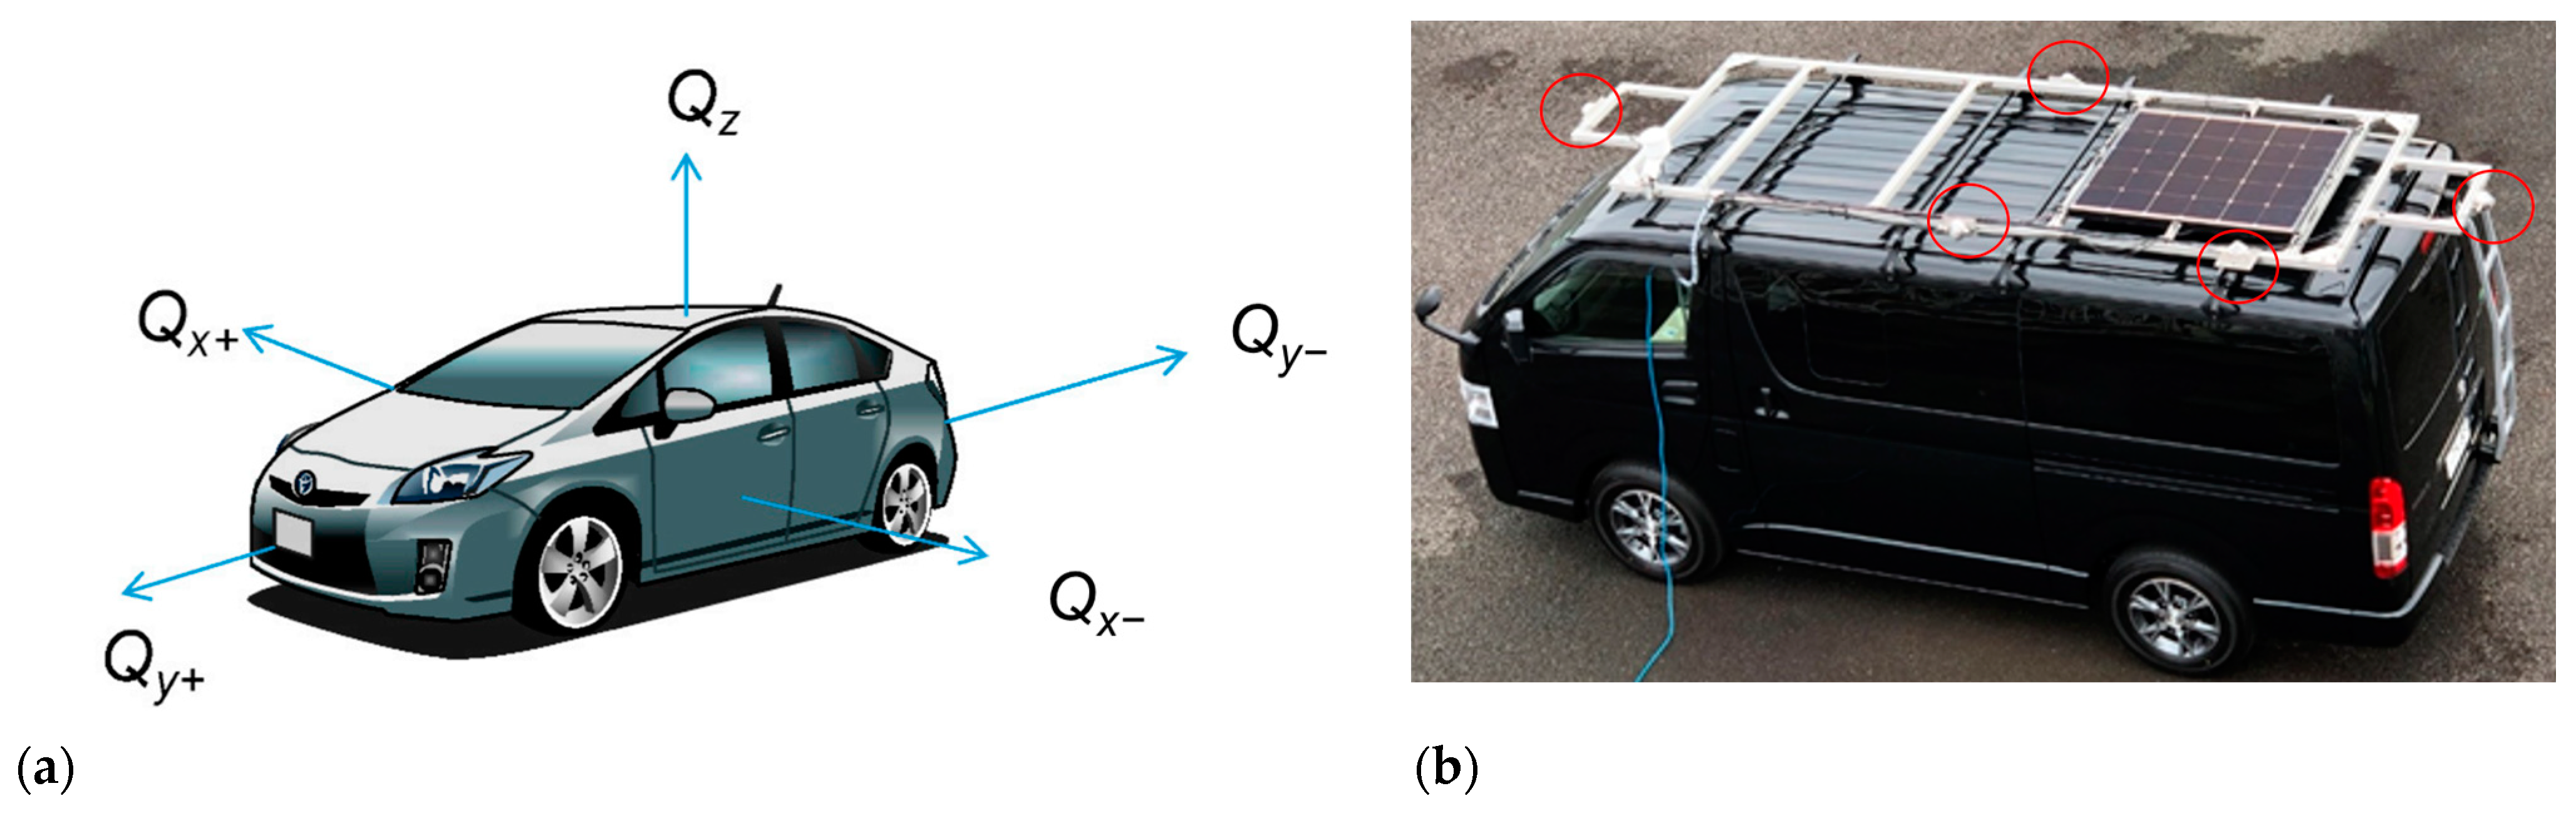
  • Solar irradiance on VIPV (orthogonal 5 axes);
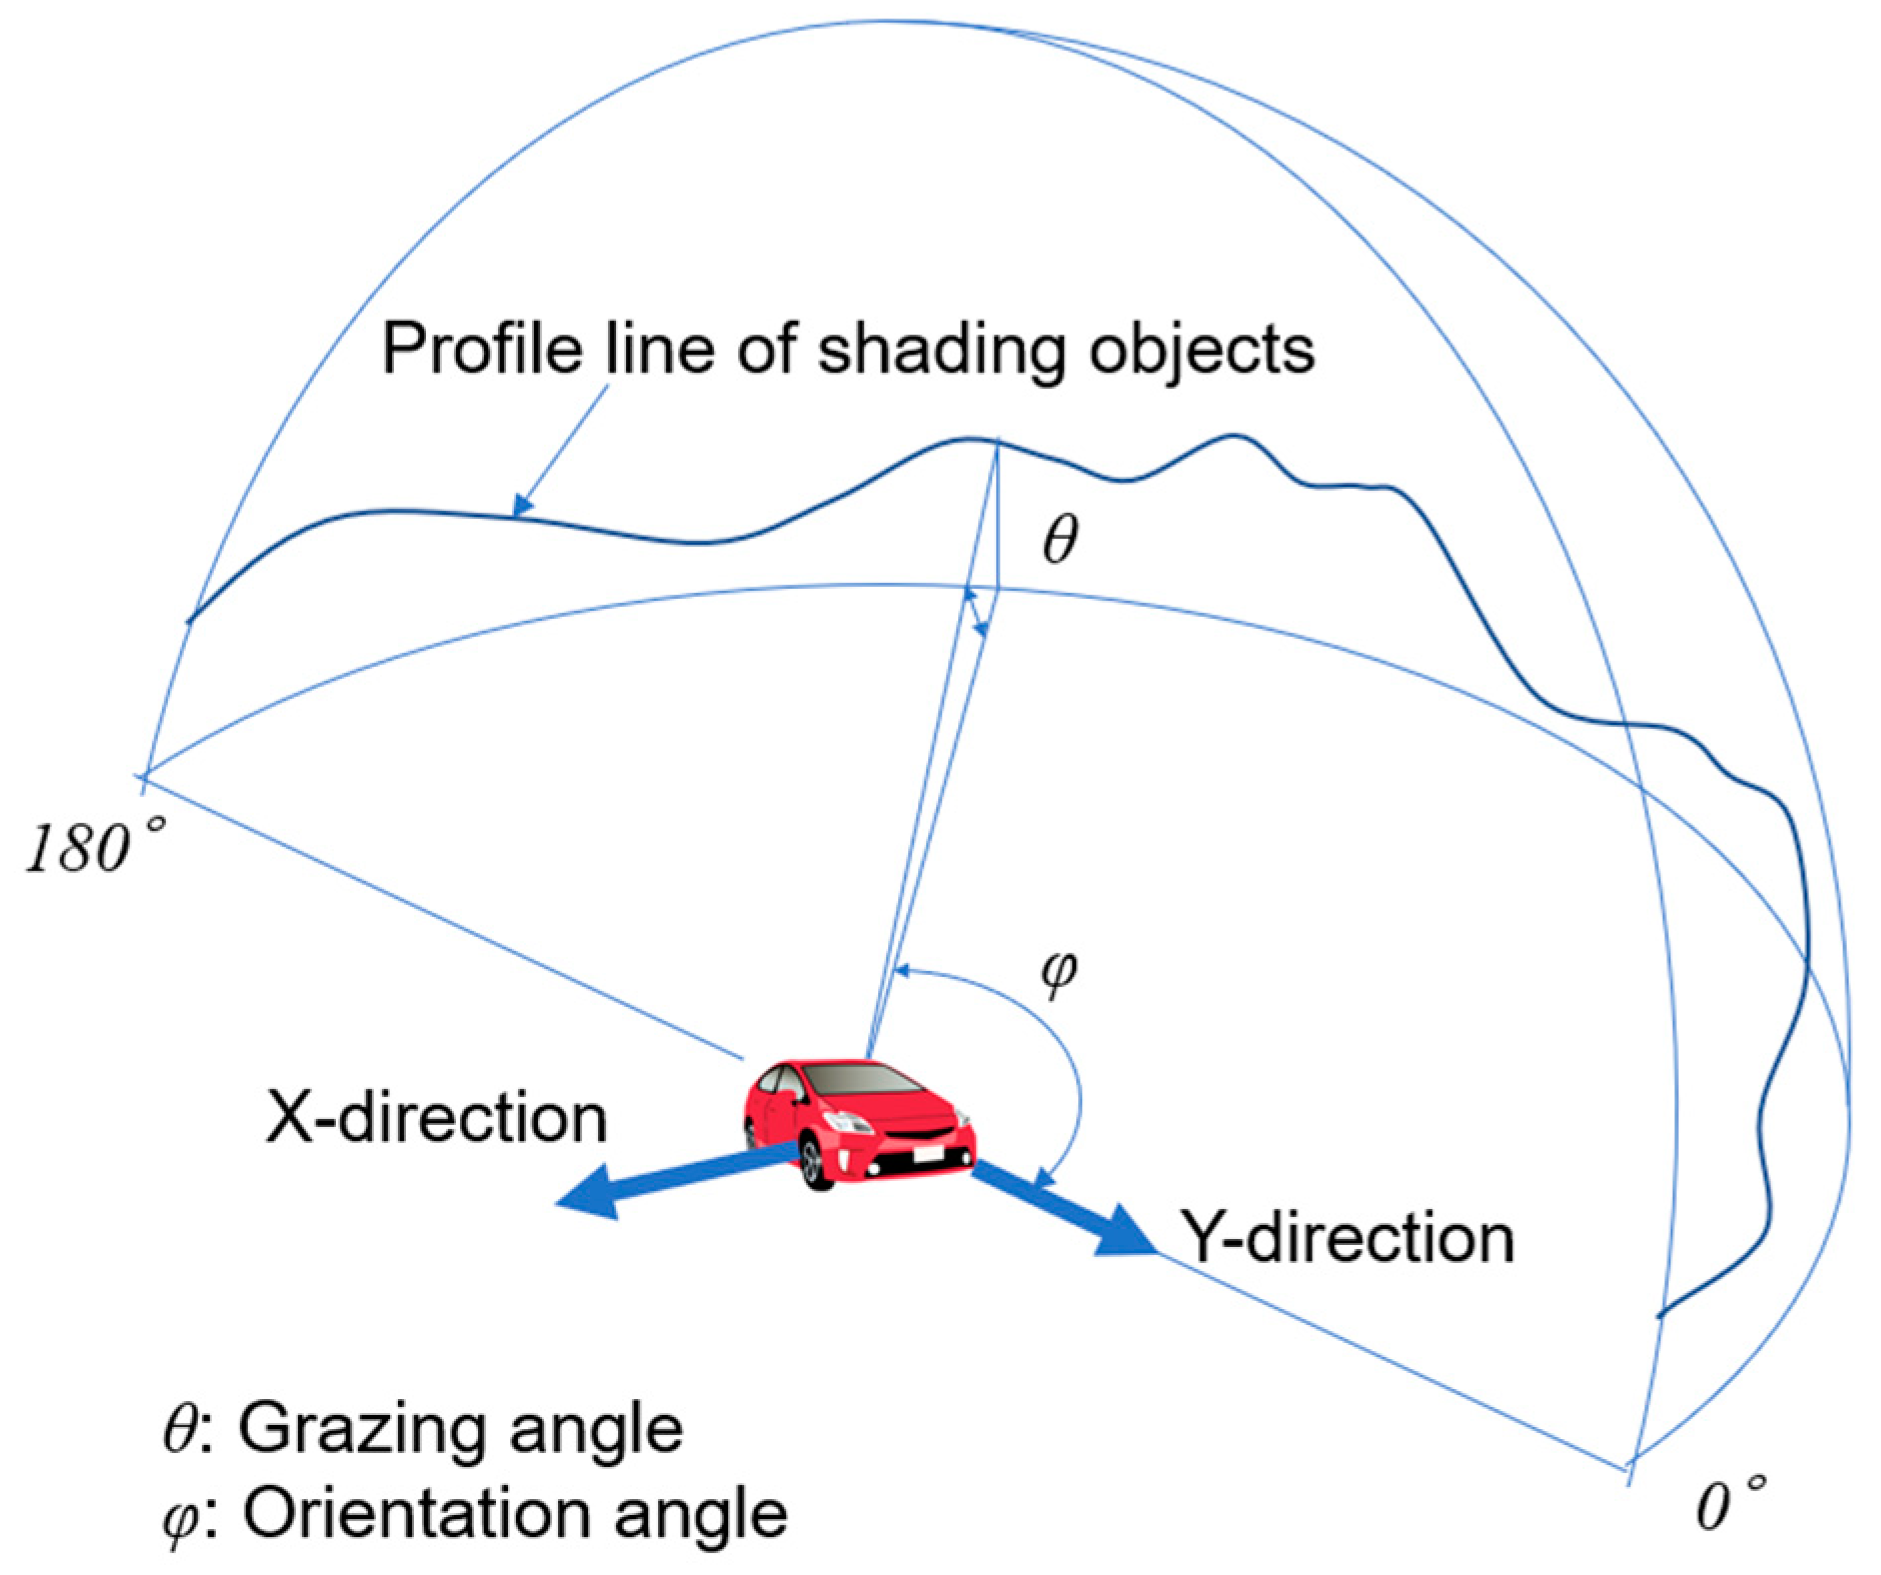
  • Distribution of shaded objects used to estimate solar irradiance and irradiation on an arbitrary reference plane tangible to the curved surface of the VIPV;
  • Distribution of edges of the shading objects that results in partial shading; and
  • Dynamic spectrum fluctuation.
Each of these factors can be directly measured or calculated in building a model, and the values can be weighted by probability. For example, the expected value of the impact of partial shading is calculated using the product of the likelihood of the sun height distribution, the probability of partial shading events (edges of shading objects that intersect with the sun directional vector), and the expected value of the impact of the power output (approximately 0.5, considering a random distribution of the size and replacement of the partial shading).
Although many factors must be considered in evaluating energy resilience through the use of VIPVs, the two main factors are curved surfaces and the impact of shading (Figure 3).

2.5. Curve Correction of VIPV

To evaluate the effect of curved surfaces, blueprints of commercial cars were analyzed to determine the variation in the roof shape of the vehicles, and the population of the roof curves was modeled using a method from a previous study [60]. A simple correction is required to determine irradiation on a curved surface based on (1) aperture loss, (2) local cosine loss, which varies by points and incident angle of rays, and (3) self-shading loss.
The irradiance behavior of curved PV modules has been previously described, including methods of standardization [61] and determination of performance [62]. For example, Ota et al. used ray tracing calculations [63], and Tayagaki et al. used an analytical method [64]. In the differential geometry approach, corrections are made using a trace illustration [60] and the coverage ratio is estimated using the above-mentioned shape model [65]. In the present study, solar irradiance variations on the curved surfaces were calculated using this method. These losses are caused by geometric, physical, optical, and circuit factors. This was validated by comparing the calculations and measurements. Details of the validation are presented in the Results section.
The correction factor for the curved surface was defined as the ratio of the total irradiance of the curved modules to the irradiance obtained when the entire cell was rearranged onto a flat plane (flat surface), with a particular angular distribution of solar rays. Notably, the shape factor is not exclusively a geometric function but is influenced by the angular distribution of the solar rays.
The measured output current matched well with the calculation by observing the effect of the sun’s orientation and height on the global horizontal irradiance (GHI), direct normal irradiance (DNI), and 3D curve profile. This technique is being considered by the International Electrotechnical Commission (IEC) as a possible standard method for determining irradiance on curved surfaces. The performance of a curved module can be adequately tested once its geometric, physical, optical, and circuit conditions are known. In this study, a 10% loss associated with the curved surface was assumed, including mismatch loss related to nonuniform irradiation. This factor (10% loss by a curved surface) is acknowledged as an adequate value and has been used in other studies [60,65,66].

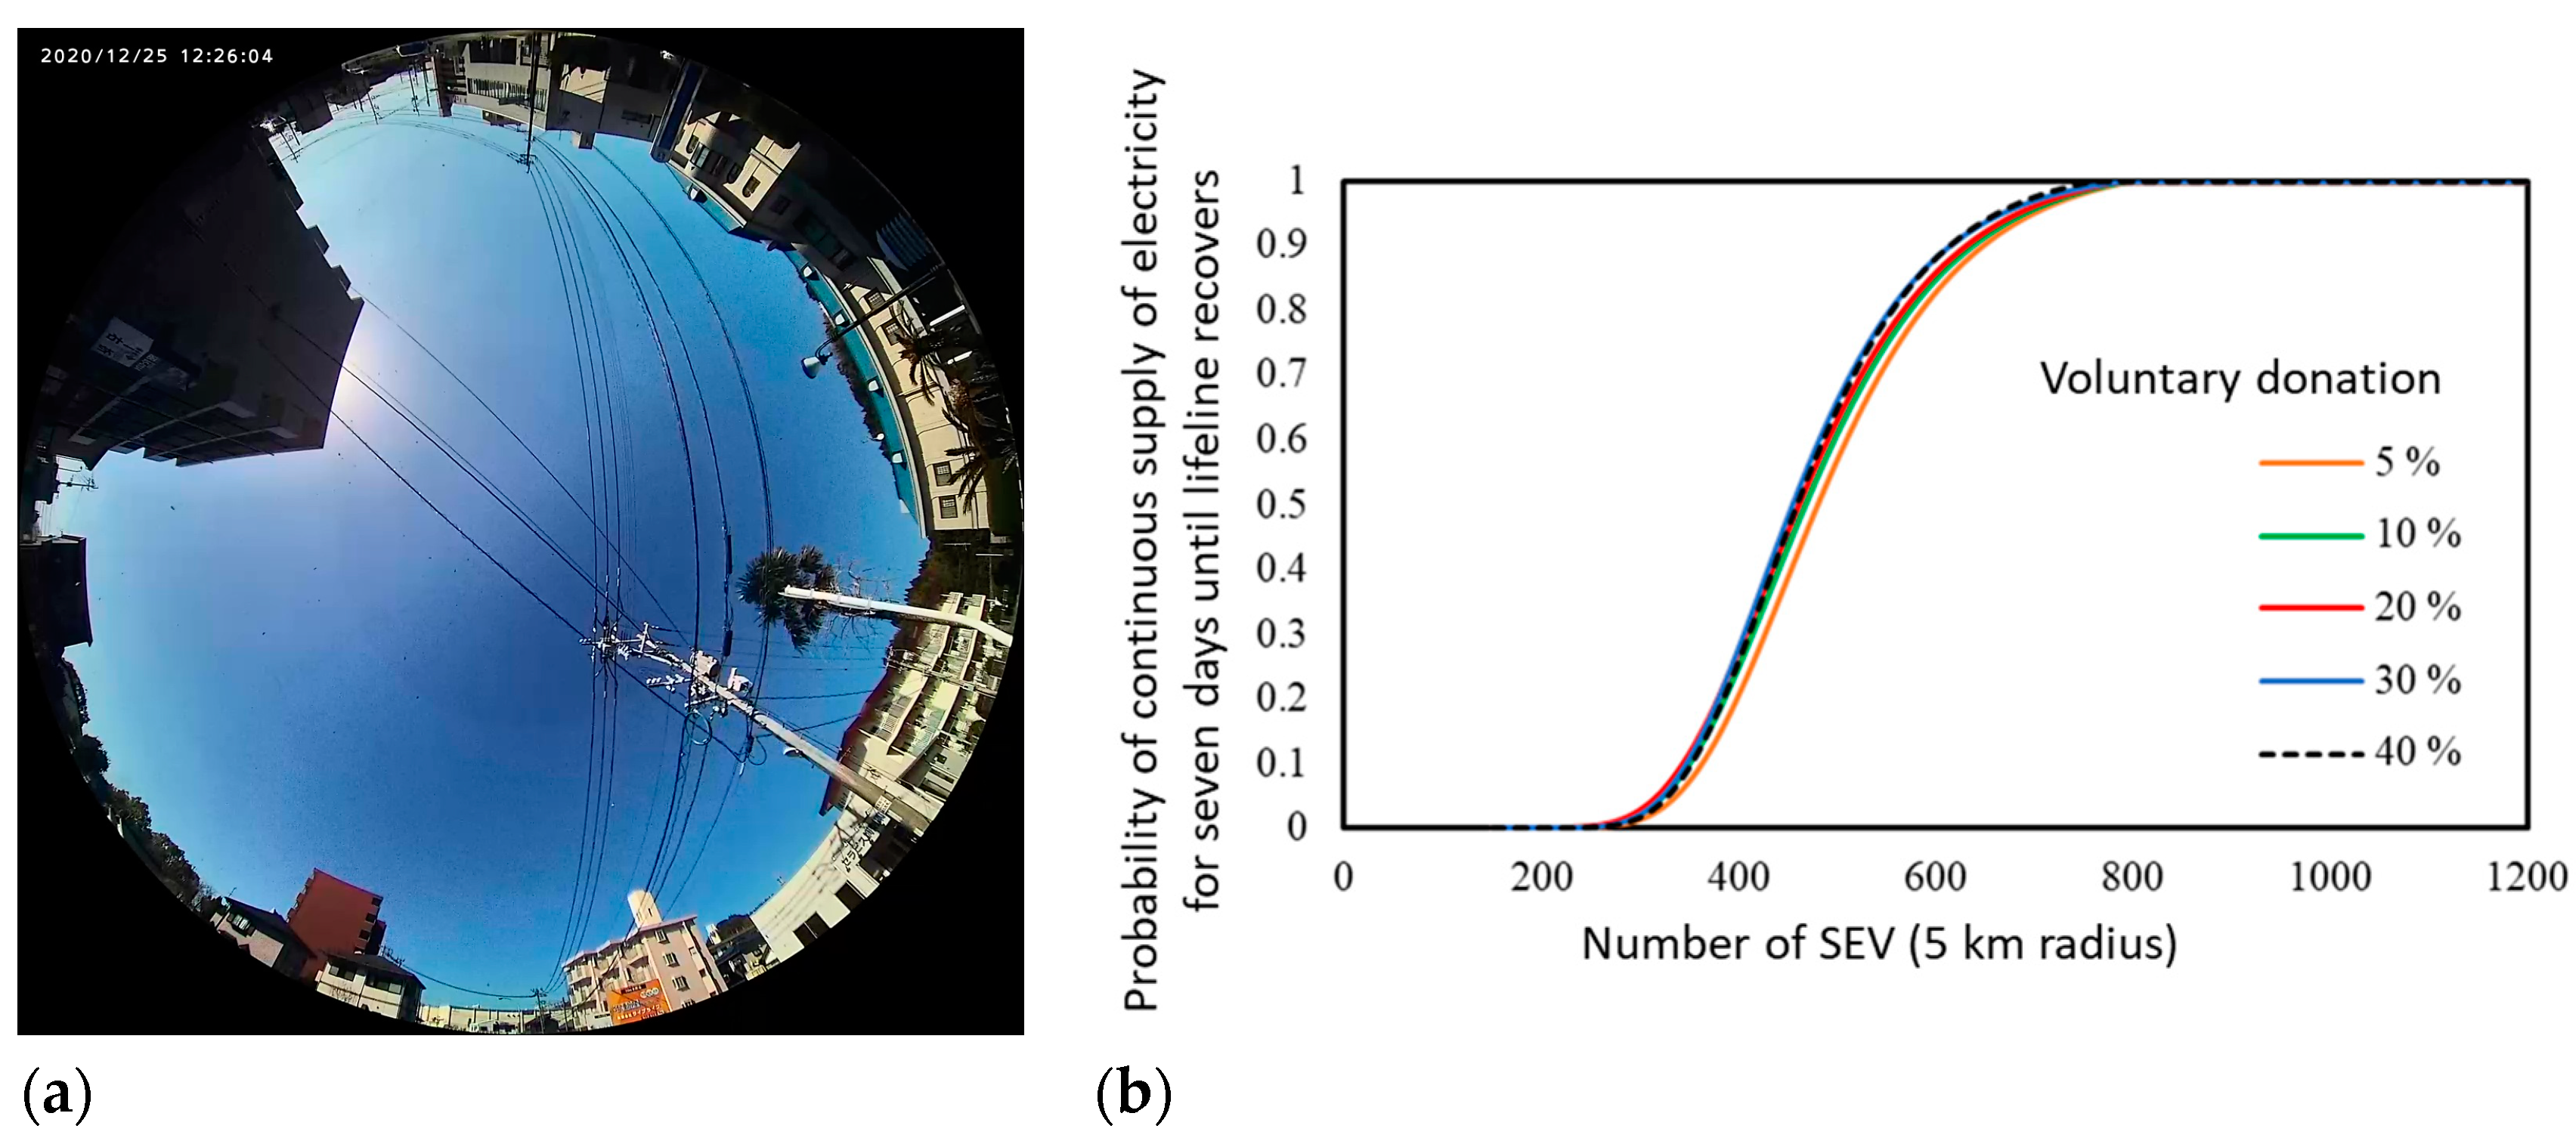
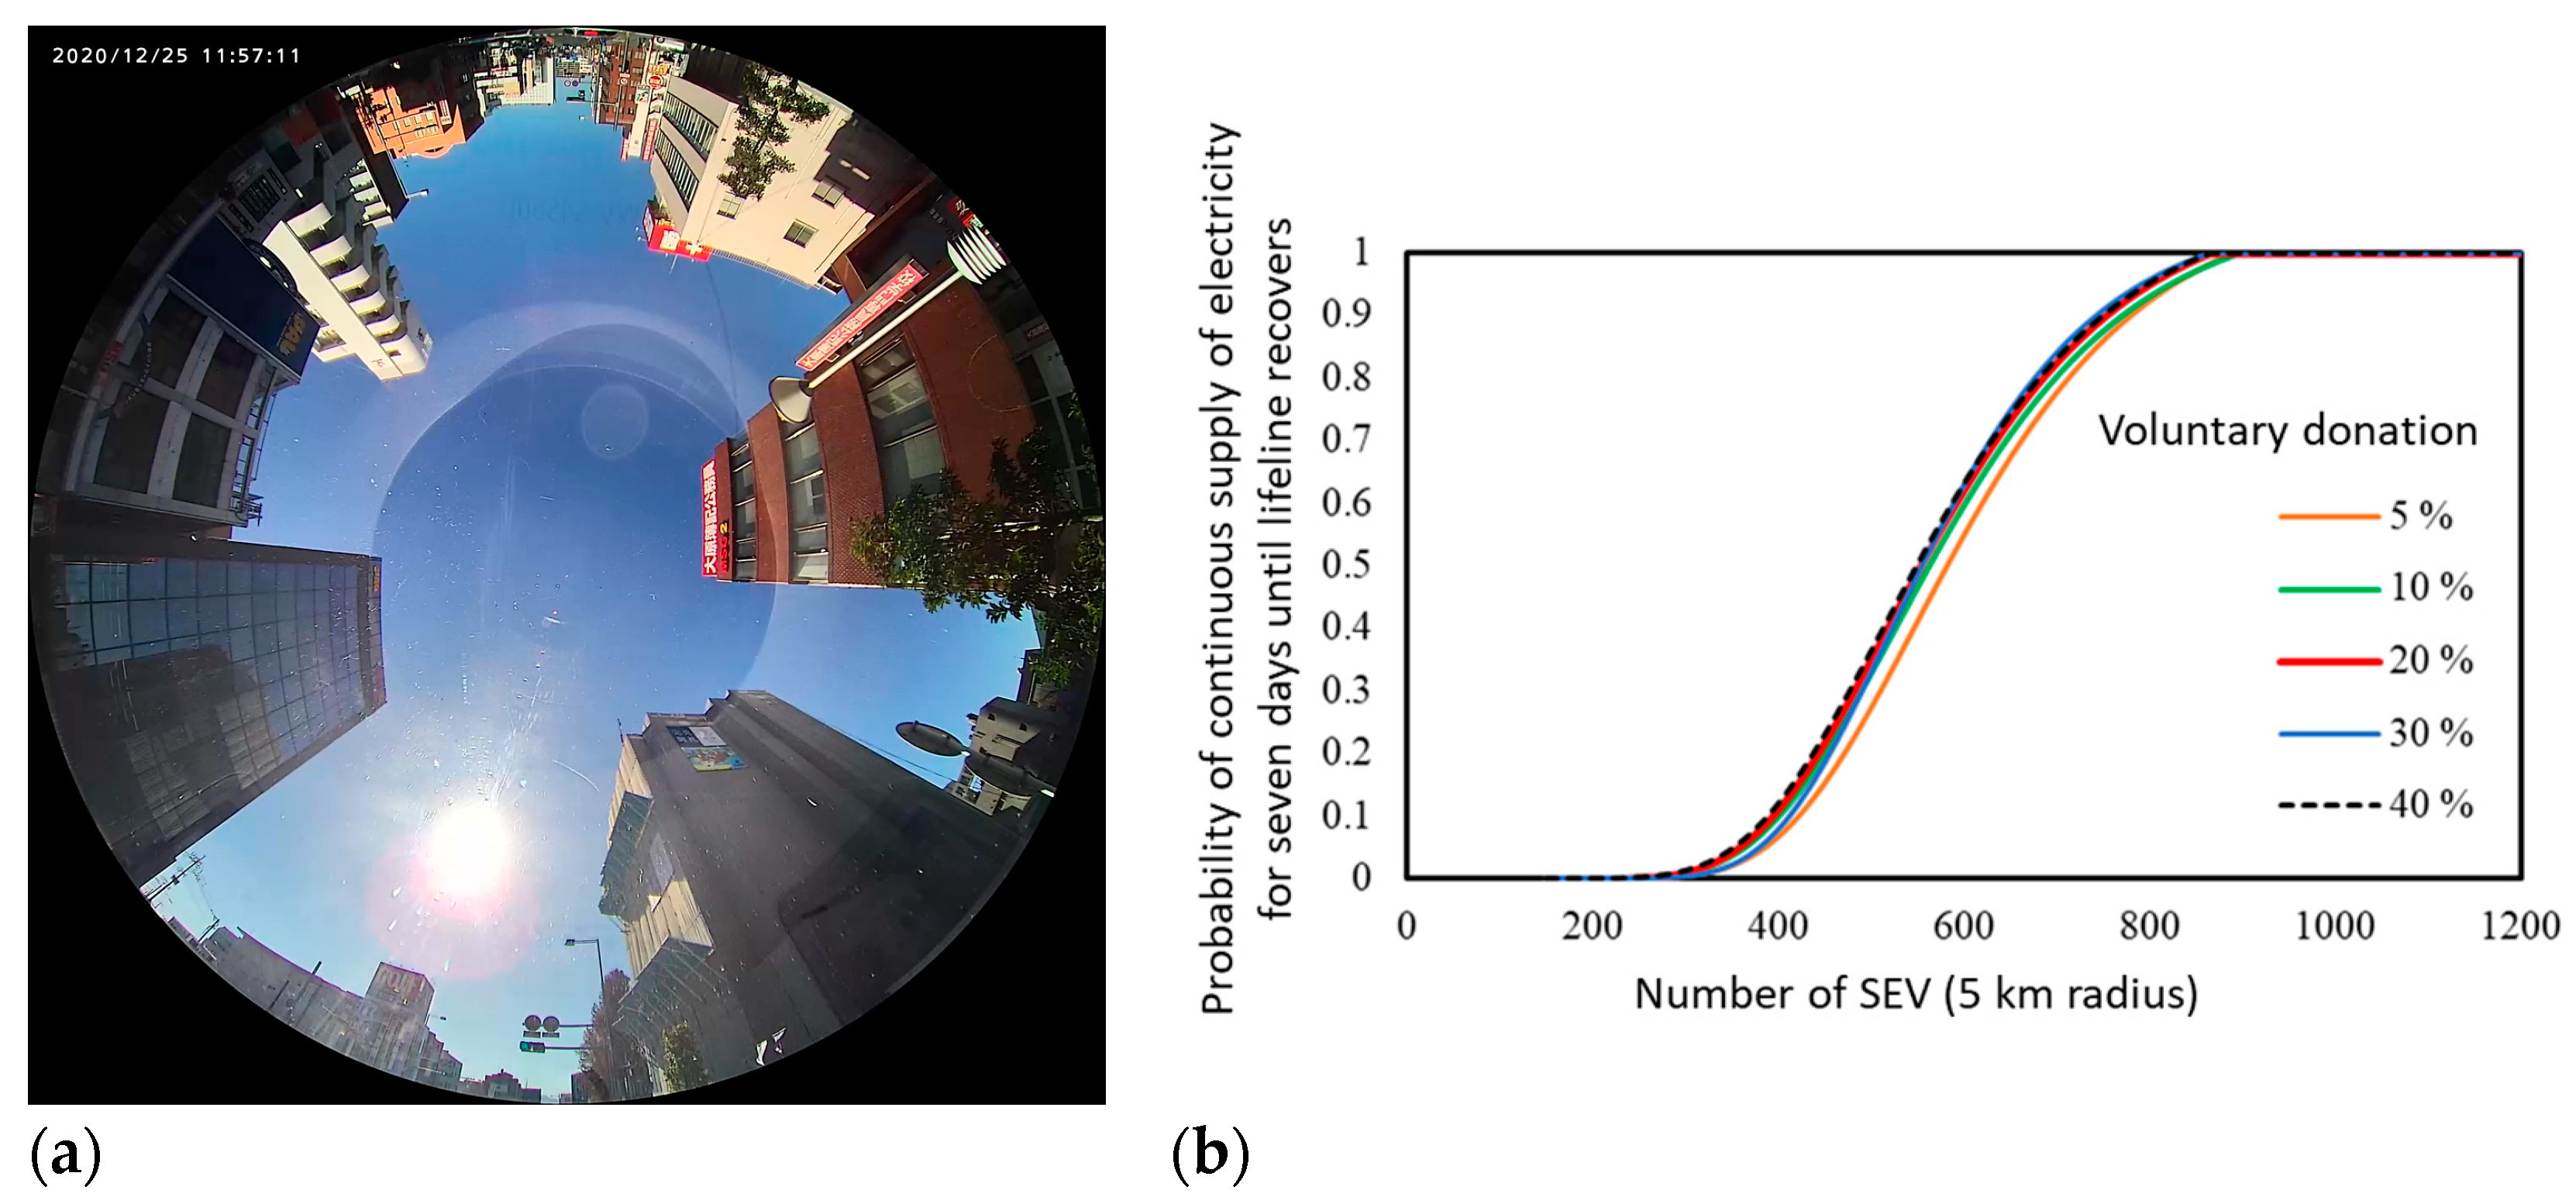
2.6. Shading Correction of VIPV Performance

Unlike the typical installation of PV on land or rooftops, the orientation of the VIPV and shaded objects varies with time owing to the movement of the vehicle. The angle of the sun cannot be determined in terms of absolute coordinates in north-south and east-west directions; rather, it is local to the vehicle’s orientation.
The solar irradiance on the horizontal plane (car roof) influenced by substantial shading can be expressed as
I z = S I z + D I z + R I z
where I z is the irradiance on the vehicle roof, S I z is the diffused irradiance on the vehicle roof, D I z is the direct irradiance on the vehicle roof, and R I z is the reflected irradiance on the vehicle roof.
The impact of the curved surface was analyzed by quantifying the distribution of the shading objects, calculating the solar irradiance affected by the nonuniform distribution of the shading objects, and validating the model by comparison with the measured and computed irradiance by shading probability distributions, including the analysis of the building valley [67], shading probability in various areas [68], and standardization of energy rating [69]. The distribution function for shading probability is defined using Equation (2). The details of the distribution functions are discussed in the Results section, including the measurement of the shading probability and the validation of the power output affected by the nonuniform shading distribution.
F x = 1 1 1 + e x p x μ s s
where F x is the shading probability and x is the grazing angle from the vehicle roof, μ s is the mean shading height (grazing angle that provides a 50% shading probability), and s is the degree of variation of the curve. Note that the parameters of the front-rear and left-right orientations vary owing to the asymmetrical distribution of the shading objects [70].
The solar irradiation using shading probability can be calculated as follows:
S I z = S H I · S V F
D I z = D N I · s i n θ · 1 F x θ + F y θ 2
R I z = S I x + S I y + D I x + D I y 2 · R v · 1 S V F
where S I z is diffused irradiance on the vehicle roof, S I x is the diffused irradiance on the vehicle’s front-rear surface, S I y is the diffused irradiance on the vehicle’s left-right sides, D I z is the direct irradiance on the vehicle roof, θ is sun height, and D I x is the direct irradiance on the vehicle’s front-rear surface. D I y is the direct irradiance on the left-right side of the vehicle, R I z is the reflected irradiance on the vehicle roof, F x θ is the shading probability in the front-rear direction, F y θ is the shading probability in the left-right direction, and R v is the reflectance of the vertical structure (generally 0.25).
The vehicle orientation was assumed to be random (uniform distribution from 0° to 360°). S I x + S I y + D I x + D I y were calculated using Equations (6)–(9):
The side irradiances for the front-rear surface can be calculated using Equation (6). Furthermore, the other sides (left and right sides) can be calculated using Equation (6) by replacing the subscript x with y.
I x = S I x + D I x + R I x + R I s
S I x = S H I · 0 ° 90 ° 1 F x θ · c o s 2 θ d θ 90 °
D I x = D N I · c o s θ · 1 F x θ 4
R I x = R v · S I x + D I x 360 ° · 0 ° 90 ° F x θ · c o s 2 θ d θ
R I s = R s · I z 2
where I x , S I x , D I x , and R I x are the irradiance, diffused irradiance, direct irradiance, and reflected irradiance, respectively, on the front-rear surface of the vehicle, R s is the reflectance of the horizontal structures (roads), which is generally 0.08, and R I s is the irradiance reflected by the surrounding horizontal structures (roads).
The following additional factors—although they have an effect on solar cell performance—were not considered in the analysis because they are at least one order of magnitude more negligible than the factors in determining the energy yield: mismatching loss induced by spectrum mismatch (building shadows), nonuniform illumination in the range of the solar cell, and partial-shading loss.
The leading cause of mismatch loss is the inherent nonuniform illumination of curved surfaces [68,71]. However, the use of high-efficiency tandem solar cells induces a spectrum mismatch. The primary calculation method, which was proposed by Ekins-Daukes [72], depends on the number of junctions [73]. Experimental validation using non-concentration solar cells for VIPV was performed by Tawa [74]. accounting for radiation coupling [75]. This has also been examined using on-Si tandem cells [76] and three-junction cells [77]. The impact of nonuniform illumination is sometimes observed in the range of solar cells [78]. Partial shading caused by street trees, the edges of buildings, and other small shading objects are other important causes of mismatch loss in VIPV [79].

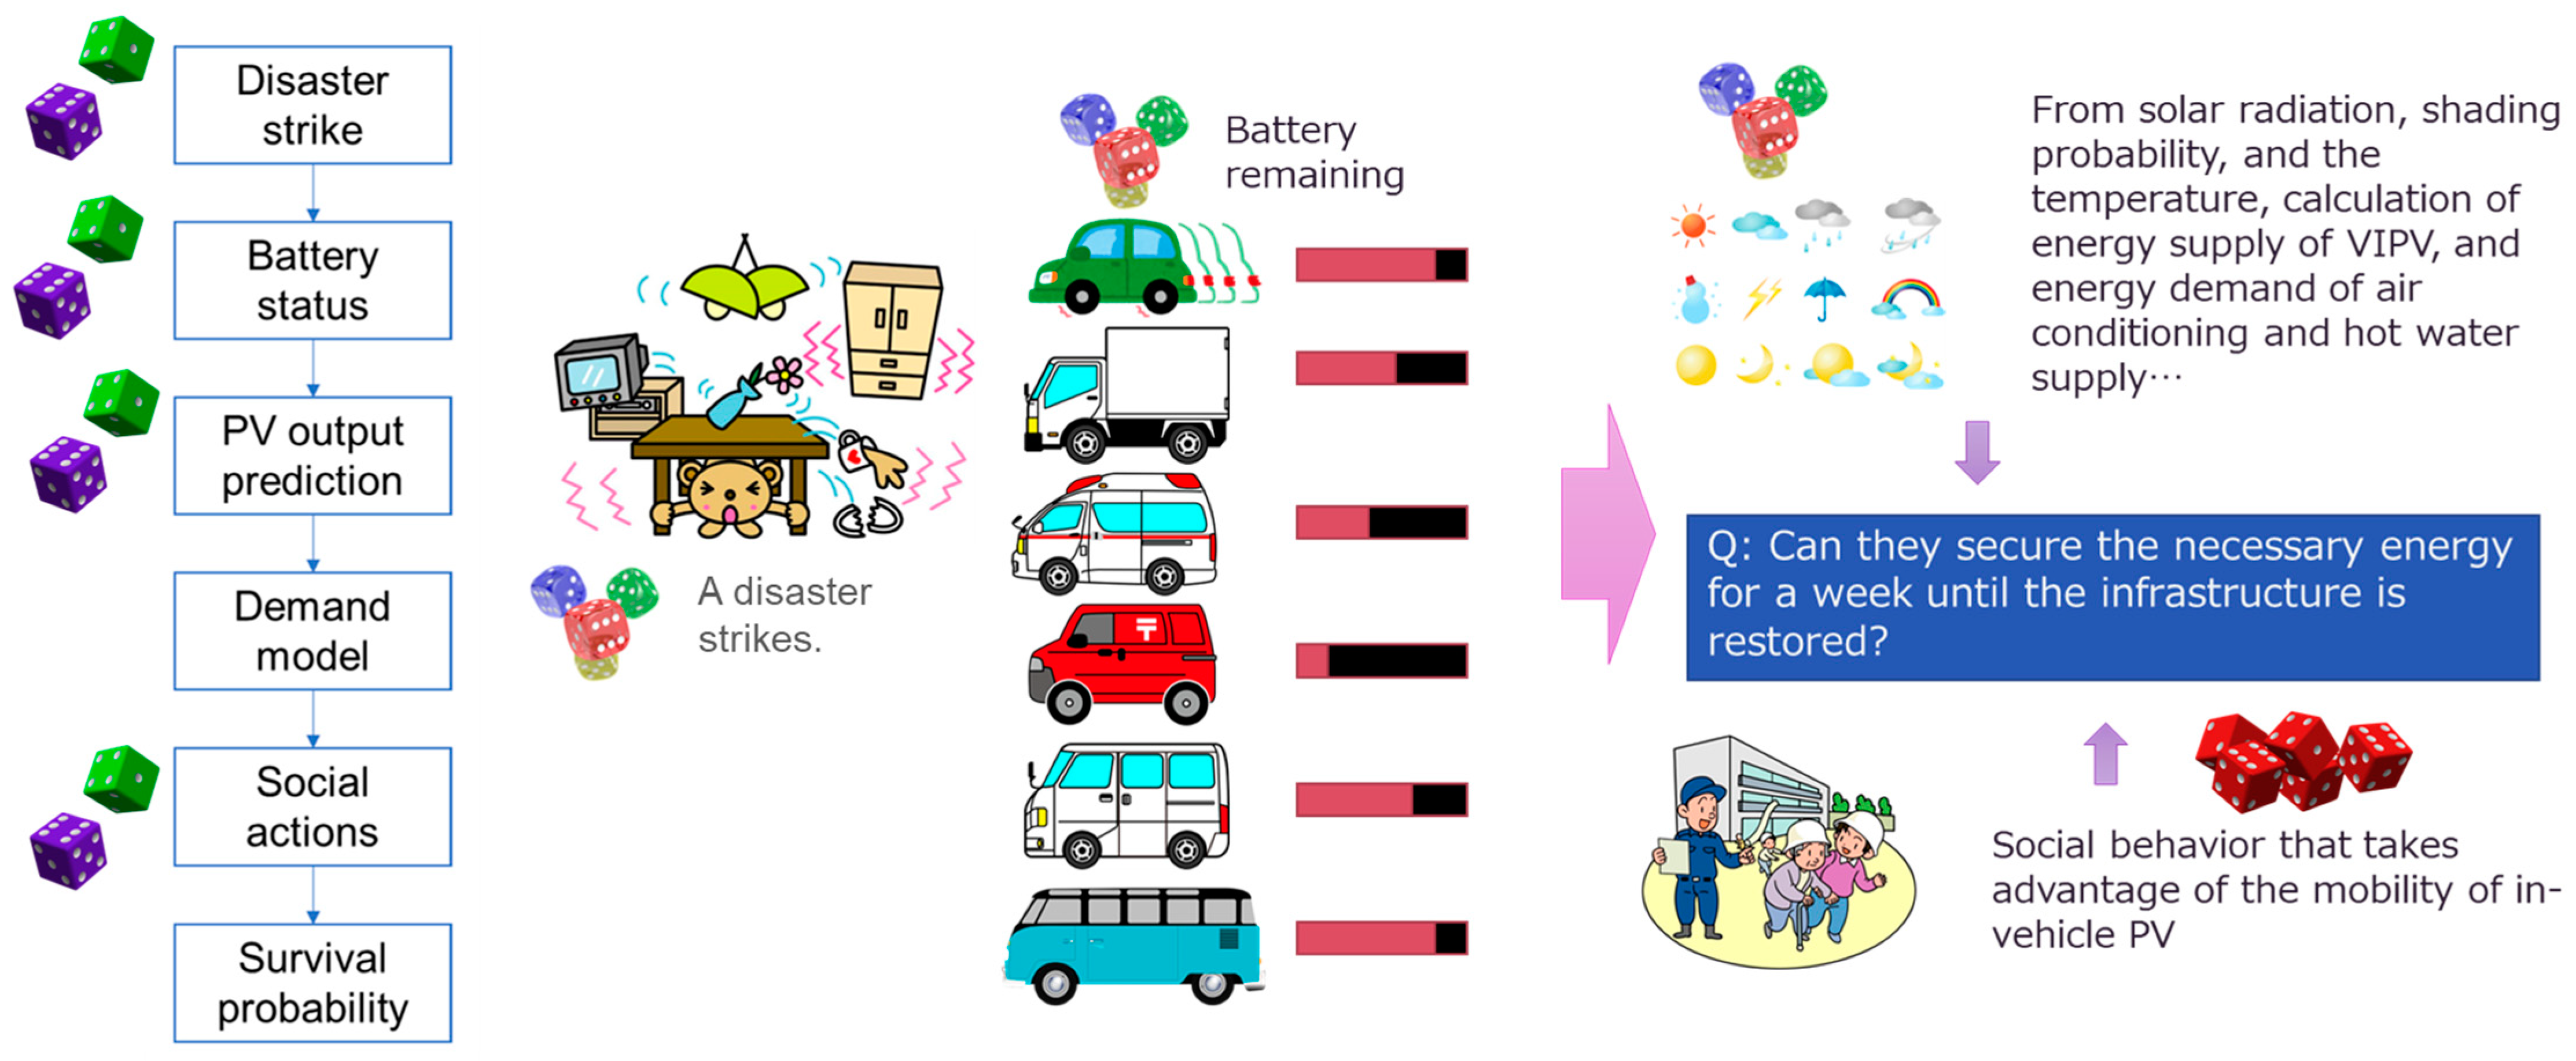
2.7. Monte-Carlo Simulation with Social Activities

A Monte Carlo simulation was performed, taking into account human activities (Figure 4). Random numbers, such as those generated by throwing dice, provide parameters related to the disaster events and the states of each SEV. Dice-throwing provides the date and time of the earthquake. The dice also provide the battery status of each vehicle as well as climate and solar irradiation data, considering the deviation from the average year.
Most importantly, human activity was simulated as follows:
  • SEV drivers check the state of charge (SoC) hourly;
  • If the SoC does not exceed 90%, then the SEV driver does not consider energy donation;
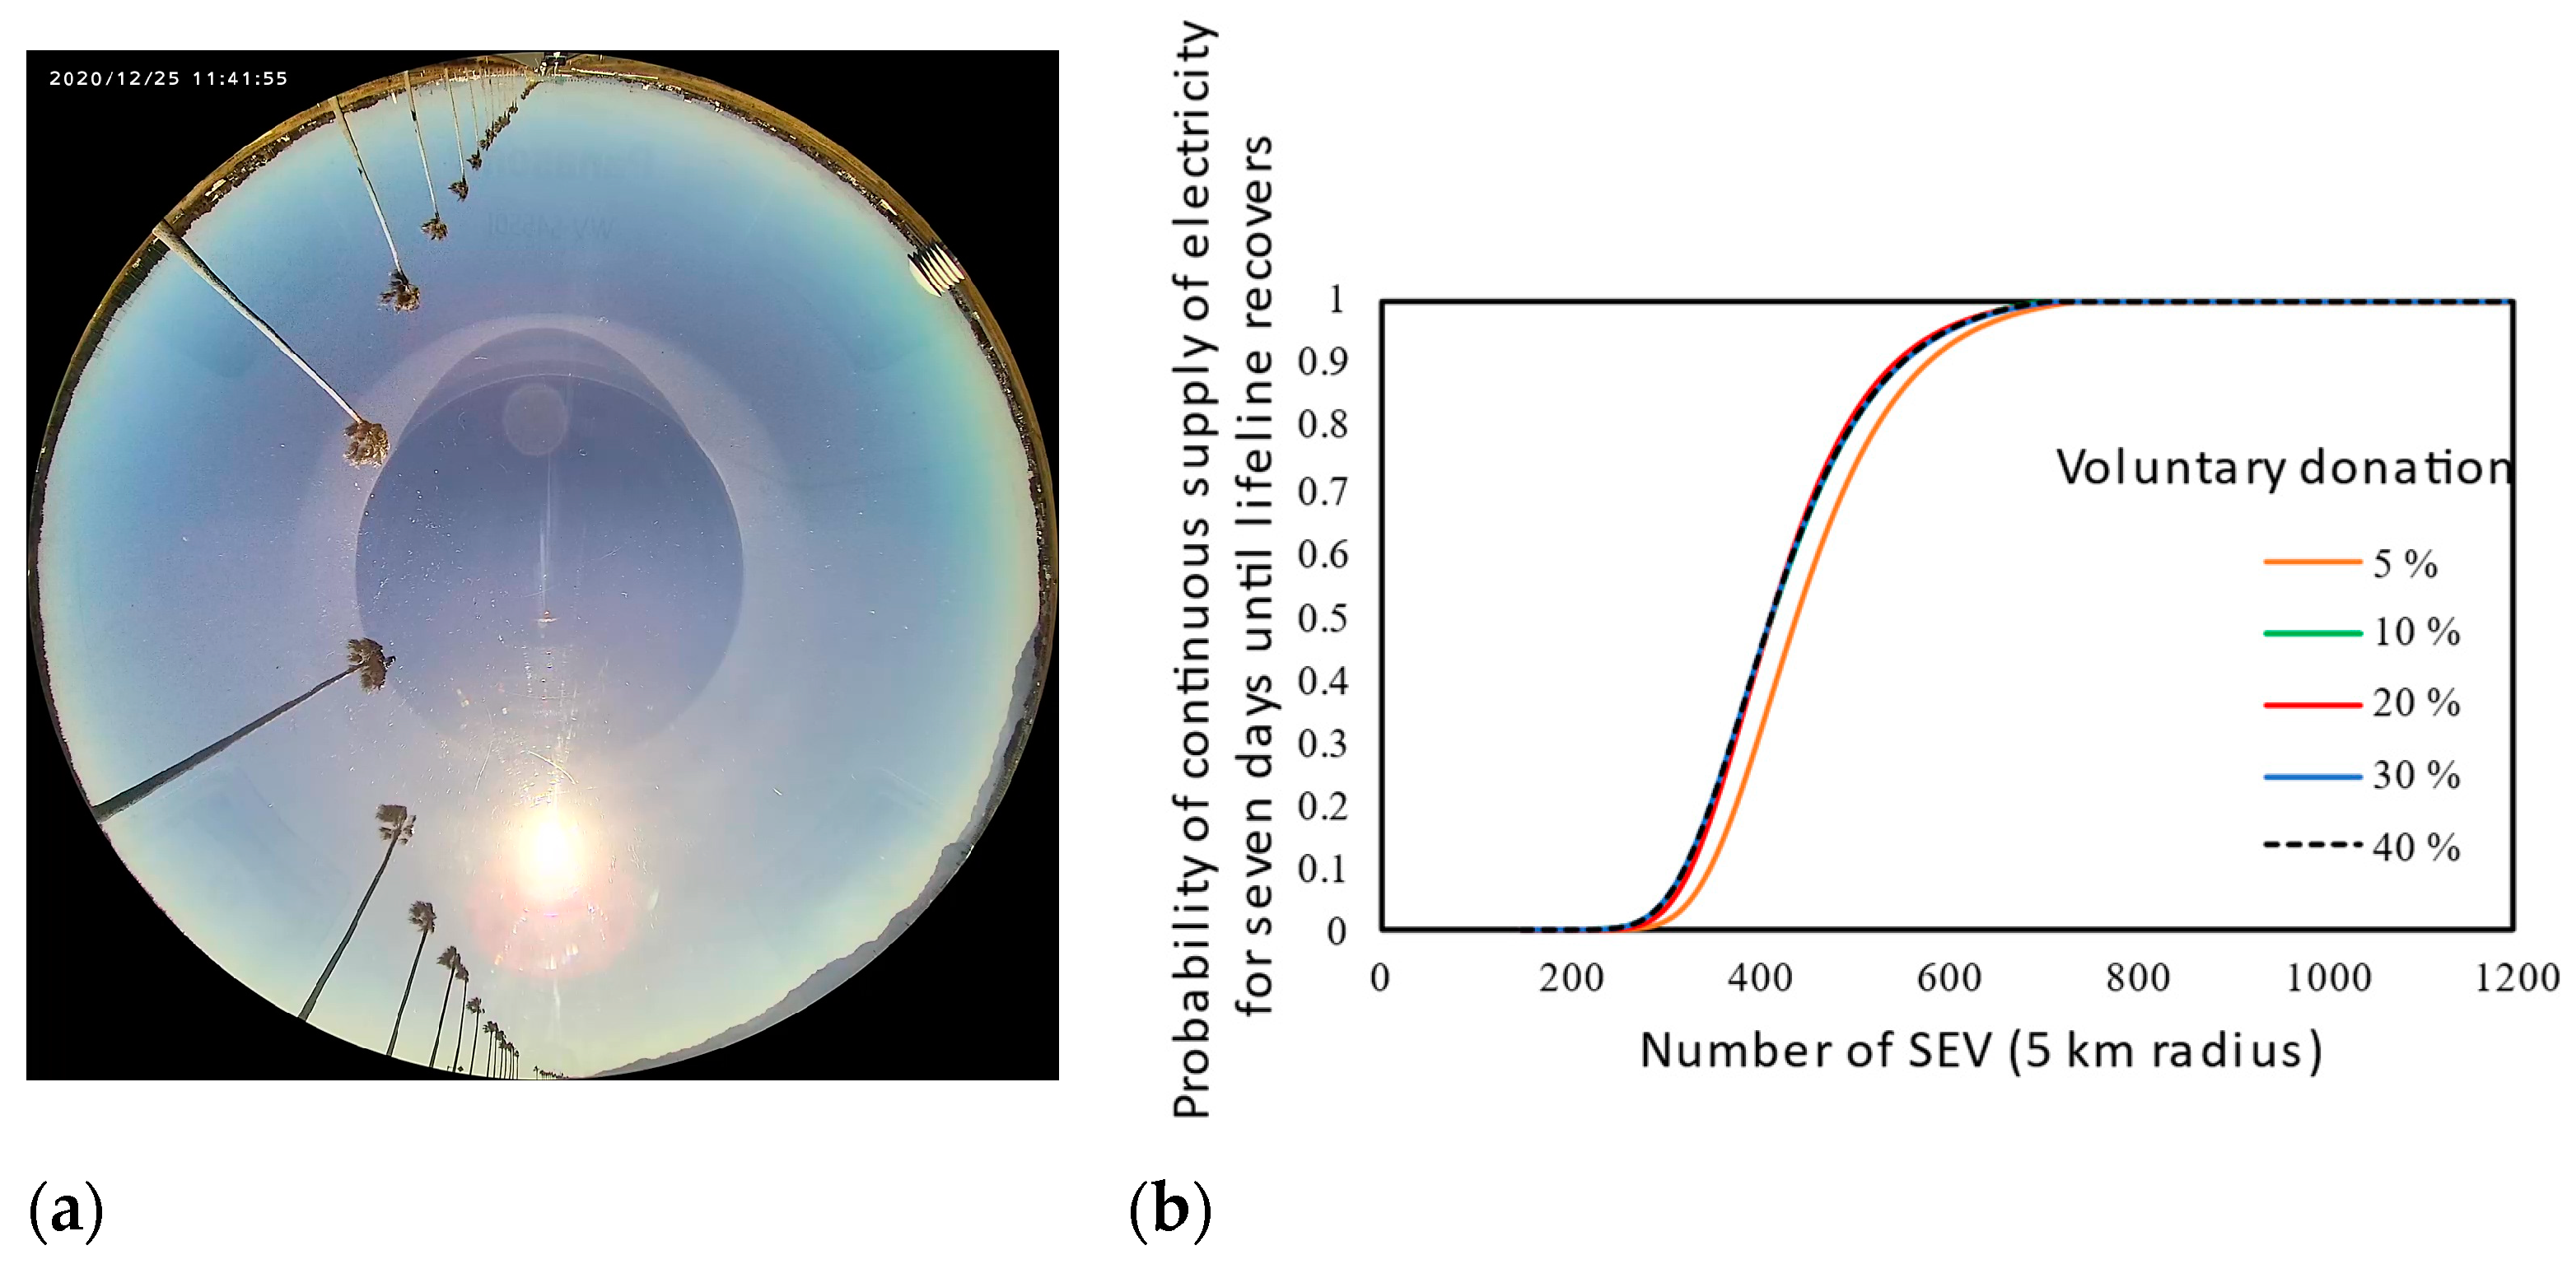
  • If the SoC exceeds 90%, 5% of drivers in this situation will donate energy, coin toss to randomly determine (5% probability) determine if a driver will donate; and
  • The SEV drivers who decide to donate energy to resilient facilities supported by the VIPV, consume energy to move to the facility, donated energy (up to 50% SoC), and return to their original places.
In Table 4, the parameters that were varied using random numbers and those related to human activity are shown. In Table 5, the constant parameters used in the calculations are listed. Some parameters are crucial, but affect the rule of proportion, and the mean value of the distribution (constant value) works as the representative value. These parameters were not considered probability variables and were not controlled by the dice. For example, the battery capacity of each SEV was given as a constant value; however, the total energy resources are proportional to the mean capacity of the EV battery. To avoid unnecessary complexity related to the Monte Carlo method, all parameters affecting the proportional impact were treated as constant values and are listed in Table 5.
Irradiance and climate (temperature and snow cover) affecting VIPV power generation were obtained from the METPV-11 database every hour for 365 days.
Monte Carlo simulations were performed to determine the fate of the PV community, namely, whether it sustained itself for seven days until the lifeline recovered. It is a sequence of five probability processes, starting with the date and time the disaster struck, battery status SoC in each vehicle, VIPV output for seven days, nighttime energy demand, and social actions. If the community succeeds in maintaining the energy supply for public facilities, one can conclude that the community is able to sustain itself until the external lifelines are re-established. The trials were repeated, and success or failure was indicated based on variations in the number of SEV.
The following recurrence formula calculates the SoC of each SEV battery and the resilience facilities supported by the VIPV:
C 1 i + 1 , k S 1 i + 1 , k S i + 1 = m e d i a n 0 , B C , i f C 1 i , k > t h 1 · B C r n d k + i · N c a r 1 < p v S i < m a x D e , t h 2 · B C d c E f f c , C 1 i , k + Q Q 2 i + E v e n t · E f f p · E f f m · E f f P V · A p v i f C 1 i , k > t h 1 · B C r n d k + i · N c a r 1 < p v S i < m a x D e , C 1 i , k t h 2 · B C , 0 k S 1 i , k D e i + S i
where C 1 is a matrix containing the SoC of each vehicle indexed as k and each time indexed as i;  S 1 is a matrix containing the donated energy from each vehicle and each time; S is a vector containing the total energy donated to the resilience facilities at each time indexed by i;  m e d i a n (A, B, C) is a function that returns the median of the elements in A, B, and C, the value above and below which there are an equal number of values when the elements A, B, and C are sorted in ascending order. If the number of values is even, the median is the arithmetic mean of the two central values. B C is the battery capacity of each vehicle; t h 1 is the threshold value of SoC at which each driver considers donating the surplus energy; r n d is a vector containing uniformly distributed random numbers ranging from 0 to 1, and its length is the product of the number of vehicles and length of the time index; Ncar is the number of vehicles; pv is the probability of donation; maxDe is the maximum demand of the resilience facilities; th2 is the threshold of SoC to terminate energy transfer; dc is the driving distance for energy donation; Effc is electric mileage; Q Q 2 is a vector containing effective irradiance onto vehicles; Effp is the energy conversion efficiency of the vehicle; Effm is the maximum power point tracking (MPPT) efficiency; Effpv is the power-conversion efficiency of VIPV; Apv is the projected area of VIPV; Event is the date and time of the disaster attack; and, lastly, D e is a vector containing the demand of energy in the resilience facilities at the time given by the index i.
The following equation calculates the probability that the community maintains its energy supply.
p = j = 0 N t 1 i = 5 l e n g t h S 1 S i > 0 N t
where p is the probability of maintaining the energy supply, Nt is the total number of trials for the Monte Carlo simulation, and l e n g t h S is a function that returns the number of elements in vector S .

3. Results

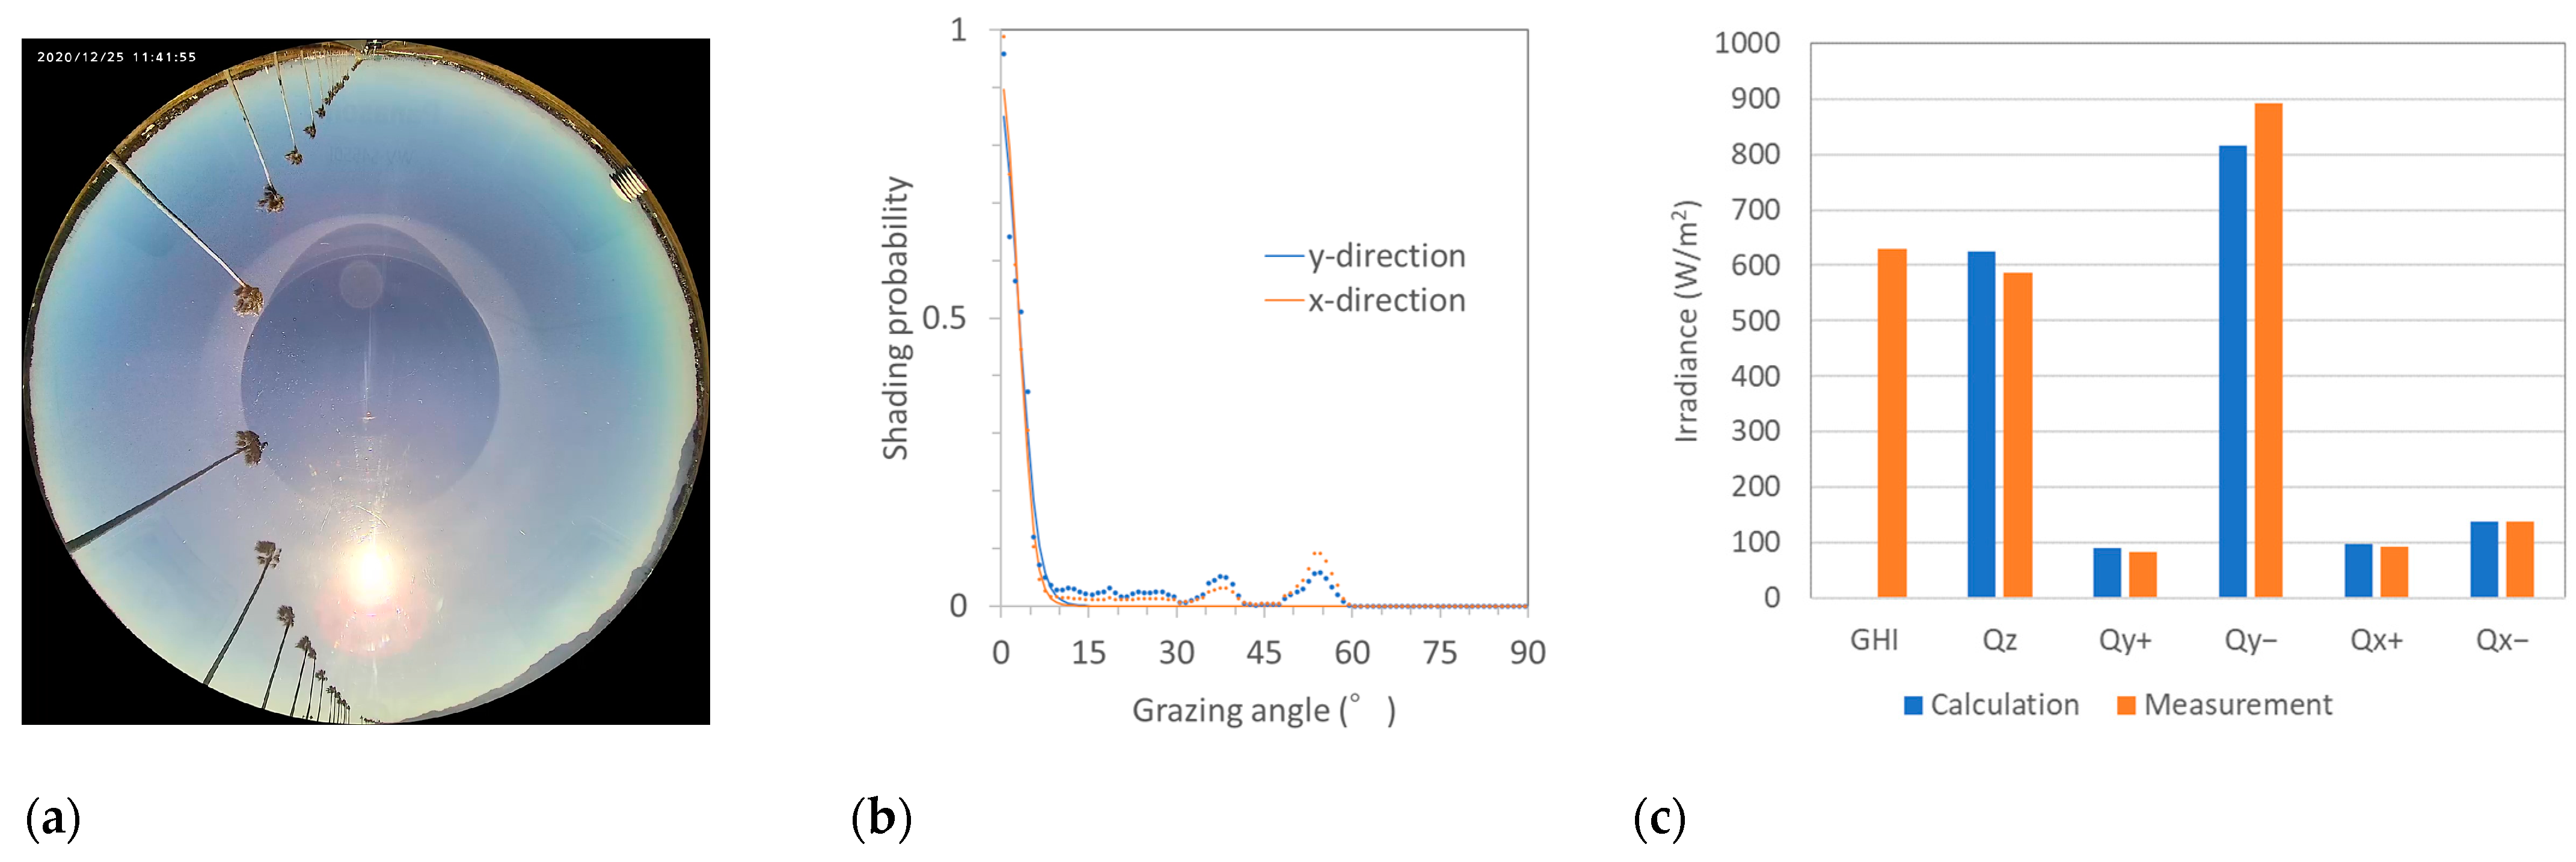
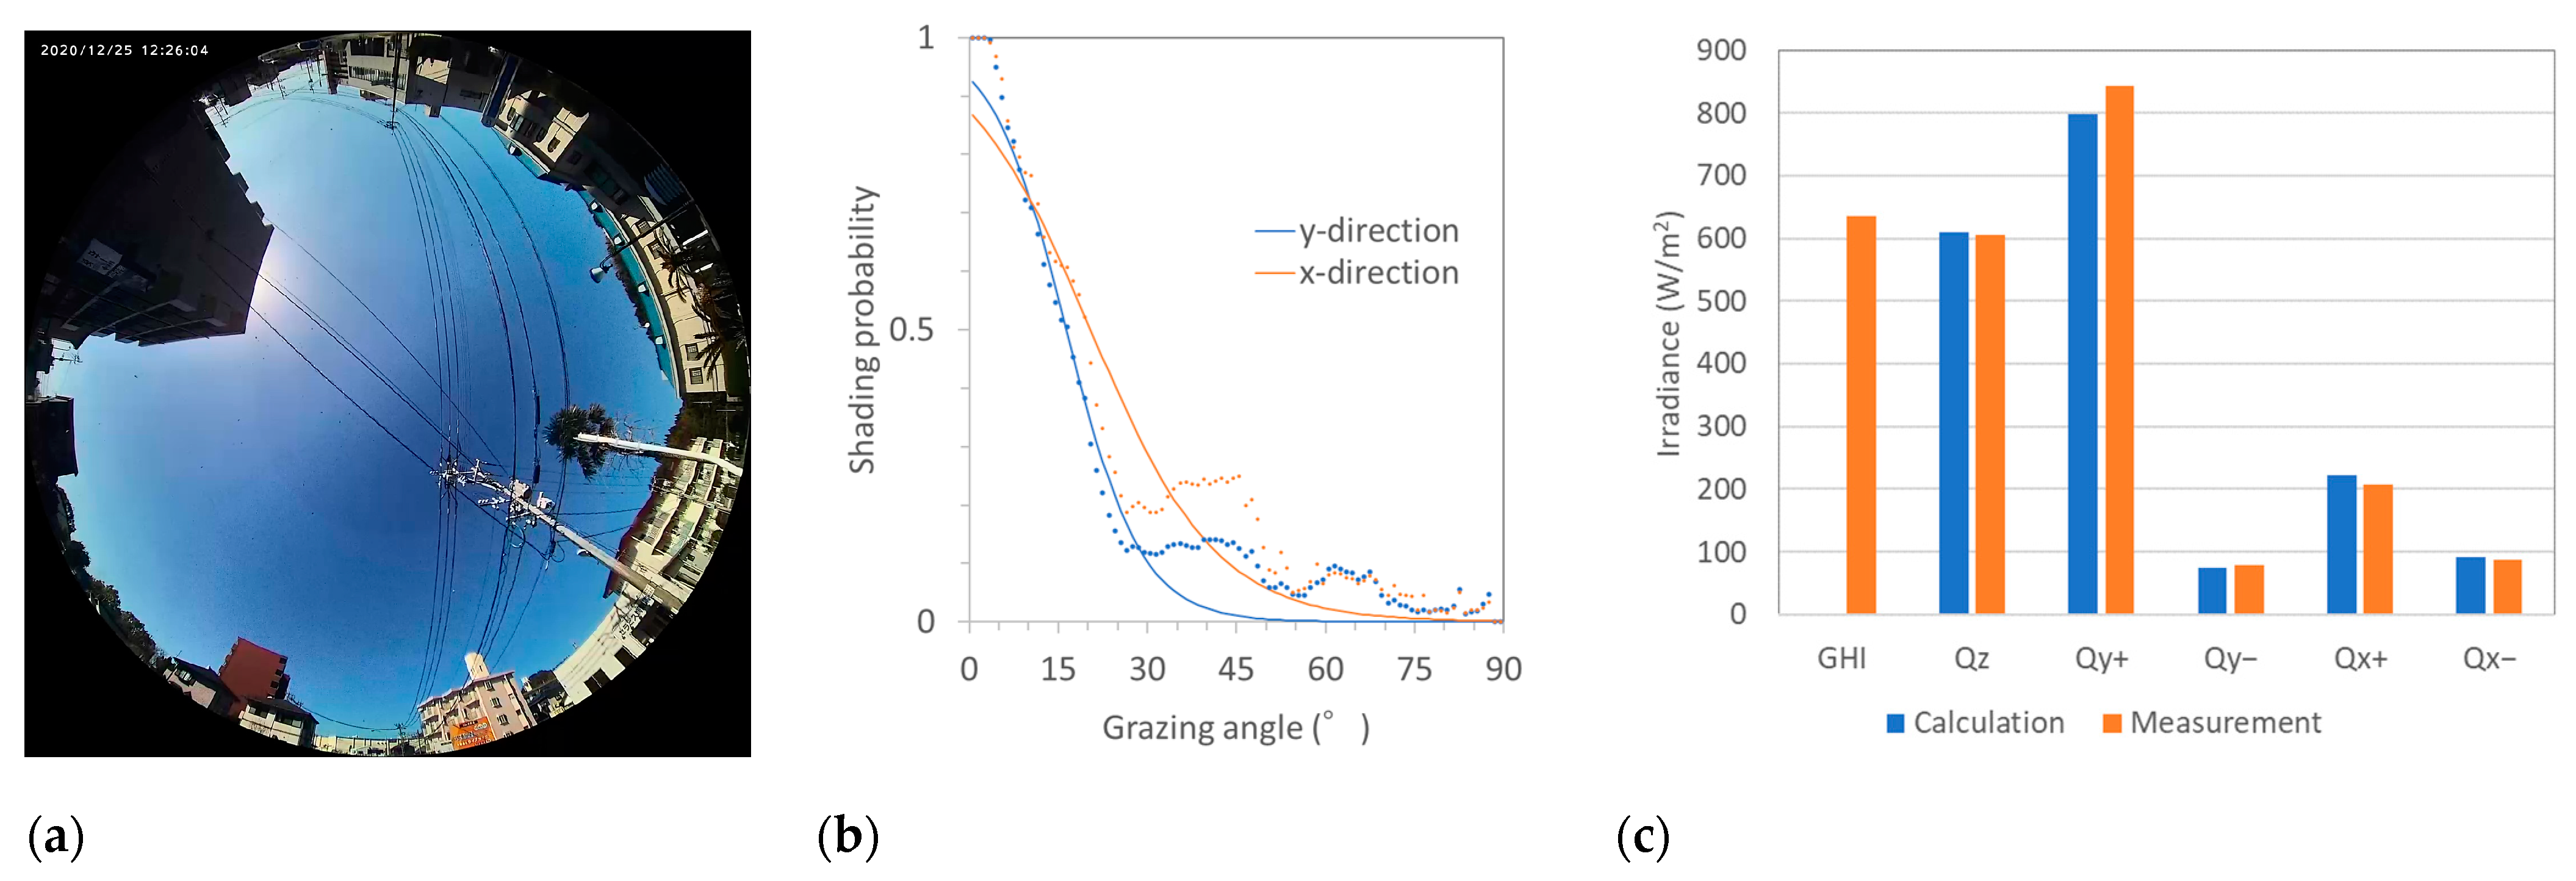
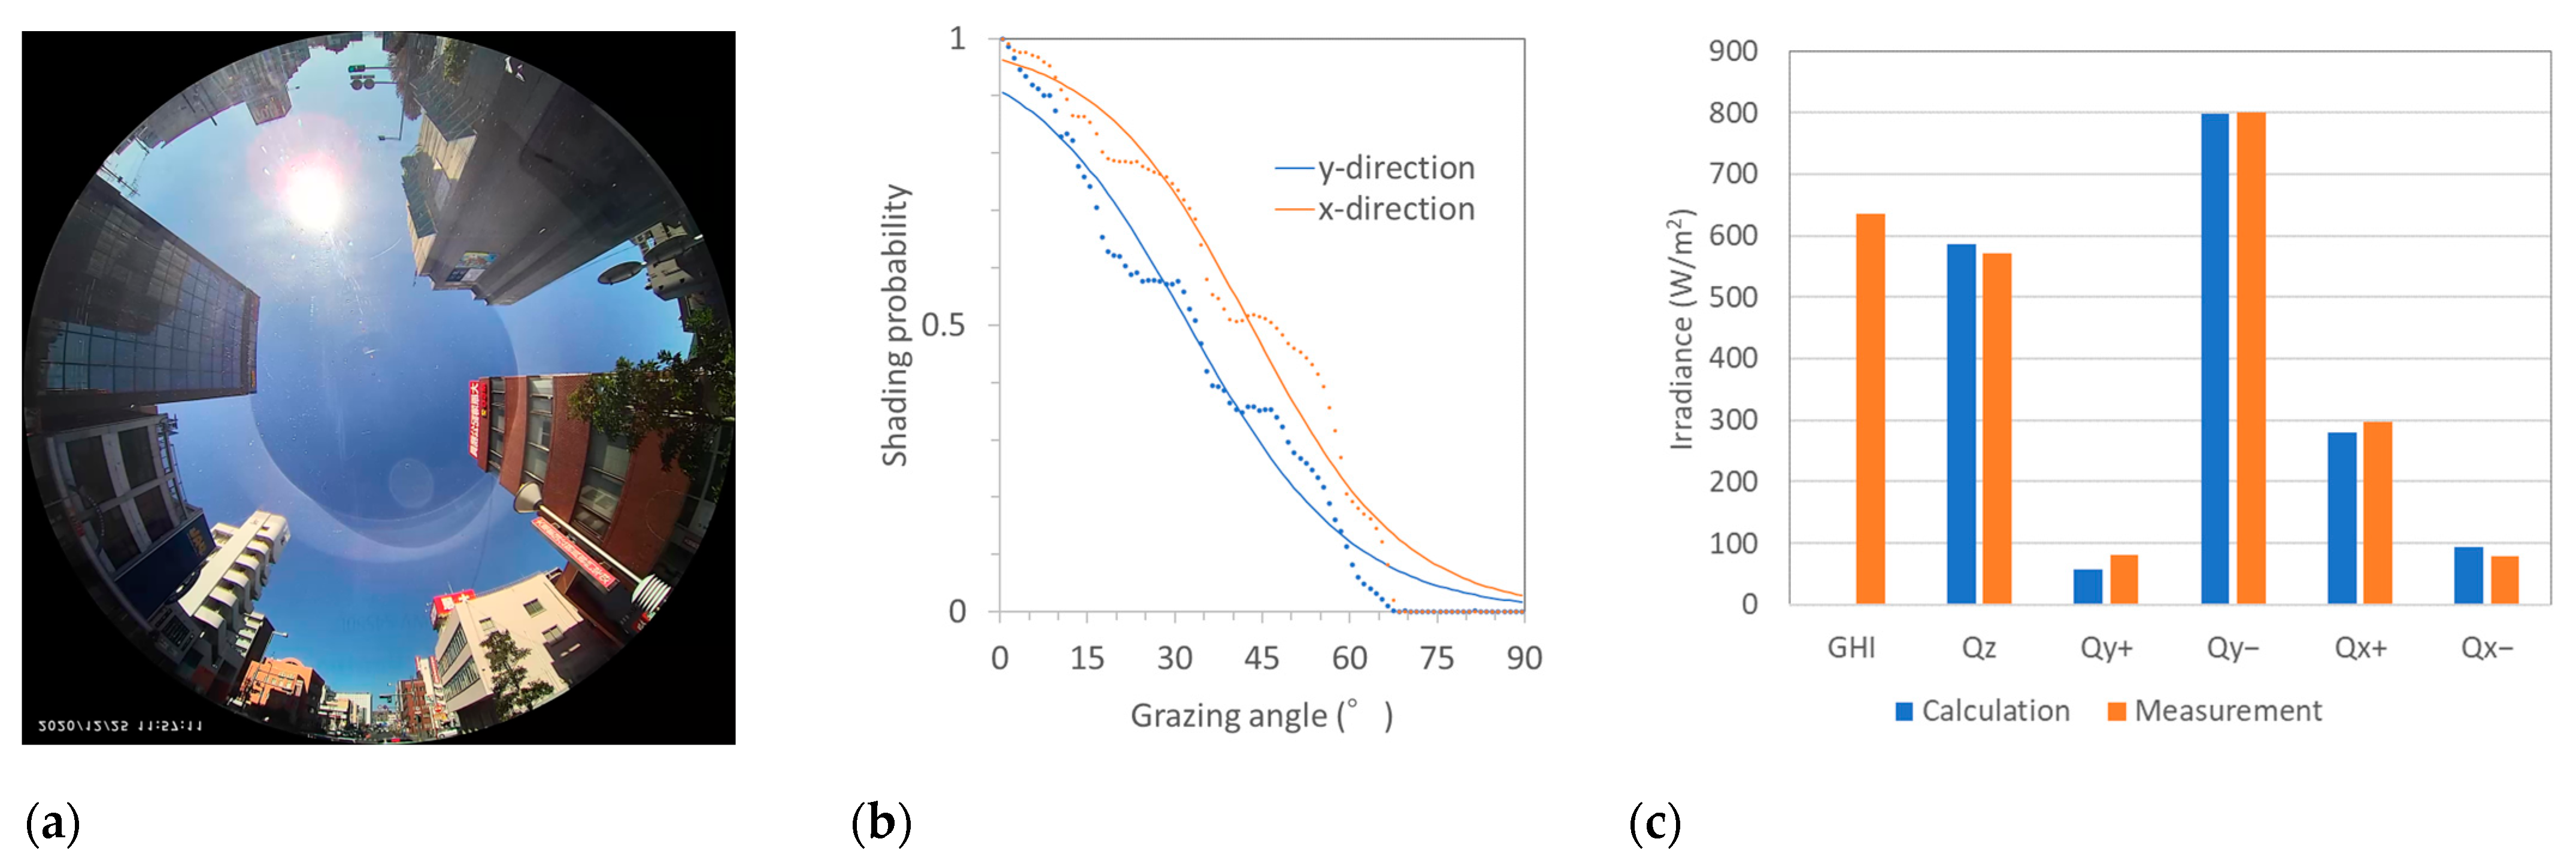
3.1. Measurement and Modeling of the Power of VIPV Affected by Shading Objects

Because SEV and VIPV are frequently shaded and the shadows are not uniform, a shading or aperture matrix is preferable to a shading ratio. The diffused sunlight from the hemispherical sky, including light from multiple reflections between the ground and the sky, was calculated using the integral of the following product:
Diffused sunlight from the hemispherical sky (constant value):
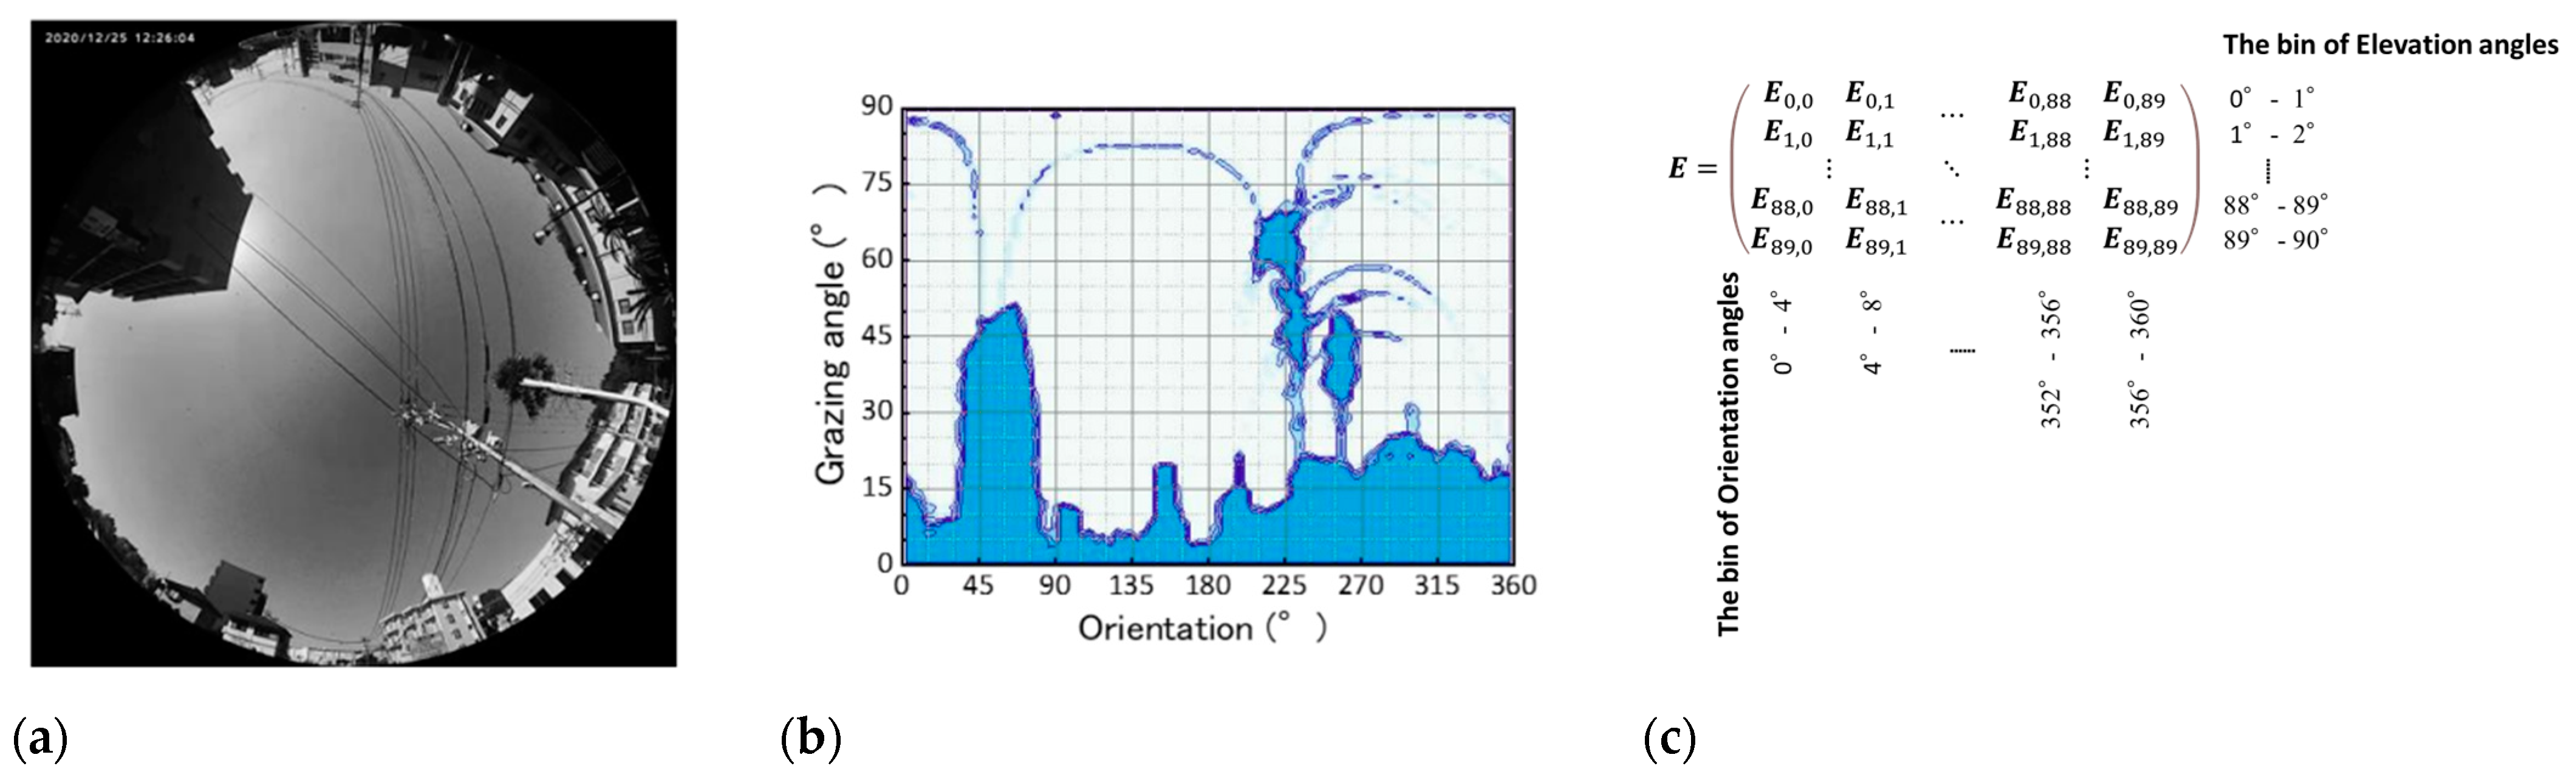
  • Area of each surface element of the hemispherical sky;
  • The aperture and shading ratio varied according to the grazing and orientation angles, given by the matrix form:
  • Cosine of ray from each surface element, cosine of ray relative to unit vector of the surface element of the absorber; and
  • Area of the surface element of the absorber.
Direct sunlight was calculated using the integral of the following product:
  • Direct normal irradiance (constant value);
  • Aperture probability (=0 when shaded and =1 when not shaded);
  • Cosine of the ray to the surface element of the absorber; and
  • Area of the surface element of the absorber.
In the case of reflected sunlight, the following was considered:
  • Reflection of the building wall by direct sunlight, the orientation of the normal vector of the wall is within ±90 ° of the direct ray of sunlight;
  • Reflection of the building wall by the diffused sunlight; and
  • The reflection from the road is given by the product of the reflectivity of the road surface and the horizontal irradiation affected by shading and reflection from the building wall.
The orientations of the reflection surface and absorbers differed, and further cosine corrections were required to illuminate the building wall.
If the focus is on the roof irradiance (moving local GHI influenced by moving shading objects), then redundant measurements in the other four directions help validate the irradiance model. In principle, instruments are attached to a car’s body to monitor solar resources and the characteristics of photovoltaic devices while driving. However, some measurements cannot be obtained by mounting instruments on the car body and can be obtained by conversion from stationary measurements. The horizontal irradiance should be measured at least; however, the simultaneous measurement of the four sides of the vertical irradiance is highly recommended. Multiple pyranometers can be conveniently installed on the car body such that the instrument assembly can perform different measurements in different shading environments (Figure 5).
The 5-axis measurement data are the basis of the angular distribution of solar irradiance on the car, which is a good indicator of the performance of the PV system as an automobile product and the optimized design of the solar power system [70].
In addition, the 5-axis measurement is helpful in the following aspects:
  • Direct indication of solar irradiance for PV panels on the roof and side(s) of the vehicle;
  • Shading detection was compared with the direction information obtained by comparing four monitored irradiances on the side(s) of the vehicle;
  • Three-dimensional solar-resource monitoring, including the angular distribution of solar resources on the roof of a vehicle, is essential for characterizing curved modules; and
  • The performance and solar irradiance models for the VIPV were validated by checking more than two orthogonal axes using monitored data in five orthogonal directions.
The distribution of shading probability using a fisheye video of a car roof was investigated as a function of the grazing angle and orientation angle (Figure 6). Images of buildings and other shaded objects were analyzed, and the generated cumulative probability curves varied according to the environment around the car (Figure 7). The shading probability was classified into three groups: open, residential, and building zones. The standard shading probability curves help predict the energy generation (Figure 8, Figure 9 and Figure 10). The shading probability trends were projected on the x- and y-axes (Figure 6a and Figure 7), with the weighting cosine of the orientation angle to each axis and fitted to Equation (2) (Figure 8, Figure 9 and Figure 10b). The solar irradiance calculation on the five orthogonal axes in Figure 8, Figure 9 and Figure 10c was performed by extending the scalar of the shading ratio and sky view factor to the matrix form, as shown in Figure 7c.
The solar irradiance on the 3D car body was validated by comparing the measured irradiance with the calculated irradiance using the observed shading (aperture) matrix in the (1) open zone, (2) residential zone, and (3) building zone (Figure 8, Figure 9 and Figure 10) as a function of the grazing angle (Figure 6). Note that the shading probability varies between the front and left sides of the vehicle because shading objects such as buildings and street trees are distributed along the street parallel to the front-tail direction of the vehicles. The solar irradiance was close to the calculated value regardless of the car’s orientation and environment. The shading probability was approximated by Equation (2), and the categorized in three zones (Figure 11).

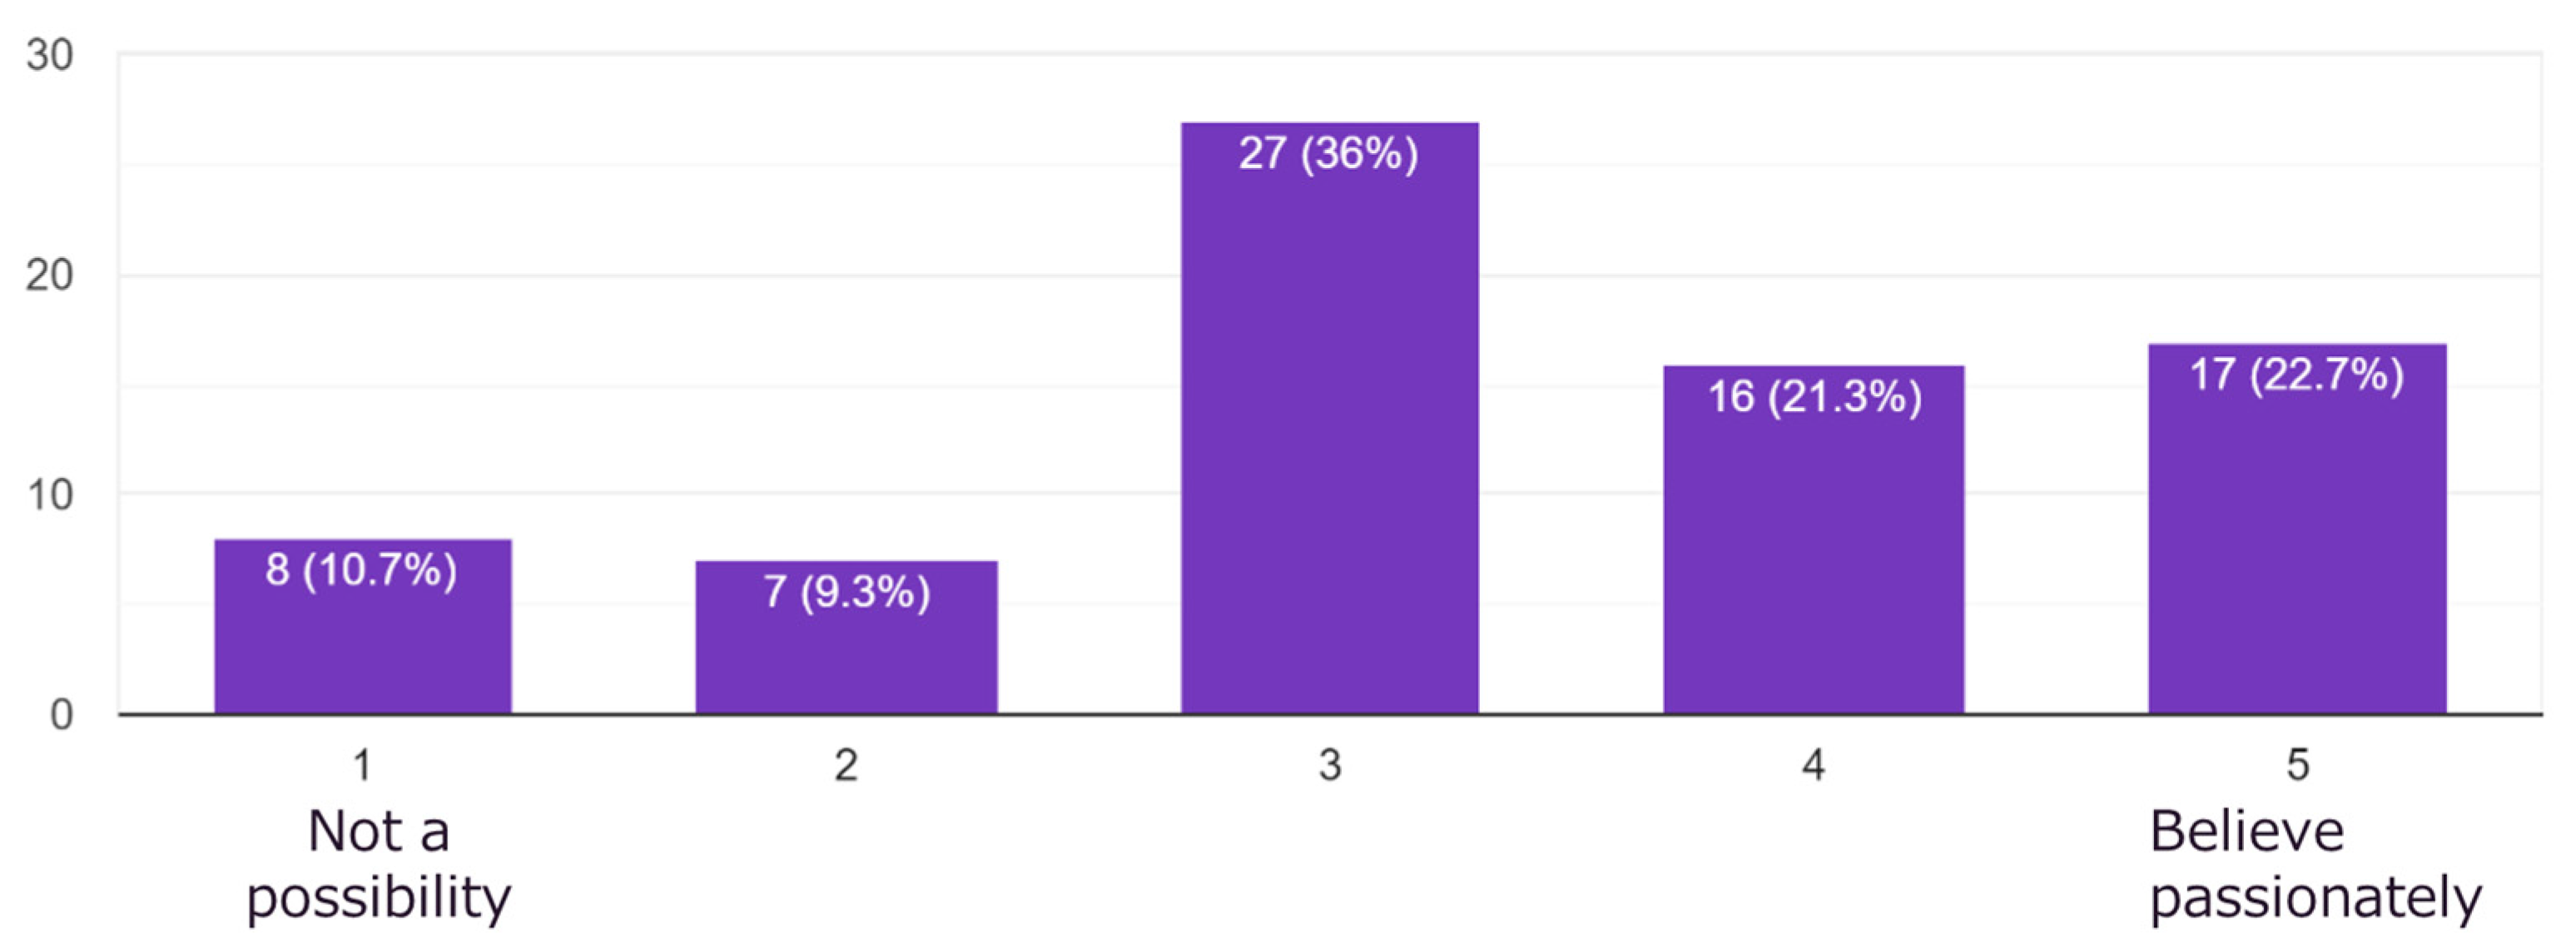
3.2. Survey of the Local Community: Willingness to Donate for Disaster Resilience

The results of the community survey are shown in Figure 12. Some respondents said that no one would want to donate the electricity saved in SEVs. Others noted that 5% of the respondents were too pessimistic. The percentage of residents who would voluntarily donate was investigated by the parents of students attending a local junior high school near the University of Miyazaki (Figure 12). Question: Suppose that you have an EV. Would you like to provide electricity to shelters that lack it? A total of 75 participants completed the questionnaire.
More than 40% said that they would be optimistic about donating electricity to public facilities in the event of a disaster. Again, the first assumption is 5% for SoC > 90% SoC. In the case of the community of Miyazaki, energy resilience systems based on VIPV and SEV energy supply and voluntary mutual support are a realistic expectation.

3.3. Monte-Carlo Simulation Results

One of the time-series variations in the energy storage status of the battery in all the resilience facilities is shown in Figure 13. The time-series trend varied when the dice were thrown; however, this case is representative. The remaining battery charging fluctuated over 24 h of the cycle time; that is, fewer charges were incurred at night and more during the day. The peak and bottom values varied with irradiation on that day. A sunny day increases the likelihood of sustaining a battery the following night.
The irradiation trend in Miyazaki, Japan (semi-tropical zone) is shown in Figure 14. Although Miyazaki has a mild climate, it experiences low solar irradiance during winter and unstable irradiance during summer. The winter in Miyazaki was the worst season in terms of resilience. These shortages and uncertainties affect the probability of maintaining energy supply for a week, until the lifeline recovers.
The probability of sustaining the community over seven days was plotted as a function of the number of SEVs after approximately 10,000 trials in a shaded environment within the residential zone. The logistic curves approximated the probability curves, and the required number of SEVs was approximately 720 in a 5 km radius, which is approximately 1/70 of the population density of Miyazaki City (Figure 15). The curve shape of the logistic curves, specifically the slope and 50% points (Equation (2)), varied by season and duration, and the required SEV for the one-week self-sustaining period was lower in summer and higher in winter.
The same types of simulations were attempted in three zones (open, residential, and building) by varying the ratio of voluntary donations (Figure 16, Figure 17 and Figure 18). The required number of SEVs did not increase when the probability of contribution exceeded 10%; however, it started to decrease at 5%. This was likely because the total energy of the SEVs dominated the baseline probability.

4. Discussion

The case study in the previous section was that of the city of Miyazaki, which might vary by climate and irradiance in other areas. Many authors have studied the energy yield of PV, which is a standard approach for their typical installation mode. However, the energy yield of VIPV is affected by many factors, and a simple extension of the standard energy calculation may not be effective.
The calculation of solar irradiance on the car roof (Equations (1)–(10)) was applied to other areas of the METPV-11 solar database [80,81], considering the driving zone category (Figure 19). The calculation covered 830 sites ranging from the subpolar zone to the subtropical zone, N45° to N24° latitude.
Surprisingly, the energy yield of the VIPV varied mainly according to the zone difference (building zone, residential zone, and open zone), rather than the difference in the climate zone and latitude. The calculation results of this study are concentrated in the city of Miyazaki. However, the results from Miyazaki can be applied to other areas, at least between the subpolar zone and the subtropical site, as shown in Figure 19.
For more realistic and transparent guidelines, a dataset should be developed to aid policymakers in making more transparent and flexible decisions regarding resilience. Another concern is the social model: what is needed is an intensive examination of variations in social activities. The safety factors represent the uncertainty calculated using Monte Carlo simulations (Figure 20).

5. Conclusions

VIPV, compared to ordinary BEV and static PV systems, has several essential advantages in designing resilient energy systems.
Compared with BEVs:
  • Lower risk of an empty battery in VIPV vehicles;
  • In BEV vehicles, once the battery is drained, the possibility of energy donation is nil; and
  • VIPV makes possible self-generating energy for transportation to the point of relief.
Compared with static PV:
  • Lower risk of damage (direct or indirect);
  • No trouble with the utility grid or electric cables;
  • Avoids reliance on a single centralized PV system (“all or nothing”);
  • Units can move to areas of higher irradiance;
  • Units can transport both energy and goods; and
  • Energy accommodation is possible by carrying energy by vehicles.
A unique advantage of SEV-based resilience is that energy can be collected through voluntary contributions. The practicality of the scenario was investigated using Monte Carlo simulation (as described in the Methods section).
The irradiance on the vehicle varies substantially depending on the shading environment. A shading matrix was used to investigate 3D solar irradiation on the car body by orthogonal 5-axes with a new model and calculation considering the nonuniform shading ratio. The calculation results met the measurement requirements and were applied to a Monte Carlo simulation considering social activities.
As a result of the Monte Carlo simulation considering the variation in the shading environment around the vehicles, SEV and VIPV (or a combination of PV and transport) are helpful for resilience regardless of the open, residential, and building zones. A density of approximately 13 SEVs per square kilometer (1000 SEVs in a 5 km radius) is sufficient to support temporary resilience facilities (one temporary shelter with medical care, six spot air conditioners for care homes and community halls, and twenty-five charging stations for mobile devices).
In Table 6, the required SEV and fixed parameter values are shown. The fixed parameters proportionally affect the calculation results. For example, if the VIPV efficiency doubles, the required SEV is halved.

Author Contributions

Conceptualization, K.A. and Y.O.; methodology, K.A. and M.K.; software, K.A. and A.M.; validation, Y.O., A.M. and M.K.; formal analysis, K.A.; investigation, Y.O., A.M. and M.K.; resources, K.N.; data curation, K.A.; writing—original draft preparation, K.A.; writing—review and editing, Y.O. and M.K.; visualization, K.A. and A.M.; supervision, K.N.; project administration, K.N.; funding acquisition, K.N. All authors have read and agreed to the published version of the manuscript.

Funding

This presentation is based on results obtained from the JPNP20015 project commissioned by the New Energy and Industrial Technology Development Organization (NEDO).

Data Availability Statement

MDPI Research Data Policies at https://www.mdpi.com/ethics (accessed on 3 March 2023).

Acknowledgments

We thank the members of IEA PVPS Rask-17, PVTEC, Miyazaki Prefecture, and the parents of students at Kibana Junior-High School (Miyazaki City) for technical discussions and responding to the social survey.

Conflicts of Interest

The authors declare no conflict of interest. The funders had no role in the study design, collection, analyses, interpretation of data, writing of the manuscript, or decision to publish the results.

References

  1. Zhang, B.; Dehghanian, P.; Kezunovic, M. Optimal allocation of PV generation and battery storage for enhanced resilience. IEEE Trans. Smart Grid 2019, 10, 535–545. [Google Scholar] [CrossRef]
  2. Laws, N.D.; Anderson, K.; DiOrio, N.A.; Li, X.; McLaren, J. Impacts of valuing resilience on cost-optimal PV and storage systems for commercial buildings. Renew. Energy 2018, 127, 896–909. [Google Scholar] [CrossRef]
  3. Galvan, E.; Mandal, P.; Sang, Y. Networked microgrids with rooftop solar PV and battery energy storage to improve distribution grids resilience to natural disasters. Int. J. Electr. Power Energy Syst. 2020, 123, 106239. [Google Scholar] [CrossRef]
  4. Elluru, S.; Gupta, H.; Kaur, H.; Singh, S.P. Proactive and reactive models for disaster resilient supply chain. Ann. Oper. Res. 2019, 283, 199–224. [Google Scholar] [CrossRef]
  5. Murray-tuite, P.M. A comparison of transportation network resilience under simulated system optimum and user equilibrium conditions. In Proceedings of the 2006 Winter Simulation Conference, Monterey, CA, USA, 3–6 December 2006. [Google Scholar] [CrossRef]
  6. Ding, T.; Wang, Z.; Jia, W.; Chen, B.; Chen, C.; Shahidehpour, M. Multiperiod distribution system restoration with routing repair crews, mobile electric vehicles, and soft-open-point networked microgrids. IEEE Trans. Smart Grid 2020, 11, 4795–4808. [Google Scholar] [CrossRef]
  7. Mohammad, A.; Zamora, R.; Lie, T.T. Integration of electric vehicles in the distribution network: A review of PV based electric vehicle modelling. Energies 2020, 13, 4541. [Google Scholar] [CrossRef]
  8. Esfahani, N.F.; Darwish, A.; Williams, B.W. Power Converter Topologies for Grid-Tied Solar Photovoltaic (PV) Powered Electric Vehicles (EVs)—A Comprehensive Review. Energies 2022, 15, 4648. [Google Scholar] [CrossRef]
  9. Aziz, M.; Oda, T.; Mitani, T.; Watanabe, Y.; Kashiwagi, T. Utilization of Electric Vehicles and Their Used Batteries for Peak-Load Shifting. Energies 2015, 8, 3720–3738. [Google Scholar] [CrossRef]
  10. Aleem, S.A.; Hussain, S.M.S.; Ustun, T.S. A Review of Strategies to Increase PV Penetration Level in Smart Grids. Energies 2020, 13, 636. [Google Scholar] [CrossRef]
  11. Salvatti, G.A.; Carati, E.G.; Cardoso, R.; da Costa, J.P.; Stein, C.M.d.O. Electric Vehicles Energy Management with V2G/G2V Multifactor Optimization of Smart Grids. Energies 2020, 13, 1191. [Google Scholar] [CrossRef]
  12. Abdalla, M.A.A.; Min, W.; Mohammed, O.A.A. Two-Stage Energy Management Strategy of EV and PV Integrated Smart Home to Minimize Electricity Cost and Flatten Power Load Profile. Energies 2020, 13, 6387. [Google Scholar] [CrossRef]
  13. Ali, A.I.M.; Sayed, M.A.; Mohamed, A.A.S. Seven-Level Inverter with Reduced Switches for PV System Supporting Home-Grid and EV Charger. Energies 2021, 14, 2718. [Google Scholar] [CrossRef]
  14. Wang, M.; Abdalla, M.A.A. Optimal Energy Scheduling Based on Jaya Algorithm for Integration of Vehicle-to-Home and Energy Storage System with Photovoltaic Generation in Smart Home. Sensors 2022, 22, 1306. [Google Scholar] [CrossRef]
  15. Gong, H.; Ionel, D.M. Improving the Power Outage Resilience of Buildings with Solar PV through the Use of Battery Systems and EV Energy Storage. Energies 2021, 14, 5749. [Google Scholar] [CrossRef]
  16. Sulaeman, I.; Chandra Mouli, G.R.; Shekhar, A.; Bauer, P. Comparison of AC and DC Nanogrid for Office Buildings with EV Charging, PV and Battery Storage. Energies 2021, 14, 5800. [Google Scholar] [CrossRef]
  17. Vermeer, W.; Chandra Mouli, G.R.; Bauer, P. Real-Time Building Smart Charging System Based on PV Forecast and Li-Ion Battery Degradation. Energies 2020, 13, 3415. [Google Scholar] [CrossRef]
  18. Nefedov, E.; Sierla, S.; Vyatkin, V. Internet of Energy Approach for Sustainable Use of Electric Vehicles as Energy Storage of Prosumer Buildings. Energies 2018, 11, 2165. [Google Scholar] [CrossRef]
  19. Cieslik, W.; Szwajca, F.; Golimowski, W.; Berger, A. Experimental Analysis of Residential Photovoltaic (PV) and Electric Vehicle (EV) Systems in Terms of Annual Energy Utilization. Energies 2021, 14, 1085. [Google Scholar] [CrossRef]
  20. Antić, T.; Capuder, T.; Bolfek, M. A Comprehensive Analysis of the Voltage Unbalance Factor in PV and EV Rich Non-Synthetic Low Voltage Distribution Networks. Energies 2021, 14, 117. [Google Scholar] [CrossRef]
  21. Strielkowski, W.; Volkova, E.; Pushkareva, L.; Streimikiene, D. Innovative Policies for Energy Efficiency and the Use of Renewables in Households. Energies 2019, 12, 1392. [Google Scholar] [CrossRef]
  22. Nishimwe, H.; Yoon, S.-G. Combined Optimal Planning and Operation of a Fast EV-Charging Station Integrated with Solar PV and ESS. Energies 2021, 14, 3152. [Google Scholar] [CrossRef]
  23. Sierra, A.; Gercek, C.; Geurs, K.; Reinders, A. Technical, Financial, and Environmental Feasibility Analysis of Photovoltaic EV Charging Stations With Energy Storage in China and the United States. IEEE J. Photovolt. 2020, 10, 1892–1899. [Google Scholar] [CrossRef]
  24. Jin, H.; Lee, S.; Nengroo, S.H.; Har, D. Development of Charging/Discharging Scheduling Algorithm for Economical and Energy-Efficient Operation of Multi-EV Charging Station. Appl. Sci. 2022, 12, 4786. [Google Scholar] [CrossRef]
  25. Mohammed, S.; Titus, F.; Thanikanti, S.B.; Sulaiman, S.M.; Deb, S.; Kumar, N.M. Charge Scheduling Optimization of Plug-In Electric Vehicle in a PV Powered Grid-Connected Charging Station Based on Day-Ahead Solar Energy Forecasting in Australia. Sustainability 2022, 14, 3498. [Google Scholar] [CrossRef]
  26. Petrusic, A.; Janjic, A. Renewable Energy Tracking and Optimization in a Hybrid Electric Vehicle Charging Station. Appl. Sci. 2021, 11, 245. [Google Scholar] [CrossRef]
  27. Dai, Q.; Liu, J.; Wei, Q. Optimal Photovoltaic/Battery Energy Storage/Electric Vehicle Charging Station Design Based on Multi-Agent Particle Swarm Optimization Algorithm. Sustainability 2019, 11, 1973. [Google Scholar] [CrossRef]
  28. Abronzini, U.; Attaianese, C.; D’Arpino, M.; Di Monaco, M.; Tomasso, G. Cost Minimization Energy Control Including Battery Aging for Multi-Source EV Charging Station. Electronics 2019, 8, 31. [Google Scholar] [CrossRef]
  29. Dukpa, A.; Butrylo, B. MILP-Based Profit Maximization of Electric Vehicle Charging Station Based on Solar and EV Arrival Forecasts. Energies 2022, 15, 5760. [Google Scholar] [CrossRef]
  30. Zhang, Z.; Gercek, C.; Renner, H.; Reinders, A.; Fickert, L. Resonance Instability of Photovoltaic E-Bike Charging Stations: Control Parameters Analysis, Modeling and Experiment. Appl. Sci. 2019, 9, 252. [Google Scholar] [CrossRef]
  31. Ghosh, A. Possibilities and Challenges for the Inclusion of the Electric Vehicle (EV) to Reduce the Carbon Footprint in the Transport Sector: A Review. Energies 2020, 13, 2602. [Google Scholar] [CrossRef]
  32. Muntwyler, U. Towards 100% renewable energy supplies. In Proceedings of the 2015 Tenth International Conference on Ecological Vehicles and Renewable Energies (EVER), Monte Carlo, Monaco, 31 March–2 April 2015; pp. 1–8. [Google Scholar] [CrossRef]
  33. Sierra-Rodriguez, A.; de Santano, T.; MacGill, I.; Ekins-Daukes, N.J.; Reinders, A. A feasibility study of solar PV-powered electric cars using an interdisciplinary modeling approach for the electricity balance, CO2 emissions, and economic aspects: The cases of The Netherlands, Norway, Brazil, and Australia. Prog. Photovolt. Res. Appl. 2020, 28, 517–532. [Google Scholar] [CrossRef]
  34. The Ford Motor Company. Let the Sun In: Ford C-MAX Solar Energi Concept Goes Off the Grid, Gives Glimpse of Clean Vehicle Future. Available online: https://media.ford.com/content/fordmedia/fna/us/en/news/2014/01/02/let-the-sun-in--ford-c-max-solar-energi-concept-goes-off-the-gri.html (accessed on 3 March 2023).
  35. Automotive News, Next-Generation Toyota Prius Has Solar Roof for Europe, Japan. Available online: https://www.autonews.com/article/20160616/OEM05/160619900/next-generation-toyota-prius-has-solar-roof-for-europe-japan (accessed on 3 March 2023).
  36. Automotive News. Available online: https://www.autonews.com/article/20160811/OEM04/308119912/karma-targets-tesla-with-115-000-solar-boosted-hybrid (accessed on 3 March 2023).
  37. Hanergy Holding Group Ltd. Available online: https://www.autoevolution.com/news/china-s-hanergy-unveils-four-solar-powered-concept-cars-109094.html (accessed on 3 March 2023).
  38. Nissan Motor Corporation. Nissan Sustainability Report 2014. Available online: https://www.nissan-global.com/EN/SUSTAINABILITY/LIBRARY/SR/2014/ (accessed on 3 March 2023).
  39. Kronthaler, L.; Maturi, L.; Moser, D.; Alberti, L. Vehicle-integrated Photovoltaic (ViPV) systems: Energy production, Diesel Equivalent, Payback Time; an assessment screening for trucks and busses. In Proceedings of the 2014 Ninth International Conference on Ecological Vehicles and Renewable Energies (EVER), Monte Carlo, Monaco, 25–27 March 2014; IEEE: Piscataway, NJ, USA, 2014. [Google Scholar] [CrossRef]
  40. Kutter, C.; Alanis, L.E.; Neuhaus, D.H.; Heinrich, M. Yield potential of vehicle integrated photovoltaics on commercial trucks and vans. In Proceedings of the 38th European PV Solar Energy Conference and Exhibition, Online, 6–10 September 2021; Volume 6, pp. 1412–1420. [Google Scholar] [CrossRef]
  41. Mallon, K.R.; Assadian, F.; Fu, B. Analysis of On-Board Photovoltaics for a Battery Electric Bus and Their Impact on Battery Lifespan. Energies 2017, 10, 943. [Google Scholar] [CrossRef]
  42. Masuda, T.; Araki, K.; Okumura, K.; Urabe, S.; Kudo, Y.; Kimura, K.; Nakado, T.; Sato, A.; Yamaguchi, M. Static concentrator photovoltaics for automotive applications. Sol. Energy 2017, 146, 523–531. [Google Scholar] [CrossRef]
  43. NEDO. Interim Report of the Exploratory Committee on the Automobile Using Photovoltaic System. Available online: http://www.nedo.go.jp/news/press/AA5_100909.html (accessed on 9 May 2018).
  44. Masuda, T.; Araki, K.; Okumura, K.; Urabe, S.; Kudo, Y.; Kimura, K.; Nakado, T.; Sato, A.; Yamaguchi, M. Next environment-friendly cars: Application of solar power as automobile energy source. In Proceedings of the IEEE 43rd Photovoltaic Specialists Conference (PVSC), Portland, OR, USA, 5–10 June 2016. [Google Scholar] [CrossRef]
  45. Araki, K.; Sato, D.; Masuda, T.; Lee, K.H.; Yamada, N.; Yamaguchi, M. Why and how does car-roof PV create 50 GW/year of new installations? Also, why is a static CPV suitable to this application? AIP Conf. Proc. 2019, 2149, 050003. [Google Scholar] [CrossRef]
  46. Sierra, A.; Reinders, A. Designing innovative solutions for solar-powered electric mobility applications. Prog. Photovolt. Res. Appl. 2021, 29, 802–818. [Google Scholar] [CrossRef]
  47. Kanz, O.; Reinders, A.; May, J.; Ding, K. Environmental Impacts of Integrated Photovoltaic Modules in Light Utility Electric Vehicles. Energies 2020, 13, 5120. [Google Scholar] [CrossRef]
  48. Kim, S.; Holz, M.; Park, S.; Yoon, Y.; Cho, E.; Yi, J. Future Options for Lightweight Photovoltaic Modules in Electrical Passenger Cars. Sustainability 2021, 13, 2532. [Google Scholar] [CrossRef]
  49. Macías, J.; Herrero, R.; Núñez, R.; Antón, I. On the effect of cell interconnection in Vehicle Integrated Photovoltaics: Modelling energy under different scenarios. In Proceedings of the 2021 IEEE 48th Photovoltaic Specialists Conference (PVSC), Fort Lauderdale, FL, USA, 20–25 June 2021; IEEE: Piscataway, NJ, USA, 2021. [Google Scholar] [CrossRef]
  50. Sagaria, S.; Duarte, G.; Neves, D.; Baptista, P. Photovoltaic integrated electric vehicles: Assessment of synergies between solar energy, vehicle types and usage patterns. J. Clean. Prod. 2022, 348, 131402. [Google Scholar] [CrossRef]
  51. Sato, D.; Masuda, T.; Araki, K.; Yamaguchi, M.; Okumura, K.; Sato, A.; Tomizawa, R.; Yamada, N. Stretchable Micro-Scale Concentrator Photovoltaic Module with 15.4% Efficiency for Three-Dimensional Curved Surfaces. Commun. Mater. 2021, 2, 7. [Google Scholar] [CrossRef]
  52. Araki, K.; Ota, Y.; Ikeda, K.; Lee, K.-H.; Nishioka, K.; Yamaguchi, M. Possibility of Static Low Concentrator PV Optimized for Vehicle Installation. AIP Conf. Proc. 2016, 1766, 020001. [Google Scholar] [CrossRef]
  53. Pinto, D.; Lu, Q.; Camocardi, P.; Chatzikomis, C.; Sorniotti, A.; Ragonese, D.; Iuzzolino, G.; Perlo, P.; Lekakou, C. Electric Vehicle Driving Range Extension Using Photovoltaic Panels. In Proceedings of the 2016 IEEE Vehicle Power and Propulsion Conference (VPPC), Hangzhou, China, 17–20 October 2016; IEEE: Piscataway, NJ, USA, 2016; pp. 1–6. [Google Scholar] [CrossRef]
  54. Conti, S.; Di Mauro, S.; Raciti, A.; Rizzo, S.A.; Susinni, G.; Musumeci, S.; Tenconi, A. Solar electric vehicles: State-of-the-art and perspectives. In Proceedings of the 2018 AEIT International Annual Conference, Bari, Italy, 3–5 October 2018; pp. 1–6. [Google Scholar] [CrossRef]
  55. Metro News. Available online: https://metro.co.uk/2019/06/26/lightyear-one-solar-powered-electric-car-thatll-450-miles-10072219/ (accessed on 1 March 2023).
  56. Sono Motors. Available online: https://sonomotors.com/ (accessed on 1 March 2023).
  57. Araki, K.; Ji, L.; Kelly, G.; Yamaguchi, M. To Do List for Research and Development and International Standardization to Achieve the Goal of Running a Majority of Electric Vehicles on Solar Energy. Coatings 2018, 8, 251. [Google Scholar] [CrossRef]
  58. Sato, D.; Le., K.-H.; Araki, K.; Masuda, T.; Yamaguchi, M.; Yamada, N. Design of Low-Concentration Static III-V/Si Partial CPV Module with 27.3% Annual Efficiency for Car-Roof Application. Progress in Photovoltaics: Research and Applications 2019, 27, 501–510. [Google Scholar] [CrossRef]
  59. Abdelhamid, M.; Pilla, S.; Singh, R.; Haque, I.; Filipi, Z. A comprehensive optimized model for on-board solar photovoltaic system for plug-in electric vehicles: Energy and economic impacts: On-board solar photovoltaic system for plug-in electric vehicles. Int. J. Energy Res. 2016, 40, 1489–1508. [Google Scholar] [CrossRef]
  60. Ota, Y.; Araki, K.; Nagaoka, A.; Nishioka, K. Curve correction of vehicle-integrated photovoltaics using statistics on commercial car bodies. Prog. Photovolt. Res. Appl. 2022, 30, 152–163. [Google Scholar] [CrossRef]
  61. Araki, K.; Ji, L.; Kelly, G.; Agudo, E.; Anton, I.; Baudrit, M.; Carr, A.; Herrero, R.; Kurtz, S.; Liu, Z.; et al. Modeling and Standardization Researches and Discussions of the Car-roof PV through International Web Meetings. In Proceedings of the 2019 IEEE 46th Photovoltaic Specialists Conference (PVSC), Chicago, IL, USA, 16–21 June 2019; pp. 2722–2729. [Google Scholar] [CrossRef]
  62. Araki, K.; Algora, C.; Siefer, G.; Nishioka, K.; Leutz, R.; Carter, S.; Wang, S.; Askins, S.; Ji, L.; Kelly, G. Standardization of the CPV and car-roof PV technology in 2018—Where are we going to go? AIP Conf. Proc. 2018, 2012, 070001. [Google Scholar] [CrossRef]
  63. Ota, Y.; Masuda, T.; Araki, K.; Yamaguchi, M. Curve-Correction Factor for Characterization of the Output of a Three-Dimensional Curved Photovoltaic Module on a Car Roof. Coatings 2018, 8, 432. [Google Scholar] [CrossRef]
  64. Tayagaki, T.; Araki, K.; Yamaguchi, M.; Sugaya, T. Impact of Nonplanar Panels on Photovoltaic Power Generation in the Case of Vehicles. IEEE J. Photovolt. 2019, 9, 1721–1726. [Google Scholar] [CrossRef]
  65. Ota, Y.; Araki, K.; Nagaoka, A.; Nishioka, K. Facilitating vehicle-integrated photovoltaics by considering the radius of curvature of the roof surface for solar cell coverage. Clean. Eng. Technol. 2022, 7, 100446. [Google Scholar] [CrossRef]
  66. Thiel, C.; Amillo, A.G.; Tansini, A.; Tsakalidis, A.; Fontaras, G.; Dunlop, E.; Taylor, N.; Jäger-Waldau, A.; Araki, K.; Nishioka, K.; et al. Impact of climatic conditions on prospects for integrated photovoltaics in electric vehicle. Renew. Sustain. Energy Rev. 2022, 158, 112109. [Google Scholar] [CrossRef]
  67. Brito, M.; Santos, T.; Moura, F.; Pera, D.; Rocha, J. Urban solar potential for vehicle integrated photovoltaics. Transp. Res. Part D Transp. Environ. 2021, 94, 102810. [Google Scholar] [CrossRef]
  68. Araki, K.; Ota, Y.; Yamaguchi, M. Measurement and Modeling of 3D Solar Irradiance for Vehicle-Integrated Photovoltaic. Appl. Sci. 2020, 10, 872. [Google Scholar] [CrossRef]
  69. Araki, K.; Ota, Y.; Nishioka, K.; Tobita, H.; Ji, L.; Kelly, G.; Yamaguchi, M. Toward the Standardization of the Car-roof PV–The challenge to the 3-D Sunshine Modeling and Rating of the 3-D Continuously Curved PV Panel. In Proceedings of the 2018 IEEE 7th World Conference on Photovoltaic Energy Conversion (WCPEC) (A Joint Conference of 45th IEEE PVSC, 28th PVSEC & 34th EU PVSEC), Waikoloa Village, HI, USA, 10–15 June 2018; IEEE: Piscataway, NJ, USA, 2018; pp. 0368–0373. [Google Scholar] [CrossRef]
  70. Ota, Y.; Masuda, K.; Araki, K.; Yamaguchi, M. A mobile multipyranometer array for the assessment of solar irradiance incident on a photovoltaic-powered vehicle. Sol. Energy 2019, 184, 84–90. [Google Scholar] [CrossRef]
  71. Araki, K.; Lee, H.; Masuda, T.; Hayakawa, Y.; Yamada, N.; Ota, Y.; Yamaguchi, M. Rough and Straightforward Estimation of the Mismatching Loss by Partial Shading of the PV Modules Installed on an Urban Area or Car-Roof. In Proceedings of the 46th IEEE PVSC, Chicago, IL, USA, 16–21 June 2019. [Google Scholar] [CrossRef]
  72. Ekins-Daukes, N.J.; Betts, T.R.; Kemmoku, Y.; Araki, K.; Lee, H.S.; Gottschalg, R.; Boreland, M.B.; Infield, D.G.; Yamaguchi, M. Syracuse—A multi-junction concentrator system computer model. In Proceedings of the Conference Record of the Thirty-First IEEE Photovoltaic Specialists Conference, Lake Buena Vista, FL, USA, 3–7 January 2005; IEEE: Piscataway, NJ, USA, 2005; pp. 651–654. [Google Scholar] [CrossRef]
  73. Araki, K.; Yamaguchi, M.; Kondo, M.; Uozumi, H. Which is the best number of junctions for solar cells under ever-changing terrestrial spectrum? In Proceedings of the 3rd World Conference on Photovoltaic Energy Conversion, Osaka, Japan, 11–18 May 2003; IEEE: Piscataway, NJ, USA, 2003; Volume 1, pp. 307–310. [Google Scholar]
  74. Tawa, H.; Saiki, H.; Ota, Y.; Araki, K.; Takamoto, T.; Nishioka, K. Accurate Output Forecasting Method for Various Photovoltaic Modules Considering Incident Angle and Spectral Change Owing to Atmospheric Parameters and Cloud Conditions. Appl. Sci. 2020, 10, 703. [Google Scholar] [CrossRef]
  75. Araki, K.; Ota, Y.; Lee, K.H.; Nishioka, K.; Yamaguchi, M. Optimization of the Partially Radiative-coupling Multi-junction Solar Cells Considering Fluctuation of Atmospheric Conditions. In Proceedings of the IEEE 7th World Conference on Photovoltaic Energy Conversion (WCPEC) (A Joint Conference of 45th IEEE PVSC, 28th PVSEC & 34th EU PVSEC), Waikoloa Village, HI, USA, 10–15 June 2018; pp. 1661–1666. [Google Scholar] [CrossRef]
  76. Araki, K.; Tawa, H.; Saiki, H.; Ota, Y.; Nishioka, K.; Yamaguchi, M. The Outdoor Field Test and Energy Yield Model of the Four-Terminal on Si Tandem PV Module. Appl. Sci. 2020, 10, 2529. [Google Scholar] [CrossRef]
  77. Araki, K.; Yamaguchi, M. Influences of spectrum change to 3-junction concentrator cells. Sol. Energy Mater. Sol. Cells 2003, 75, 707–714. [Google Scholar] [CrossRef]
  78. Araki, K.; Yamaguchi, M.; Takamoto, T.; Ikeda, E.; Agui, T.; Kurita, H.; Takahashi, K.; Unno, T. Characteristics of GaAs-based concentrator cells. Sol. Energy Mater. Sol. Cells 2001, 66, 559–565. [Google Scholar] [CrossRef]
  79. Ota, Y.; Araki, K.; Nagaoka, A.; Nishioka, K. Evaluating the Output of a Car-Mounted Photovoltaic Module Under Driving Conditions. IEEE J. Photovolt. 2021, 11, 1299–1304. [Google Scholar] [CrossRef]
  80. Itagaki, A.; Okumura, H.; Yamada, A. Preparation of meteorological data set throughout Japan for suitable design of PV systems Photovoltaic Energy Conversion. In Proceedings of the 3rd World Conference on Photovoltaic Energy Conversion, Osaka, Japan, 11–18 May 2003. [Google Scholar]
  81. Shirakawa, K.; Itagaki, A.; Utsunomiya, T. Preparation of hourly solar radiation data on inclined surface (METPV-11) throughout Japan. In Proceedings of the JSES/JWEA Joint Conference, Wakkanai, Japan, 21–22 September 2011. [Google Scholar]
Figure 1. Standard resilience facilities with their energy source requirement and estimated energy consumption during disaster response.
Energies 16 03580 g001
Figure 2. Resilience facilities in addition to the standard facilities in Figure 2, powered by voluntary electricity contributions from SEVs and VIPVs.
Energies 16 03580 g002
Figure 3. Main differences between VIPV and typical solar panels in fixed-tilt installation.
Energies 16 03580 g003
Figure 4. Graphical flowchart of the Monte Carlo simulation.
Energies 16 03580 g004
Figure 5. Multi-pyranometer irradiance measurement on the 5-axis: (a) definition of the coordinate system; (b) position of the pyranometers (red circles).
Energies 16 03580 g005
Figure 6. Definition of the grazing angle and orientation angle in the hemispherical sky.
Energies 16 03580 g006
Figure 7. Calculation of the 3D shading and aperture matrix from the fisheye image: (a) fisheye image; (b) 2D histogram of the shading probability calculated by binarization of the image; (c) structure of the aperture matrix obtained by the 2D histogram of the shading probability; the shading matrix is calculated by 1–E.
Energies 16 03580 g007
Figure 8. Shading distribution and irradiance onto VIPVs (5-axis) of the open zone: (a) fisheye image; (b) shading probability as the function of the grazing angle; (c) comparison of the measured (red bars) and calculated (blue bars) irradiance onto 5-axis planes.
Energies 16 03580 g008
Figure 9. Shading distribution and irradiance onto VIPVs (5-axis) of the residential zone: (a) fisheye image; (b) shading probability as the function of the grazing angle; (c) comparison of the measured (red bars) and calculated (blue bars) irradiance onto 5-axis planes.
Energies 16 03580 g009
Figure 10. Shading distribution and irradiance onto VIPVs (5-axis) of the building zone: (a) fisheye image; (b) shading probability as the function of the grazing angle; (c) comparison of the measured (red bars) and calculated (blue bars) irradiance onto 5-axis planes.
Energies 16 03580 g010
Figure 11. Shading distribution on three zones used for the resilience probability; blue curves correspond to the x-direction (left–right direction), and the red curves correspond to the y-direction (front-rear).
Energies 16 03580 g011
Figure 12. Response to community survey regarding willingness to donate energy during disaster relief.
Energies 16 03580 g012
Figure 13. Monte Carlo simulation result: A time-series plot of the total battery charge remaining in the facilities supported by SEVs.
Energies 16 03580 g013
Figure 14. Solar irradiation of Miyazaki, Japan, the community on which the Monte Carlo simulation was based.
Energies 16 03580 g014
Figure 15. Number of SEVs vs. probability of continuous electricity supply for seven days, until the lifeline recovers (residential zone in Miyazaki).
Energies 16 03580 g015
Figure 16. Probability of sustaining resilience energy for a week in open zone: (a) fisheye image; (b) probability curves.
Energies 16 03580 g016
Figure 17. Probability of sustaining resilience energy for a week in residential zone: (a) fisheye image; (b) probability curves.
Energies 16 03580 g017
Figure 18. Probability of sustaining resilience energy for a week in building zone: (a) fisheye image; (b) probability curves.
Energies 16 03580 g018
Figure 19. Histogram of the estimated solar irradiance on a car roof in Japan from 830 sites (N45° to N24°, ranging from subpolar to subtropical zone) in three zones.
Energies 16 03580 g019
Figure 20. Example of the spreadsheet resilience plan customized to a local government.
Energies 16 03580 g020
Table 1. Requirements of typical resilience facilities.
Type of FacilityHQ, Disaster ResponseEvacuation CenterCommunity HallCare House
Floor area (m2)10,000 7000 950 4200
Capacity (persons)2503000200100
Required energy capacity 294.4 262.1 54.8 363.5
Non-emergency air conditioning capacity (kW)200 200 50 300
On-site battery (kWh)264 133 43 44
PV (kW)165 61 10 32
Co-generator------0.7 kW
Emergency generator (kW)200 120 38.4
Fuel stock (hr)72 3 5
Table 2. Energy demand by time of day in typical resilience facilities.
Type of FacilityTime PeriodAverage Energy Demand (kW)
Headquarters of disaster response06:00–17:0034.6
17:00–21:0034.6
21:00–06:0032.2
Evacuation center06:00–17:0013.2
17:00–21:0023.1
21:00–06:0013.2
Community hall06:00–17:000.8
17:00–21:001.2
21:00–06:000.7
Care house06:00–17:0023.7
17:00–21:0025.9
21:00–06:0023.1
Table 3. Energy demand by time of day in resilience facilities supported by VIPV.
Type of FacilityPeriodAverage Power Demand (kW)
Temporary shelter with medical care06:00–17:0034.6
17:00–21:0034.6
21:00–06:0032.2
Common charging station for mobile devices06:00–06:000.2 kW× 25
Backup power for air conditioning 06:00–16:002.2 kW× 6
Table 4. List of probability parameters and values used for the Monte Carlo simulation.
ParameterParameter DescriptionVariable TypeDistribution
Date/time of the disasterStep by 1 h starting from 1 January, 00:00–01:00, end on 31 December, 23:00–24:00IntegerRanged uniform (0, 365 × 24 − 1)
Once at the beginning
SoC at the disasterEach vehicleVector (double-precision float)
(Vector size) = (Number of SEV)
Ranged uniform (0%, 100%)
Once at the beginning
Irradiation deviation1: Best year
0: Average year
−1: Worst year
Double-precision floatRanged uniform (−1, 1)
Once at the beginning
Degree of intention
for donation
If (value) < x% and satisfies other conditions, the driver donates the energy.Vector (double-precision float)
(Vector size)
= (Number of SEV) × 24 × 7
Ranged uniform (0, 1)
Table 5. List of constant parameters and values used for the Monte Carlo simulation.
ParameterParameter DescriptionValue
SiteMiyazaki, Japan (N31.938°, E131.413°)87376 (METPV index number)
Road reflectanceReflectance from the road to the vertical plane of vehicles0.08
Road reflectance (snow)(snow cover) > 10 cm,
Reflectance from the road to the vertical plane of vehicles
0.9
The reflectance of the vertical plane of the shading objectsbuildings, etc.0.25
Number of SEVInput at the beginning (Integer)--
Number of mobile charging stationsDistributed by walking distance (1 km)25
The required power for a mobile charging station24 h (constant)0.2 kW each
Number of sites demanding energy supply of air conditioning 6
The required power for air conditioning24 h (constant)2.2 kW each
(6 horsepower each)
Number of temporal shelters with medical care 1
The required energy for the temporal shelter with medical careRequired power varies by time zone.0.36 kW 00:00–06:00
1.61 kW 06:00–17:00
4.47 kW 17:00–21:00
0.36 kW 21:00–24:00
Drive distance at delivering energy to the public good 5 km
Electric milage 8.33 km/kWh
Battery capacity 40 kWh
Energy management efficiency of EV 93%
MPPT 1 efficiency for PV power conversion 95%
VIPV efficiency 22%
VIPV areaProjected area to a horizontal plane1.8 m2
Performance ratio of VIPVTemperature correction is done separately90%
Temperature coefficientVaries by irradiance level−0.328%/K @ 1 kW/m2 of solar irradiance
1 Maximum power point tracking.
Table 6. Summary of the Monte Carlo simulation of SEV-based energy resilience.
Type of FacilitiesValue
PlaceMiyazaki, Japan, N
ClimateSemi-tropical
ZoneResidential zone
Population density624 /km2
Assumed area for calculation5 km radius
Drive distance at delivering energy to the public good5 km
Electric mileage (average)8.33 km/kWh
Battery capacity (average)40 kWh
Energy management efficiency of EV (average)93%
MPPT 1 efficiency for PV power conversion (average)95%
VIPV efficiency (average)22%
VIPV area (projected area, average)1.8 m2
Performance ratio of VIPV (*)90%
Temperature coefficient (**)−0.328%/K @ 1 kW/m2 of solar irradiance
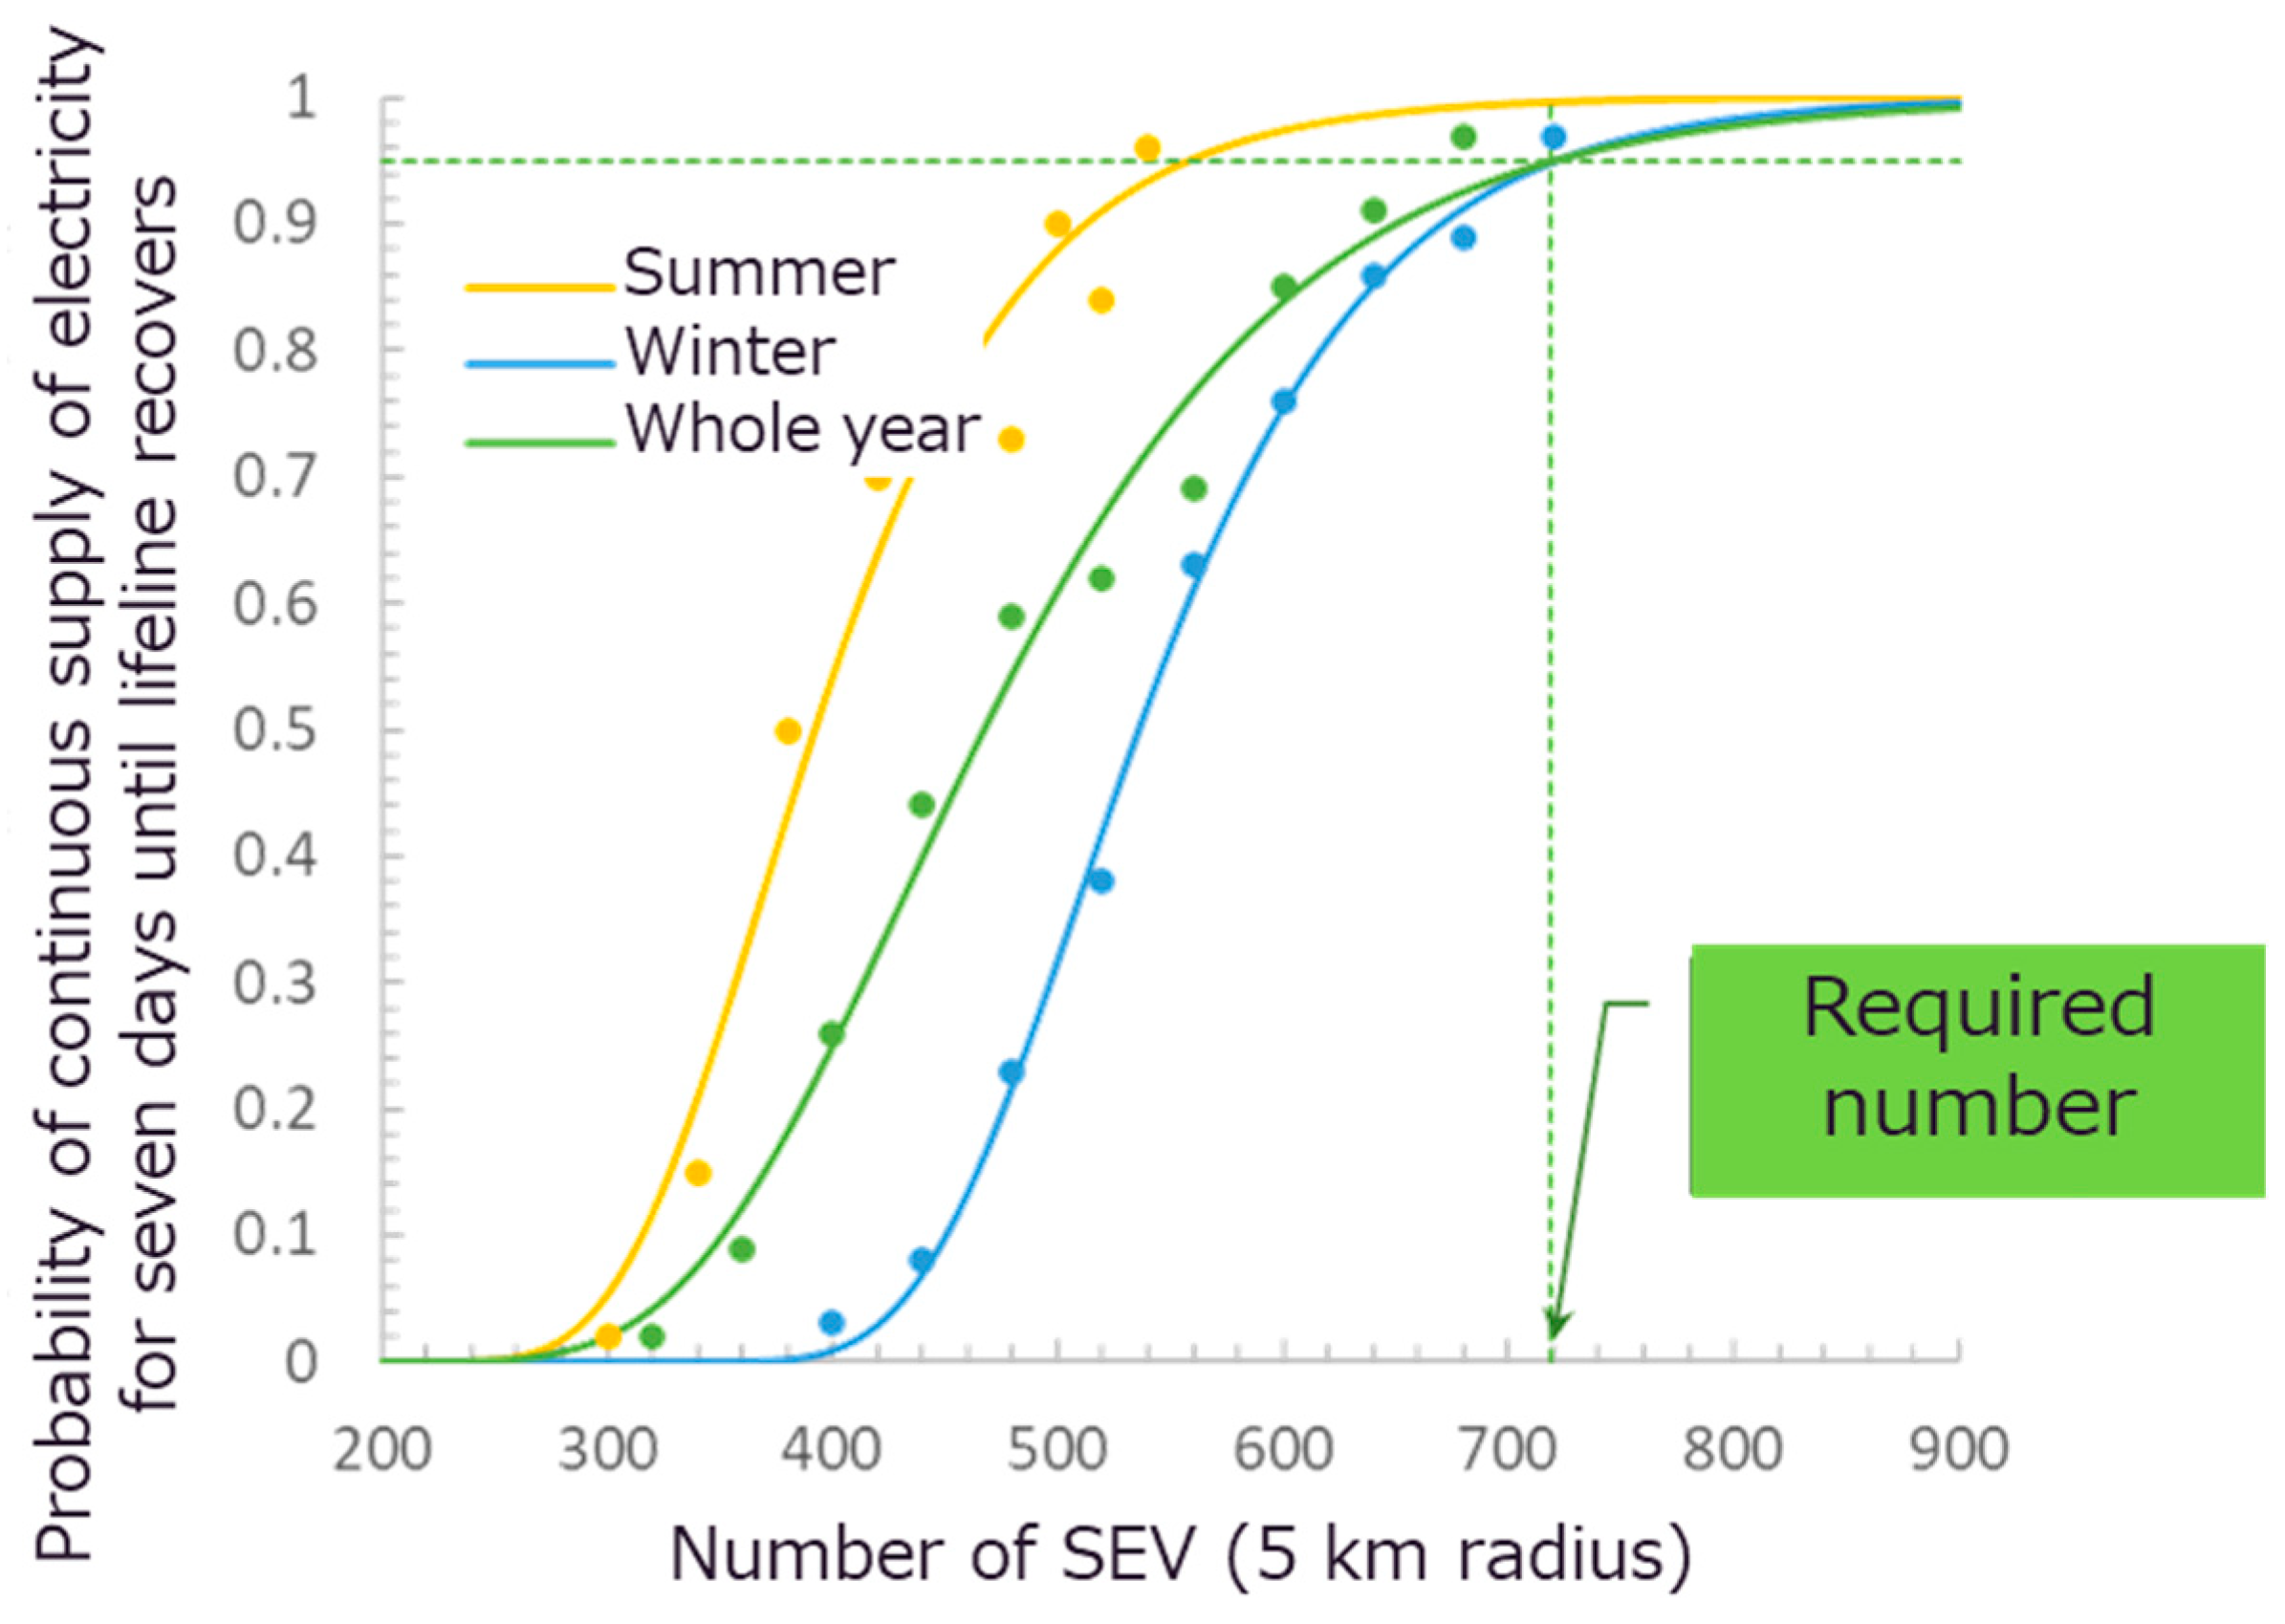
Calculation result: Number of required SEVs
(residential zone)
720 in a 5 km radius, 9.2 per km2
1 Maximum power point tracking. * Not including temperature; ** varies by irradiance level.
Disclaimer/Publisher’s Note: The statements, opinions and data contained in all publications are solely those of the individual author(s) and contributor(s) and not of MDPI and/or the editor(s). MDPI and/or the editor(s) disclaim responsibility for any injury to people or property resulting from any ideas, methods, instructions or products referred to in the content.

