1. Introduction
In recent years, it is easy to observe that electric vehicles are more and more present on the roads worldwide [
1]. While at first, people were reluctant towards the idea of EVs and car producers considered this a niche market, currently, there is a tendency to launch more and more hybrid and electric vehicles onto the market [
2]. The difference between traditional vehicles and electric ones is the type of energy used. The former uses conventional fuels (petrol, diesel, and liquefied petroleum gas), while the latter uses electric energy. EVs are promoted as vehicles with low greenhouse gas (GHG) emissions and contribute to better air quality, especially in highly circulated areas, making a significant contribution to slowing global warming. Additionally, the consequences of EV adoption on the environment also relate to decreasing the dependence on fossil fuels, reducing air pollutants that come from gasoline, which can cause severe health problems [
3]. They also produce less noise compared to traditional vehicles and perform better in crowded areas where speed is reduced, due to the possibility of charging the batteries during braking. Whereas immediately after the launch of EVs, their autonomy was only several tens of kilometers; now, the autonomy can be between 500 and 600 km. In recent years, methods have been developed to predict the distance an EV can travel with the energy it has available. Very promising results were obtained and presented in the paper [
4] where starting from three models (physical, energetic, and based on the state of charge), a new model was proposed that will allow the estimation of the distance that an EV can travel with a higher accuracy. Given the fact that the EV industry is a relatively new one, the charging infrastructure is limited. With the growing number of EV charging stations and the development of station networks, EV owners will have increased freedom of movement.
In this paper we focus on EVs, the trends of EV ownership in Romania, EV energy storage capacity, charging methods, and the EV charging infrastructure available in the city of Cluj-Napoca, Romania. The current infrastructure was analyzed, and an estimation of the CO
2 emission reductions was made for the Cluj-Napoca urban area, using the available data from each charging station. The paper is organized as follows.
Section 2 introduces the current context of hybrid and electric vehicles ownership in Romania, then a case study for the EV infrastructure for the city of Cluj-Napoca is presented in
Section 3. In
Section 4 we discuss the energy consumption for charging stations, located in two different areas in Cluj-Napoca. Finally, a simulation of energy consumption was designed and performed and is detailed in
Section 5 along with the calculation for an estimated number of kilometers travelled with EVs. Conclusions are drawn in
Section 6.
2. Current Context
At the European Union (EU) level, the reliance of the member states on imported fuel is evident. The alarming growth of the pollution levels in large urban settings caused by the transport sector is also a pressing issue. The occurrence of meteorological phenomena due to the growing CO2 emissions and climate changes draws attention to implementing urgent changes in lifestyle and mobility.
The most accessible alternative for replacing vehicles with a high GHG emission with alternative energy vehicles that are non-polluting and energy efficient is the EV. They allow the substantial reduction of fuel usage and contribute to the reduction in environmental pollution. There are two categories of EVs: 100% EVs and hybrid vehicles, the latter consisting of two types: Plug-In Hybrid Electric Vehicles (PHEVs) and Hybrid Electric Vehicles (HEV). Hybrid vehicles can have different grades of hybridization: full hybrid—in this case, electric energy runs only the engine or just the batteries and requires a high-capacity battery pack [
5]. Plug-in hybrid vehicles (PHEVs) have rechargeable batteries but the car is also equipped with a combustion engine which can be used as a backup; in this way, the driver does not have to worry about the inconveniences that a full electric car can have [
6].
According to [
7], the number of registered vehicles in Romania in 2022 was 127,948, an increase of 6.8% compared to 2021. There were 82,549 petrol engines, 17,679 diesel, and 27,720 electric and full hybrid vehicles; the ratios are presented in
Figure 1. Compared to the previous year, the number of petrol vehicles was constant, the number of diesel vehicles decreased by 21.6%, and the number of EVs and hybrid vehicles increased significantly (21.7% in 2022, 12.8% in 2021).
The evolution of registered vehicles in 2022 can be observed in
Table 1, along with the registration variations in 2021 and 2022 [
7].
The most common registered EVs were HEVs, followed by full EVs and PHEVs, as seen in
Figure 2. The increase in EVs was also been observed in previous years, 12.8% in 2021 and 6.6% in 2020 [
8]; thus, considering the past trend, it is safe to assume that the demand will be higher for full EVs in the future.
According to the study in [
9], in Romania, there is an openness to acquire EVs. The study showed that 80% of Romanians have a positive attitude toward EVs, compared to 61% worldwide. In addition, the interviewed people stated that the main reasons to buy an electric vehicle are the reduction of pollution and the diminished fuel cost. The reluctance to buy an EV resides in the acquisition cost, which is higher than that of traditional vehicles. Another reason for concern is the lower EV autonomy and the reduced number of available charging stations. Based on this study, we can state that the future of EVs is promising if the price continues to decrease, and the battery storage capacity increases, the latter of which is happening with the development of technology. Moreover, the variety of EV models and investment of public authorities and private societies in the development of EV charging infrastructure could contribute to EV success [
10,
11].
3. Case Study
In March 2017, in Cluj-Napoca, there were no charging stations for EVs [
12]. It was then that the authorities assessed the necessity to support the citizens in the process of acquisition and usage of electric means of transportation through the installation of public charging stations. From the infrastructure standpoint, it was necessary for special parking spaces to be created for the charging stations, considering that one charging station can simultaneously charge two vehicles, thus requiring two parking spaces reserved for one charging station. However, existing parking spaces could be used for charging stations installation. Additionally, the charging stations are required to be connected to the electricity distribution network and to the internet, to provide real-time data and control access; thus, connections to the two types of networks were made [
13].
There are two types of charging stations: DC and AC. The EV plug standards of the stations are Type 2, Combined Charging System (CCS) and CHAdeMO. The Type 2 standard is used for AC charging with up to 22 kW of power. CCS and CHAdeMO standards are used for DC, and have a larger power, up to 350 kW. To be able to propose a pilot project that can be extended on a large scale if it proves useful, the installation possibility for three charging stations in two locations was analyzed, as recommended in [
14]. The first location was in a public open parking (Unirii Square), where a 50 kW DC station + 22 kW AC station were proposed. The second location was the car park on Motilor Street, with a 22 kW + 11 kW AC and an 11 kW AC to charge public EVs.
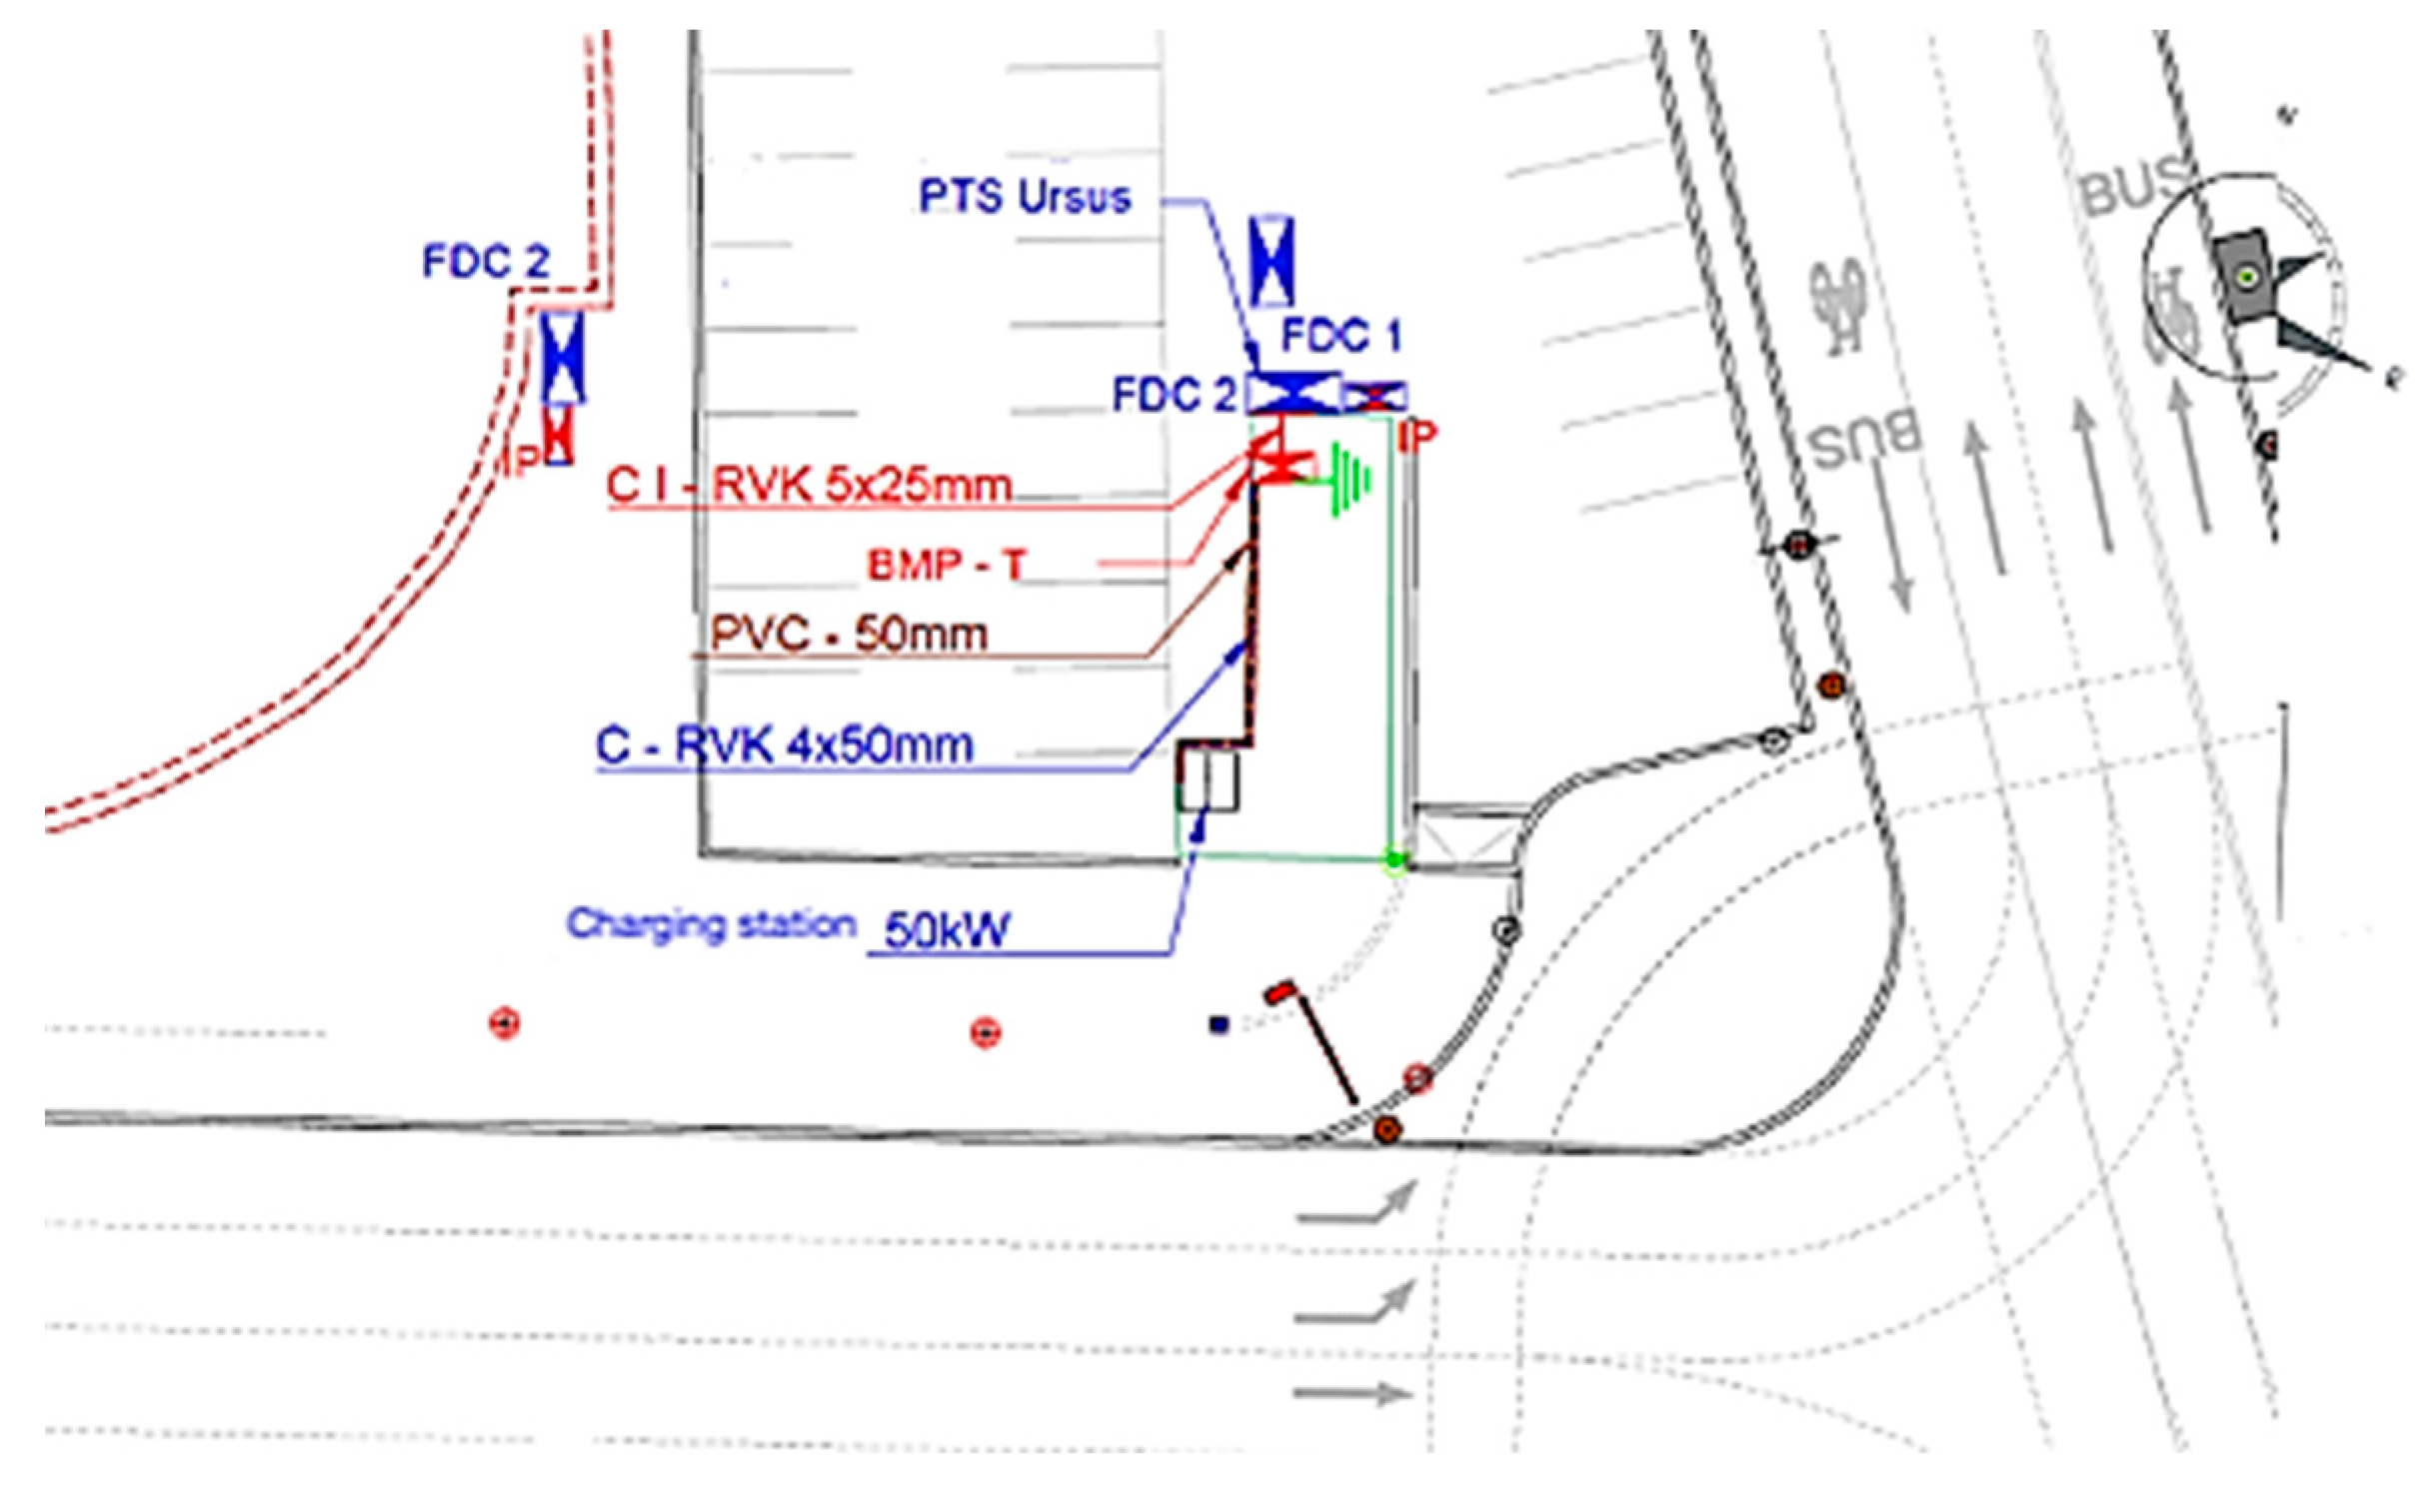
The necessary power for the charging station in Unirii Square is 50 kW. According to the Technical Connection Approval (TCA) issued by the Society of Electric Energy Distribution, the supply can be obtained from the distribution line FDC1, connected to an already existing underground transformer station (PTS Ursus, as seen in
Figure 3). The standard connection point enforces a voltage level of 0.4 kV, an approved power of 50 kW, 50.348 kVA. The station has three charging cables: Type 2, CCS, and CHAdeMO (fast charging). When two vehicles are charging simultaneously, the station limits the maximum transmitted power to the EVs to 50 kW, so that the maximum value approved by the TCA is not exceeded [
15].
In the case of the two stations on Motilor Street, the necessary power is 44 kW. According to the TCA, the supply can be obtained from the connection slot situated on 2A Clinicilor Street, connected to an underground transformer station (PTS Pacii Square); the supply plan is presented in
Figure 4. The connection point is at a 0.4 kV voltage level, an approved power of 44 kW, 47.826 kVA. The charging stations have two Type 2 sockets [
13].
In this way, five EVs can be charged simultaneously at three charging stations, with all the socket types used in Europe. An option for fast charging exists. The total installed power is 94 kW. The average charging capacity is 36 EVs in 12 h [
16].
The implementation of this pilot project may help to analyze the demand for charging, types of standards most frequently used for charging, and the charging power, as seen in the data presented in
Figure 5. Based on these indicators, concerning the necessary number of stations, their type can be decided, and tendencies and evolution of demand can be analyzed [
17,
18].
To analyze the data generated by the charging stations, we integrated them into the Polyfazer Charging Stations Management Platform. The platform became operational in October 2018, and is available in Romania. After analyzing the printout of charging between October 2018 and January 2019, it can be seen that there were 291 finalized charging sessions, totaling 3603.115 kWh in 32,787 min. This means that the average charging time was 112 min/session. The average charged energy quantity was 12.38 kWh; these data are only available in the Polyfazer application.
The 11 kW station installed for internal usage registered 90 charging sessions, while the public station of 33 kW registered 44 charging sessions and the 50 kW station registered 157 charging sessions. There were, on average, 3–4 charging sessions a day.
To explain
Figure 6, we must highlight that from 6th of October to 1st of November, the charging stations were in a test period and were not available for the public.
After the public had access to the charging stations, the number of charging sessions grew, reaching a high point in the middle of November, and then decreasing during December. The charging station for internal usage began to be used later, after acquiring the EVs, and the number of charging sessions grew alongside the intense usage of EVs.
Based on the pilot project, we can state that there is a growing demand for using the public EV charging stations, given the growing number of EVs. Thus, the installation of charging stations was proposed in the following locations [
19]:
Inside existing public parking lots;
Inside parking lots under construction;
In modernized road infrastructure areas;
In the areas of public buildings that are to be rehabilitated (administrative buildings, cultural units, schools, etc.);
At all important exits of the city (consisting of 5–10 fast and slow charging stations);
In taxi stations;
In residential areas;
In public lighting points (here, the charging stations can charge directly from the supply of the public lighting system). This would be possible when the public lighting is off and when the charging stations are limited to the power of the existing TCA. There are 158 public lighting points that can contribute to 158 charging points evenly distributed throughout the city, serving home users.
Starting from these proposals, 38 charging stations were installed until the middle of 2022 and are currently monitored. They are distributed all over the city, in key locations. Both fast and slow charging stations were installed. Due to the market demand, an additional 47 charging stations are currently in the process of installation [
19].
The tendency is to install faster charging stations because the charging technology has improved and EVs have a higher storage capacity. Additionally, in areas where a higher power supply is available, the necessary circuitry has been foreseen for a larger number of stations. They are to be installed when the demand is higher.
One of the problems, discovered after the installation of several charging stations from different providers, is that every provider offers its own control and management app. This makes management more difficult, both for city hall and for the consumers. The latter must use more mobile apps to start the charging process, while city hall does not have access to all the data. One solution to this problem is developing an app managed by city hall. Thus, the degree of comfort in using the EV charging stations is growing, providing a better experience while charging EVs, regardless of the vehicle number and their producer.
A management platform of EV charging stations must provide the following operations:
Generating statistics, reports, and spreadsheets of charging in real time.
Exporting statistics and reports in PDF format.
The reports must contain information about the quantity of used electricity, the average charging power, length, and period of charging.
Possibility to open, close, reset, allow access, or initiate a charging session remotely.
Possibility of having access through Open Charge Point Protocol (OCPP) to technical data from the charging stations in order to analyze and solve some errors.
Possibility of establishing fixed or dynamic prices.
Accessibility to download the app from the virtual shops on most mobile devices (Apple Store or Google Play).
Providing a map with the available EV charging stations and guiding information for users to reach the closest station or the selected one.
Displaying the status of the charging station (free/occupied/out of service).
Displaying the remaining time until the complete charging of the EV.
Having the possibility of online payment.
Based on the above criteria, the EVCharge Cluj app was developed. It offers fast access to charging stations to EV users and city hall has access to data about stations, errors, and statistics in real time. The app is accessible by any user, being available in mobile operating systems application stores.
Figure 7 shows (in blue dots) the distribution of EV charging stations in Cluj-Napoca. We can see that they adequately cover the East–West access of the city. The northern and southern areas do not have the same infrastructure; more EV charging stations should be placed there. The app shows the available, occupied, reserved, and out of service charging stations and those with errors.
According to the data available from the management platform between January 2020 and June 2022 presented in
Figure 8, there were 38,440 charging sessions. The platform registered 4239 EV users, while the total consumed energy was 564.79 MWh. The average charging time was 67 min and the average consumed energy in one session was 14.67 kWh. The platform estimates a reduction in CO
2 emissions of 474.61 kg.
We may conclude from the graph in
Figure 9 that there is a growing trend in the energy demand for EV charging. In 2021, the consumption doubled when compared to 2020. In addition, the first 6 months of 2022 registered a consumption equivalent to the previous 2 years.
Based on the consumption in the analyzed period, we can state that electromobility is in a clear development phase. The rising number of EVs must be met by the development of charging stations. Moreover, providing regulations for the efficient usage of EV charging stations is necessary [
20,
21,
22]. To better understand the behavior of EV users, we need to analyze the data provided by the management app for every charging station.
4. Discussion
Our case study focused on the Unirii Square Charging station from January 2019 to June 2022. During this period, there was 76.22 MWh consumed in 3225 h; the station was used without charging for 26 h, it was out of order for 6 h, and it was free for 88,254 h, as seen in
Figure 10. The number of hours and the energy quantity represent the sum of the three available sockets.
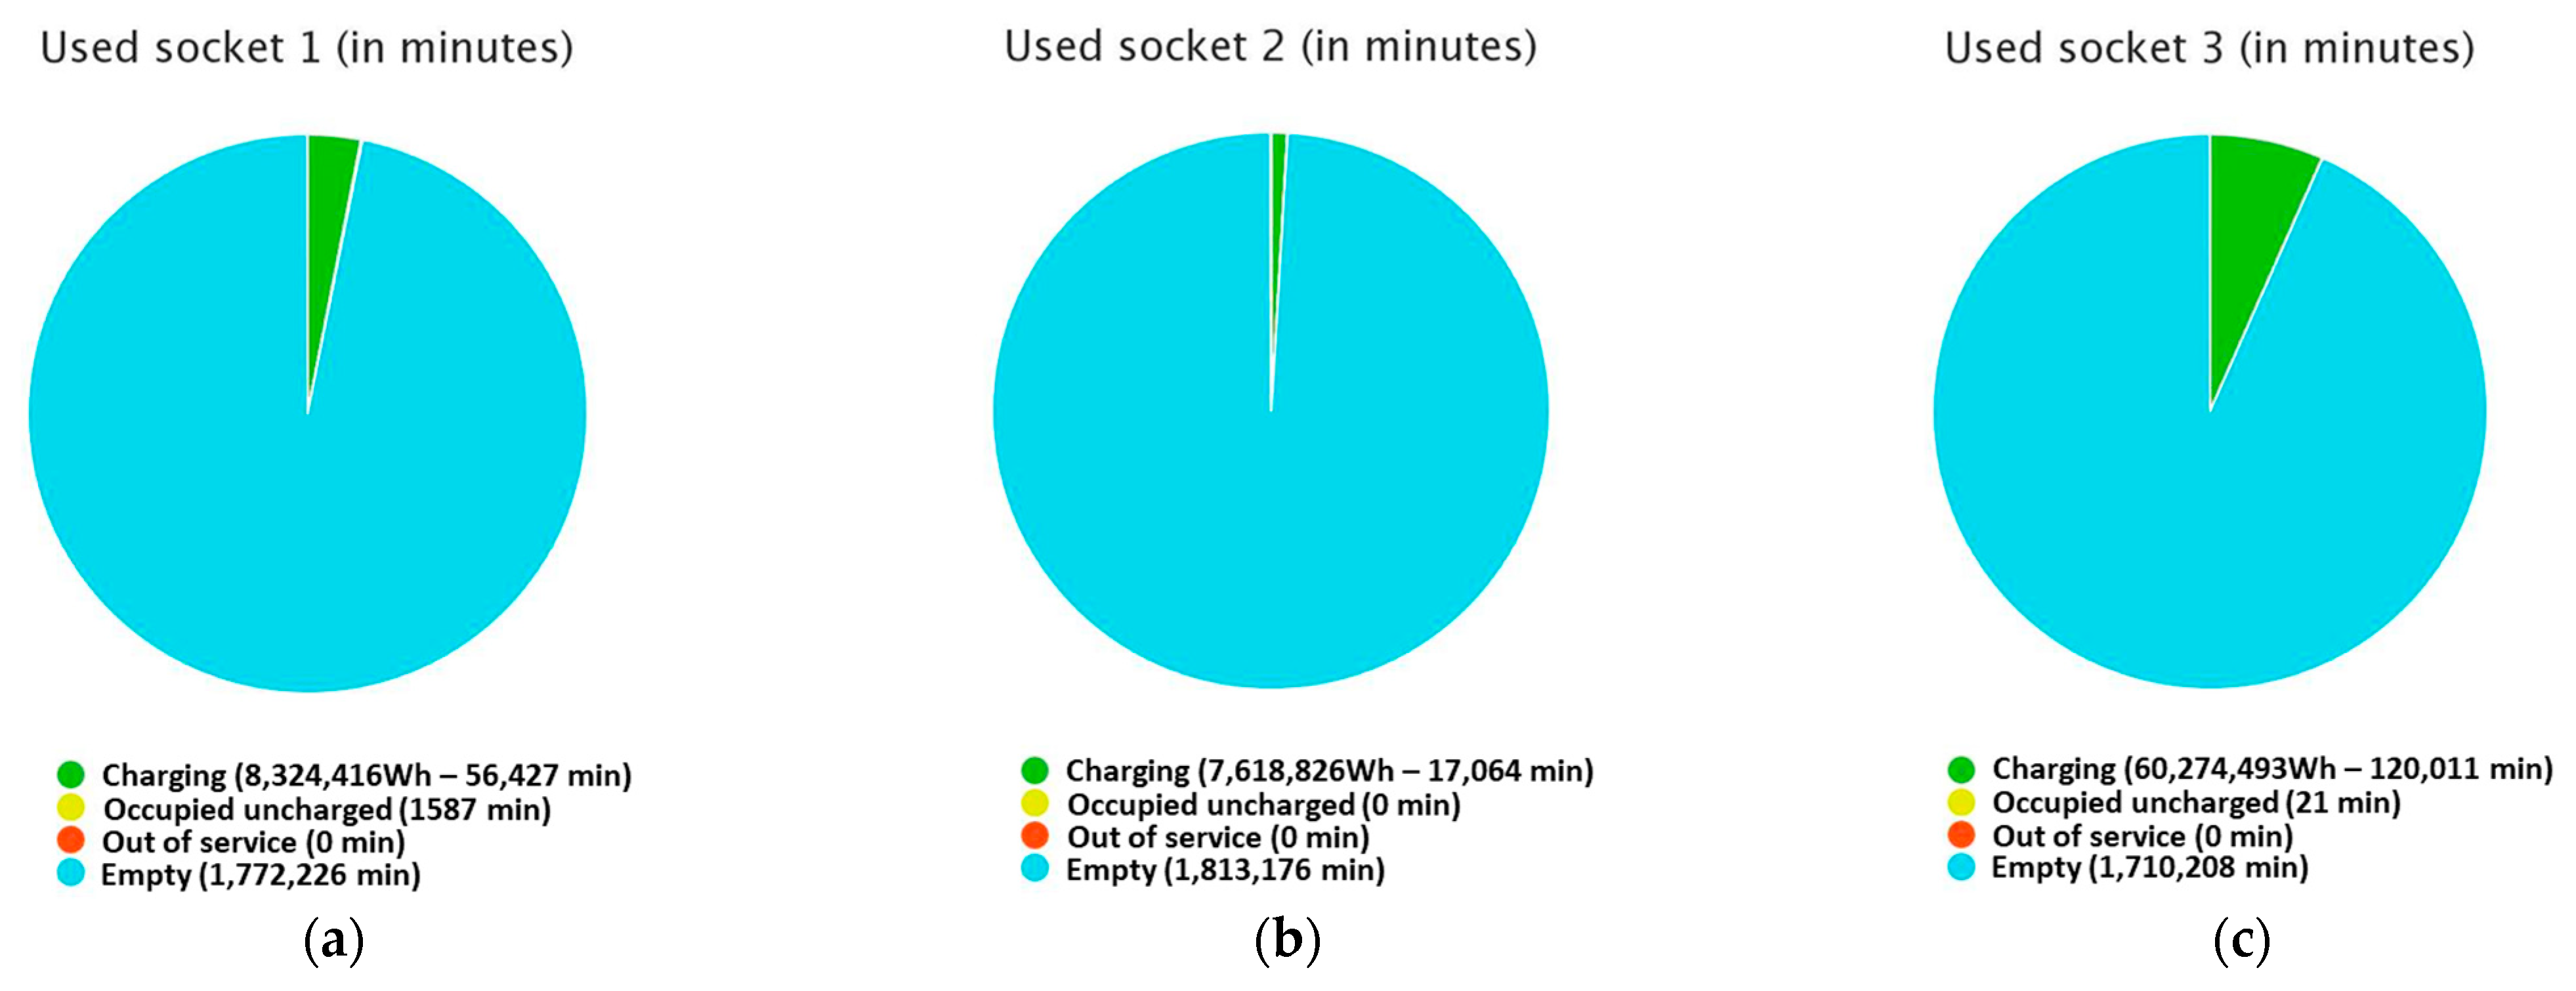
The consumption and the used period for every socket can be observed in detail, in
Figure 11.
Socket 1 uses the CHAdeMO standard. It charged 8.32 MWh in 940 h. The socket was busy but without charging for 26 h and it was free for 29,537 h. Socket 2 uses Type 2 standard. It charged 7.62 MWh in 284 h. The socket was busy but without charging for 0 h and it was free for 30,219 h. Socket 3 uses the CCS standard. It charged 60.27 MWh in 2000 h. The socket was busy but without charging for 21 min and it was free for 28,503 h. For this charging station, the most used socket was the one that uses the CCS standard for fast charging. It can be seen that the charging station worked under optimal conditions. It was out of order for 6 h, which represents less than 1% of the total monitored time. Even though the station was used daily, we see that it was actually used under 5% of the time, with over 95% of the analyzed period being unoccupied. The charging station is situated in the central area and the parking cost was around 1.6 EUR/h.
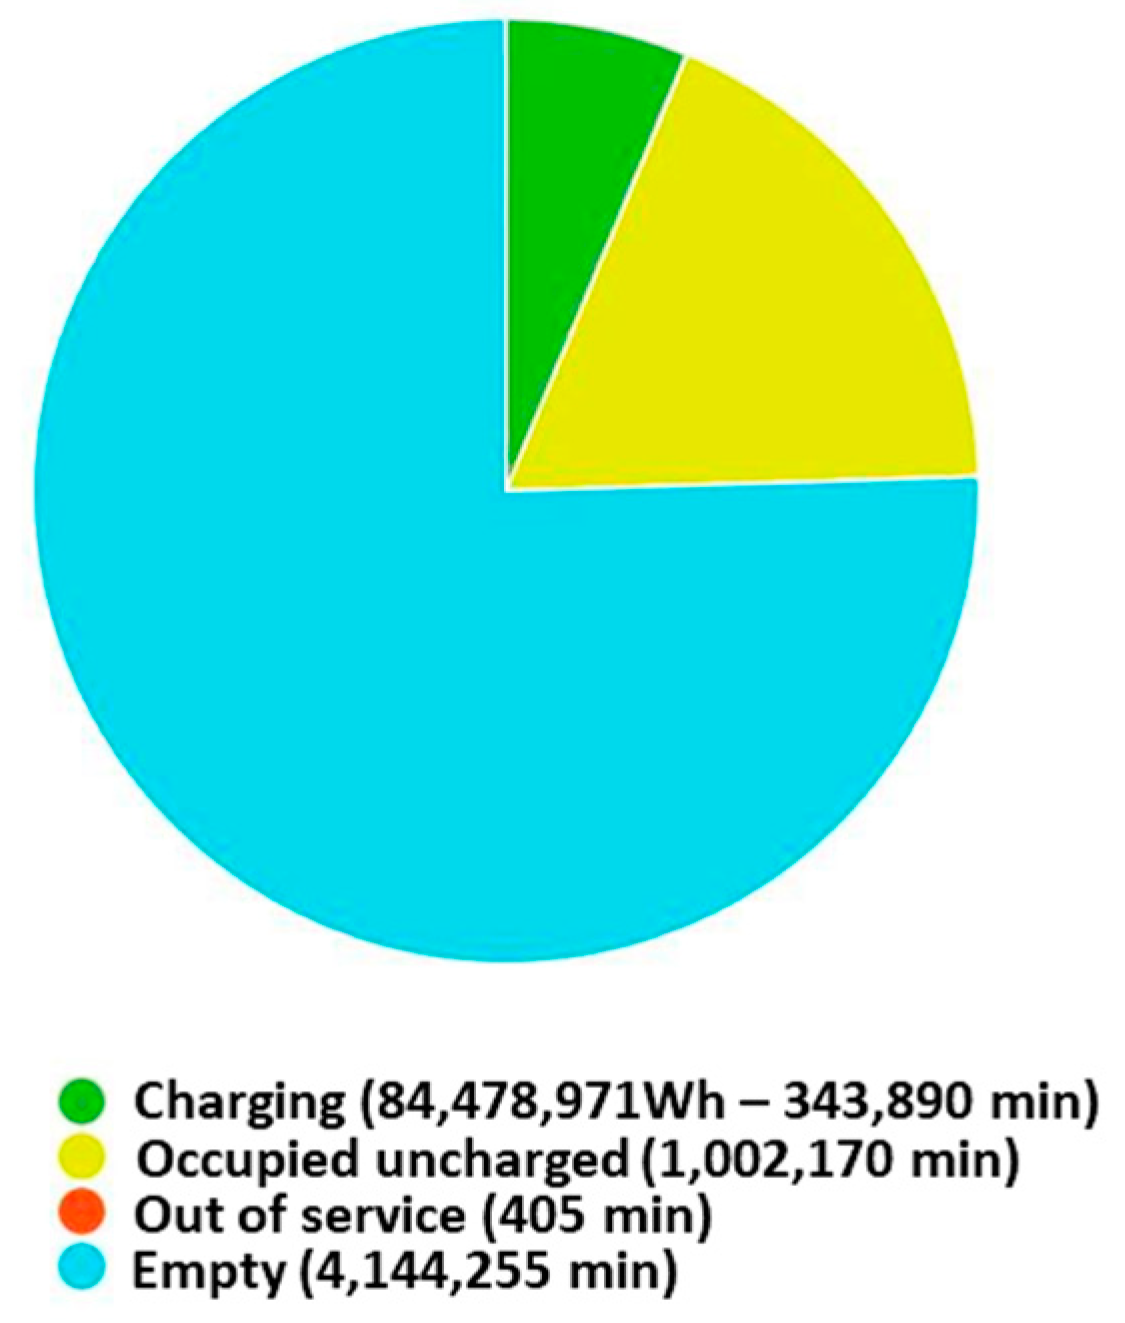
A special situation can be seen at a similar station situated in a residential area on Fabricii Street, where the charging is free. Here, the charging was 84.478 MWh in 5731 h. The charging station was busy but without charging for 16,702 h, it was out of order for 7 h, and it was free for 69,070 h, as seen in
Figure 12. The number of hours and the energy quantity represent the sum of the three available sockets.
The consumption and the used period for every socket is shown in
Figure 13. Socket 1 uses the CHAdeMO standard. It charged 29.68 MWh in 3454 h. The socket was busy but without charging for 3110 h and it was free for 23,938 h.
Socket 2 uses the Type 2 standard. It charged 6.0 MWh in 251 h. The socket was busy but without charging for 3926 h and it was free for 26,326 h. Socket 3 uses the CCS standard. It charged 48.74 MWh in 2024 h. The socket was busy but without charging for 9667 h and it was free for 18,812 h.
Due to its location, in a residential area with free parking, we noted that the charging station was busier with cars that were not charging, probably because the inhabitants leave their car charging overnight. It was also evident that the most used socket was also the CCS for fast charging, followed by CHAdeMO [
23,
24].
According to the data generated by the charging management software for electric vehicles in Cluj-Napoca, the average charging time for the last 3 years (2020, 2021, 2022) was 67 min. The average amount of energy charged by a vehicle was 14.69 kWh. The cost of the charged electrical energy varied depending on the cost of electricity (approx. 0.25 EUR/kWh in March 2023) [
25], resulting a cost of approximately EUR 3.67 for a full charge, which is significantly less than for petrol-based engines.
These statistics were calculated for 38,440 users. Analyzing the consumption of the two locations, we remark that there is a demand for EV charging stations, both in central and residential areas. The charging stations are available most of the time, but the tendency to use them is increasing. Most of the citizens prefer the fast charging. In the residential areas, there is a tendency to leave the EVs for charging for longer periods of time. The EV owners should be motivated to reduce the parking time after charging to avoid needlessly occupying the charging stations. An additional fee can be established after the charging process is finished. The charging requirements were covered by the charging stations with Type 2, CCS, and CHAdeMO connectors, being compatible with all the existent EV types. The charging time became shorter due to EVs’ increased absorption capacity and the higher power ratings of the charging stations.
EVs developed rapidly in the last decade and the technology reached its peak. The EV sector has seized a bigger market share. The main advantages are the low maintenance costs compared to thermal engine vehicles. In addition, EVs contribute to lower GHG emissions in urban areas. The EV charging infrastructure is developing and adapting to the market demand. The charging stations have higher capacity to keep up with the growing storage capacity of EVs, thus reducing the charging period. Alongside the EVs’ growing autonomy and reduction of charging period, more potential users are attracted to this alternative means of transport [
26,
27,
28].
5. Simulation of Energy Consumption
To determine the amount of CO
2 emissions reduced by installing the stations, we performed simulations using Simulink. The performance indicators of charging stations represent the amount of CO
2 emissions avoided by traveling with an electric vehicle, instead of a thermal engine vehicle. In the simulations, we considered an average EV consumption of 12.7 kWh/100 km covered [
29,
30,
31]. The average CO
2 emissions generated by an internal combustion vehicle, used in the calculations, were 0.130 kg/km. It should be noted that this reduction in CO
2 emissions is achieved if the electricity used in charging stations comes from renewable sources. The analyzed period was from January 2019 to June 2022. The CO
2 reduction was calculated using the formula:
where:
x—GHG emissions (kg CO2) reduced by using EVs instead of vehicles with internal combustion engines;
n—number of existing charging stations;
ei—electricity supplied by the i-th charging station (kWh);
B—GHG emissions from an internal combustion vehicle (kgCO2/km);
A—average energy consumption to cover 100 km.
Figure 14 shows the amount of GHG emissions that were reduced following the use of EVs that were charged at the station on Fabricii Street, which was 864.7 kg CO
2, as calculated using Simulink. It can also be seen that the electric vehicles that charged at this station during the analyzed period covered 6652 km. The above implemented subsystem can be used for any charging station for which we know the amount of supplied energy. Thus, we can enter the amount of energy, and after running the simulation, the software calculates the CO
2 emissions and the number of km that can be achieved. Hence, for all monitored charging stations, the above subsystem can be implemented, resulting in an application that can estimate the total reduction in CO
2. Simulink was chosen for the computations because the data can be extracted in .csv format and used in other models, and the subcircuit can also be integrated into a larger model to better estimate the CO
2 reduction for all charging stations that exist in the city and the ones that will be installed in the future.
A total reduction of CO2 emissions of 8589 kg CO2 was observed, after running simulations with the data obtained from all charging stations, until September 2022. This application was also useful for the installation of new charging stations, by allowing objectives to be set based on verified historical data. By entering the number of stations to be installed, the application can estimate the reduction in CO2 emissions that will be achieved in the next 2.5 years, based on consumption histories and by using a growth factor of 15% (this was chosen based on estimates of EV growth in the following period). It should be noted that the CO2 emissions generated during the production of the electrical energy used to supply the charging station were not taken into account, and the reason is twofold: firstly, Cluj-Napoca is partially supplied with energy obtained from a hydropower plant, and secondly, the rest of energy is not produced in the urban area, so the pollution resulting from the energy production occurs in a green area where CO2 is rapidly assimilated.
6. Conclusions
Currently, the increasing number of EVs is a known fact. In Romania alone, in 2022, the number of hybrid and electric vehicles increased by 84%. The case study performed for Cluj-Napoca showed that using the existing infrastructure, it would be easy to install new charging stations, especially in high-traffic areas. Cluj-Napoca is a city where commuting is common, so having charging stations distributed all over the city is of paramount importance. In Cluj-Napoca City Hall, there are development programs for increasing the number of charging stations for electric vehicles. It is estimated that by 2026 the number of charging stations will exceed 200 units. Additionally, to develop the capacity to produce electricity from renewable sources, the City Hall of Cluj-Napoca has several investment projects underway for the installation of photovoltaic panels with the aim of producing electricity for self-consumption and for electric cars. To date, through a pilot program, photovoltaic panels have been installed on seven public buildings. Feasibility studies were also carried out for the installation of photovoltaic panels on more than 60 public objectives [
32].
The model developed using Simulink proposed by the authors is a useful tool to predict the energy consumption at each charging station, and the reduction in CO2 emissions from the consumed energy, with the results being confirmed by the data extracted from the charging stations. The model was tested for the presented use cases, where the data was available, but can be expanded to include any location, current or planned. The data from the model can be easily exported in .csv format and can be used as input for larger models.
By performing the current study, we created an overview of the existing infrastructure, user behavior for the existing charging stations, and predictions about the future projects based on the successful implementation of the current one. The essential information is easy to access. It is also easy to develop the application as the number of stations increases by adding new subsystems. It is enough to update the energy consumption achieved at each station to have an overview of the reduction in CO2 emissions and the kilometers traveled by EVs charged at the analyzed stations.


