1. Introduction
In the aftermath of the COVID-19 pandemic and the outbreak of the war in Ukraine, persisting effects of a global-scale energy crisis [
1] have reshaped the energy landscape in Europe [
2,
3]. High exposure to natural gas and limited supply diversity previously identified have now given birth to drastic initiatives, such as REPowerEU [
4], calling for unprecedented changes and an accelerated energy transition associated with a vast rollout of renewables. Increased energy prices, market volatility, and supply chain bottlenecks on the other hand, are all counteractive toward investments in the field of renewable energy sources (RES), delaying what is considered to be a much-anticipated transition [
5].
On the technical front, and with regards to power systems, higher shares of RES expected shall, apart from strengthening energy security, introduce high levels of uncertainty; thus, the need for increased reserves. To that end, power system flexibility components like energy storage [
6], demand side management [
7], interconnectors [
8], advanced energy management, and forecasting [
9,
10], are all complementary solutions in addressing the intermittent character of renewables. Amongst them, energy storage probably stands as the most mature alternative; limited, however, by its persisting, capital-intensive character, and increased costs overall.
In the meantime, the phase-out of support schemes for RES, such as with feed-in tariffs, suggests that new RES installations are gradually set to directly face the market, which adds to the already existing technical challenges by also introducing higher risks in terms of investment and also greater requirements on the operational front. The higher the share of non-dispatchable RES in a given power system, the higher the risk of non-dispatchable RES power generation becoming curtailed, which in turn leads RES actors to investigate the option of supporting means. The latter are meant to improve RES dispatchability and allow also for the development of informed market integration strategies for the involved RES actors [
11]. Coupling of RES and energy storage towards that direction introduces different schemes and synergies; individual or multi-actor [
12], physical or virtual [
13], that enable better dispatch terms under calculated risk. This of course tends to be more urgent in the case of wind energy, which is inherently determined by higher levels of uncertainty. Owing to that, as wind energy shares tend to increase in an electricity system, the risk of wind energy curtailments gets higher, with certain, existing systems already determined by increased levels of rejected wind energy [
14]. At the same time, since wind parks are gradually set to face dynamic pricing patterns, as a result of their participation in day-ahead electricity markets, there is a need for wind park owners to develop optimum bidding offers and strategies so as to hedge the risk associated with the variation of electricity prices and wind power generation.
To that end, research in the specific field has been vast recently, with the current body of literature mainly focusing on the design of optimum dispatch models for the participation of different wind–storage configurations in the day-ahead and other markets. Relevant to that, in [
15], the authors developed two optimization models for the short-term self-scheduling and redispatch of a virtual power plant (VPP) composed of a wind farm and a Li-ion battery, looking into the day-ahead energy and secondary regulation reserve markets of the Spanish power system. Next, in [
16], the authors studied the performance of wind–PHS configurations participating in the day-ahead energy market. In doing so, they proceeded with the examination of a multi-objective optimization problem, using the objectives of direct economic benefits, carbon emissions, and grid stability. Furthermore, the authors in [
17] worked on the development of optimal day-ahead operation of a wind–hydrogen configuration, also introducing uncertainties relating to day-ahead prices and wind power generation, estimated with the application of appropriate forecasting models. A similar problem is also evaluated in [
18], where a wind-compressed air energy storage configuration was examined in the context of parallel participation in the day-ahead, the intraday, and the balancing markets.
Adding to the current body of literature, our research is set to focus on a higher level of analysis, introducing long-term temporal and also spatial aspects at the national level, while also examining problem dynamics in a broader spectrum of scenarios for different, market-related wind–storage narratives. In more detail, instead of focusing on the optimum dispatch of a given size configuration under specific market and wind conditions, we presently put forward the execution of an extensive parametrical analysis, adopting an empirical approach. Our aim, to that end, is the generation of national-scale findings for different wind–storage configurations and the investigation of the wider problem’s sensitivity under the application of more practical dispatch strategies, using the Greek electricity market as a problem application setting.
Greece, which finds itself in a transitional stage concerning its energy status, has recently embraced ambitious targets concerning the shares of RES to be anticipated in the local electricity sector by 2030. The initial target of 60% [
19] is nowadays under revision, with the aspiration to exceed 70% and even reach 80%. Given that the current (2022) shares of RES reach ~40% [
20], the required pace of transition calls for massive investments by the end of the decade, with minimum storage needs in order to support this transition estimated at the levels of 1.5–2 GW [
21] and above. At the same time, with the application of the Target Model, new RES power plants are now obliged to participate in the Greek wholesale electricity market, with the latter lately determined by high levels of volatility and increased spot prices, owing to both the effects of the ongoing energy crisis and the application of the new Target Model [
22].
Having said that, interest is building up on the design, elaboration, and value assessment of dispatch strategies for RES and storage schemes in the Greek electricity market, in line with recently published research in the field. On the other hand, there are only a few studies [
11,
23] focusing on the day-ahead market and on the actors’—rather than the system’s—point of view. This also comes with strategic planning implications for the Greek electricity system; since, so far, emphasis has been given, regarding the Greek mainland system, solely on the discussion concerning the development of centralized storage [
21], largely neglecting the alternative for the development of distributed, smaller-scale energy storage at the local/installation level. At this point, it is also important to mention that similar research on the development of smaller-scale wind storage schemes regarding the Greek territory has traditionally focused on the market of non-interconnected island regions [
24]. This is justified by the increased electricity generation costs on the one hand, owing to the high shares (~85%) of oil-based power generation locally, and the recording of considerable wind energy curtailments for certain island systems on the other, stimulating research on the emergence of hybrid wind–storage solutions.
Acknowledging that, by assessing the value of practical dispatch strategies for a broad set of operational scenarios and wind–storage configurations, our study also aims to contribute to the wider context of policy–making discussions regarding the transformation of Greece’s electricity sector, introducing what is seen as potentially emerging wind–storage narratives and an alternative to the sole establishment of centralized storage. The next chapters of the paper are organized as follows: in
Section 2, we present the input data used for our analysis, together with the main methodological aspects.
Section 3 provides the results and relevant analysis for each of the different scenarios examined, while in
Section 4, a discussion of the study results takes place. Conclusions of the research are next provided in the final section,
Section 5, of the paper.
2. Materials and Methods
2.1. Input Data
Input data used for our analysis includes long-term, historical data of day-ahead prices for the Greek electricity market together with a detailed set of wind speed time series for ten different wind regimes, representative of the broader Greek territory. The former corresponds to a 7-year period (2015–2021) that captures a wide span of price variation and trends, also including the extreme price year of 2021 (owing mainly to the local market’s exposure to high natural gas prices), and the latter is descriptive of different wind speed patterns for low-, medium-, and also high-quality wind potential areas in Greece. Hourly time series used in the study are given in
Figure 1; while accordingly, the respective duration curves are given in
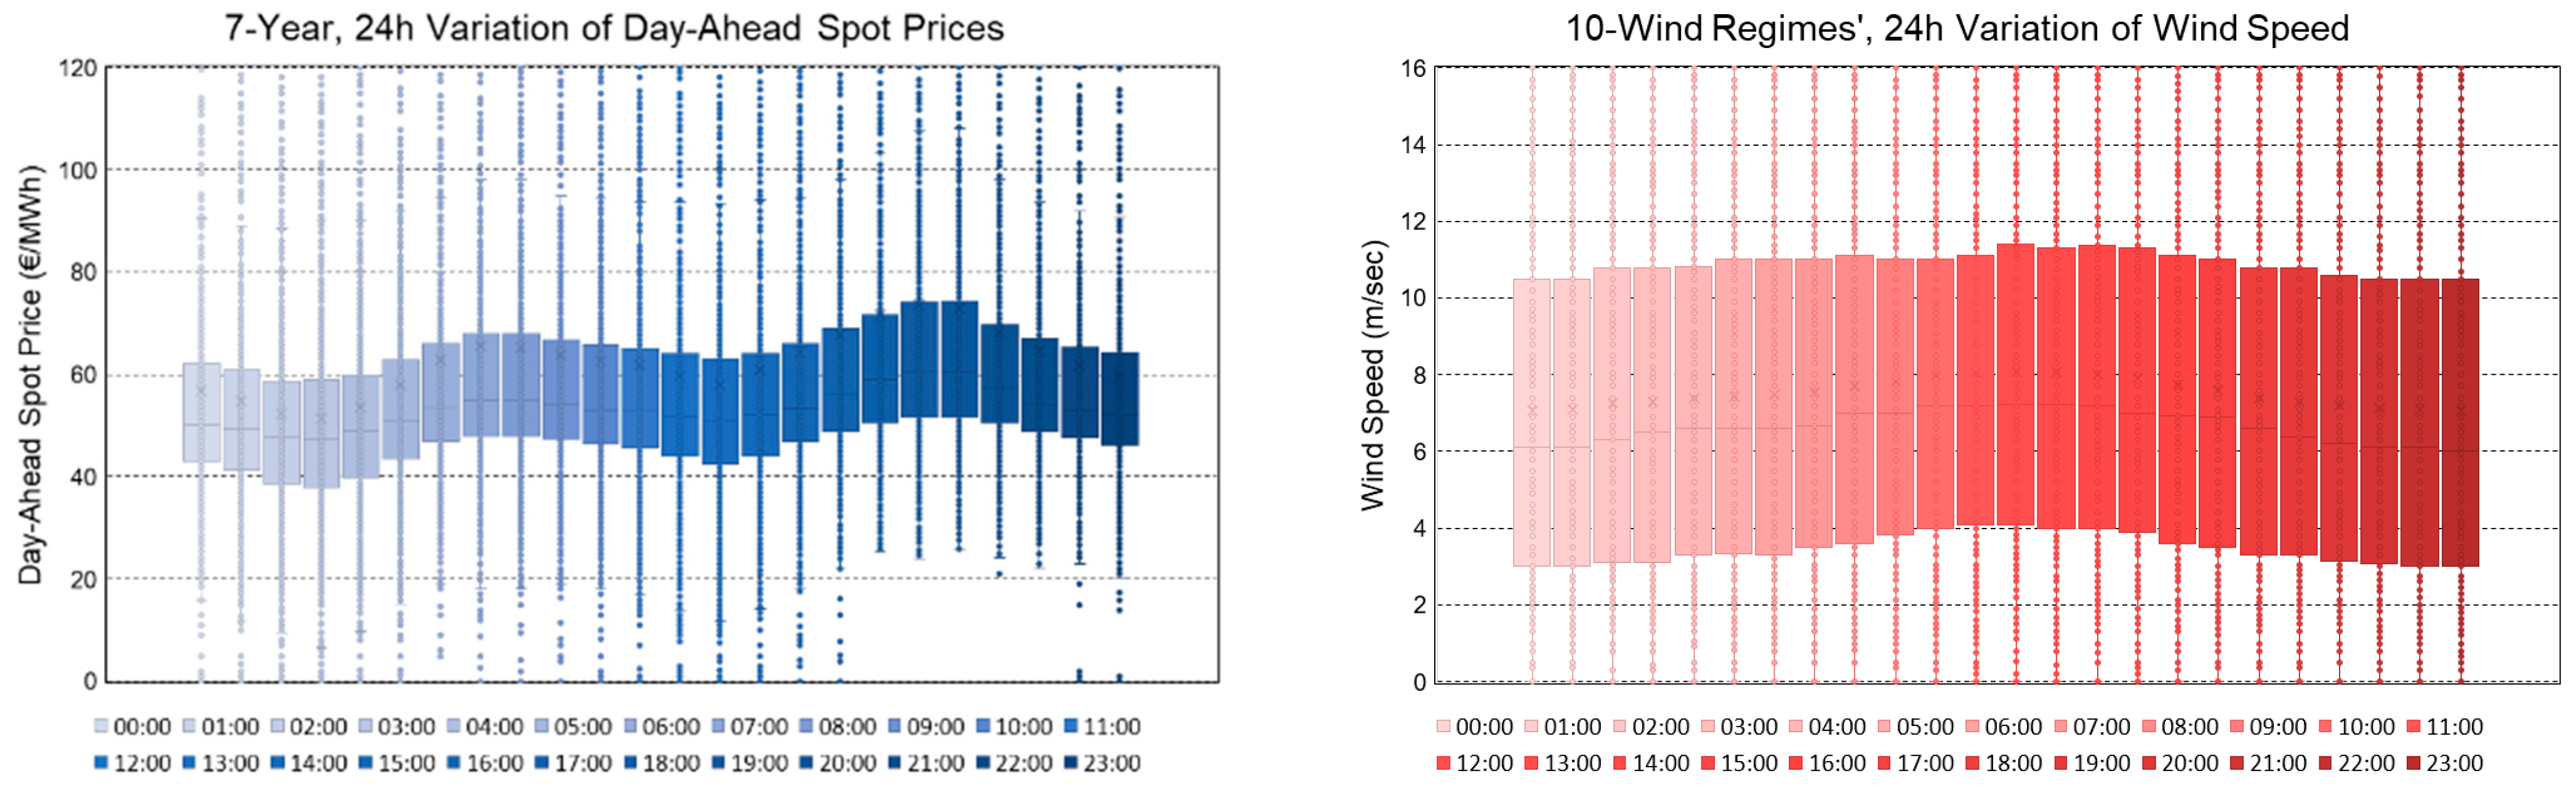
Figure 2. In addition, 24 h box plots are provided in
Figure 3 for the entire 7-year period and set of wind regimes studied.
To that end, the 7-year period examined introduces a notable variation of prices over the course of time, with a remarkable increase for the year 2021, with values well exceeding 150 €/MWh during the second half. Concerning daily variation patterns for the entire period, narrow (50th percentile) and wider price spreads (25th and 75th percentiles) between peak and off-peak hours are in the order of ~50–60 €/MWh and ~40–70 €/MWh.
Accordingly, different wind regimes studied exhibit a similar seasonal pattern, with wind speeds decreasing during the mid-period of the year. Annual averages, on the other hand, vary from a minimum of 5.5 m/s to a maximum of 11.2 m/s (
Table 1), while daily variation follows a mild, bell-shaped curve, opposite to the standard two-peak load curve pattern demonstrated by the variation of electricity prices.
2.2. Problem Definition and Methods
To assess the value of emerging, market-related wind–storage schemes in Greece, we perform a comparison between the latter and the reference scenarios of an individual wind park/storage actor. In the first case, the wind actor is set to operate under a simplistic, direct market participation strategy, challenged by the complementarity between the historical spot price and the inelastic wind energy production patterns, assuming full dispatchability of wind energy at all times (no curtailments and/or penalties for non-compliant energy offers are considered, while only active wind power is taken into account, with recent research in day-ahead market modeling also investigating the exploitation of reactive power [
25]). On the other hand, the standalone storage actor is set to operate on the basis of practicing standard trading (arbitrage) strategies, utilizing empirical market signals for the implementation of both charging and discharging decisions under the application of daily and intraday operational cycles, and with the aim to exploit maximum electricity price spreads. Against these two reference scenarios, which we treat as
Narrative A and
Narrative B, we evaluate the coupling of the wind and storage components, letting storage charging rely exclusively on wind energy, with its discharging being market-driven. Furthermore, through the examination of three new narratives, we also investigate different actor schemes, as follows:
Narrative C: both the wind and storage entities are owned by an individual actor, which in turn suggests zero cost charging fees for the storage component.
Narrative D (non-constrained power system): the wind and storage entities are owned by two different actors, and are operated in a non-constrained (non-saturated) energy market environment in terms of RES shares, implying full market dispatchability of wind energy. As such, wind energy charging fees are assumed to reflect on day-ahead market conditions (set equal to 100% of the appearing historical spot price).
Narrative E (constrained power system): the wind and storage entities are again assumed to be owned by two different actors. This time, the market setting concerns a saturated environment in terms of RES penetration. As such, wind energy charging fees are set to reflect the risk of curtailments; which, implies a reduction in the offered price for storage charging (an indicative 50% over the historical spot prices is adopted).
To that end, the matrix of examined scenarios and framework of analysis are synopsized in
Figure 4 and
Table 2, with the storage charging fee (SCF) coefficient supporting the differentiation of narratives, from an individual wind storage actor
(Narrative C) to independent wind/storage actors in different market environments (
Narratives D–E).
The above aspects are incorporated in the formulation of an extensive, parametrical analysis problem, looking into the value generated by market-related wind–storage configurations, also taking into account different application settings and assuming a price-taker approach. These reflect on a matrix of different cycling patterns (single cycle on a daily basis and two cycles on an intraday basis), different wind regimes, and different levels of spot prices, also considering the variable of energy storage capacity. Moreover, the analysis performed considers the exercise of hourly simulations on an annual basis, under the adoption of a brute force, ex-post approach, capturing all possible combinations of wind–storage configurations, wind regimes, and historical datasets of day-ahead electricity prices examined.
In the same context, in
Figure 5, the flow diagram on the energy balance analysis of combined wind–storage configurations is also provided; while finally,
Table 3 provides the technical characteristics assumed for the storage and wind components. As far as the former is concerned, we consider a round-trip efficiency of ~75%, together with a conservative maximum depth of discharge of 75% and a variable storage capacity of 5 to 25 times the wind power capacity, at a rate of 1C and C/3 for 1 h and 3 h duration of charging and discharging, respectively.
Further details concerning the applied methodology lie in the following set of equations (see also the nomenclature), governing the energy balance analysis and value assessment of market-integrated wind–storage configurations. More precisely, the first set of equations introduces a typical wind power curve currently considered (see also
Table 3), together with the balance of wind energy production, taking into account the parts of wind energy used for storage charging and directed to the day-ahead market, respectively.
Accordingly, the second set of equations concerns balance of the storage component, limited by the maximum depth of discharge
DoDmax and considering charging and discharging efficiencies (
ηc and
ηd), as well as the rates of charging and discharging of 1C and C/3, respectively.
Finally, the net and specific net revenue (
NR and
SNR) are estimated for each of the examined narratives, taking also into account the associated value of the
SCF (0%, 50%, and 100%) and empirical market signals (
and
), determined under
Section 2.3.
2.3. Empirical Market Signals
Following the presentation of the input data series and the problem’s definition and methods, a 24 h analysis of historical electricity prices was conducted in order to gain a better understanding of the exhibited trends during the entire 7-year period studied and then to inform the generation of market signals for the application of arbitrage strategies. In doing so, we performed a ranking of day-hours, starting from the one featuring the highest (1st) and resulting to the one featuring the lowest (24th) electricity price (hours receive the same ranking if prices are equal). Ranking was performed for all days of the 7-year period and then used for the development of the probability map given in
Figure 6a. Similarly, and in order to assess the impact of letting the execution of two operational cycles take place within the day for storage and wind–storage configurations, the analysis was repeated on an intraday basis with mapping results provided in
Figure 6b,c.
According to our analysis of the daily cycling routine, hours with the lowest ranking appear between 2:00 and 4:00 at night (blue shade), while hours with the highest ranking appear from 17:00 to 19:00 in the afternoon. With regards to the intraday analysis, for the first half of the day (00:00–11:00), hours with the lowest ranking correspond to 2:00 to 4:00 at dawn, while hours with the highest one appear from 6:00 to 8:00 in the morning. Finally, for the second half of the day (12:00–23:00), hours with the lowest ranking are at 22:00, 23:00, and 13:00, while hours with the highest ranking are from 17:00 to 19:00 in the afternoon.
As such, two opportunities for arbitrage trading are identified. The first involves a complete charge–discharge cycle of the storage component within 24 h, for which the unit is set to buy/charge in the early morning ( from 2:00 to 4:00) and sell/discharge in the afternoon ( from 17:00 to 19:00). Accordingly, and on an intraday basis, two cycles can be performed, with charging slots referring to the periods from 2:00 to 4:00 and from 12:00 to 14:00, and with discharging slots capturing the periods from 6:00 to 8:00 and from 17:00 to 19:00.
Finally, the duration of charging and discharging periods is, as already implied, also set to vary. The first option suggests a 1 h duration for the charging and discharging to take place, while the second considers a 3 h duration for both parts of the full operational cycle (equally distributed across the 3 h duration), taking also into account that the charging and discharging rates are configured accordingly (i.e., 1C and C/3 rates are assumed).
3. Results
Simulation results obtained from the application of the scenarios’ matrix and elaborated market signals are provided in the following paragraphs, organized per different narrative examined and on the basis of the following two main indices, already seen earlier (Equation (3)). The latter include the annual NR (or profit, in k€/year) per MW of wind power capacity, together with the annual SNR (in €/MWh of energy delivered to the day-ahead market and/or traded amongst actors), with results given in the form of box plot graphs in relation, for the majority of cases, to the variation of the storage size component and the cycling option examined.
3.1. Narrative A
The first scenario involves the standalone, direct participation of a wind park actor in the day-ahead market, under the assumption of 100% wind power dispatchability, i.e., facing no curtailment restrictions. All different wind regimes and spot price years are taken into account together with a typical, MW-scale wind turbine power curve, as seen earlier. Results obtained are provided in the next figure,
Figure 7, with the annual revenue following an increasing trend, which is in line with the quality of the examined wind regimes. Considering the 50th percentile, the resulting range of variation stands between ~100 k€ and 300 k€, reflecting the influence of the different quality of wind potential and degree of complementarity between price and wind speed patterns. At the same time, specific revenue values are mainly concentrated in the area of 40–60 €/MWh, with the extremes of >100 €/MWh corresponding, as anticipated, to the year 2021.
3.2. Narrative B
The second scenario examined concerns market participation of a storage actor on the basis of empirically determined market signals used for the application of arbitrage. Under the given scenario, the storage asset interfaces the market both for charging (buying) and discharging (selling), taking into account a total of five different cases regarding its capacity, alongside four different cycling options. The former involve storage capacity ranging from 5 MWh to 25 MWh, and the latter concern day-ahead and intraday cycling (one and two full cycles, respectively) of 1 h and 3 h duration. Results obtained are next provided in
Figure 8, where the annual
NR and
SNR are again presented.
According to the results, an increase in the storage size under a dispatch strategy of a single cycle per day implies an increase in annual NR; mainly for the 1 h duration cycle. On the other hand, negative NR values appear in both cases (1 h and 3 h duration), resulting from the spot years with the lower appearing price spreads. Furthermore, the annual SNR is found positive for approximately 50% of the examined configurations; while, if considering 2021 alone, the former ranges between 20 €/MWh and 30 €/MWh.
Results are somewhat different in the case of intraday cycling, where the majority of solutions generate negative annual
NR values, owing to the lower spreads appreciated in comparison to the single-cycle approach. Due to that, the size increase of the storage component introduces greater losses, which is reflected in
Figure 8a. In the same context, values of annual
SNR are also kept negative in their majority (
Figure 8b), with the exception of spot years determined by the highest price levels, generating a positive output that may even reach the levels of ~25 €/MWh.
3.3. Narrative C
Accordingly, the individual actor narrative is extended towards the evaluation of coupled wind storage schemes, with results—firstly of
Narrative C—provided in
Figure 9. Under the given configuration, storage charging is set to rely exclusively on wind energy production, free of charge (
SCF = 0%), also assuming 1 MW of wind power capacity. On the other hand, storage discharging decisions are market-driven, in accordance with the signals generated earlier, and any excessive wind energy, as a result of a fully charged storage, is assumed to be delivered directly to the market, at the given spot price, without facing any curtailments.
To that end, with the increase in storage size, the annual NR presents a slightly decreasing trend, while the opposite is true for the annual SNR. This is explained on the basis of storage losses, which increase with the size of storage, and as such, they tend to reduce the energy amount delivered to the market.
Furthermore, and concerning the comparison between the different cycling patterns, daily cycles and 3 h of duration generate marginally greater revenue, which is comparable to the value of the intraday cycling pattern and the case of the 1 h cycle duration. At the same time, comparison between the combined wind–storage and the standalone wind scenarios of
Narrative A (
Figure 7) suggests that, in certain instances, coupling of the two components could result in the generation of slightly higher revenues.
This reads somewhat differently if also considering the risk of curtailment for the excessive part of wind energy delivered to the market. As one may note from
Figure 10, storage size increase implies minimization of excessive wind energy shares; which, is currently considered as equivalent to improved terms of dispatchability, and which is also common for
Narratives D–E. Taking cycles of 1 h duration, for example, it can be noted that storage autonomy in the order of 15–25 h, over the 1 MW of wind capacity, is assumed to minimize the risk of wind curtailments, with ~80–100% of the wind energy yield channeled to the market through the storage component. Lower autonomy of 5 h is also appreciable, however; especially, in the case of intraday cycling, where the excessive wind energy shares drop well below 55%.
Finally, it can be noted that the excessive wind power shares tend to be higher in the case of the 3 h duration cycles and lower in the case of bigger storage sizes (>15 h for daily cycles and >5 h for intraday cycling). This suggests that under Narrative C, longer duration cycles are found to underperform in terms of anticipated revenue and in terms of risk hedging, with the second part of the argument holding true for Narratives D–E as well.
3.4. Narrative D
Following the presentation of the individual actor narrative regarding the coupling of the wind and storage components, we next examine the scenario of coupling between independent wind and storage actors. Two different cases are taken into account; the first introduces a SCF of 100% over the appearing spot price and the second assumes a SCF of 50%. These fees apply to the share of wind energy used for storage charging; thus, they influence the net revenue generated by the storage asset.
Regarding the first case (
Narrative D), the
SCF of 100% is considered representative of a non-constrained energy market with regard to wind power dispatchability. Under this setting, the annual wind energy yield is assumed to be fully absorbable by the market, and as such, the claimed price for the wind power component is assumed to be equal to the appearing market price (
). Owing to that, the
SCF determining charging fees for the storage components is set equal to 100%. With this in mind,
Figure 11a presents charging fees of the storage actor; or equivalently, partial revenue of the wind actor that excludes the part of the excessive wind energy delivered directly to the market, and
Figure 11b presents the annual
NR of the storage actor. Additionally,
Figure 12 as follows, provides the share of revenue of the wind actor that is generated by the excessive part of wind energy delivered to the market.
To that end, the influence of the 100% fee coefficient applied is clearly reflected in the graphs of
Figure 11, with annual charging costs increasing rapidly with the increase in storage size. The impact of that on the annual
NR of the storage component is obtained in
Figure 11b; where in almost all cases, the values obtained are negative, and which compares unfavorably with the results of the individual storage actor and arbitrage-based strategy under
Narrative B. This is due to the fact that wind energy charging is not limited by the empirical time signals for charging decisions used in
Narrative B for the storage component; instead, it follows the pattern of wind power generation, allowing for the maximum possible charging of the storage component prior to the time points of it selling energy to the grid. In the meantime, and regarding the aspects of storage size and cycling, in accordance with
Figure 11, storage sizes greater than 10 h produce the lower values of revenue, while the 3 h duration cycling results appear marginally higher than the ones of the 1 h cycling.
Next, in
Figure 12, we provide the share of market revenue achieved by the wind actor, independently of the storage actor. Such revenue relies on the excessive part of wind energy production (
Figure 10), and is common for all
Narratives C–E, under the assumption that the resulting excess of wind energy generation is fully absorbed by the grid. This is challenged as an assumption under a setting that represents a constrained energy system in terms of wind energy penetration, and which may concern all previous narratives and especially
Narrative E, with the exception of
Narrative B.
As such, results presented in
Figure 12 are considered optimistic, and are determined by a higher degree of certainty in the case of bigger storage sizes, under which the shares of direct delivery of wind energy to the market minimize or even zero out. In the meantime, and also reflecting on the pattern of
Figure 10, the 3 h cycling generates higher values of revenue than the 1 h cycling, with the difference becoming greater for storage sizes bigger than 10 h of storage capacity.
3.5. Narrative E
By assuming a 50% fee coefficient, we next reflect on the scenario of constrained dispatchability for the wind actor. Arguably, this provides an incentive for reducing the
SCF, which is exploited by the storage actor in order to hedge the risk of wind energy curtailments by providing a dedicated energy sink (load). Results of this scenario are given in the following
Figure 13a, focusing on the annual
NR of the storage actor, and providing a comparison with the respective revenue of
Narrative C, under a
SCF value of 0%.
To that end, all revenue values of
Figure 13a are kept positive; thus, demonstrating an inverse trend to the one shown in
Figure 11b. In more detail, storage size increase is now suggesting an increase in the annual
NR of the storage component, moving asymptotically beyond 10 h of storage, especially in the case of intraday cycling. At the same time, and as anticipated, results are further improved if considering the case of 0%
SCF, with the annual
NR found to more than double (
Figure 13b).
5. Conclusions
The present study focused on assessing the value associated with the emergence of different, market-related wind–storage schemes, using the Greek day-ahead electricity market as a case study. To that end, based on the conduction of an early empirical analysis for long-term wholesale price patterns, we developed market signals in order to inform the development of practical dispatch strategies for the storage component, also allowing for the introduction of different cycling routines and storage sizes, together with the examination of several wind regimes. In addition, we described different actor settings and narratives and proceeded to the application of the developed strategies for all possible configurations, with output results focusing on the operational revenue generated, also in relation to associated dispatchability risks. To that end, our results initially emphasized the comparison between different storage sizes and cycling routines for each of the narratives examined; while accordingly, further discussion of initial results allowed for a higher-level comparison amongst narratives as well as for an assessment of the associated risk introduced by the problem’s two main dimensions, i.e., the temporal effect of spot prices and the spatial effect of different wind regimes.
Based on our analysis, the potential for the development of similar schemes relates strongly with market conditions, with this taking into account both the prospective incentive of wind actors to gradually negotiate with storage entities in order to hedge future curtailment risks and the persistence of high energy prices in electricity markets. On the other hand, influence of the wind regime and wind potential quality appears to be less important in terms of specific net revenue achieved; which, can be also perceived as of broadening the application scope of similar schemes. Synthesis of multi-actor schemes to that end, with the inclusion of, e.g., different wind actors coupled with a unique storage actor or asset, could generate higher competition and at the same time benefit from the complementarity of different wind profiles, also introducing the notion of aggregating strategies as an extra alternative worth examining. Another aspect of increased research interest to that end relates to the investigation of establishing direct PPAs between wind and storage actors on the basis of fixed energy prices, with the latter hedging the risk introduced by the variation of market prices. Furthermore, and in the pursuit of a broader assessment, the temporal impact of wind speed variation may be also incorporated in a similar analysis, on top of the spatial dimension, with more substantial results taking also into account the quantified risk of wind energy curtailments in energy terms, in addition to SCF implications examined under this study. In this context, it is worth mentioning that the Greek energy market is nowadays faced with the threat of emerging RES curtailments at the national grid level. This calls for imminent actions in the planning stage, with efforts so far directed to the development of centralized, utility scale energy storage, such as with pumped hydro storage stations. Although similar solutions can be determined by several advantages, like lower costs due to economies of scale, they also present limitations associated with long construction times and the potential establishment of more oligopolistic models in the sector. On the other hand, distributed energy storage may also respond to the arising challenges, at a potentially faster pace and in a more flexible fashion, offering the opportunity for the development of a variety of schemes that may foster greater competition. To conclude, our analysis is in line with this argument and is set to contribute to the given field through the initiation of a broader discussion on both the development and valuation of alternative wind and storage schemes in Greece.


