
Assessing Predictions of Australian Offshore Wind Energy Resources from Reanalysis Datasets


Abstract
:1. Introduction
1.1. Australian Offshore Wind Resources
1.2. Climate Reanalysis Datasets
2. Methodology
3. Results and Discussion
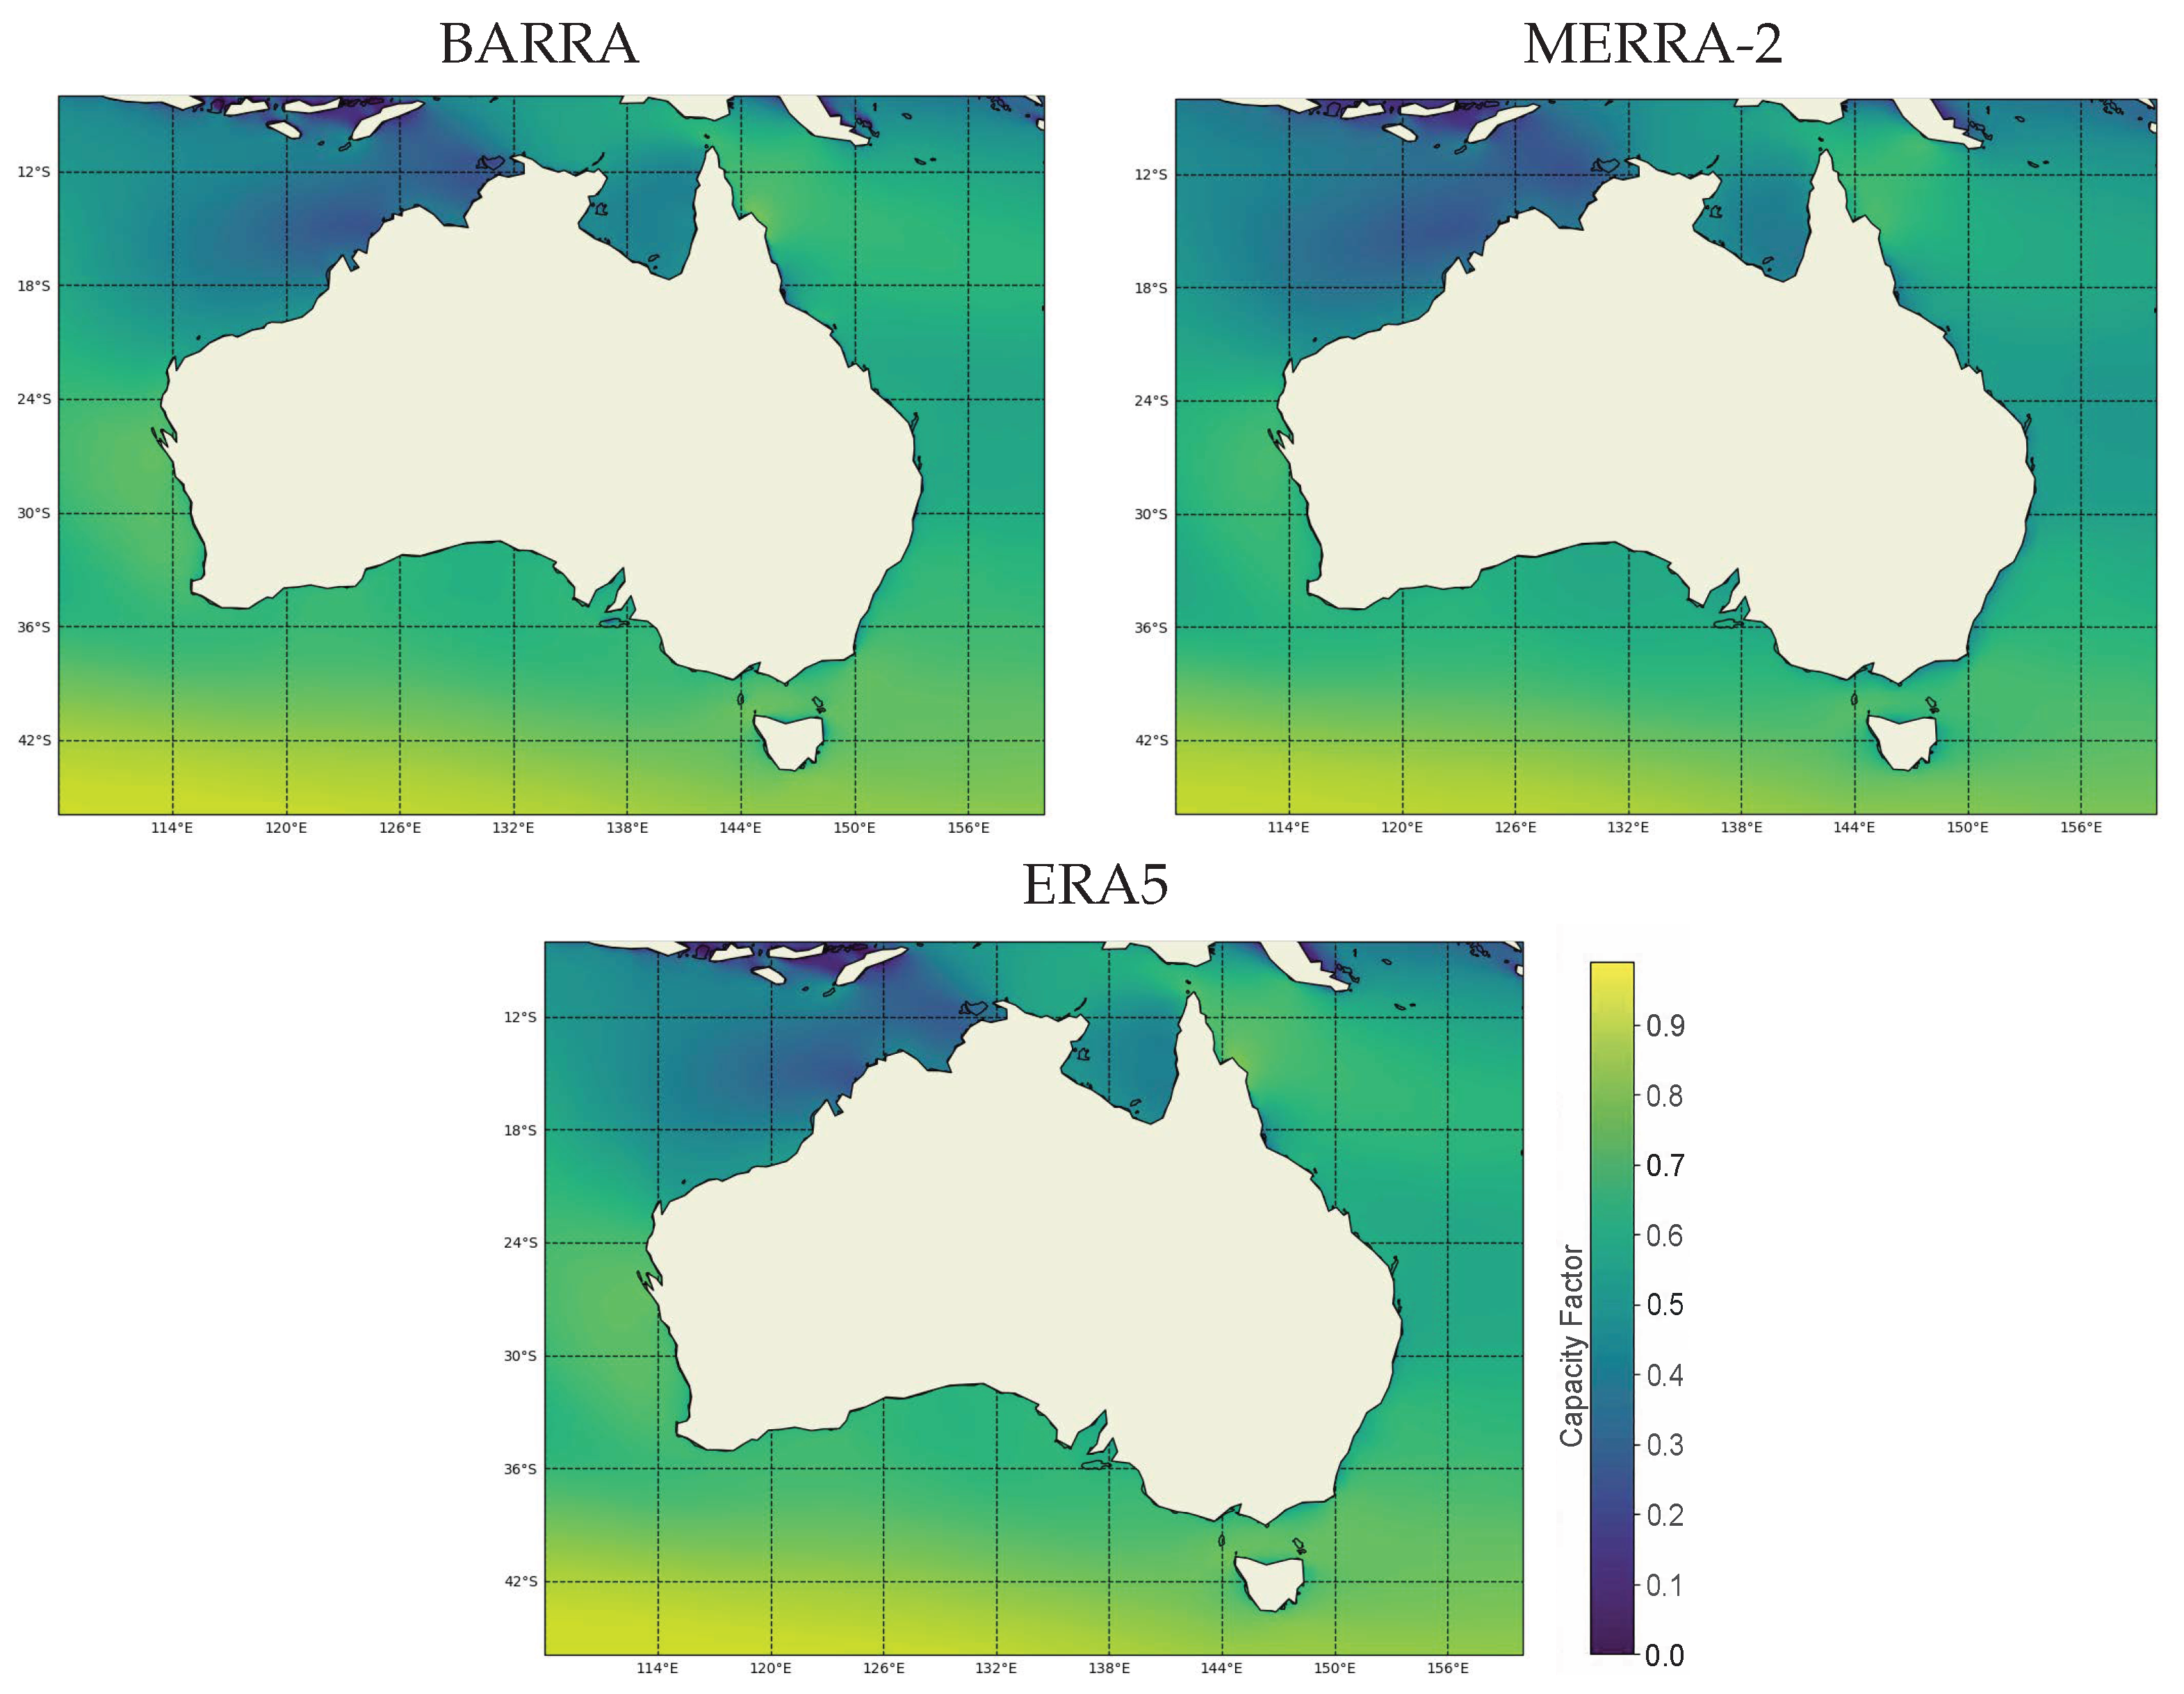
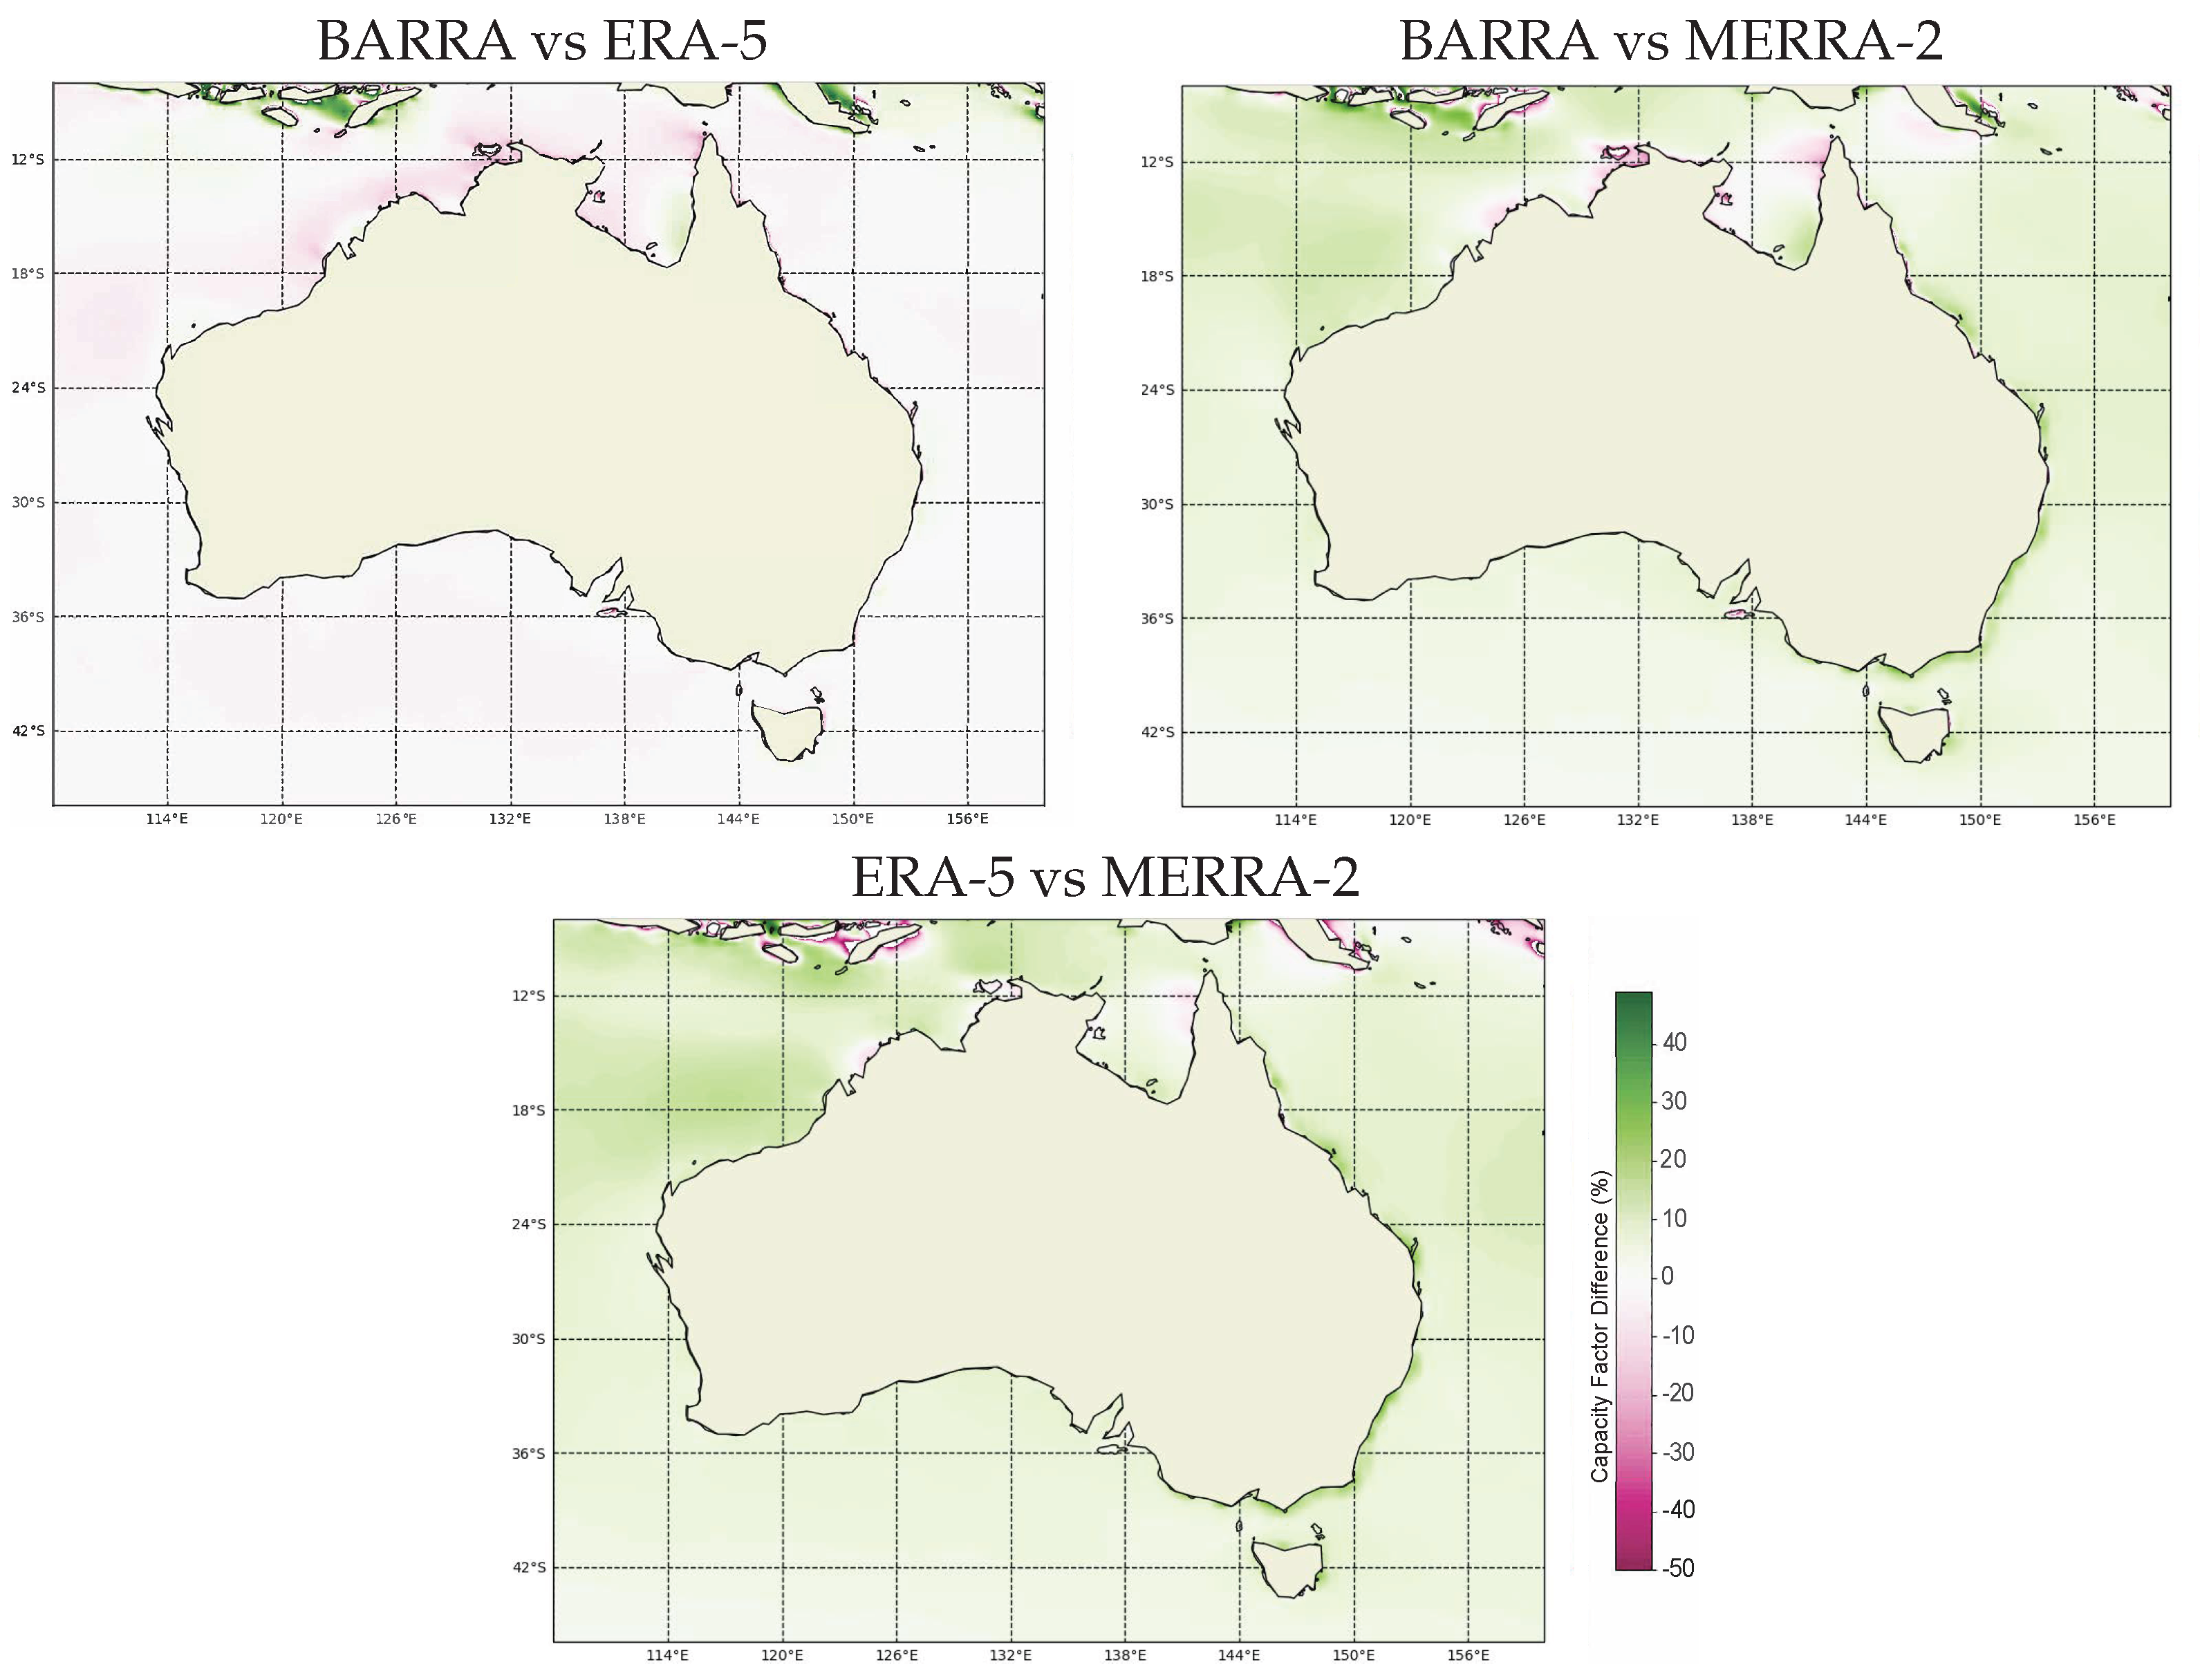
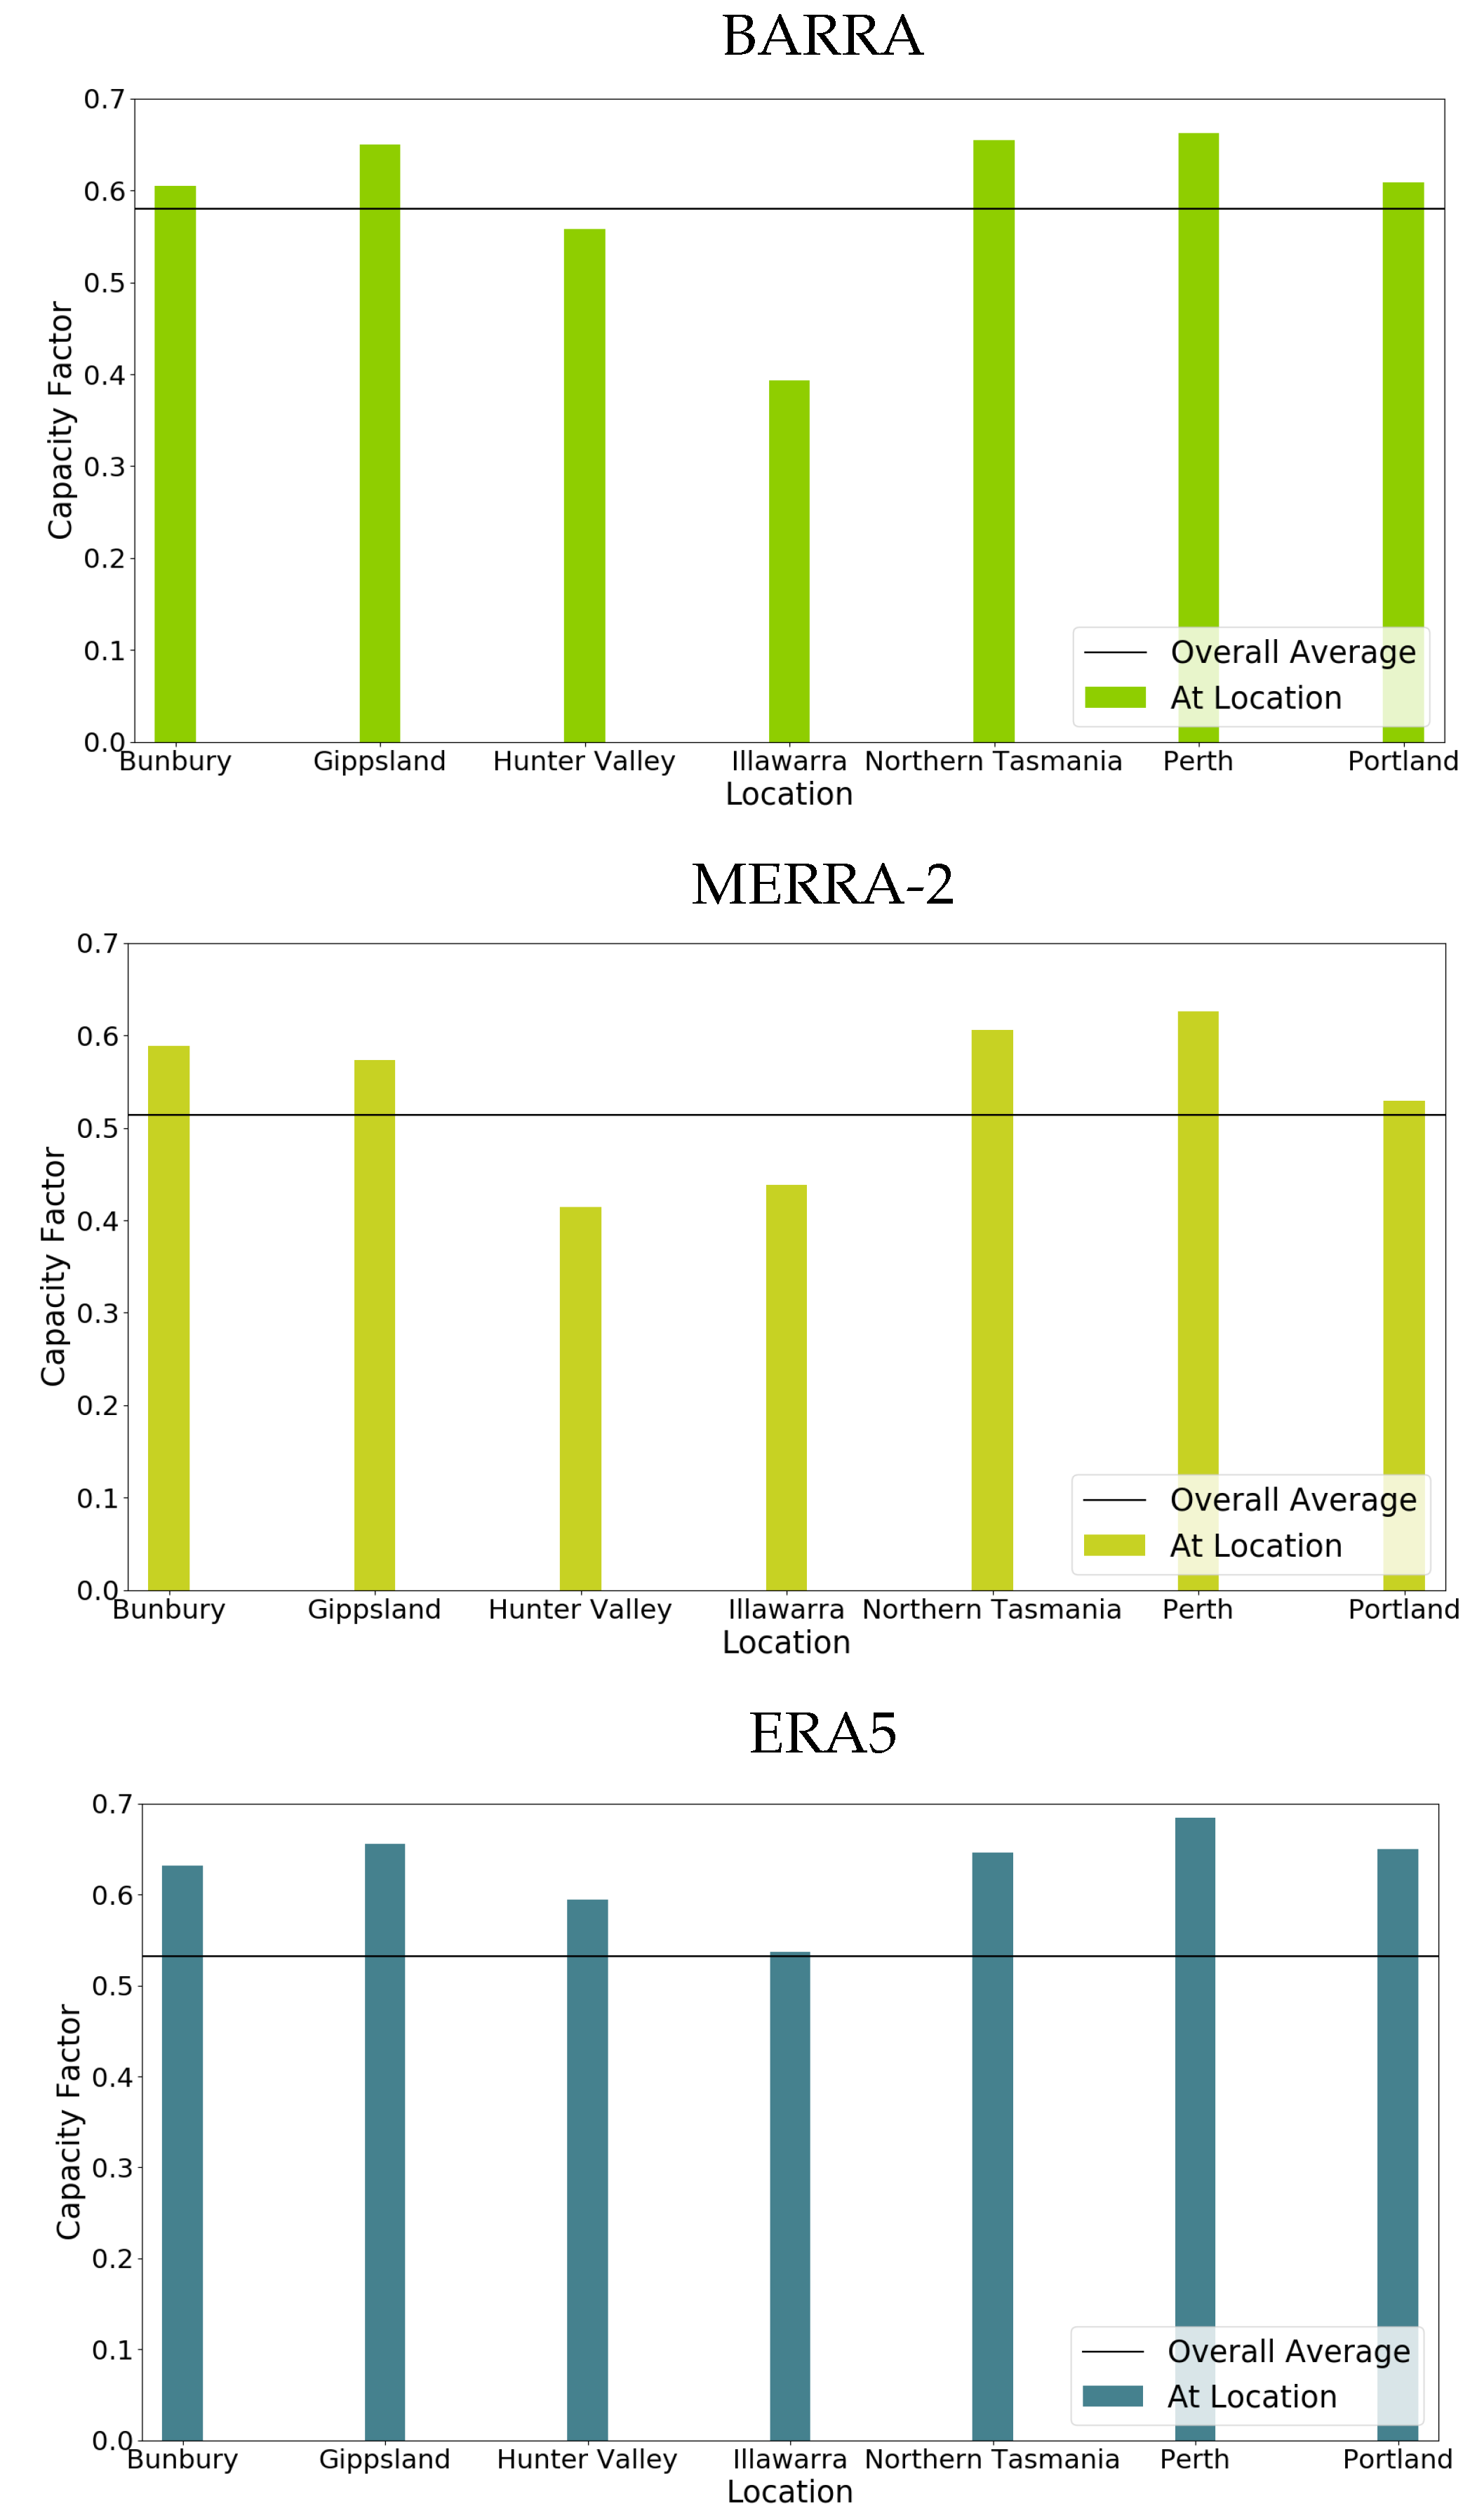
3.1. Cross Dataset Comparison
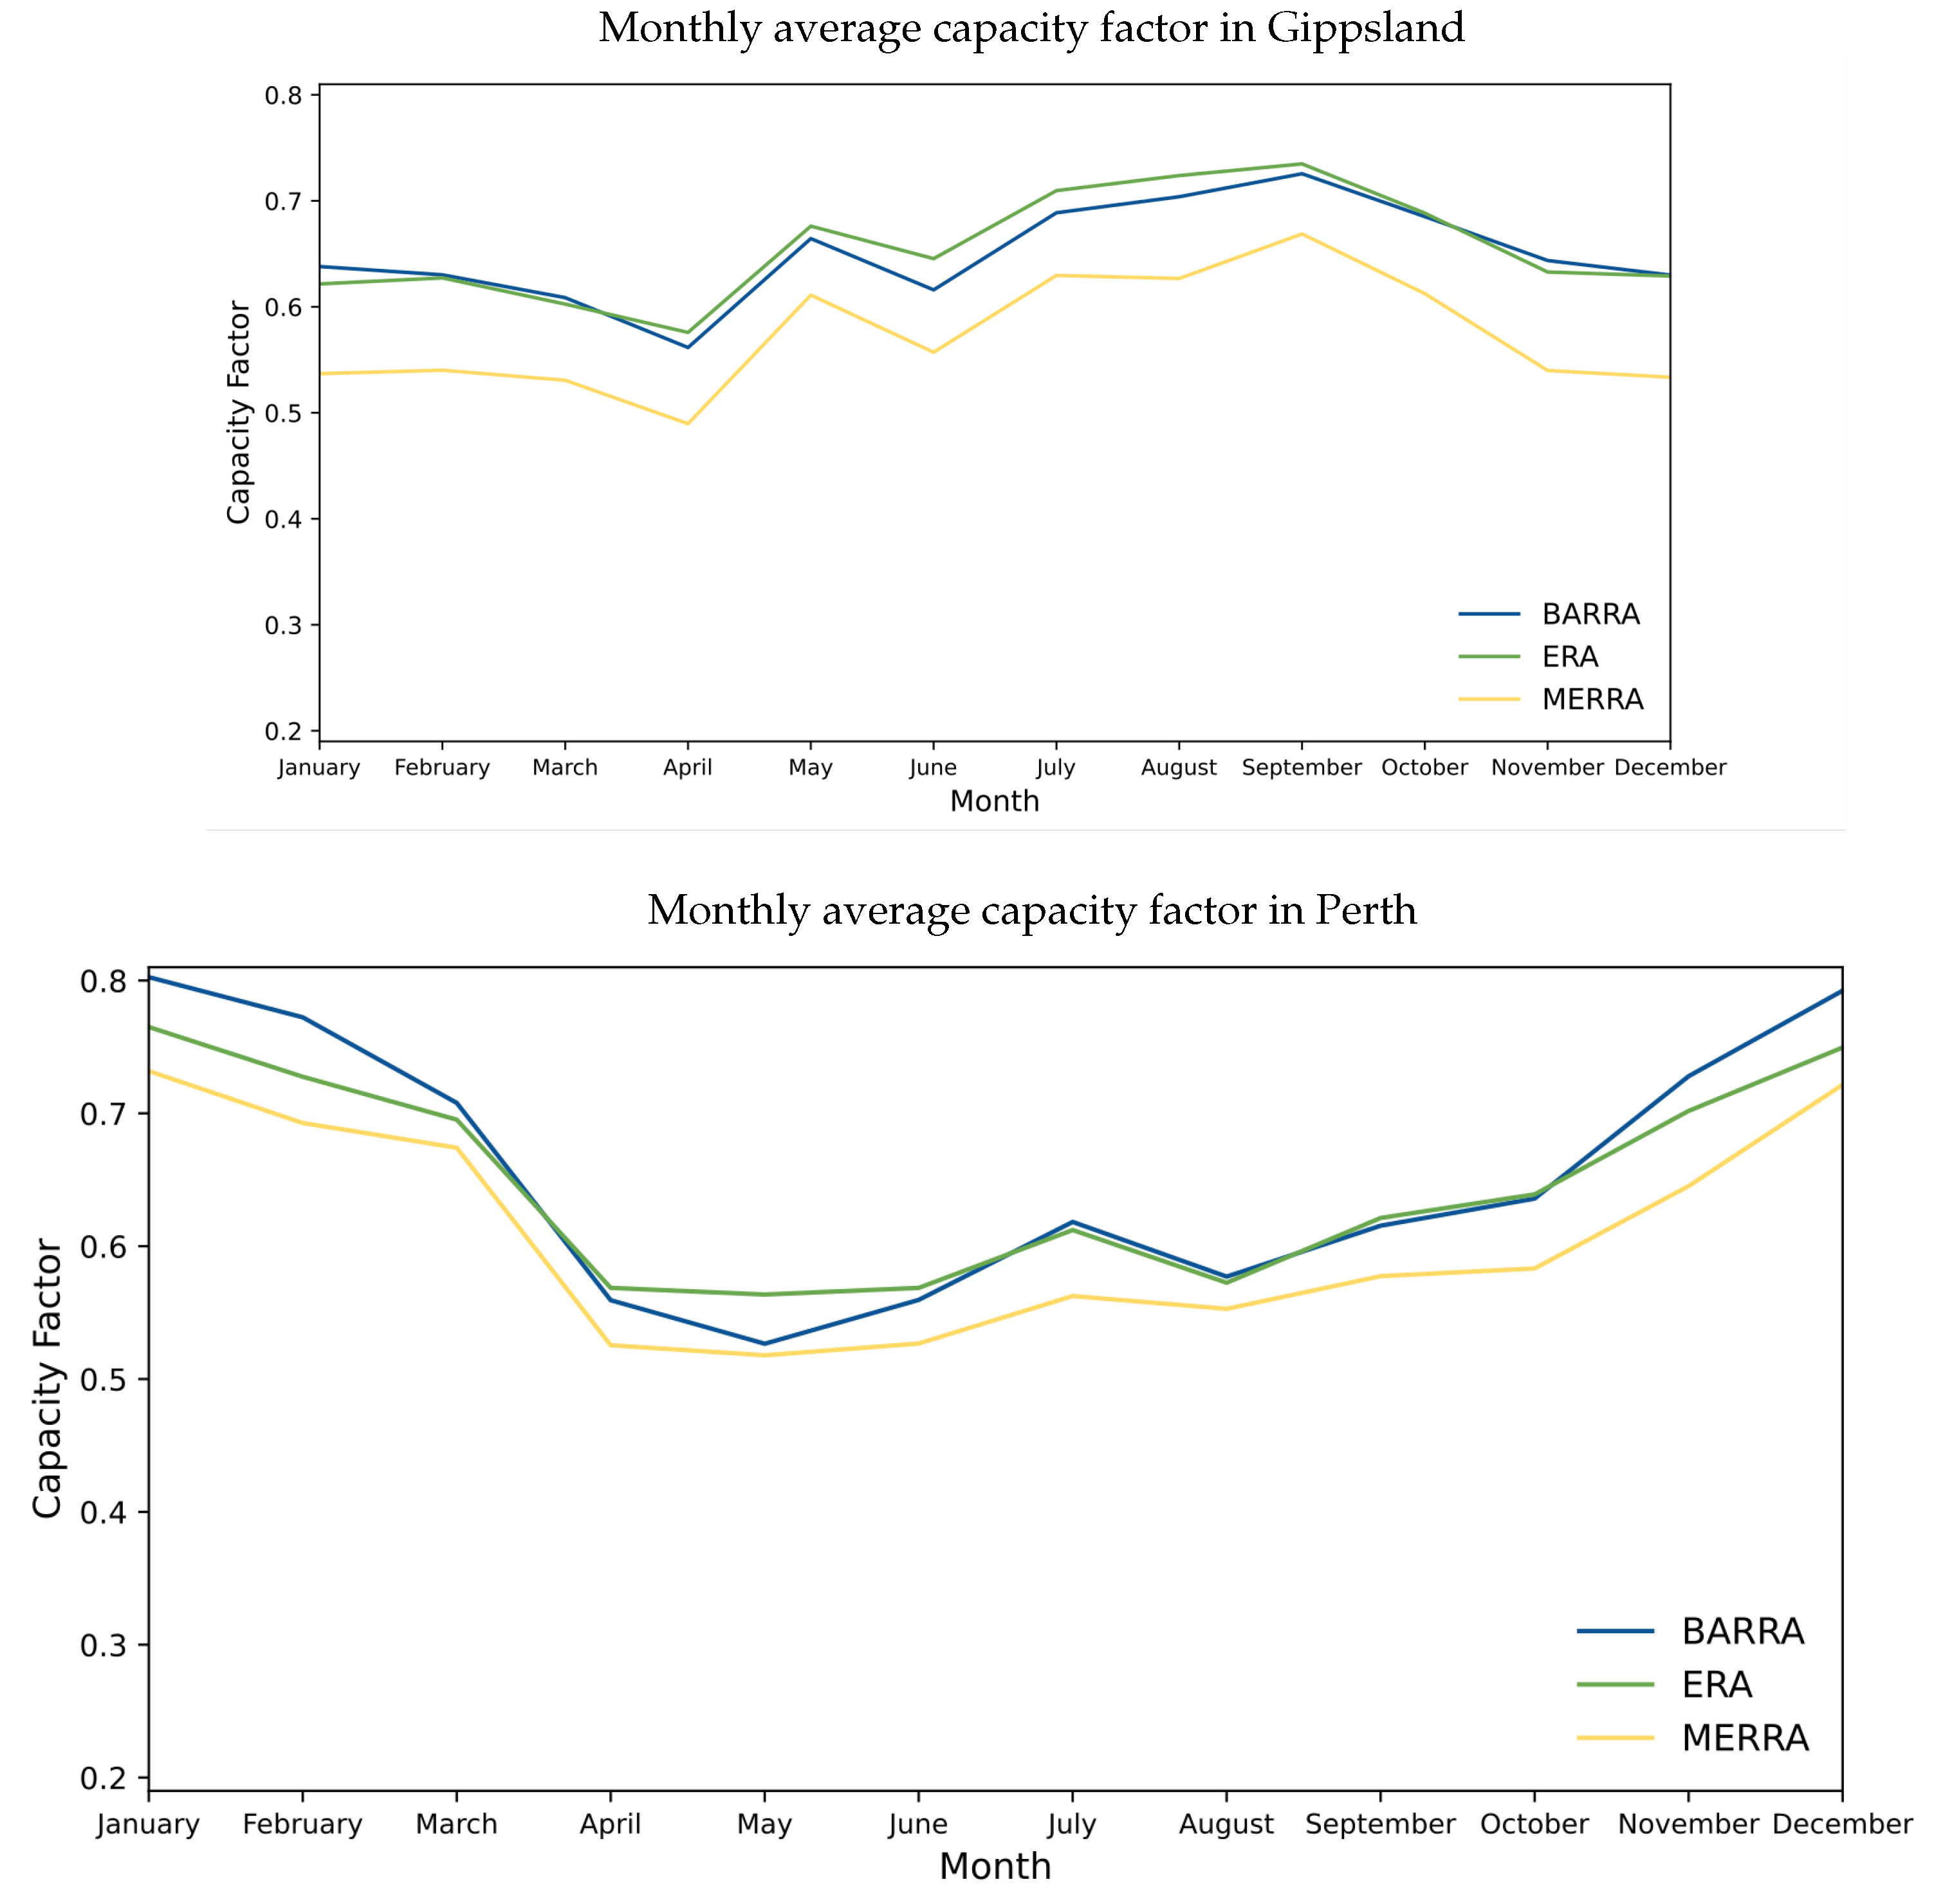
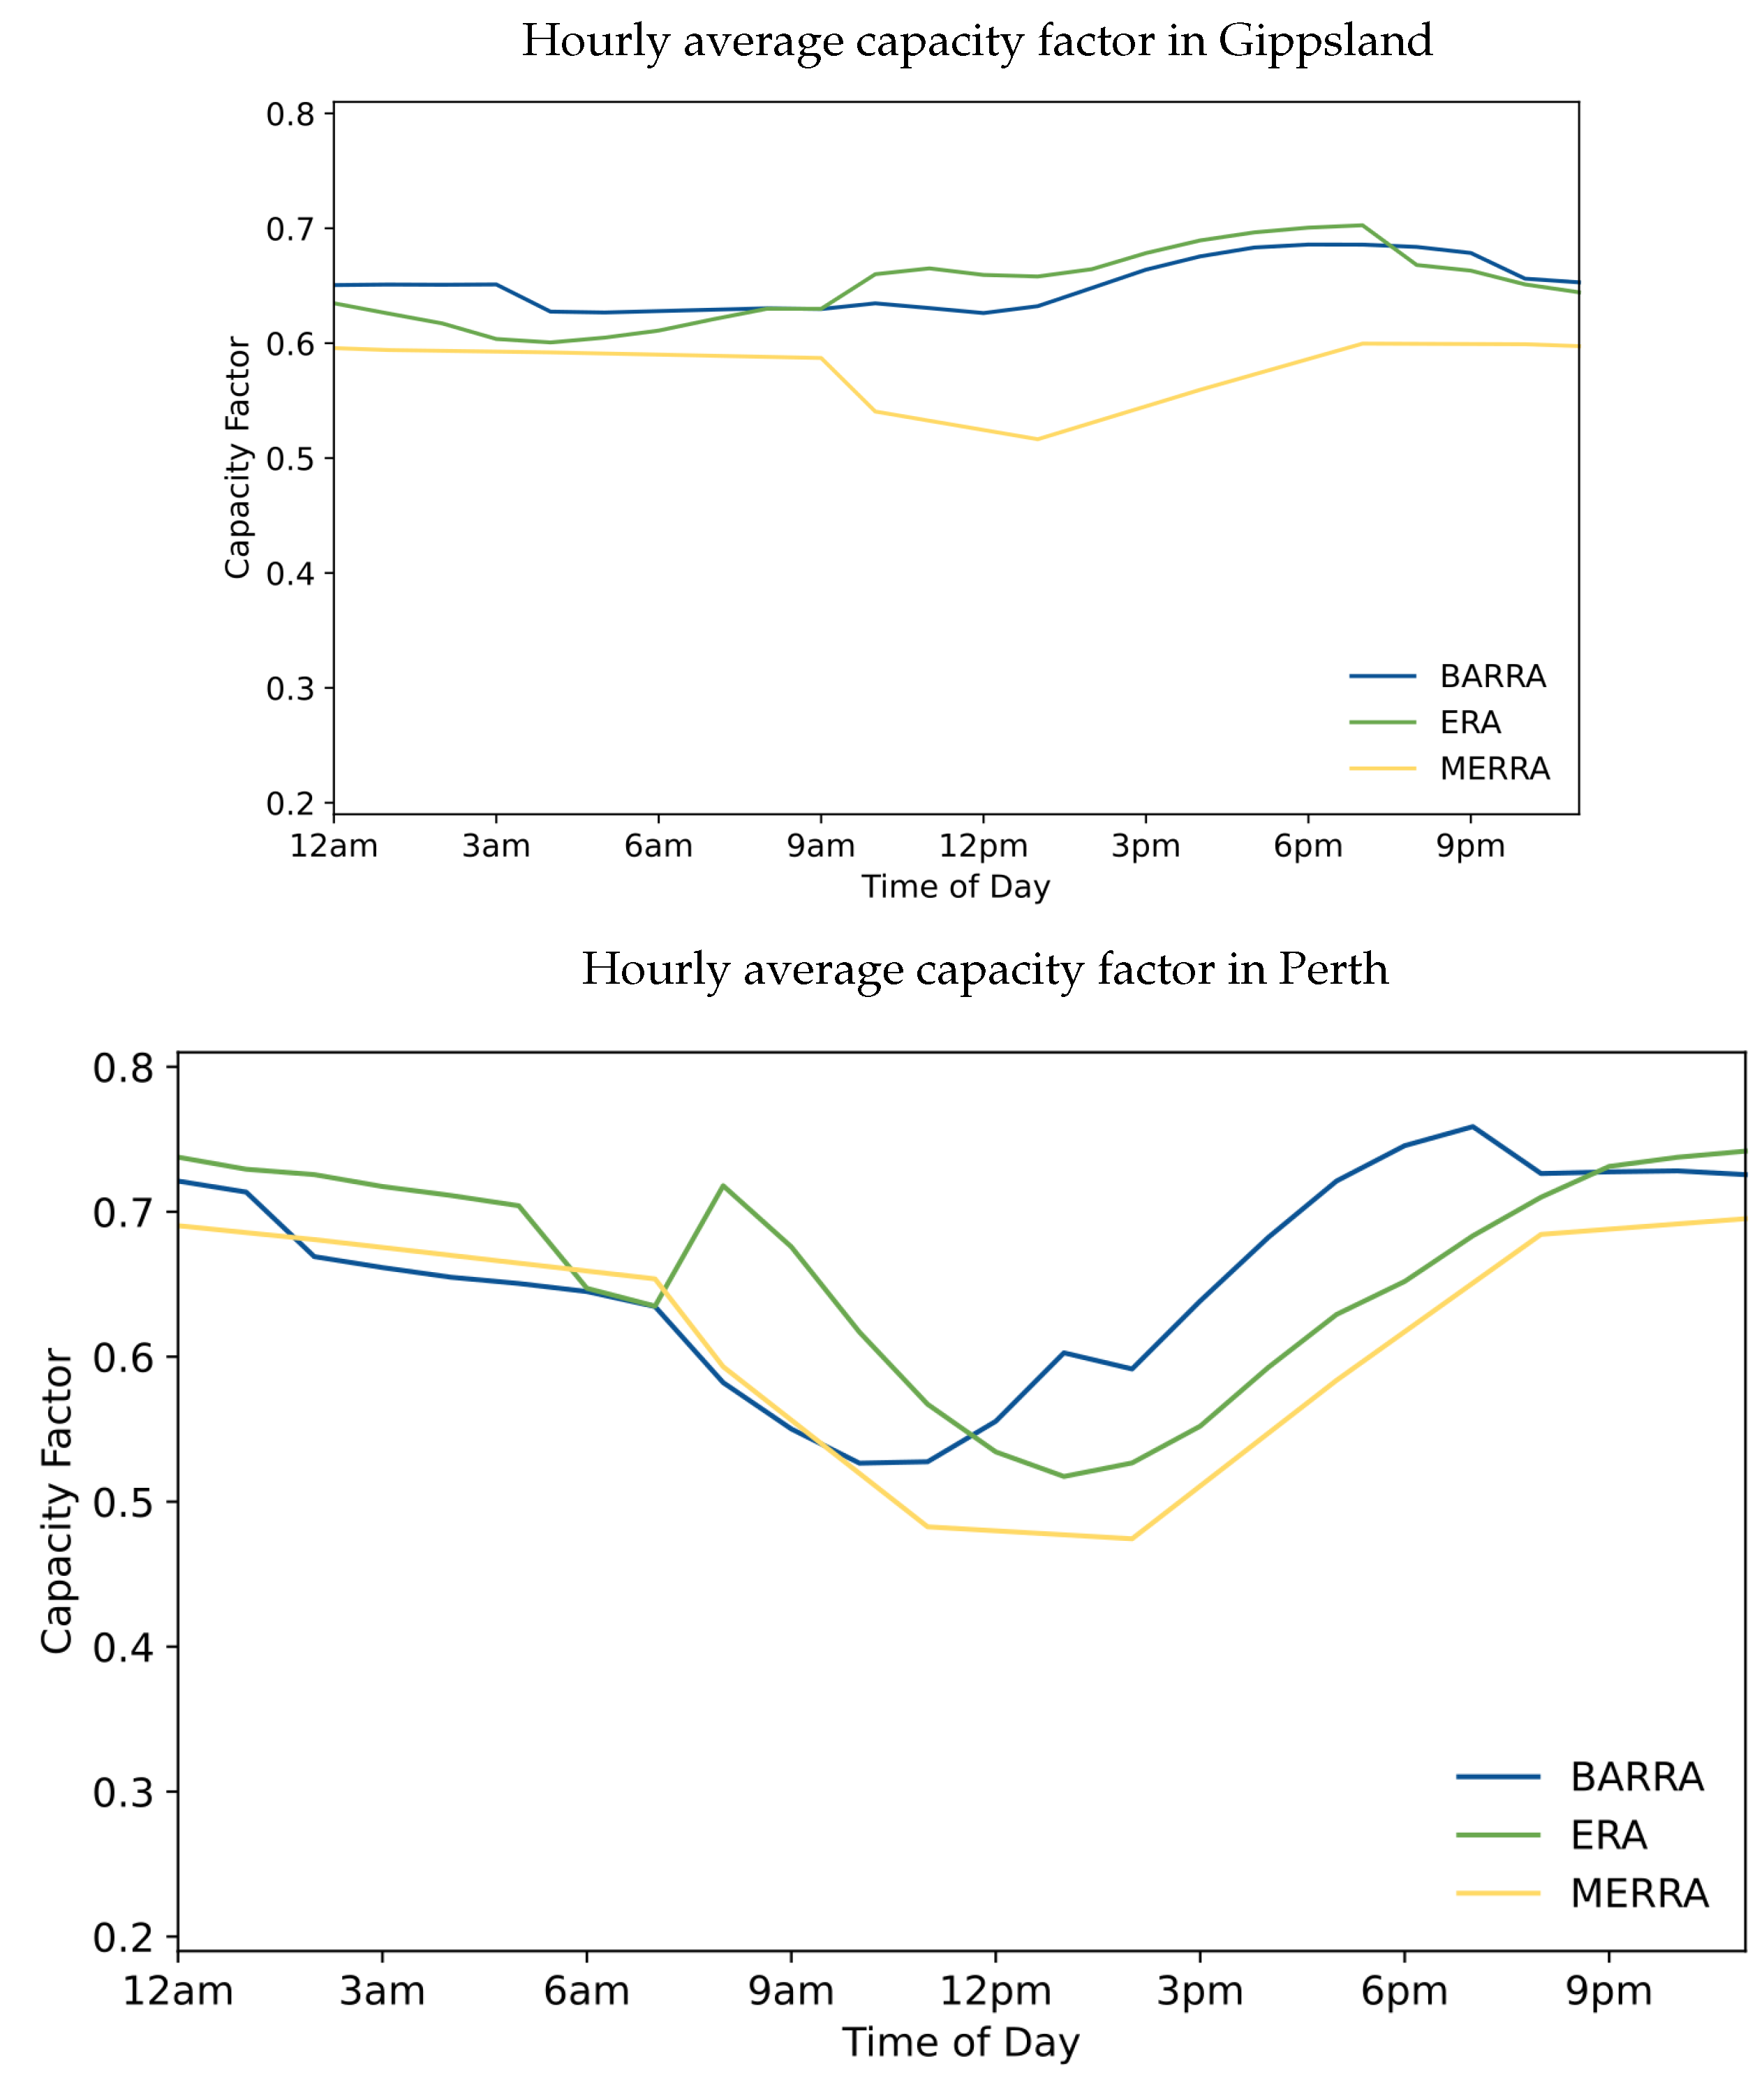
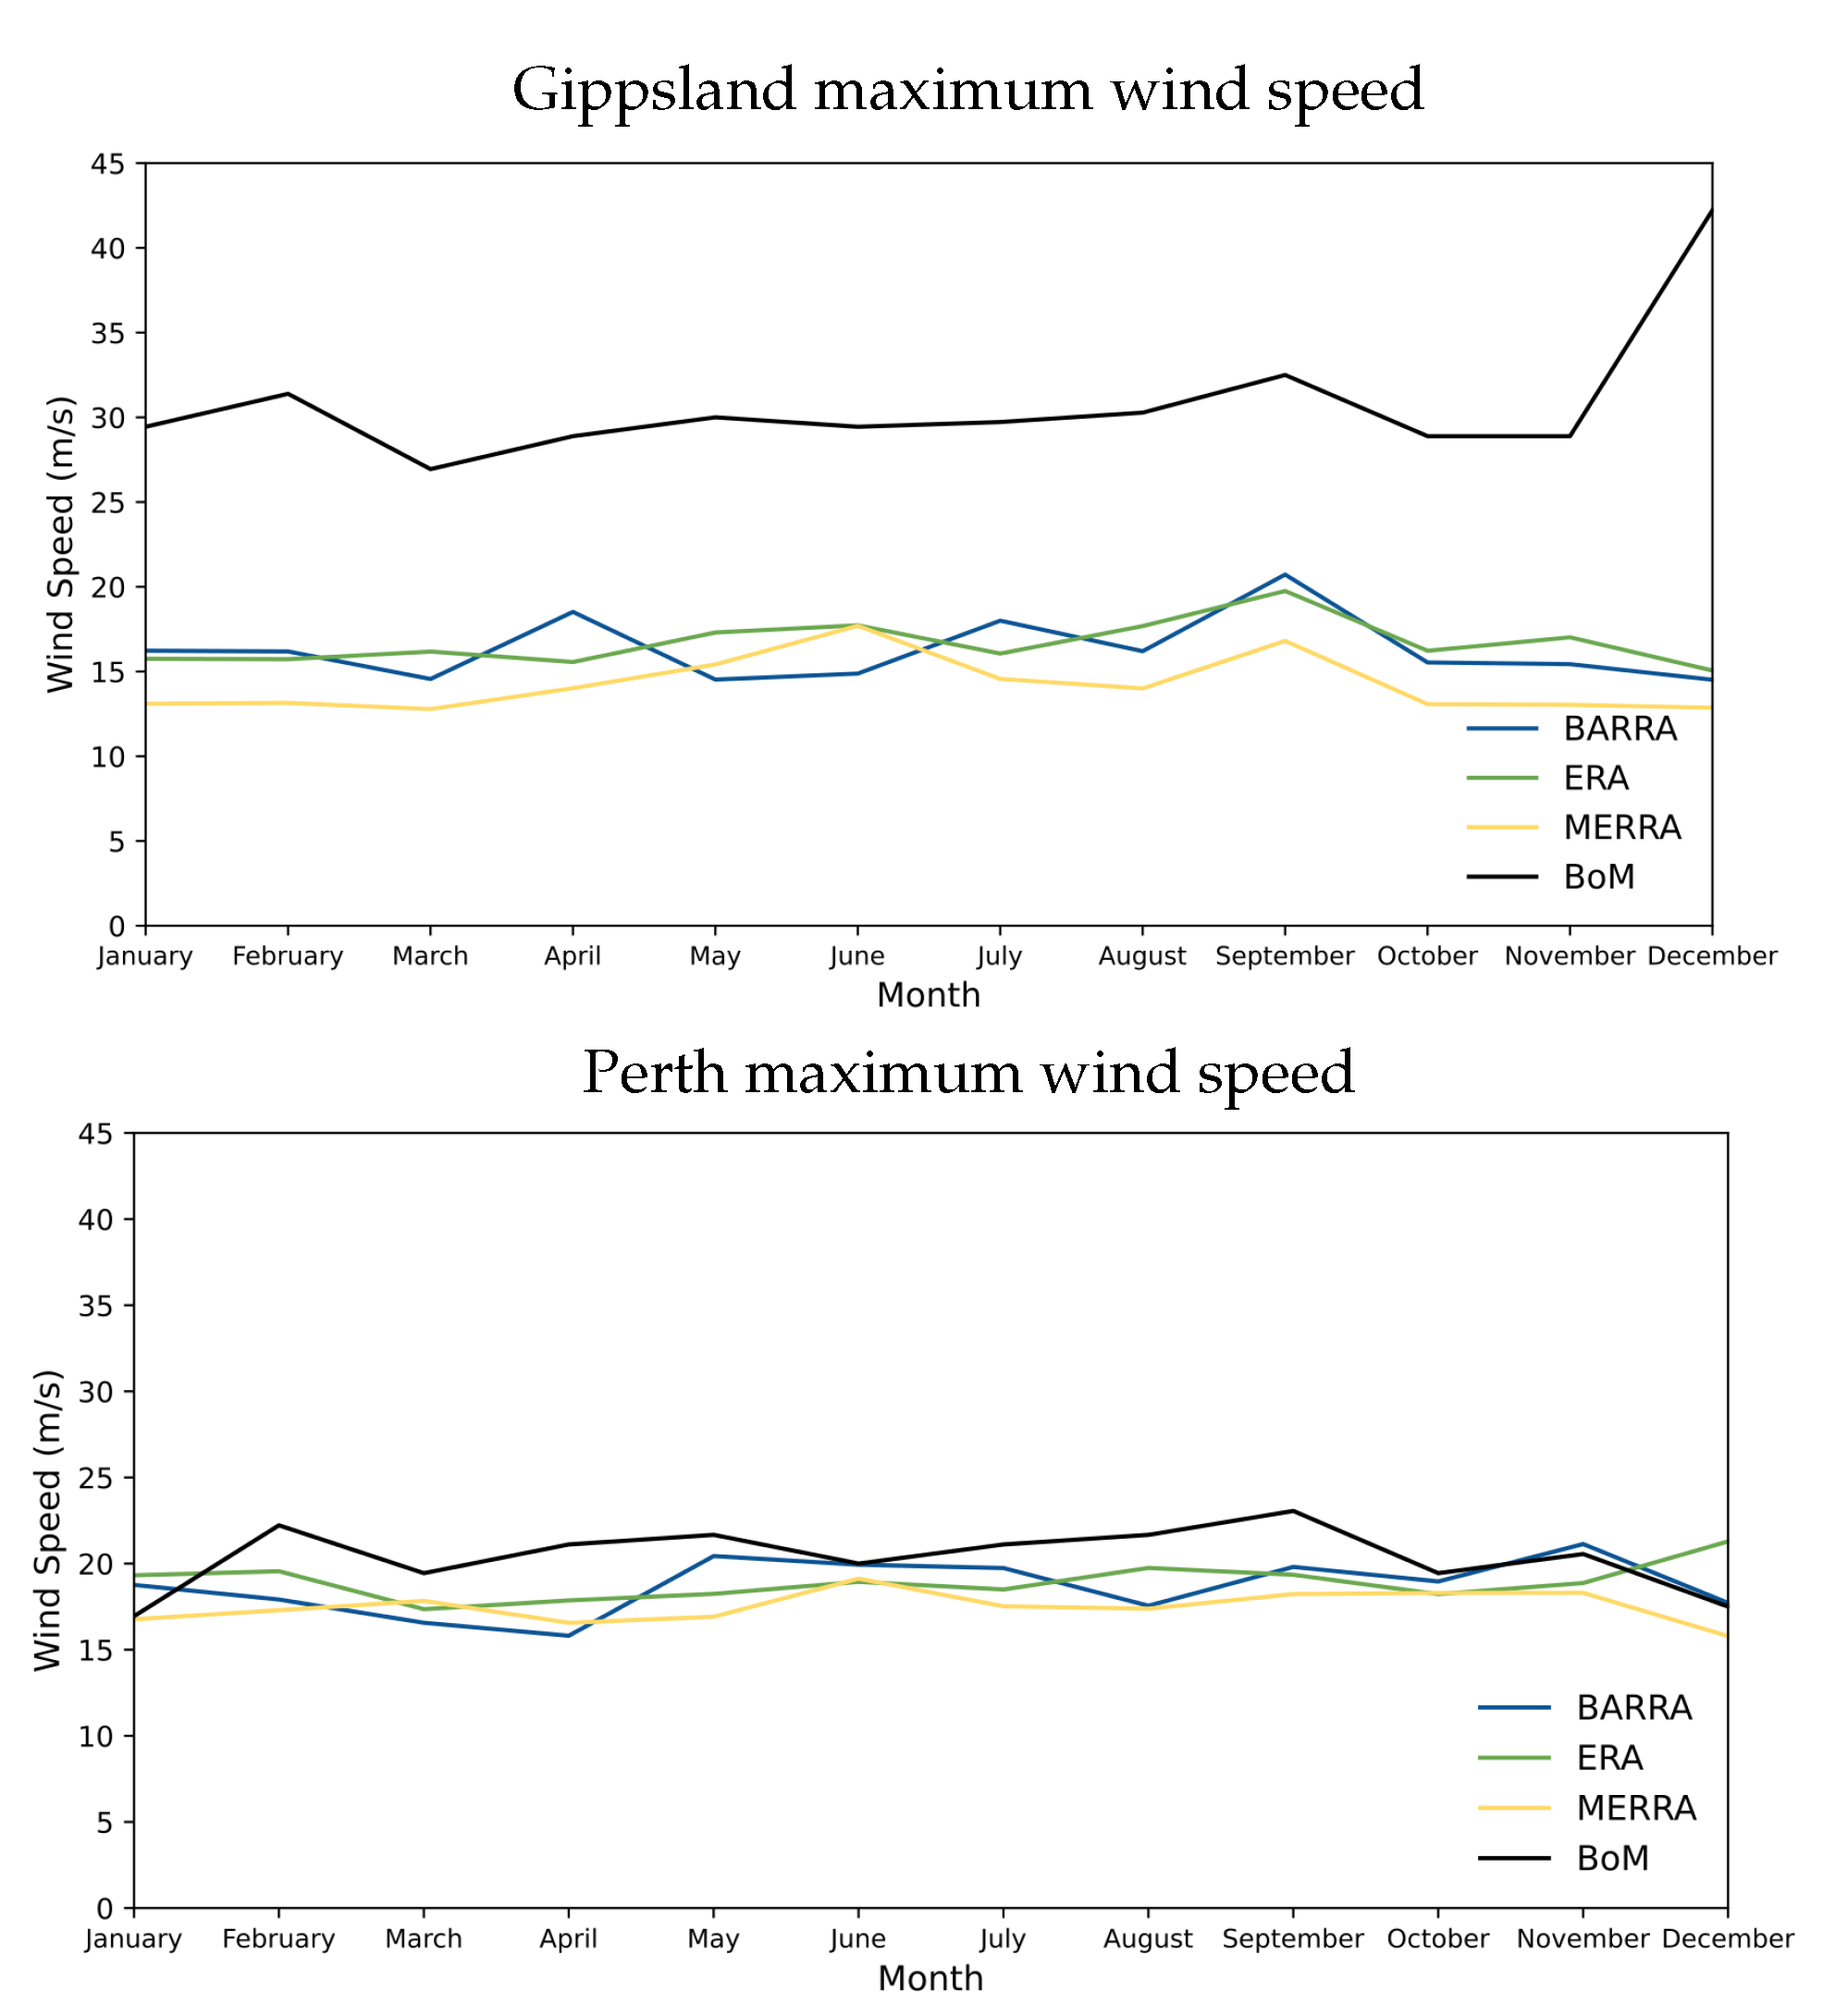
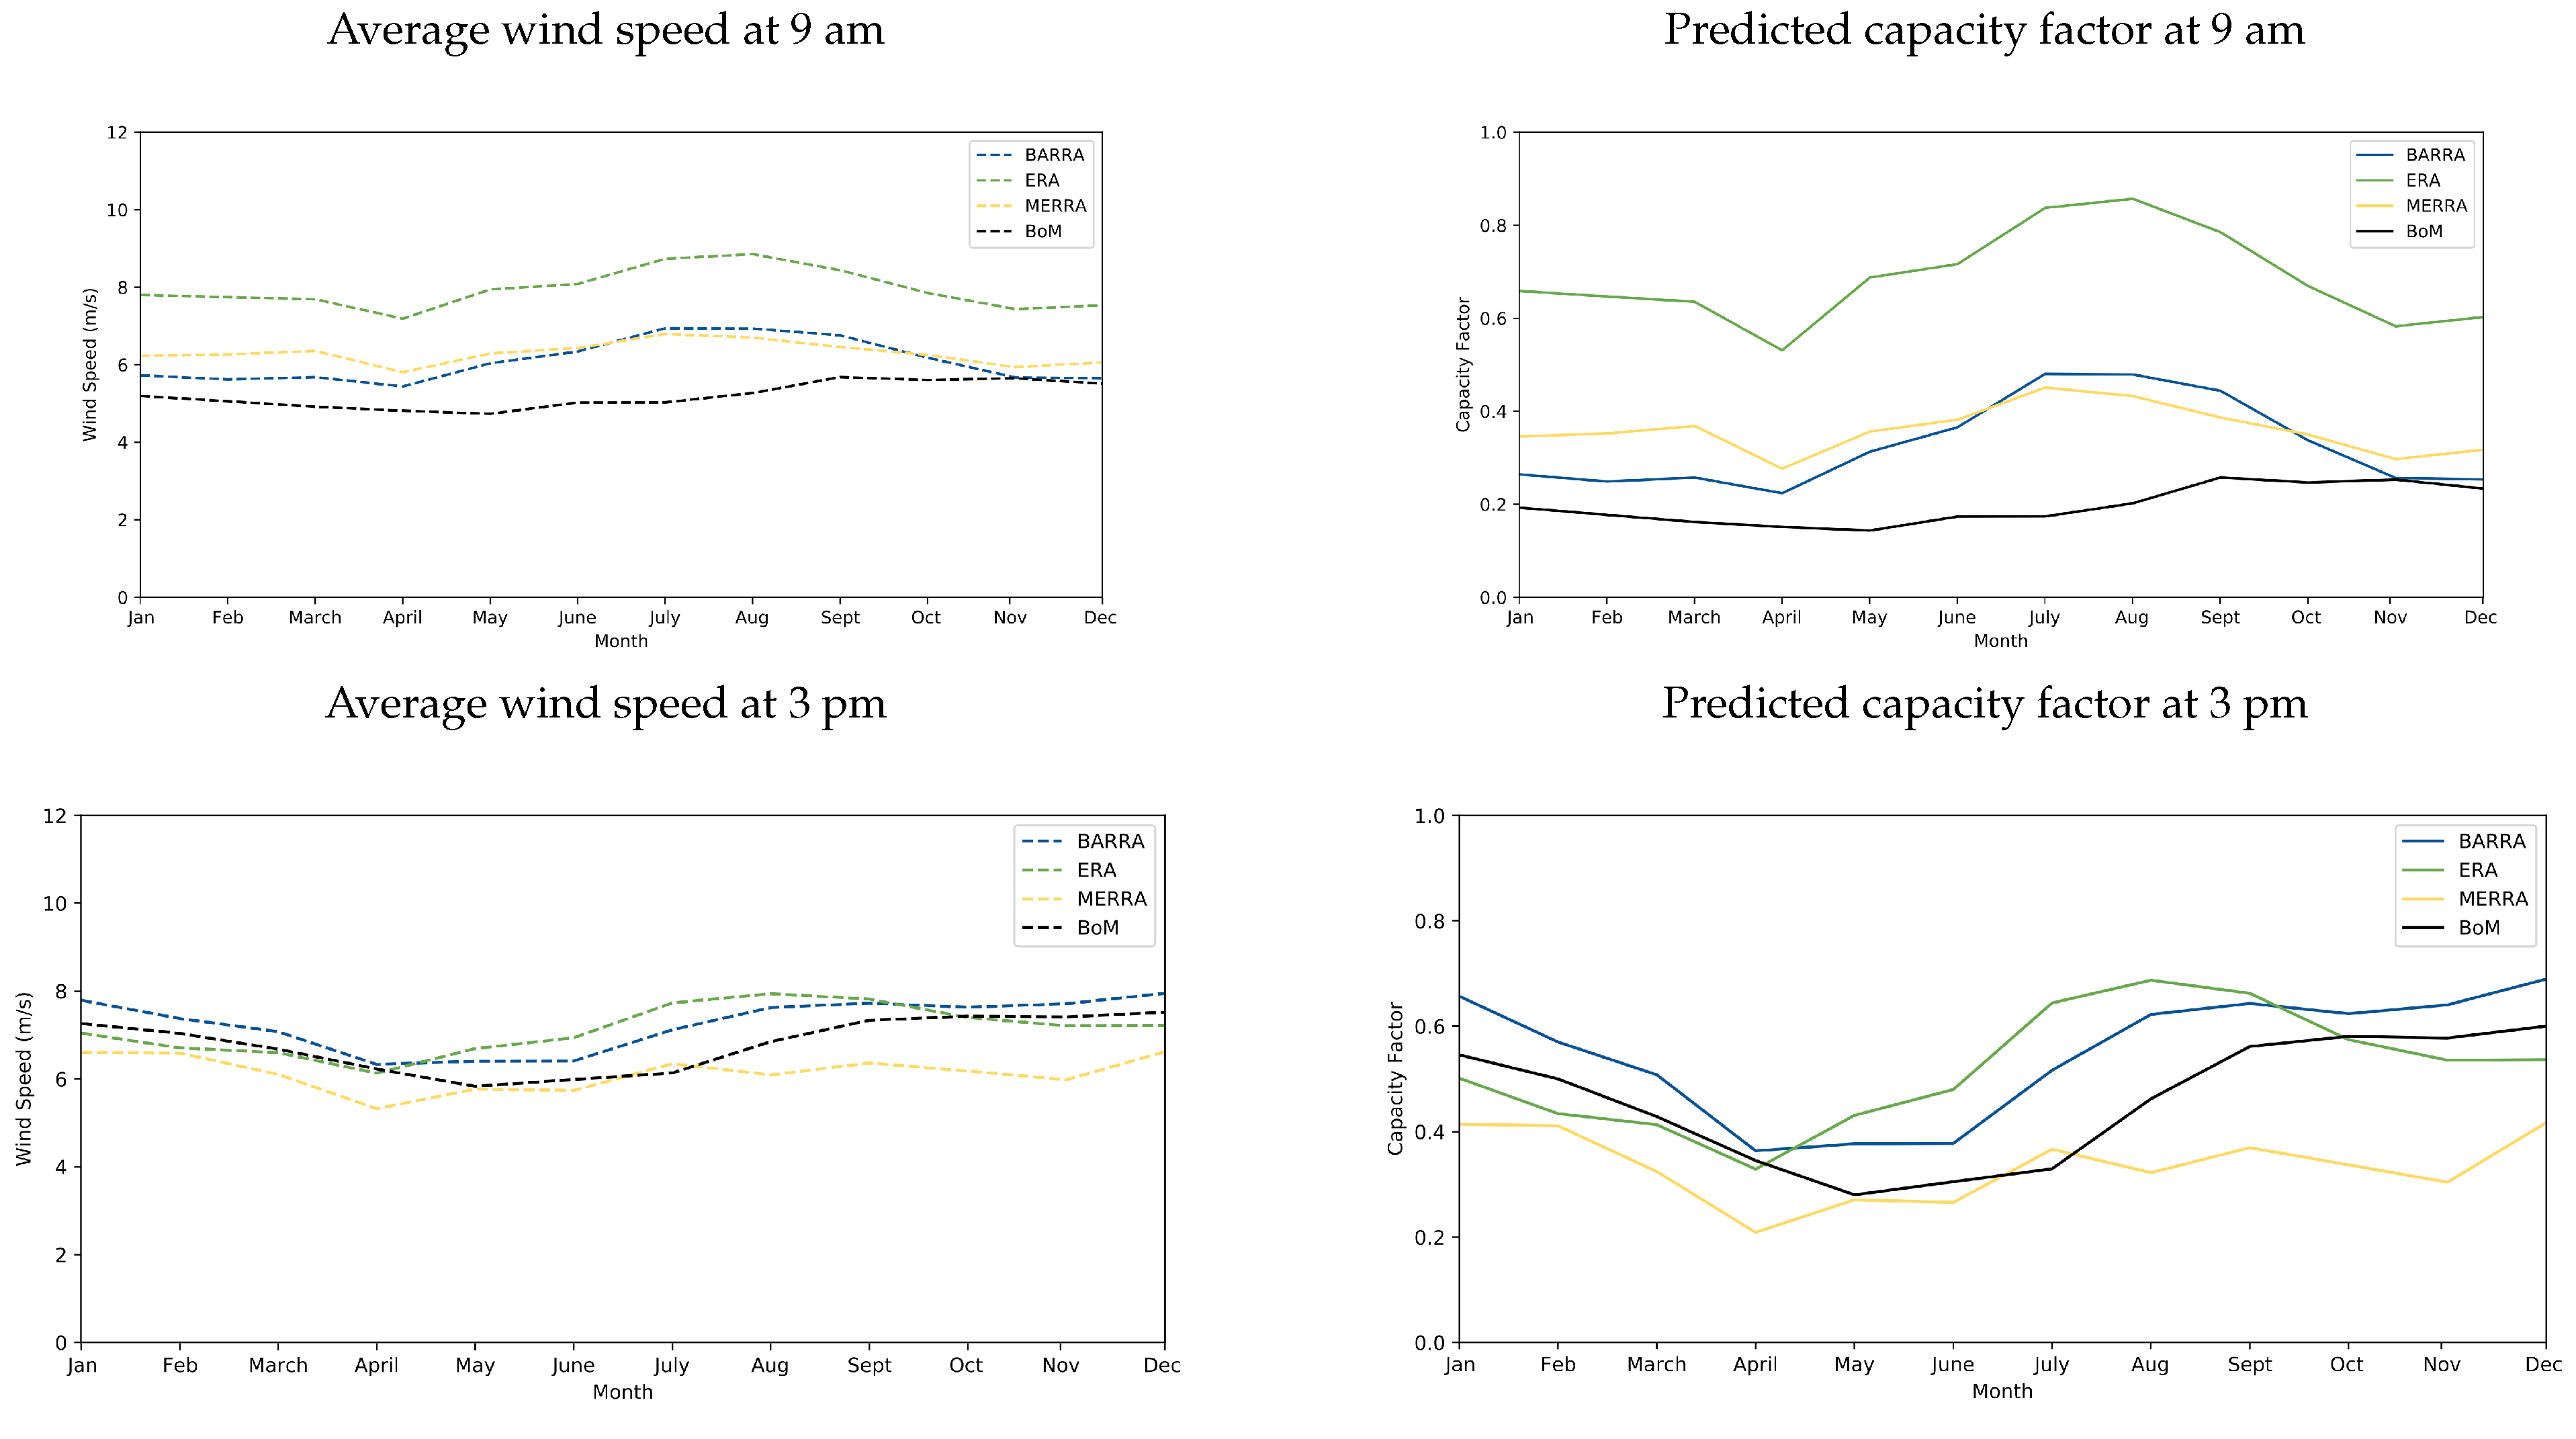
3.2. Temporal Comparisons at Specific Locations
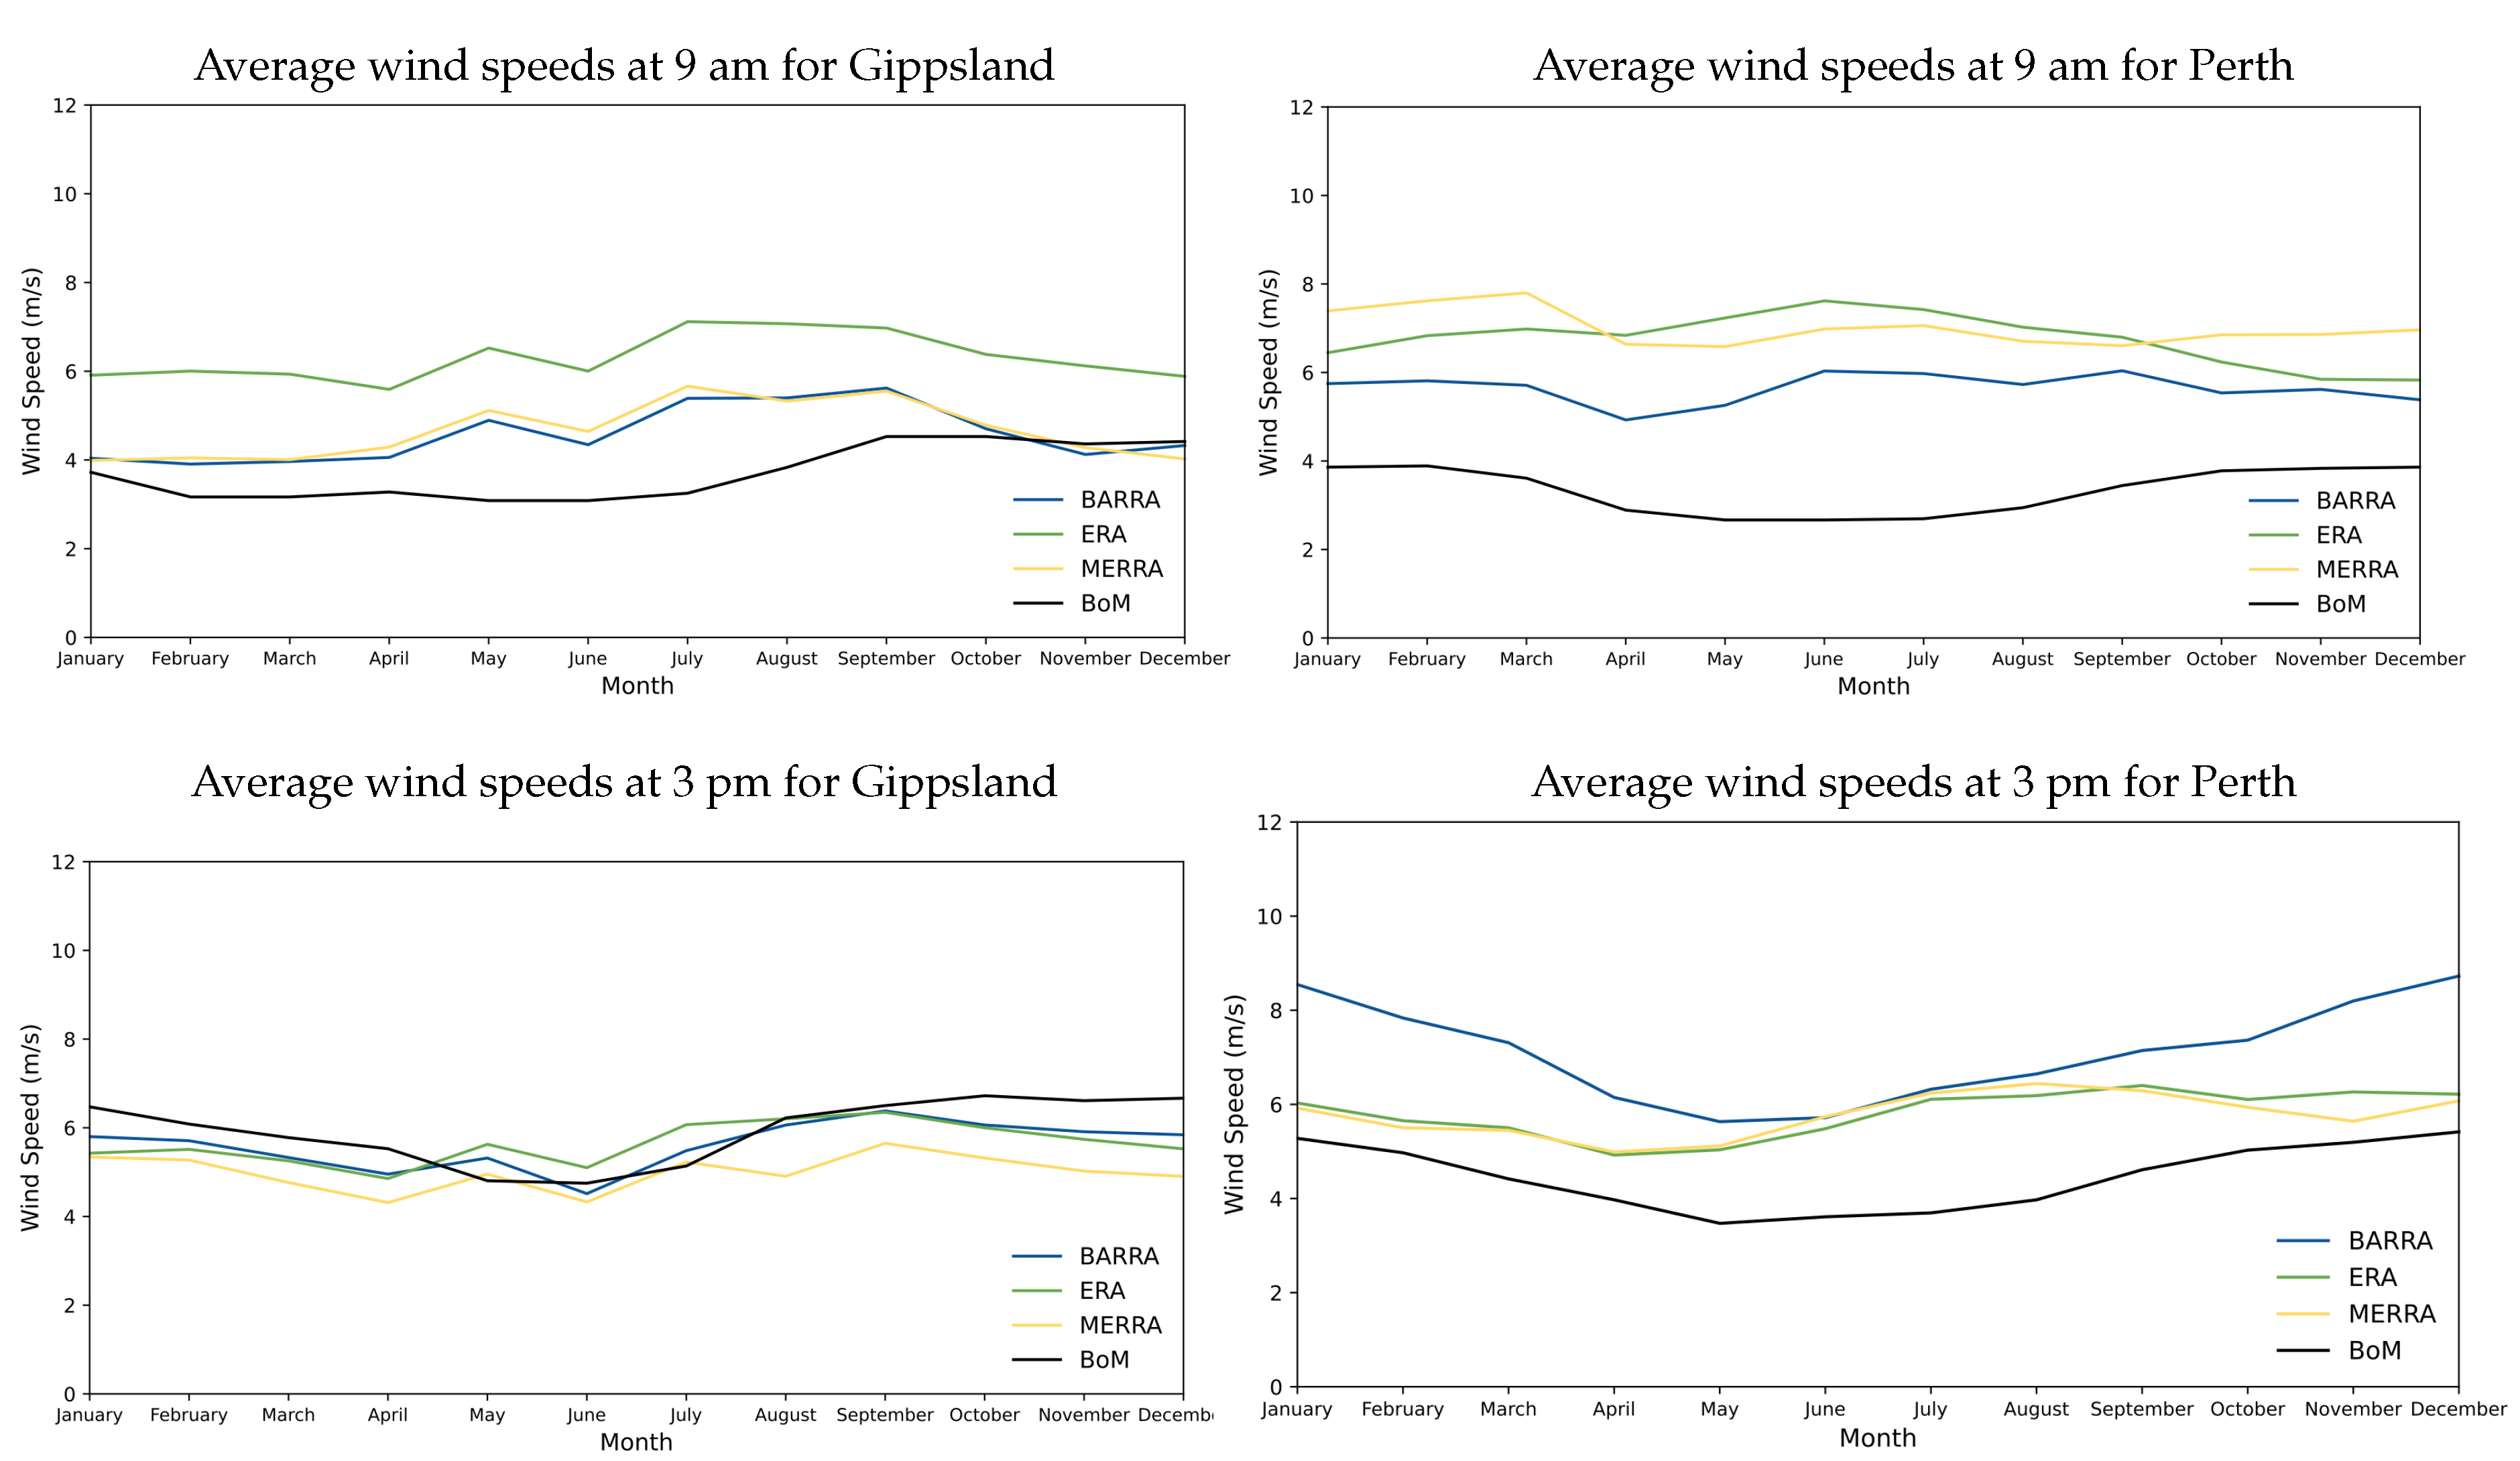
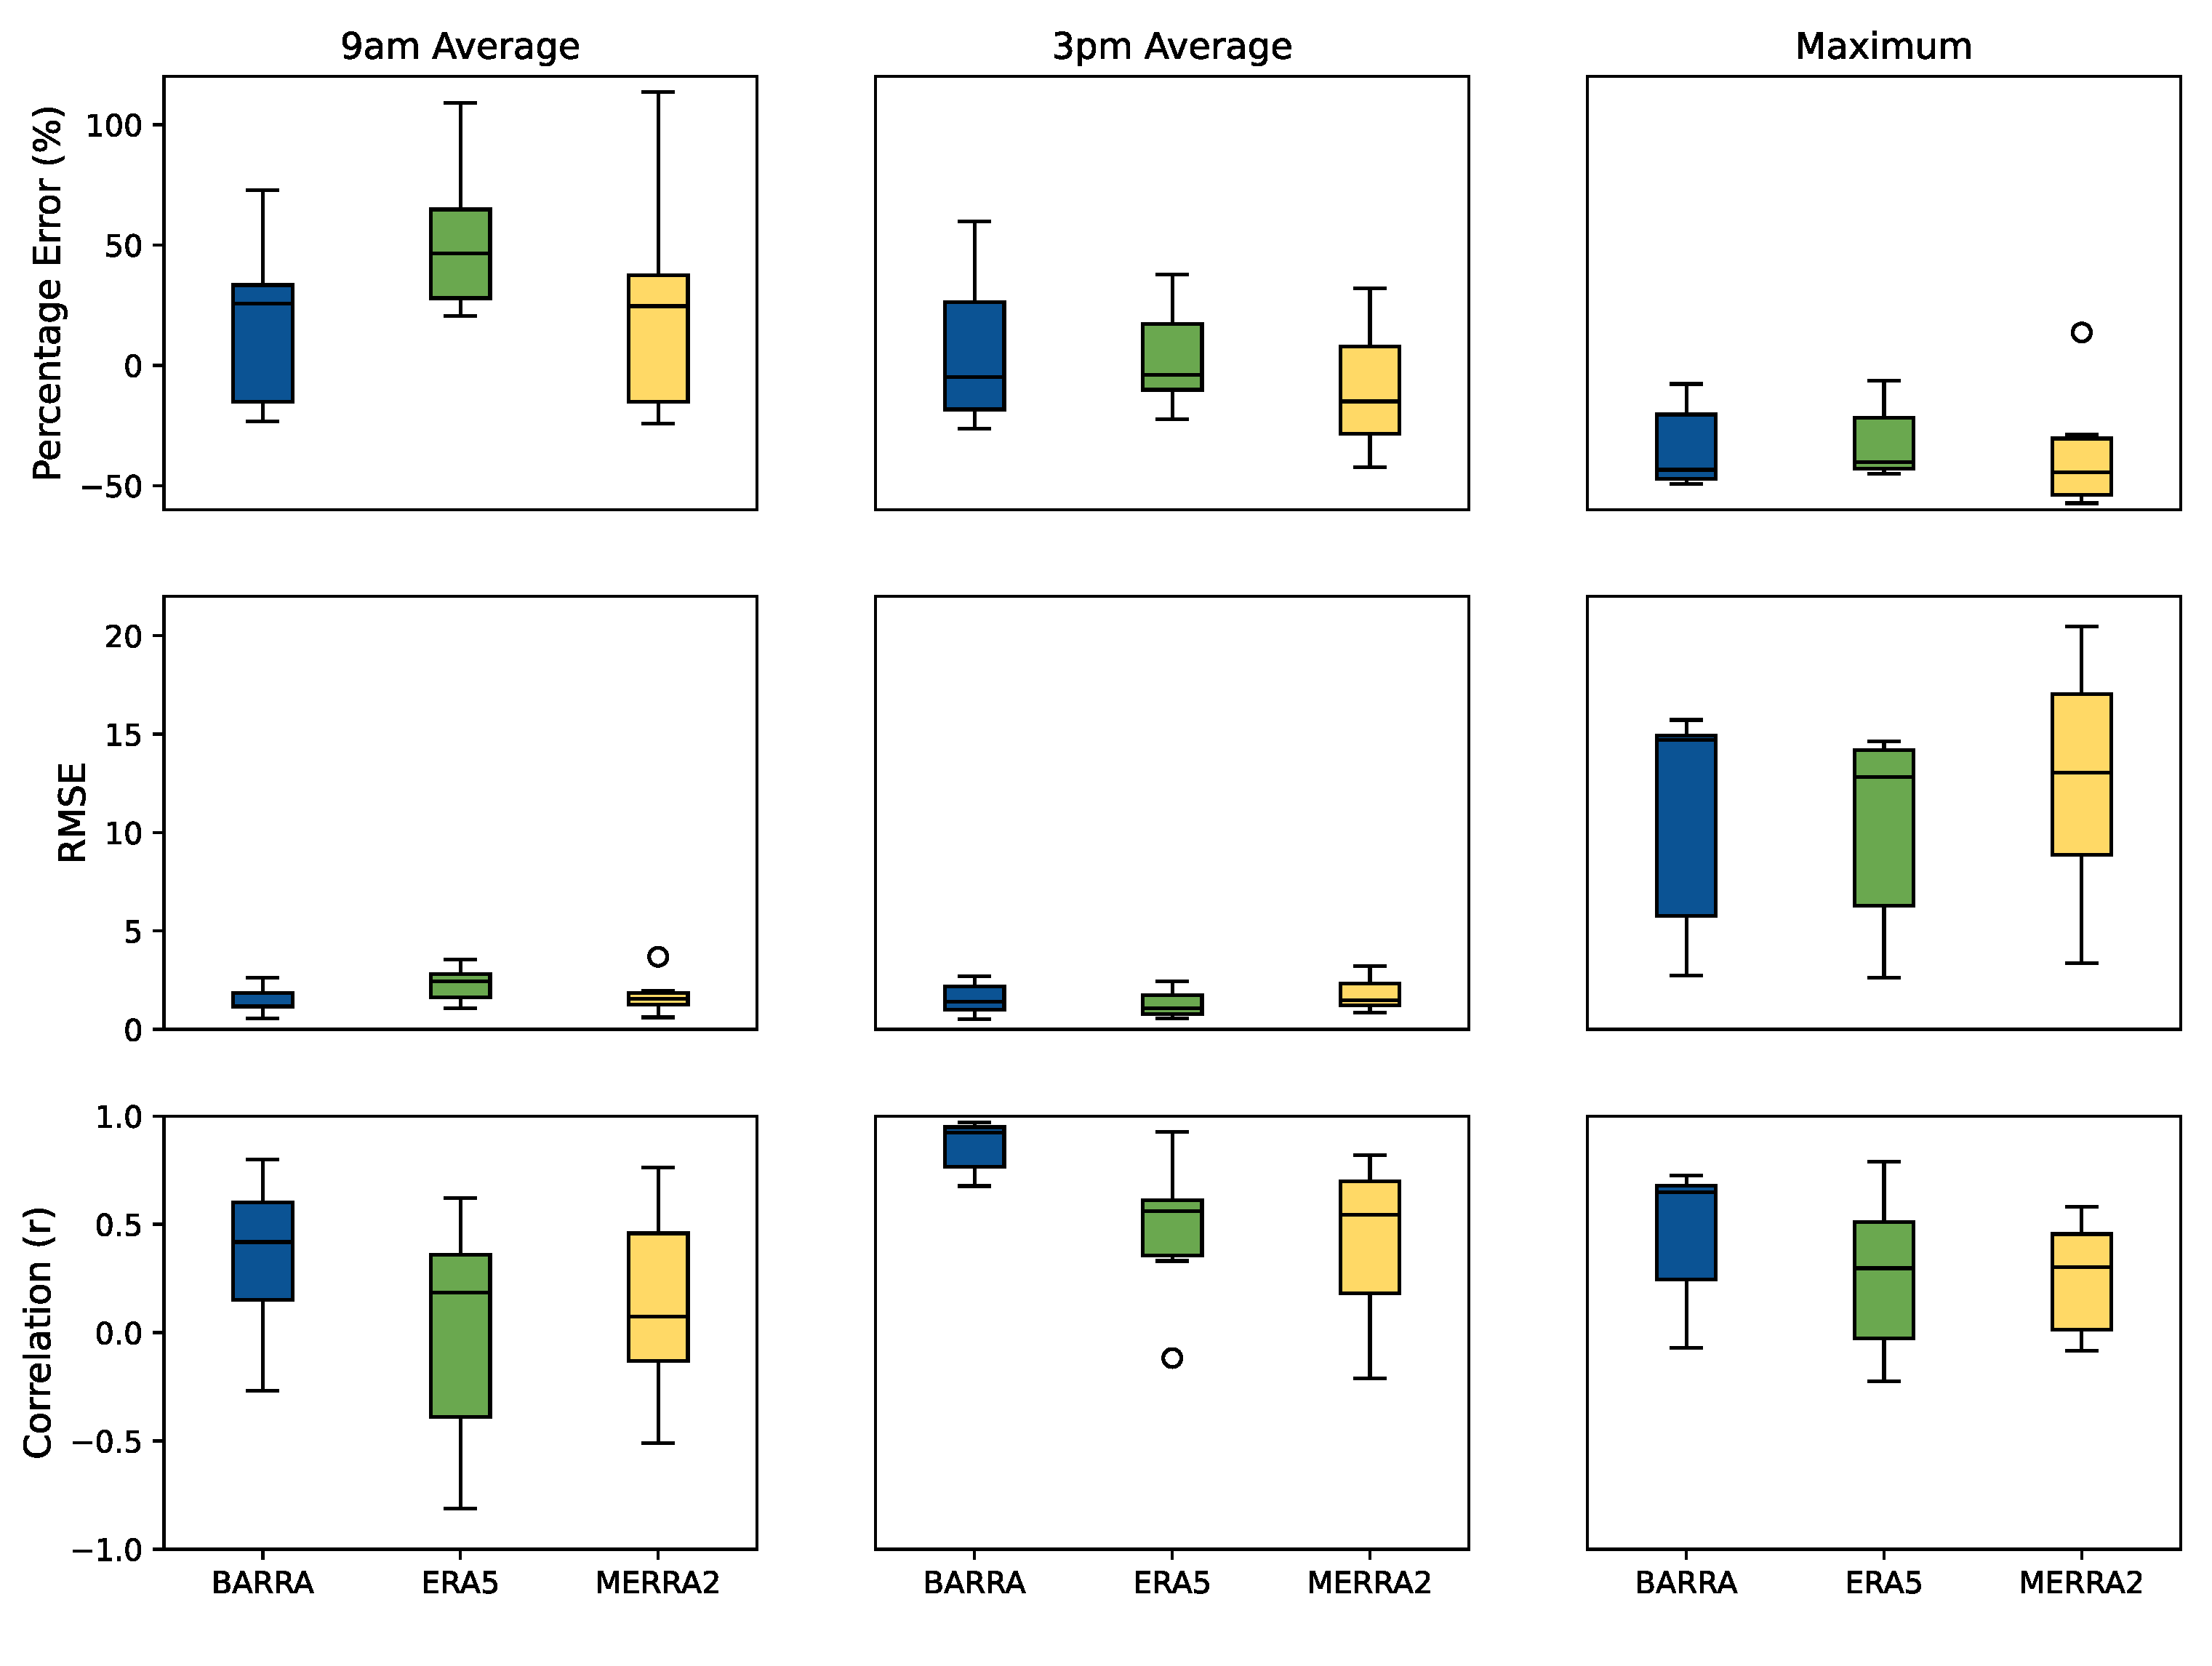
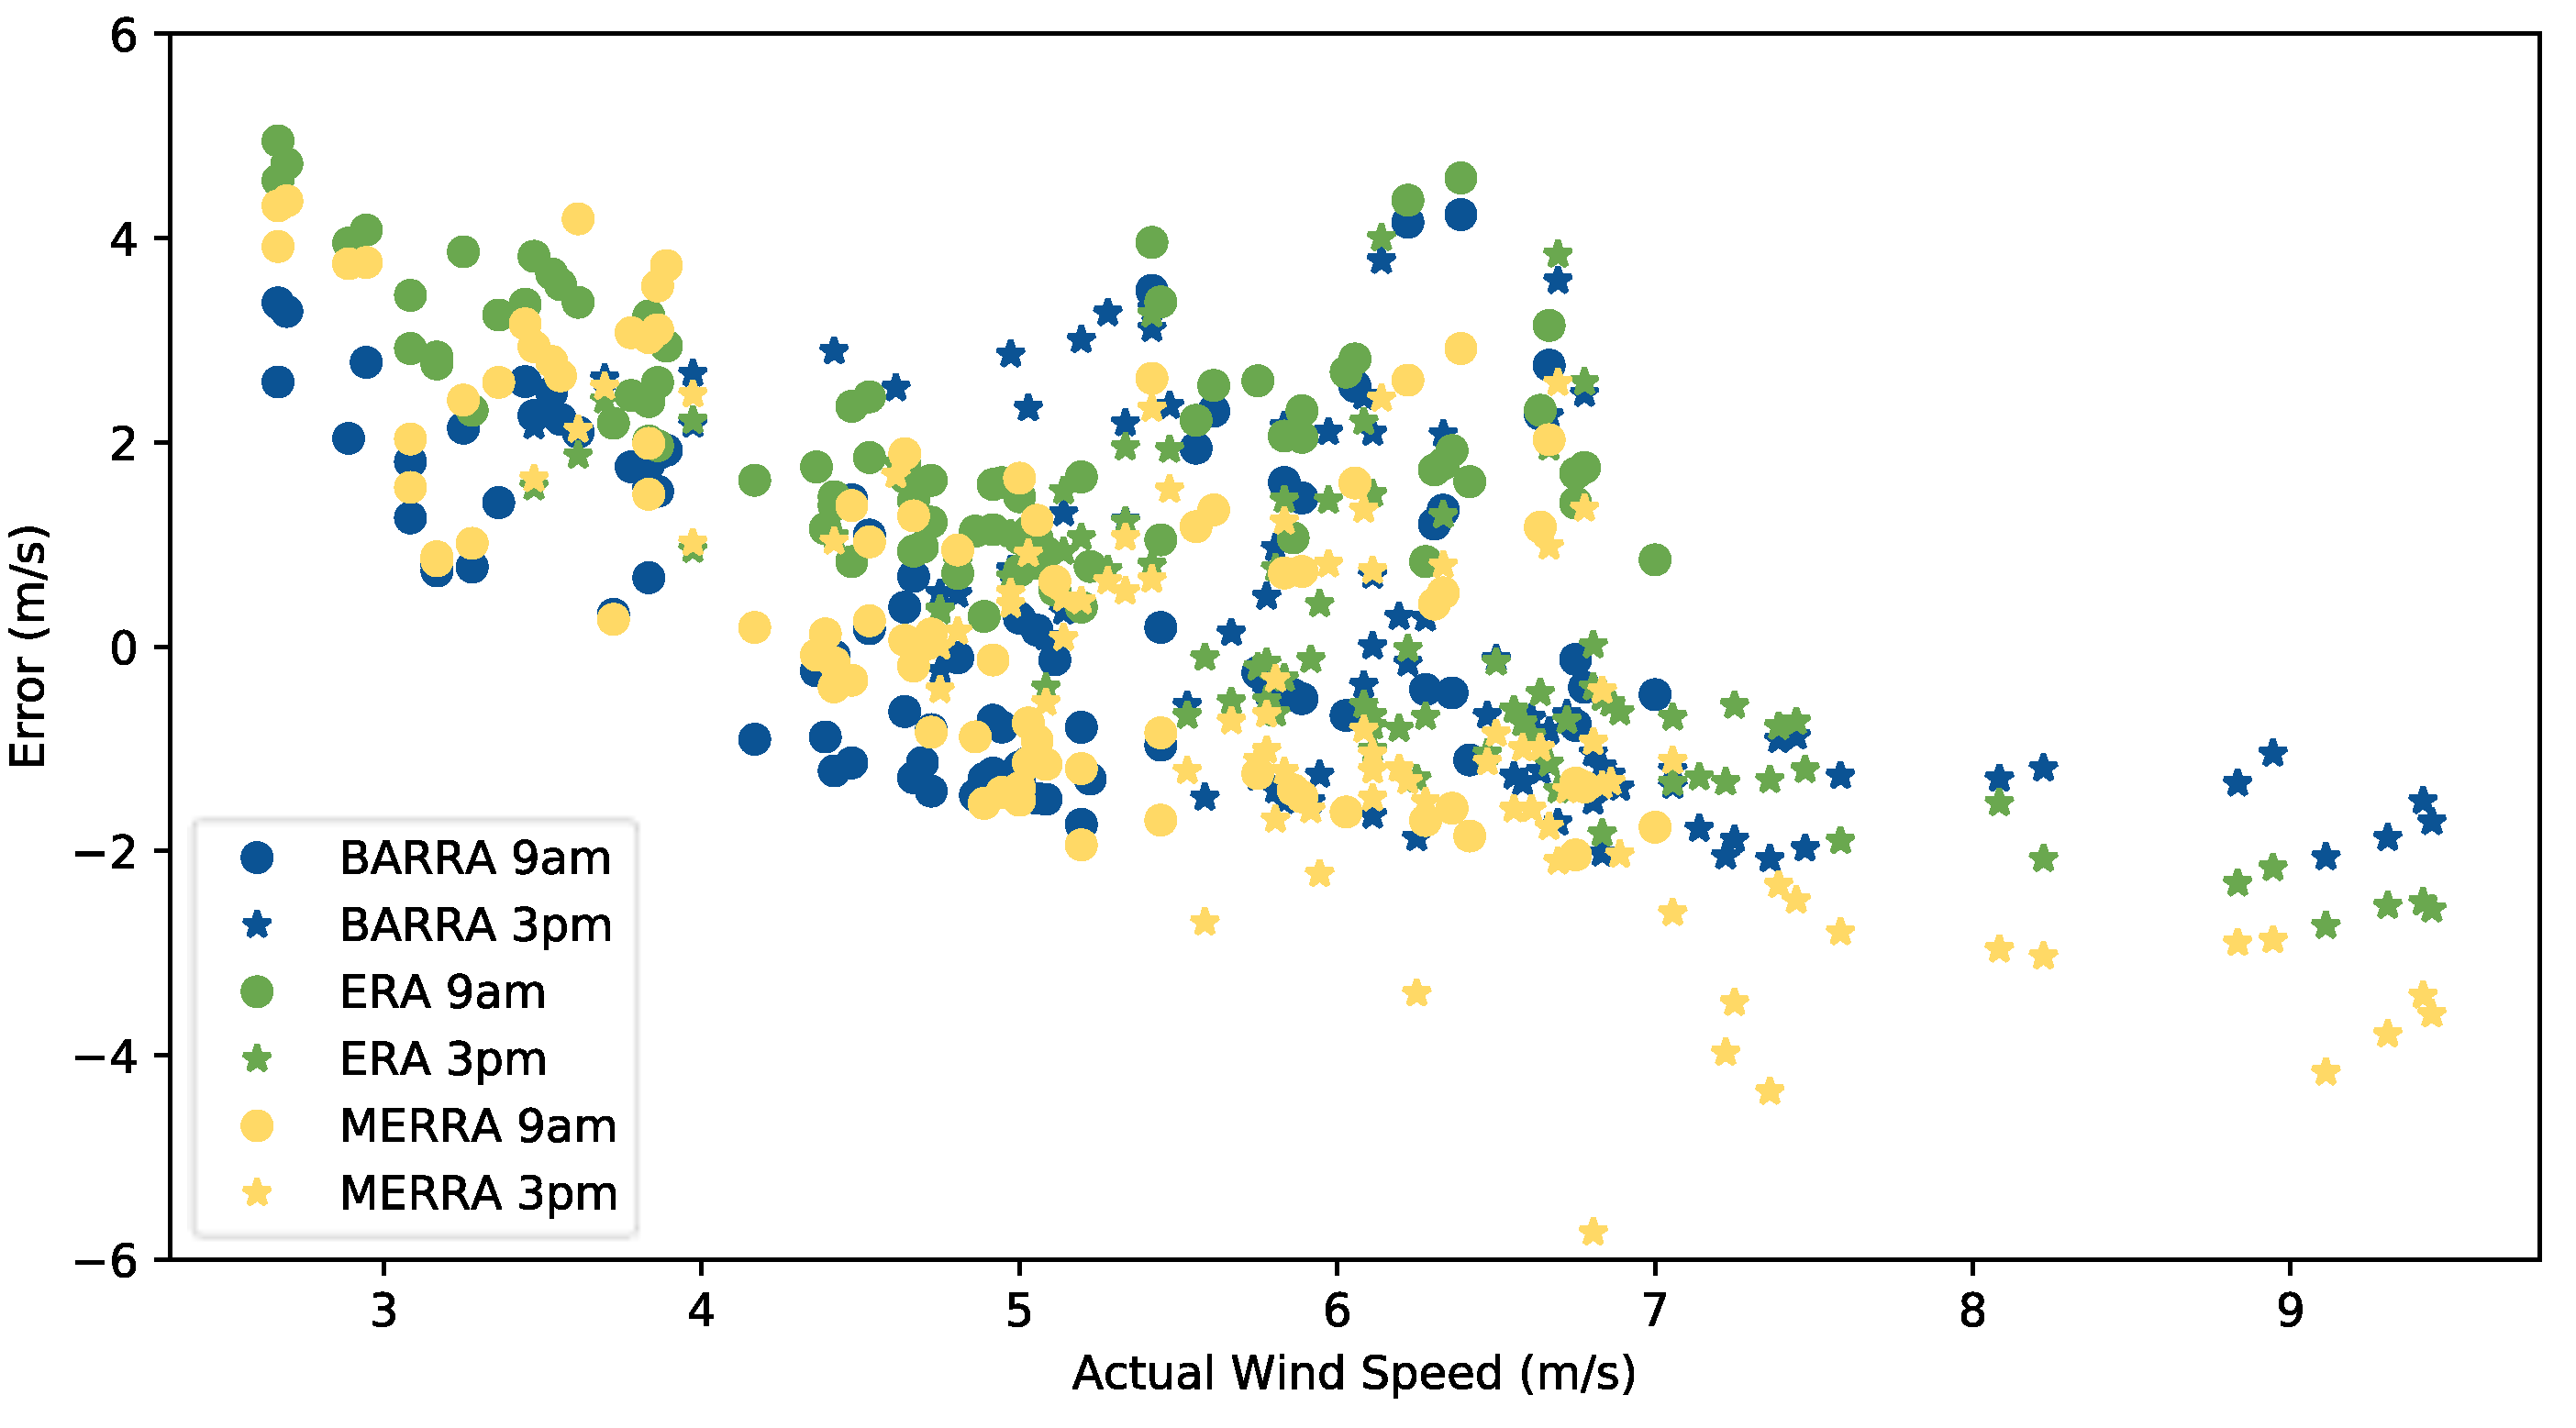
3.3. Comparison with Measured Wind speed
4. Conclusions
Author Contributions
Funding
Data Availability Statement
Conflicts of Interest
References
- CEC. Clean Energy Australia Report 2022; Technical Report; Clean Energy Council: Melbourne, Australia, 2022. [Google Scholar]
- Briggs, C.; Hemer, M.; Howard, P.; Langdon, R.; Marsh, P.; Teske, S.; Carrascosa, D. Offshore Wind Energy in Australia; Blue Economy Cooperative Research Centre: Newnham, Australia, 2021; p. 92. [Google Scholar]
- IEA. Offshore Wind Outlook; Technical Report; International Energy Agency: Paris, France, 2019.
- Jensen, C.U.; Panduro, T.E.; Lundhede, T.H.; Nielsen, A.S.E.; Dalsgaard, M.; Thorsen, B.J. The impact of on-shore and off-shore wind turbine farms on property prices. Energy Policy 2018, 116, 50–59. [Google Scholar] [CrossRef]
- Bowen, C. Unlocking the Power of Offshore Wind; Media Release; Department of Climate Change, Energy, the Environment and Water: Canberra, Australia, 2022. [Google Scholar]
- Golestani, N.; Arzaghi, E.; Abbassi, R.; Garaniya, V.; Abdussamie, N.; Yang, M. The Game of Guwarra: A game theory-based decision-making framework for site selection of offshore wind farms in Australia. J. Clean. Prod. 2021, 326, 129358. [Google Scholar] [CrossRef]
- Messali, E.; Diesendorf, M. Potential sites for off-shore wind power in Australia. Wind Eng. 2009, 33, 335–348. [Google Scholar] [CrossRef]
- AEMO. 2021 Inputs, Assumptions and Scenarios Report; Technical Report; Australian Energy Market Operator: Melbourne, Australia, 2021. [Google Scholar]
- Rispler, J.; Roberts, M.; Bruce, A. A change in the air? The role of offshore wind in Australia’s transition to a 100% renewable grid. Electron. J. 2022, 35, 107190. [Google Scholar] [CrossRef]
- Victorian Government. Offshore Wind Policy Directions Paper; Technical Report; Department of Environment, Land, Water, & Planning, Victorian Government: Melbourne, Australia, 2022.
- Masters, G.M. Renewable and Efficient Electric Power Systems; John Wiley & Sons: Hoboken, NJ, USA, 2013. [Google Scholar]
- Gualtieri, G. Analysing the uncertainties of reanalysis data used for wind resource assessment: A critical review. Renew. Sustain. Energy Rev. 2022, 167, 112741. [Google Scholar] [CrossRef]
- Hersbach, H.; Bell, B.; Berrisford, P.; Hirahara, S.; Horányi, A.; Muñoz-Sabater, J.; Nicolas, J.; Peubey, C.; Radu, R.; Schepers, D.; et al. The ERA5 global reanalysis. Q. J. R. Meteorol. Soc. 2020, 146, 1999–2049. [Google Scholar] [CrossRef]
- Fujiwara, M.; Wright, J.S.; Manney, G.L.; Gray, L.J.; Anstey, J.; Birner, T.; Davis, S.; Gerber, E.P.; Harvey, V.L.; Hegglin, M.I.; et al. Introduction to the SPARC Reanalysis Intercomparison Project (S-RIP) and overview of the reanalysis systems. Atmos. Chem. Phys. 2017, 17, 1417–1452. [Google Scholar] [CrossRef] [Green Version]
- Jiang, Y.; Han, S.; Shi, C.; Gao, T.; Zhen, H.; Liu, X. Evaluation of HRCLDAS and ERA5 datasets for near-surface wind over hainan island and south China sea. Atmosphere 2021, 12, 766. [Google Scholar] [CrossRef]
- Molina, M.O.; Gutiérrez, C.; Sánchez, E. Comparison of ERA5 surface wind speed climatologies over Europe with observations from the HadISD dataset. Int. J. Climatol. 2021, 41, 4864–4878. [Google Scholar] [CrossRef]
- Gelaro, R.; McCarty, W.; Suárez, M.J.; Todling, R.; Molod, A.; Takacs, L.; Randles, C.A.; Darmenov, A.; Bosilovich, M.G.; Reichle, R.; et al. The modern-era retrospective analysis for research and applications, version 2 (MERRA-2). J. Clim. 2017, 30, 5419–5454. [Google Scholar] [CrossRef] [PubMed]
- Mamani, R.; Hendrick, P. Weather research & forecasting model and MERRA-2 data for wind energy evaluation at different altitudes in Bolivia. Wind Eng. 2022, 46, 177–188. [Google Scholar]
- Rabbani, R.; Zeeshan, M. Exploring the suitability of MERRA-2 reanalysis data for wind energy estimation, analysis of wind characteristics and energy potential assessment for selected sites in Pakistan. Renew. Energy 2020, 154, 1240–1251. [Google Scholar] [CrossRef]
- Khatibi, A.; Krauter, S. Validation and performance of satellite meteorological dataset MERRA-2 for solar and wind applications. Energies 2021, 14, 882. [Google Scholar] [CrossRef]
- Staffell, I.; Pfenninger, S. Using bias-corrected reanalysis to simulate current and future wind power output. Energy 2016, 114, 1224–1239. [Google Scholar] [CrossRef] [Green Version]
- Olauson, J. ERA5: The new champion of wind power modelling? Renew. Energy 2018, 126, 322–331. [Google Scholar] [CrossRef] [Green Version]
- Gruber, K.; Regner, P.; Wehrle, S.; Zeyringer, M.; Schmidt, J. Towards global validation of wind power simulations: A multi-country assessment of wind power simulation from MERRA-2 and ERA-5 reanalyses bias-corrected with the global wind atlas. Energy 2022, 238, 121520. [Google Scholar] [CrossRef]
- Su, C.H.; Eizenberg, N.; Steinle, P.; Jakob, D.; Fox-Hughes, P.; White, C.J.; Rennie, S.; Franklin, C.; Dharssi, I.; Zhu, H. BARRA v1. 0: The Bureau of Meteorology atmospheric high-resolution regional reanalysis for Australia. Geosci. Model Dev. 2019, 12, 2049–2068. [Google Scholar] [CrossRef] [Green Version]
- BoM. Q&A for BARRA; Technical Report; Australian Bureau of Meterology: Melbourne, Australia, 2019.
- Lee, B.X.; Kjaerulf, F.; Turner, S.; Cohen, L.; Donnelly, P.D.; Muggah, R.; Davis, R.; Realini, A.; Kieselbach, B.; MacGregor, L.S.; et al. Transforming our world: Implementing the 2030 agenda through sustainable development goal indicators. J. Public Health Policy 2016, 37, 13–31. [Google Scholar] [CrossRef] [PubMed]
- Bosilovich, M.; Lucchesi, R.; Suarez, M. MERRA-2: File specification, Global Modeling and Assimilation Office GMAO; Technical Report; NASA: Greenbelt, MD, USA, 2016. [Google Scholar]
- Arakawa, A. Computational design of the basic dynamical processes of the UCLA general circulation model. Methods Comput. Phys. Adv. Res. Appl. 1977, 177, 173–265. [Google Scholar]
- Walsh, S.D.C.; Easton, L.; Weng, Z.; Wang, C.; Moloney, J.; Feitz, A. Evaluating the economic fairways for hydrogen production in Australia. Int. J. Hydrogen Energy 2021, 46, 35985–35996. [Google Scholar] [CrossRef]
- Wang, C.; Walsh, S. Offshore Wind Capacity Factor Maps—Evaluating Australia’s Offshore Wind Resources Potential; Technical Report; Geoscience Australia: Canberra, Australia, 2022. [Google Scholar]
- OEP. Wind Turbine Library; Open Energy Platform; 2020; Available online: https://openenergy-platform.org/dataedit/view/supply/wind_turbine_library (accessed on 1 April 2023).
- SoTS. Measuring the Wind and Wave Conditions; Technical Report; Star of the South: Melbourne, Australia, 2019. [Google Scholar]
- BoM. Climate Data Online; Technical Report; Australian Bureau of Meterology: Melbourne, Australia, 2022.
- Coppin, P.; Ayotte, K.; Steggel, N. Wind Resource Assessment in Australia: A Planners Guide; CSIRO Wind Energy Research Unit, Australian Greenhouse Office: Canberra, Australia, 2003. [Google Scholar]
- GGIC. Australian Requirements for the Submission of Digital Exploration Data: National Guidelines; Technical Report; Government Geoscience Information Committee: Canberra, Australia, 2018.
- Australian Parliament. Pre-Competitive Geoscience Data Acquisition. In Proceedings of the Inquiry into Resources Exploration Impediments; Standing Committee on Industry and Resources: Canberra, Australia, 2002. [Google Scholar]


| Dataset | Spatial Resolution | Pressure Levels | Pressure Level Range | Dates Available | Temporal Resolution |
|---|---|---|---|---|---|
| BARRA | 12 km | 37 | 0.1–1000 hPa | 1990–2019 (Feb.) | Hourly |
| ERA5 | 30 km | 37 | 1–1000 hPa | 1979–present | Hourly |
| MERRA-2 | 50 km | 42 | 0.1–1000 hPa | 1980–present | 3 h |
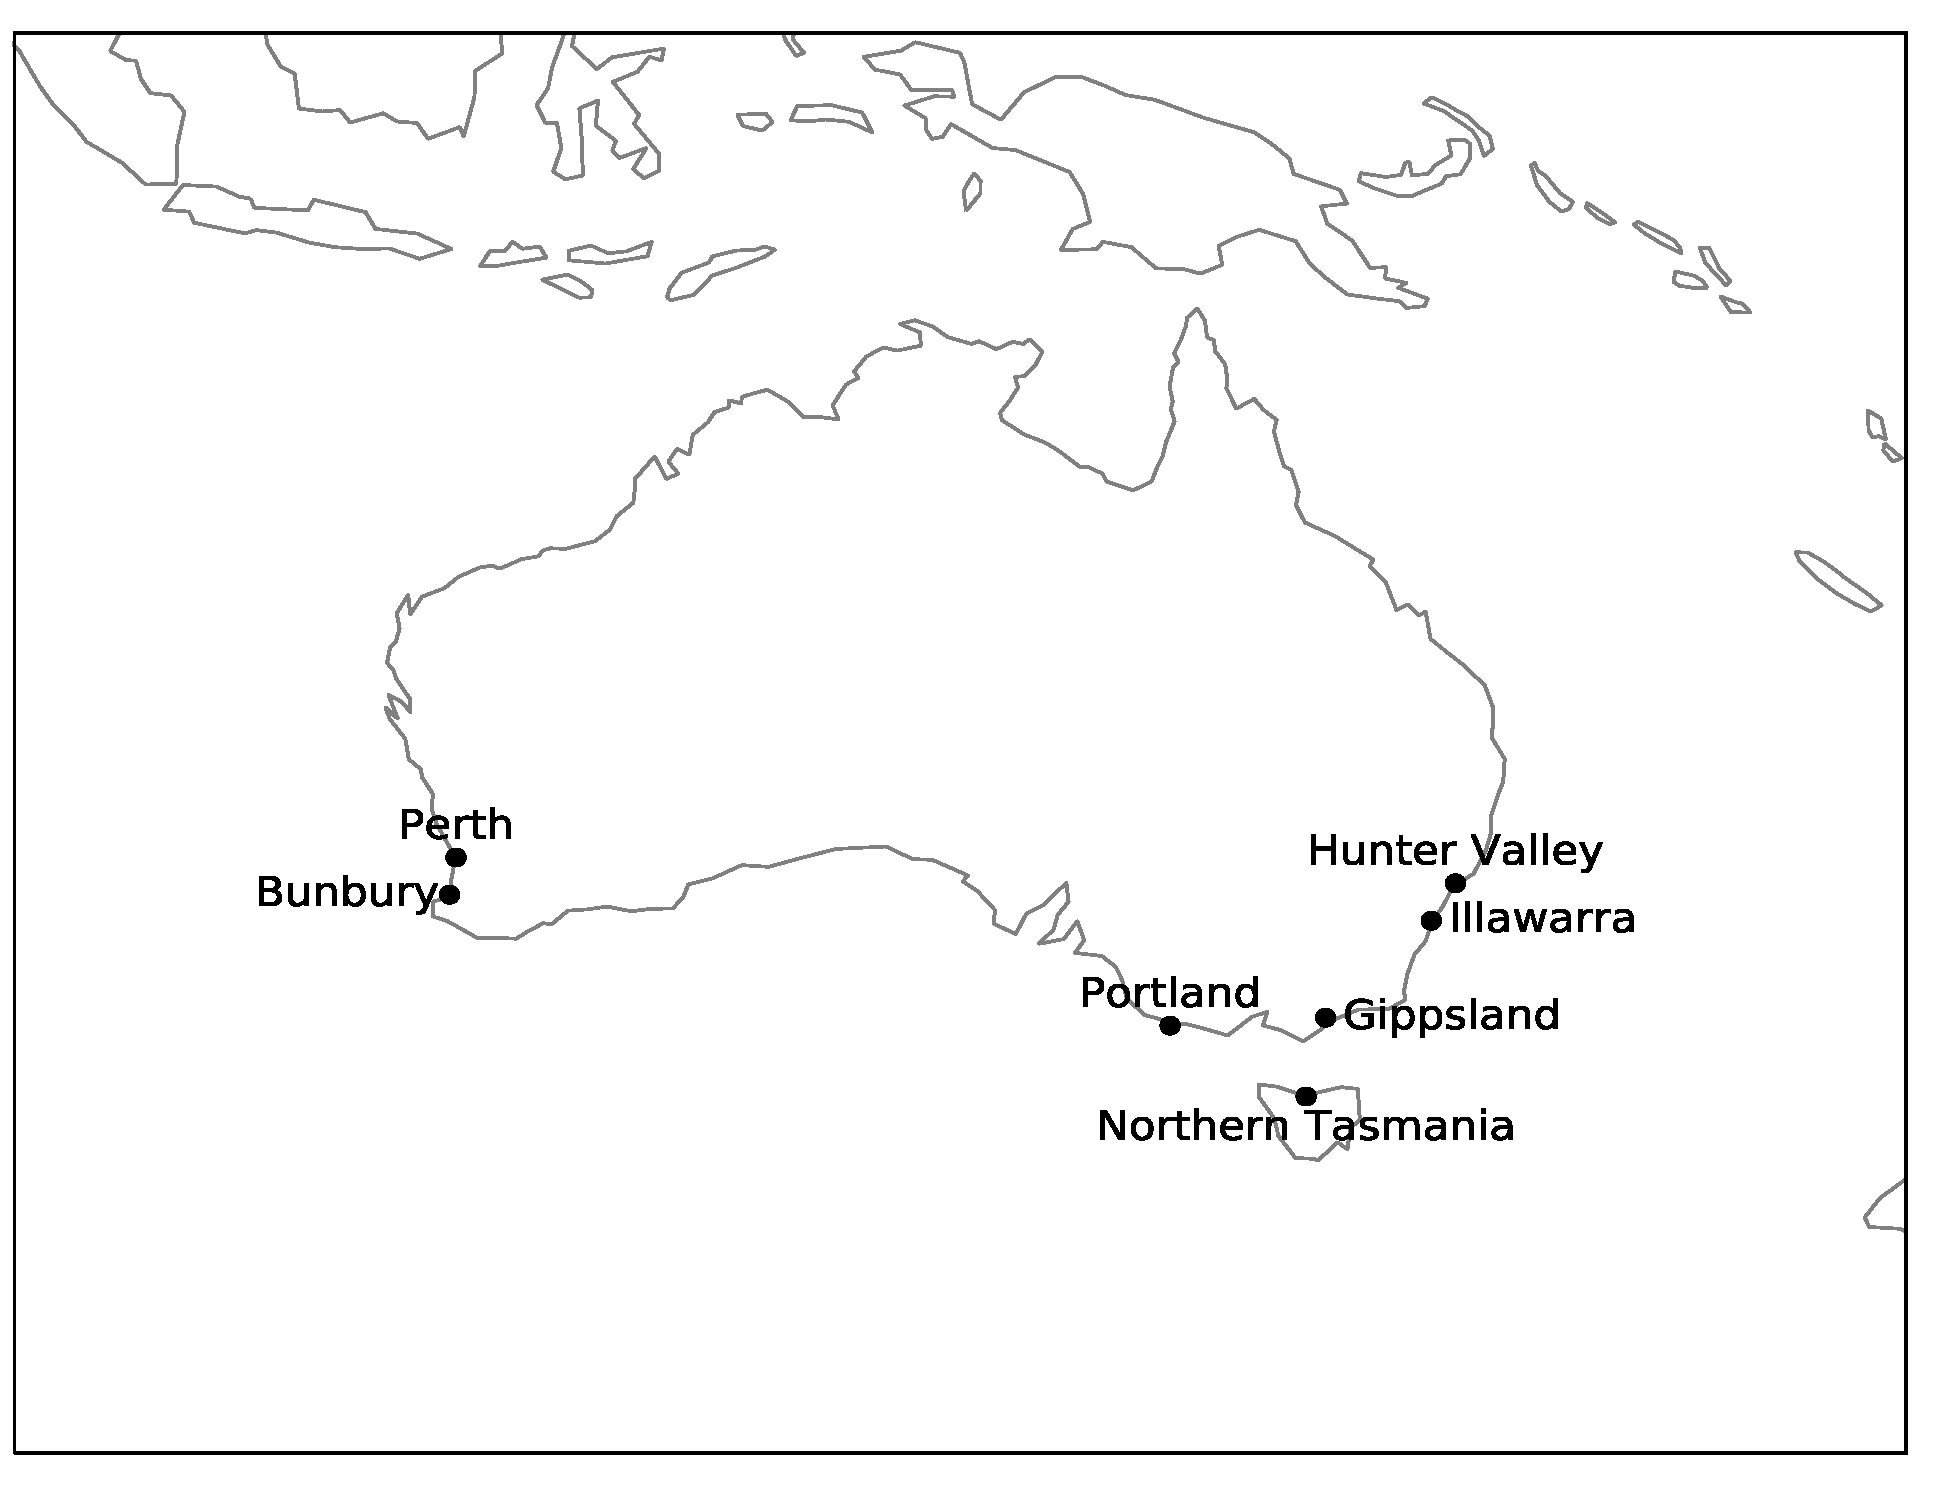
| Offshore Wind Zone | Weather Station | Coordinates | Elevation | Dates |
|---|---|---|---|---|
| Bunbury | Bunbury | 33.36 S, 115.64 E | 5 m | 2003–2022 |
| Gippsland | East Sale | 38.12 S, 147.13 E | 5 m | 1991–2017 |
| Hunter Valley | Newcastle Nobbys Signal Station | 32.92 S, 151.80 E | 33 m | 1991–2020 |
| Illawarra | Bellambi AWS | 34.37 S, 150.93 E | 10 m | 2003–2022 |
| Northern Tasmania | Devonport Airport | 41.17 S, 146.43 E | 8 m | 1996–2020 |
| Perth | Perth Metro | 31.92 S, 115.87 E | 25 m | 2003–2022 |
| Portland | Cape Nelson Lighthouse | 38.43 S, 141.54 E | 45 m | 2003–2022 |
| BARRA and MERRA-2 | BARRA and ERA5 | ERA5 and MERRA-2 | |
|---|---|---|---|
| Correlation coefficient | 0.779 | 0.811 | 0.977 |
| Average absolute difference | 0.128 | 0.111 | 0.048 |
| Maximum absolute difference | 0.902 | 0.792 | 0.886 |
| BARRA and MERRA-2 | BARRA and ERA5 | ERA5 and MERRA-2 | |
|---|---|---|---|
| Yearly | 0.799 | 0.892 | 0.788 |
| Monthly | 0.932 | 0.930 | 0.960 |
| Hourly | 0.292 | 0.378 | 0.692 |
| BARRA and MERRA-2 | BARRA and ERA5 | ERA5 and MERRA-2 | |
|---|---|---|---|
| Yearly | 7.816 | −8.131 | 14.436 |
| Monthly | 7.783 | −8.235 | 14.506 |
| Hourly | 6.784 | −9.456 | 14.704 |
Disclaimer/Publisher’s Note: The statements, opinions and data contained in all publications are solely those of the individual author(s) and contributor(s) and not of MDPI and/or the editor(s). MDPI and/or the editor(s) disclaim responsibility for any injury to people or property resulting from any ideas, methods, instructions or products referred to in the content. |
© 2023 by the authors. Licensee MDPI, Basel, Switzerland. This article is an open access article distributed under the terms and conditions of the Creative Commons Attribution (CC BY) license (https://creativecommons.org/licenses/by/4.0/).
Share and Cite
Cowin, E.; Wang, C.; Walsh, S.D.C. Assessing Predictions of Australian Offshore Wind Energy Resources from Reanalysis Datasets. Energies 2023, 16, 3404. https://doi.org/10.3390/en16083404
Cowin E, Wang C, Walsh SDC. Assessing Predictions of Australian Offshore Wind Energy Resources from Reanalysis Datasets. Energies. 2023; 16(8):3404. https://doi.org/10.3390/en16083404
Chicago/Turabian StyleCowin, Emily, Changlong Wang, and Stuart D. C. Walsh. 2023. "Assessing Predictions of Australian Offshore Wind Energy Resources from Reanalysis Datasets" Energies 16, no. 8: 3404. https://doi.org/10.3390/en16083404