
Effects of Liquid Density on the Gas-Liquid Interaction of the Ionic Liquid Compressor for Hydrogen Storage

Abstract
:1. Introduction
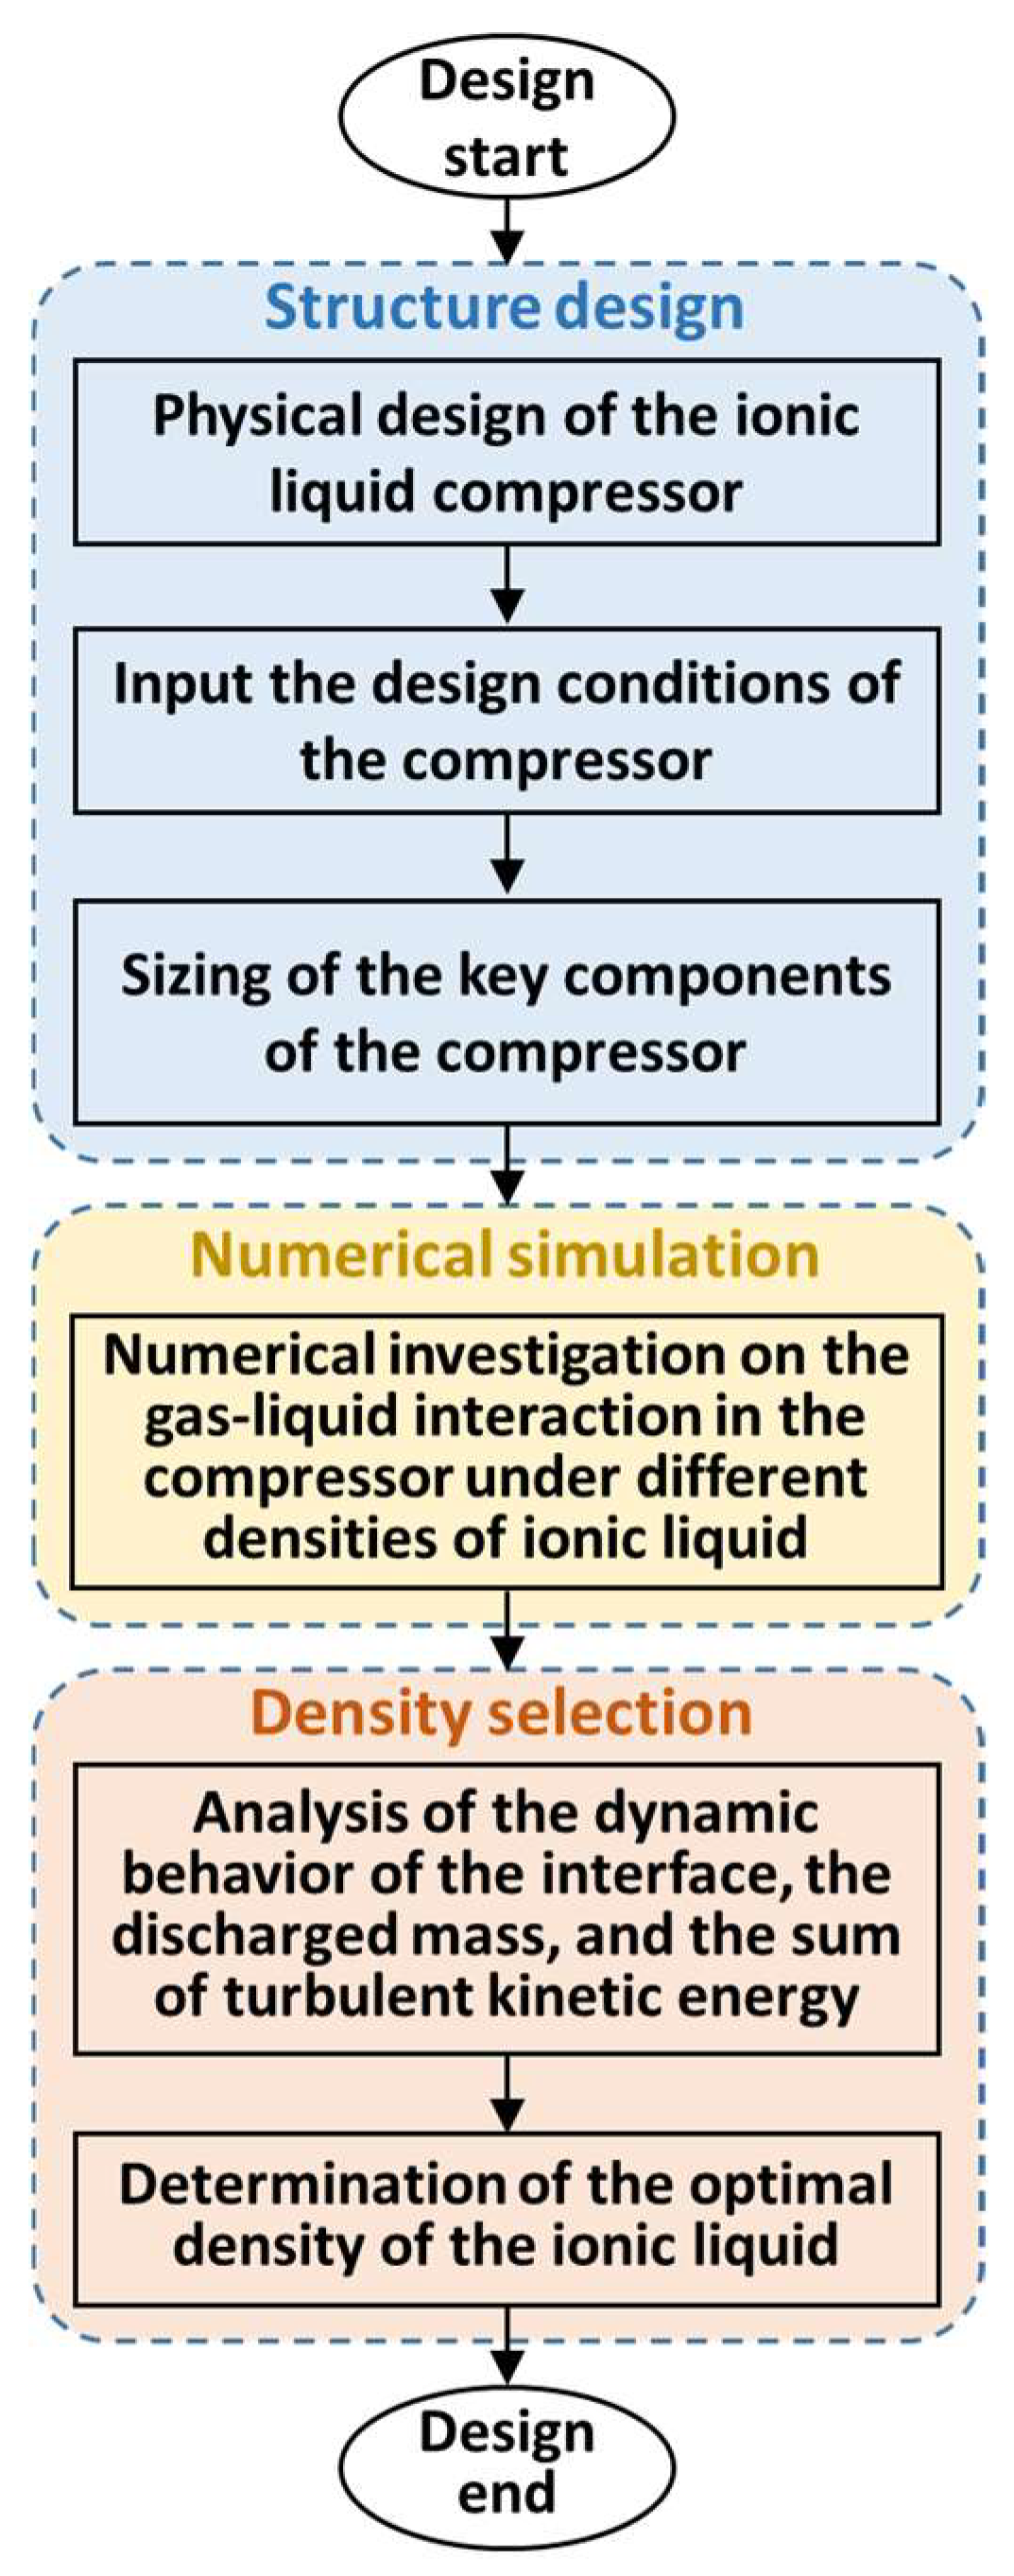
2. Methodology
- (1)
- Hydrogen gas is regarded as with a high purity without the water content.
- (2)
- Inlet hydrogen temperature is assumed as the environment temperature.
- (3)
- Hydrogen production methods are not considered in the study, which means that the hydrogen colour type is not taken into account.
3. Mathematical and Numerical Model
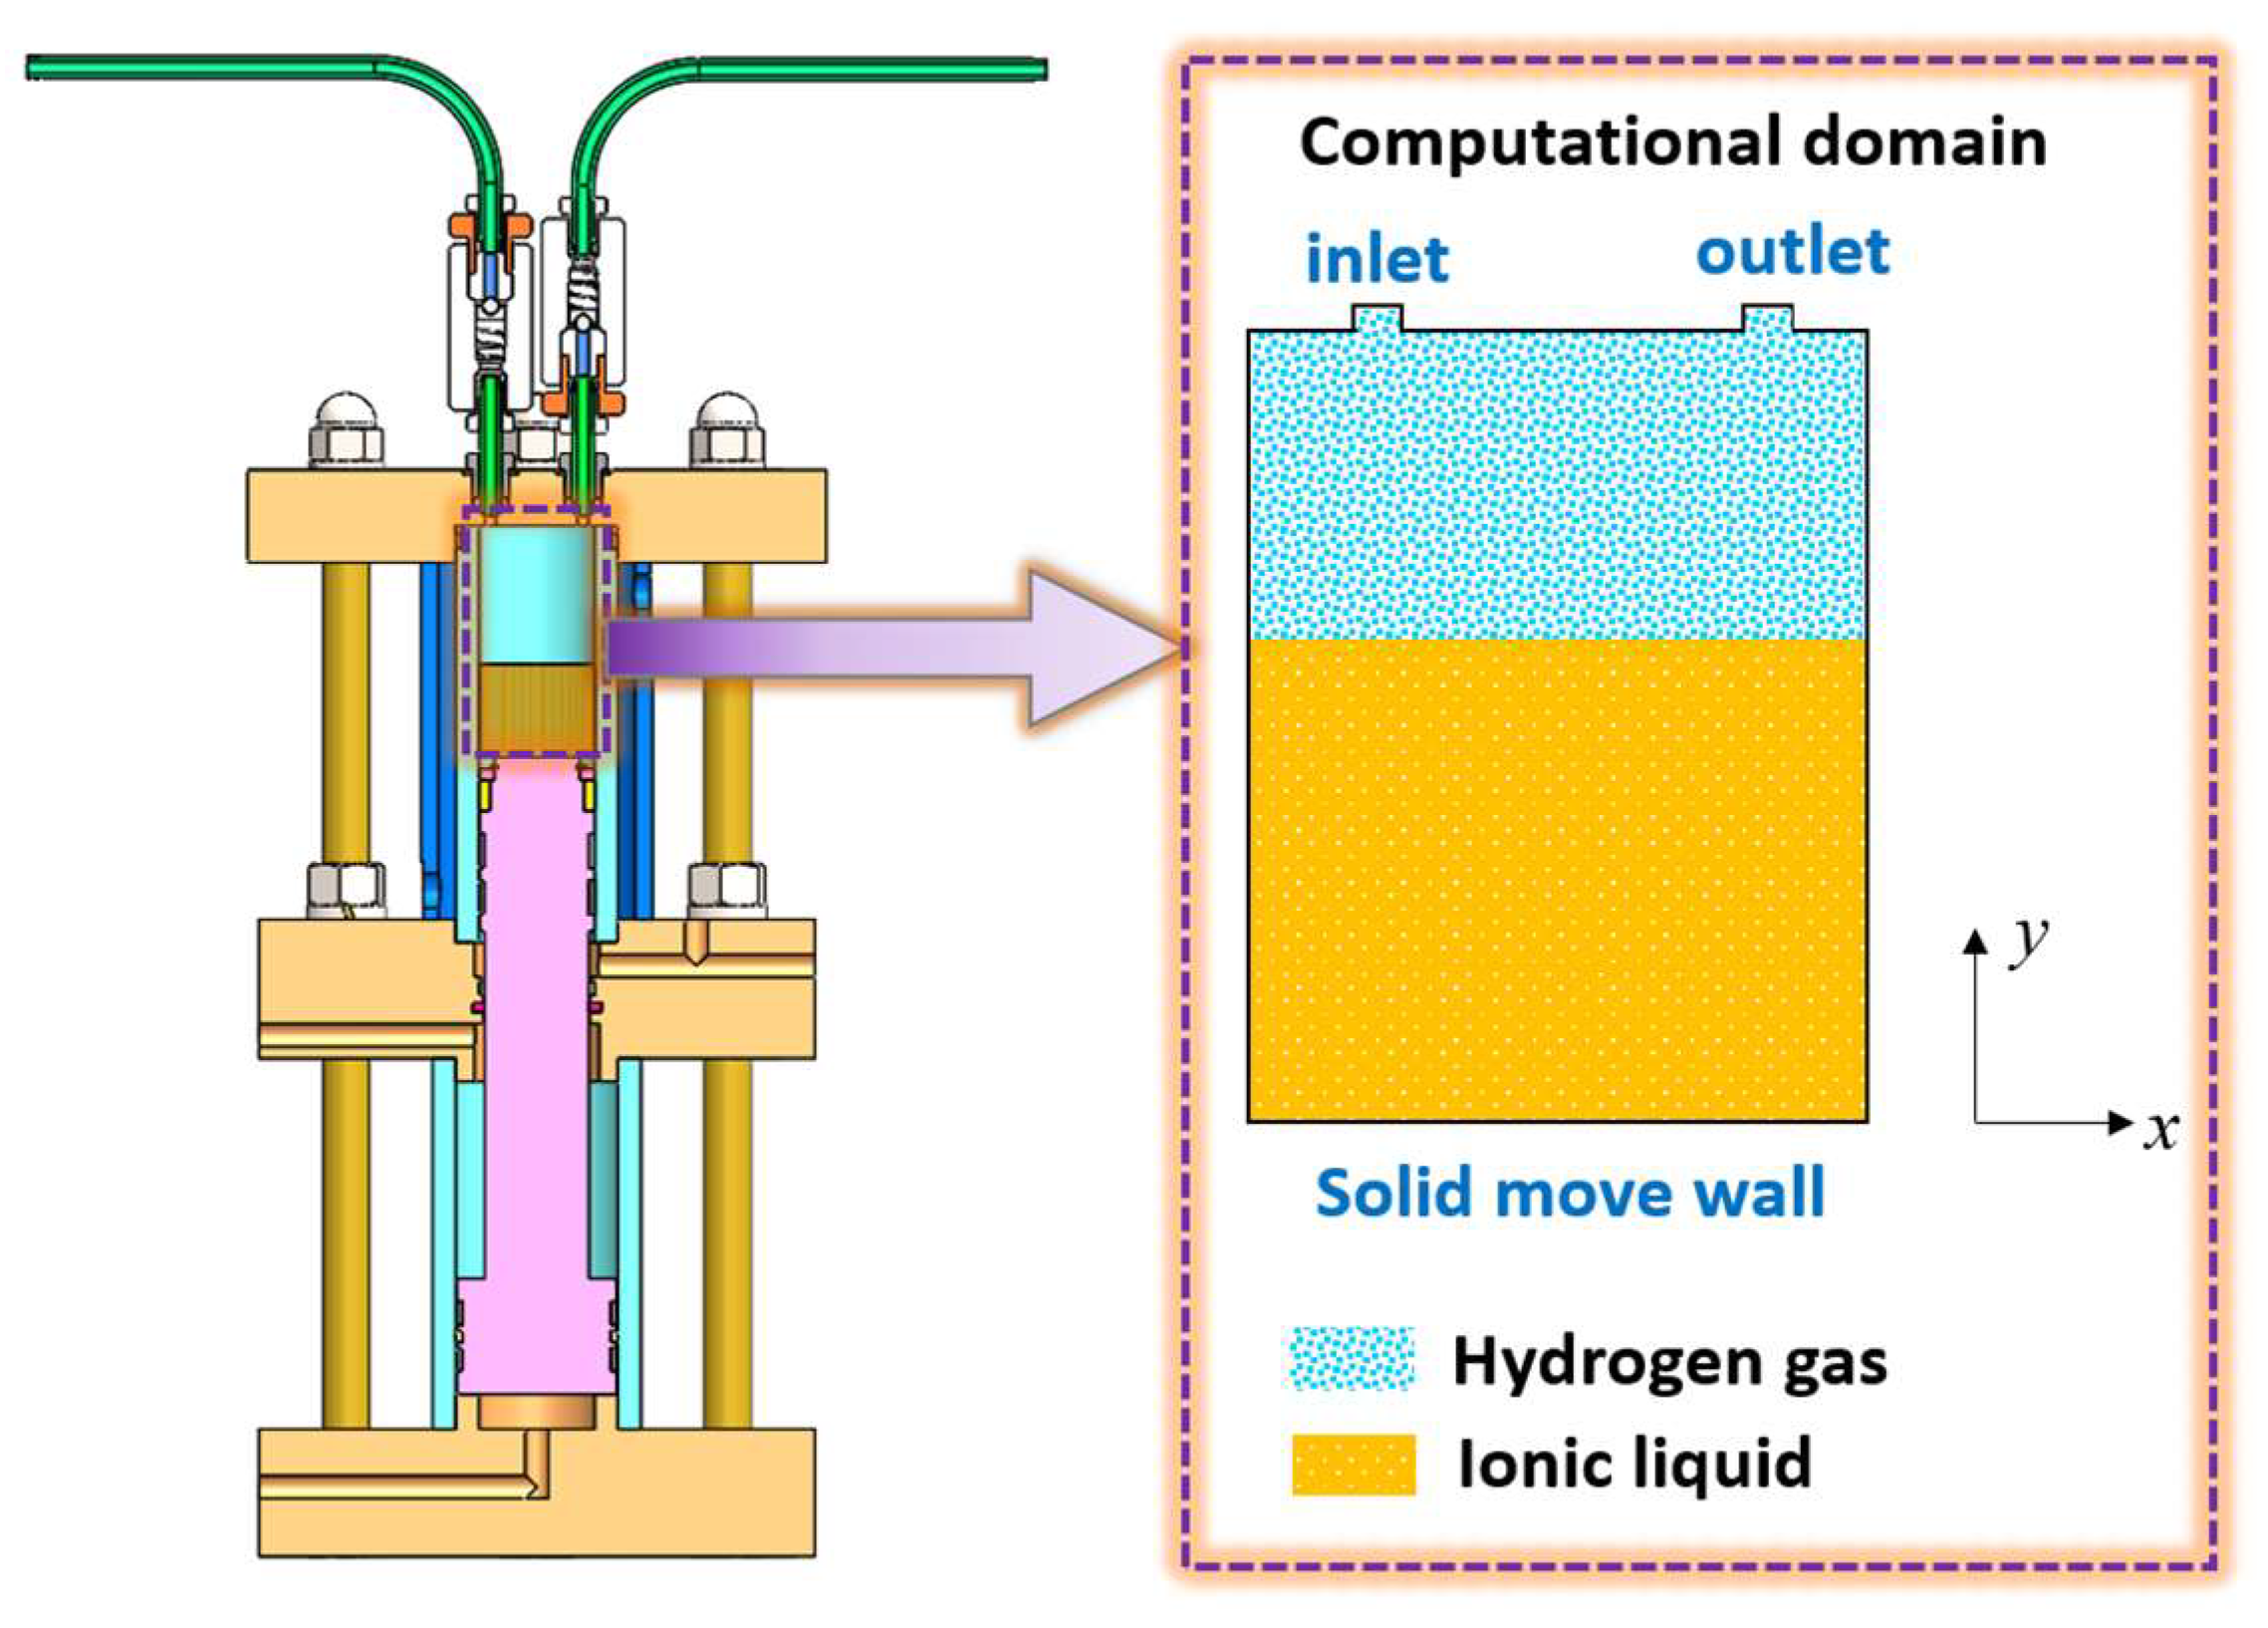
3.1. Computational Domain and Size Calculation
3.2. Governing Equations
3.3. Boundary Conditions and Calculation Setting
3.4. Independence Verification of the Mesh Size and Time Step
4. Results and Discussion
4.1. Results of the Size Calculation
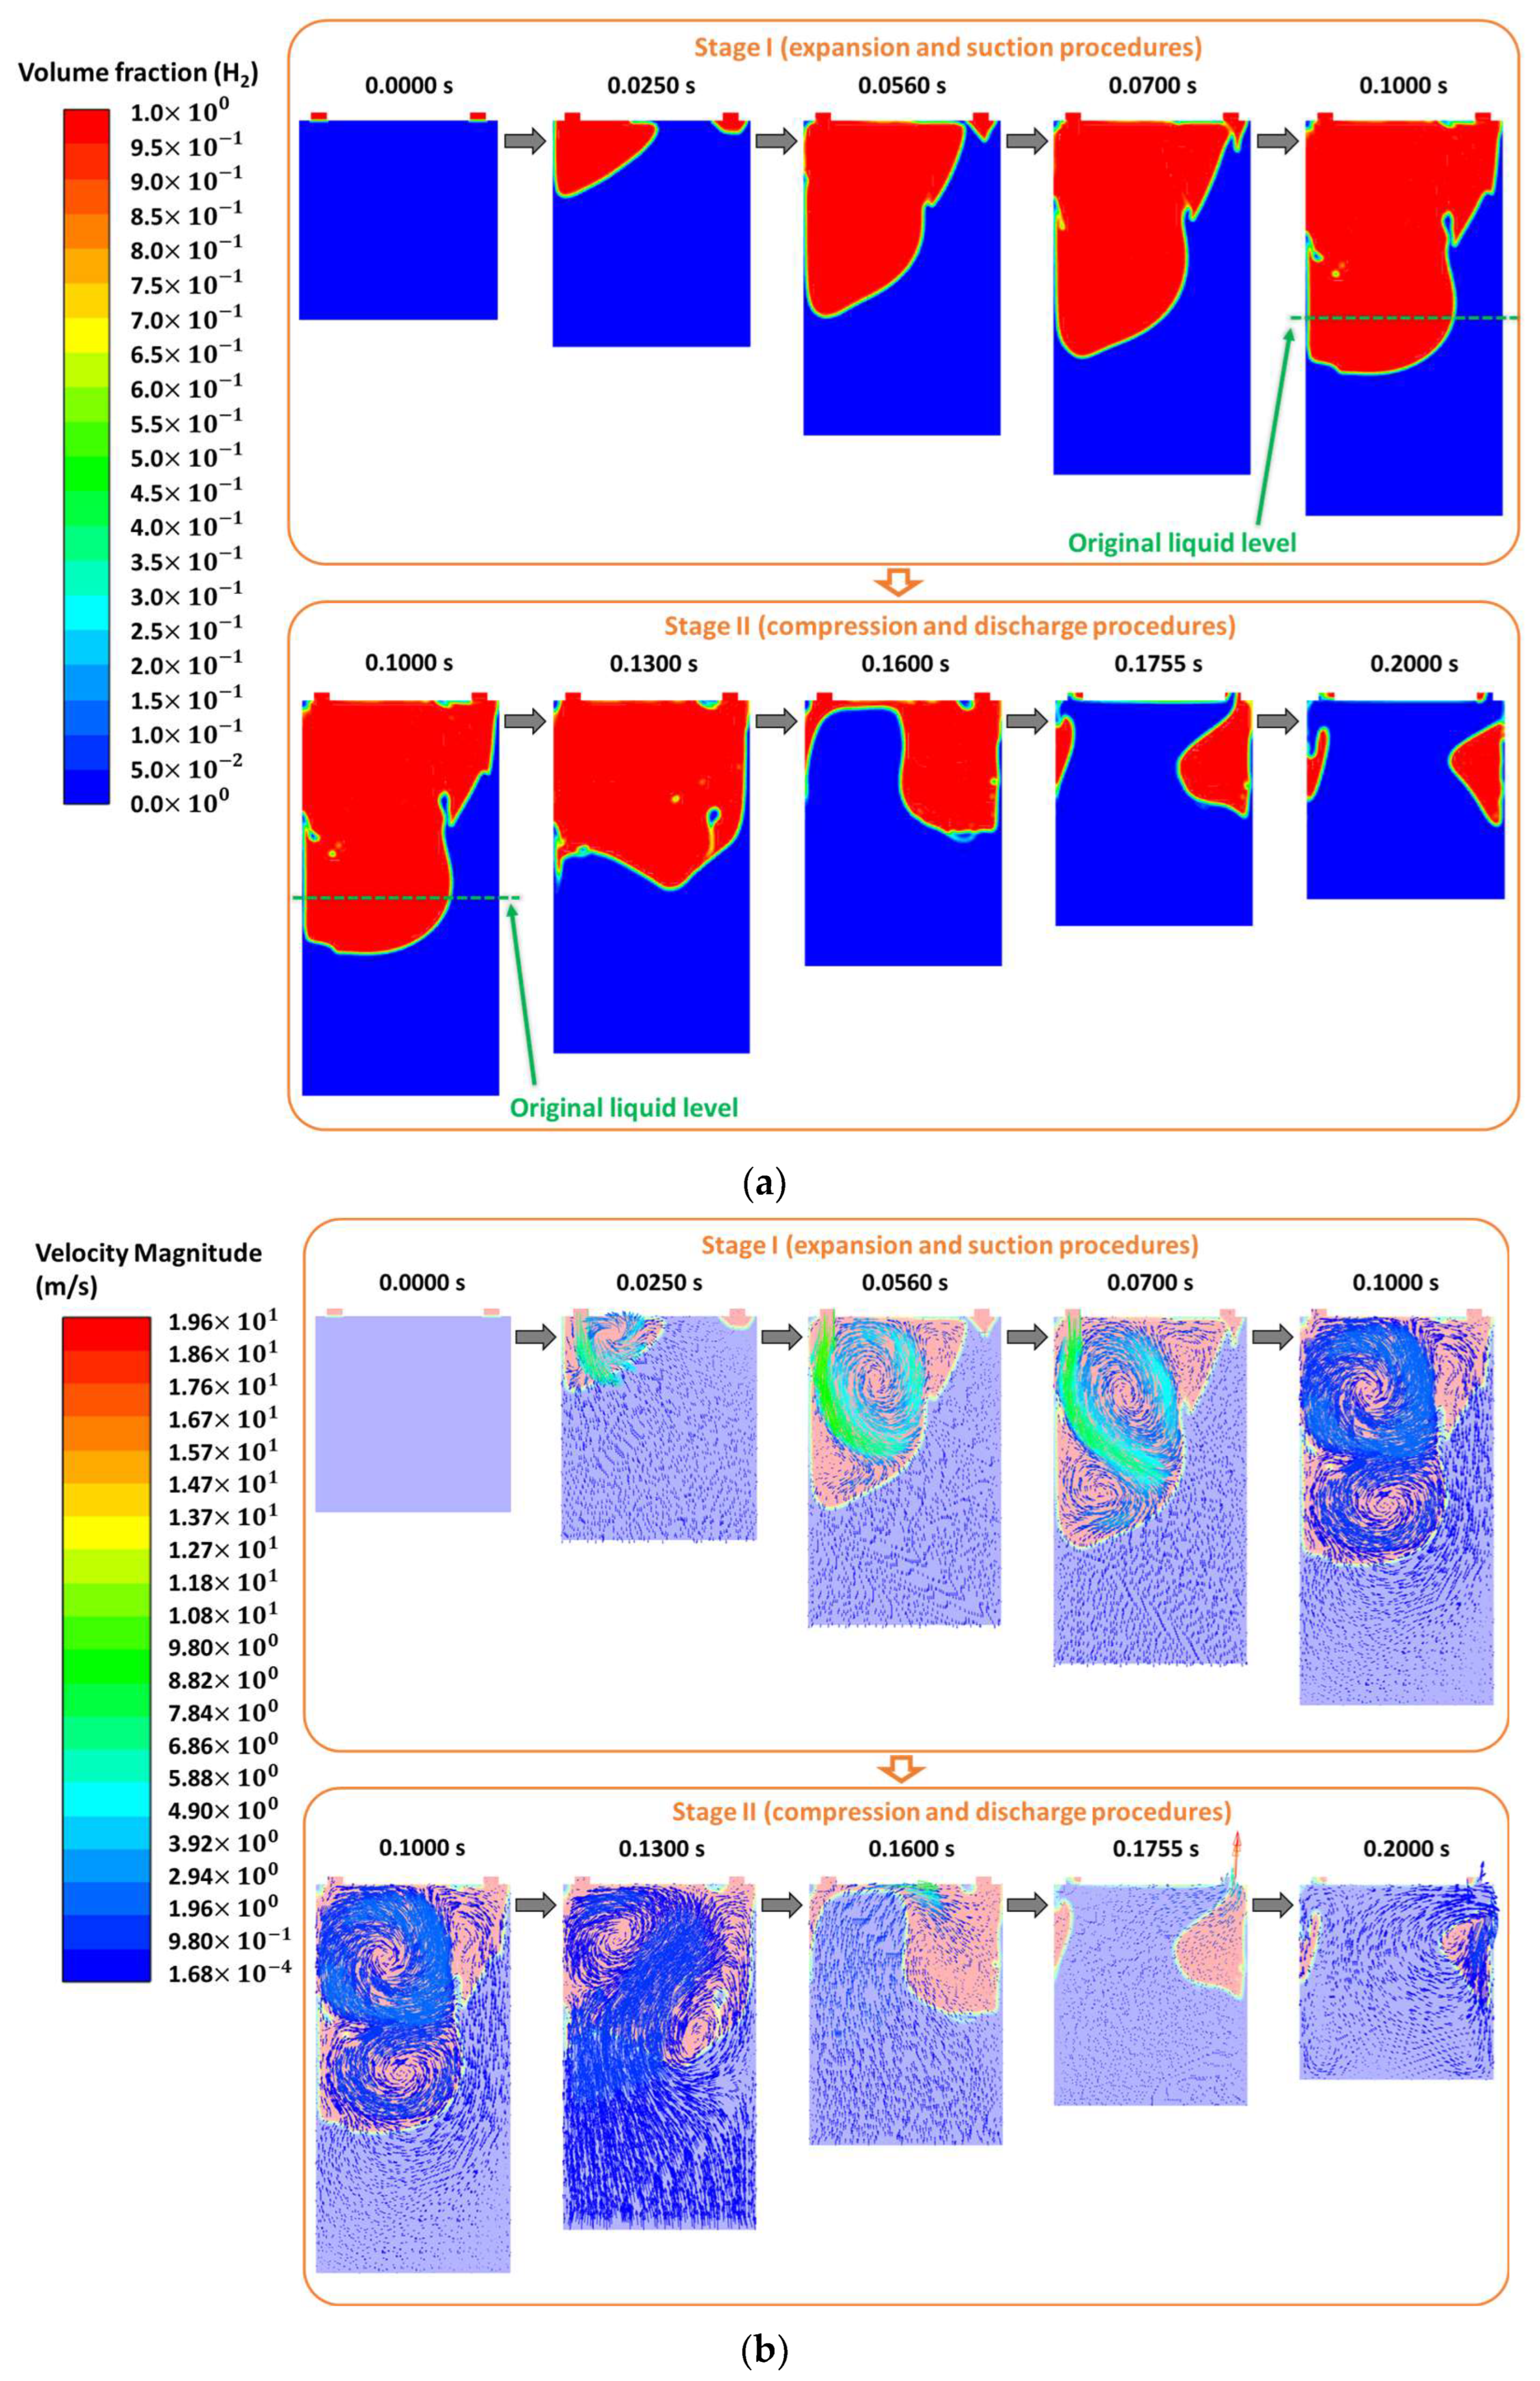
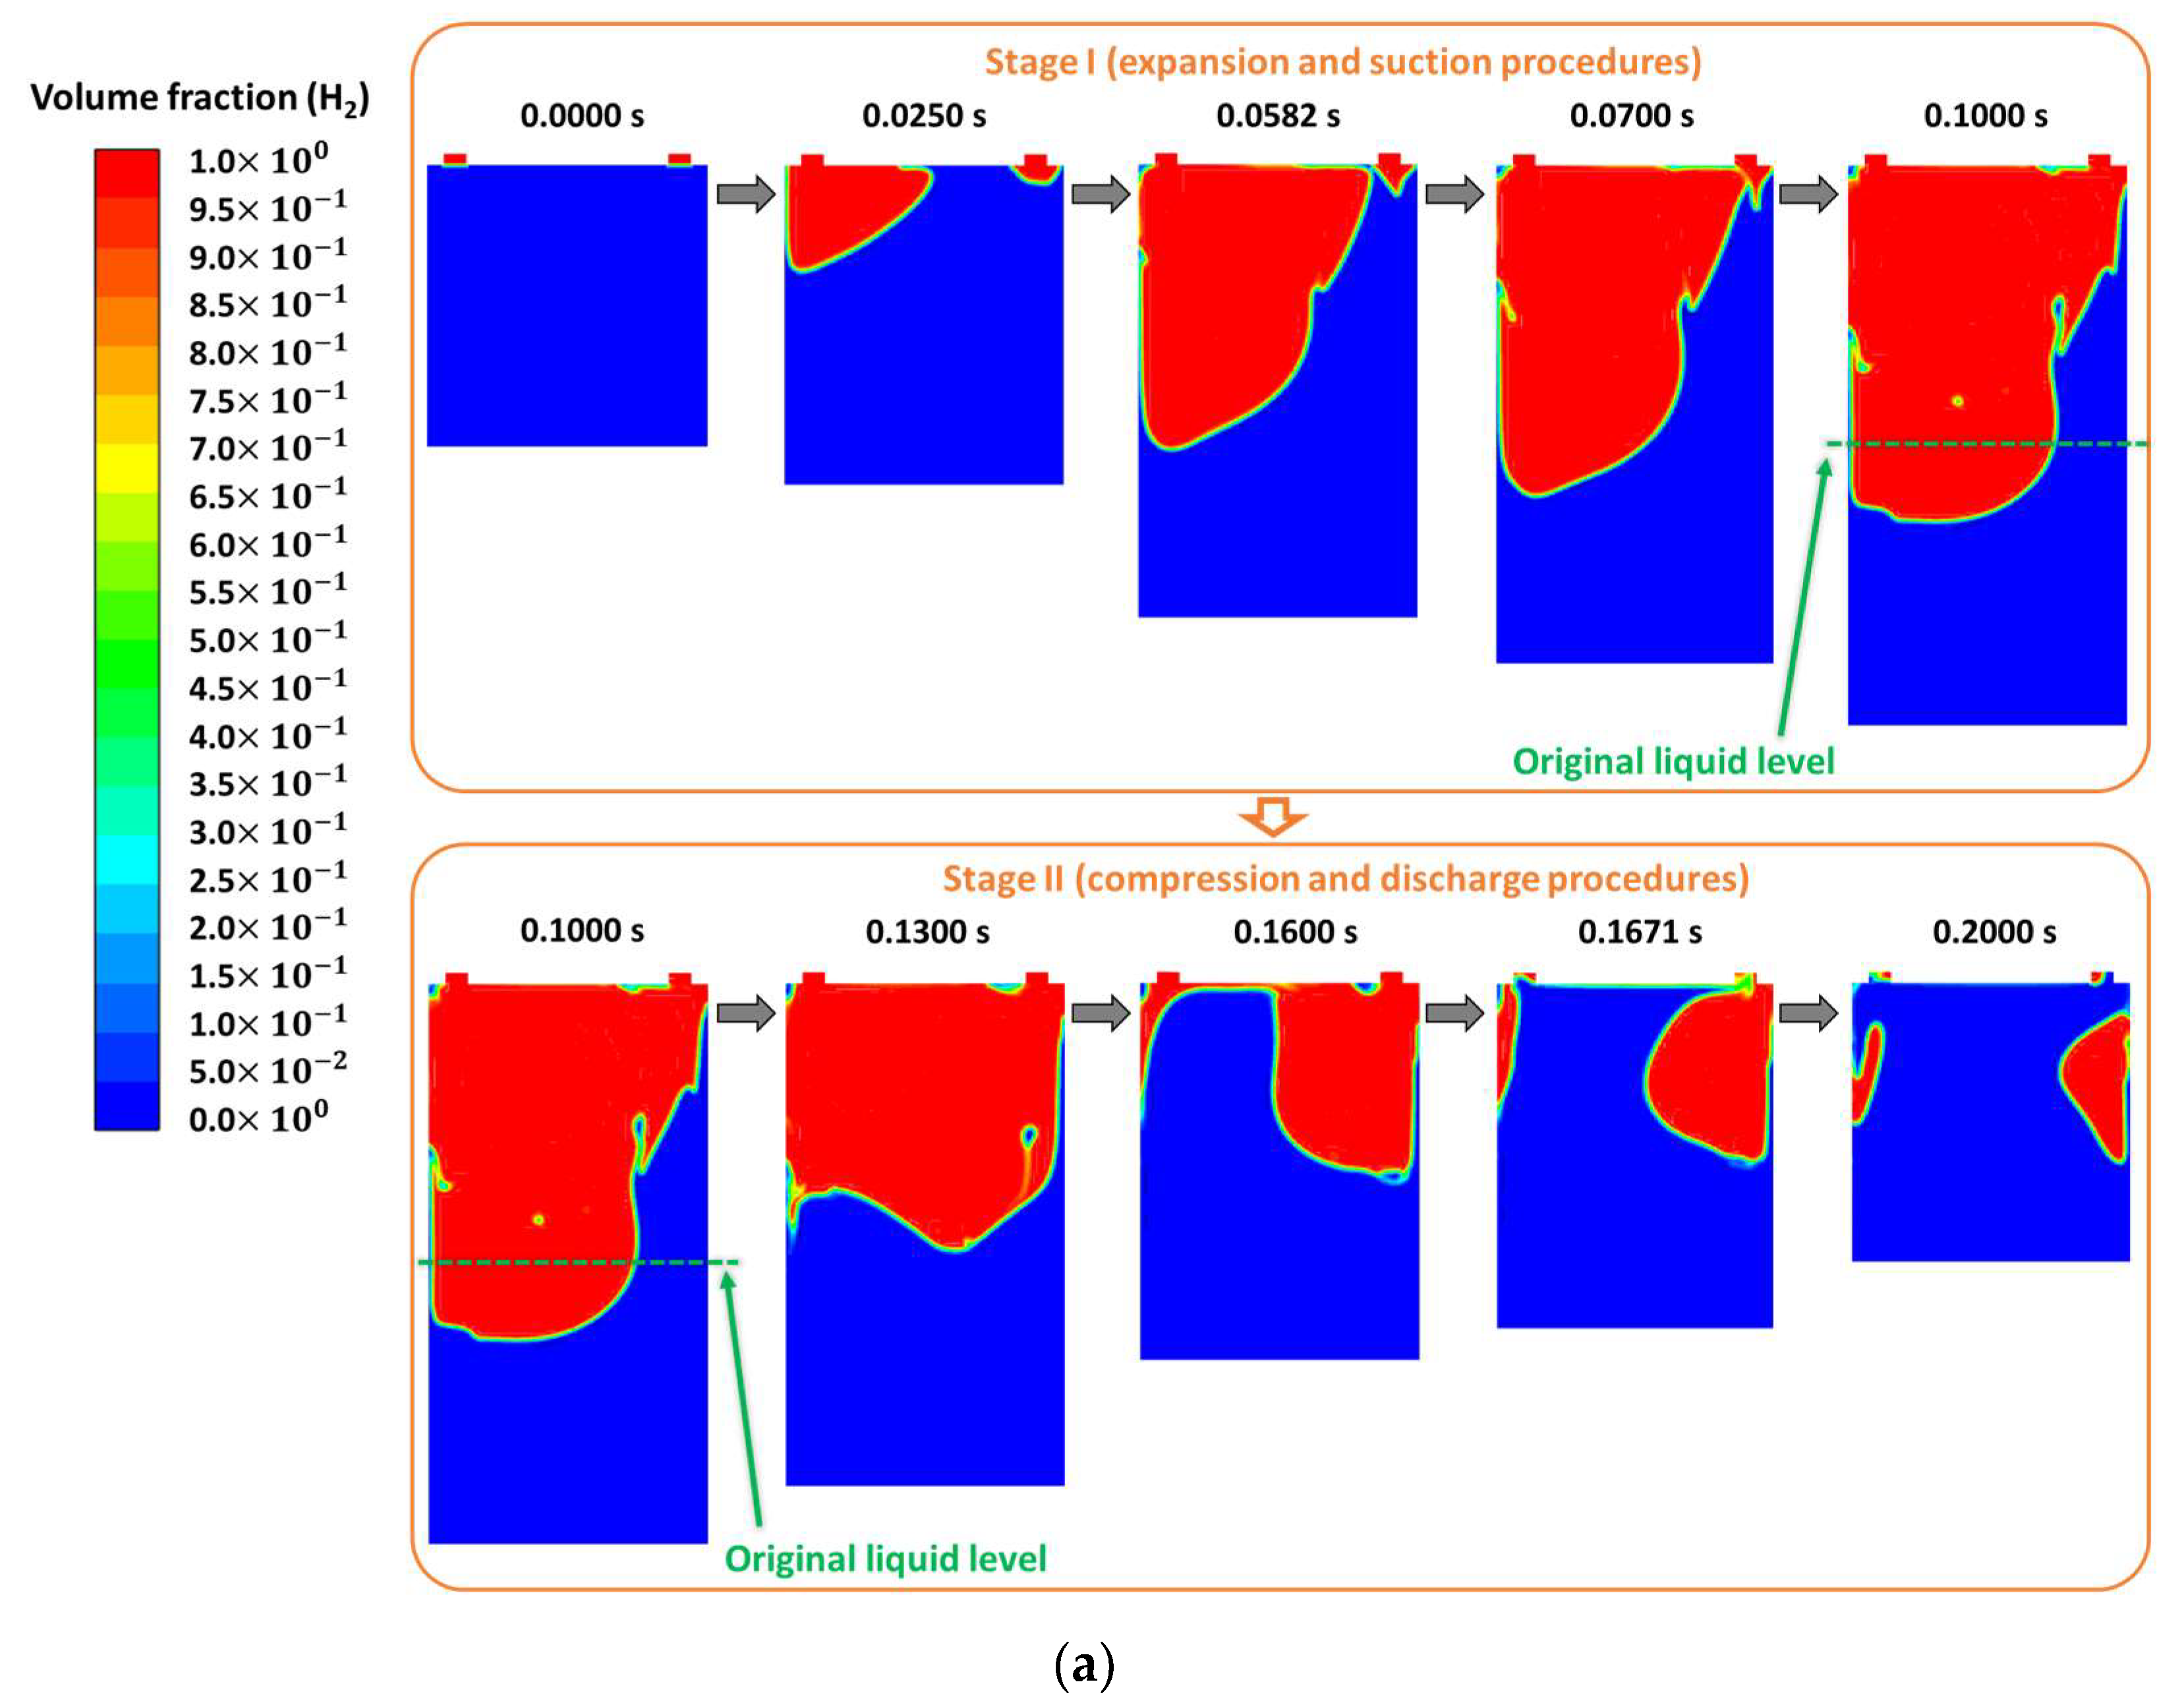
4.2. Results of the CFD Simulations
5. Conclusions
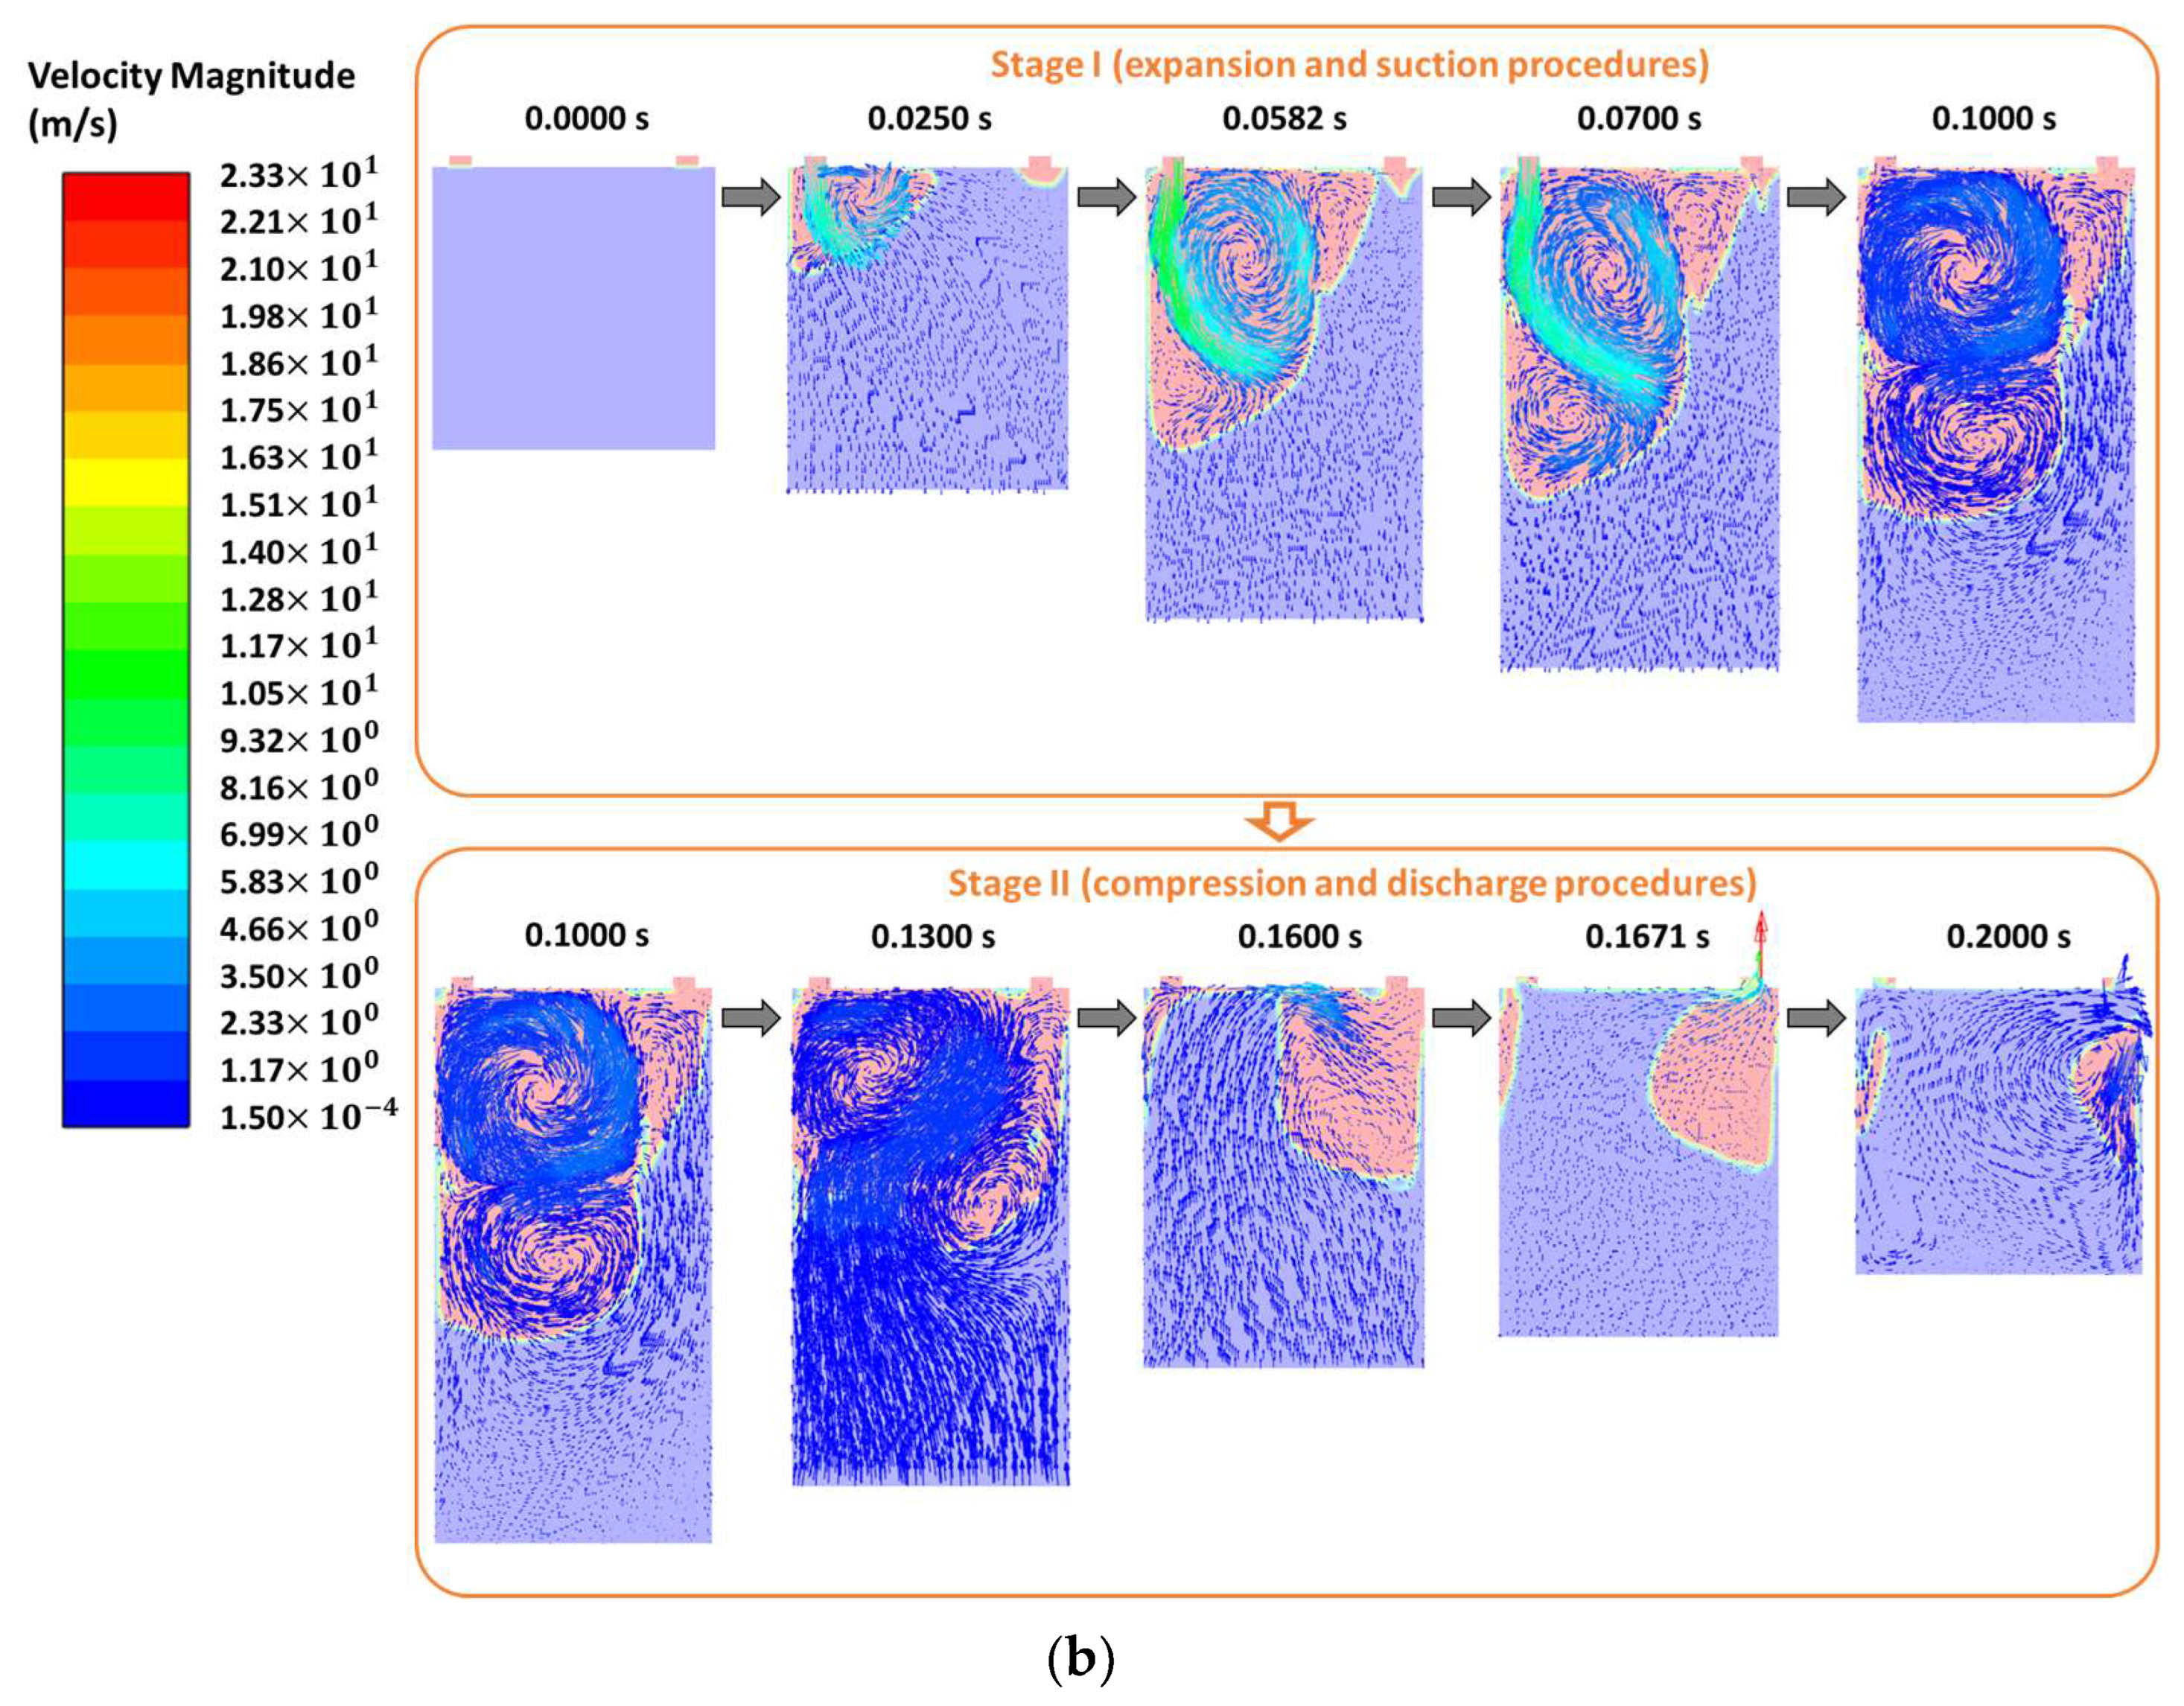
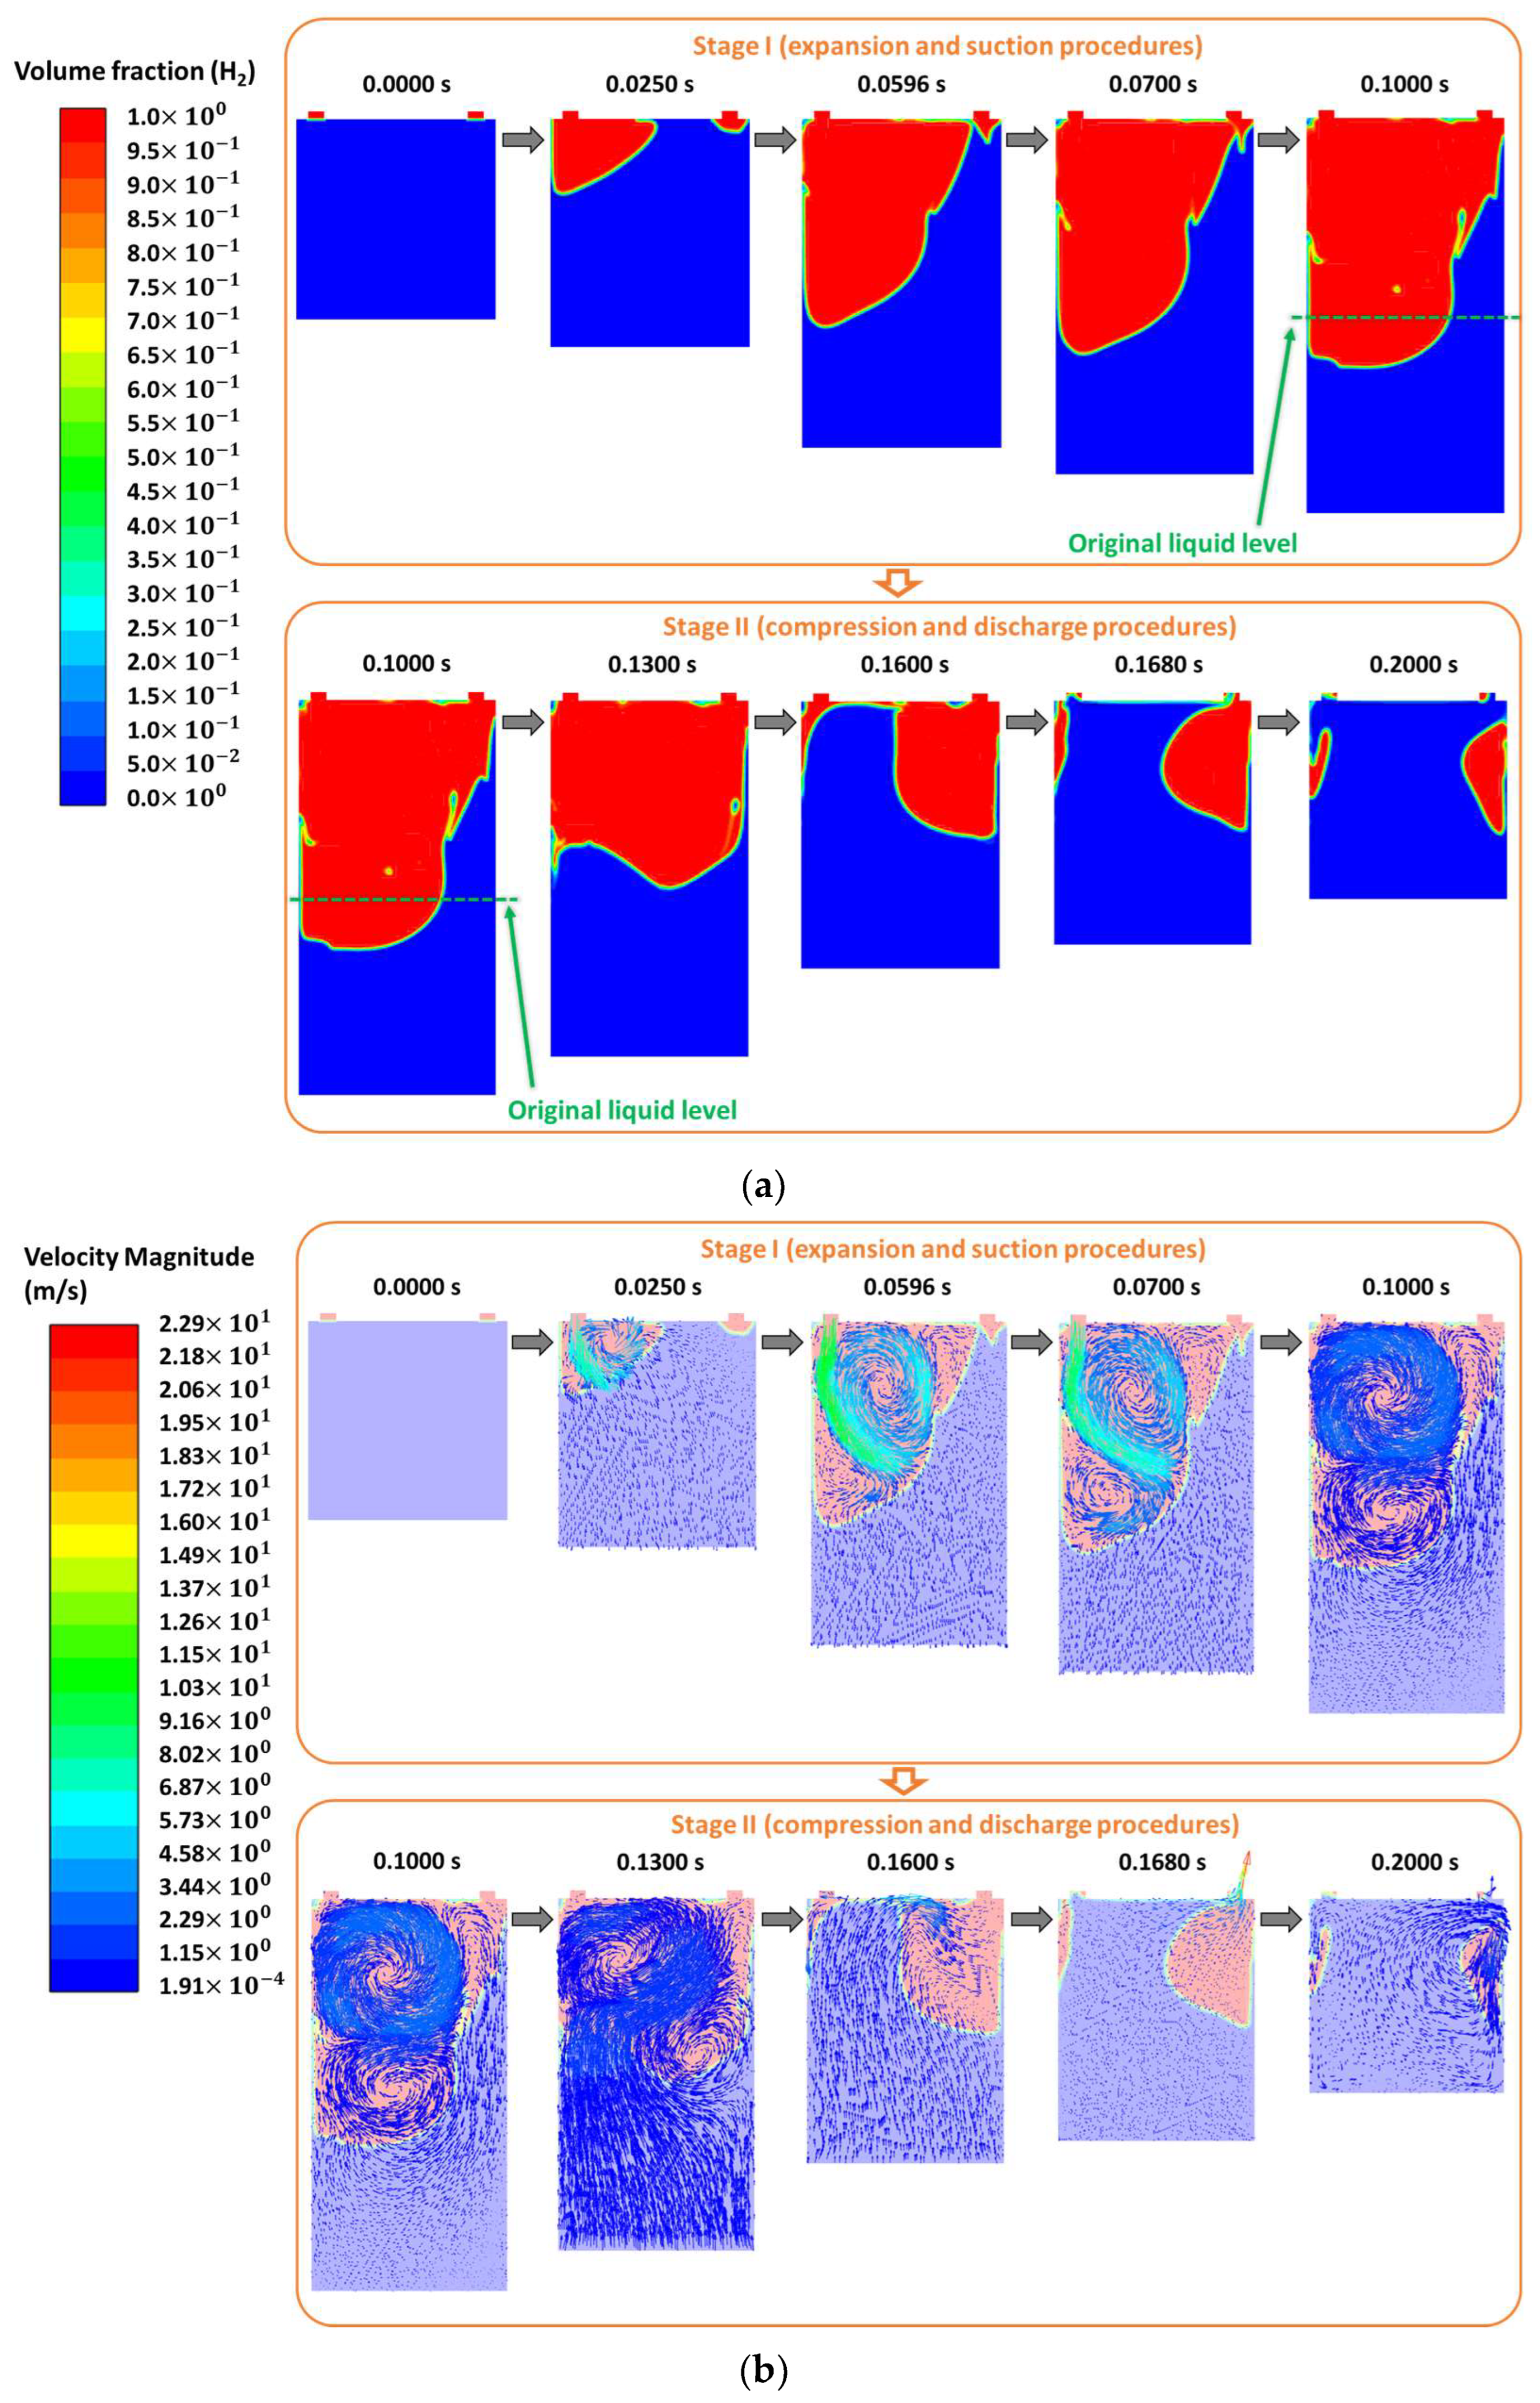
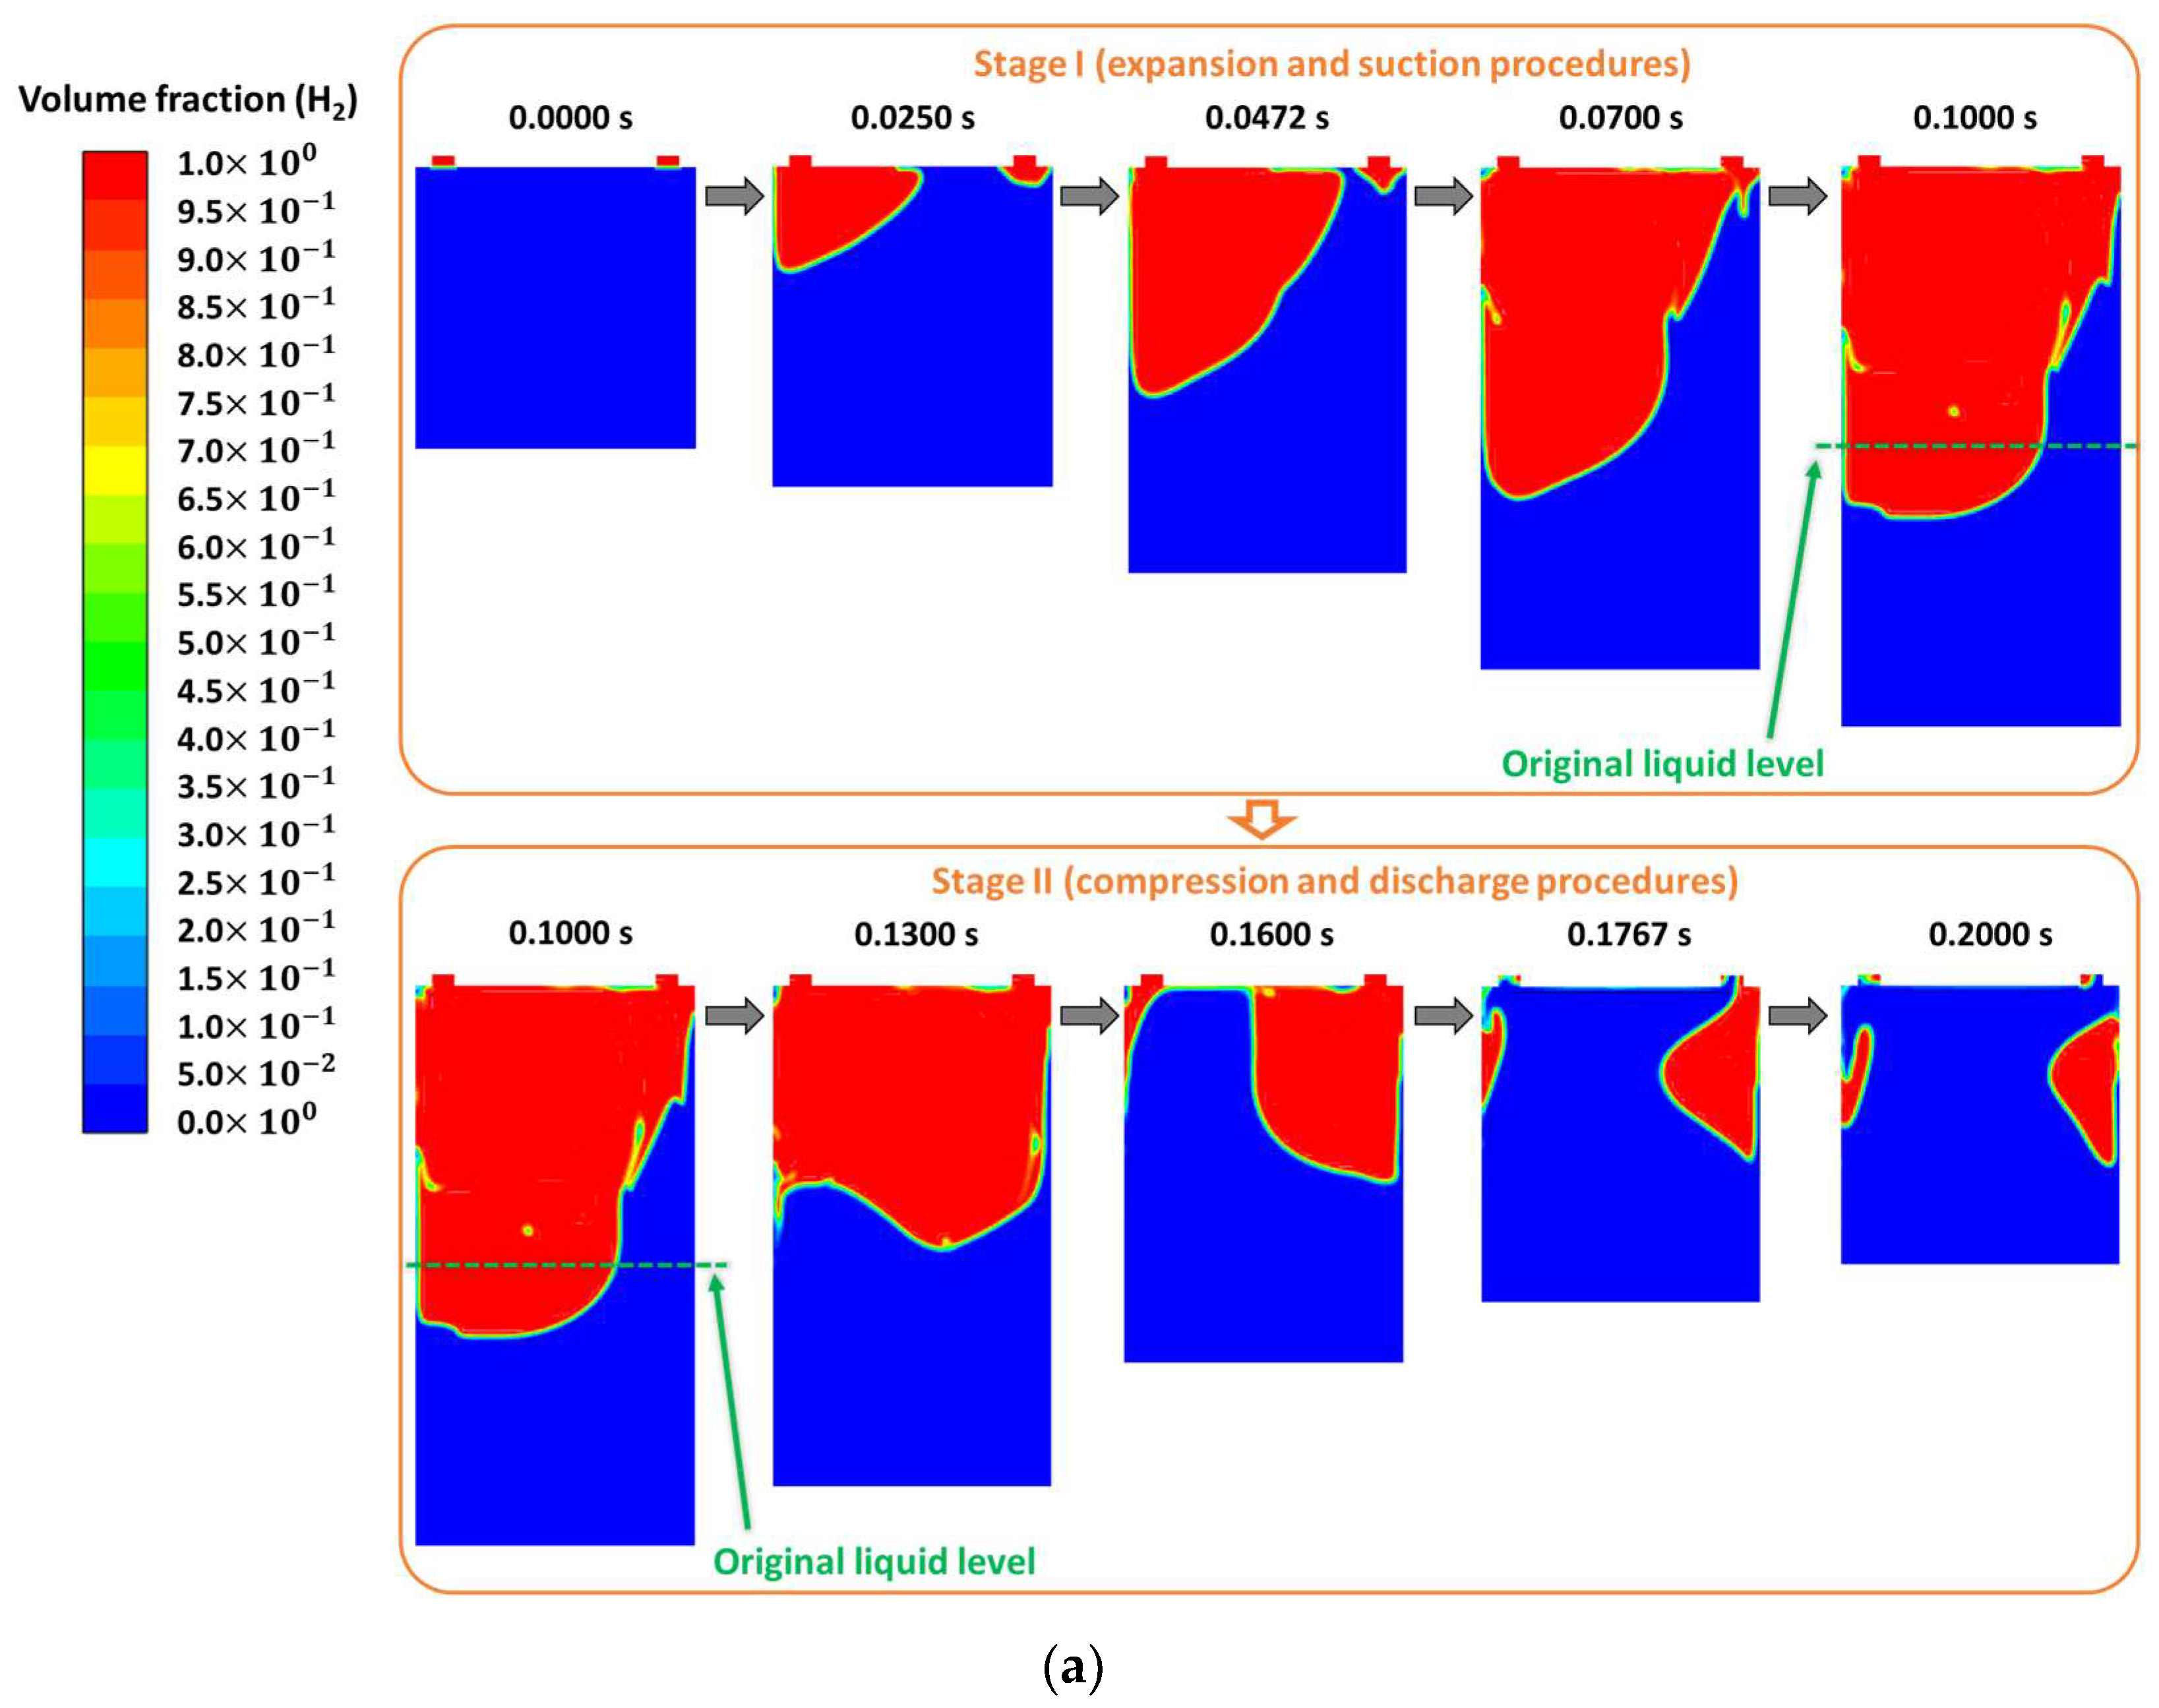
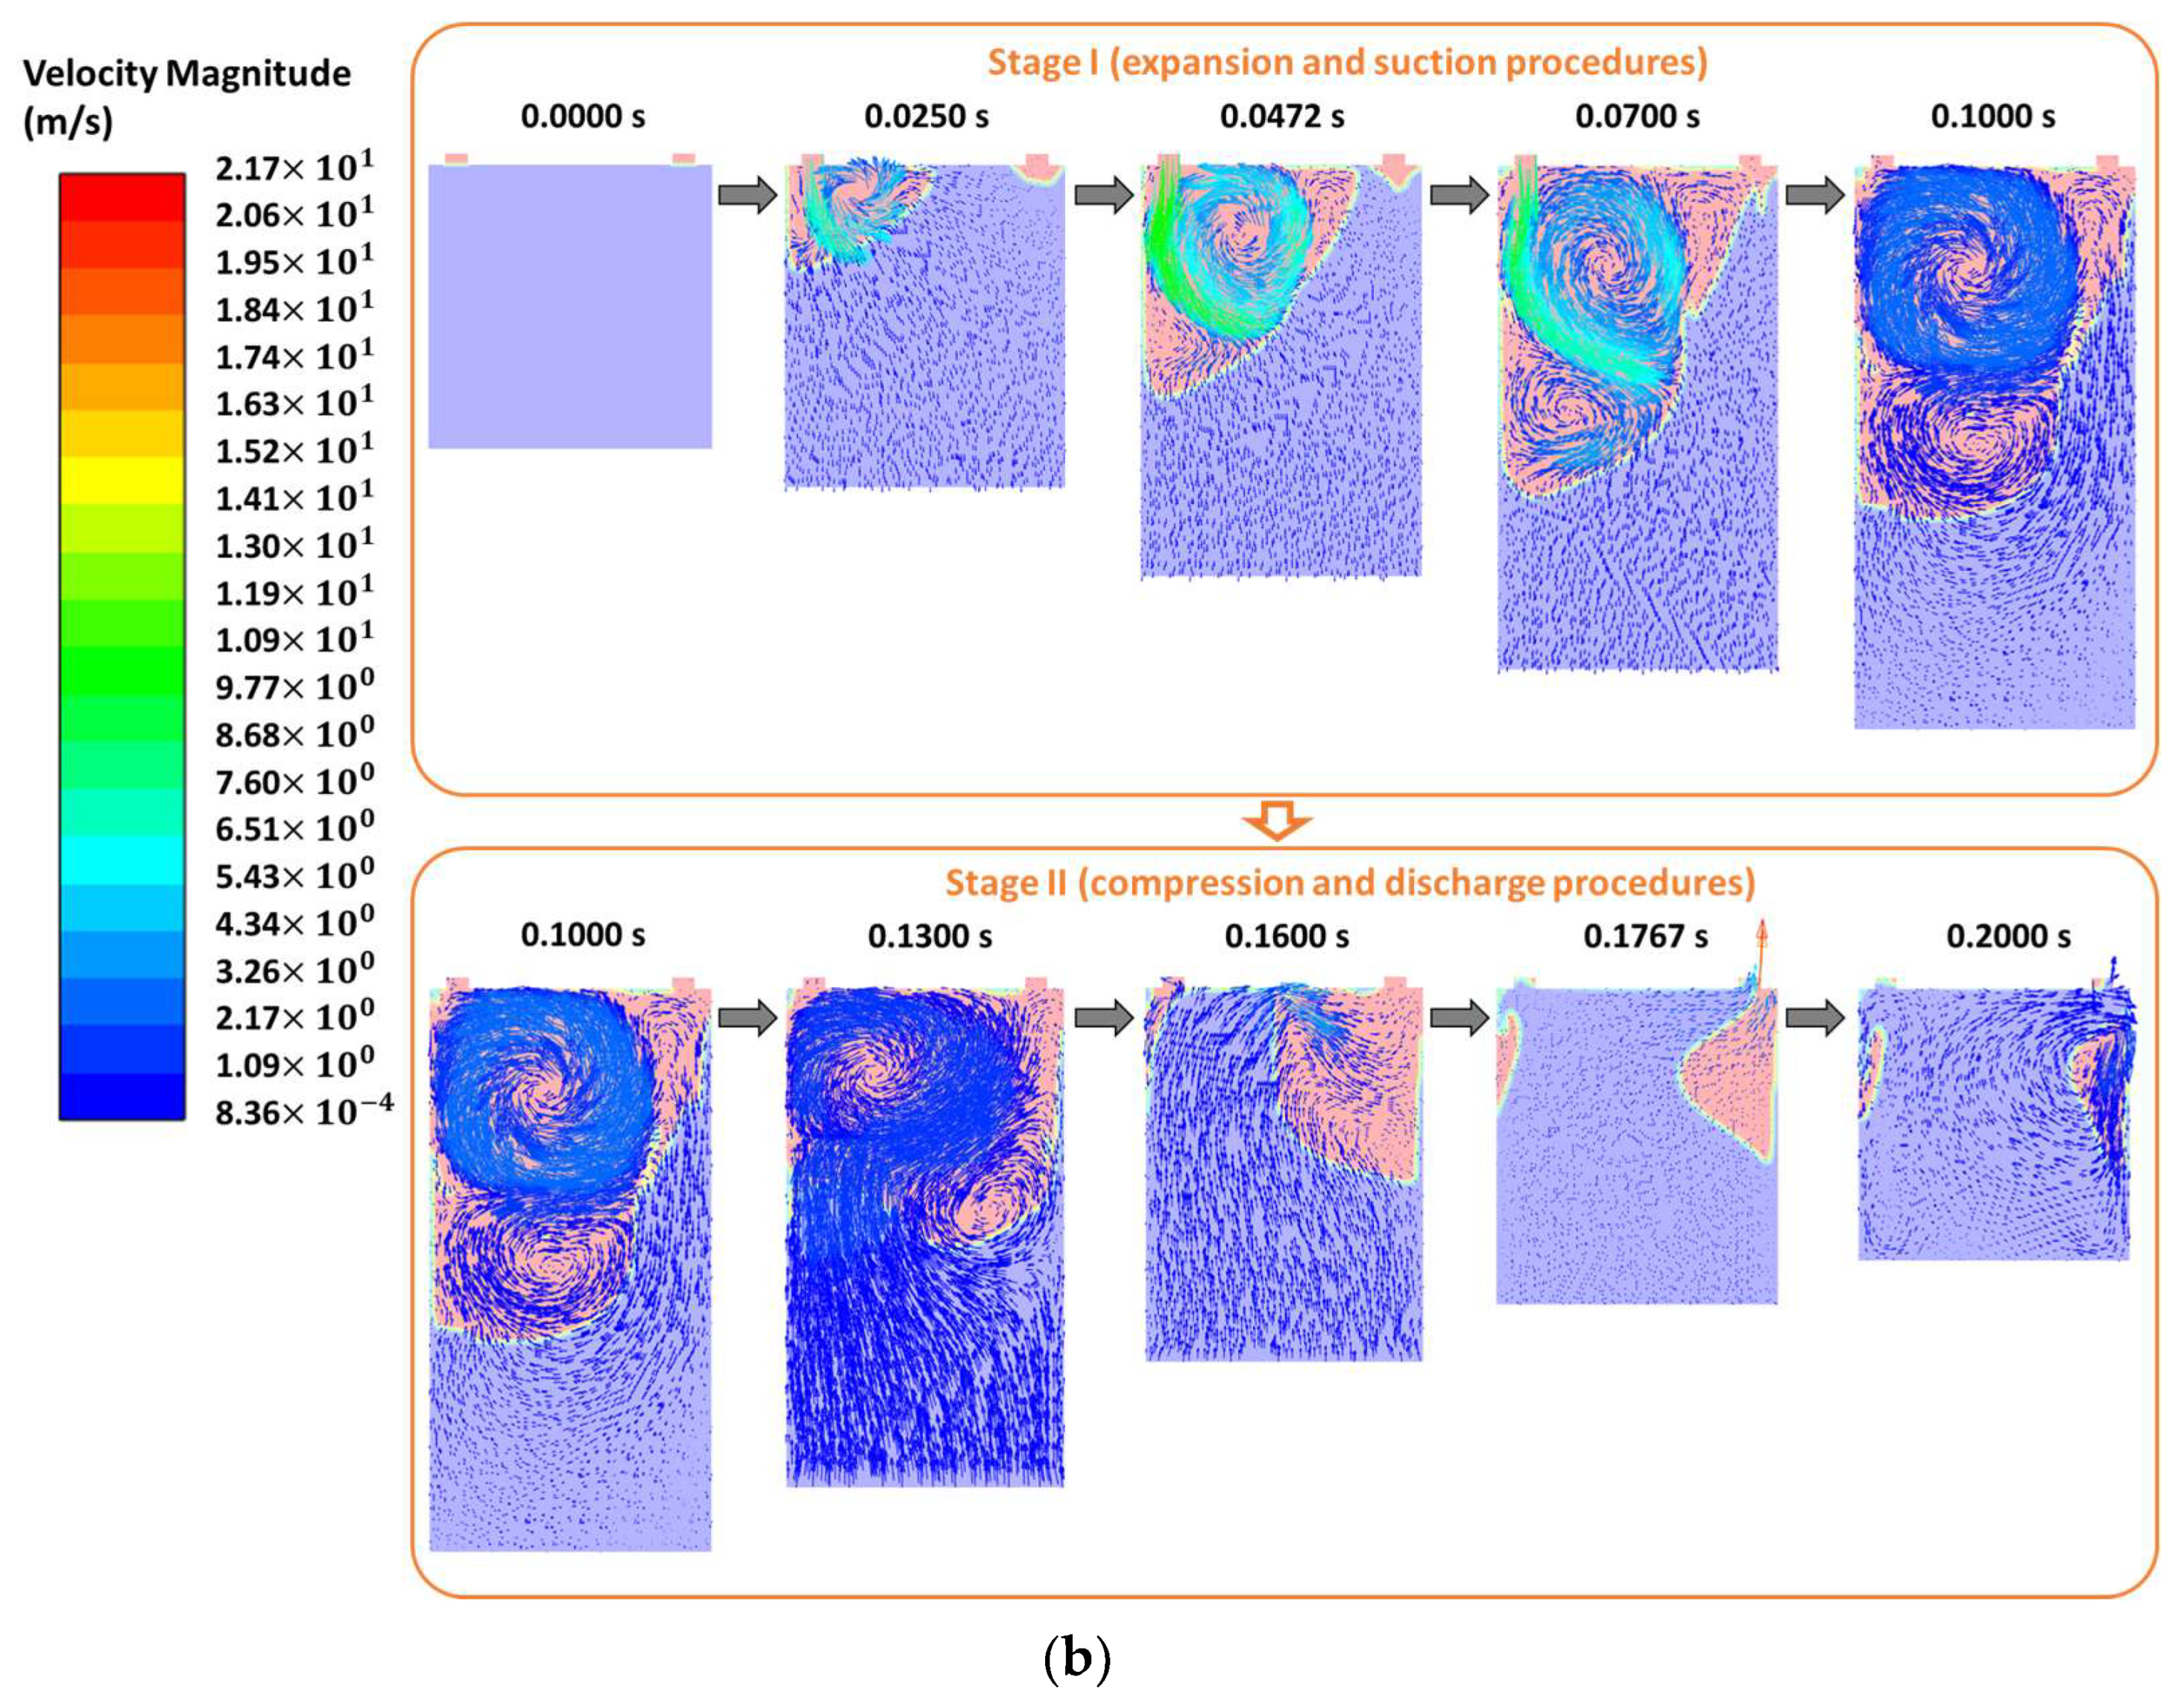
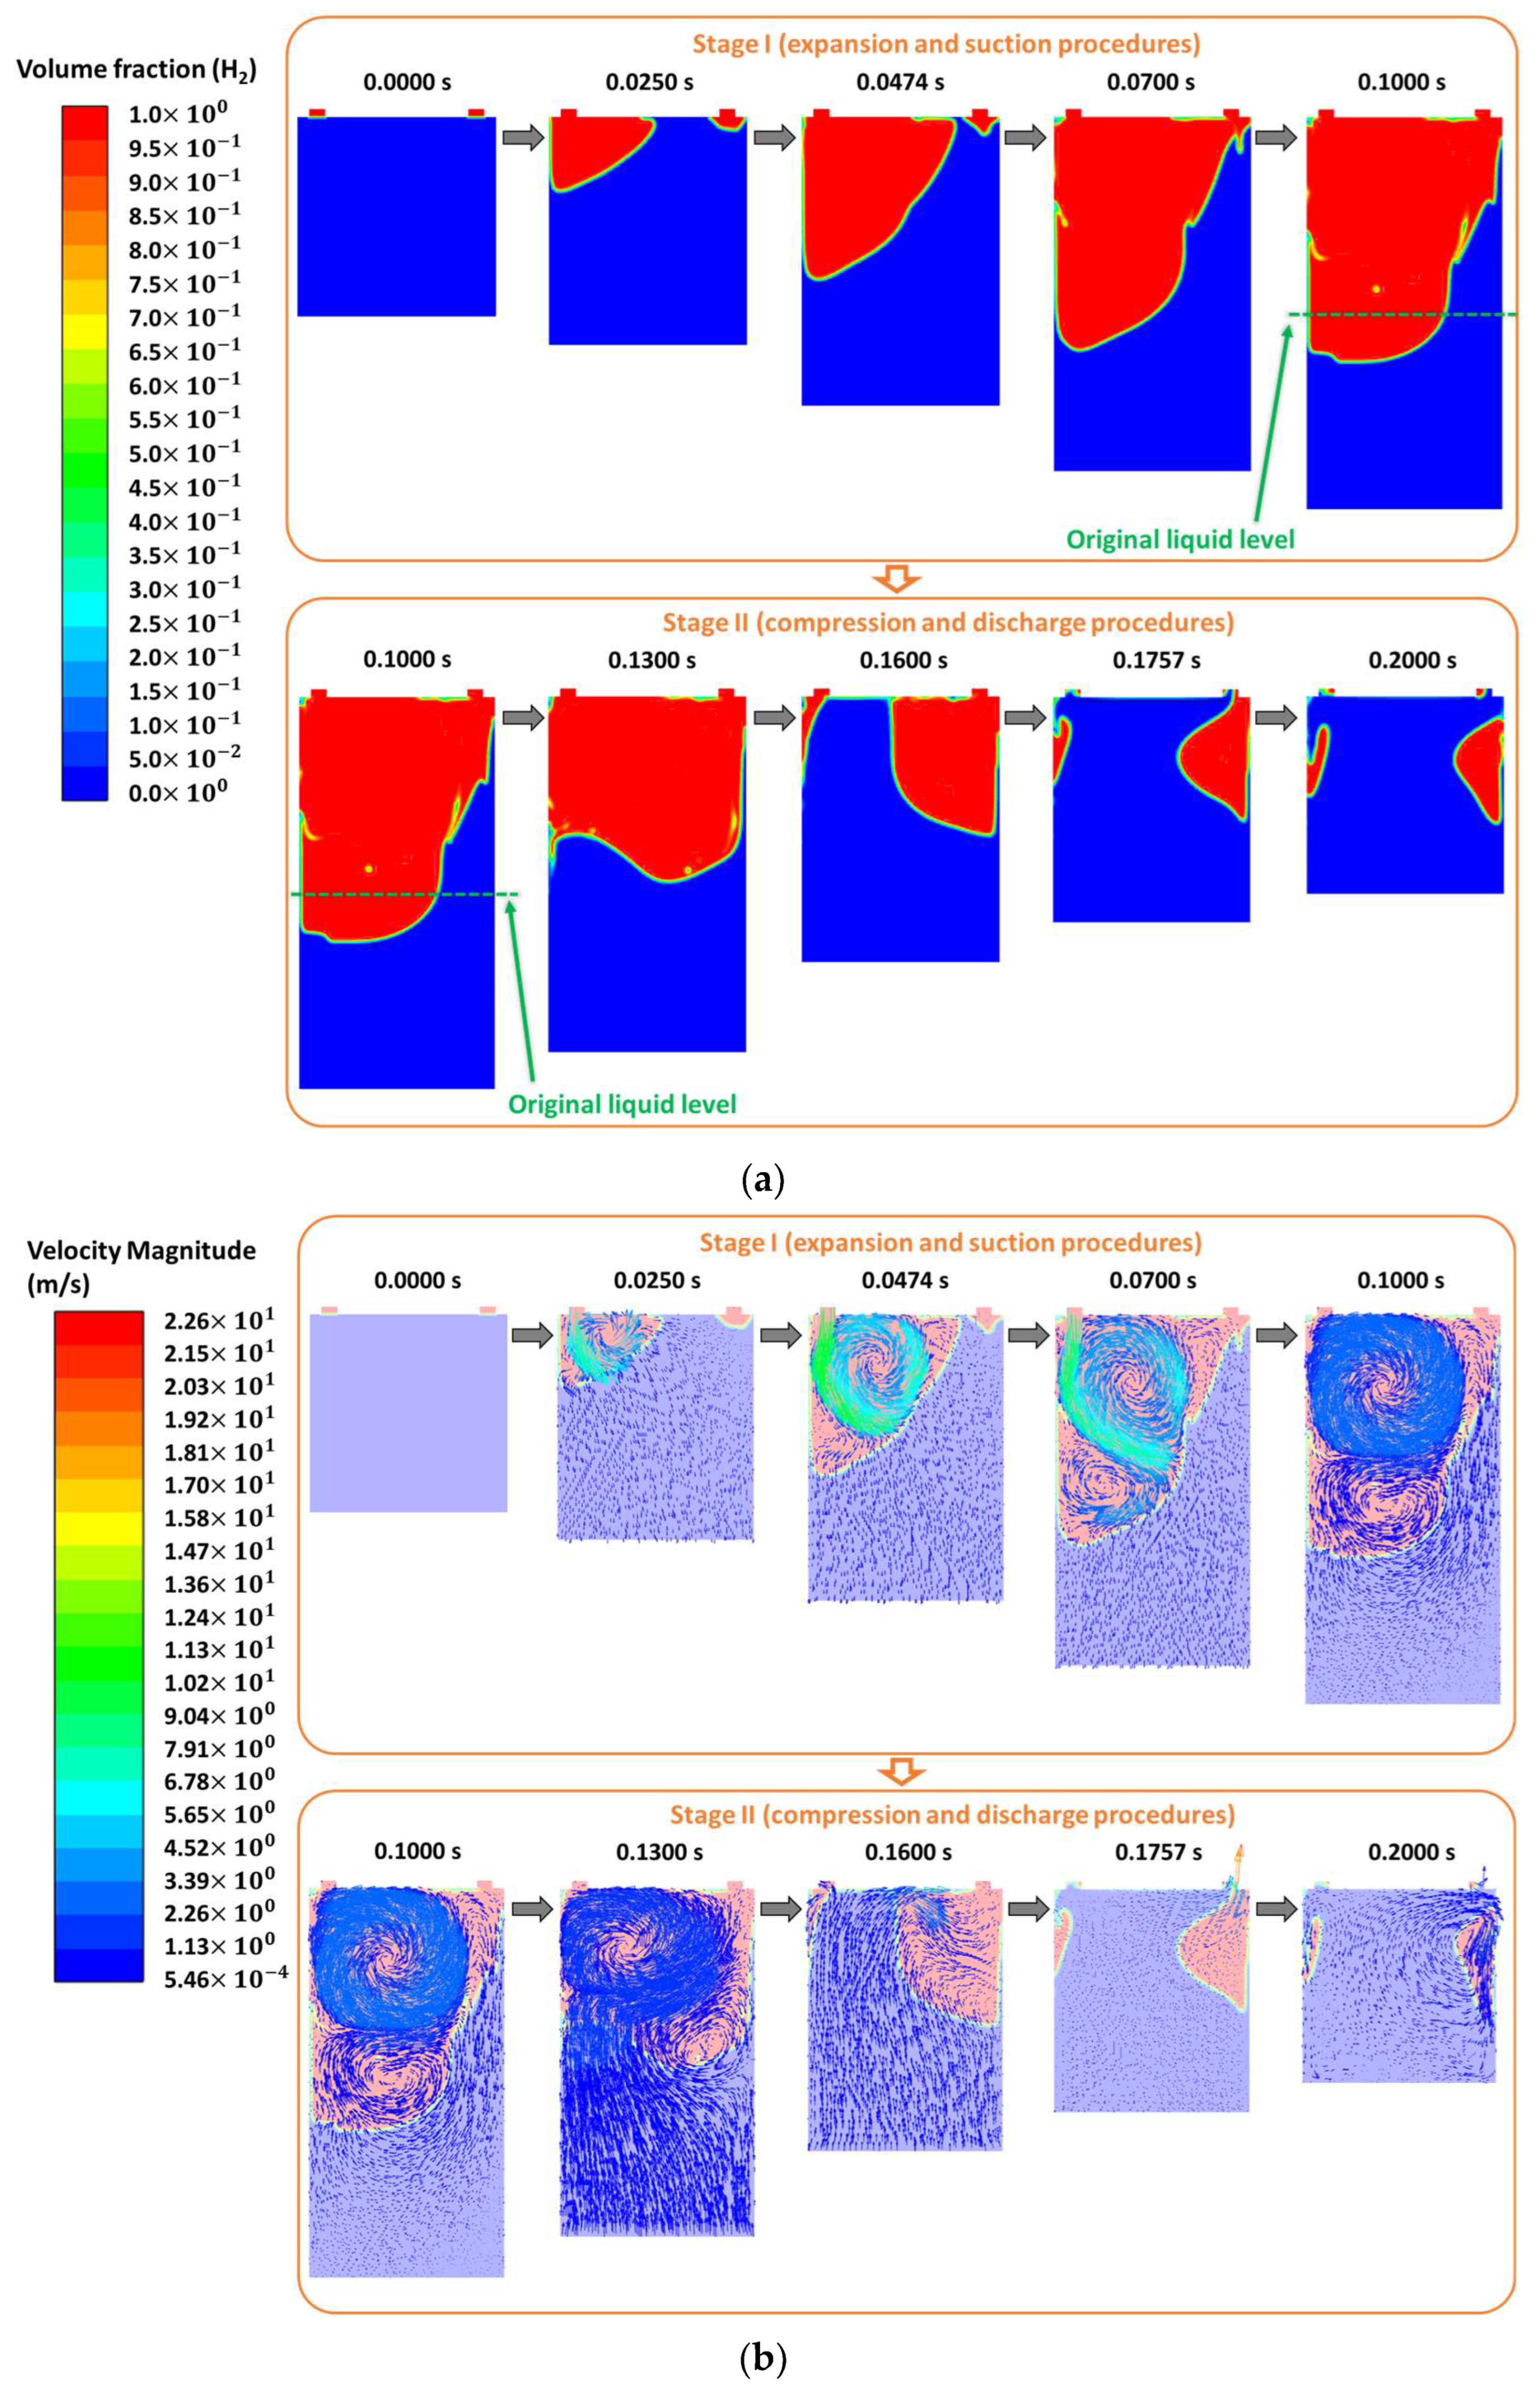
- The area of the gas-occupied region above the wave peak during the suction procedure enlarged when the liquid density increased. The size of droplets generated in the hydrogen gas suction procedure reduced with the increase in the liquid density. The dimension of the derived gas vortex slightly decreased when the liquid density rose.
- The neck-like structure of the liquid column was observed at the original liquid level at the time of 0.1000 s, the thickness of which rose with the elevation in the liquid density. At the time of 0.1300 s, the remaining liquid on the surface of the compressor cover reduced with the increase in the liquid density.
- The increase in the liquid density promoted the detachment of the ionic liquid from the compressor cover in Stage I and the contact from the liquid wave of the compressor cover early in Stage II.
- The mass transfer of the ionic liquid after one operation cycle continually rose when the liquid density increased. The transferred mass of the hydrogen gas after one operation cycle decreased first and then increased with the elevation in the liquid density with the trough at 1150 kg/m3.
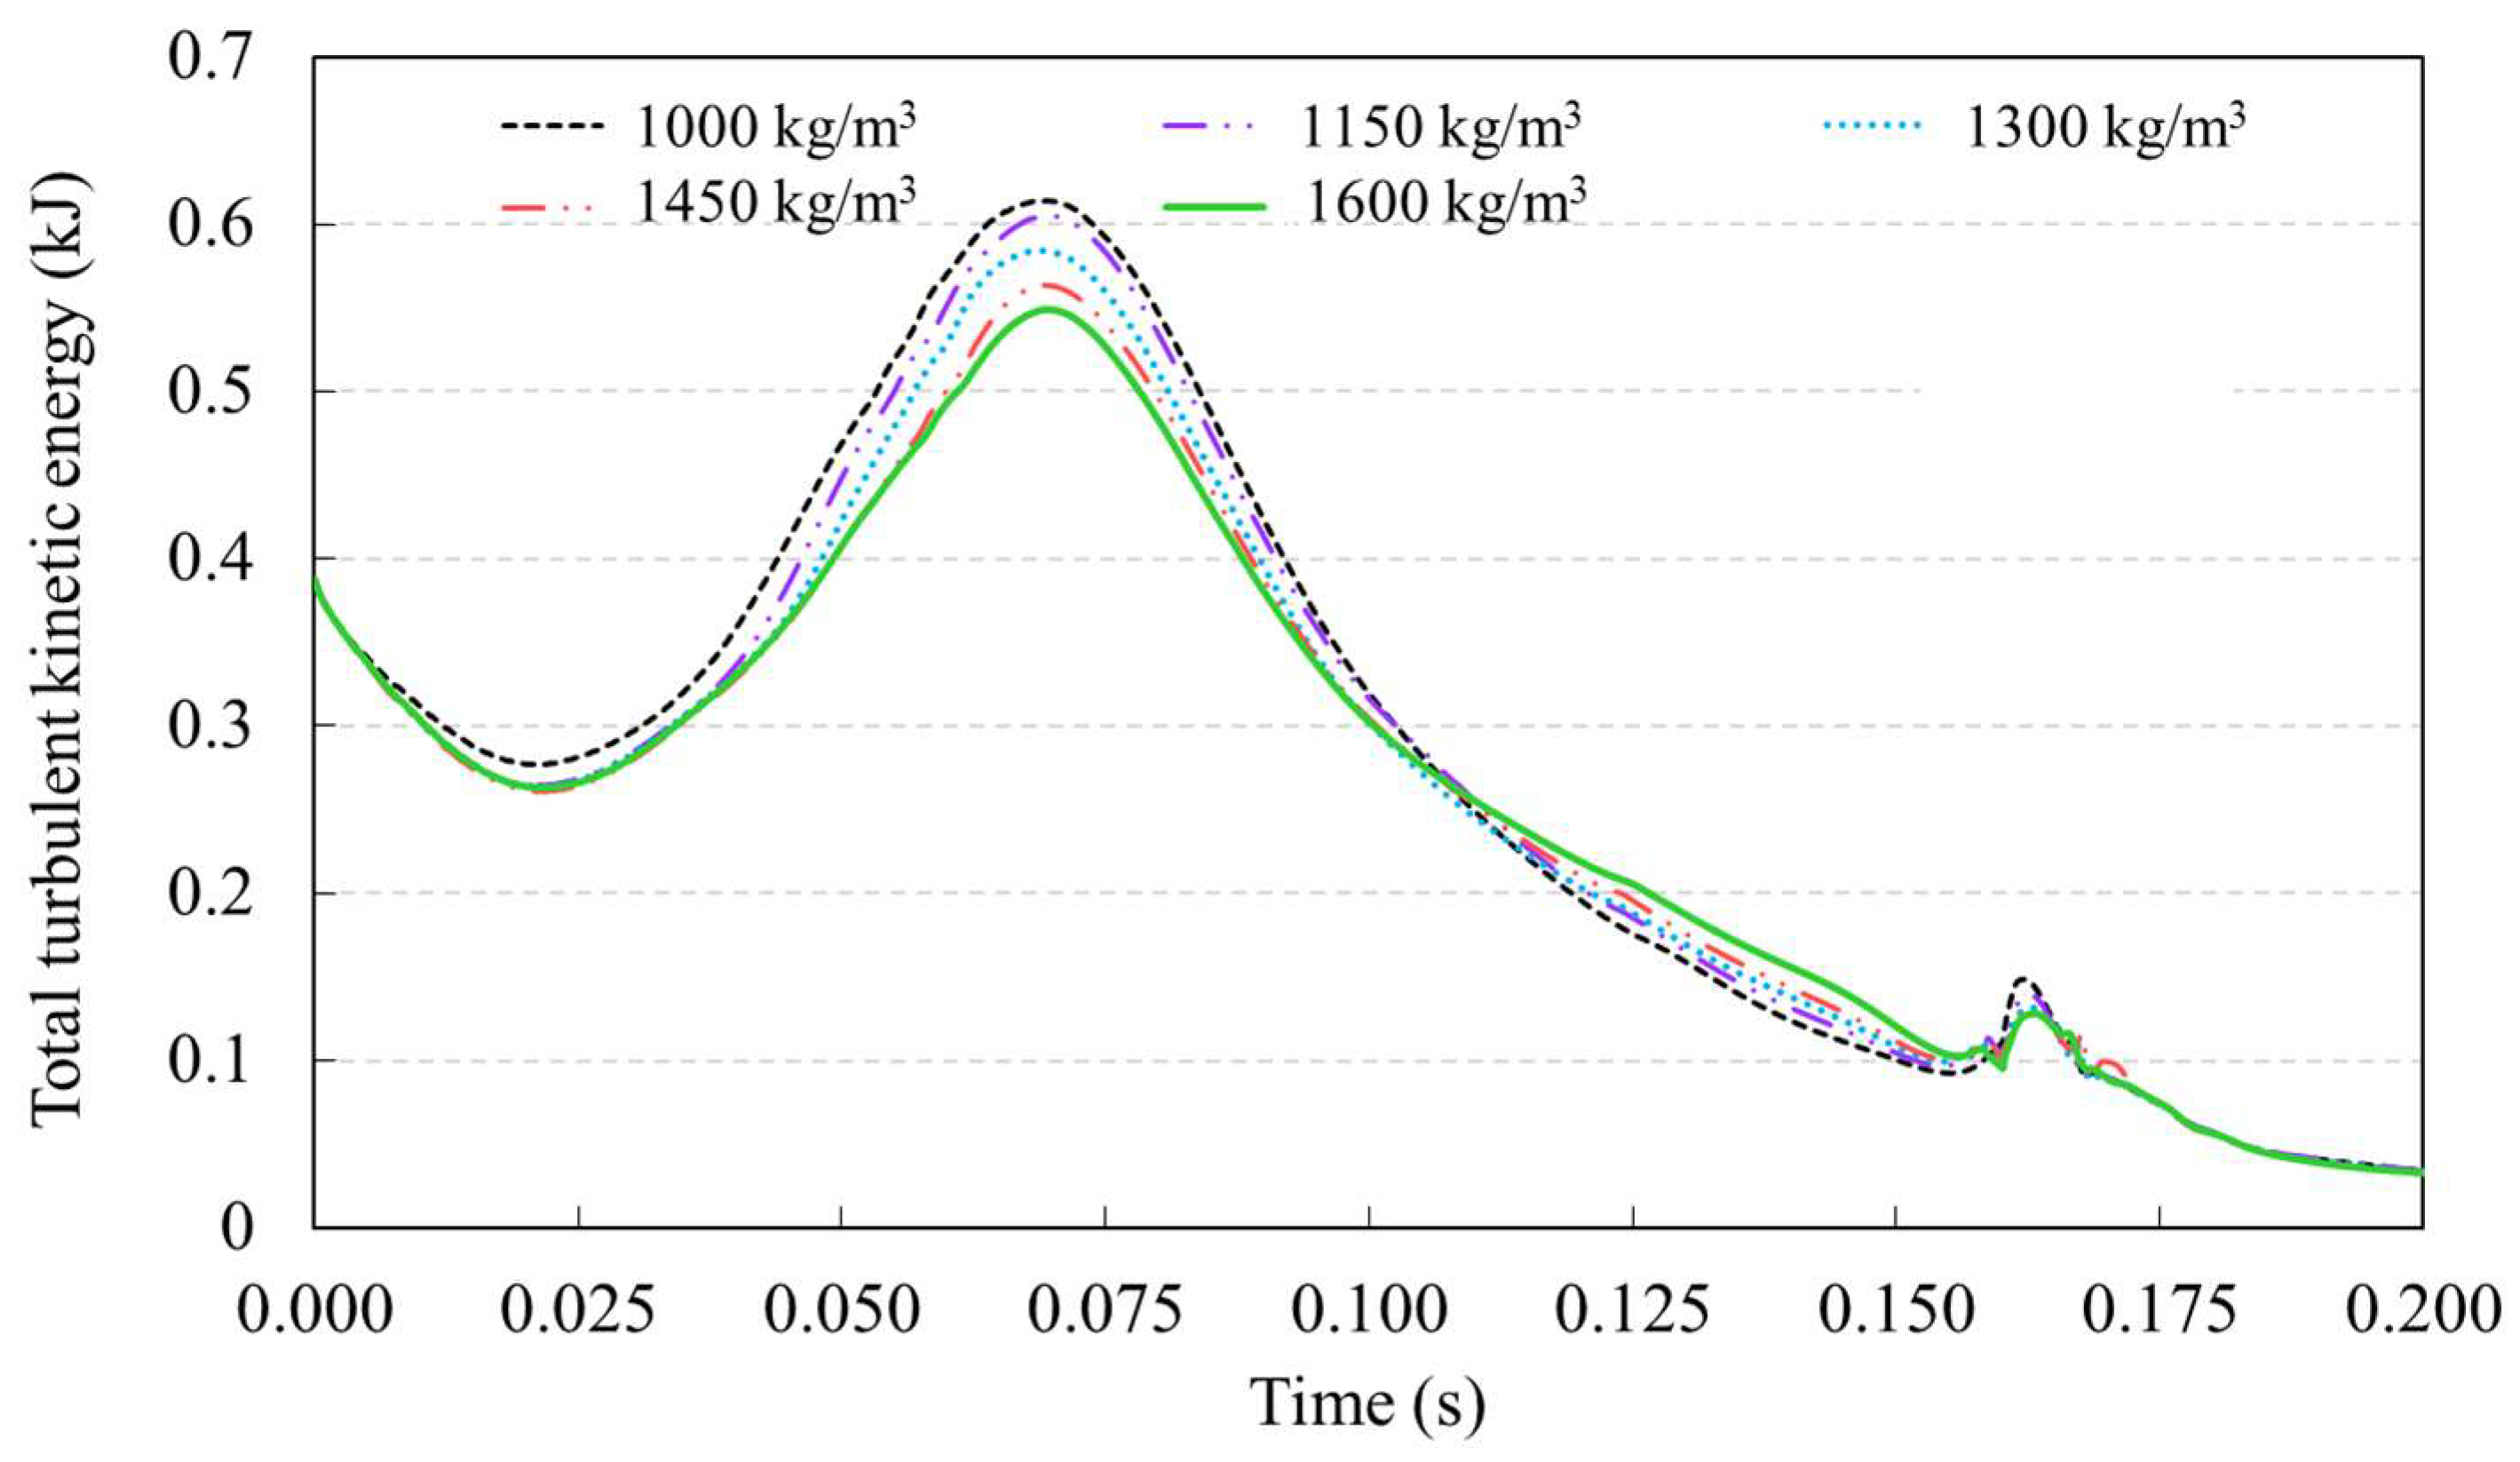
- The total turbulent kinetic energy was found with the largest peak value of 0.61 kJ with a liquid density of 1000 kg/m3 and the lowest value of 0.55 kJ in the simulation with a liquid density of 1600 kg/m3.
- The liquid density in the range of 1300–1450 kg/m3 is suggested for designing the hydrogen compressor adopting the ionic liquid piston with the design requirements provided considering the gas-liquid interaction, the mass transfer via the outlet, and the total turbulent kinetic energy.
Author Contributions
Funding
Data Availability Statement
Conflicts of Interest
References
- Isaac, N.; Saha, A.K. A Review of the Optimization Strategies and Methods Used to Locate Hydrogen Fuel Refueling Stations. Energies 2023, 16, 2171. [Google Scholar] [CrossRef]
- Lamagna, M.; Ferrario, A.M.; Astiaso Garcia, D.; McPhail, S.; Comodi, G. Reversible solid oxide cell coupled to an offshore wind turbine as a poly-generation energy system for auxiliary backup generation and hydrogen production. Energy Rep. 2022, 8, 14259–14273. [Google Scholar] [CrossRef]
- Dall’Armi, C.; Pivetta, D.; Taccani, R. Hybrid PEM Fuel Cell Power Plants Fuelled by Hydrogen for Improving Sustainability in Shipping: State of the Art and Review on Active Projects. Energies 2023, 16, 2022. [Google Scholar] [CrossRef]
- Giacoppo, G.; Trocino, S.; Lo Vecchio, C.; Baglio, V.; Díez-García, M.I.; Aricò, A.S.; Barbera, O. Numerical 3D Model of a Novel Photoelectrolysis Tandem Cell with Solid Electrolyte for Green Hydrogen Production. Energies 2023, 16, 1953. [Google Scholar] [CrossRef]
- Gultom, N.S.; Abdullah, H.; Kuo, D.-H. Facile synthesis of cobalt-doped (Zn,Ni) (O,S) as an efficient photocatalyst for hydrogen production. J. Energy Inst. 2019, 92, 1428–1439. [Google Scholar] [CrossRef]
- Matamba, T.; Iglauer, S.; Keshavarz, A. A progress insight of the formation of hydrogen rich syngas from coal gasification. J. Energy Inst. 2022, 105, 81–102. [Google Scholar] [CrossRef]
- Li, H.; Cao, X.; Liu, Y.; Shao, Y.; Nan, Z.; Teng, L.; Peng, W.; Bian, J. Safety of hydrogen storage and transportation: An overview on mechanisms, techniques, and challenges. Energy Rep. 2022, 8, 6258–6269. [Google Scholar] [CrossRef]
- Fang, J.; Yin, X.; Wang, A.; Sun, X.; Liu, Y.; Cao, F. Cooling performance enhancement for the automobile transcritical CO2 air conditioning system with various internal heat exchanger effectiveness. Appl. Therm. Eng. 2021, 196, 117274. [Google Scholar] [CrossRef]
- Raeesi, M.; Changizian, S.; Ahmadi, P.; Khoshnevisan, A. Performance analysis of a degraded PEM fuel cell stack for hydrogen passenger vehicles based on machine learning algorithms in real driving conditions. Energy Convers. Manag. 2021, 248, 114793. [Google Scholar] [CrossRef]
- Gallo, M.; Marinelli, M. The Use of Hydrogen for Traction in Freight Transport: Estimating the Reduction in Fuel Consumption and Emissions in a Regional Context. Energies 2023, 16, 508. [Google Scholar] [CrossRef]
- Al-Mukainah, H.; Al-Yaseri, A.; Yekeen, N.; Hamad, J.A.; Mahmoud, M. Wettability of shale–brine–H2 system and H2-brine interfacial tension for assessment of the sealing capacities of shale formations during underground hydrogen storage. Energy Rep. 2022, 8, 8830–8843. [Google Scholar] [CrossRef]
- Hazrat, M.A.; Rasul, M.G.; Jahirul, M.I.; Chowdhury, A.A.; Hassan, N.M.S. Techno-economic analysis of recently improved hydrogen production pathway and infrastructure. Energy Rep. 2022, 8, 836–844. [Google Scholar] [CrossRef]
- Rufer, A. Increasing the Energy Efficiency of Gas Boosters for Hydrogen Storage and for Refueling Stations. Energies 2023, 16, 1763. [Google Scholar] [CrossRef]
- Mazloomi, K.; Gomes, C. Hydrogen as an energy carrier: Prospects and challenges. Renew. Sustain. Energy Rev. 2012, 16, 3024–3033. [Google Scholar] [CrossRef]
- Rivard, E.; Trudeau, M.; Zaghib, K. Hydrogen Storage for Mobility: A Review. Materials 2019, 12, 1973. [Google Scholar] [CrossRef] [Green Version]
- Wang, L.; Jiao, S.; Xie, Y.; Xia, S.; Zhang, D.; Zhang, Y.; Li, M. Two-way dynamic pricing mechanism of hydrogen filling stations in electric-hydrogen coupling system enhanced by blockchain. Energy 2022, 239, 122194. [Google Scholar] [CrossRef]
- Caponi, R.; Monforti Ferrario, A.; Del Zotto, L.; Bocci, E. Hydrogen refueling stations and fuel cell buses four year operational analysis under real-world conditions. Int. J. Hydrogen Energy 2022. [Google Scholar] [CrossRef]
- Berstad, D.; Gardarsdottir, S.; Roussanaly, S.; Voldsund, M.; Ishimoto, Y.; Nekså, P. Liquid hydrogen as prospective energy carrier: A brief review and discussion of underlying assumptions applied in value chain analysis. Renew. Sustain. Energy Rev. 2022, 154, 111772. [Google Scholar] [CrossRef]
- Amirthan, T.; Perera, M.S.A. The role of storage systems in hydrogen economy: A review. J. Nat. Gas Sci. Eng. 2022, 108, 104843. [Google Scholar] [CrossRef]
- Ahsan, N.; Al Rashid, A.; Zaidi, A.A.; Imran, R.; Abdul Qadir, S. Performance analysis of hydrogen fuel cell with two-stage turbo compressor for automotive applications. Energy Rep. 2021, 7, 2635–2646. [Google Scholar] [CrossRef]
- Abdalla, A.M.; Hossain, S.; Nisfindy, O.B.; Azad, A.T.; Dawood, M.; Azad, A.K. Hydrogen production, storage, transportation and key challenges with applications: A review. Energy Convers. Manag. 2018, 165, 602–627. [Google Scholar] [CrossRef]
- Li, X.; Chen, J.; Wang, Z.; Jia, X.; Peng, X. A non-destructive fault diagnosis method for a diaphragm compressor in the hydrogen refueling station. Int. J. Hydrogen Energy 2019, 44, 24301–24311. [Google Scholar] [CrossRef]
- Arjomand Kermani, N.; Petrushina, I.; Rokni, M.M. Evaluation of ionic liquids as replacements for the solid piston in conventional hydrogen reciprocating compressors: A review. Int. J. Hydrogen Energy 2020, 45, 16337–16354. [Google Scholar] [CrossRef]
- Białek, P.; Bielawski, P. Failure analysis of refinery hydrogen reciprocating compressors. Diagnostyka 2018, 19, 83–92. [Google Scholar] [CrossRef]
- Charbonnier, V.; Enoki, H.; Asano, K.; Kim, H.; Sakaki, K. Tuning the hydrogenation properties of Ti1+yCr2−xMnx laves phase compounds for high pressure metal-hydride compressors. Int. J. Hydrogen Energy 2021, 46, 36369–36380. [Google Scholar] [CrossRef]
- Sdanghi, G.; Nicolas, V.; Mozet, K.; Schaefer, S.; Maranzana, G.; Celzard, A.; Fierro, V. A 70 MPa hydrogen thermally driven compressor based on cyclic adsorption-desorption on activated carbon. Carbon 2020, 161, 466–478. [Google Scholar] [CrossRef]
- Hu, Y.; Xu, X.; Wang, W. A new cavity profile for a diaphragm compressor used in hydrogen fueling stations. Int. J. Hydrogen Energy 2017, 42, 24458–24469. [Google Scholar] [CrossRef]
- Ren, S.; Jia, X.; Jiang, J.; Zhang, S.; Zhao, B.; Peng, X. Effect of hydraulic oil compressibility on the volumetric efficiency of a diaphragm compressor for hydrogen refueling stations. Int. J. Hydrogen Energy 2022, 47, 15224–15235. [Google Scholar] [CrossRef]
- Wang, T.; Jia, X.; Li, X.; Ren, S.; Peng, X. Thermal-structural coupled analysis and improvement of the diaphragm compressor cylinder head for a hydrogen refueling station. Int. J. Hydrogen Energy 2020, 45, 809–821. [Google Scholar] [CrossRef]
- Peng, Z.; Li, Q.; Ouyang, L.; Jiang, W.; Chen, K.; Wang, H.; Liu, J.; Li, Z.; Wang, S.; Zhu, M. Overview of hydrogen compression materials based on a three-stage metal hydride hydrogen compressor. J. Alloy. Compd. 2022, 895, 162465. [Google Scholar] [CrossRef]
- Gray, E.M. Alloy selection for multistage metal-hydride hydrogen compressors: A thermodynamic model. Int. J. Hydrogen Energy 2021, 46, 15702–15715. [Google Scholar] [CrossRef]
- Gkanas, E.I.; Stamatakis, E.; Christodoulou, C.N.; Tzamalis, G.; Karagiorgis, G.; Chroneos, A.; Kuganathan, N.; Khzouz, M.; Stubos, A.K. Study on the operation and energy demand of dual-stage Metal Hydride Hydrogen Compressors under effective thermal management. Int. J. Hydrogen Energy 2021, 46, 29272–29287. [Google Scholar] [CrossRef]
- Zhou, H.; Dong, P.; Zhu, S.; Li, S.; Zhao, S.; Wang, Y. Design and theoretical analysis of a liquid piston hydrogen compressor. J. Energy Storage 2021, 41, 102861. [Google Scholar] [CrossRef]
- Guo, Y.; Wang, T.; Liu, X.; Zhang, M.; Peng, X. Mathematical modelling and design of the ionic liquid compressor for the hydrogen refuelling station. Int. J. Energy Res. 2022, 46, 19123–19137. [Google Scholar] [CrossRef]
- Ventura, S.P.M.; e Silva, F.A.; Quental, M.V.; Mondal, D.; Freire, M.G.; Coutinho, J.A.P. Ionic-Liquid-Mediated Extraction and Separation Processes for Bioactive Compounds: Past, Present, and Future Trends. Chem. Rev. 2017, 117, 6984–7052. [Google Scholar] [CrossRef]
- Lim, J.R.; Chua, L.S.; Mustaffa, A.A. Ionic liquids as green solvent and their applications in bioactive compounds extraction from plants. Process Biochem. 2022, 122, 292–306. [Google Scholar] [CrossRef]
- Hajipour, A.R.; Rafiee, F. Recent Progress in Ionic Liquids and their Applications in Organic Synthesis. Org. Prep. Proced. Int. 2015, 47, 249–308. [Google Scholar] [CrossRef]
- Merone, M.G.; Tartaglia, A.; Rosato, E.; D’Ovidio, C.; Kabir, A.; Ulusoy, I.H.; Savini, F.; Locatelli, M. Ionic Liquids in Analytical Chemistry: Applications and Recent Trends. Curr. Anal. Chem. 2021, 17, 1340–1355. [Google Scholar] [CrossRef]
- Ali, S.A.; Mulk, W.U.; Ullah, Z.; Khan, H.; Zahid, A.; Shah, M.U.H.; Shah, S.N. Recent Advances in the Synthesis, Application and Economic Feasibility of Ionic Liquids and Deep Eutectic Solvents for CO2 Capture: A Review. Energies 2022, 15, 9098. [Google Scholar] [CrossRef]
- Kreivaitis, R.; Kupčinskas, A.; Žunda, A.; Ta, T.N.; Horng, J.H. Effect of temperature on the lubrication ability of two ammonium ionic liquids. Wear 2022, 492–493, 204217. [Google Scholar] [CrossRef]
- Ding, H.; Ye, W.; Wang, Y.; Wang, X.; Li, L.; Liu, D.; Gui, J.; Song, C.; Ji, N. Process intensification of transesterification for biodiesel production from palm oil: Microwave irradiation on transesterification reaction catalyzed by acidic imidazolium ionic liquids. Energy 2018, 144, 957–967. [Google Scholar] [CrossRef]
- Kazemi, S.; Nor, M.I.M.; Teoh, W.H. Thermodynamic and economic investigation of an ionic liquid as a new proposed geothermal fluid in different organic Rankine cycles for energy production. Energy 2020, 193, 116722. [Google Scholar] [CrossRef]
- Kazmi, B.; Haider, J.; Ammar Taqvi, S.A.; Qyyum, M.A.; Ali, S.I.; Hussain Awan, Z.U.; Lim, H.; Naqvi, M.; Naqvi, S.R. Thermodynamic and economic assessment of cyano functionalized anion based ionic liquid for CO2 removal from natural gas integrated with, single mixed refrigerant liquefaction process for clean energy. Energy 2022, 239, 122425. [Google Scholar] [CrossRef]
- Kalita, P.; Lukaszewicz, G. Navier-Stokes Equations: An Introduction with Applications, 1st ed.; Springer Nature Customer Service Center GmbH: London, UK, 2016. [Google Scholar]
- Nangia, N.; Griffith, B.E.; Patankar, N.A.; Bhalla, A.P.S. A robust incompressible Navier-Stokes solver for high density ratio multiphase flows. J. Comput. Phys. 2019, 390, 548–594. [Google Scholar] [CrossRef] [Green Version]
- Lee, J.; Ahn, Y.; Kim, Y. Experimental study on effect of density ratio and phase transition during sloshing impact in rectangular tank. Ocean. Eng. 2021, 242, 110105. [Google Scholar] [CrossRef]
- Rao, Y.; Liu, C.; Wang, H.; Ni, Y.; Lv, C.; Liu, S.; Lan, Y.; Wang, S. Density ratio effect on particle sedimentation in a vertical channel. Chin. J. Phys. 2018, 56, 1427–1438. [Google Scholar] [CrossRef]
- Troncoso, J.; Cerdeiriña, C.A.; Sanmamed, Y.A.; Romaní, L.; Rebelo, L.P.N. Thermodynamic Properties of Imidazolium-Based Ionic Liquids: Densities, Heat Capacities, and Enthalpies of Fusion of [bmim][PF6] and [bmim][NTf2]. J. Chem. Eng. Data 2006, 51, 1856–1859. [Google Scholar] [CrossRef]
- Lazzús, J. Estimation of Density as a Function of Temperature and Pressure for Imidazolium-Based Ionic Liquids Using a Multilayer Net with Particle Swarm Optimization. Int. J. Thermophys. 2009, 30, 883–909. [Google Scholar] [CrossRef]
- Gardas, R.L.; Freire, M.G.; Carvalho, P.J. High-Pressure Densities and Derived Thermodynamic Properties of Imidazolium-Based Ionic Liquids. J. Chem. Eng. Data 2007, 52, 80–88. [Google Scholar] [CrossRef]
- Tomé, L.I.N.; Carvalho, P.J.; Freire, M.G.; Marrucho, I.M.; Fonseca, I.M.A.; Ferreira, A.G.M.; Coutinho, J.A.P.; Gardas, R.L. Measurements and Correlation of High-Pressure Densities of Imidazolium-Based Ionic Liquids. J. Chem. Eng. Data 2008, 53, 1914–1921. [Google Scholar] [CrossRef] [Green Version]
- Fredlake, C.P.; Crosthwaite, J.M.; Hert, D.G.; Aki, S.N.V.K.; Brennecke, J.F. Thermophysical Properties of Imidazolium-Based Ionic Liquids. J. Chem. Eng. Data 2004, 49, 954–964. [Google Scholar] [CrossRef]
- Kermani, N.A.; Petrushina, I.; Nikiforov, A.; Jensen, J.O.; Rokni, M. Corrosion behavior of construction materials for ionic liquid hydrogen compressor. Int. J. Hydrogen Energy 2016, 41, 16688–16695. [Google Scholar] [CrossRef] [Green Version]


| Inlet Condition | Outlet Condition | Working Specification | |||
|---|---|---|---|---|---|
| Pressure (MPa) | Temperature (°C) | Pressure (MPa) | Compression Ratio | Flow Rate (Nm3/h) | Frequency (Hz) |
| 12 | 25 | 45 | 3.75 | 150 | 5.0 |
| No. | Thermophysical Properties | |||
|---|---|---|---|---|
| Density (kg/m3) | Dynamic Viscosity (mPa∙s) | Thermal Conductivity (W/m∙K) | Heat Capacity (J/mol∙K) | |
| 1 | 1000 | 51.87 | 0.1209 | 509.2 |
| 2 | 1150 | 51.87 | 0.1209 | 509.2 |
| 3 | 1300 | 51.87 | 0.1209 | 509.2 |
| 4 | 1450 | 51.87 | 0.1209 | 509.2 |
| 5 | 1600 | 51.87 | 0.1209 | 509.2 |
| Mesh Size (mm) | Time Step (s) | ||||||
|---|---|---|---|---|---|---|---|
| Value | 0.7 | 0.6 | 0.5 | 0.4 | |||
| Discharged mass (g) | 14.50 | 14.84 | 14.81 | 14.56 | 15.11 | 14.81 | 14.78 |
| Deviation (%) | 2.10 | 0.22 | / | 1.71 | 1.99 | / | 0.22 |
Disclaimer/Publisher’s Note: The statements, opinions and data contained in all publications are solely those of the individual author(s) and contributor(s) and not of MDPI and/or the editor(s). MDPI and/or the editor(s) disclaim responsibility for any injury to people or property resulting from any ideas, methods, instructions or products referred to in the content. |
© 2023 by the authors. Licensee MDPI, Basel, Switzerland. This article is an open access article distributed under the terms and conditions of the Creative Commons Attribution (CC BY) license (https://creativecommons.org/licenses/by/4.0/).
Share and Cite
Guo, Y.; Wang, Q.; Geng, M.; Peng, X.; Feng, J. Effects of Liquid Density on the Gas-Liquid Interaction of the Ionic Liquid Compressor for Hydrogen Storage. Energies 2023, 16, 3193. https://doi.org/10.3390/en16073193
Guo Y, Wang Q, Geng M, Peng X, Feng J. Effects of Liquid Density on the Gas-Liquid Interaction of the Ionic Liquid Compressor for Hydrogen Storage. Energies. 2023; 16(7):3193. https://doi.org/10.3390/en16073193
Chicago/Turabian StyleGuo, Yi, Qi Wang, Maofei Geng, Xueyuan Peng, and Jianmei Feng. 2023. "Effects of Liquid Density on the Gas-Liquid Interaction of the Ionic Liquid Compressor for Hydrogen Storage" Energies 16, no. 7: 3193. https://doi.org/10.3390/en16073193