1. Introduction
According to International Energy Agency (IEA) report on Global Energy Review: CO
2 Emissions in 2021, global CO
2 emissions derived from fossil fuel combustion and industrial processes was increased to a record high of 36.3 Gt from 2020 pushed emissions [
1]. To effectively limit the global average temperature rise to 1.5 °C above preindustrial levels, it is critical and urgent to explore the potential of renewable energy sources as an alternative to traditional fossil fuels to provide a suite of energy services. Attributed to the clean, abundant, and easily accessible characteristics, solar energy has been extensively utilized in the fields of heating [
2], natural lighting [
3], photovoltaic (PV) electricity generation [
4], and solar fuels [
5].
The integration of solar photovoltaic energy systems in various buildings has been proven as a promising solution to reduce CO
2 emissions by alleviating or eliminating fossil fuel utilization in building sector. Ghaleb et al. [
6] found that, with the overall utilization factor of 0.49, an annual power production of 91,122 MWh and a reduction of 72,533 tons of CO
2 were achieved by applying PV systems on the studied 105 commercial buildings in Saudi Arabia. Furthermore, the levelized cost of electricity (LCOE) was SR 0.16/kWh and the payback period was 13.6 years within the span life of 25 years. Mohammed et al. [
7] analyzed the performance and feasibility of a 10 kWh PV system for residential buildings in Saudi Arabia and found that the levelized cost of energy in Tabuk was 0.027
$/kWh, and the greenhouse gas reduction was 330.88 tons of CO
2 per year. Yang et al. [
8] investigated the potential of solar PVs mounted on roofs of different types of buildings in Sweden, and an approximately available roof area of 504 km
2 could yield the maximum installed capacity potential of 65 GWp–84 GWp in Sweden. According to the International Renewable Energy Agency, the installed photovoltaic capacity in China was increased from 1.0 GW to 204.3 GW over the past decade from 2010 to 2019, which was mainly due to strong government supports and heavy industry investments [
9].
University campuses have a variety of building types with large roof surfaces and diverse utilization purposes including academic, research, residential, athletics, and administration. Serving as a multifunctional comprehensive infrastructure in the society, universities have been facing the urgent challenges relevant to the high energy consumption. Switching to renewable energy is an alternative way to reduce campus-wide environmental impacts in response to the commitment of carbon neutrality and peak carbon dioxide emissions. Until 2020, more than 40 colleges and universities have already led the transition to 100% renewable energy on campus by shifting to renewable electricity, adopting electric vehicles, or repowering building with clean energy [
10].
A variety of studies have been carried out to explore the potential of solar PV utilization at the scale of university campus. Thai et al. [
11] investigated the power generation potential of solar PV panels in the University of California campuses based on utilization factors, and estimated a combined potential capacity of 345 MW and 471 MW corresponding to frozen building development cases and new buildings converted from parking lots, respectively. The performance analysis of grid-connected PV systems installed at the Hashemite University in Jordan revealed that, the annual final yield of two 7.98 kWp PV systems with and without tracking elements was 2572 kWh/kWp and 1959 kWh/kWp, corresponding to a total saving of
$138,825 and
$105,737 over 20 years, respectively [
12]. A 42 kW PV system installed at the West Texas A&M University annually generated 71,000 kWh and saved around
$6390 by reducing energy consumption from the electrical grid [
13]. A 67 kW PV system at the University of New Haven located in New England could generate an amount of 82,800 kWh electricity and a cumulative cash flow of
$360,000 over its 25-year lifetime [
14]. PV systems installed at the Technical University of Madrid provided an optimal power of 3.3 MW, approximate 77% of which was locally consumed to cover 40% of the total electricity consumption of 0. Obeng et al. [
15] designed a 50 MW grid-tied solar PV plant with three PV systems at the University of Energy and Natural Resources in Ghana, which had the capacity to supply more than 48% of the campus’ electricity demand. Atri et al. [
16] analyzed the technical and economic potential of installing a solar PV plant in Manav Rachna education campus in India. The PV output could meet 85% of the electricity demand and 31,000 MWh of surplus energy was sold to the grid, with the investment recovered in nearly 7 years. Low-rise residential buildings integrated with solar PV systems had the potential to become net zero energy buildings, and the designed nominal PV power for The Indian Institute of Technology Kharagpur could meet the maximum residential energy demand in the studied academic campus in the COVID-19 affected year [
17]. Mokhtara et al. [
18] applied grid-connected rooftop PV systems in education buildings in an Algeria university campus, and their results showed that 60% of the roof area was optimally appropriate for PV installations and that the highest annual electricity output of 2333.11 MWh/year could be achieved. 1 MW rooftop solar PV proposed for Purwanchal Campus in Nepal gave a return on investment of 190% within its 25-year service life, with a levelized cost of energy of 0.069 USD/kWh and payback period of 8.4 years [
19]. Ali et al. [
20] found that the payback period of grid-connected PV systems installed in Zakho University in Iraq could be reduced to 4 years with the use of local generators, demonstrating that the proposed PV systems were quite favorable for university campuses in Iraq. Ahmed et al. [
21] investigated the PV systems on the building rooftops in NED University of Engineering and Technology in Pakistan. Based on comprehensive analysis from the perspectives of technical feasibility, financial viability, and environmental benefits, it was concluded that PV applications in universities’ buildings were a viable choice and building rooftops in university campuses should be capitalized to solve their increasing energy demand.
The above literature review indicates that rooftop PV systems installed in university campuses present power generation, economic revenue, and environmental benefits. However, most relevant research mainly focuses on PV systems with a fixed configuration, without considering the tradeoff between technical performance and economic assessments of PV systems with different configurations. In addition, to our knowledge, a comprehensive assessment from the perspectives of geographical location, technical potential, and economic benefits for rooftop PV systems installed in universities campuses in China has not been published. Therefore, the main objective of the present study is to qualitatively and quantitatively evaluate the rooftop solar PV systems installed in university campuses located in different solar zones in China, considering seven installation scenarios for PV systems mounted on flat and pitched rooftops, and two electricity selling strategies.
After introduction, the rest of this study is organized as follows.
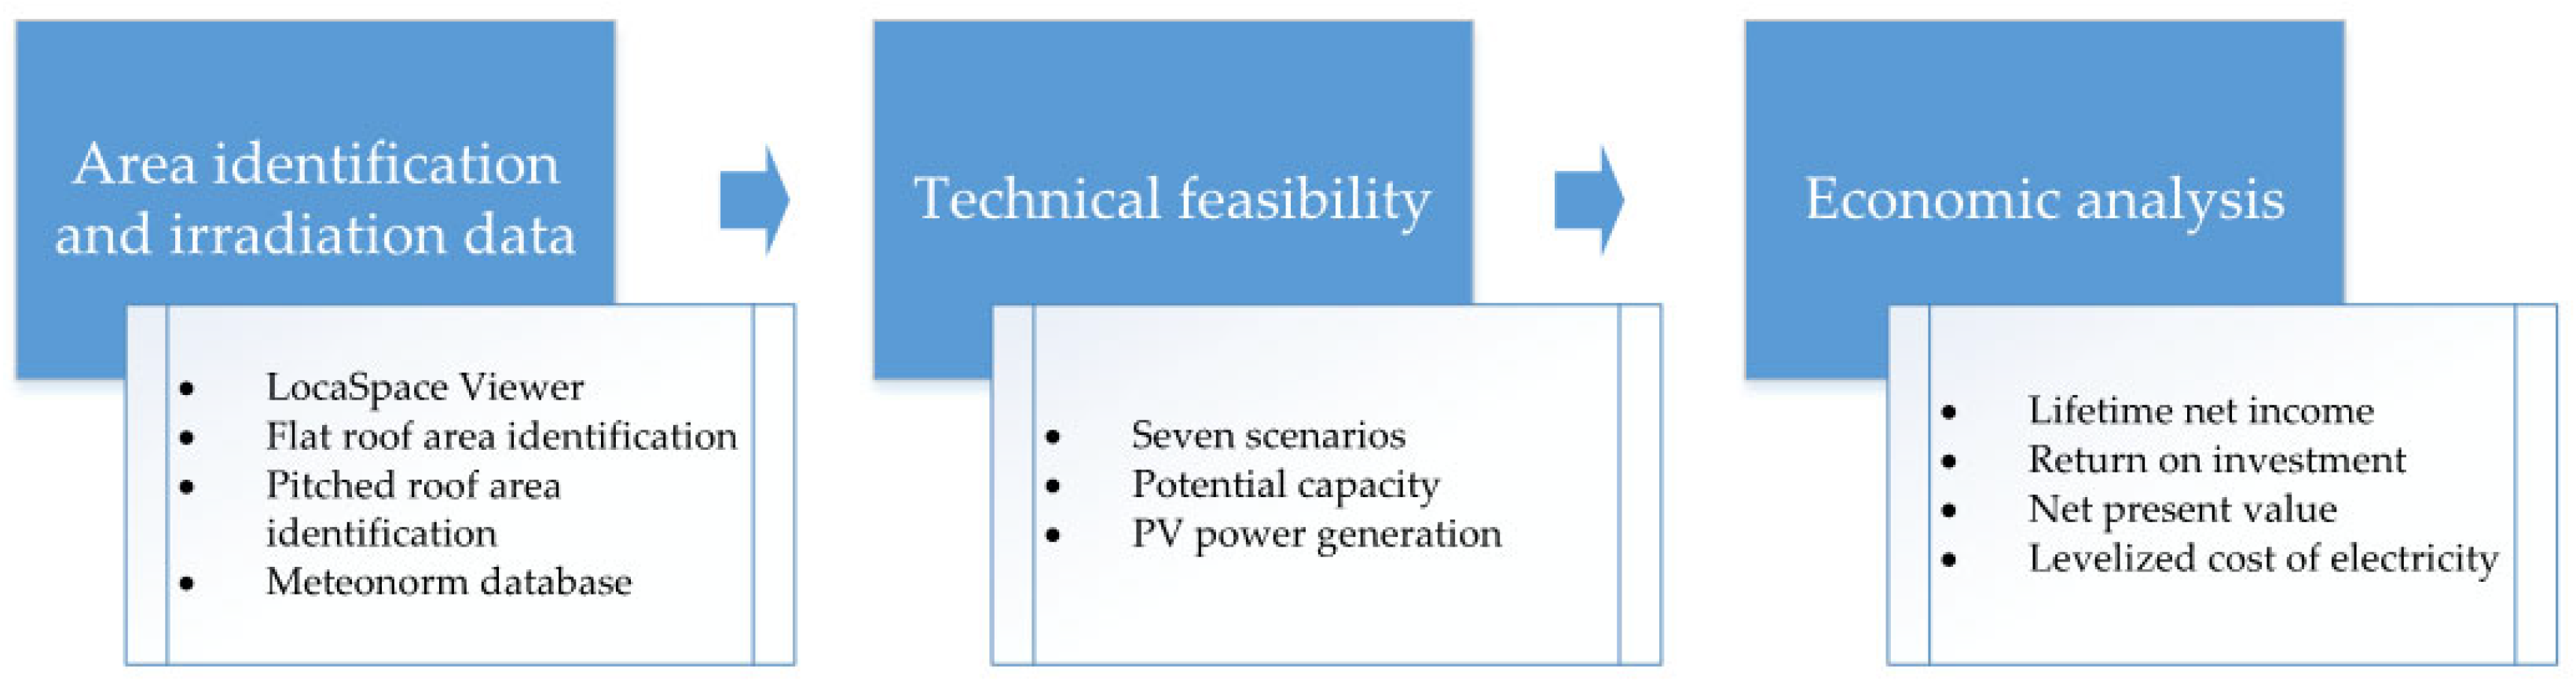
Section 2 presents the research methodology which describes the data acquisition, PV module spacing relevant with flat and pitched rooftops, and energy potential and economic indicators for the proposed PV system.
Section 3 gives a detailed description of three study cases located in three different solar zones, as well as seven installation scenarios. Results and discussion for technical potential and economic performances are given in
Section 4. Finally,
Section 5 summarizes the main conclusions of the present study.
3. Study Case
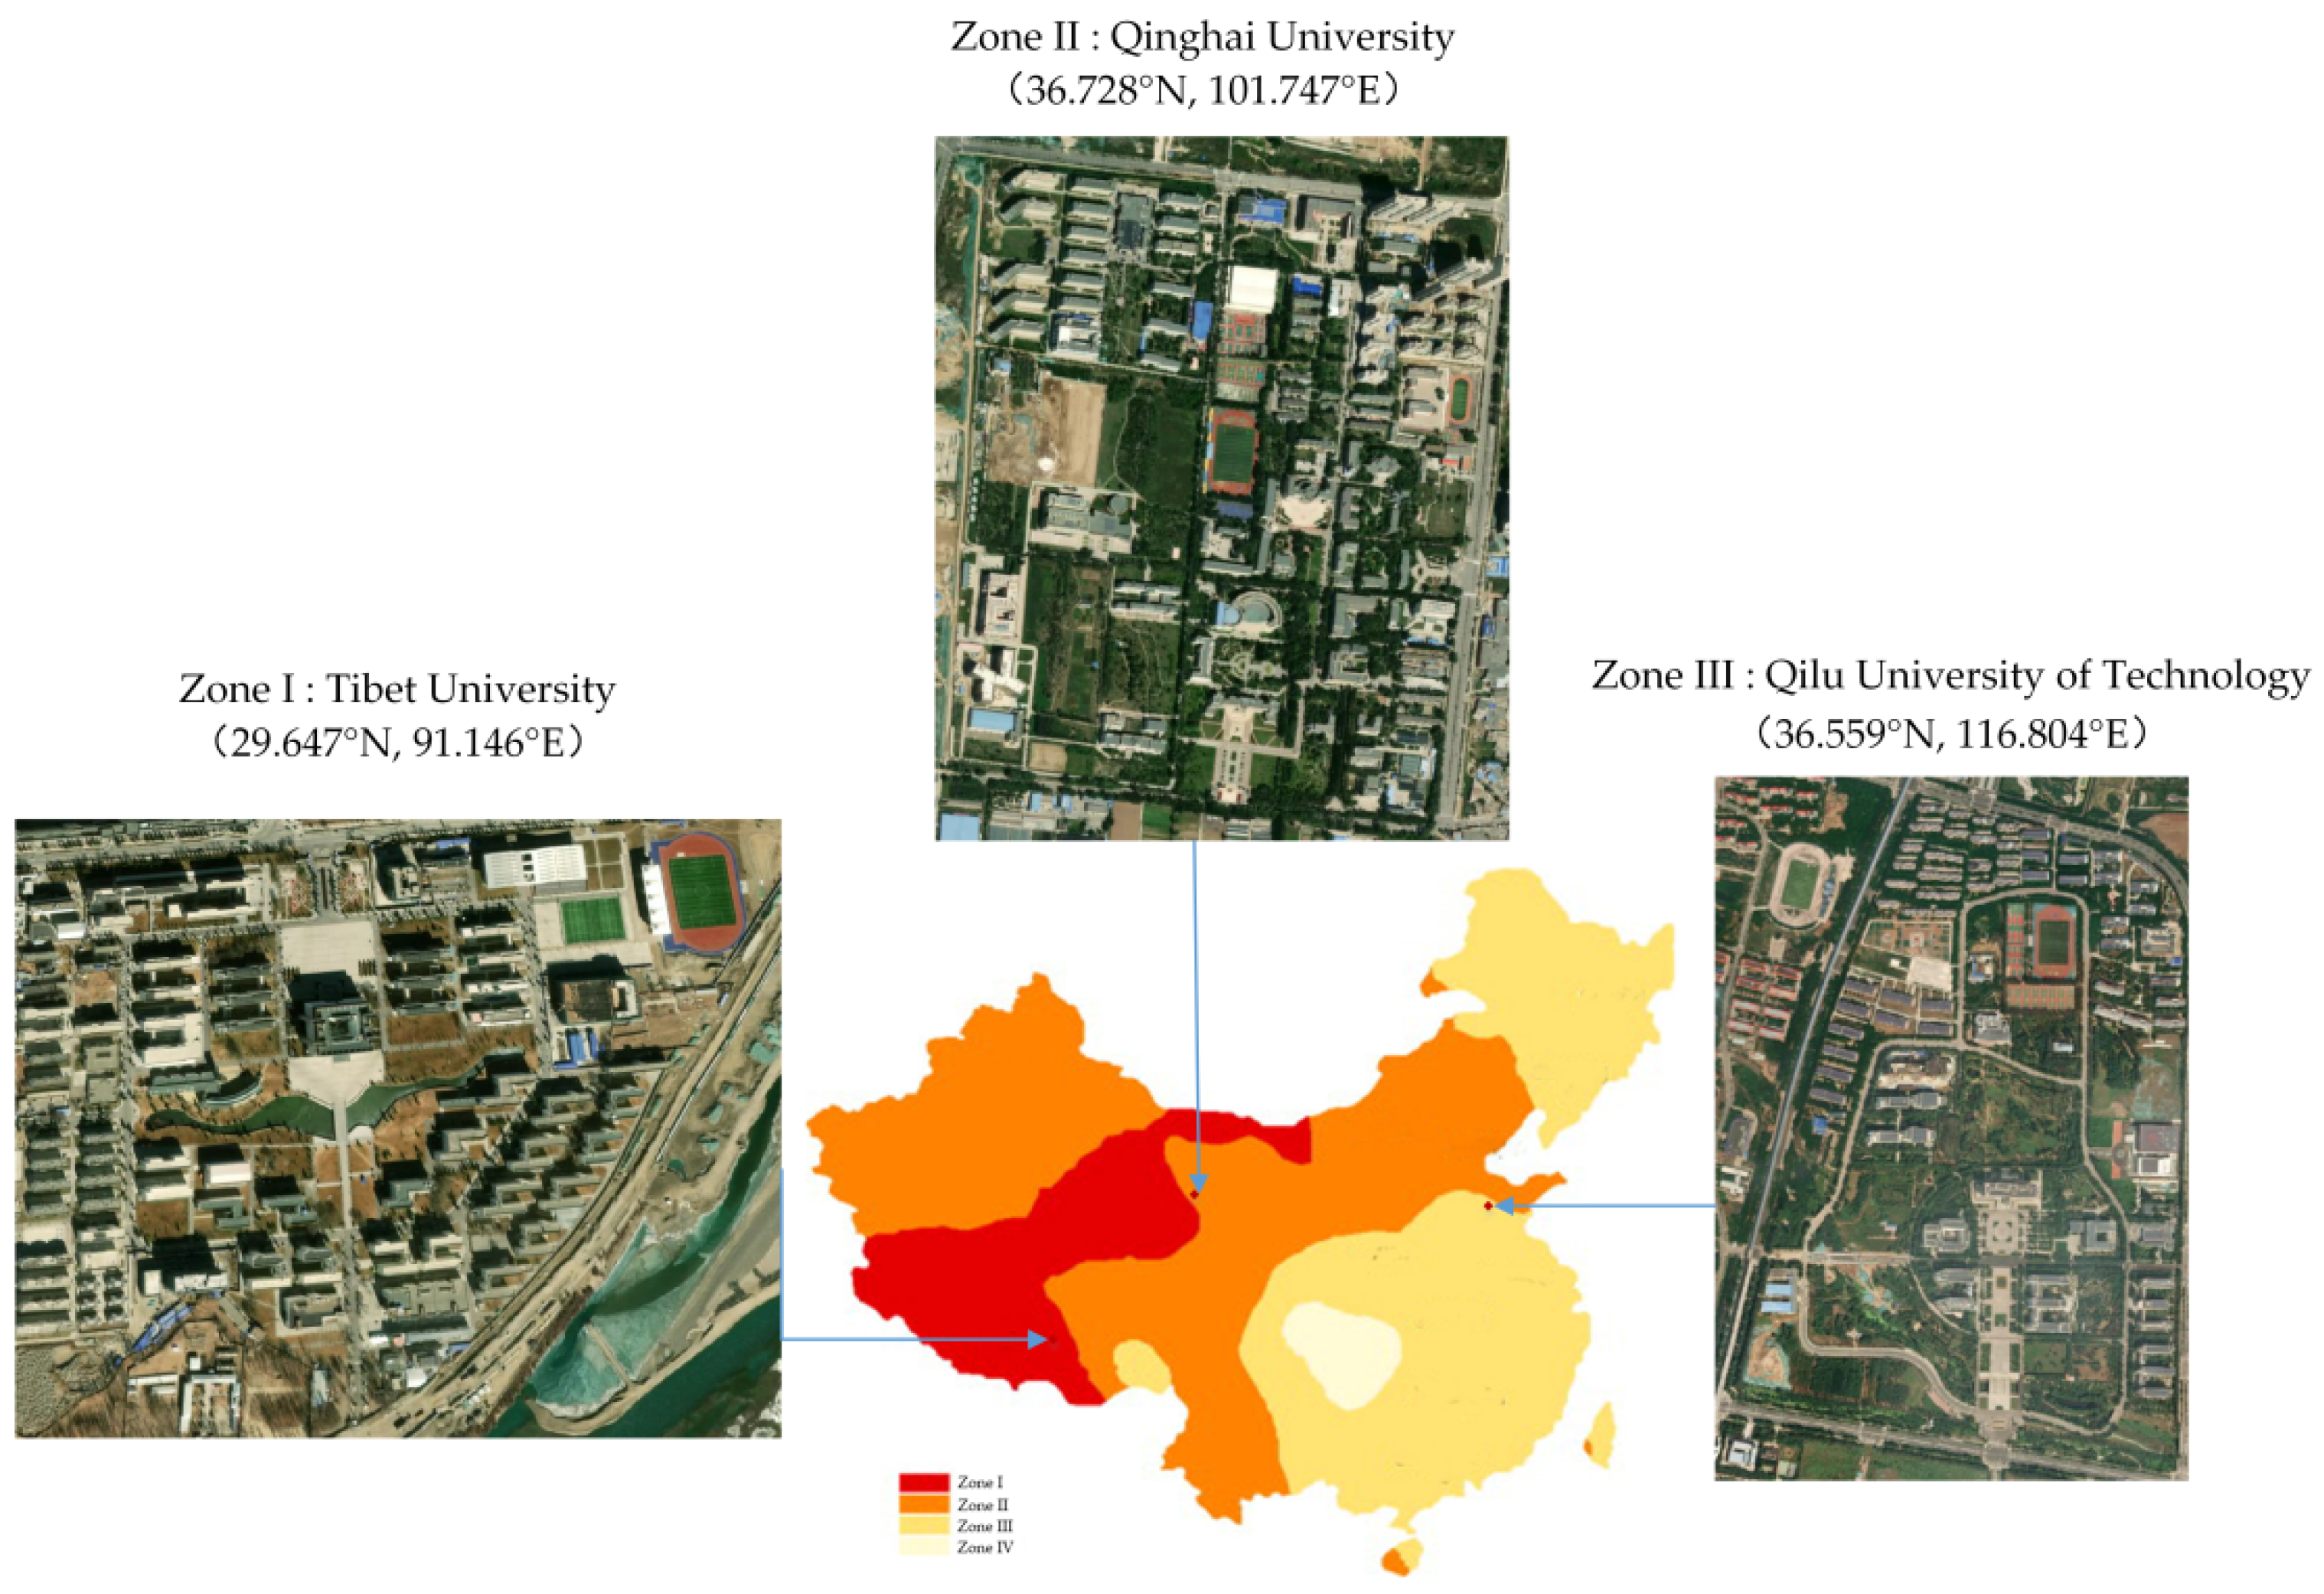
The power generation efficiency, the location, and the array layout of PV systems depends on the solar radiation received on the solar panel surfaces. Due to a vast land mass with diverse meteorological conditions, four major solar radiation zones have been identified from Zone I to Zone IV in China for targeting solar energy utilization [
25]. In order to evaluate the technical feasibility and economic benefit of university campus PV systems, Tibet University in Lhasa City, Qinghai University in Xining City, and Qilu University of Technology in Jinan City are selected as study cases, with the location and satellite images shown in
Figure 4. Zone IV is not taken into account in the present study due to less solar radiation. The coordinates of three selected universities are (29.647° N, 91.146° E), (36.728° N, 101.747° E), and (36.559° N, 116.804° E), representing Zone I, Zone II, and Zone III irradiation areas in China, respectively.
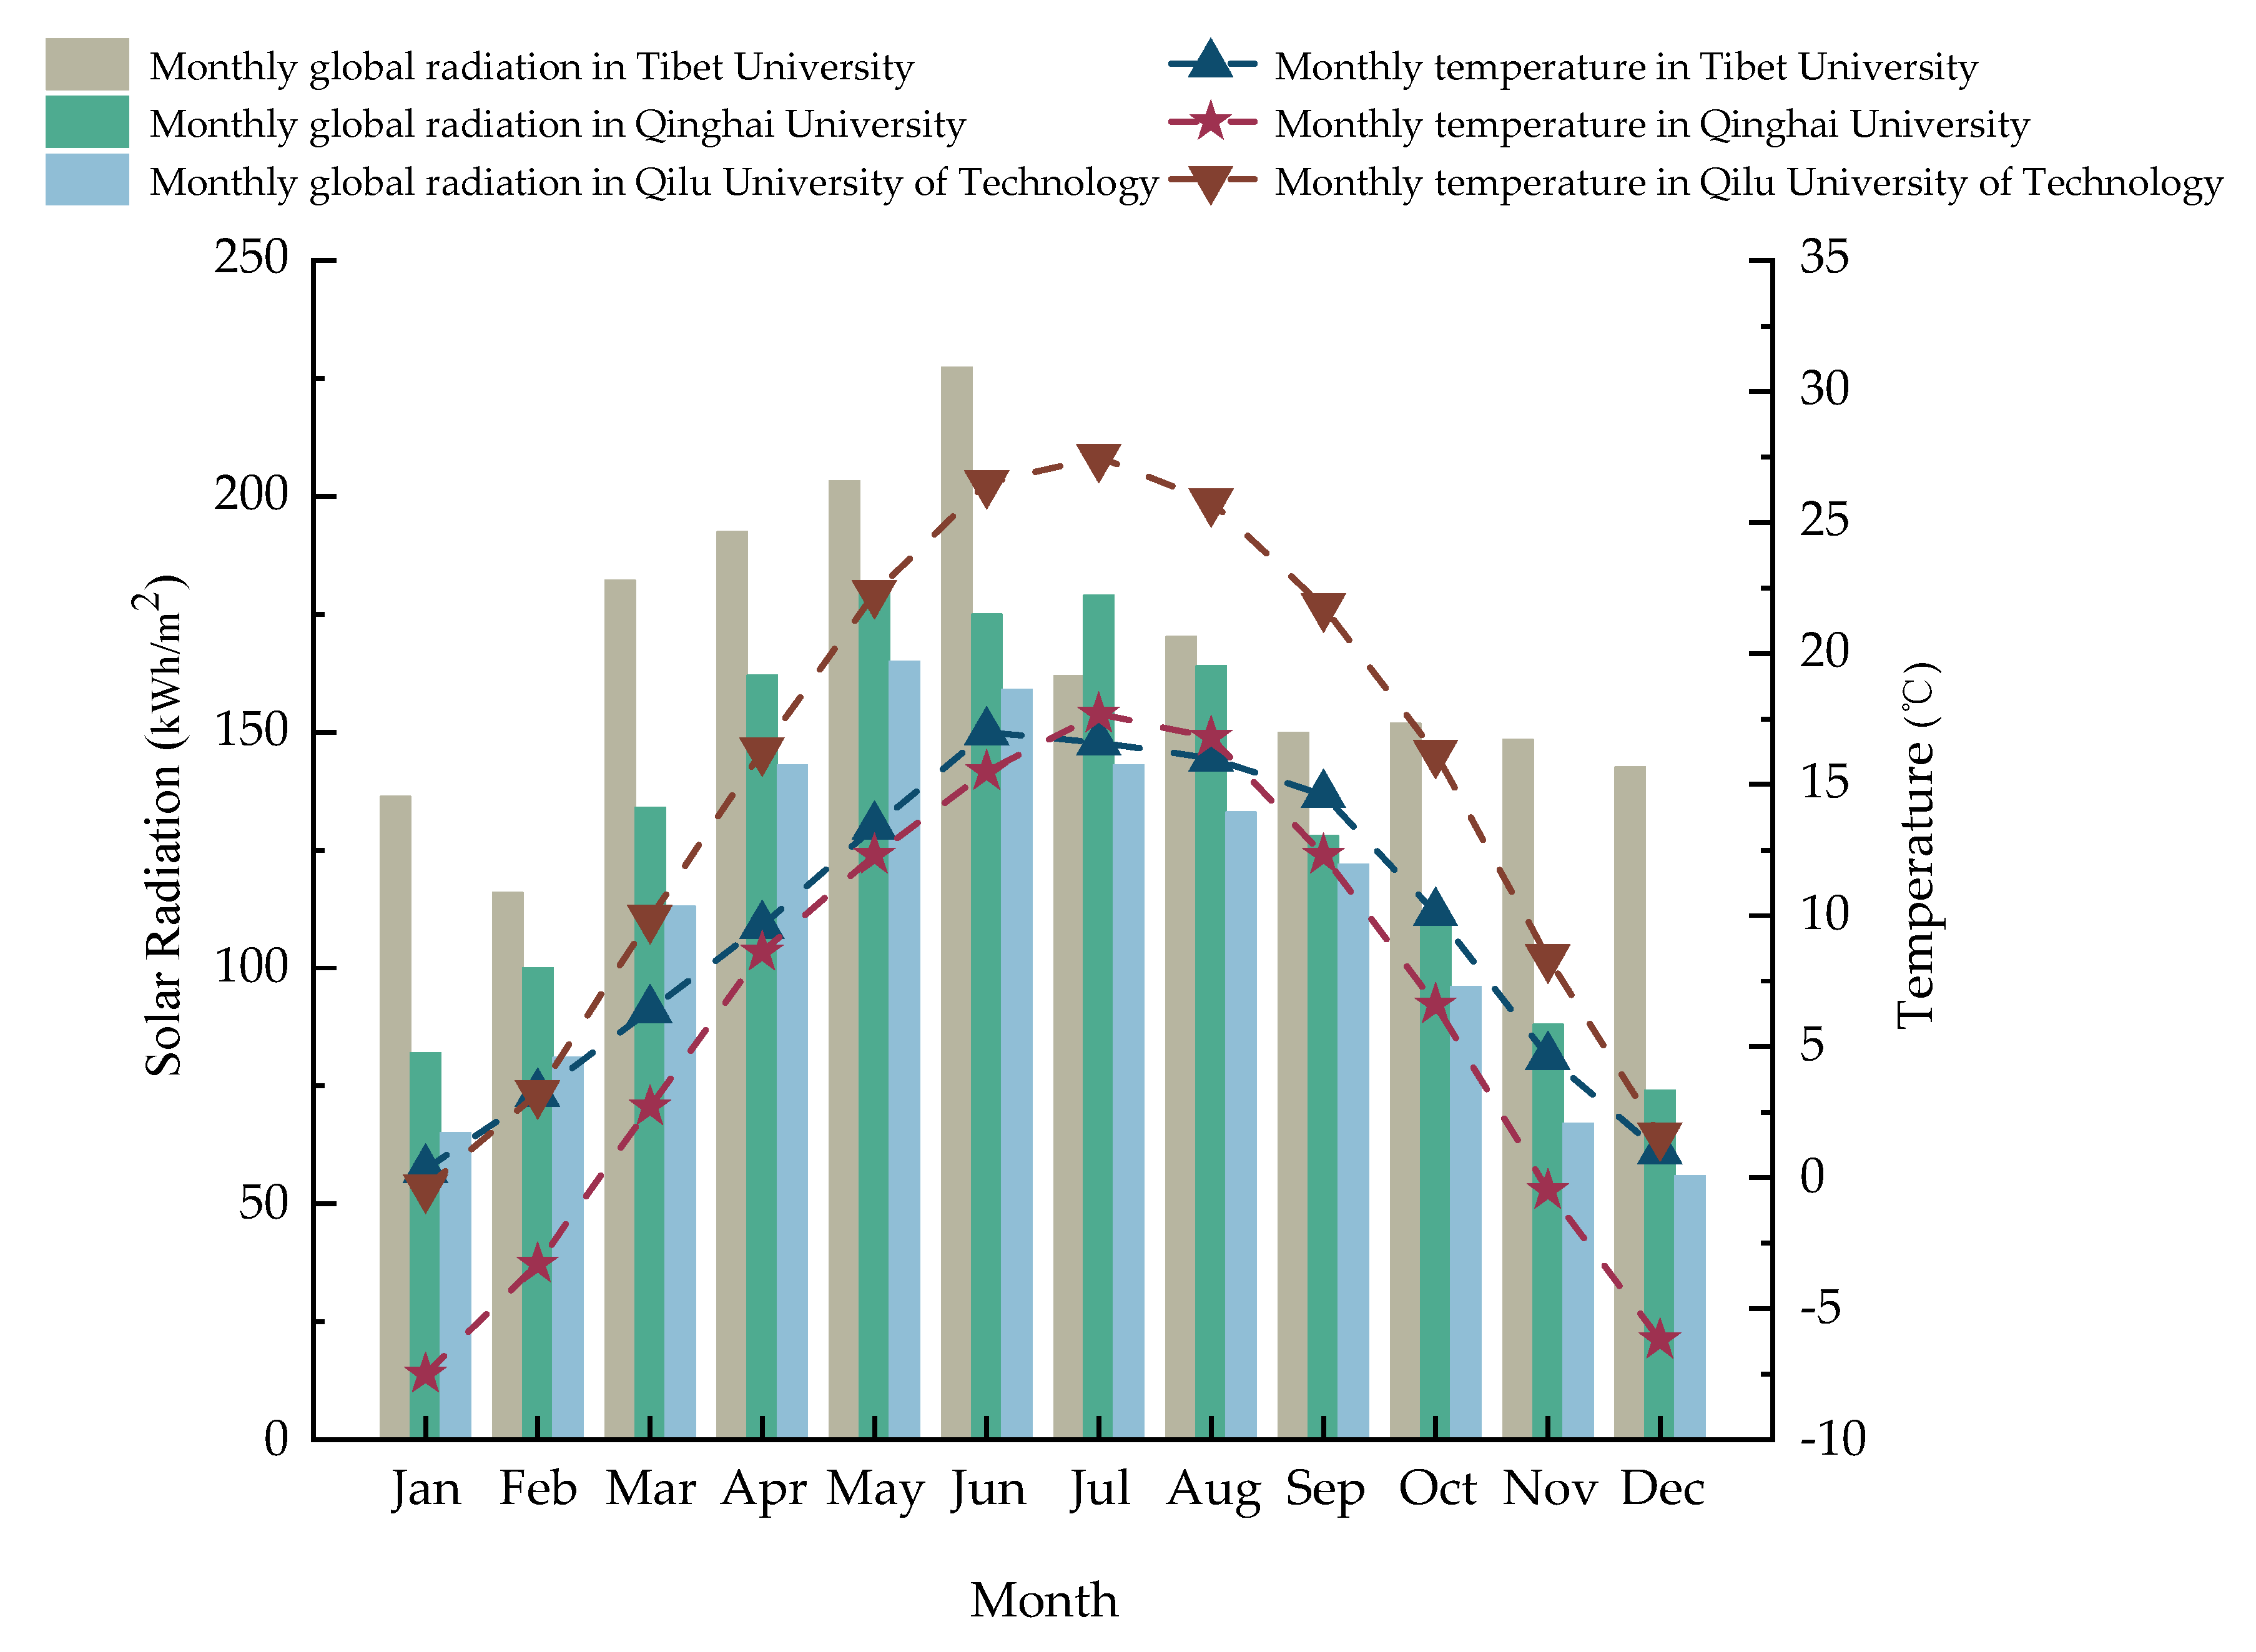
The main meteorological parameters of the three studied university are shown in
Figure 5. The annual outdoor average temperature at Tibet University, Qinghai University, and Qilu University of Technology is 9.4 °C, 6.3 °C, and 14.9 °C, respectively. The annual global horizontal irradiation of above three universities reaches 1983 kWh/m
2, 1576 kWh/m
2, and 1342 kWh/m
2, respectively. It can be obviously observed that, Tibet University has the most solar irradiation, followed by Qinghai University and Qilu University of Technology, which is consistent with their located solar radiation zones. Tibet University has the highest monthly global horizontal radiation of 228 kWh/m
2 in June and the lowest radiation of 116 kWh/m
2 in February. Both Qinghai University and Qilu University of Technology reach the highest irradiation values in May with 181 kWh/m
2 and 165 kWh/m
2, and the lowest irradiation levels in December with 74 kWh/m
2 and 56 kWh/m
2, respectively.
The technical feasibility and economic evaluation are crucial for the installation of PV systems [
27]. Taking improvement of the technical performance into consideration, embedding solar trackers into the PV systems is an effective strategy to improve the irradiation utilization [
26]. However, solar trackers also increase the construction cost and economic expense of the relevant PV systems. If a PV system embedded with solar trackers is installed at an angle of more than 15° the roof tilt angle needs to be adjusted, resulting in an increase in the installation cost [
28]. Therefore, PV systems embedded with solar trackers are generally mounted at an angle of less than 15° and on relatively flat ground [
29]. In this study, considering the balance between technical performance and economical evaluation, seven installation scenarios for PV systems mounted on flat and pitched rooftops are proposed to investigate the optimal configuration of the studied university campuses.
Scenario A: PV system fixed on flat rooftop at the optimal tilt angle without adjustment;
Scenario B: PV system fixed on flat rooftop at the optimal tilt angle with biannual adjustment, corresponding to summer optimal tilt angle and winter optimal tilt angle, respectively;
Scenario C: PV system fixed on flat rooftop at the optimal tilt angle with monthly adjustment;
Scenario D: PV system with single-axis tracking module installed on flat rooftop;
Scenario E: PV system with dual-axis tracking module installed on flat rooftop;
Scenario F: PV system installed parallel to pitched rooftop without adjustment, at the roof pitch of 25°;
Scenario G: PV system installed on pitched rooftop at the optimal tilt angle with no adjustment.
In comparison with Scenario A, the installation cost and adjustment cost in the case of scenarios B and C are increased by 0.06 CNY/W and 0.0045 CNY/W [
30], respectively. In comparison with Scenario A, the initial investment in case of scenarios D and E is increased by 25% and 50% [
29], respectively. In the present study, it is assumed that the maintenance and operation costs under all scenarios are 1% of the initial investment [
31].
Considering the pricing policy of the PV system, economic benefits of the three studied universities are evaluated under the “full-self-consumption” and “full-feed-into-grid” modes. In the case of “full-self-consumption” mode, the electricity generated by the PV systems is completely consumed by the universities. The tariff of Tibet University, Qinghai University, and Qilu University of Technology is calculated according to the local residential electricity tariffs, which is 0.49 CNY [
32], 0.3964 CNY [
33], and 0.555 CNY [
34], respectively. For the “full-feed-into-grid” mode, due to no PV subsidy after 2021, electricity generated by the PV system is all sold to the national grid at local benchmark price of solar-powered electricity of 0.1 CNY [
35], 0.3247 CNY [
36], 0.3949 CNY [
35] for Tibet University, Qinghai University, and Qilu University of Technology, respectively.
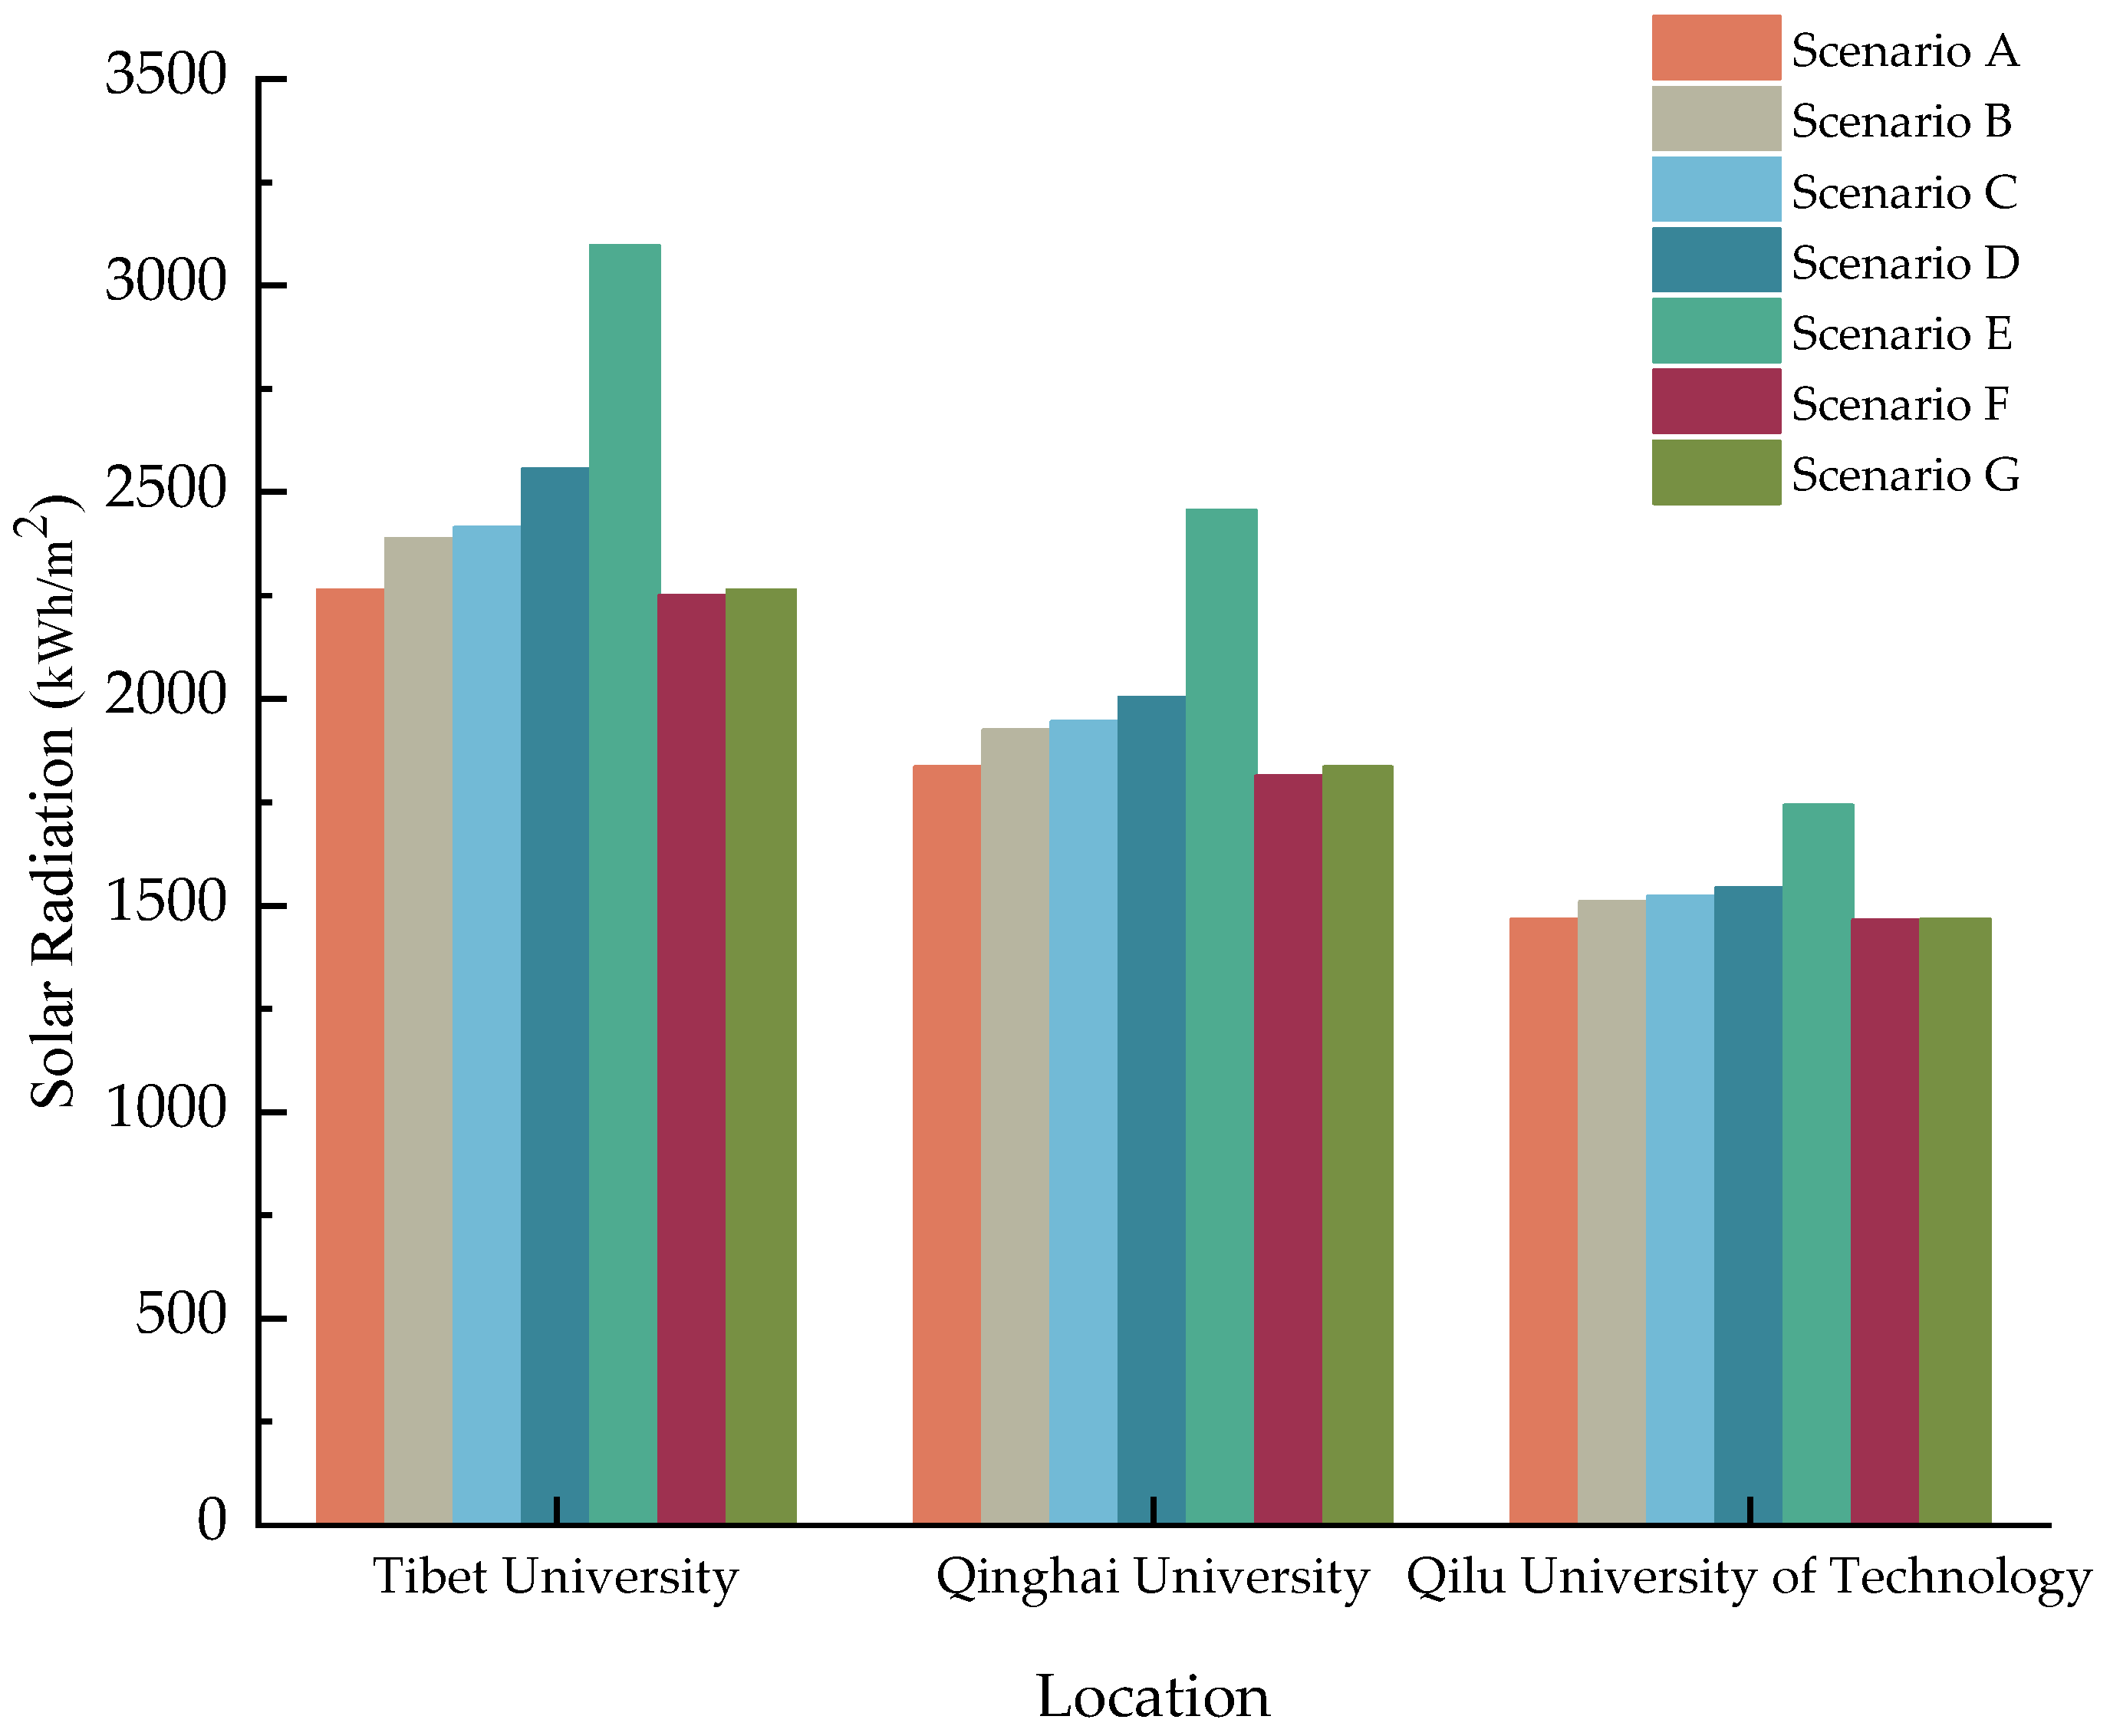
The comparison of irradiation data for the three studied universities under seven scenarios is shown in
Figure 6. It can be observed that, most solar irradiation is obtained under Scenario E, that is, a PV system with a dual-axis tracking module installed on a flat rooftop. On a pitched rooftop, Scenario F and Scenario G almost obtain the same amount of annual irradiation, with scenario G being slightly higher than that of scenario F.
4. Results and Discussion
4.1. Utilizable Area for PV Application
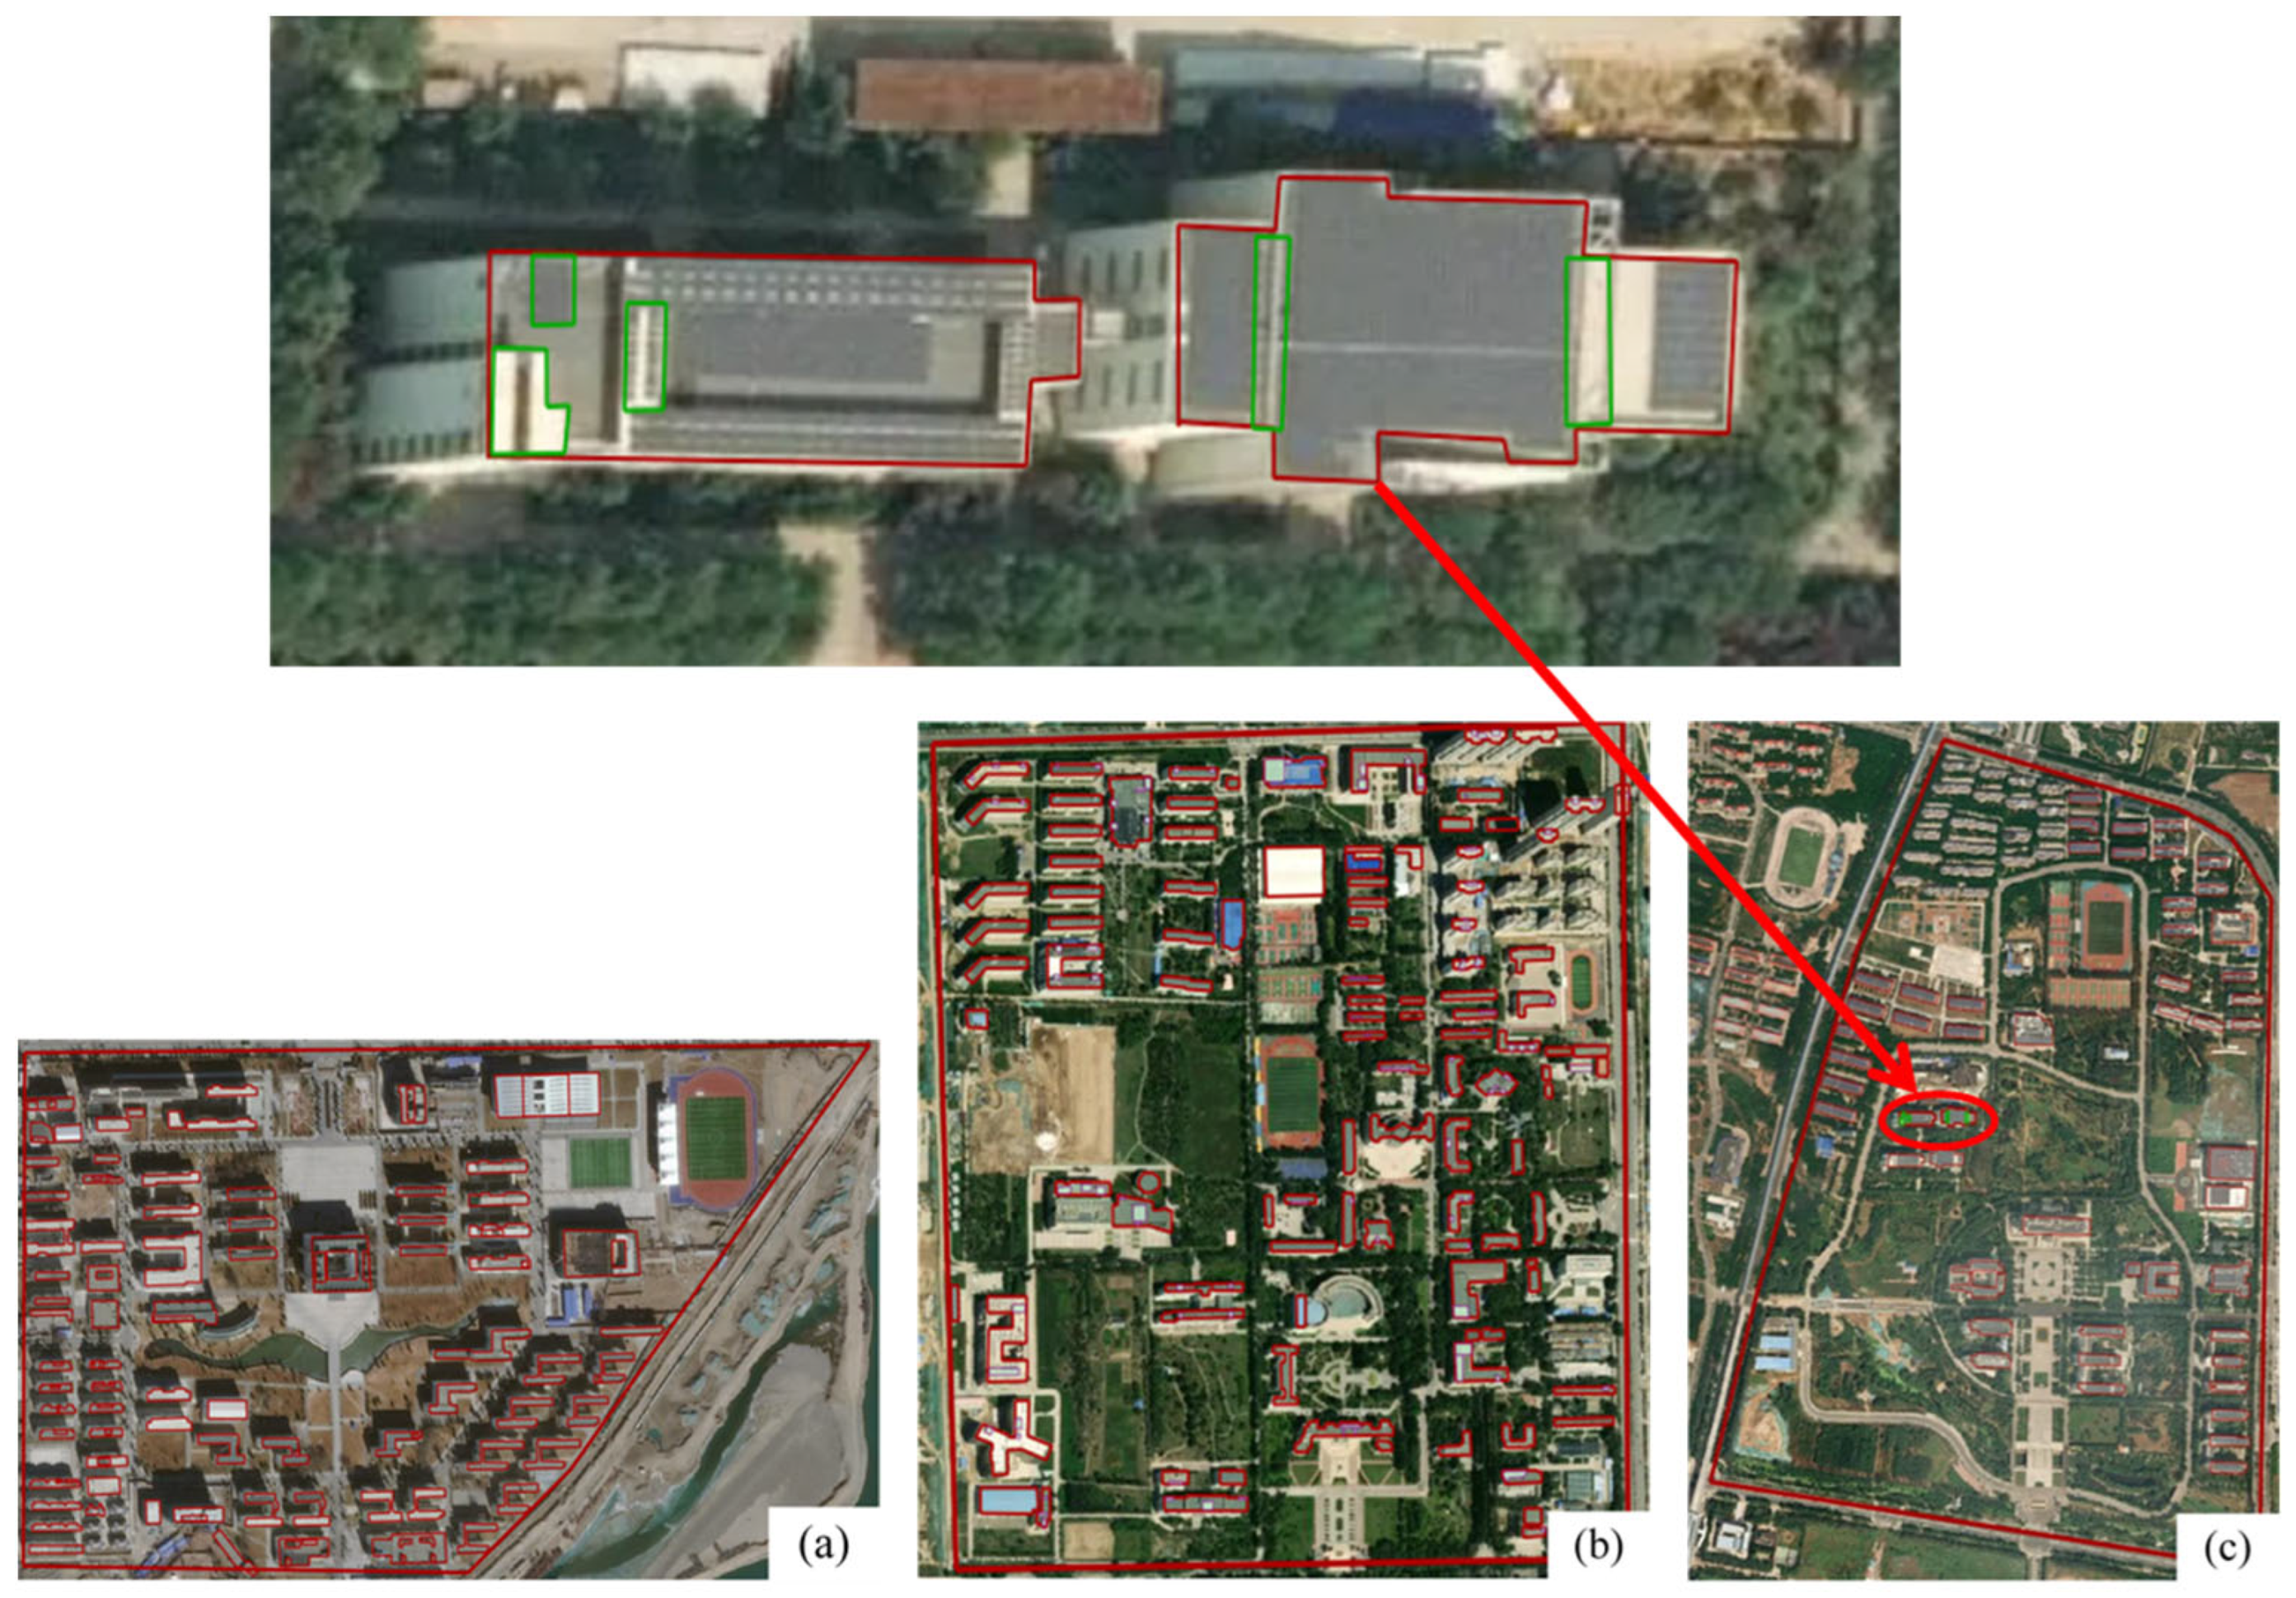
LocaSpace Viewer is a 3D digital earth software which integrates images and terrain online services such as Google Earth and TIANDITU, to achieve the rapid browsing, measurement, analysis, and marking of 3D geospatial information data. In the present study, potentially utilizable areas for PV system application in the three studied universities are obtained by LocaSpace Viewer software, while the rooftop areas inappropriate for PV system installation are manually excluded. The total coverage area of Tibet University, Qinghai University, and Qilu University of Technology is 0.77 km
2, 1.09 km
2, and 1.26 km
2, respectively. The potentially available areas for PV systems in the three universities are shown in
Figure 7. Available flat rooftop areas of Tibet University, Qinghai University, and Qilu University of Technology are 104,741 m
2, 105,360 m
2, and 42,797 m
2, accounting for 96.75%, 96.67%, and 71.25% of total available areas, respectively. On the other hand, the potentially utilizable areas on the pitched rooftops of Tibet University, Qinghai University, and Qilu University of Technology are 3485 m
2, 6585 m
2, and 13,577 m
2, accounting for 3.22%, 3.33%, and 28.75% of total potential areas, respectively.
4.2. Installed Capacity of PV Systems
The PV output in the three studied university campuses are calculated using the input data shown in
Table 1.
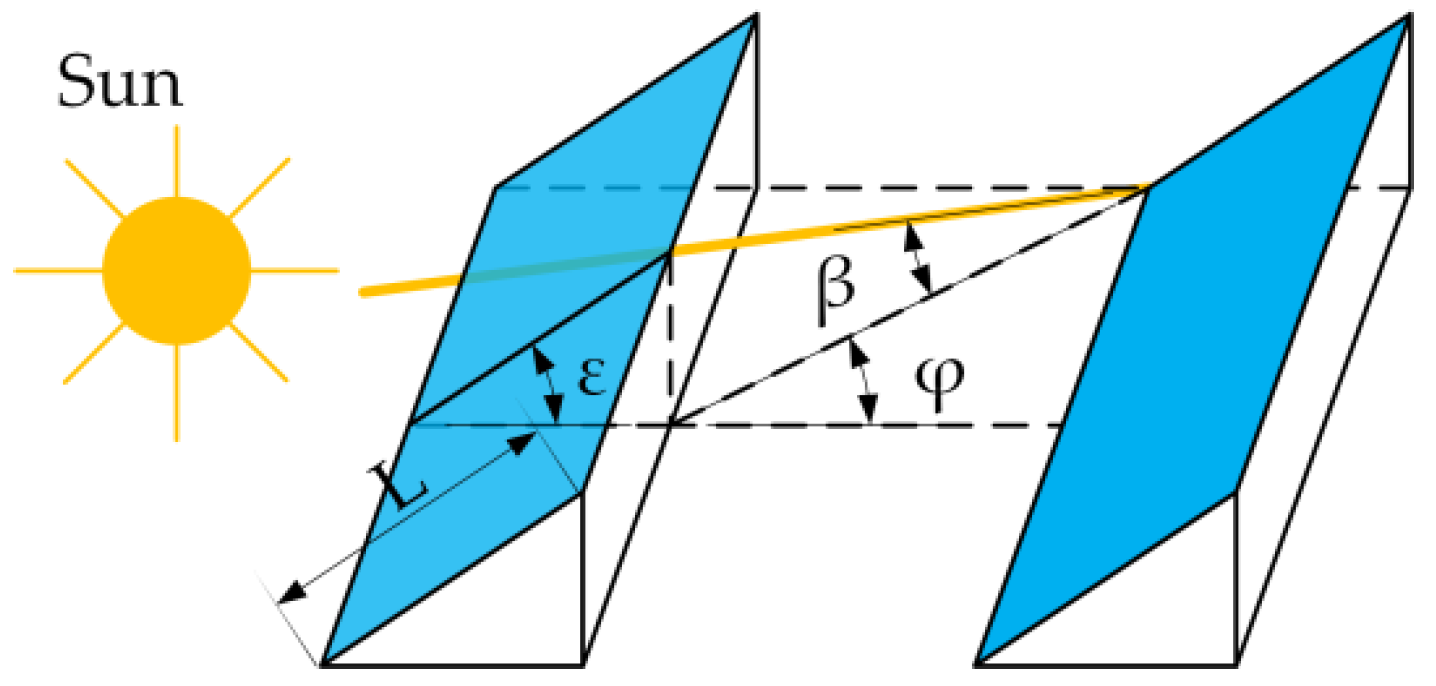
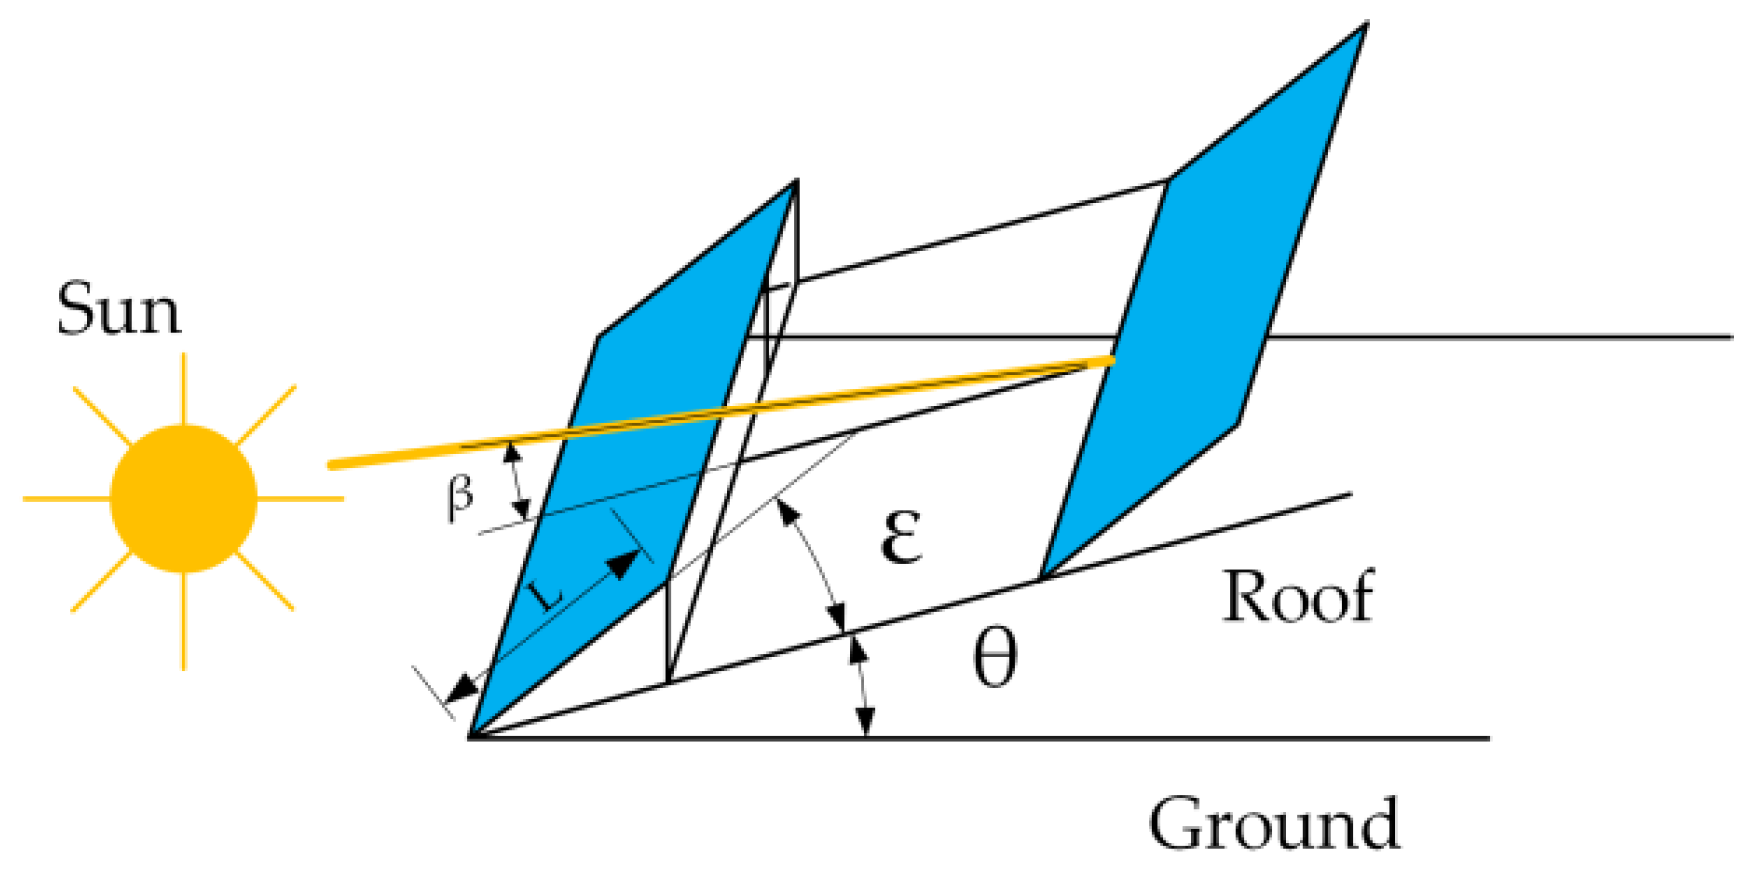
The dimensions of the PV modules used in the present study are 1.755 m (L) × 1.038 m (W) × 0.035 m (T). The shading effect of adjacent PV modules is simplified by assuming that packing factors under scenarios B–E are the same as that under scenario A. For plat rooftops in scenarios A–E, it is assumed that the shadows between adjacent photovoltaic modules can be ignored. In scenarios A–E, the distance between adjacent photovoltaic modules is calculated by Equation (1) to obtain the same intervals. Thus, the potentially installed capacity of the photovoltaic system on the flat rooftops in Tibet University, Qinghai University, and Qilu University of Technology is 11291 kW, 9102 kW, and 3821 kW, respectively. For the pitched rooftops, the potentially installed capacity of PV systems installed under scenario F and scenario G is different due to different installation intervals between adjacent photovoltaic modules. Under scenario F, the potentially installed capacity of the photovoltaic systems on the pitched rooftops in Tibet University, Qinghai University, and Qilu University of Technology is 679 kW, 1283 kW, and 2645 kW, respectively. Under scenario G, the potentially installed capacity of the photovoltaic systems on the pitched rooftops in Tibet University, Qinghai University, and Qilu University of Technology is 628 kW, 1117 kW, and 2455 kW, respectively.
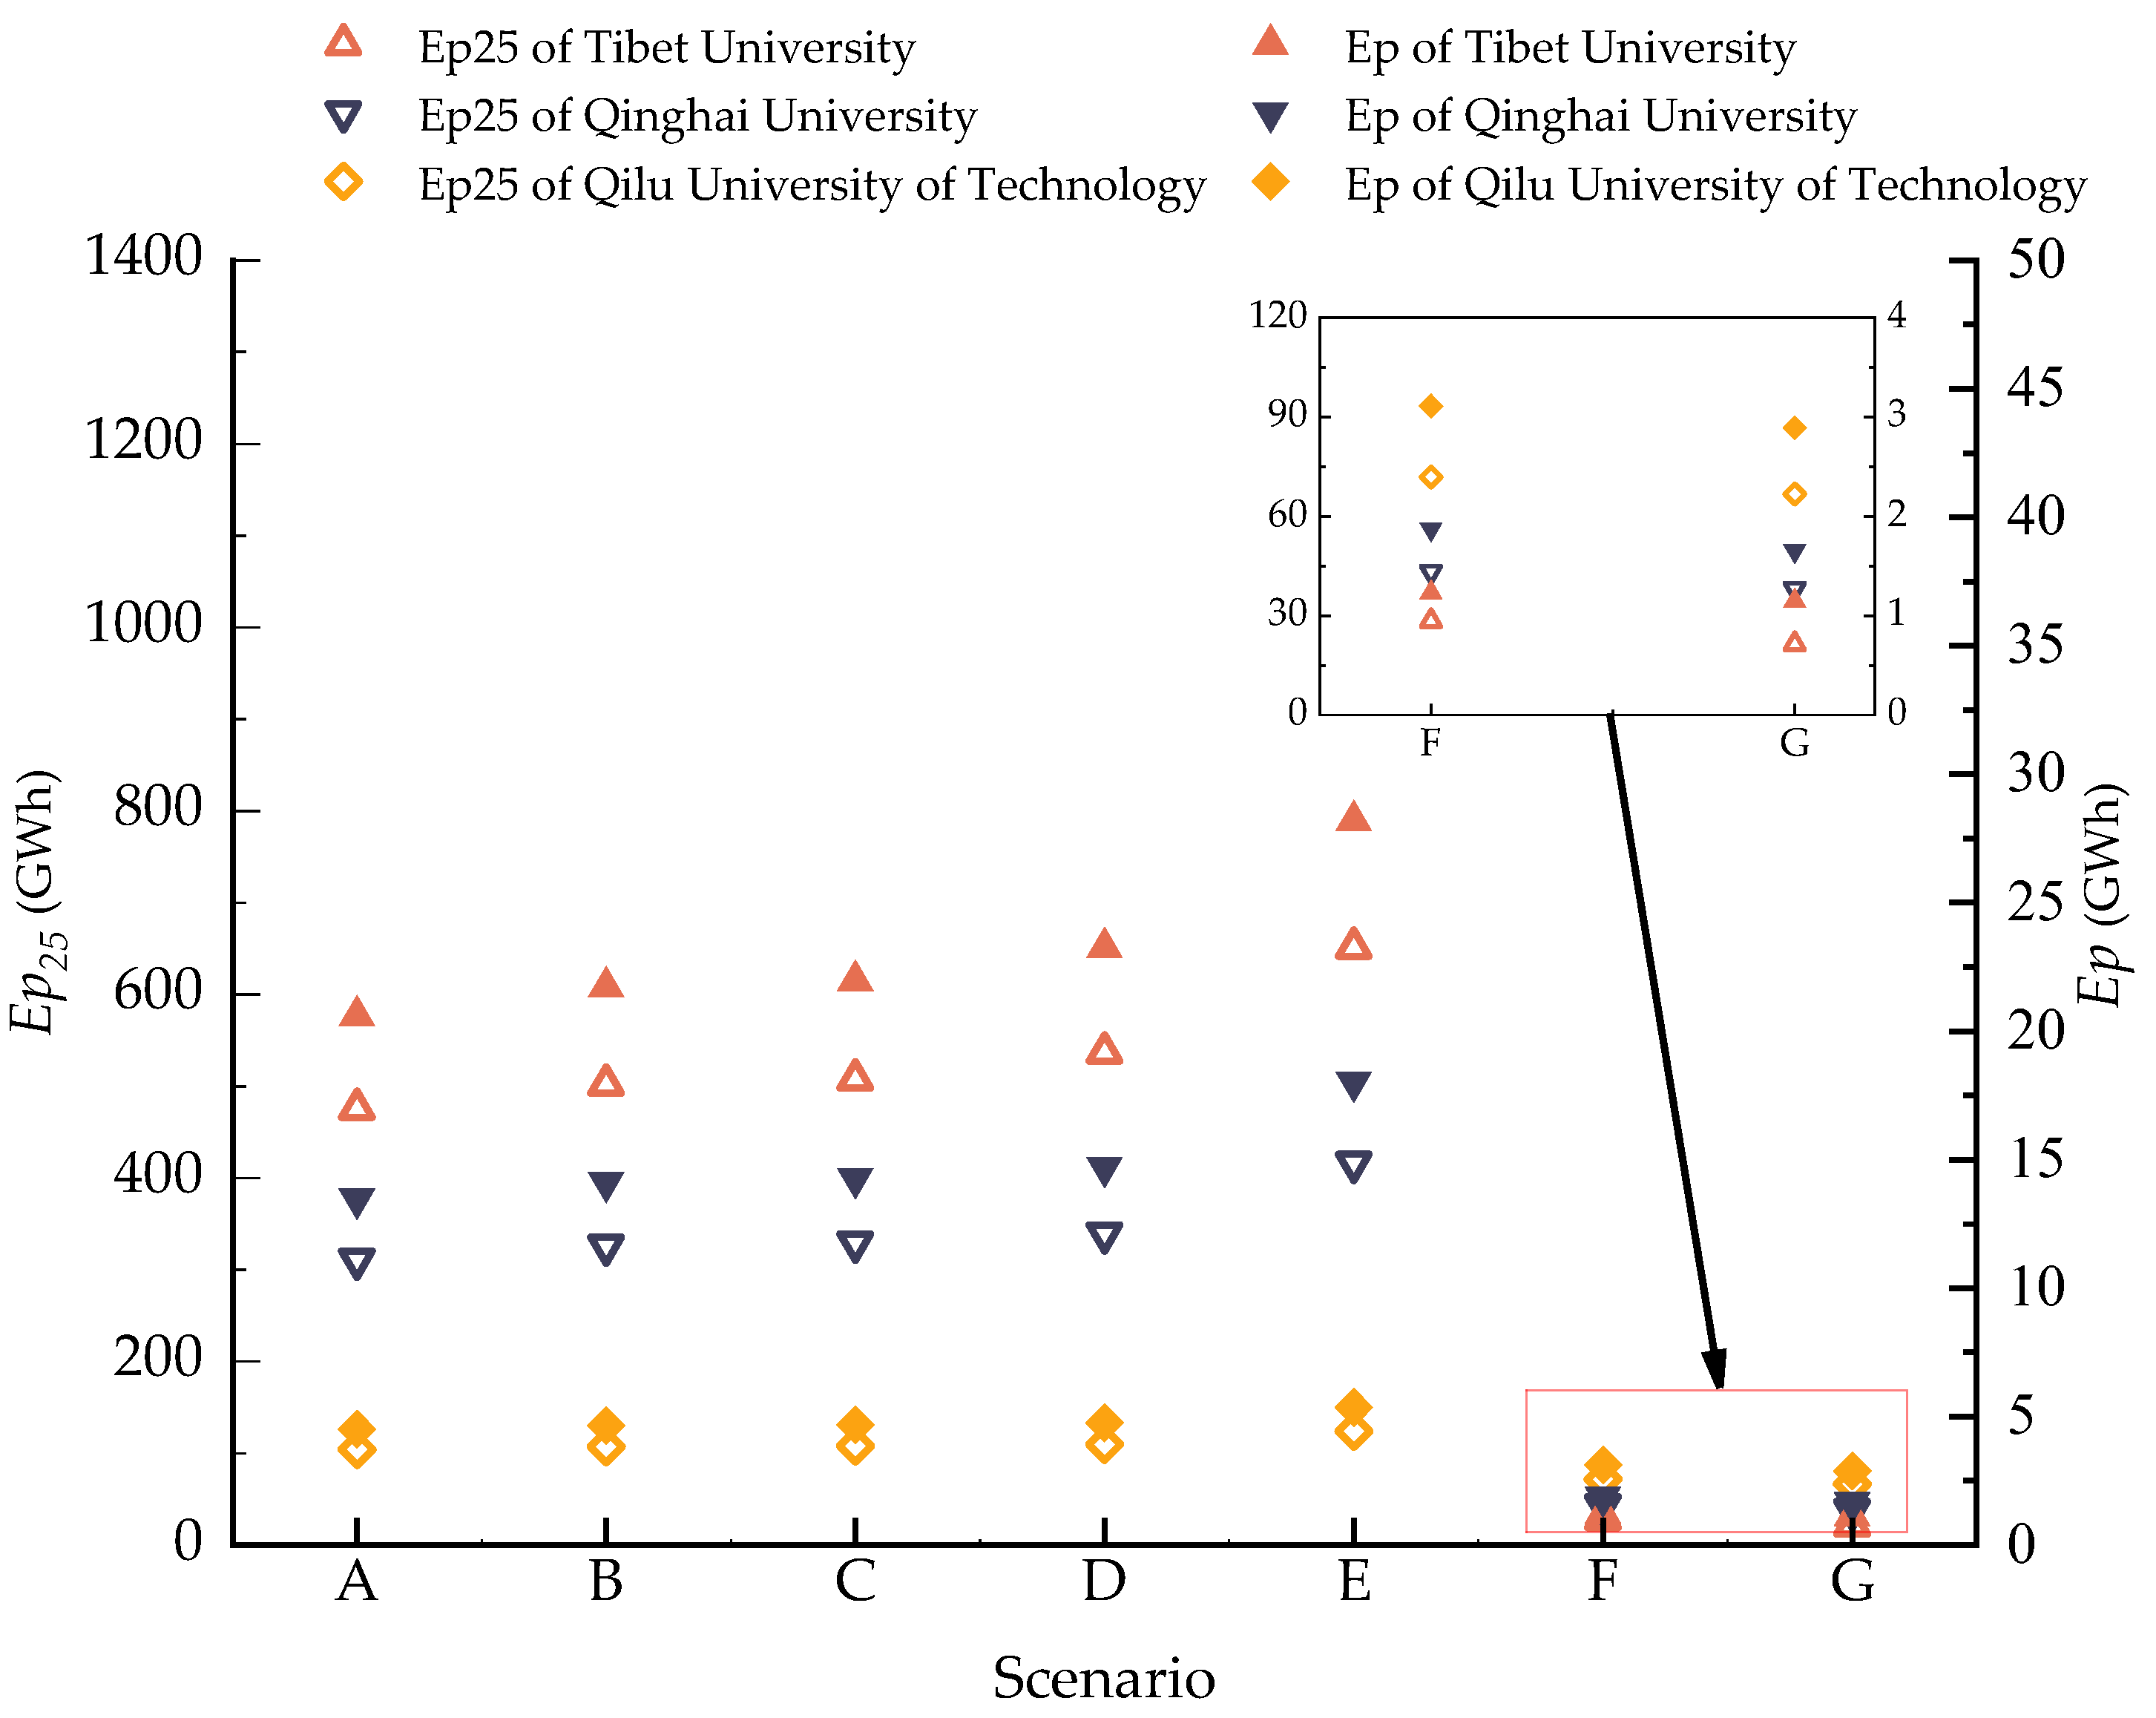
Figure 8 is the PV output during lifetime of three studied universities under seven scenarios. For the same university, the annual power generation and total power generation within a 25-year lifetime under scenario E > scenario D > scenario C > scenario B > scenario A, because the scenario E shows the highest radiation intensity per area under the condition of the same PV-installed capacity. For flat rooftops under scenarios A–E, Tibet University has the highest annual power generation, following by Qinghai University and Qilu University of Technology. This can be attributed to the highest solar radiation intensity and most flat rooftop areas in Tibet University. The maximum of 28.19 GWh, 18.03 GWh, and 5.36 GWh of annual power generation capacity can be obtained in Tibet University, Qinghai University, and Qilu University of Technology, respectively. Under scenario E, the annual power generation and total power generation within 25-year lifetime of both Tibet University and Qinghai University are the highest in comparison with another four configurations, which can also be attributed to the highest solar radiation under scenario E. The same conclusion can be drawn for Qilu University of Technology, but the increase rate is much lower than another two universities due to lower solar radiation.
Annual power generation and total power generation within a 25-year lifetime in scenarios F are slightly higher than those in scenarios G for three study cases due to higher packing factor. Even though the solar radiation both in Tibet University and Qinghai University is higher than that in Qilu University of Technology, the area of the pitched rooftops in Qilu University of Technology is 3.90 times and 2.06 times of that in Tibet University and Qinghai University, respectively. As demonstrated in
Figure 8, Qilu University of Technology presents the highest annual power generation and total power generation within 25-year lifetime for PV systems installed on the pitched rooftops in scenarios F and G, followed by Qinghai University and Tibet University. When the PV systems are installed parallel to the pitched rooftop under scenario F, the annual power generation of Tibet University, Qinghai University, and Qilu University of Technology is 1.23 GWh, 1.88 GWh, and 3.11 GWh, respectively.
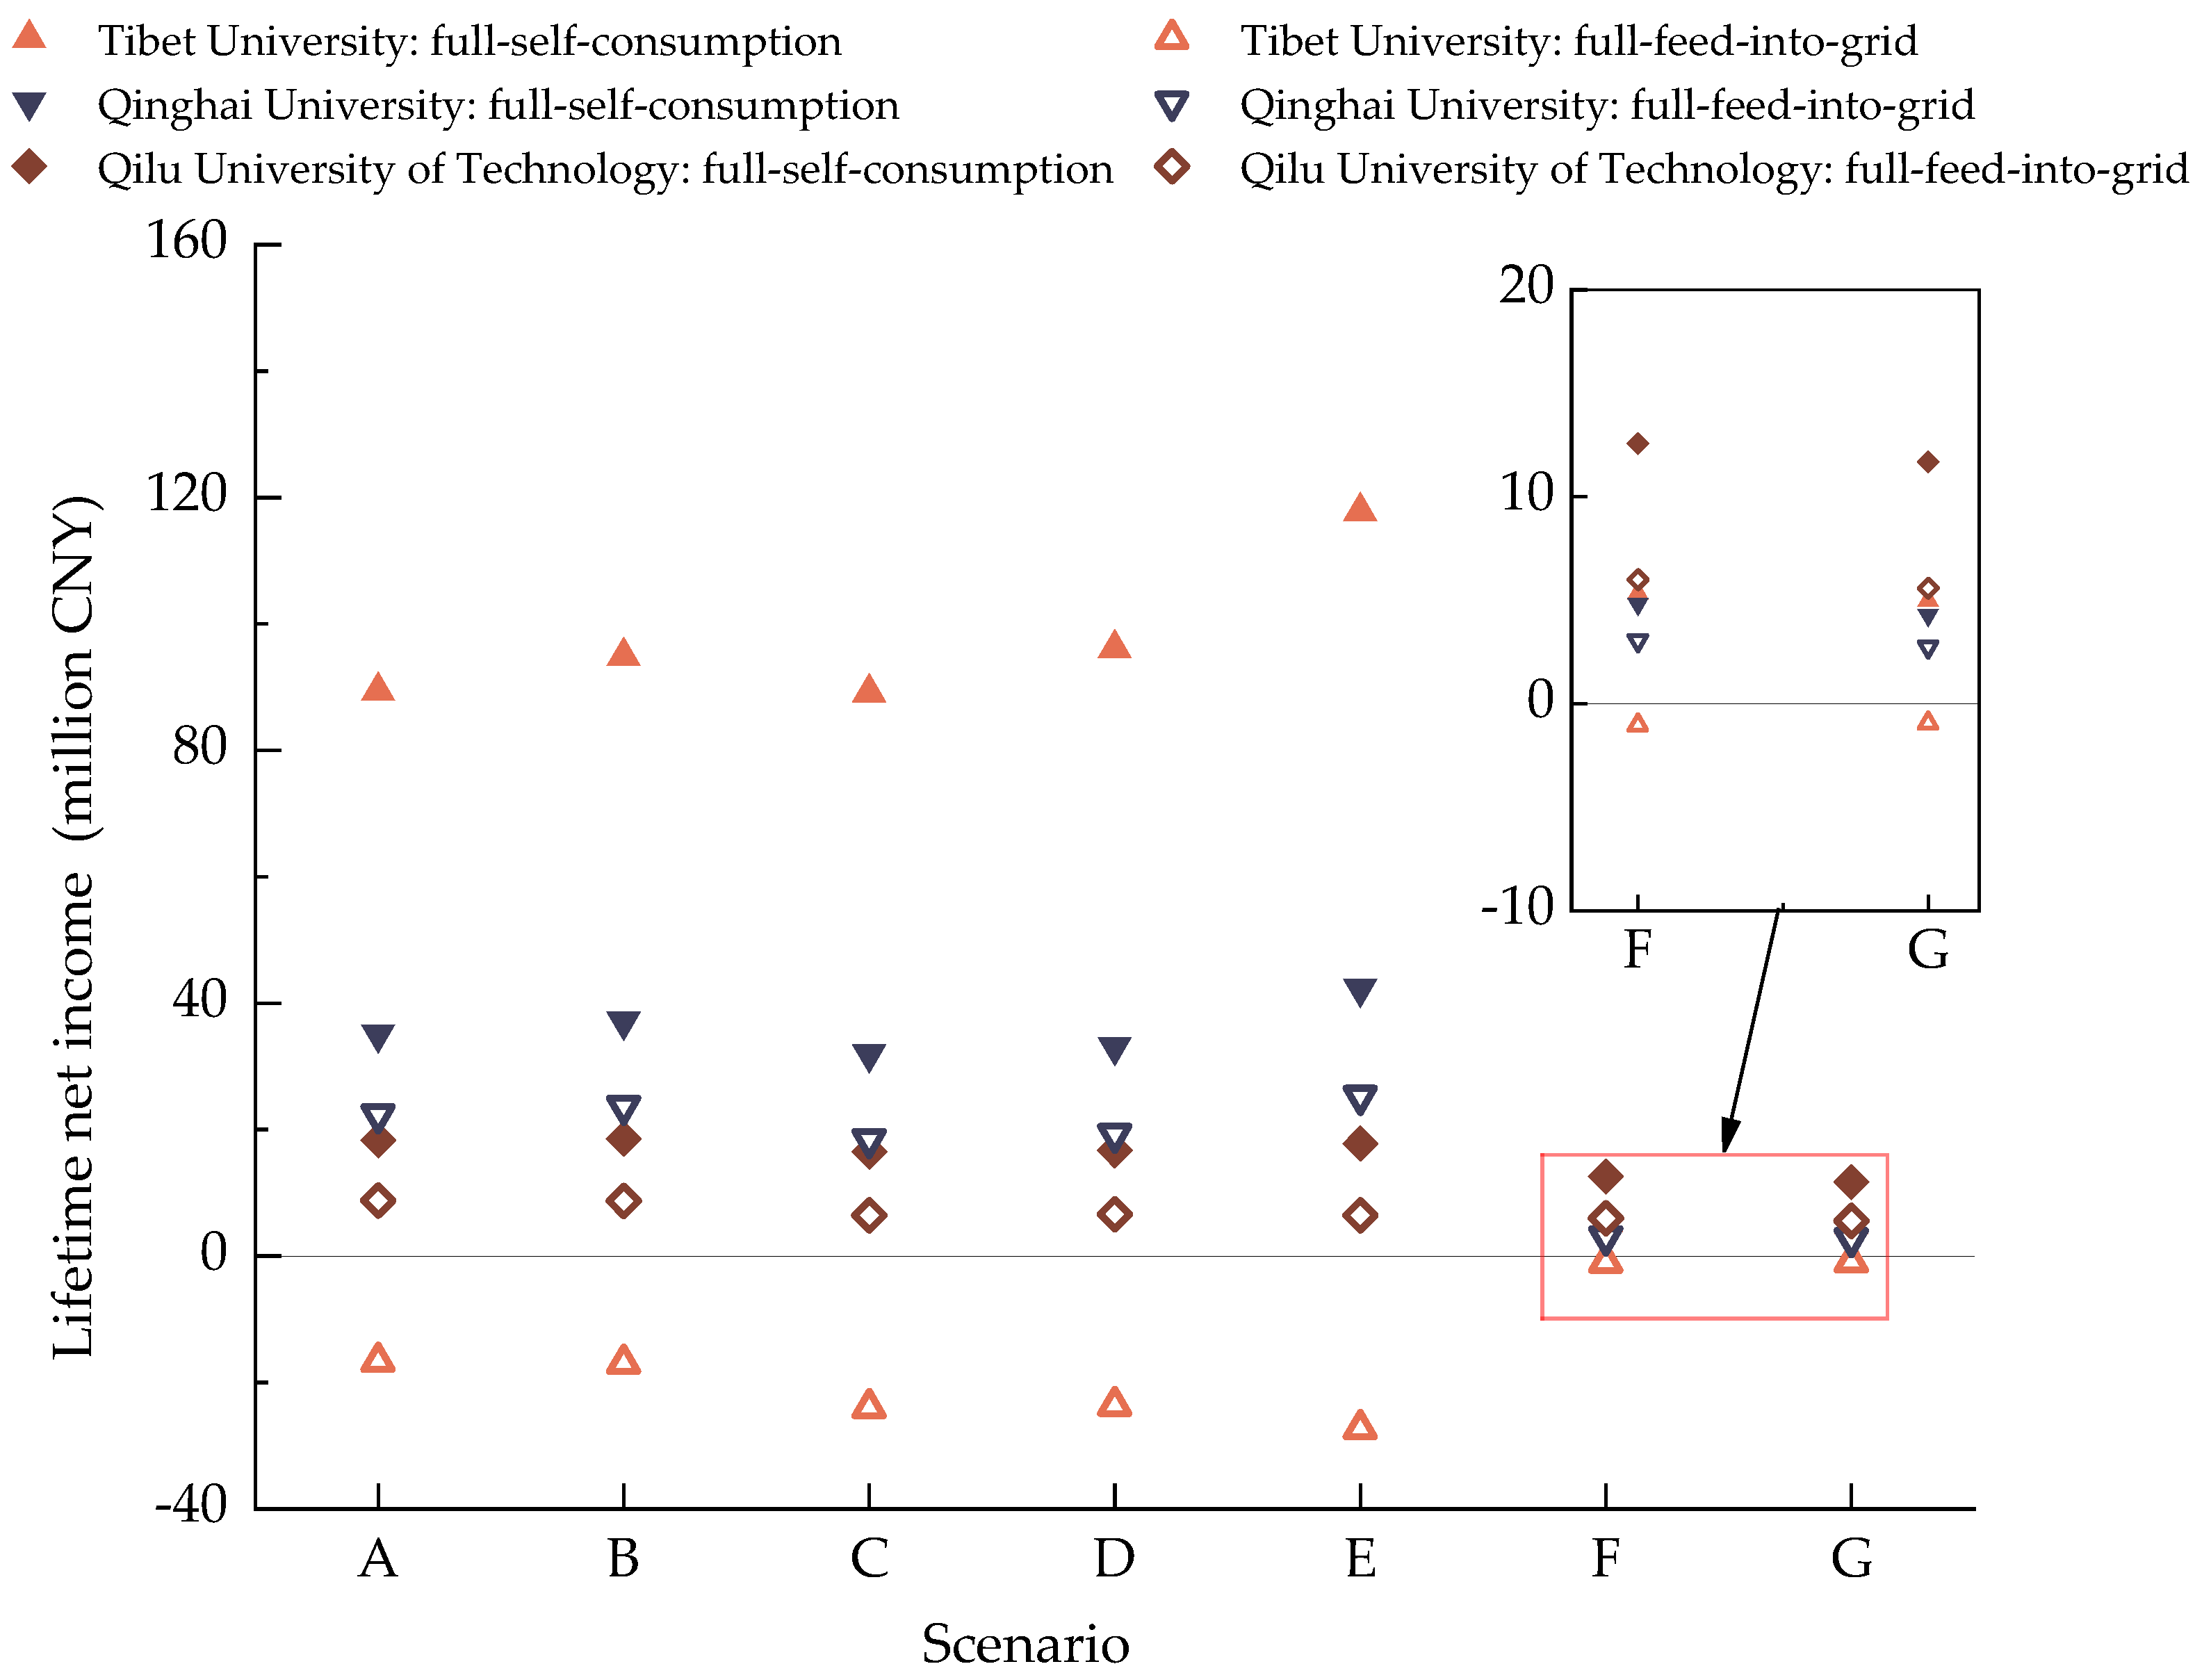
4.3. Lifetime Net Income of PV Systems
Figure 9 presents the net income of PV systems within the lifetime in case of “full-self-consumption” mode and “full-feed-into-grid” mode of three study cases, respectively. For the same study case, the lifetime net income of PV system installed in “full-self-consumption” mode is far higher than that in “full-feed-into-grid” mode due to higher residential electricity tariff. The lifetime net income of PV systems installed in Tibet University even becomes negative in the case of “full-feed-into-grid” mode because the local benchmark price of solar-powered electricity in Tibet is as low as 0.1 CNY/kWh.
As demonstrated in
Figure 9, for PV systems installed on the flat rooftops, both Tibet University and Qinghai University have the highest lifetime net income under scenario E with biaxial tracking system in comparison with another four scenarios, corresponding to 117.85 million CNY and 42.33 million CNY, respectively. However, PV systems installed in Qilu University of Technology shows the highest lifetime net income at 18.56 million CNY under scenario B when the tilt angle is adjusted every half a year. Compared to scenario B, the biaxial tracking system in scenario E enhances the utilization rate of solar radiation at the cost of increasing equipment investment. Tibet University and Qinghai University are, respectively, located in solar Zone I and solar Zone II with relatively abundant solar energy resources to achieve higher lifetime net income. For PV systems installed in Qilu University of Technology located in solar Zone III, the lifetime net income within the lifetime is lower compared with another two study cases due to a limited increase in solar radiation and high tracking investment. The highest lifetime net income can be achieved at and when PV systems are installed in “full-self-consumption” mode for Tibet University, Qinghai University, and Qilu University of Technology, respectively.
For PV systems installed on the pitched rooftops in scenarios F and G, the highest lifetime net income can be achieved under scenario F for all three study cases, except the PV systems installed in “full-feed-into-grid” mode in Tibet University. Although scenario F has features of slightly lower solar radiation and higher investment cost compared to scenario G, the lifetime net income under scenario F is still higher than that under scenario G, attributed to its higher installed capacity for PV systems and more generated electricity. When the PV systems are installed parallel to the pitched rooftop under scenario F, the lifetime net income of Tibet University, Qinghai University, and Qilu University of Technology is 5.33 million CNY, 4.83 million CNY, and 12.58 million CNY, respectively.
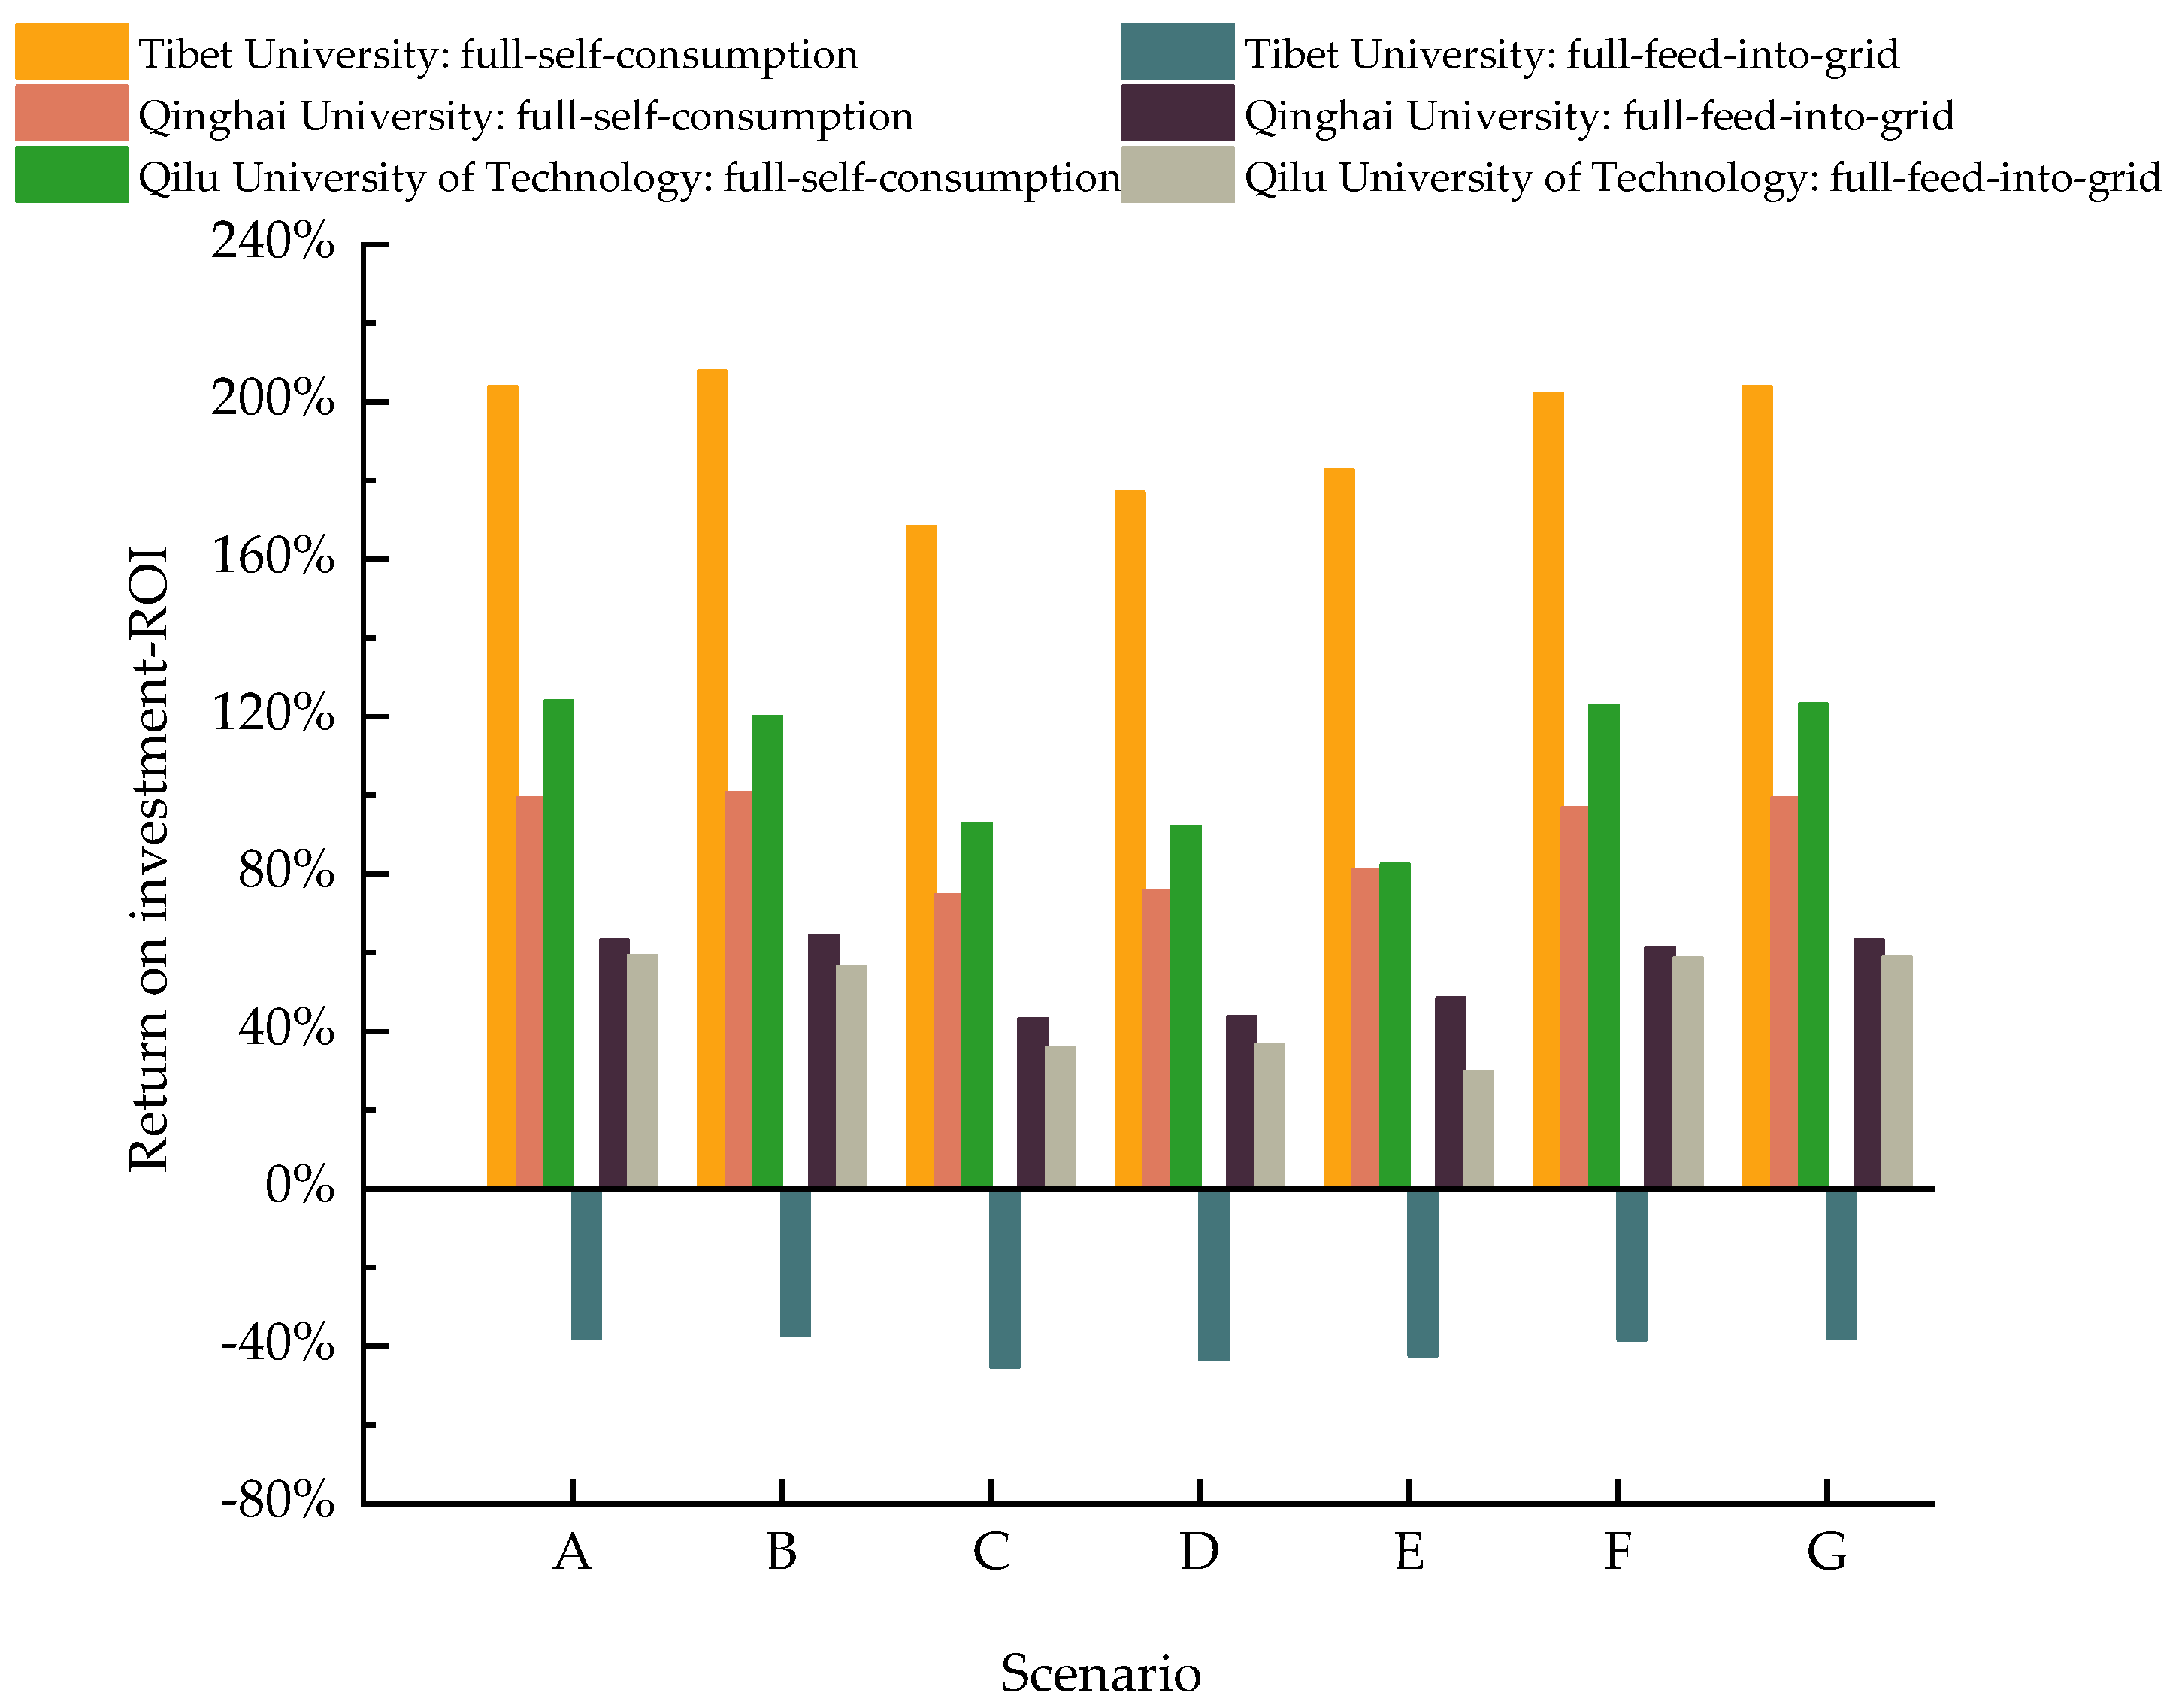
4.4. Return on Investment of PV Systems
Figure 10 presents the return on investment of PV systems under seven scenarios in three universities. Under seven scenarios, the ROI of PV systems installed in “full-self-consumption” mode is always higher in comparison with “full-feed-into-grid” mode, which can be attributed to the fact that the local benchmark price of solar-powered electricity is lower than the residential electricity tariff when the above two modes have the same power generation capacity. Furthermore, the highest ROI can be achieved at 208% and 101% under scenario B when the tilt angle is adjusted twice every year for both Tibet University and Qinghai University. Low frequency adjustment of PV modules corresponds to low operation cost; thus, PV systems installed under scenario B can effectively utilize the solar radiation of these two zones to enhance the ROI. For Qilu University of Technology located in solar Zone III, the highest ROI can be obtained at 124% under scenario A thanks to the lowest investment cost in comparison with other scenarios. When it comes to the PV systems installed on the pitched rooftops, the highest ROI is achieved under scenario G with the lowest PV system capacity and the highest PV power generation per capacity, which is 204%, 99%, and 123% in Tibet University, Qinghai University, and Qilu University of Technology, respectively.
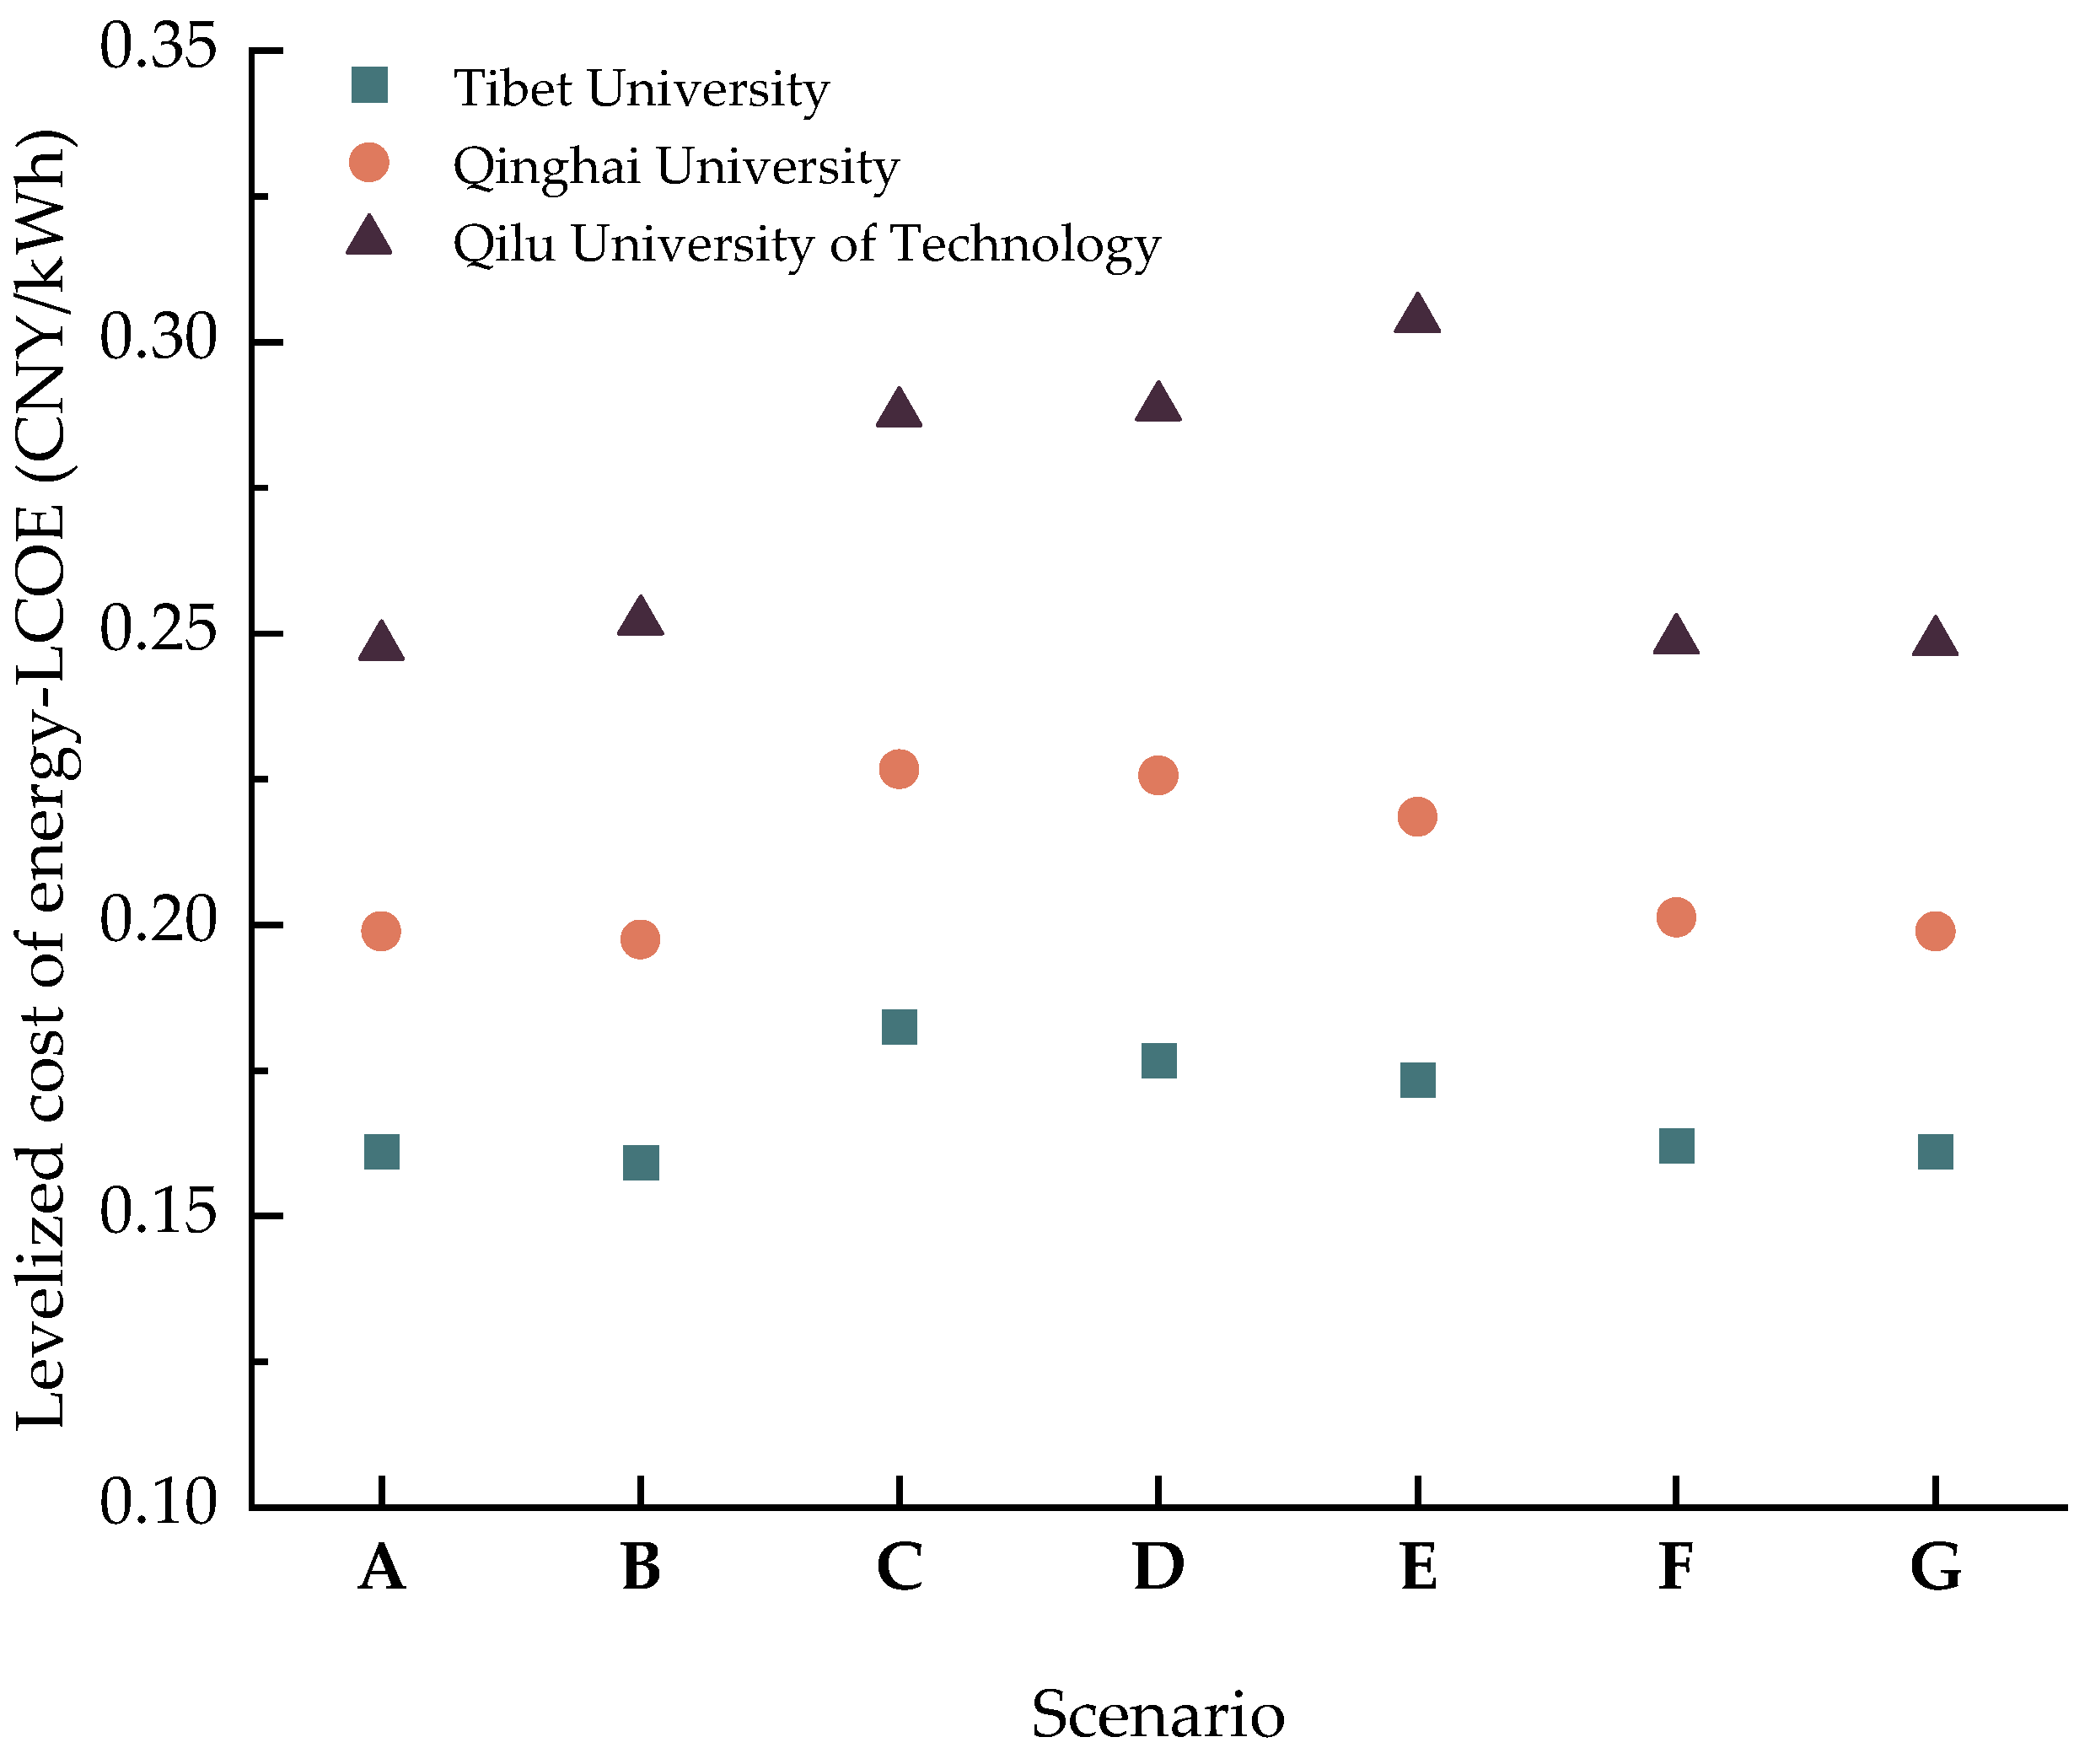
4.5. Levelized Cost of Electricity of PV Systems
Figure 11 shows the levelized cost of electricity of PV systems installed in three universities under seven scenarios. Tibet University and Qinghai University have the lowest levelized cost of electricity in Scenario B, and Qilu University of Technology has the lowest levelized cost of electricity in Scenario A. Under the same scenario, the LCOE of the PV systems installed in Qilu University of Technology is the highest, following by Qinghai University and Tibet University, corresponding to the solar Zone III, II, and I, respectively. The results indicate that the LCOE of the proposed PV systems becomes higher with the decrease in solar radiation.
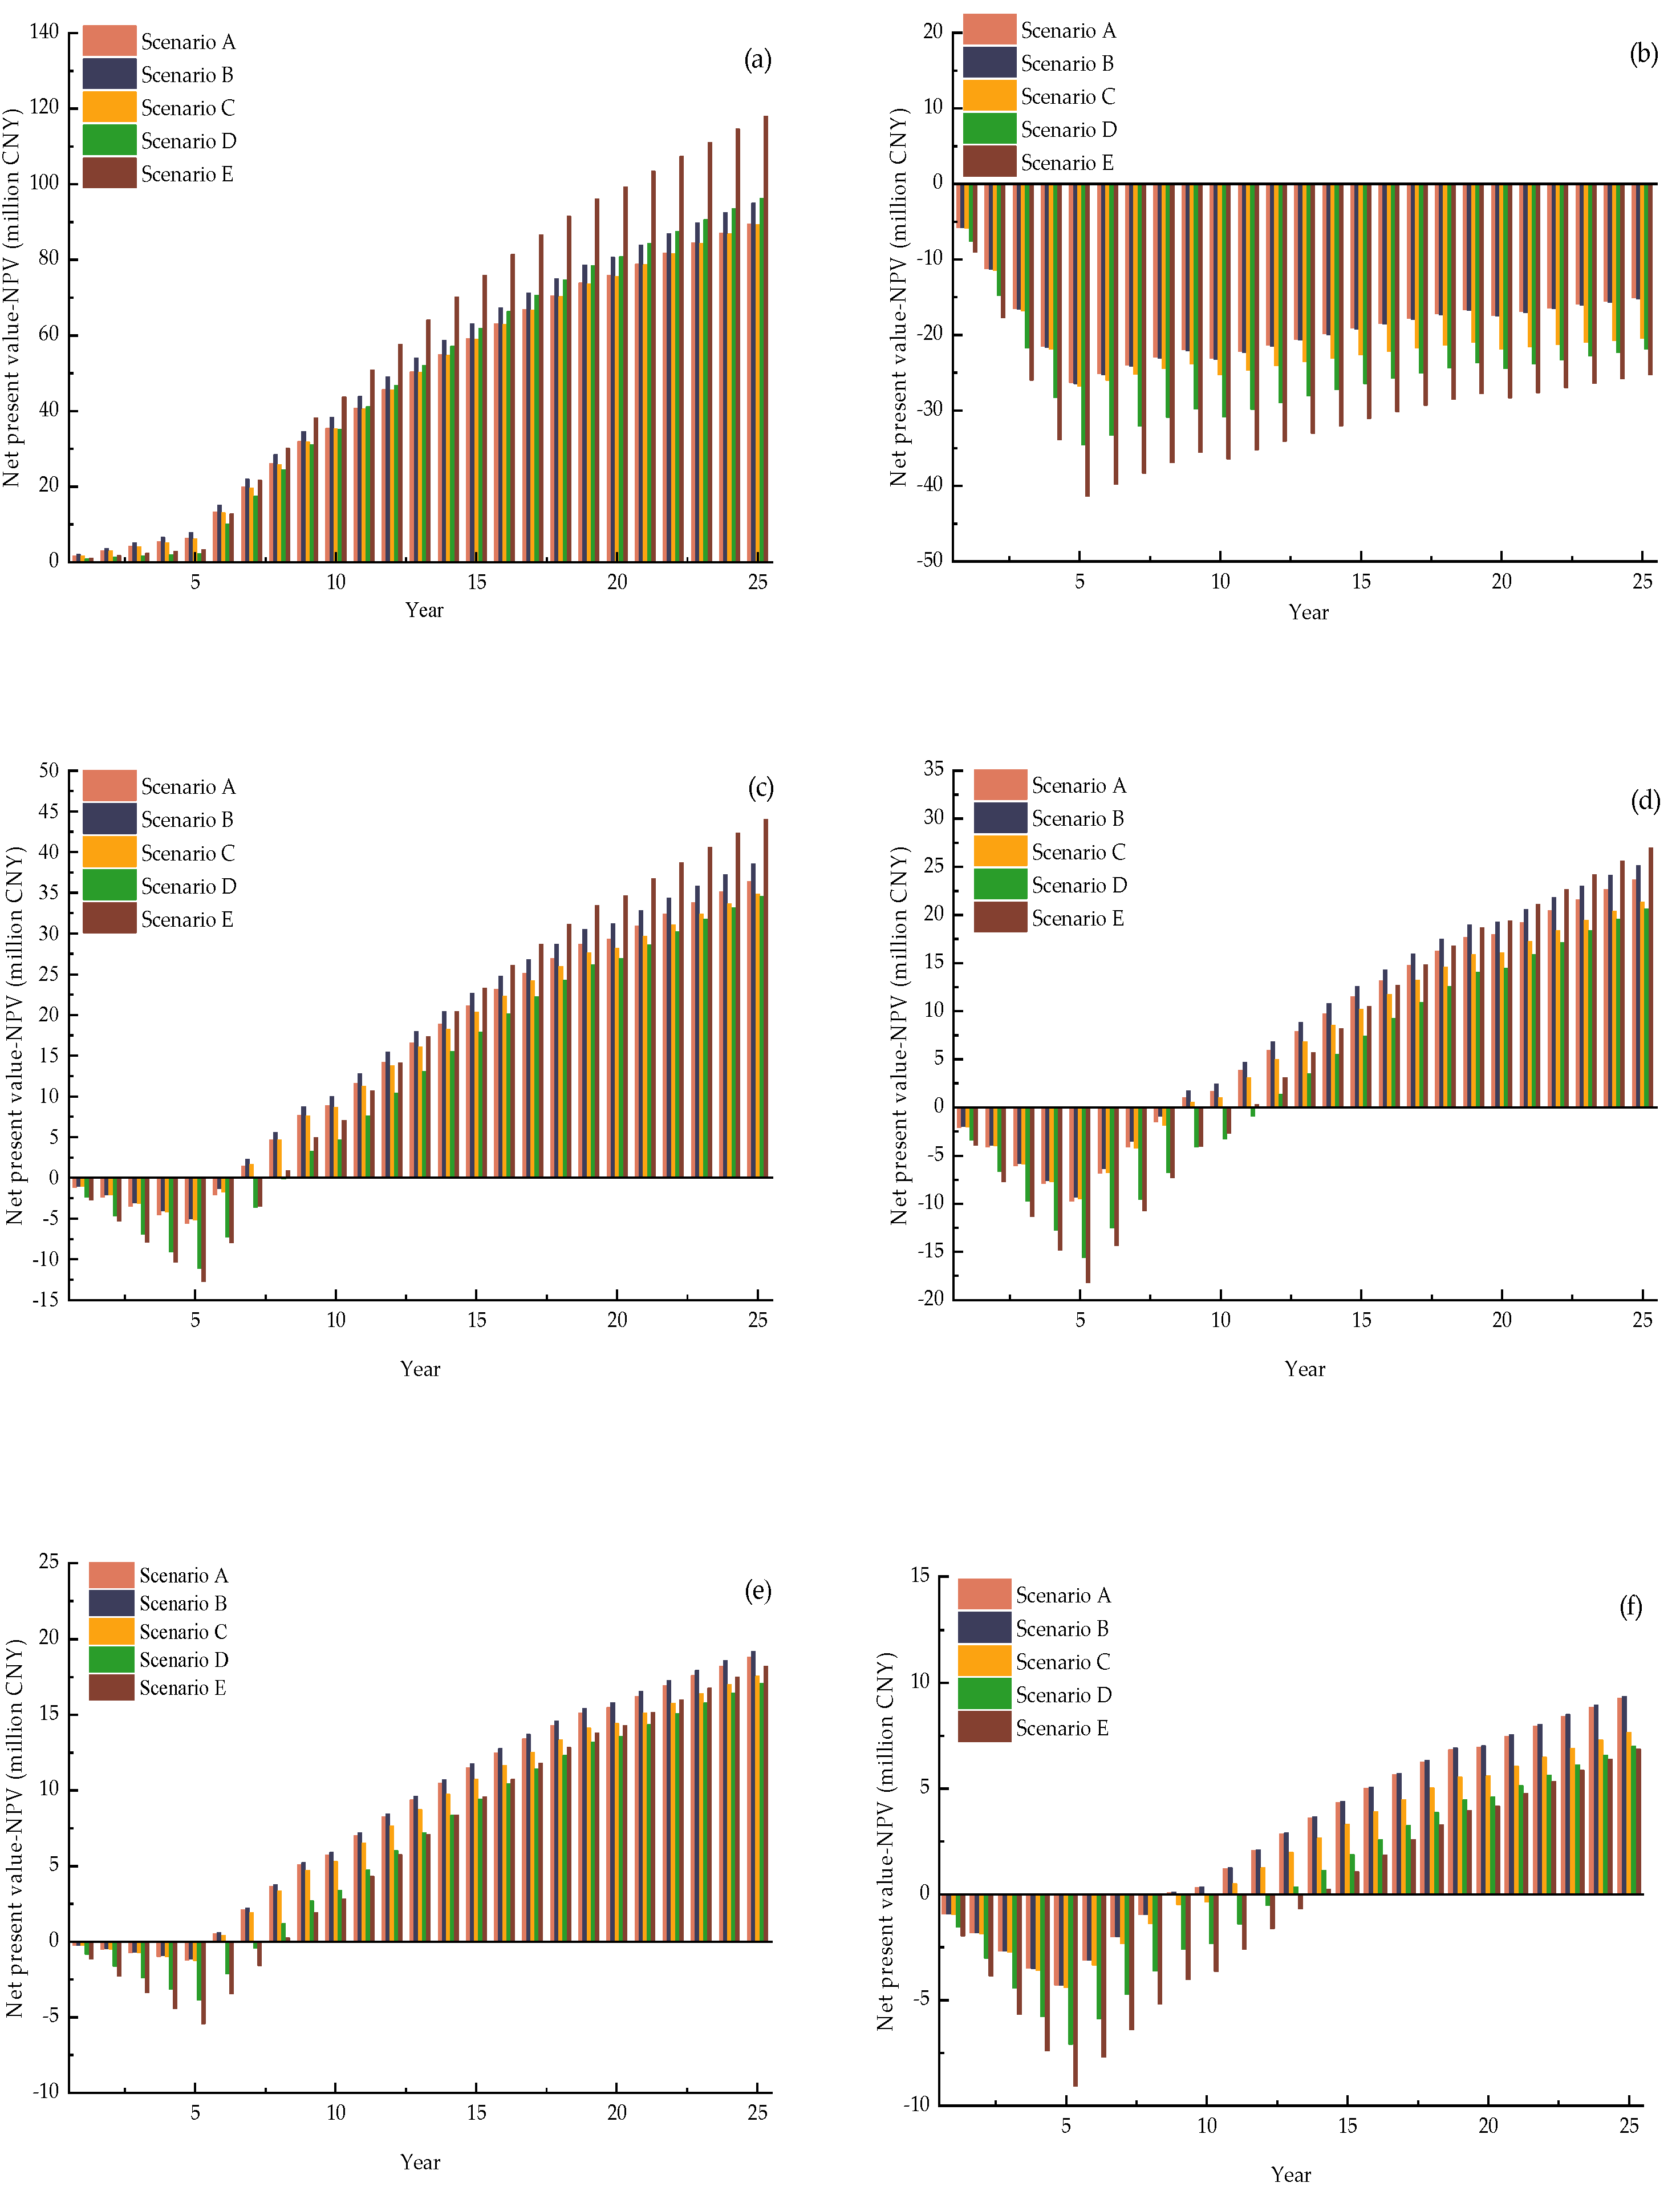
4.6. Net Present Value of PV Systems on Flat Rooftops
NPV of PV systems is mainly affected by the cost, solar radiation, residential electricity tariff, and other factors.
Figure 12 is the NPV of PV systems under five scenarios installed on the flat rooftops of three universities. Obviously, under the same scenario, the payback period of PV systems in “full self-consumption” mode is always shorter than that in “full-feed-into-grid” mode for all three studied universities. As shown in
Figure 12a, the NPV of PV systems installed in Tibet University is always positive in “full-self-consumption” mode, which indicates that the PV systems can recover investment in the first year. However, as shown in
Figure 12b, NPV becomes negative for PV systems installed in Tibet University due to a too-low local benchmark price of solar-powered electricity in “full-feed-into-grid” mode. It can be observed form
Figure 12c that, the NPV of PV systems changes from negative to positive during Year 6–8 based on the scenarios, indicating that the payback period of PV systems installed on flat rooftops in Qinghai University is 6–8 years in “full-self-consumption” mode. In
Figure 12d, the payback period of the same university becomes 8–11 years in “full-feed-into-grid” mode. The same trend can be observed in Qilu University of Technology, but the payback period of PV systems installed on flat rooftops is 5–8 years and 8–13 years in “full-self-consumption” and “full-feed-into-grid” mode, respectively.
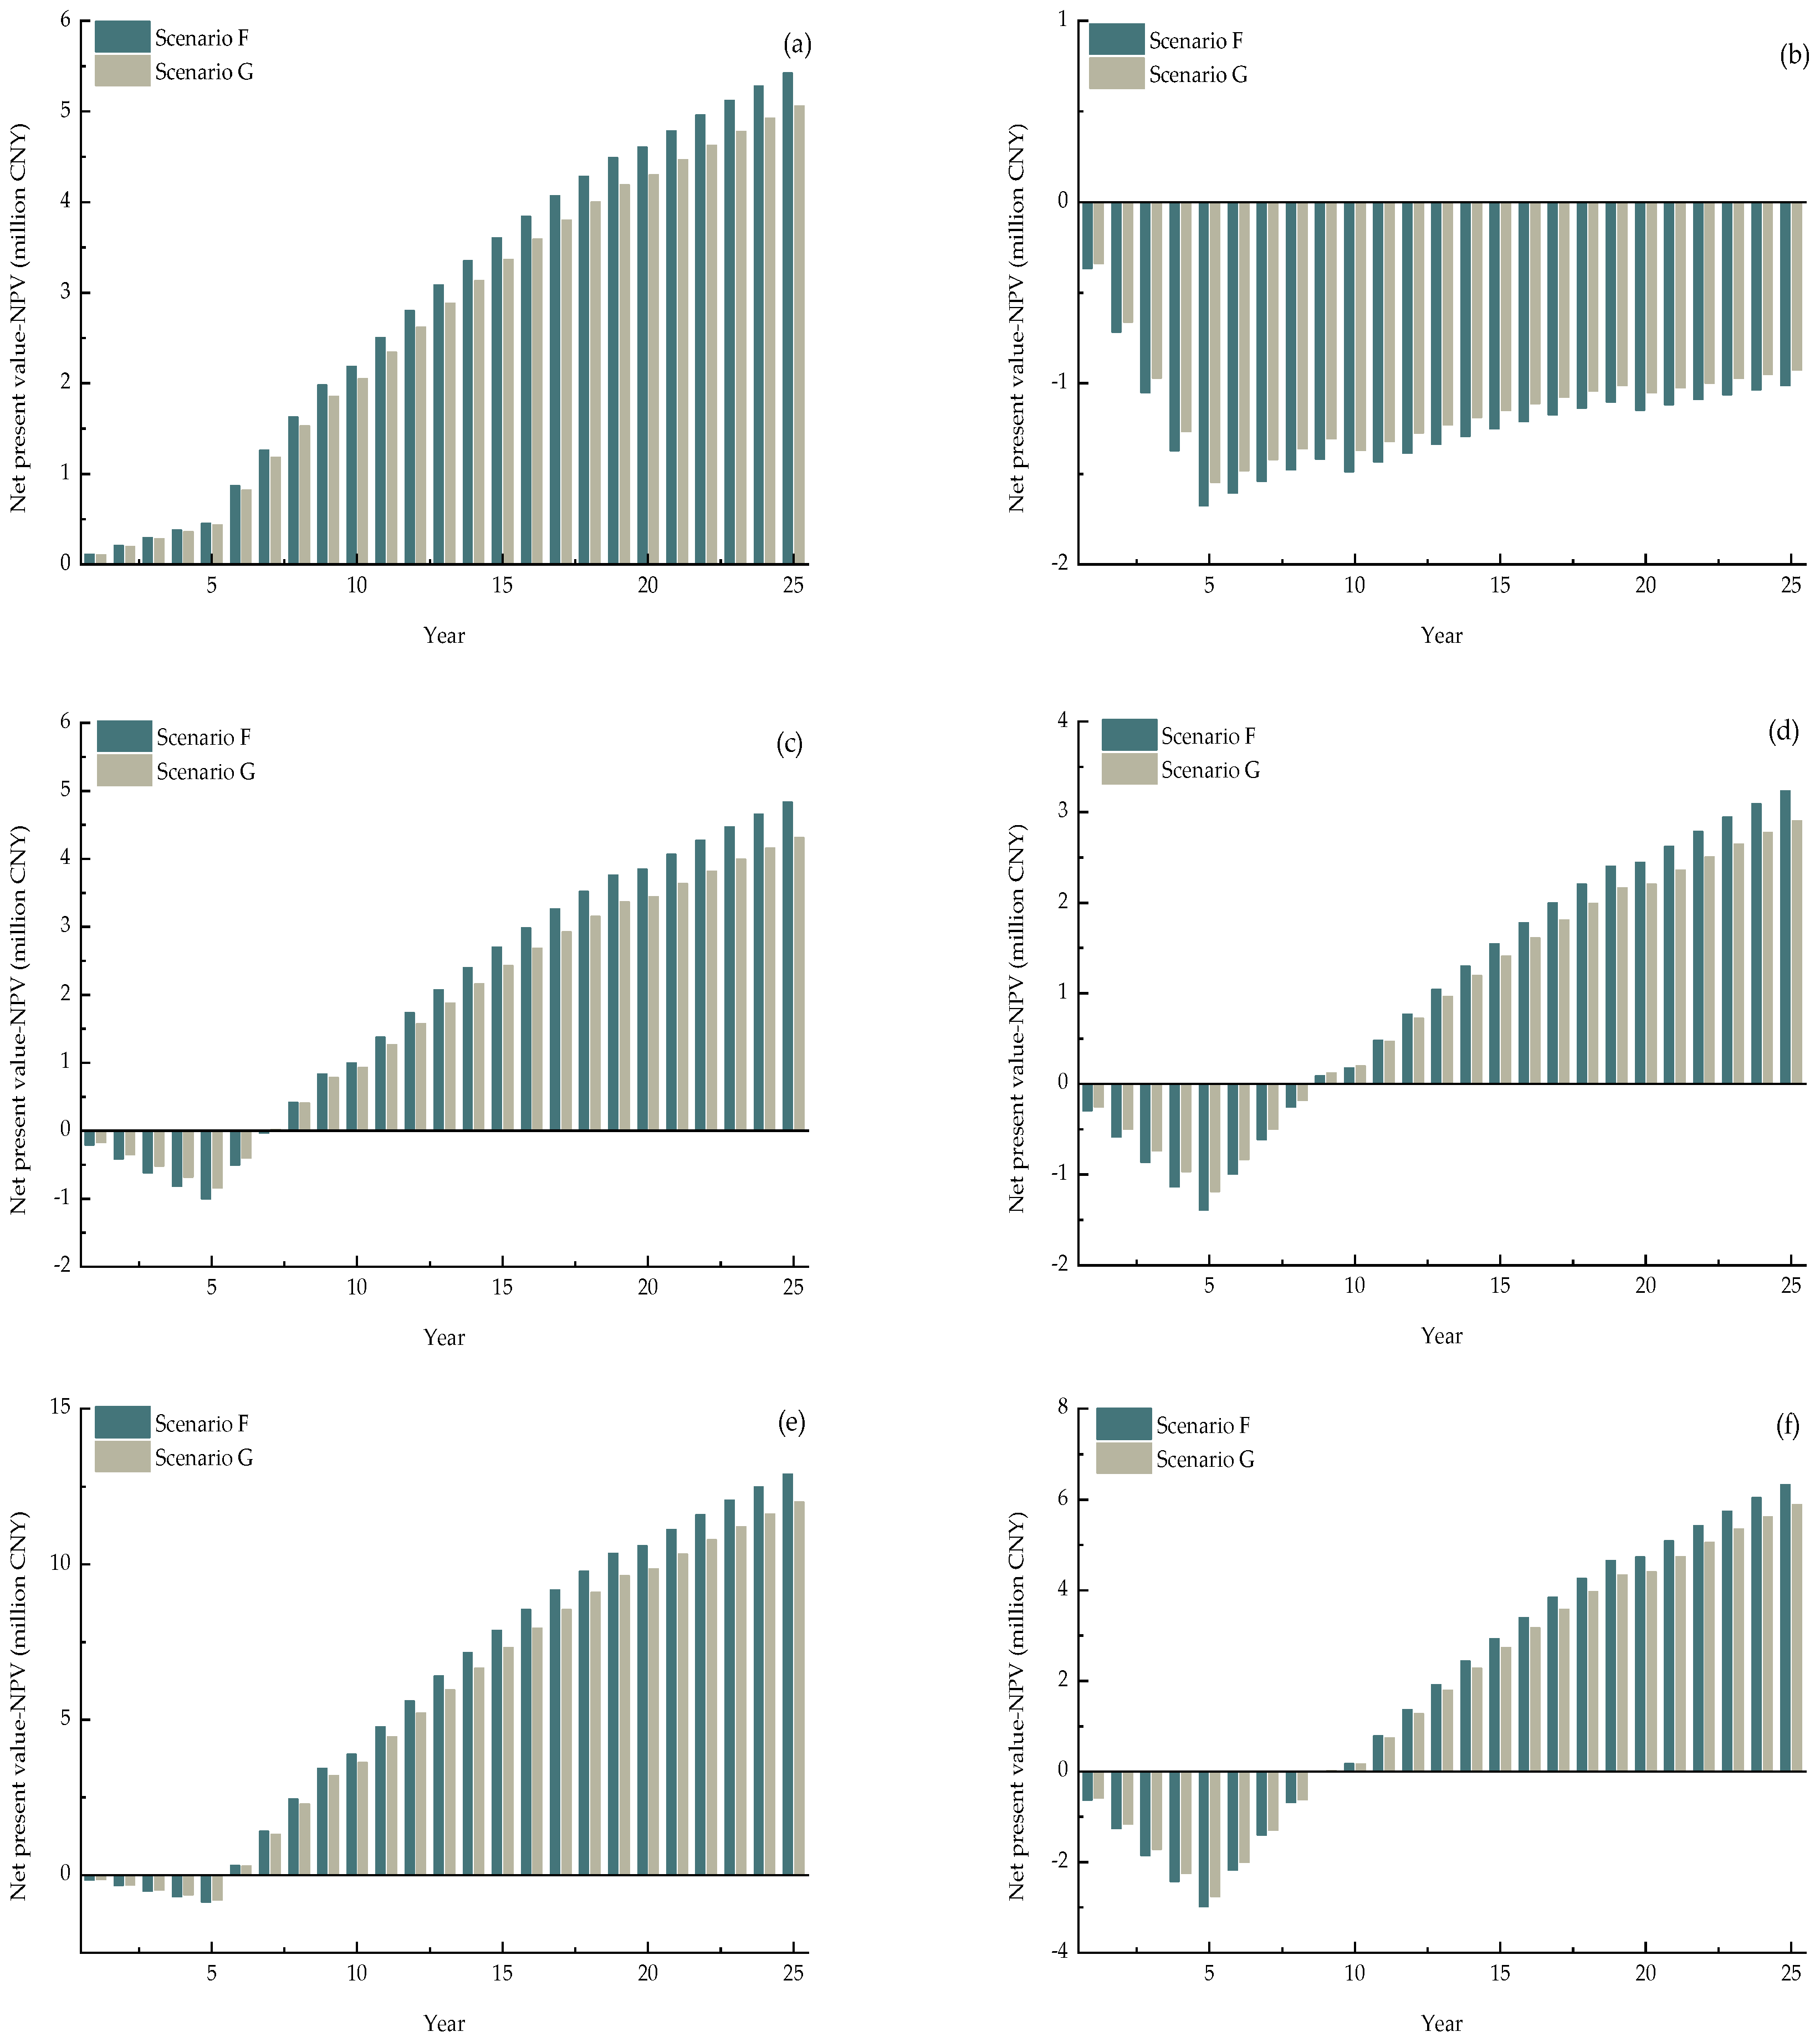
4.7. Net Present Value of PV Systems on Pitched Rooftops
Figure 13 is the NPV of PV systems installed on the pitched rooftops of three universities. Similarly, like in
Figure 12, the payback period of PV systems in “full self-consumption” mode is still always shorter than that in “full-feed-into-grid” mode for all three studied universities both under scenarios F and G. In “full self-consumption” mode, the payback period for PV systems installed in Tibet University, Qinghai University, and Qilu University of Technology is 1 year, 6–7 years, and 5 years, respectively. In “full-feed-into-grid “ mode, the payback period for PV systems installed in Qinghai University and Qilu University of Technology is both 8 years.
Figure 13b shows that NPV is always negative for PV systems on pitched rooftops of Tibet University, due to a too-low local benchmark price of solar-powered electricity in “full-feed-into-grid” mode.

 ,
, 


