

A Numerical Investigation of PVT System Performance with Various Cooling Configurations

1
Mechanical Engineering Department, College of Engineering, Jouf University, Sakaka 72341, Saudi Arabia
2
Mechanical Engineering Department, Faculty of Engineering, Suez University, Suez 43533, Egypt
Energies 2023, 16(7), 3052; https://doi.org/10.3390/en16073052
Submission received: 23 January 2023
/
Revised: 15 March 2023
/
Accepted: 23 March 2023
/
Published: 27 March 2023
(This article belongs to the Section A2: Solar Energy and Photovoltaic Systems)
Abstract
:A numerical analysis of a photovoltaic-thermal (PVT) hybrid system with different cooling configurations is developed. The PVT system consists mainly of a photovoltaic panel and cooling fluid channels. The developed model is used to simulate the system PVT and to study the influence of different cooling patterns, operating and weather conditions on the system performance and to evaluate its energy and exergy efficiency. Five cooling patterns were tested: the first is cooled by air above the panel and water below the panel; the second is air cooling from above and below; the third is cooled by air above the panel only; the fourth is cooled by air below the panel only; and the fifth is cooled by water below the panel only. It was shown that the results of the developed model are consistent with the results of other published works. The performance of the PVT system was analyzed under the weather conditions of Sakaka Al-Jouf, KSA, in summer and winter. It was found that the best cooling pattern is the fifth and the worst is the second. The average panel temperature of (pattern 5) is 21 °C lower than the average panel temperature of pattern 2. The highest efficiency of total energy is 90% when water is used as coolant at the bottom of the panel and air at the top (pattern 1). The lowest efficiency of the total energy of the panel is 34% when the coolant is air at the bottom of the panel (pattern 4). The electrical energy efficiency, total energy efficiency, and total exergy efficiency are strongly influenced by the water flow rate and ambient temperature, while the effect of solar intensity is insignificant.
1. Introduction
In the last decade, the use of (PVT) systems has increased due to the increasing demand for electrical and thermal energy. Much research has focused on the performance of PVT systems [1]. The PVT system generates both thermal and electrical energy that can be used in many applications such as household, space heating and preheating. Garg et al. have conducted detailed analytical and experimental studies on PVT hybrid air-liquid heating systems since the early 1990s over a 10-year period [2,3,4,5,6,7,8,9,10]. Using a steady-state model from PVT/air, they found that the double-glass cover reduced heat losses but increased transmission losses. Thus, the decision to use a single glass cover or double glass cover depends on the temperature range used in the proposed system [6]. Sopian et al. investigated the performance of single and double pass PVT/air collectors based on a steady-state model [11], and an experimental device was presented [12]. The results showed that the performance of the double-pass is better than the single-pass because the temperature of the front cover and the cooling of the solar cell are reduced.
Prakash developed a transient model to compare the performance of air or water collectors PVT [13]. His results show that the thermal efficiency of the air collector is lower than that of the water collector. O. Rejeb et al. studied a dynamic model of the PVT water collector [14]. It was found that as the number of glass covers increases, the thermal efficiency increases and the electrical efficiency decreases, so choosing a single glass cover is better to achieve compatibility between the two efficiencies. The results show that the electrical efficiency is increased by increasing the packing factor and the heat conduction coefficient between the photovoltaic cell and the plate absorber, but it decreases by increasing the solar radiation and the water inlet temperature. However, the thermal efficiency increases with the increase of solar radiation and heat conduction coefficient between the photovoltaic cell and the plate absorber. However, it decreases with an increase in packing factor and water inlet temperature [14].
An experimental study on PVT water system by Al Harbi et al. [15] was conducted in Riyadh, Saudi Arabia. It was found that, in summer, the electrical efficiency decreased as the ambient temperature increased, although the thermal efficiency increased. In winter, the electrical efficiency increased as the ambient temperature decreased, although the thermal efficiency decreased. An experimental and numerical analysis of the PVT water collector was performed by Francesco et al. [16]. The analysis showed that solar radiation plays a more important role than water inlet temperature in determining the system efficiency. Imtiaz et al. [17] present a transient mathematical and CFD model of a two-fluid nano-engineered PV/T system. They investigated metal oxide nanoparticles (SiO2, Al2O3 and CuO) with different concentrations in the base fluid (water). The results showed that the CuO nanofluid had the highest thermal conductivity. It was found that the highest efficiency was obtained for the CuO nanofluid plus air compared to water plus air, nanofluid and water. The performances of the bi-fluid system PVT (water-air) and the PVT water system are presented using a numerical model developed by El Manssouri et al. [18]. The analysis showed that the bi-fluid system PVT has a higher thermal efficiency than the water-based system PVT. However, the electrical efficiency of the two configurations does not seem to differ. Viet et al. [19] developed a numerical simulation program to evaluate and compare four PVT module models in terms of exergy and energy efficiency. The first model consists of an air duct above the PV cell and a spiral water pipe below the cell, the second model consists of an air duct above the PV cell and a parallel water pipe below the cell, the third model consists of spiral water pipes below the cell, and the fourth model consists of parallel water pipes below the cell. The results show that the first model has the highest thermal efficiency of 54.85% and the highest energy and exergy efficiencies of 57.85% and 15.67%, respectively. The third model has the highest electrical efficiency of 13.67%. Charalambous et al. [20] classified the PVT system into two categories: conventional and advanced systems PVT. The conventional PVT system is classified into air, water, and air-water based on the type of heat transfer medium [20,21,22]. The advanced PVT system is classified based on the heat transfer techniques for nano-liquid, refrigerant, phase change material (PCM), concentrated and heat pipe integration of PVT systems with different infrastructure. Fuentesa et al. [23] compared the actual performance of the PVT system with that of a PV-only system. Their results showed that the commercial PVT has lower performance () than PV () and thermal systems separately. Souliotis et al. [24] found that the maximum electrical efficiency is 13.5% and the maximum thermal efficiency is 57% when the cooling water temperature is reduced. Rejeb et al. [14] developed a model for PVT systems and studied the effects of solar intensity, water temperature, and number of glass covers on thermal and electrical efficiency. It was found that the maximum electrical and thermal output were 8119 kWh/m2 and 49.44 kWh/m2, respectively. Joshi et al. [25] studied the performance of PVT air collectors and found that the instantaneous total energy and total energy efficiency ranged from 12–15% and 55–65%, respectively. Fakouriyan et al. [26] studied the performance of PVT system under real weather conditions with water as coolant. The results show that the efficiency of the PV system without cooling water is 10.9%; with cooling water, the total efficiency of energy, thermal energy and electrical energy are 61.7%, 49.4% and 12.3%, respectively. A numerical and experimental study was conducted by Omer et al. [27]. They found that the total efficiency of the PVT system with a glass cover is 7% higher than the total efficiency without a glass cover. Mingke et al. [28] demonstrated a photovoltaic-photo thermal-radiative cooling system (PV-PT-RC) that can generate electrical and thermal energy with a total efficiency of 40.4% to 56.9% and provide 2.90 MJ of chilled water during the day. Manokar et al. [29] presented a review of solar distillation systems using PVT collectors and found that the daily production is 6–12 kg/m2. Finally, a hybrid PVT system produces more thermal and electrical energy than the same area covered partly with PV only and partly with a thermal collector only. This is the main advantage of the PVT collector according to Zondag et al. [30].
In the present work, a comparative study of hybrid PVT systems with different cooling channel configurations and different coolants is developed to estimate the electrical and thermal performance. The main objective of the current work is to develop a numerical model that simulates the possible patterns of the PVT system. The developed model will be compared with other published work. It will also be investigated how the system patterns affect system performance and how different weather and operating conditions affect system performance.
2. PVT System Details
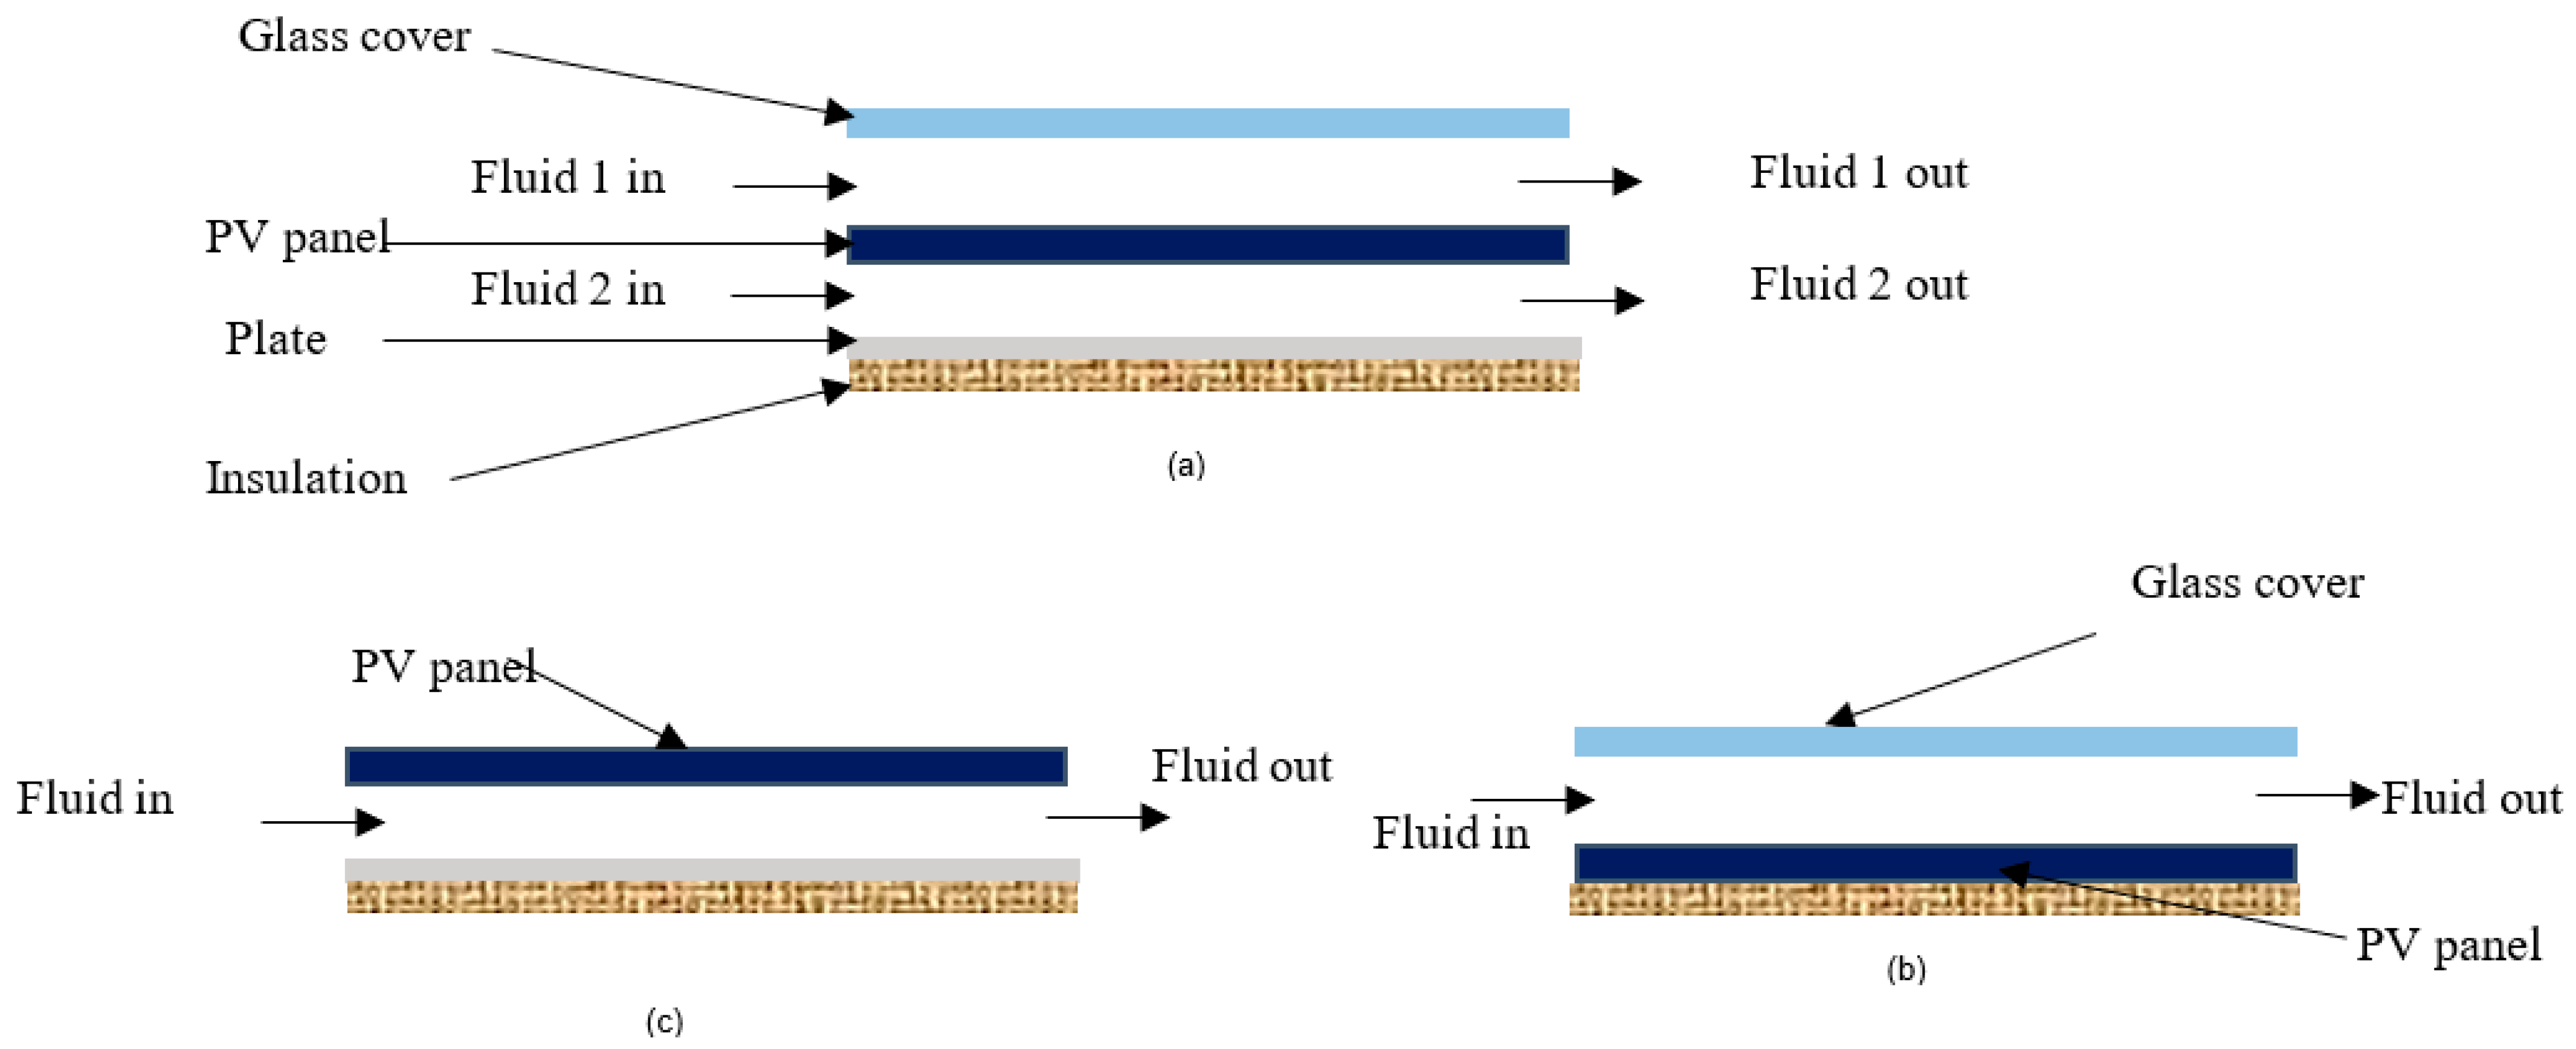
Figure 1 displays an illustrative diagram of various PVT system patterns.
The PVT system in Figure 1 is configured in the following ways:
- Two fluids are used to cool the PV panel, one on top and one on bottom.
- Air is on the top side, and water is on the bottom side. (Pattern 1)
- Air is present on both the top and bottom sides. (Pattern 2)
- One fluid (water or air) is used as coolant for PV panel.
- Air is on the top side. (Pattern 3)
- Air is on the bottom side. (Pattern 4)
- Water is on the bottom side. (Pattern 5)
3. Mathematical Model
3.1. Energy Model
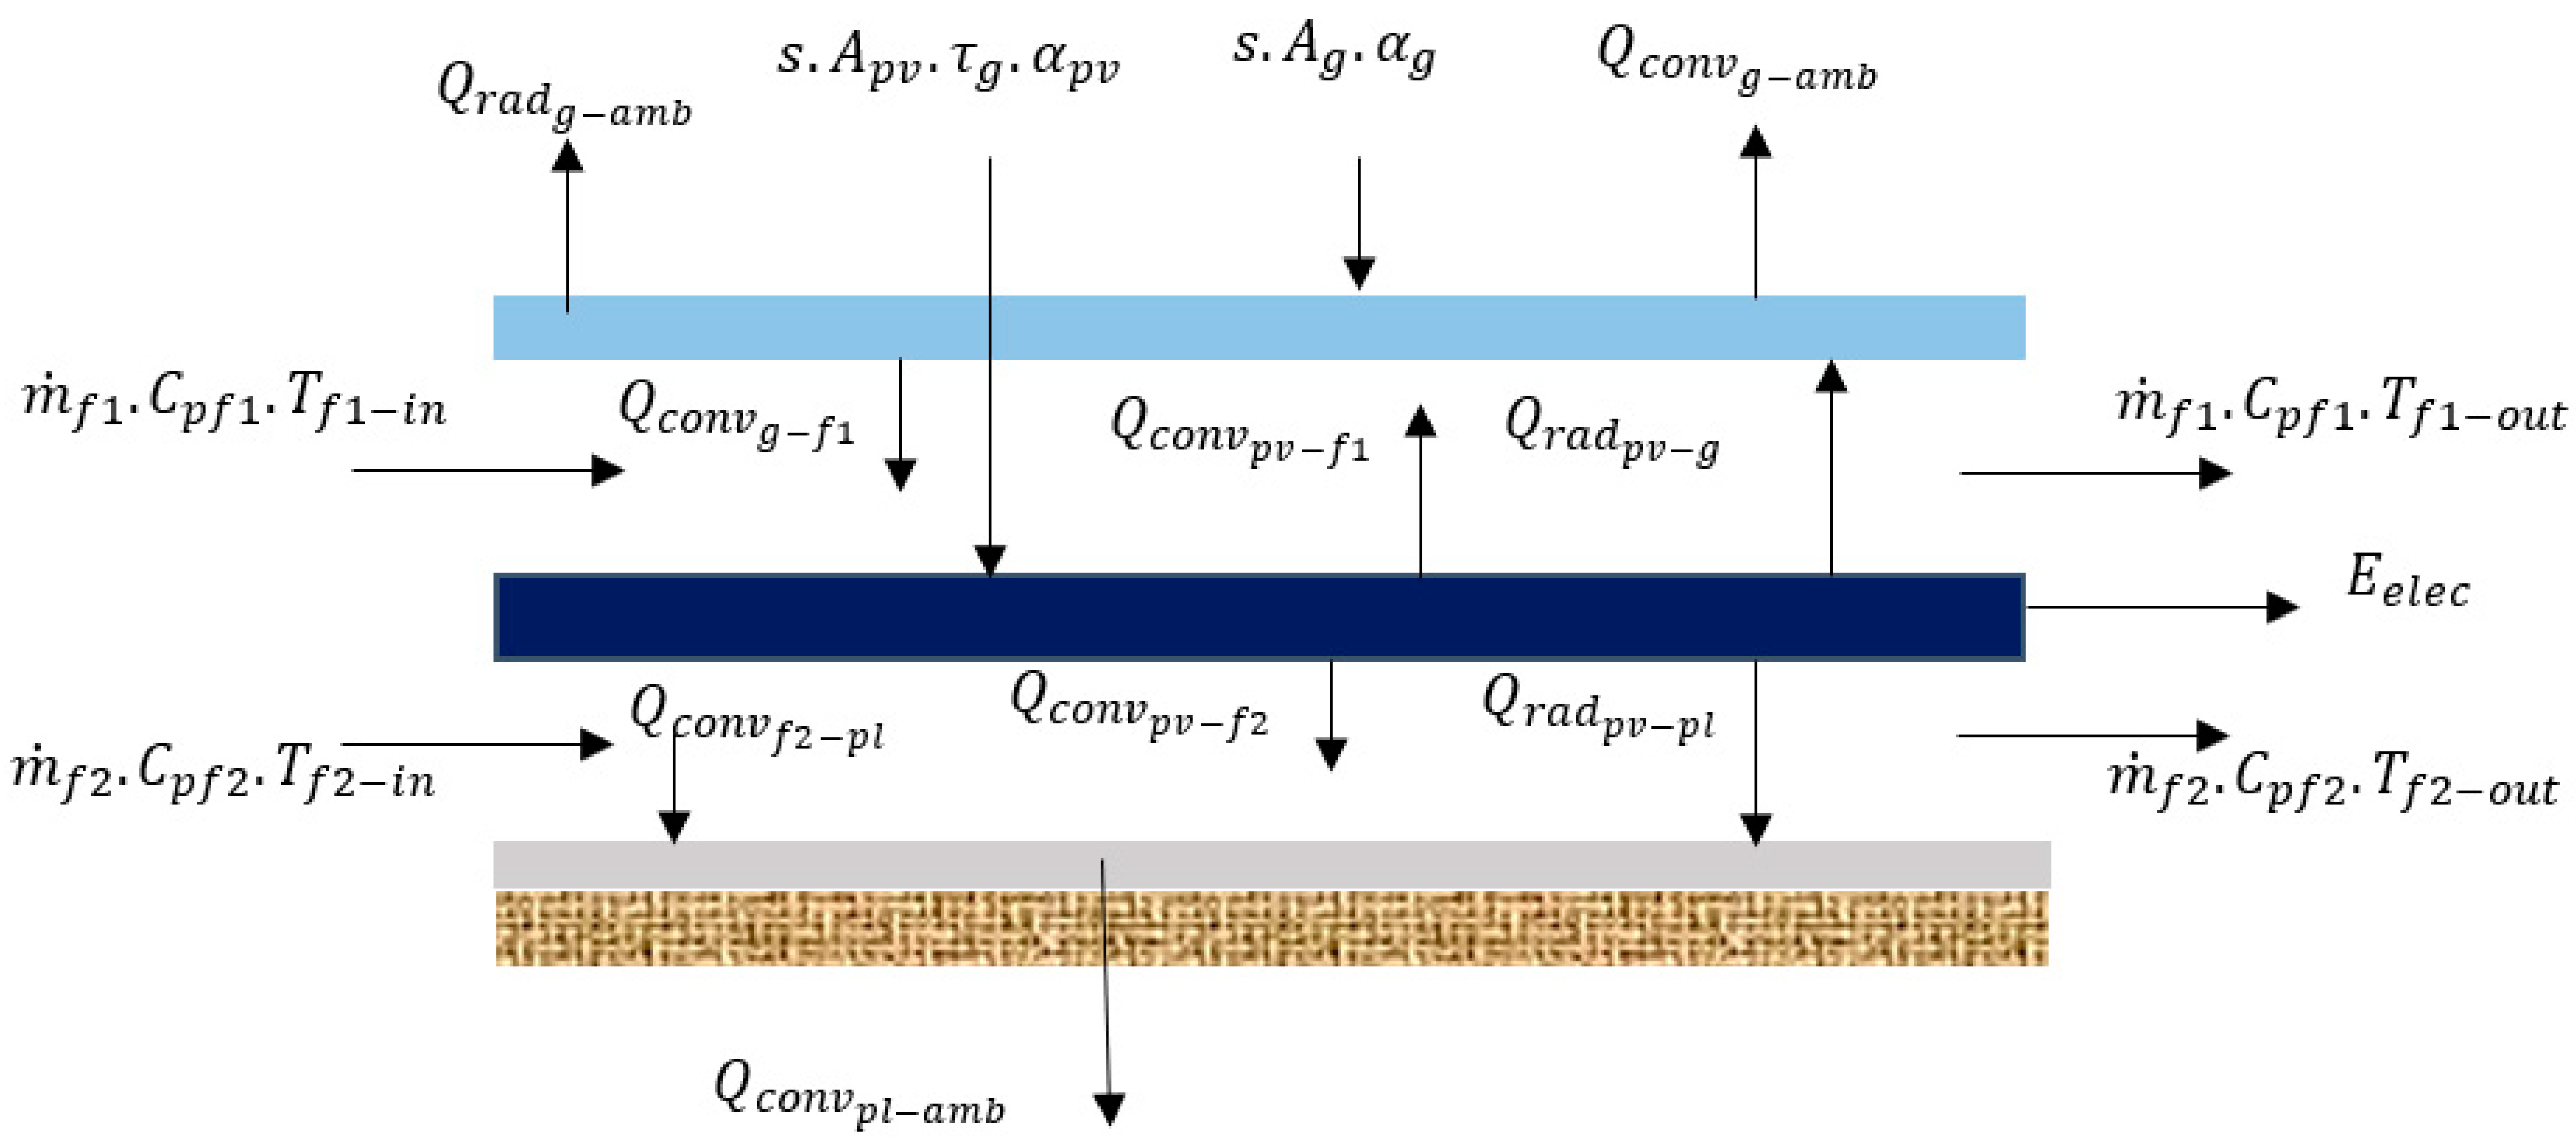
The energy model is presented in Figure 2, and the energy balance equations of the system components [14,31,32,33,34] are the following.
For glass cover,
For fluid 1
For PV module,
For fluid 2
For plate
The electrical energy efficiency is calculated as the following [35]:
where, = 0.1545 at Tpv = 25 °C and s = 1000 W/m2
The heat transfer rates are calculated as a follows
The heat transfer coefficients are calculated in Appendix A.
By substituting using the equations from (6)–(15) on Equations (1)–(5), the energy balance equation of the glass cover can be rewritten as follows:
Substitute into (17) by
and
Hence, Equation (17) becomes
Similarly, Equations (2)–(5) can be rewritten as
The thermal energy efficiency of PVT is calculated as follows,
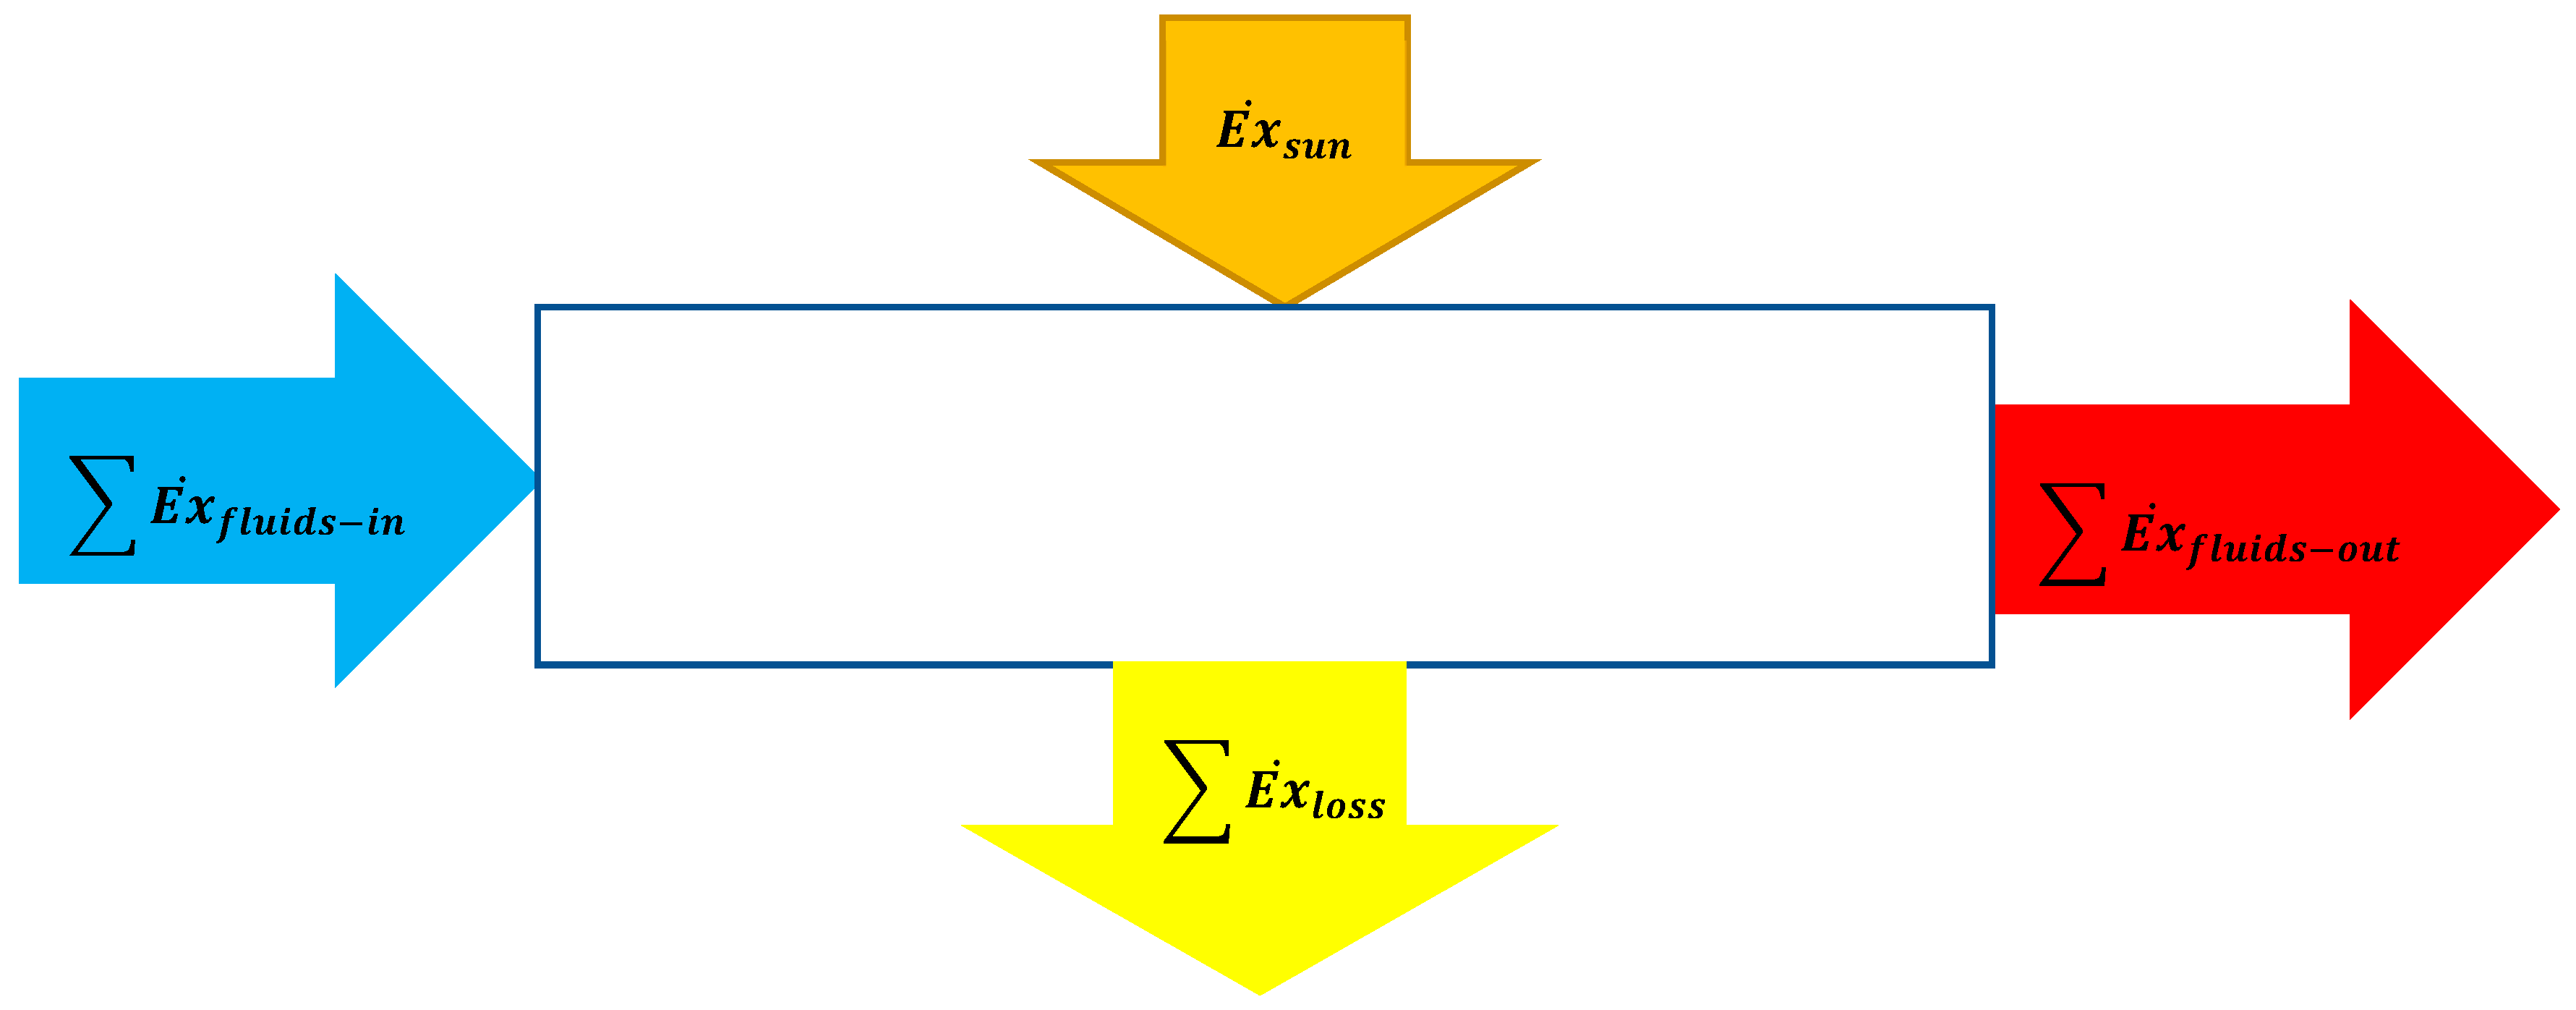
3.2. Exergy Model
Electrical exergy efficiency is
Thermal exergy efficiency is
4. Solution Method
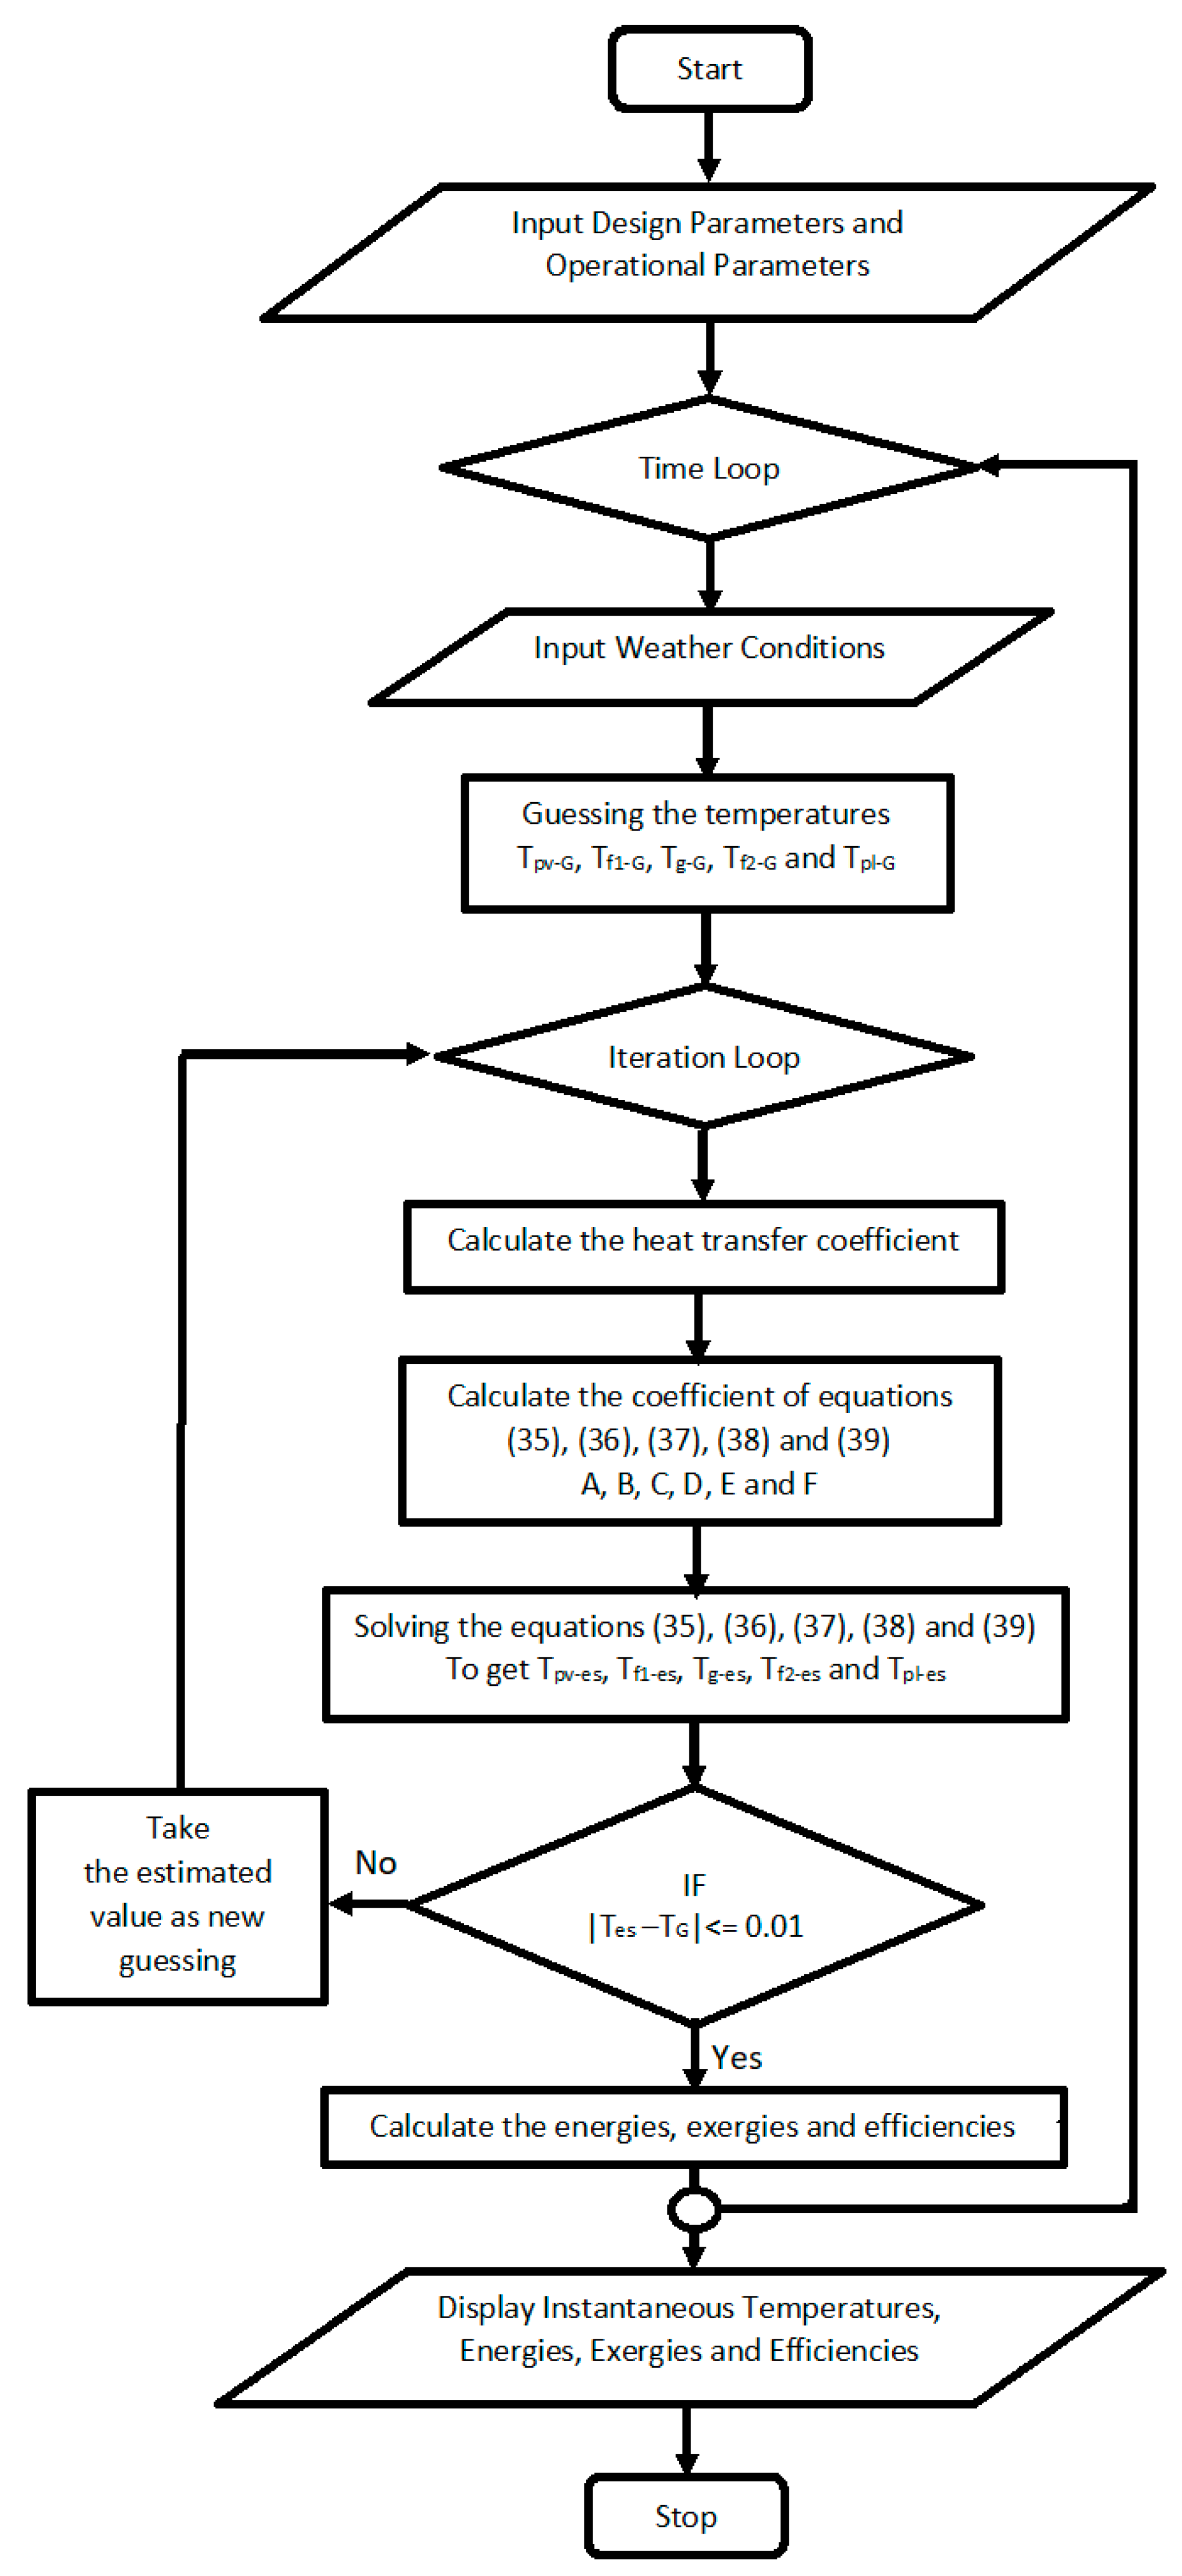
At steady state, the Equations (18)–(22) can be rewritten as
The system of linear Equations (35)–(39) can be solved using MATLAB program. The flow chart of the computer program used to calculate the temperatures of the PV module, the fluid 1, the glass cover, the fluid 2, and plate is shown in Figure 4.
To simplify the calculation, the incident remains perpendicular to the surface of PV cell during the daytime.
5. Results
5.1. Validation of Current Model
The model’s results were compared with the published results of several researchers, as follows.
5.1.1. Comparison of Efficiencies
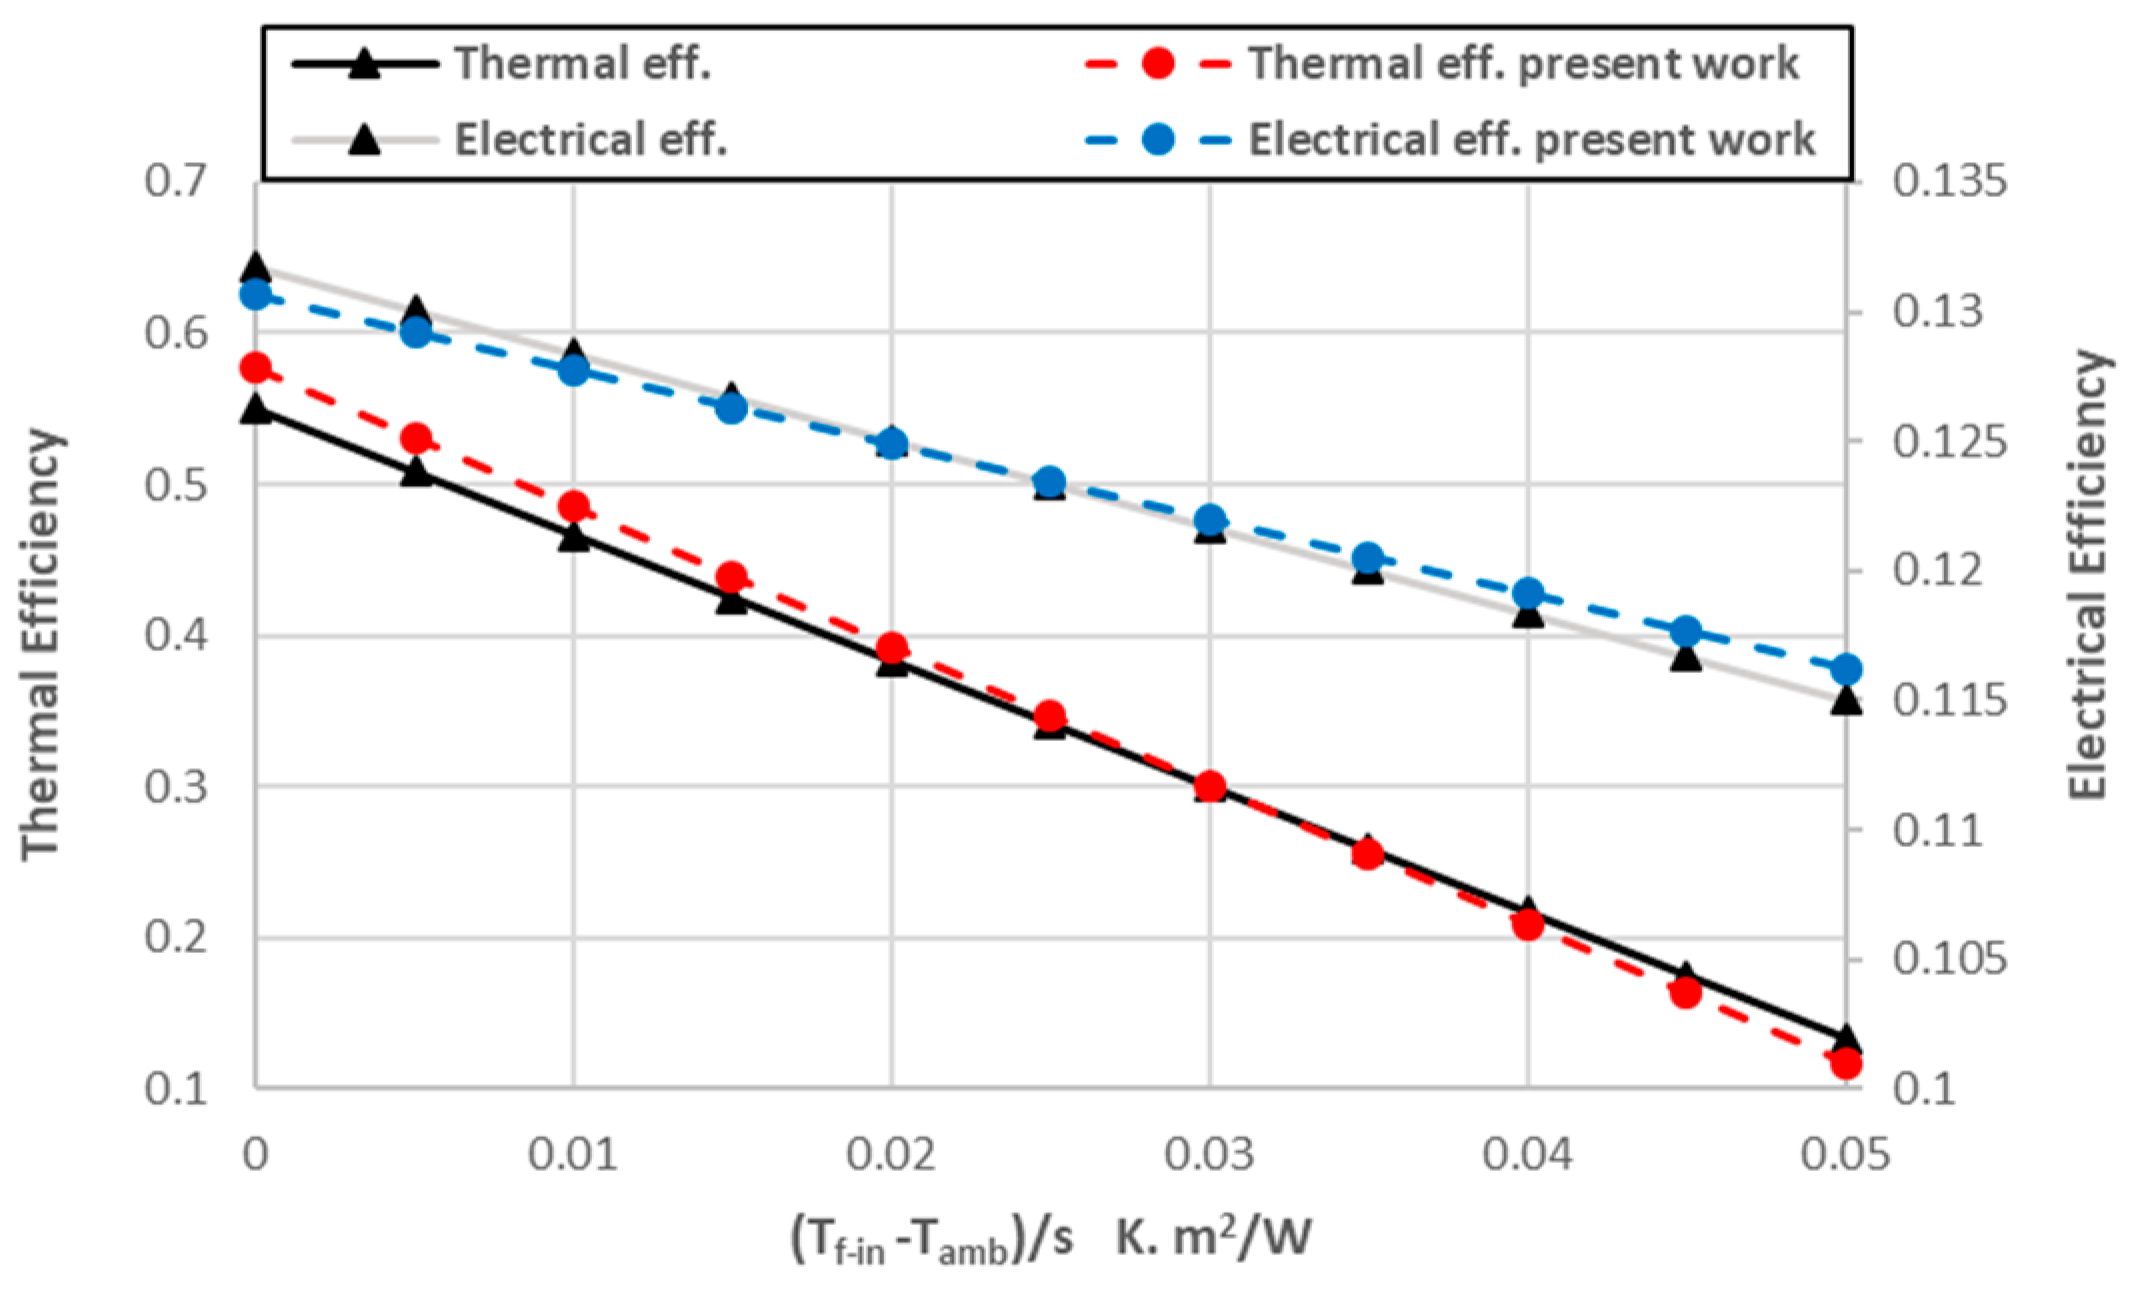
A comparison of the thermal and electrical efficiencies of the present results with the simulation results of Viet et al. [19], as shown in Figure 5, showed closeness.
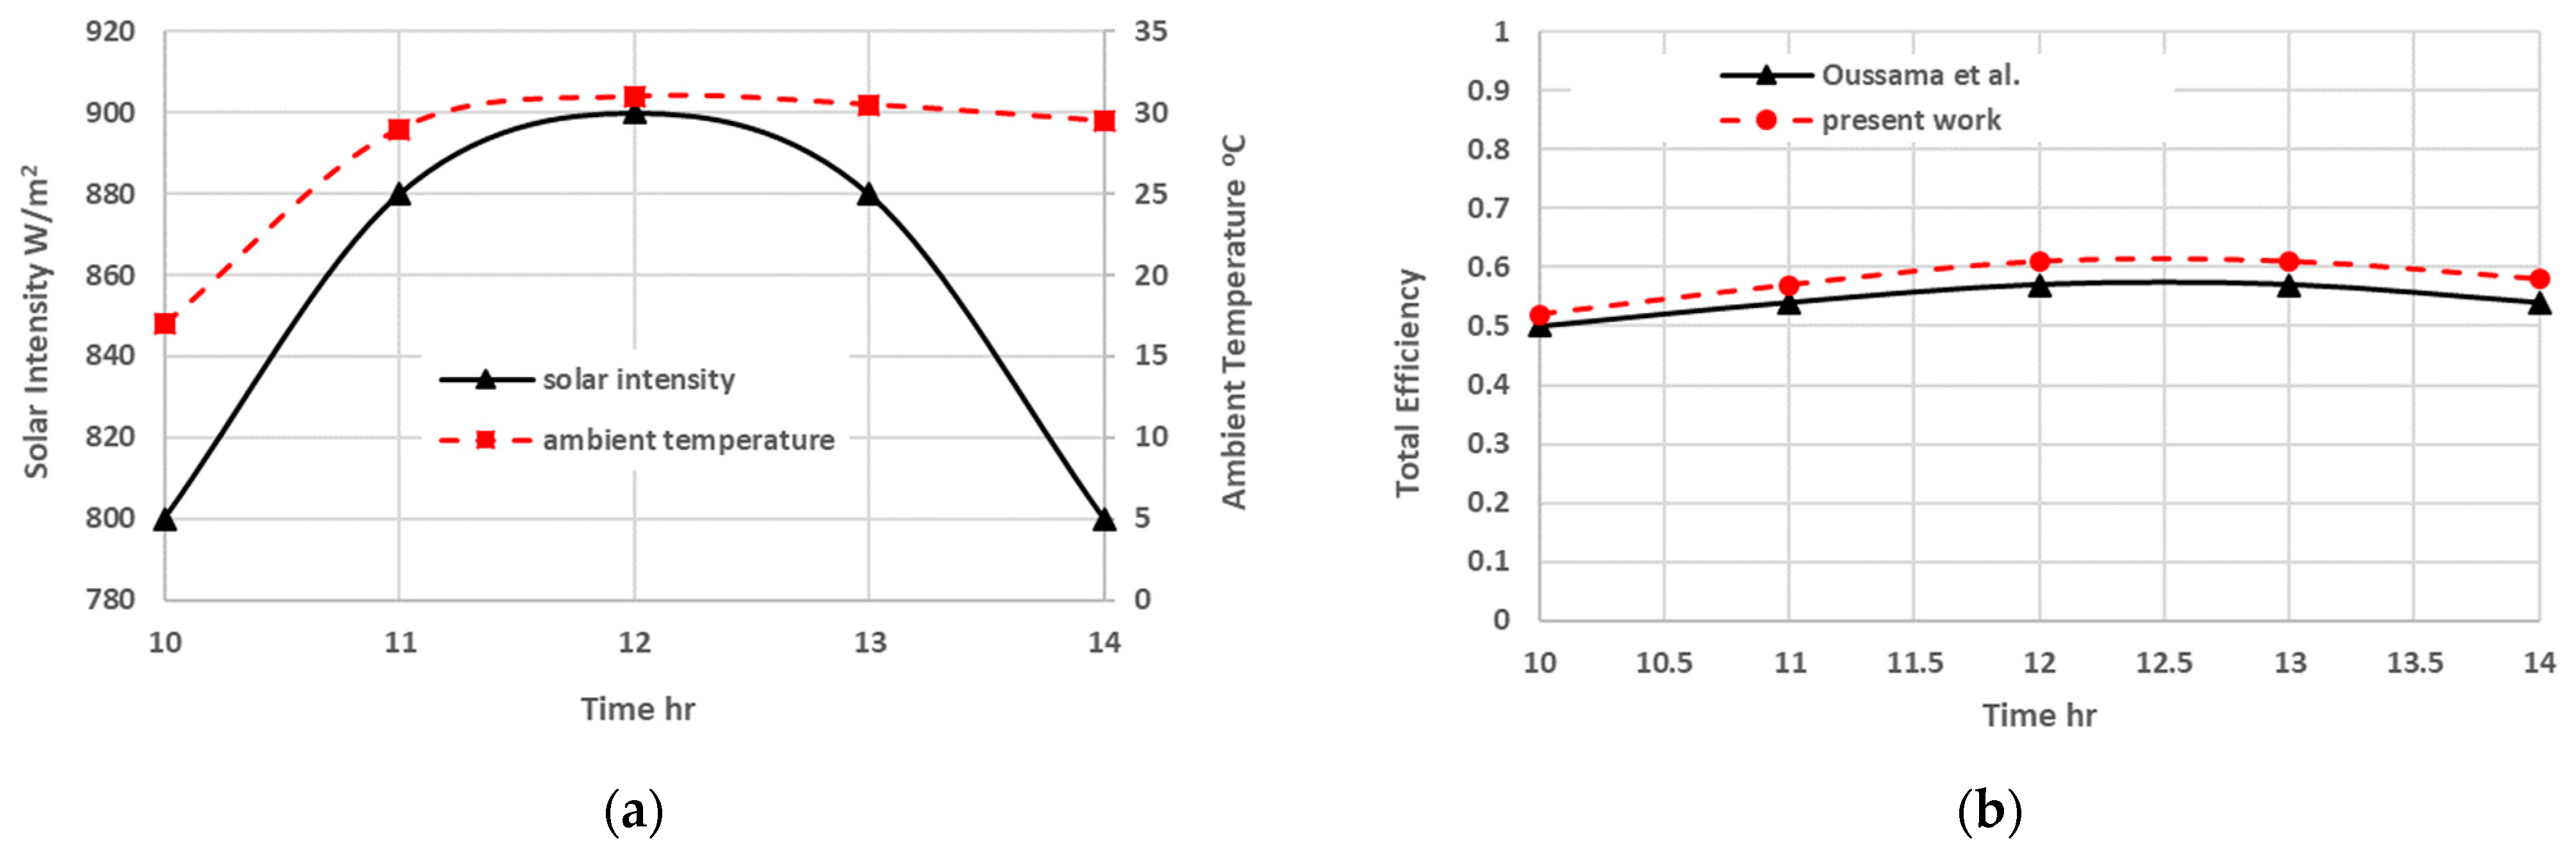
Figure 6 shows the comparison of the total efficiency of the present work with that of Oussama [18] under the same weather conditions, design parameters, water flow rate (0.0075 kg/(s·m2), and air flow rate (0.008 kg/(s·m2). The maximum deviation between the present work and Oussama [18] is 6.8%.
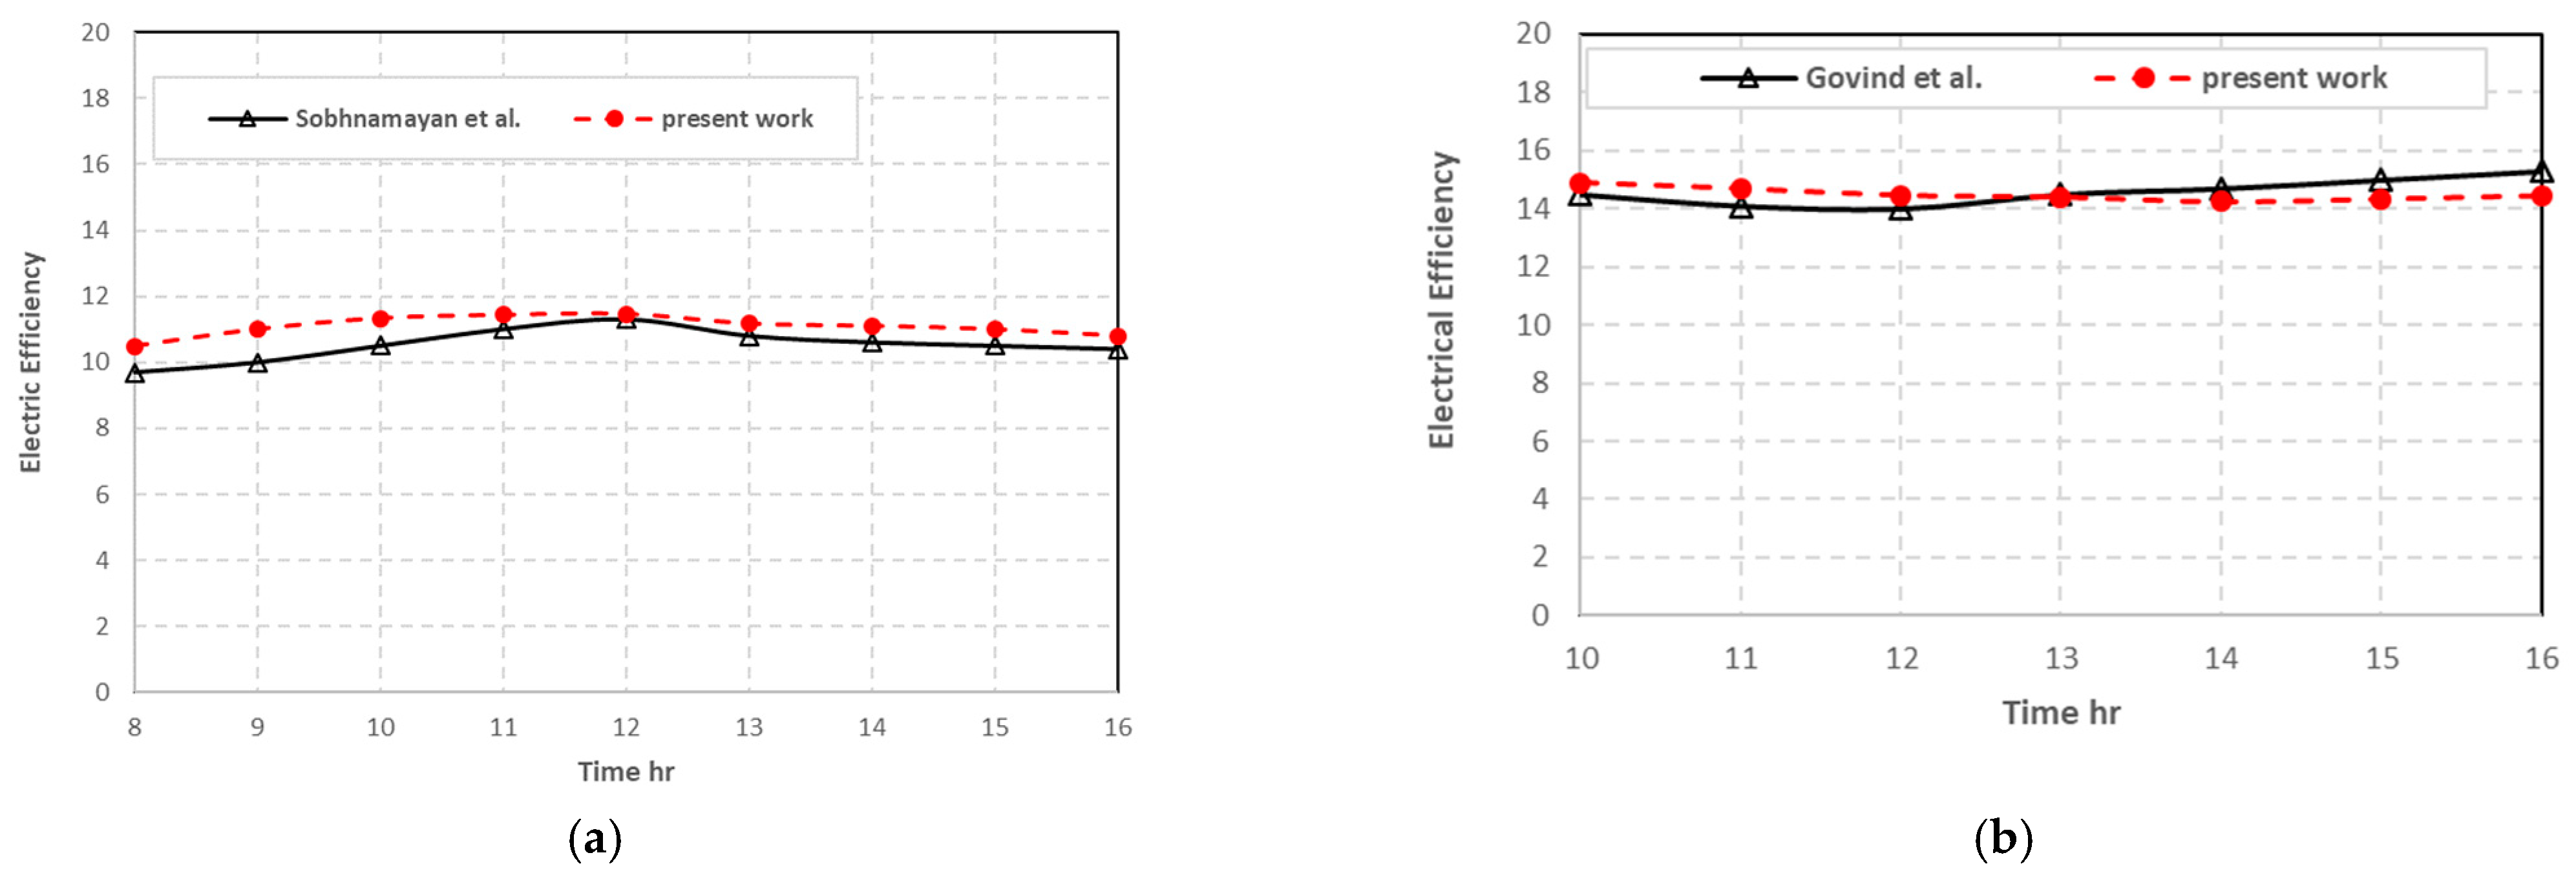
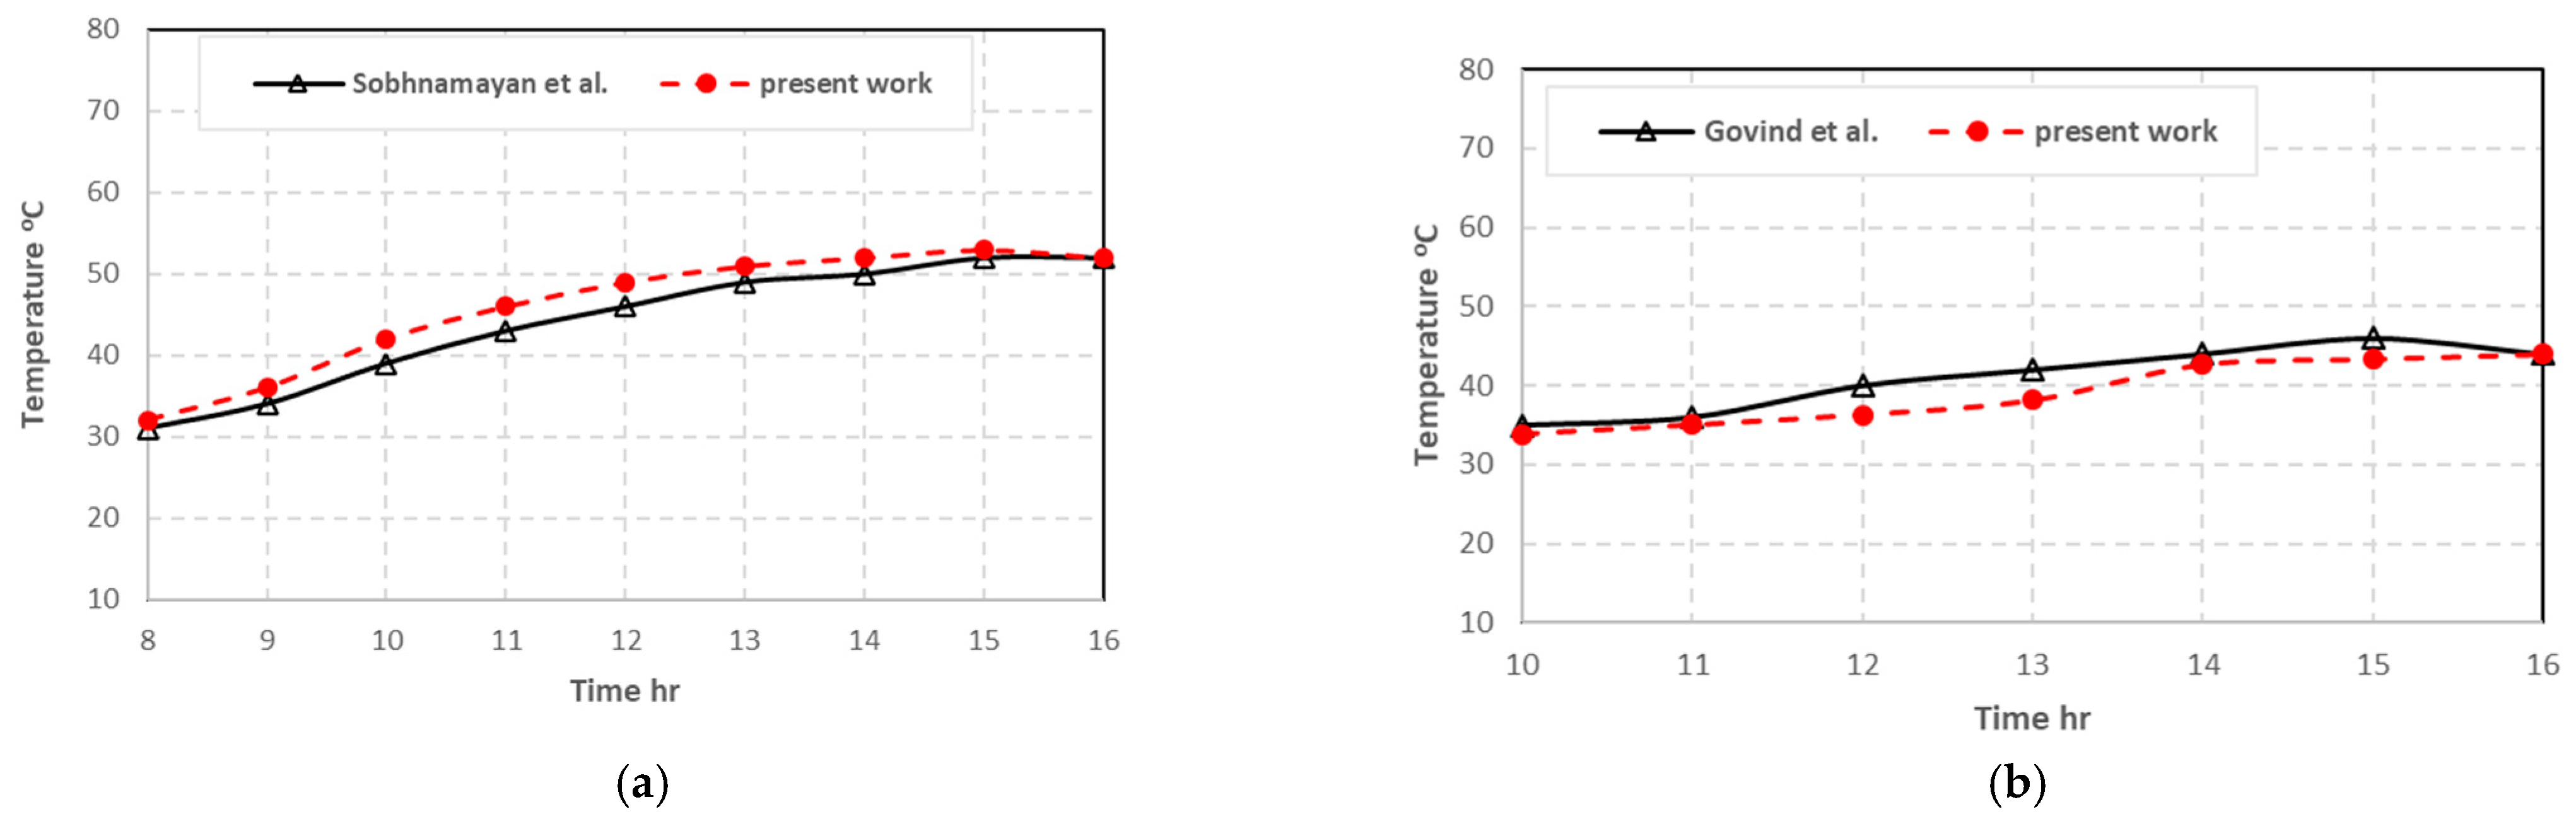
Figure 7a shows the hourly variations in the electrical efficiency of PVT compared to the results of Sobhnamayan et al. [40] for the same design parameters (water flow rate of 0.037 kg/s, panel size of 1.1 × 0.5 m2) and weather conditions in Table 1.
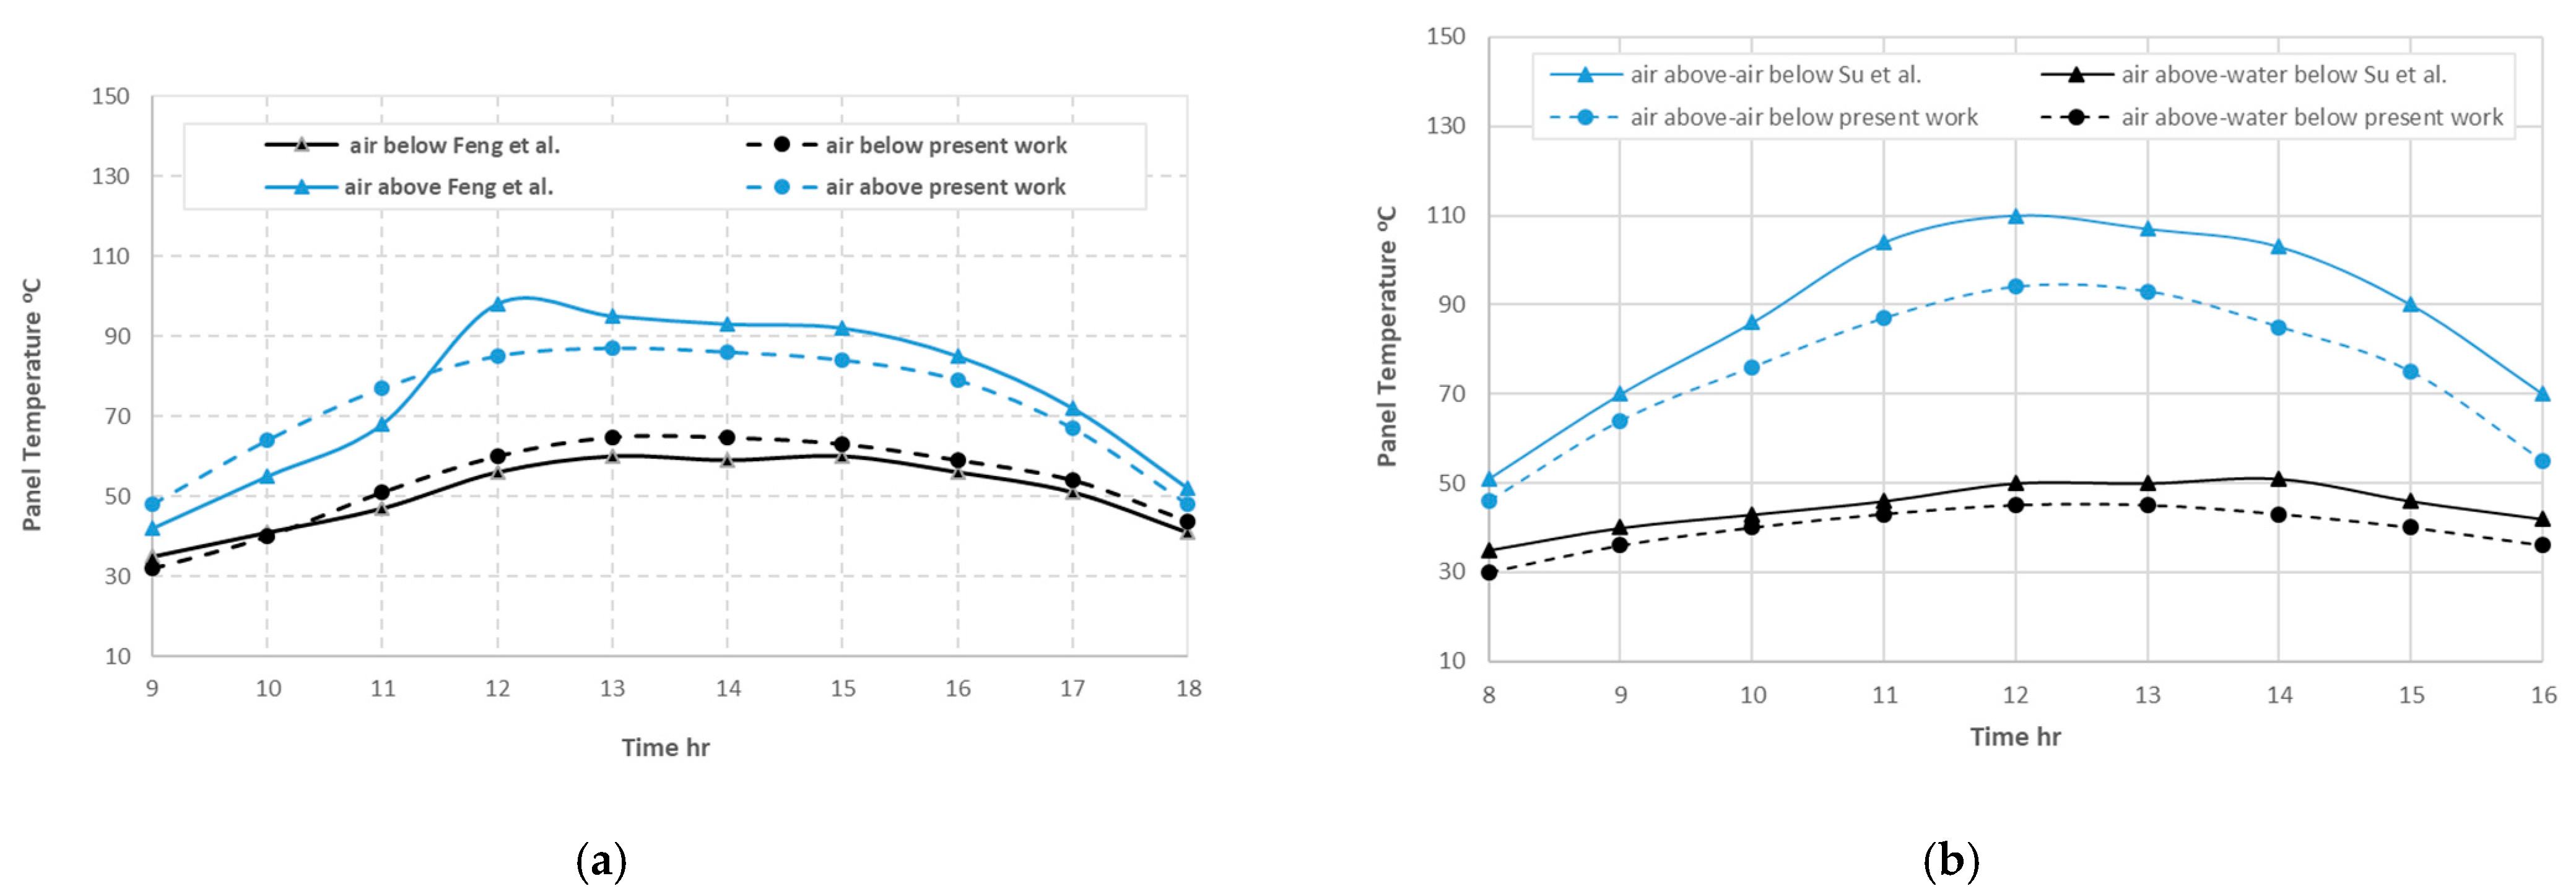
5.1.2. Comparison of Panel Temperatures
5.1.3. Comparison of Outlet Water Temperatures
5.2. Model Results
5.2.1. Specification of PV Module
The tilted angle between PV cells and solar is neglected, which has little effect on simulation analysis [44], with the mass air flow rate of 0.06 kg/s and with the mass water flow rate of 0.06 kg/s. PV panel characteristics are shown in Table 6. The fluid channel is a rectangular shape and the design parameters of the fluid channel are shown in Table 7.
The results of the current model will be presented in this section as follows:
5.2.2. Comparison Cooling Configurations
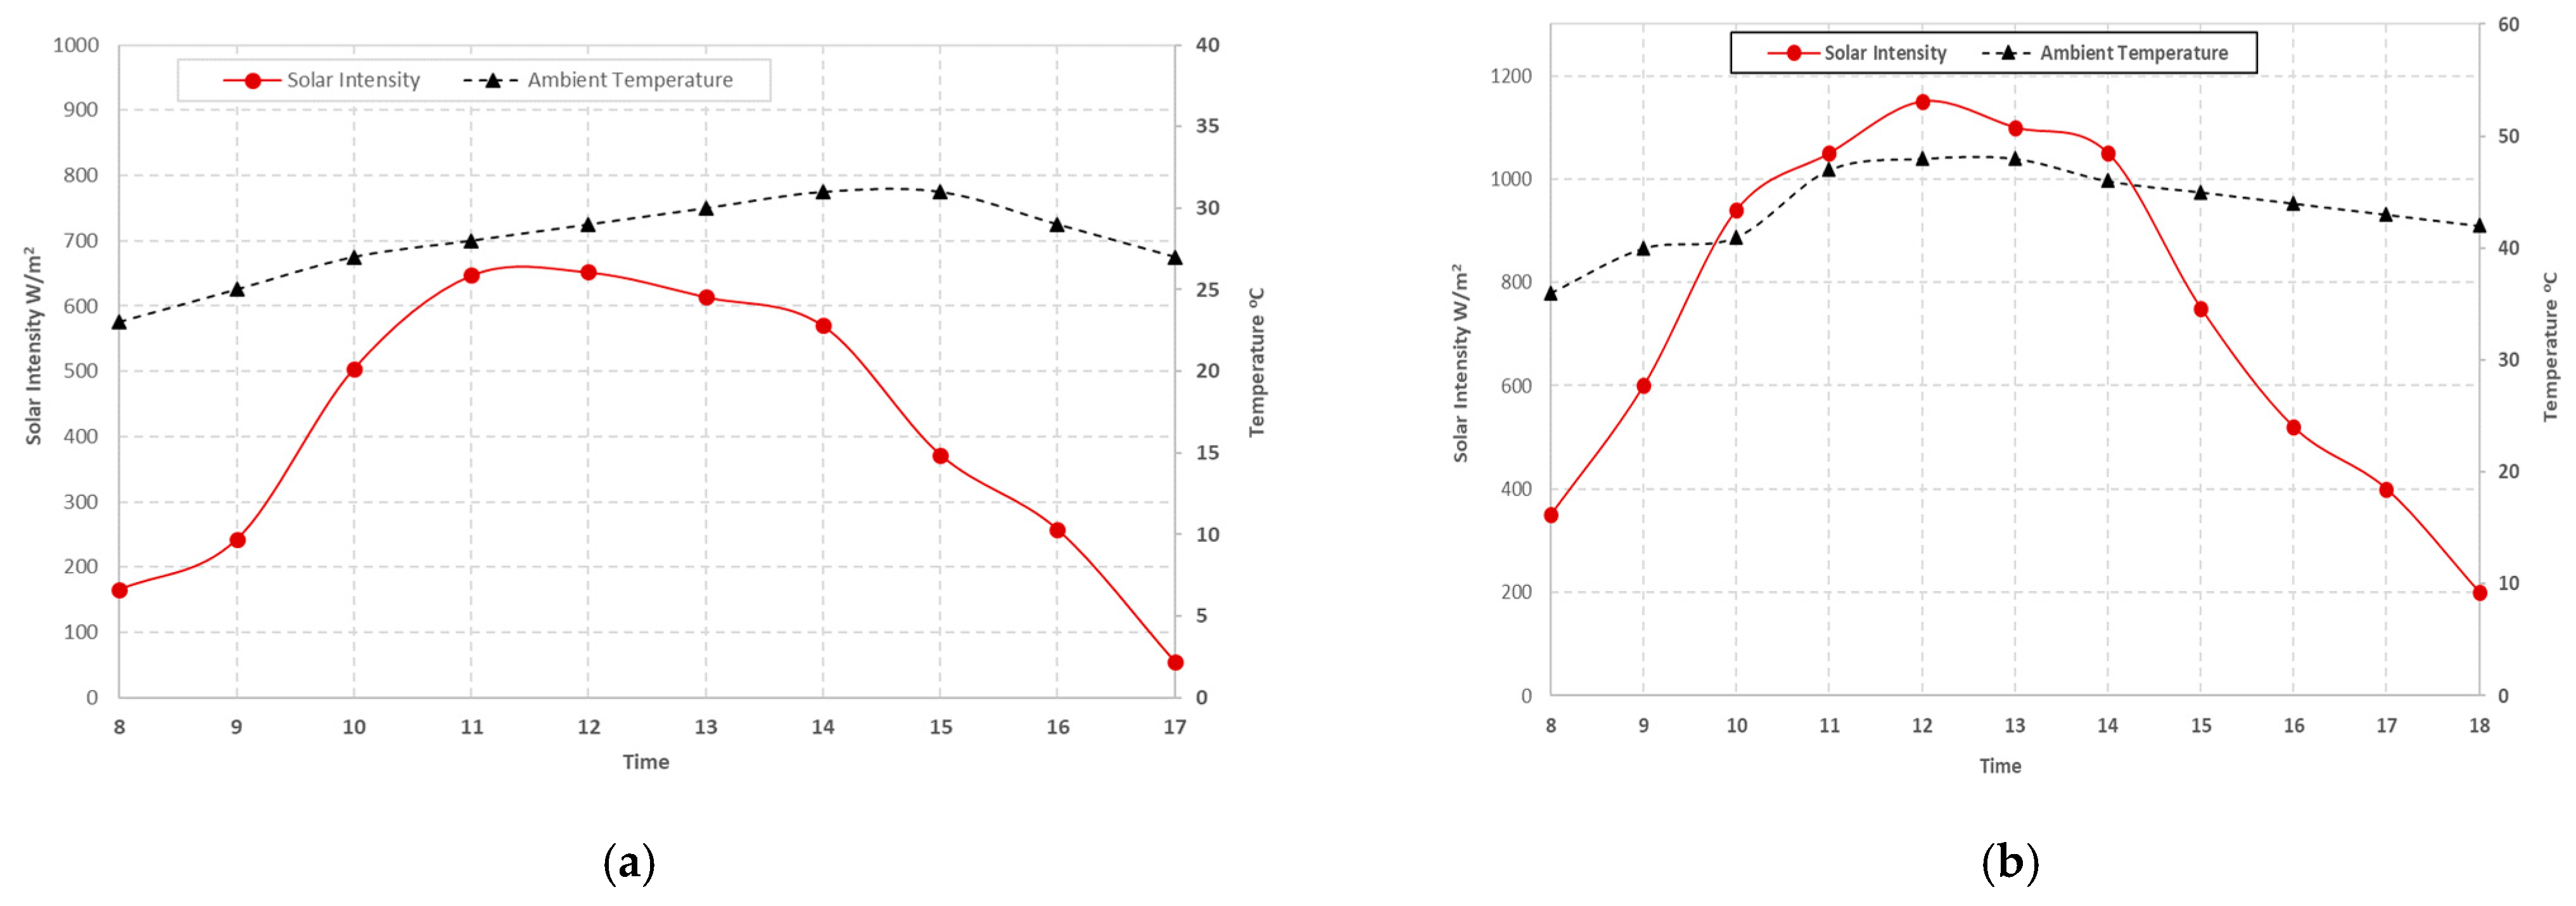
Figure 11a,b show the hourly variations in ambient temperature and solar radiation during a winter day and summer day in Sakaka, KSA, respectively.
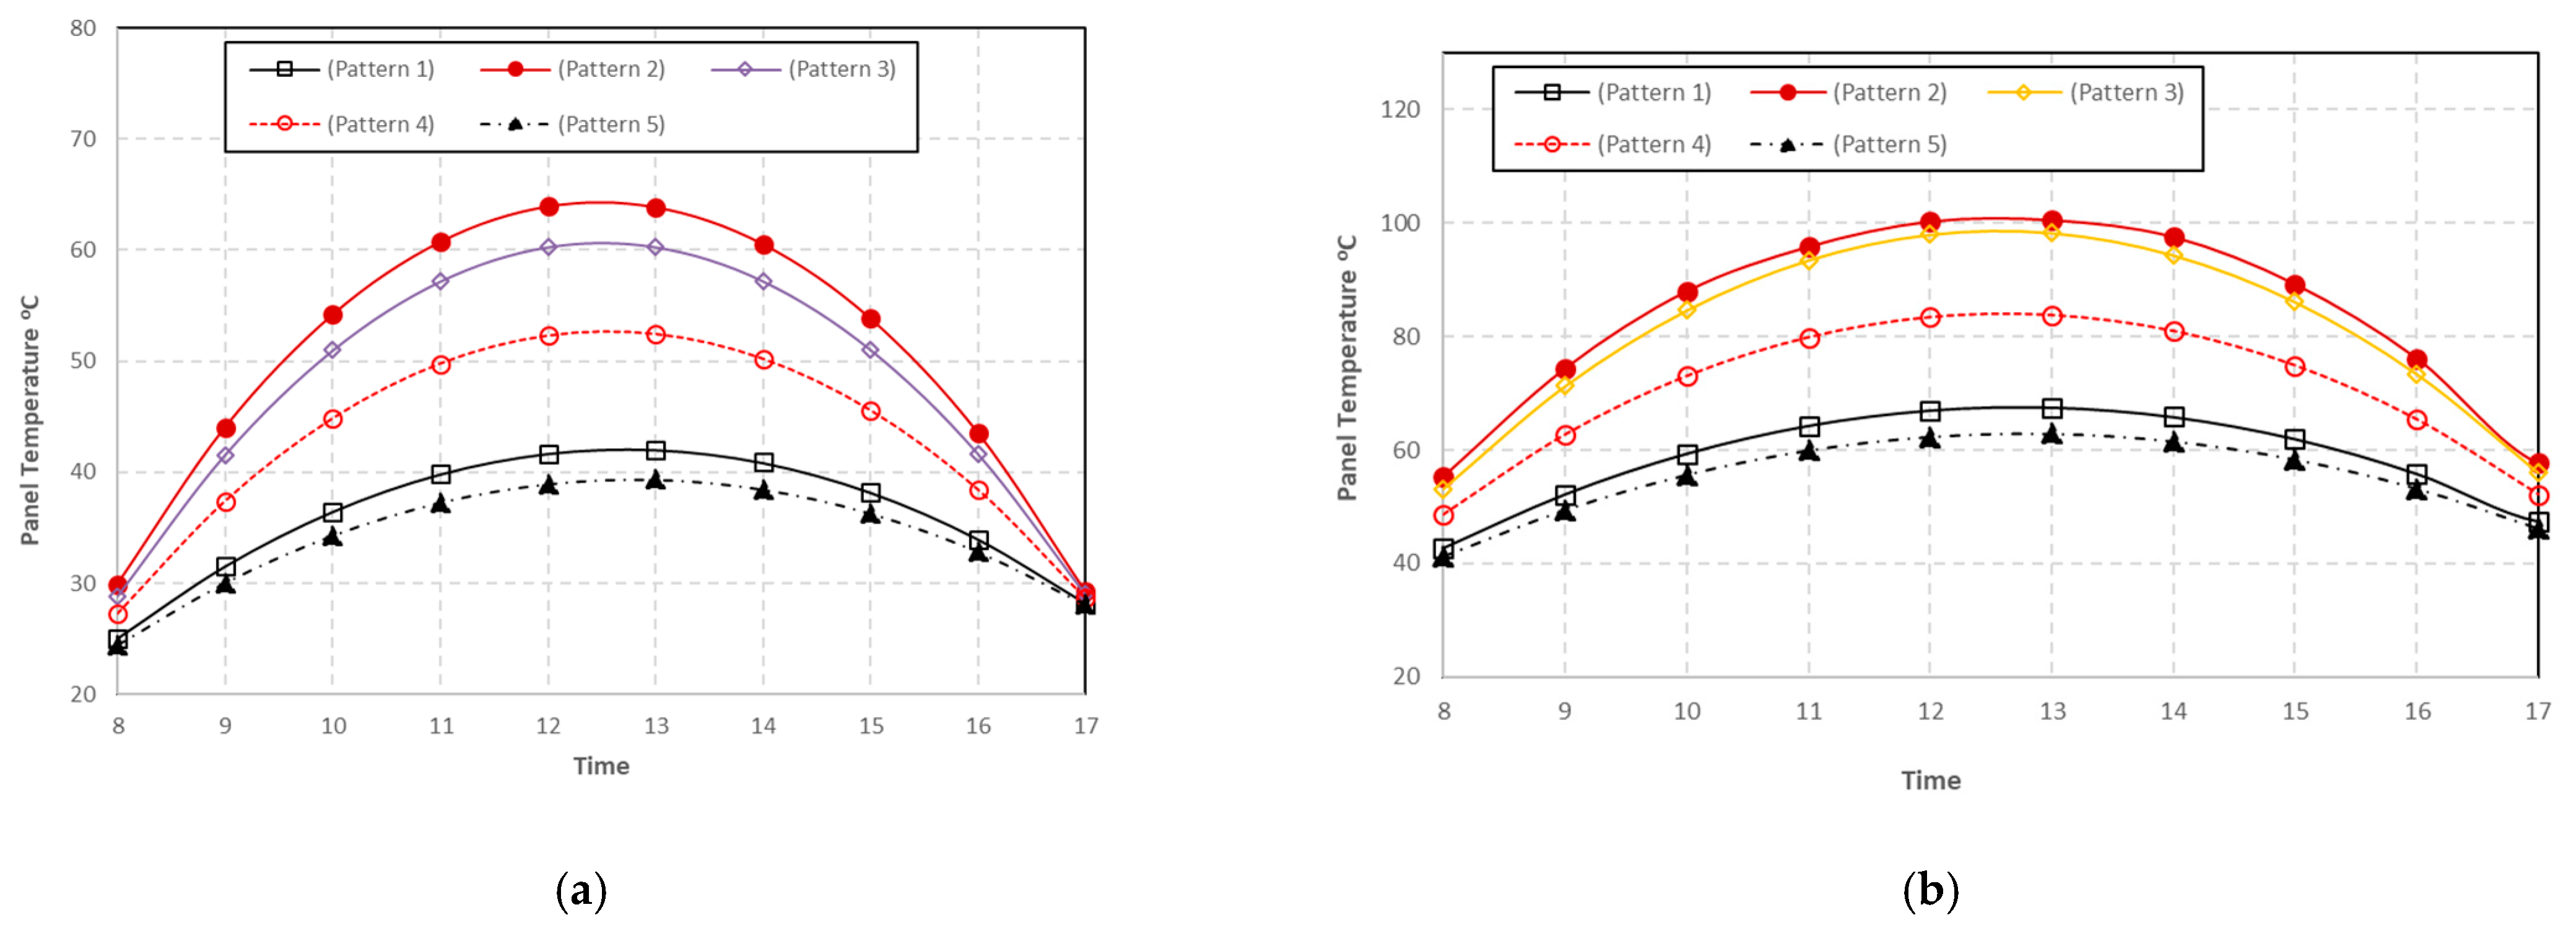
Figure 12a,b show the hourly variations of the temperature of the PVT panel for different configurations. It was found that the lowest temperature of the panel is reached when water is used as a coolant at the bottom of the panel (pattern 5) (with maximum temperature at 13:00 (average temperature 44 °C). On the other hand, the highest temperature of the panel is reached when air is used as a coolant above and below the panel (pattern 2) (with maximum temperature at 13:00 (average temperature 65.5 °C), where air acts as a heat insulator rather than a coolant, so it is better to use water as a coolant [43]. Where the temperature of the panel depends on the properties of the fluids and the operating conditions. First, about the properties of fluids: The thermal conductivity of air is very low (0.02 W/m·K), which is why it is considered insulating. In contrast, the thermal conductivity of water, 0.6 W/m·K, is 300 times higher than that of air. In addition, the heat capacity of air is very low (1292 kJ/m3·K) compared to the heat capacity of water (4184 kJ/m3·K), so the water can efficiently absorb heat from the panel. Second, the temperature of the panel depends on the operating conditions, such as the inlet temperature and the flow rate of the fluid.
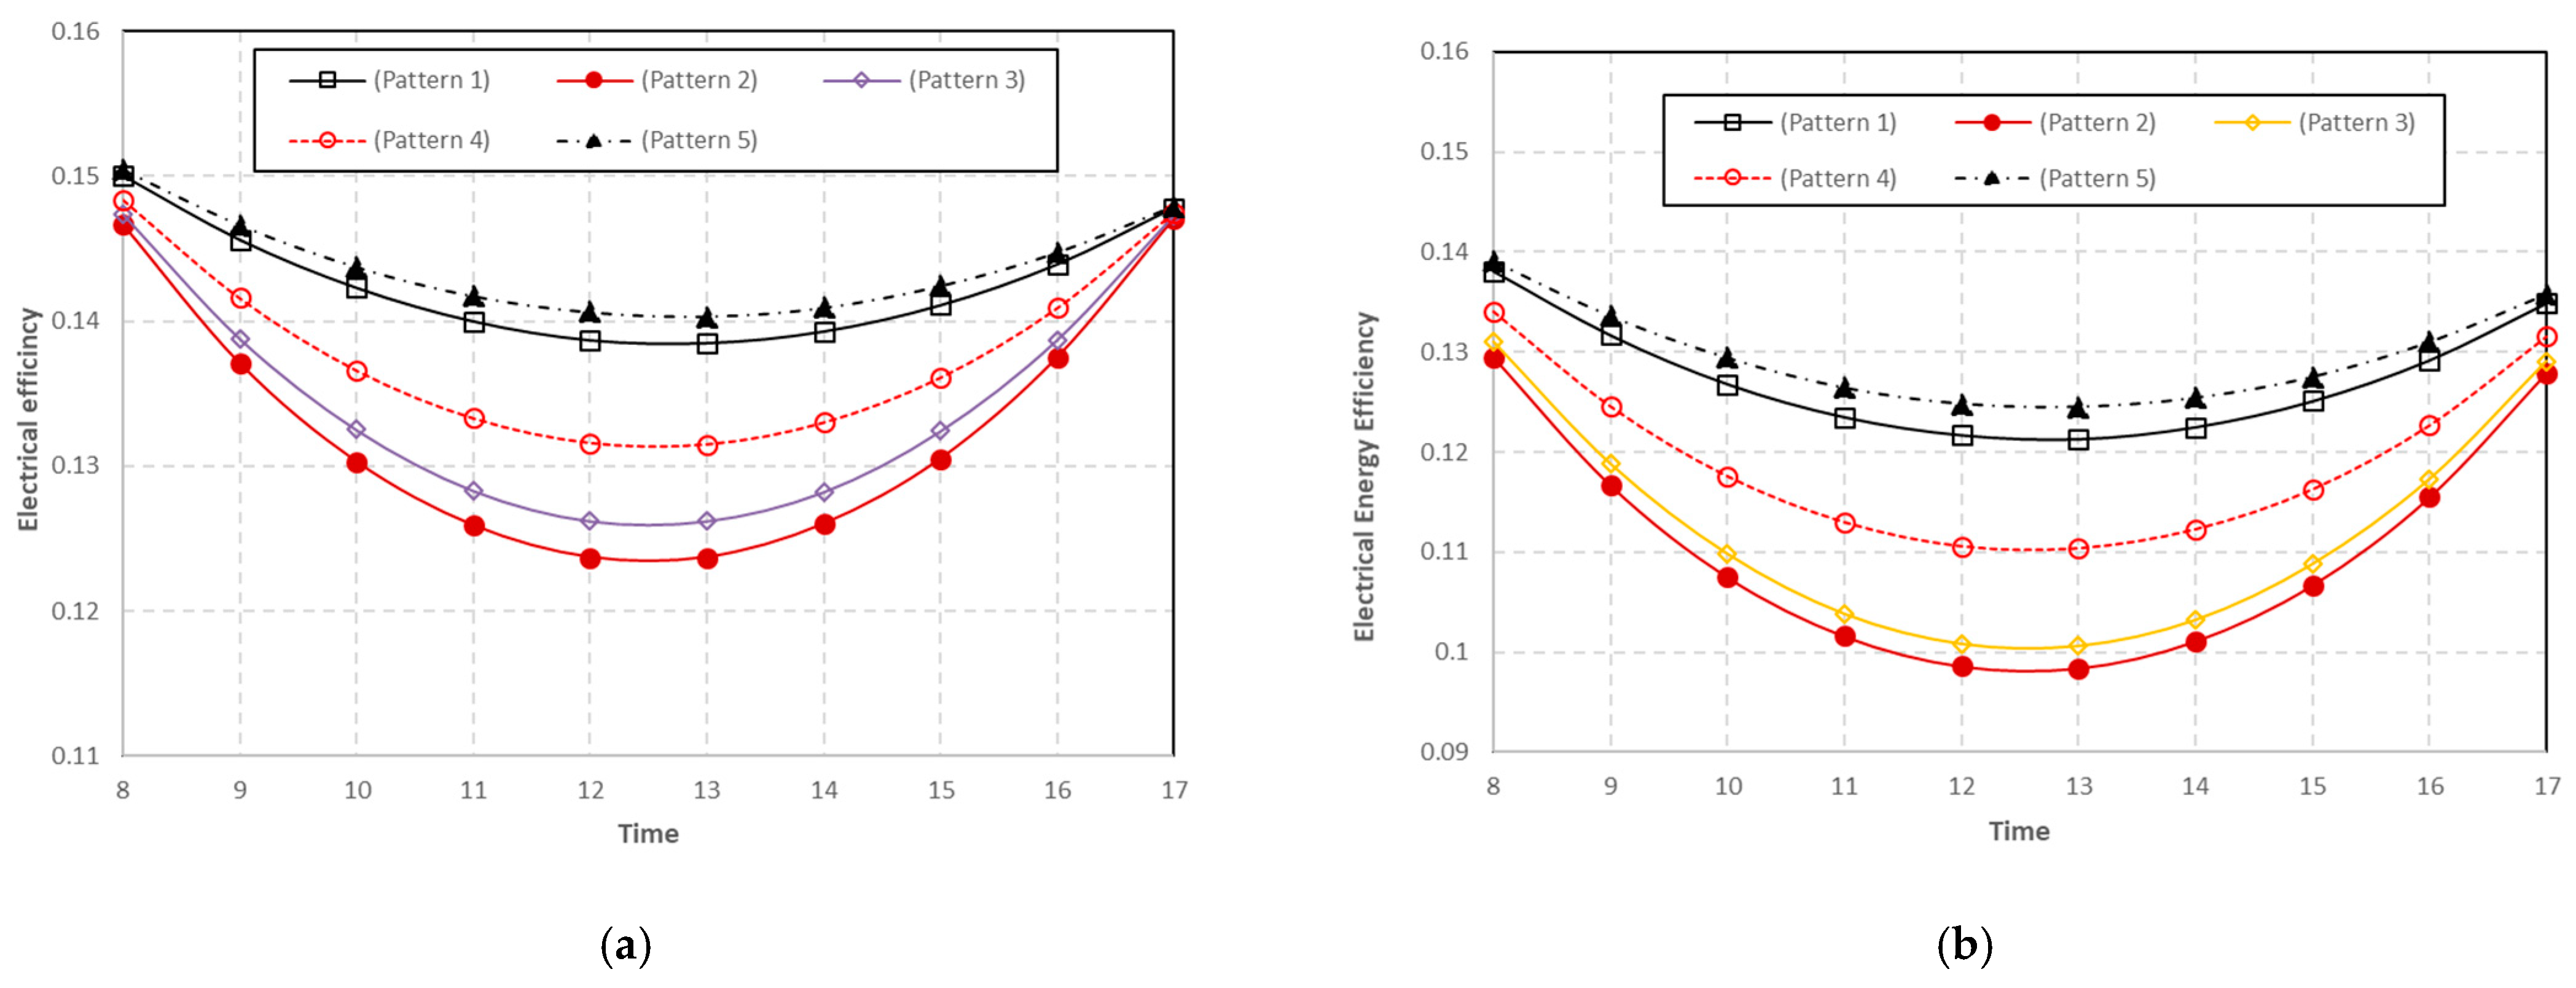
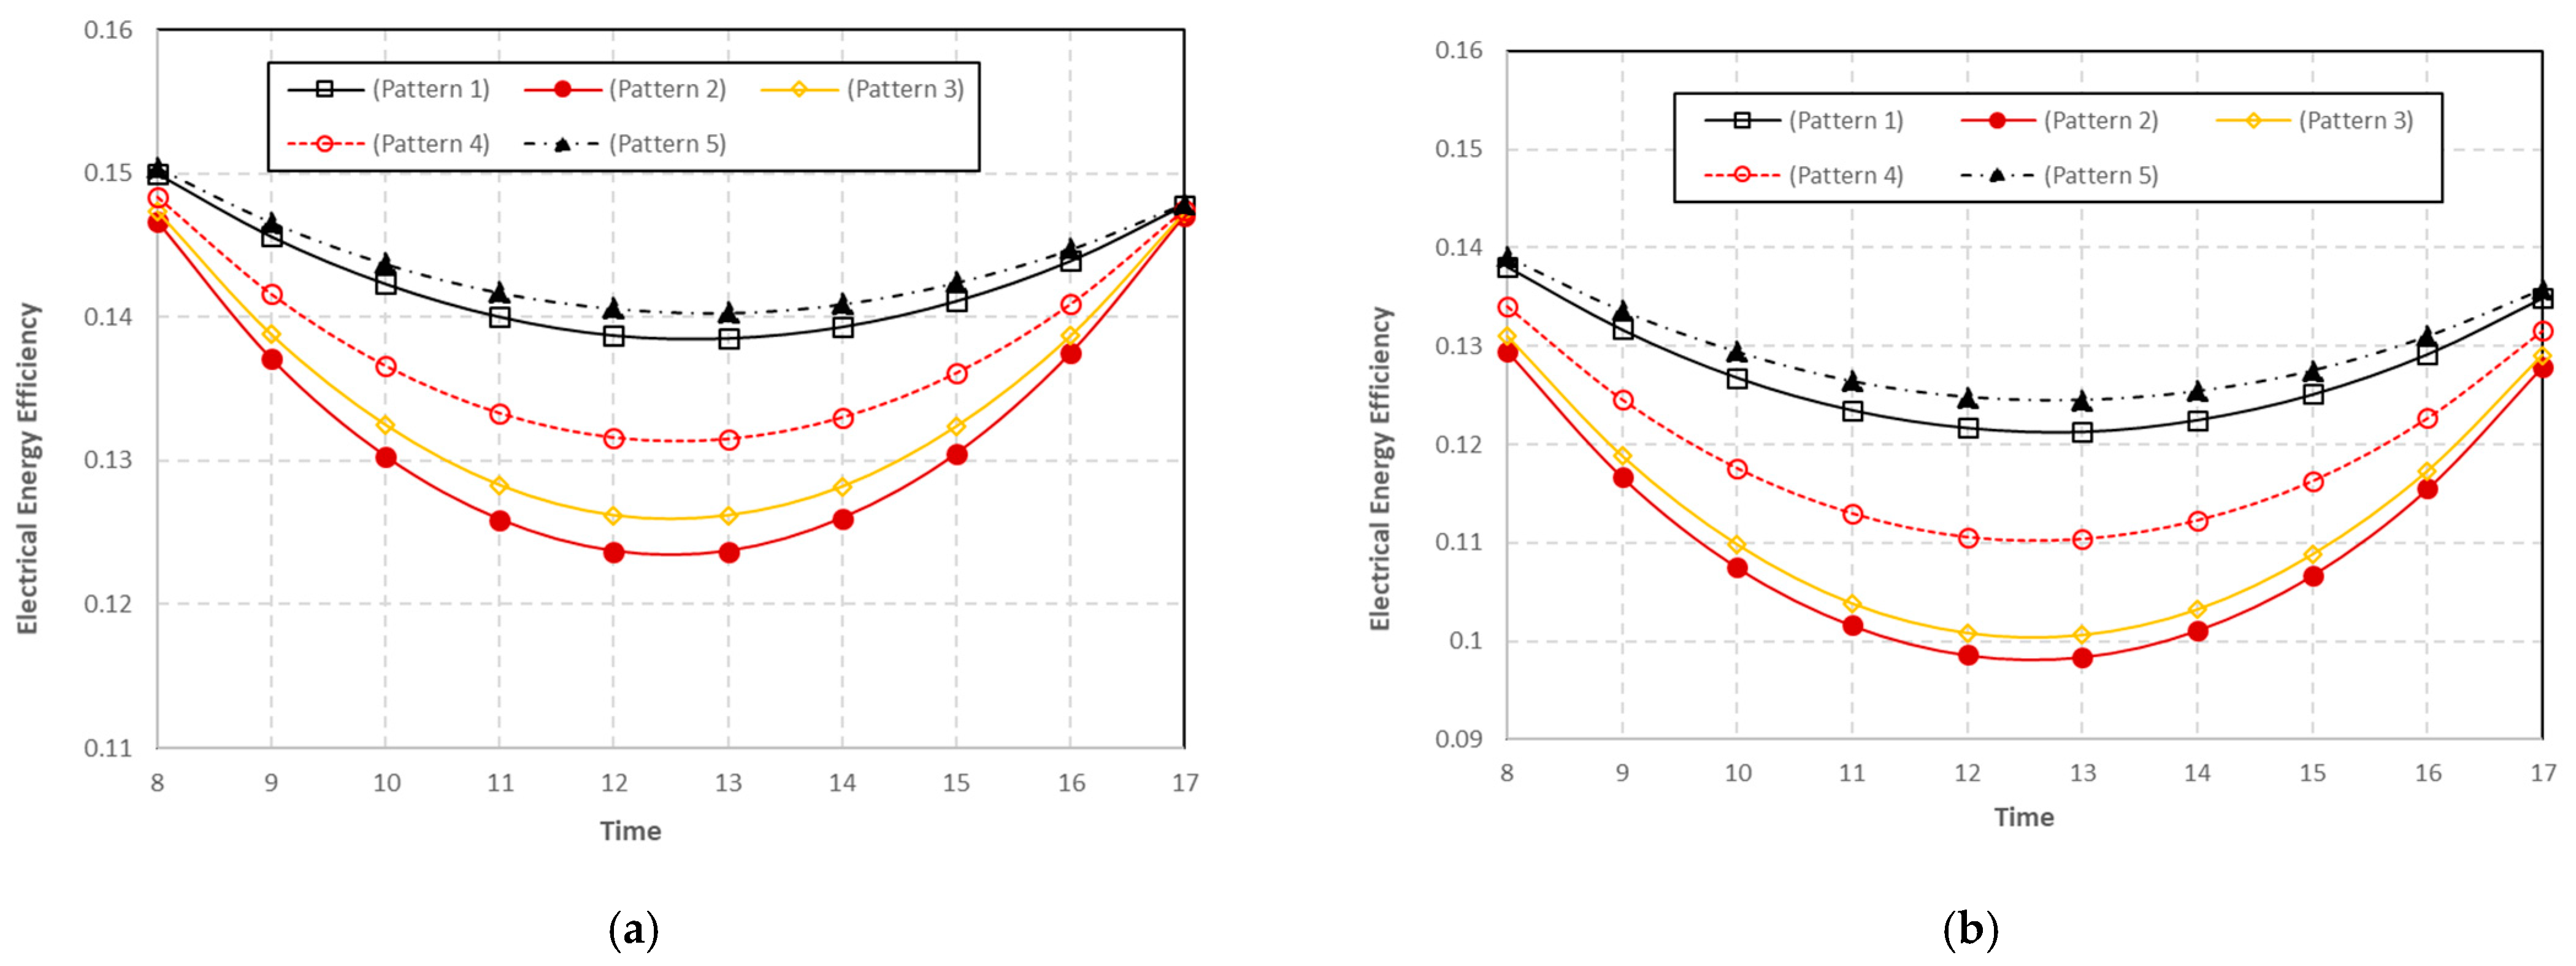
Figure 13a,b show the hourly variations of electrical energy efficiency for different configurations. It was found that the highest efficiency of the electrical energy of the panel is achieved when the water cooling is used at the bottom of panel (pattern 5) (average electrical efficiency 13.6%). On the other hand, the lowest electrical energy efficiency is achieved when air cooling is used above and below the panel (pattern 2) (average electrical efficiency 12.1%), with the air acting as a thermal insulator rather than a coolant. This results in an increase in the temperature of the panel and thus a decrease in the electrical energy efficiency of the panel.
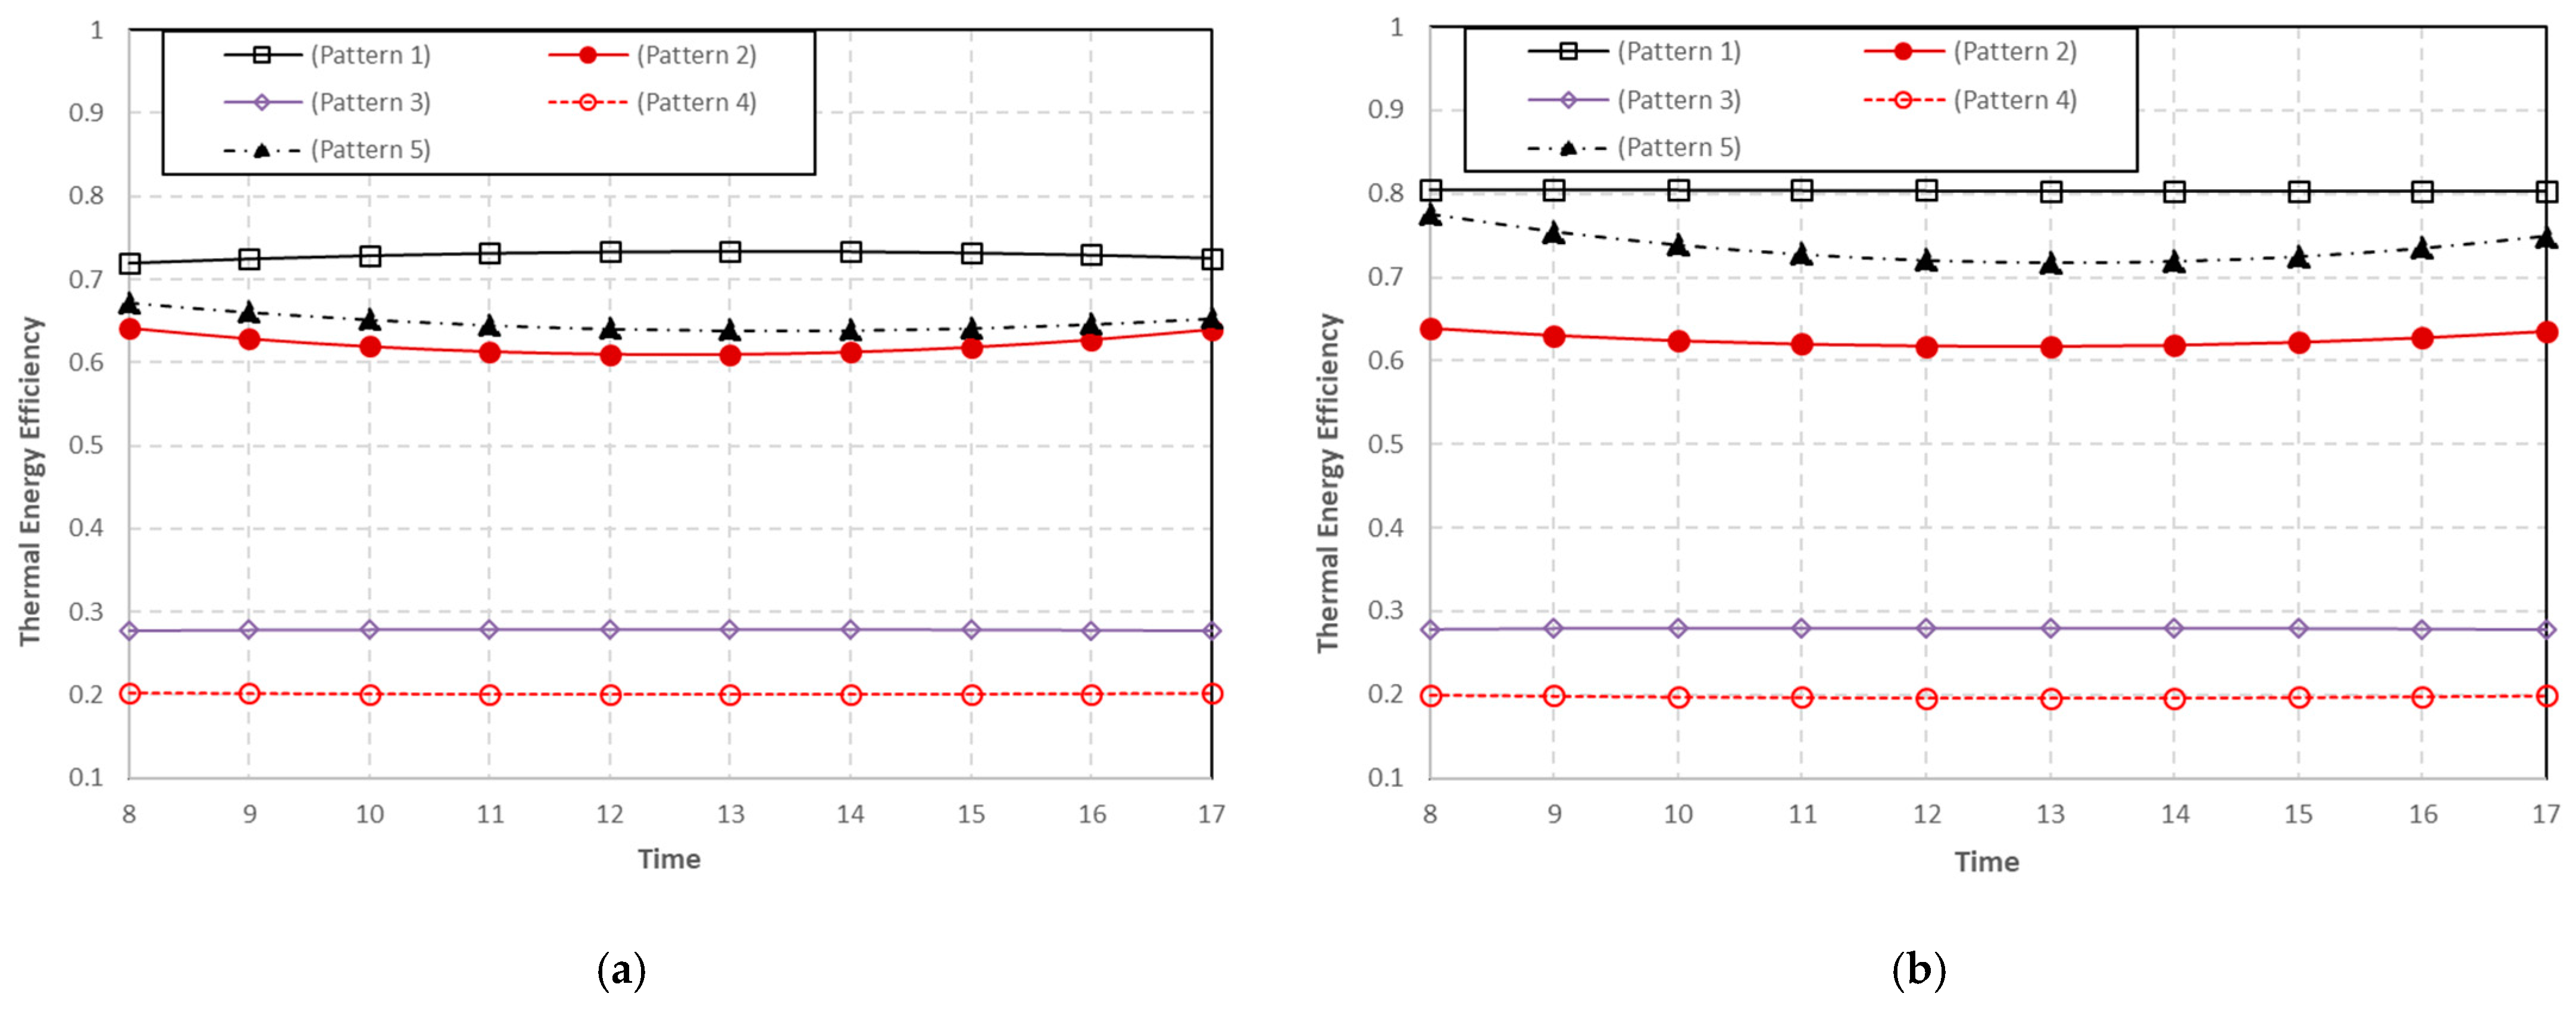
Figure 14a,b show the hourly variations in thermal energy efficiency for different patterns. It was found that the highest thermal energy efficiency of the panel occurred when using coolant water at the bottom of the panel and air in the top (pattern 1) (average thermal efficiency 75%). On the other hand, the lowest efficiency of thermal energy the panel occurred when using coolant air below the panel (pattern 4) (average thermal efficiency 20%).
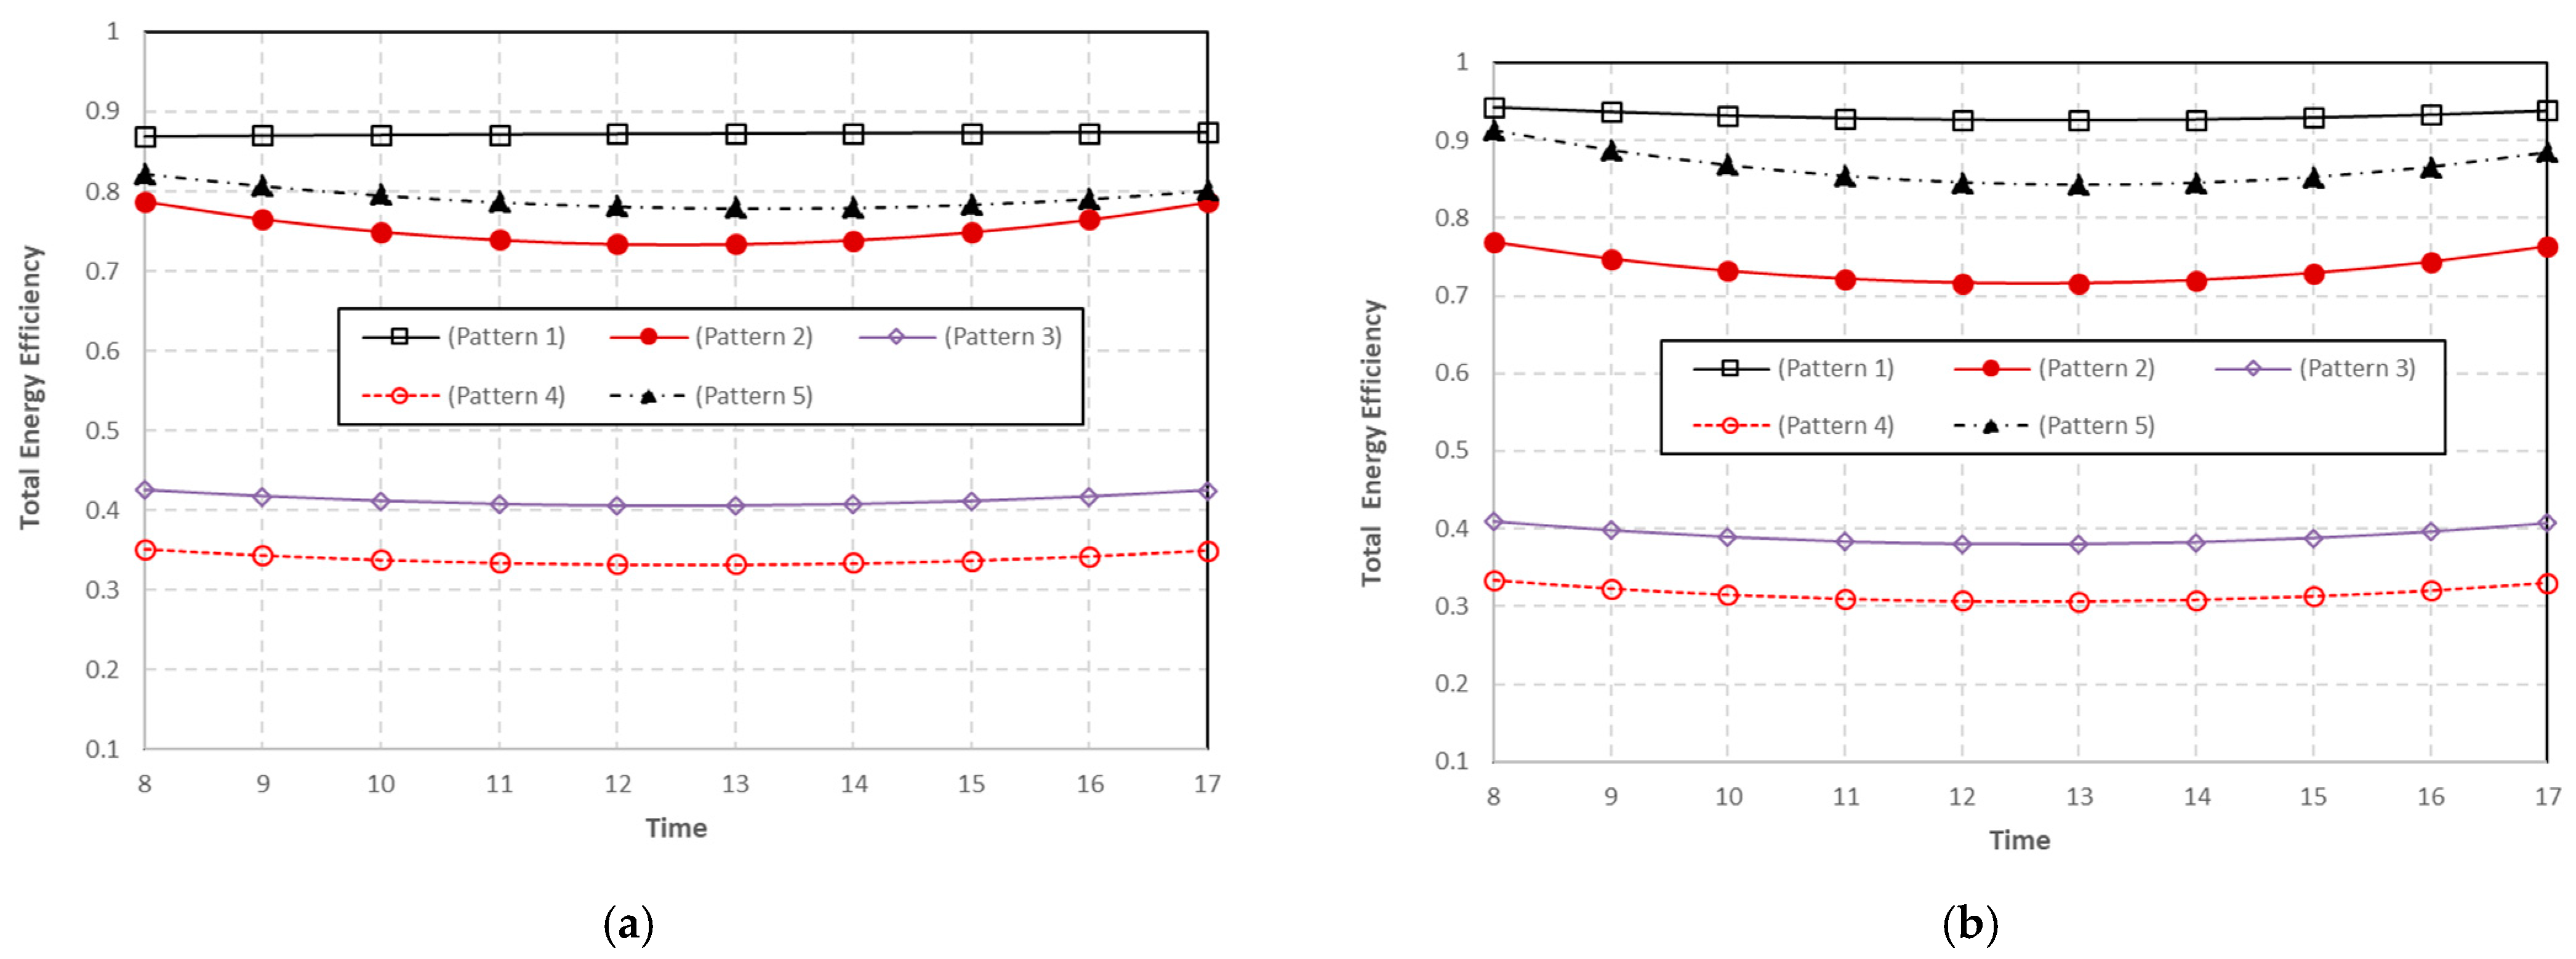
Figure 15a,b show the hourly variations in the efficiency of total energy for different configurations. It was found that the highest efficiency of total energy is achieved when using water as coolant at the bottom of the panel and air in the top (pattern 1) (average total energy efficiency 90%). Otherwise, the lowest efficiency of total energy in the panel is obtained when using coolant air below the panel (pattern 4) (average total energy efficiency 34%).
Figure 16a,b show the hourly variations in efficiency of electrical exergy for different configurations. It was found that the highest electrical exergy efficiency of the panel is achieved when using water cooling at the panel bottom (pattern 5) (average electrical exergy efficiency 13.6%). On the other hand, the lowest efficiency of electrical exergy is achieved when using air cooling above and below the panel (pattern 2) (average electrical exergy efficiency 12.1%), where the air acts more as a heat insulator than a coolant. This causes a rise in the temperature of the panel and, thus, a decrease in the electrical exergy extracted from the panel.
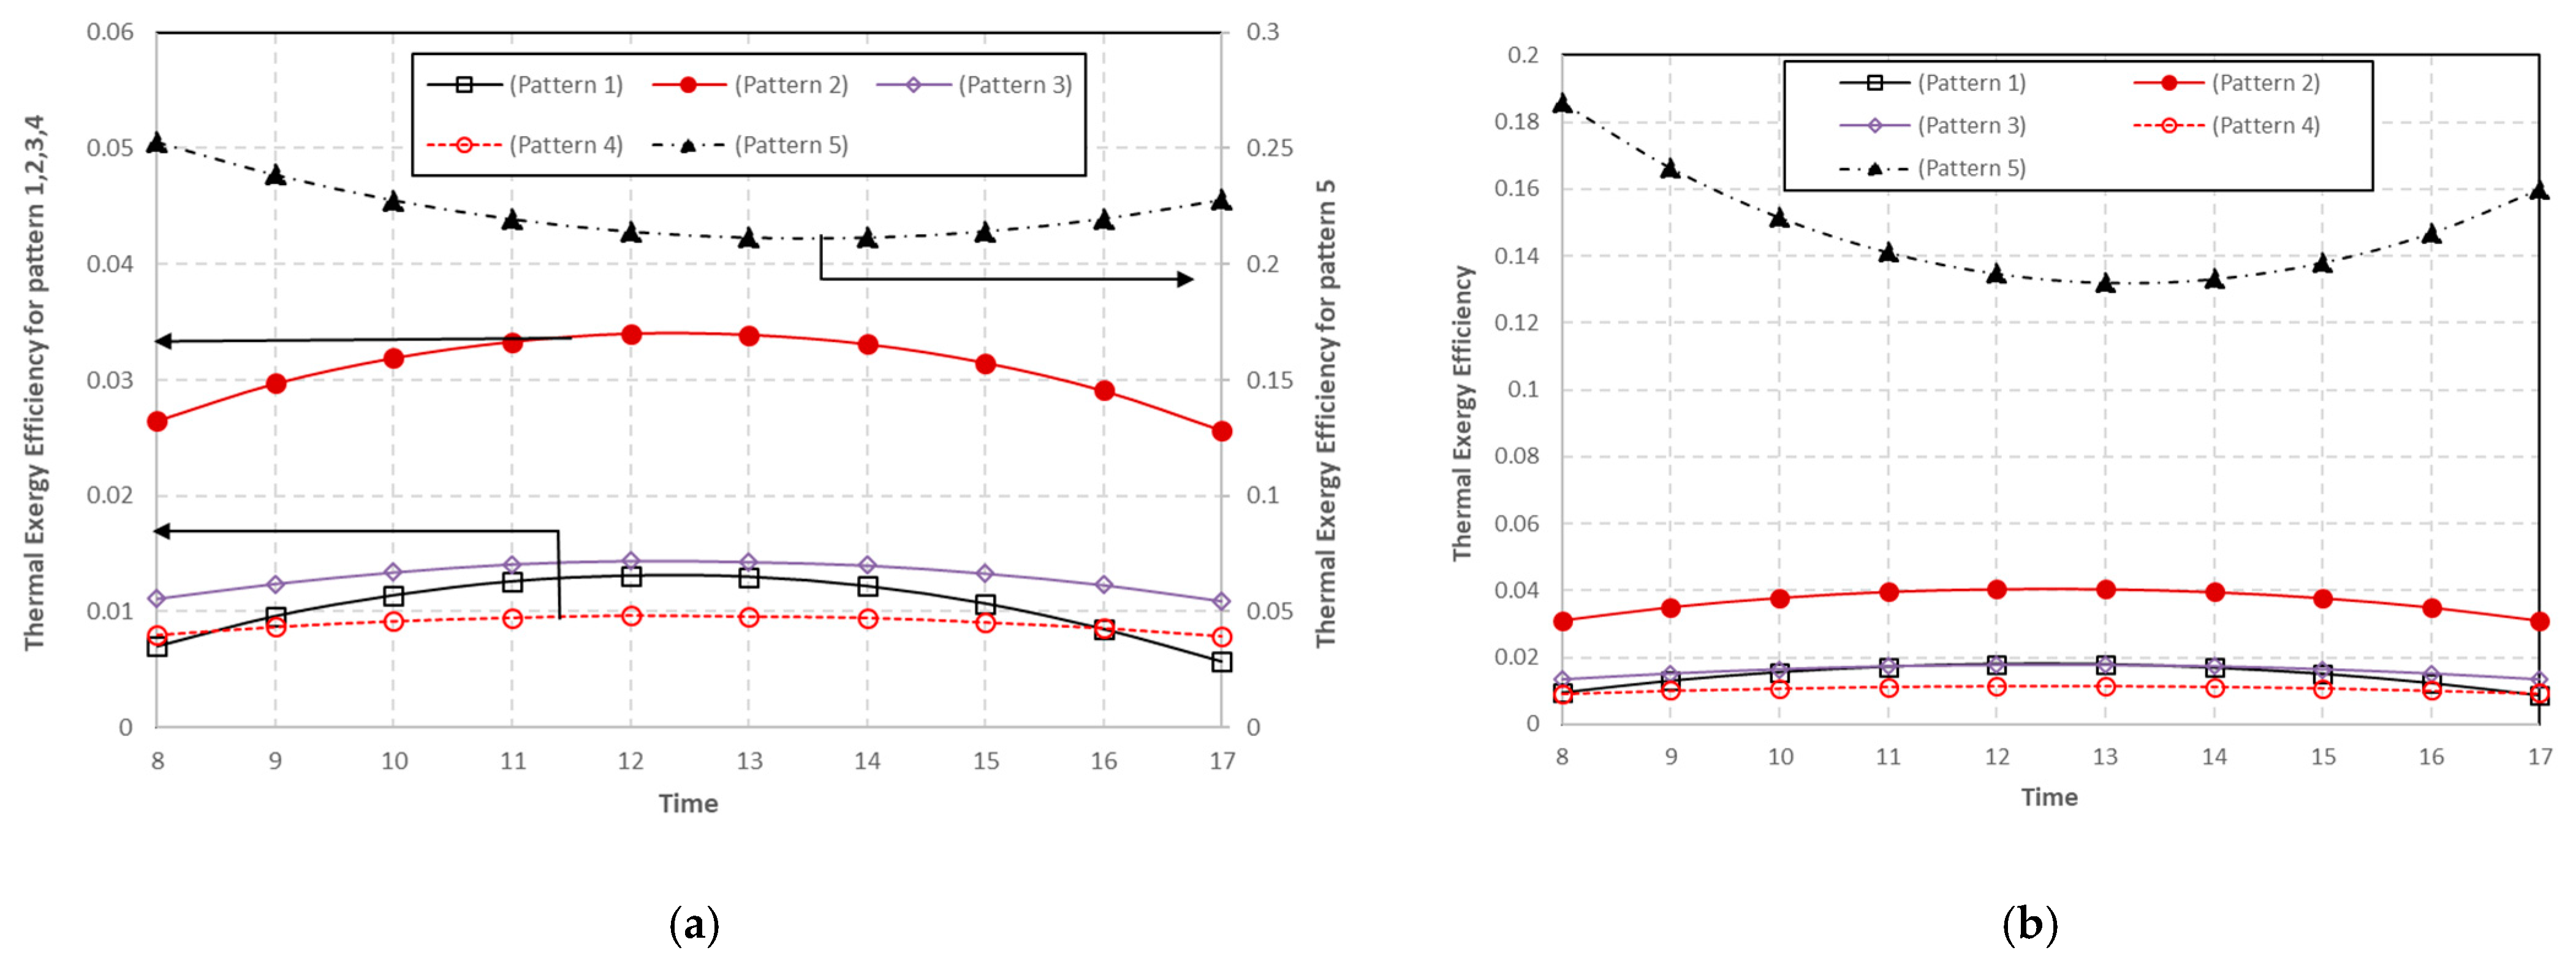
Figure 17a,b show the hourly variations in efficiency of thermal exergy of for different configurations. It was found that the highest efficiency of thermal exergy is achieved when using cooling water at the panel bottom (pattern 5) (average thermal exergy efficiency 18.5%). On the other hand, the lowest efficiency of thermal exergy is achieved when using air cooling below the panel (pattern 4) (average thermal exergy efficiency 1%). This is due to the thermal exergy extracted from water being higher than the thermal exergy from the air.
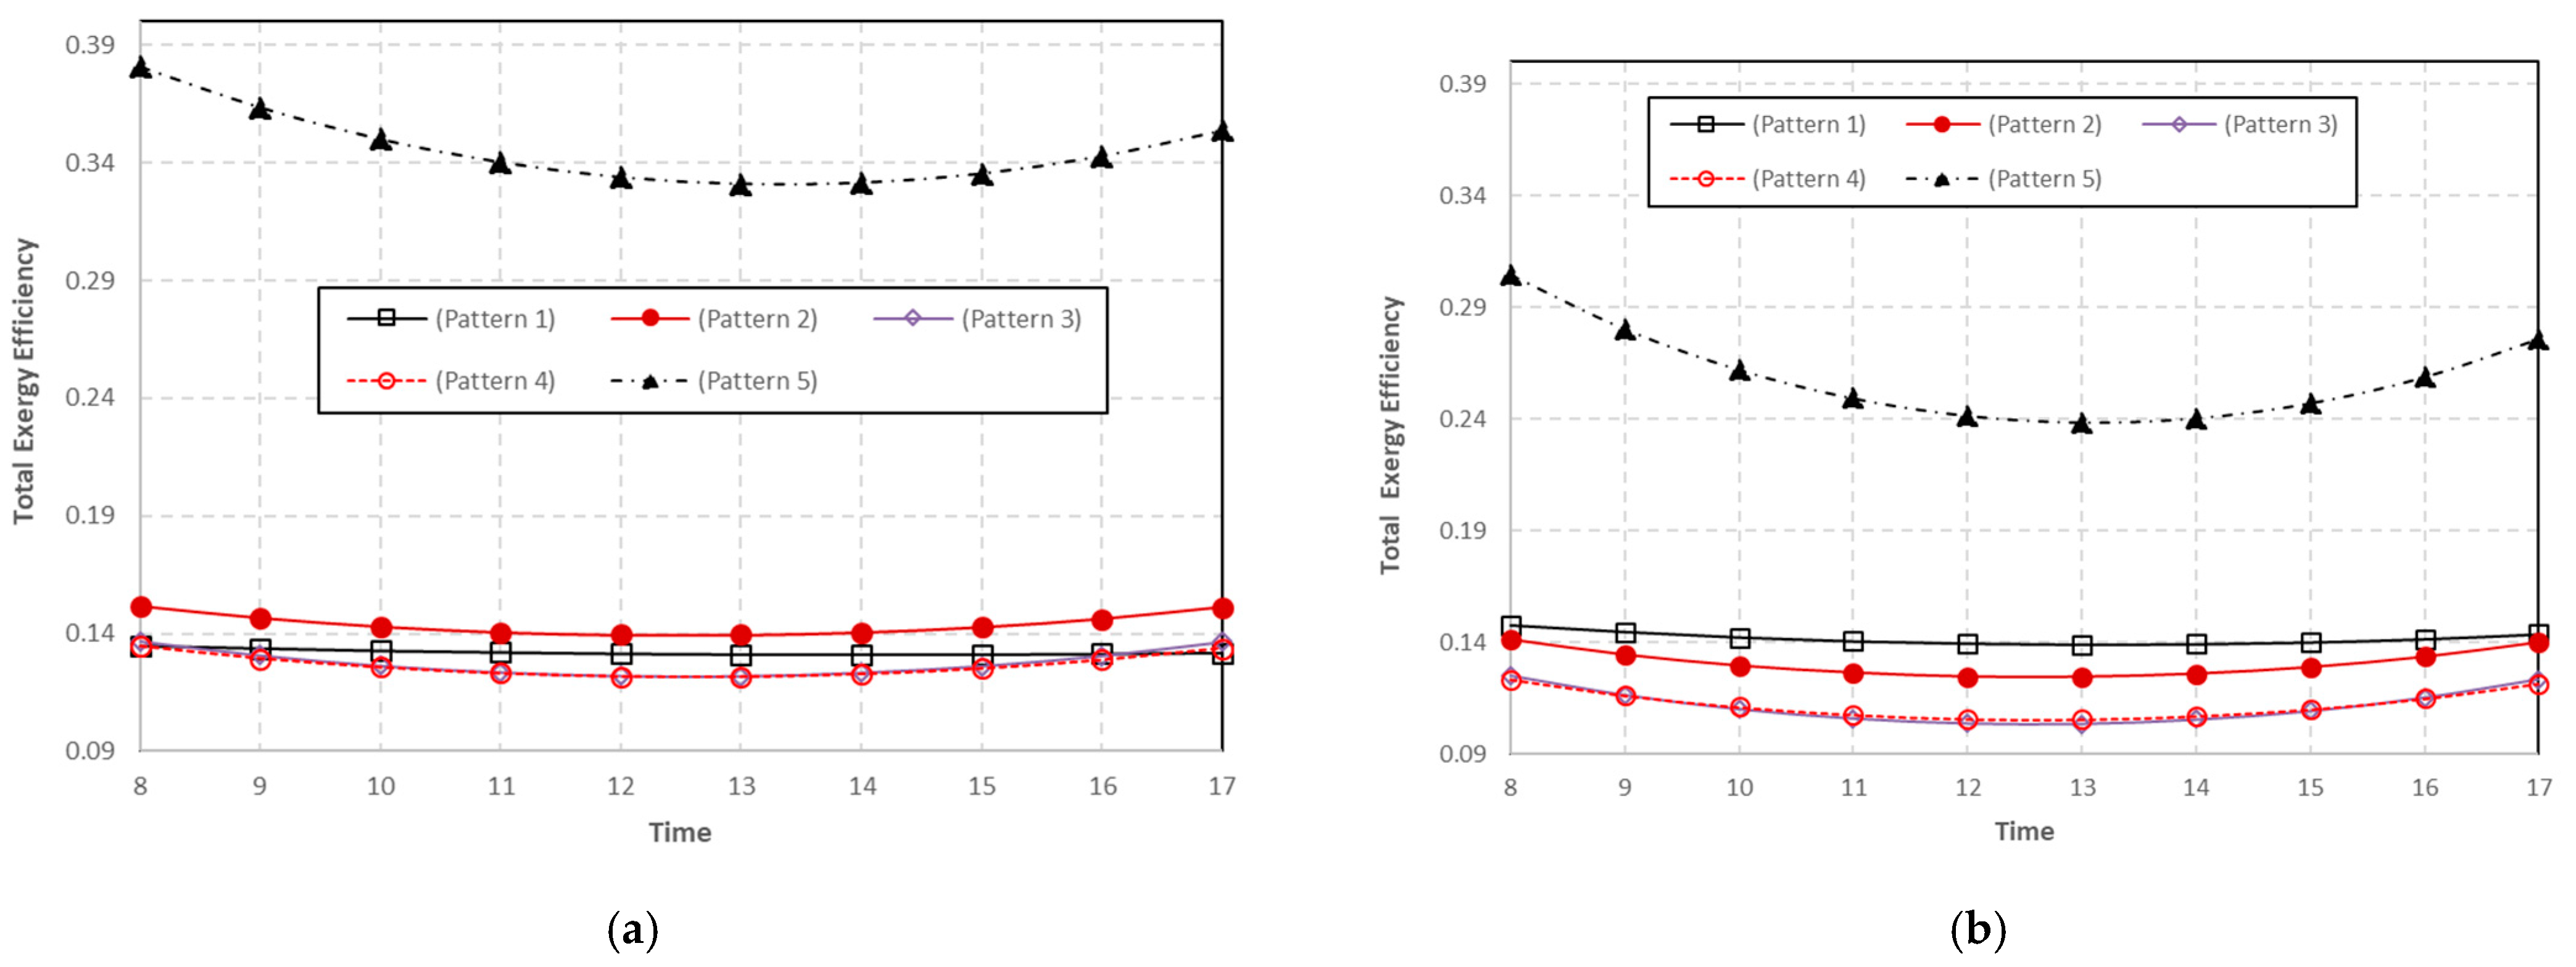
Figure 18a,b shows the hourly variations in the efficiency of total exergy for different configurations. It was found that the highest efficiency of total exergy is achieved when using cooling water at the bottom (pattern 5) (average electrical exergy efficiency 32.1%). On the other hand, the lowest efficiency of total exergy is achieved when using air cooling below the panel (pattern 4) (average total exergy efficiency 13.1%).
5.2.3. Effect of Water Flow Rate on PVT System
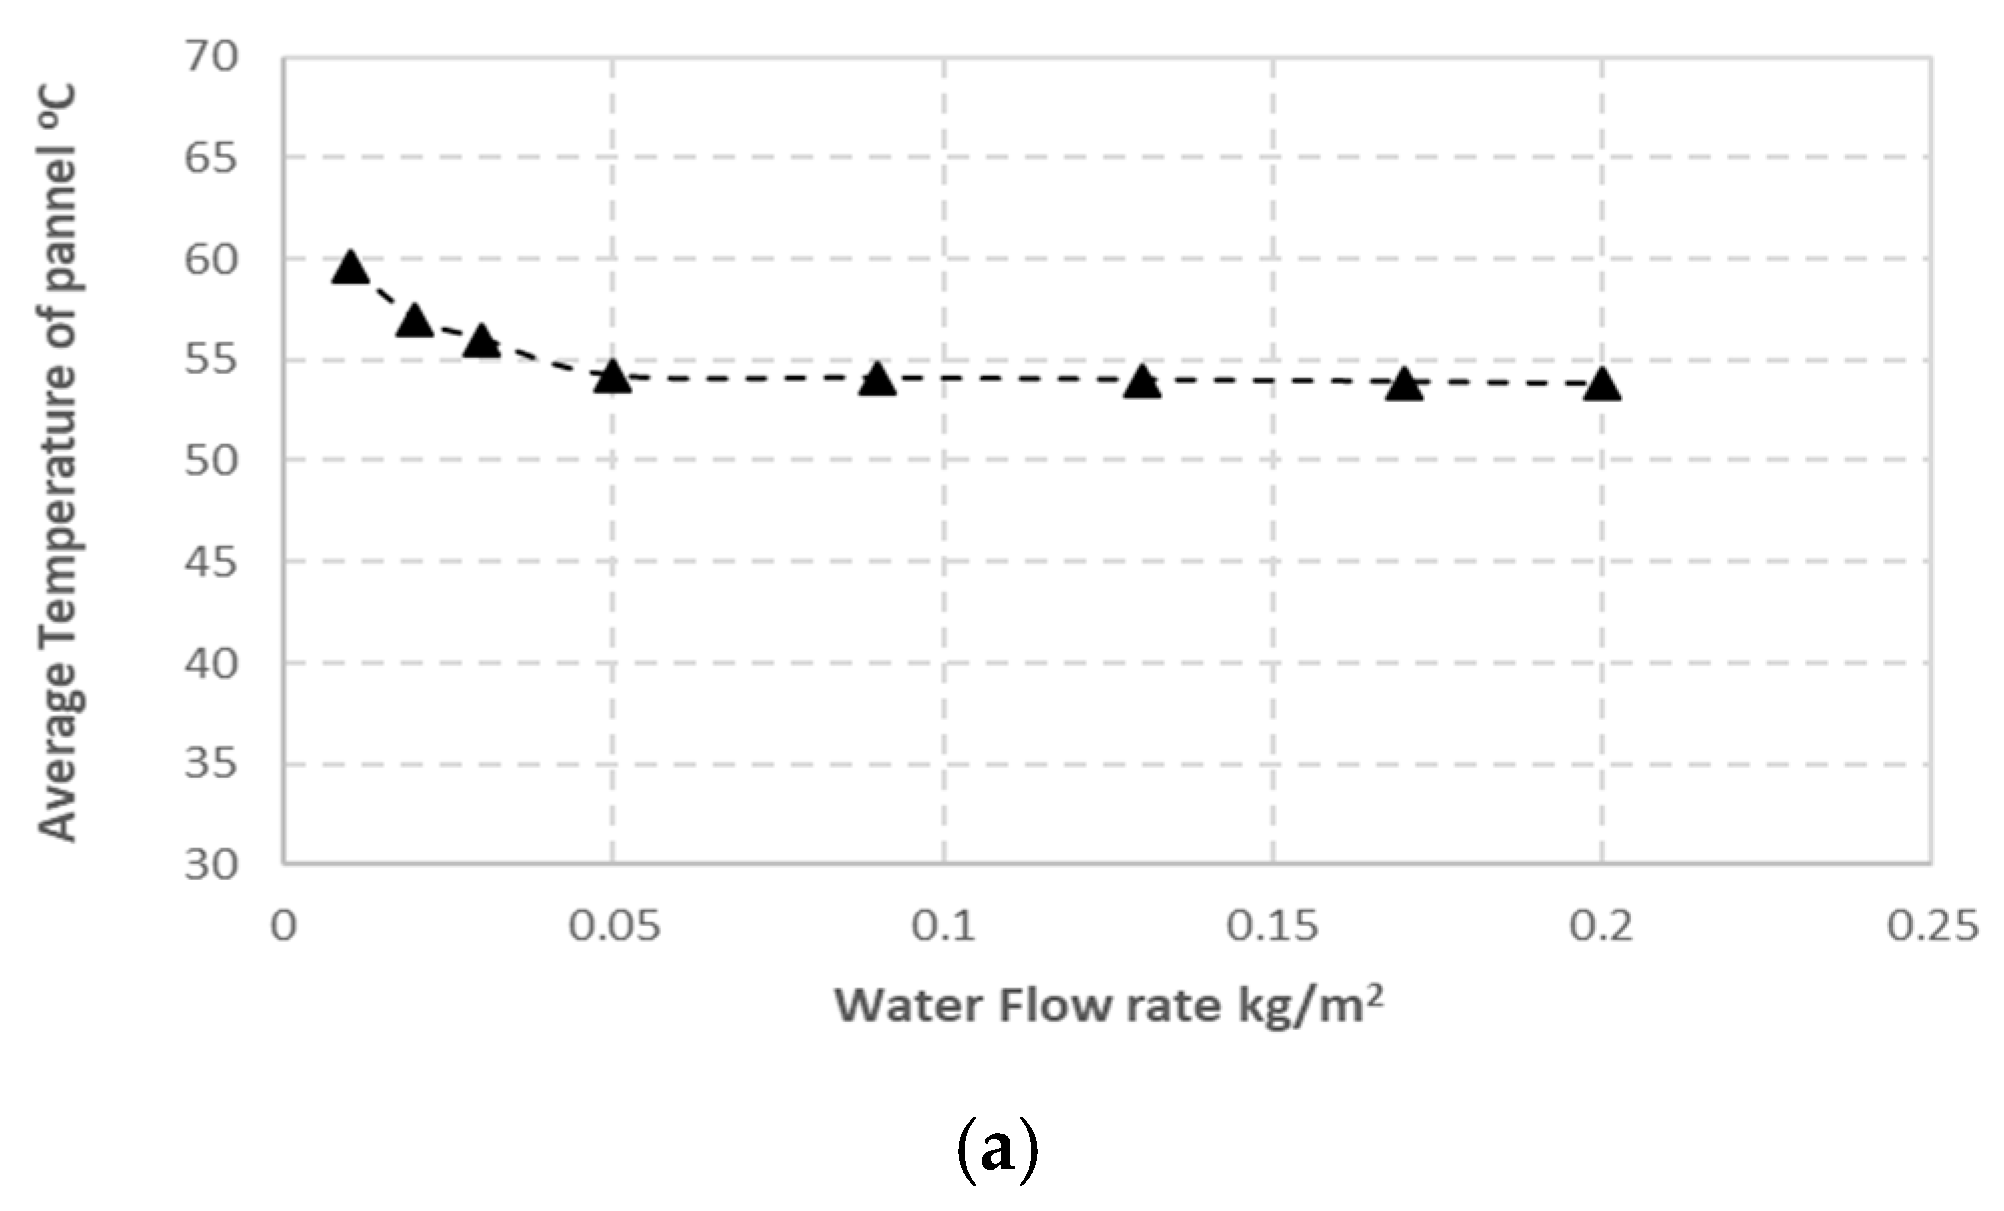
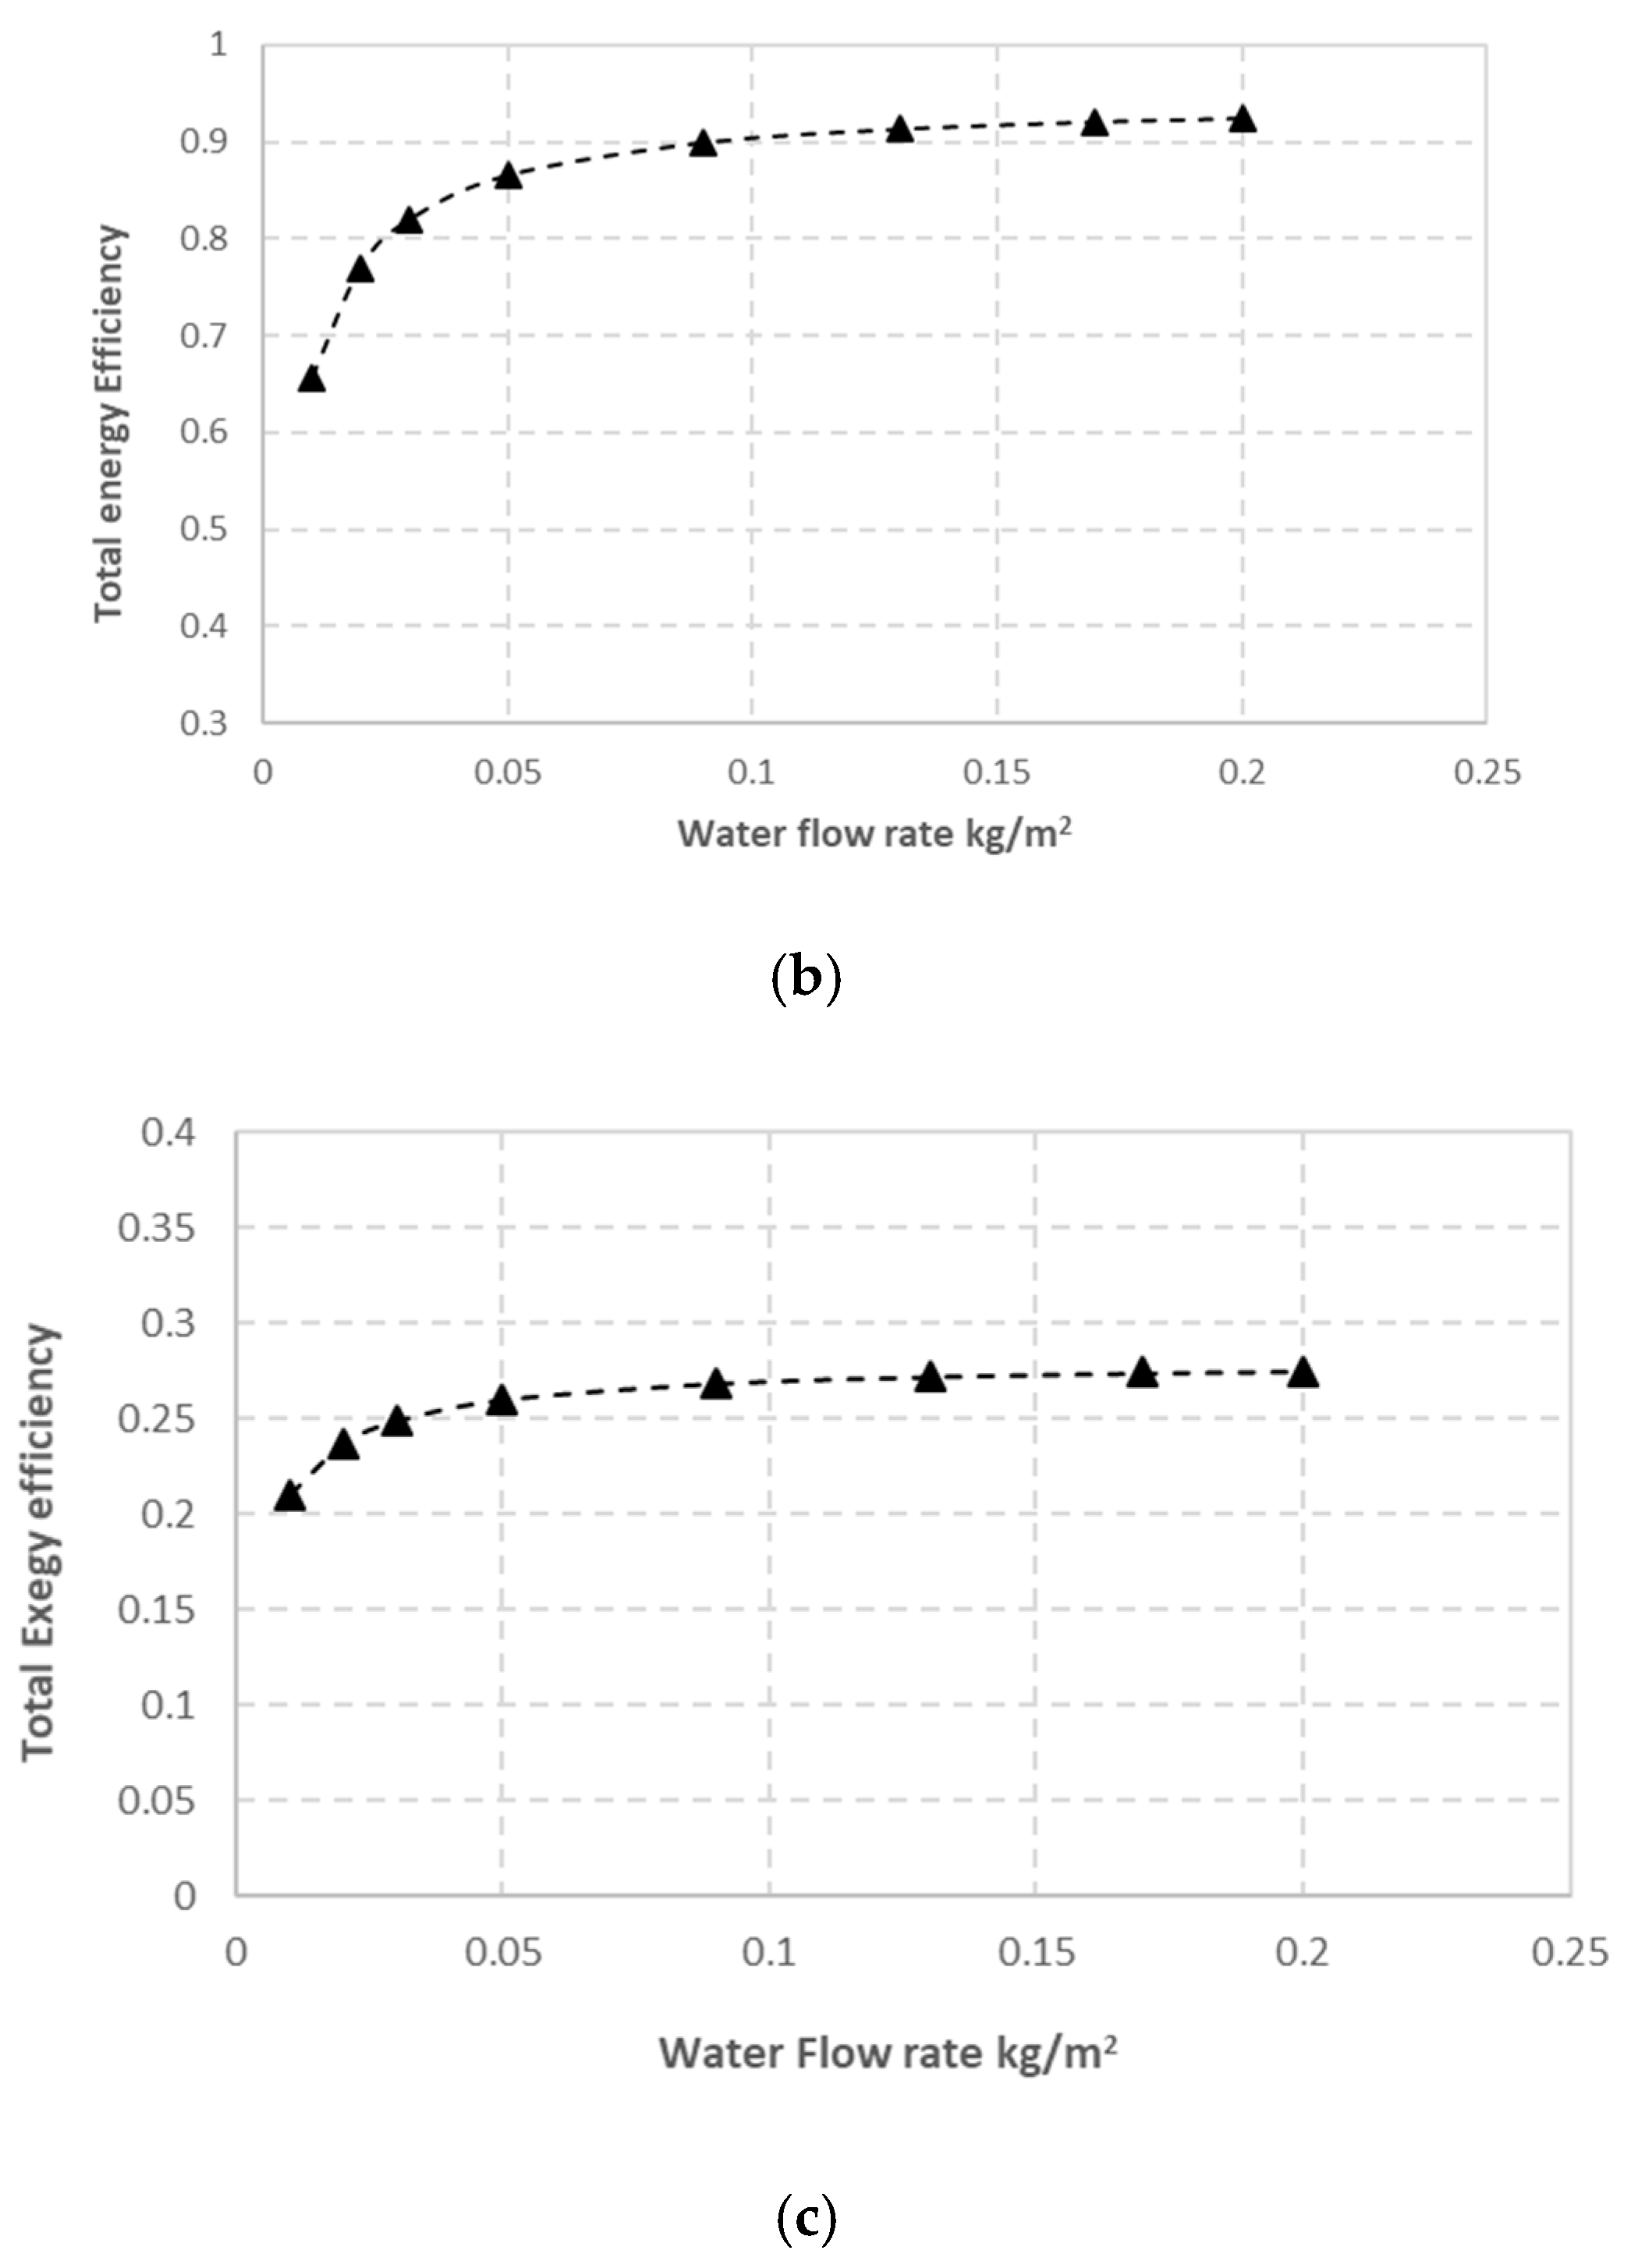
Figure 19a represents the influence of the cooling water mass flow rate on the average temperature of the panel. It is found that when the water flow rate is increased from 0.01 to 0.2 kg/s, the temperature of the plate decreases by 6 °C due to an increase in the velocity of the water through the channel, which causes an increase in the Nusselt number and an increase in the heat transfer coefficient.
While Figure 19b shows a 25% increase in the overall energy efficiency when the mass flow rate of water is increased from 0.01 to 0.2 kg/s, which is due to the increase in the efficiency of thermal energy as well as the efficiency of electrical energy of the panel due to the lower panel temperature, the rate of increase in efficiency decreases after 0.05 kg/s due to the attainment of fully turbulent flow. Figure 19c shows a 7% increase in the total exergy efficiency when the mass flow rate of the water is increased, which is due to the increase in the thermal exergy efficiency of the system as well as the electrical exergy efficiency of the panel due to the decrease in the panel temperature. After a mass flow rate of 0.05 kg/s, the rate of increase in efficiency decreases due to the attainment of a fully turbulent flow.
5.2.4. Effect of Solar Intensity
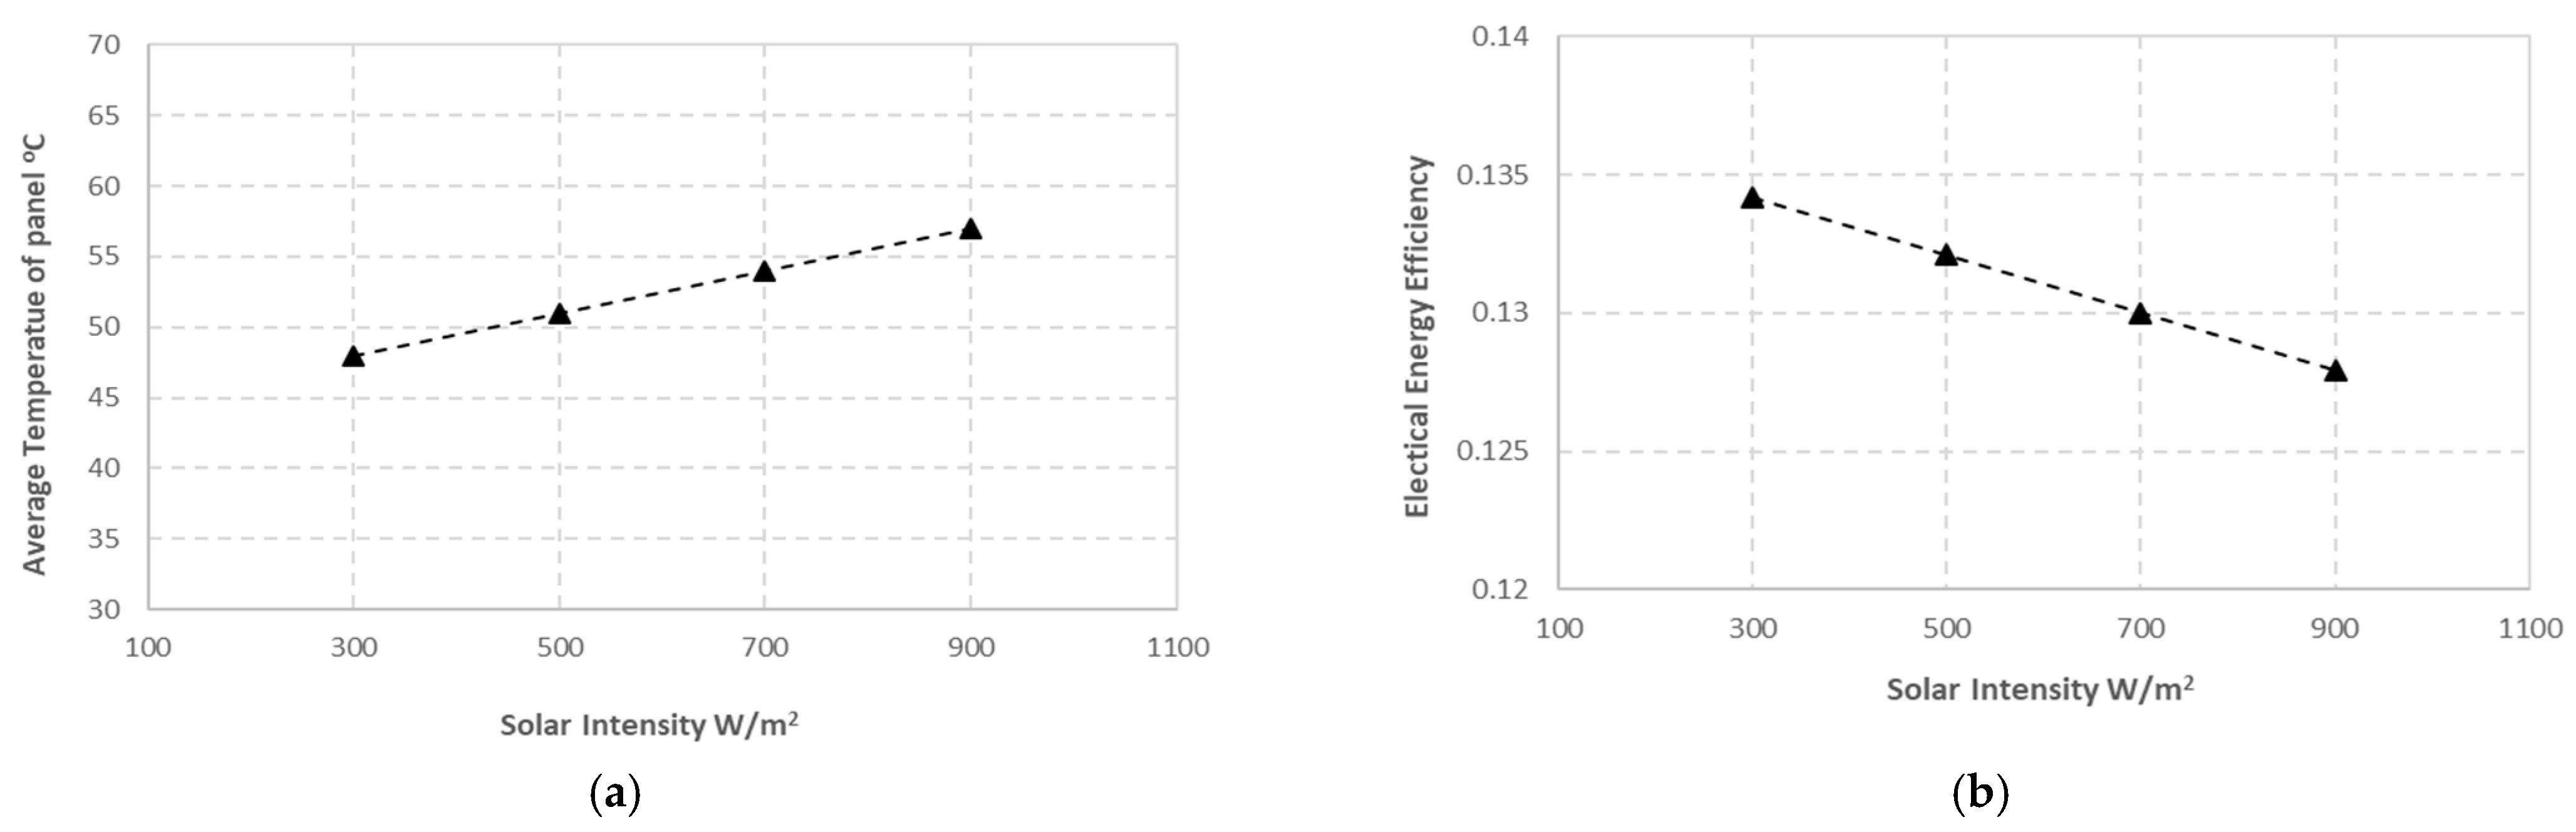
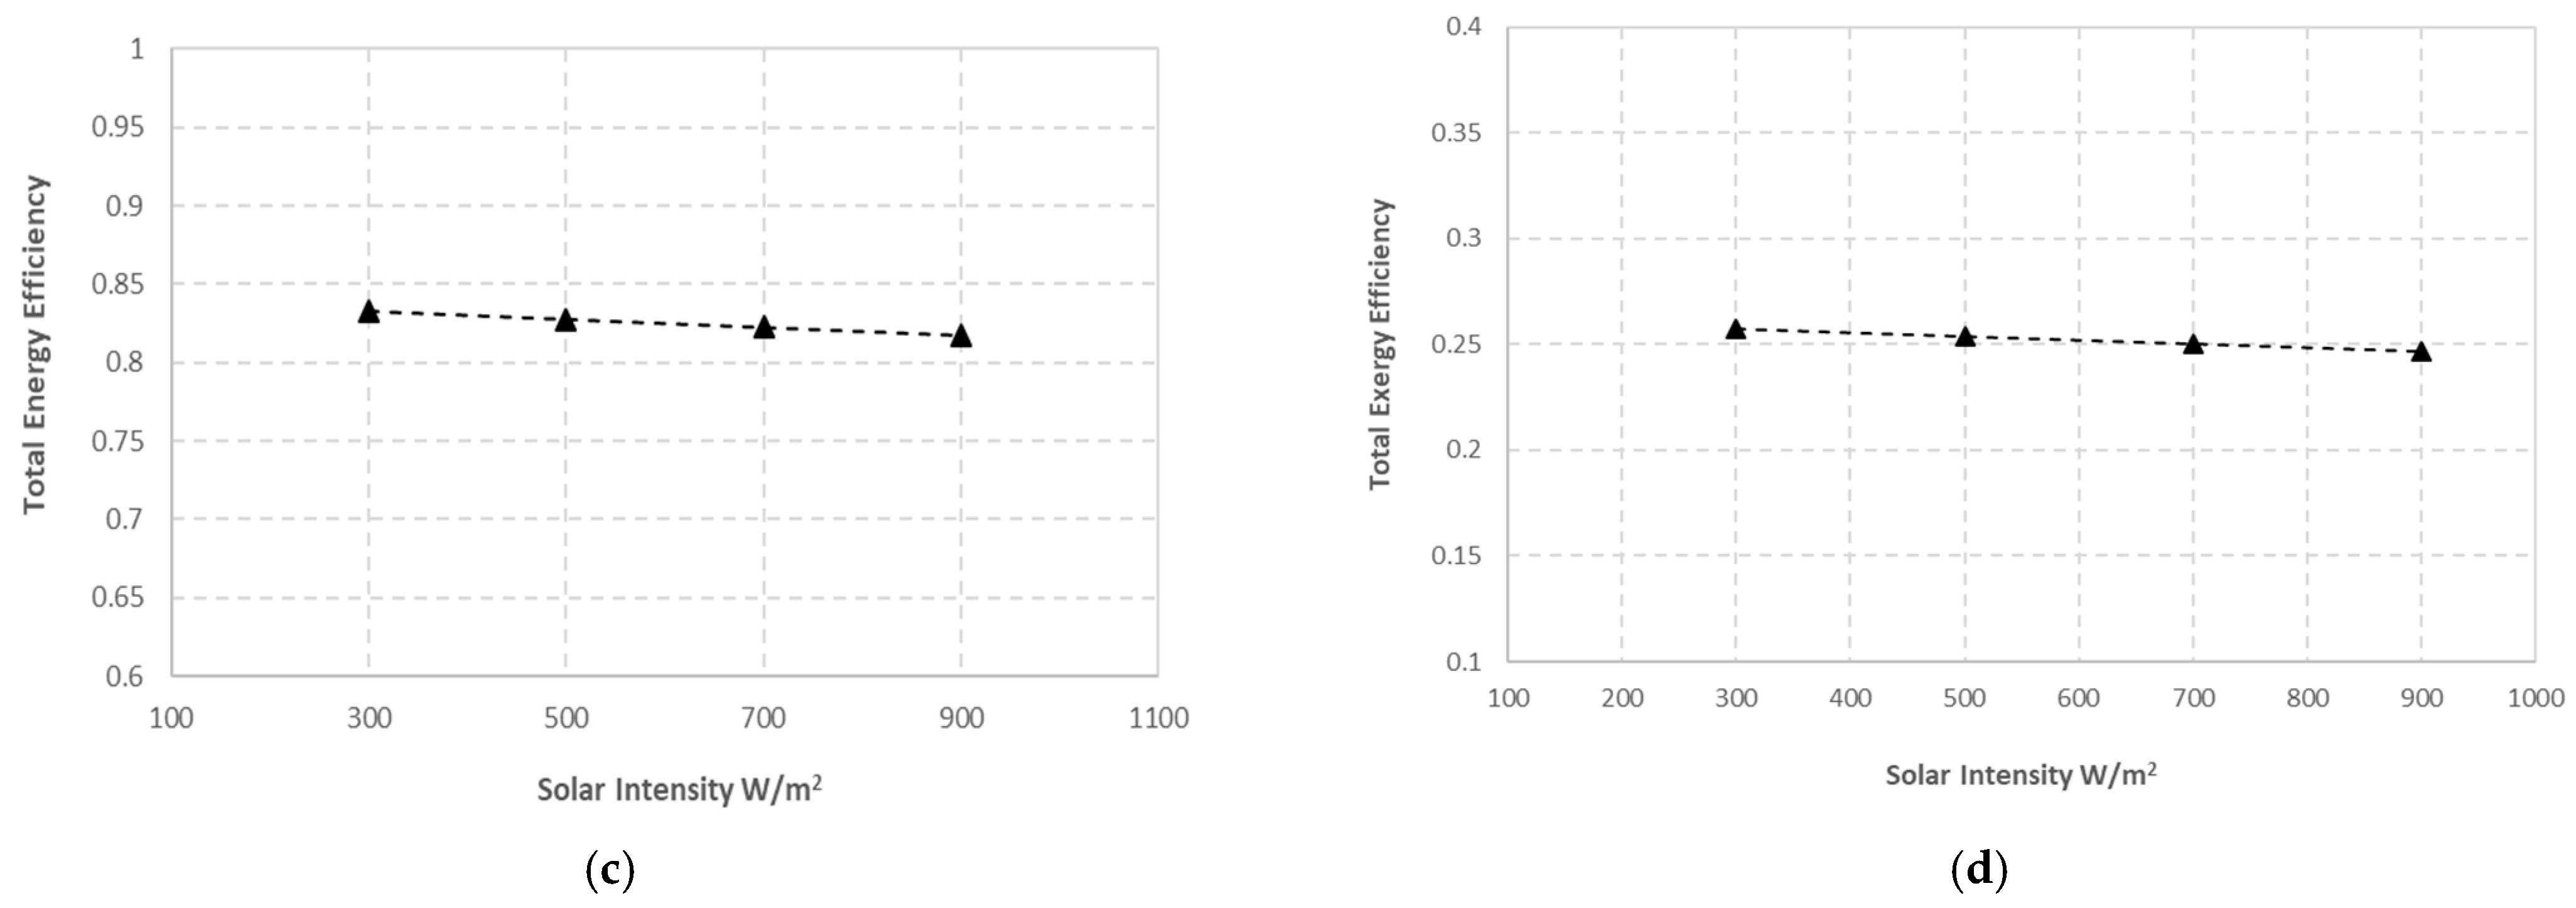
The effects of solar intensity (300 to 900 W/m2) on average panel temperature, total energy efficiency, and efficiency of total exergy are presented in Figure 20
Increasing the intensity of solar radiation leads to two effects. The first effect is to increase the panel’s temperature (by 10 °C), which leads to a decrease in the electrical energy efficiency (by 1%), of the system. The second effect is a rise in the outlet water temperature, which causes an increase in the thermal energy gained and a decrease in the thermal energy lost, so the thermal energy efficiency of the system tends to be constant. All of those lead to a slight decrease in the efficiency of total energy as solar radiation increases. The same analysis applies to the efficiency of total energy for the system.
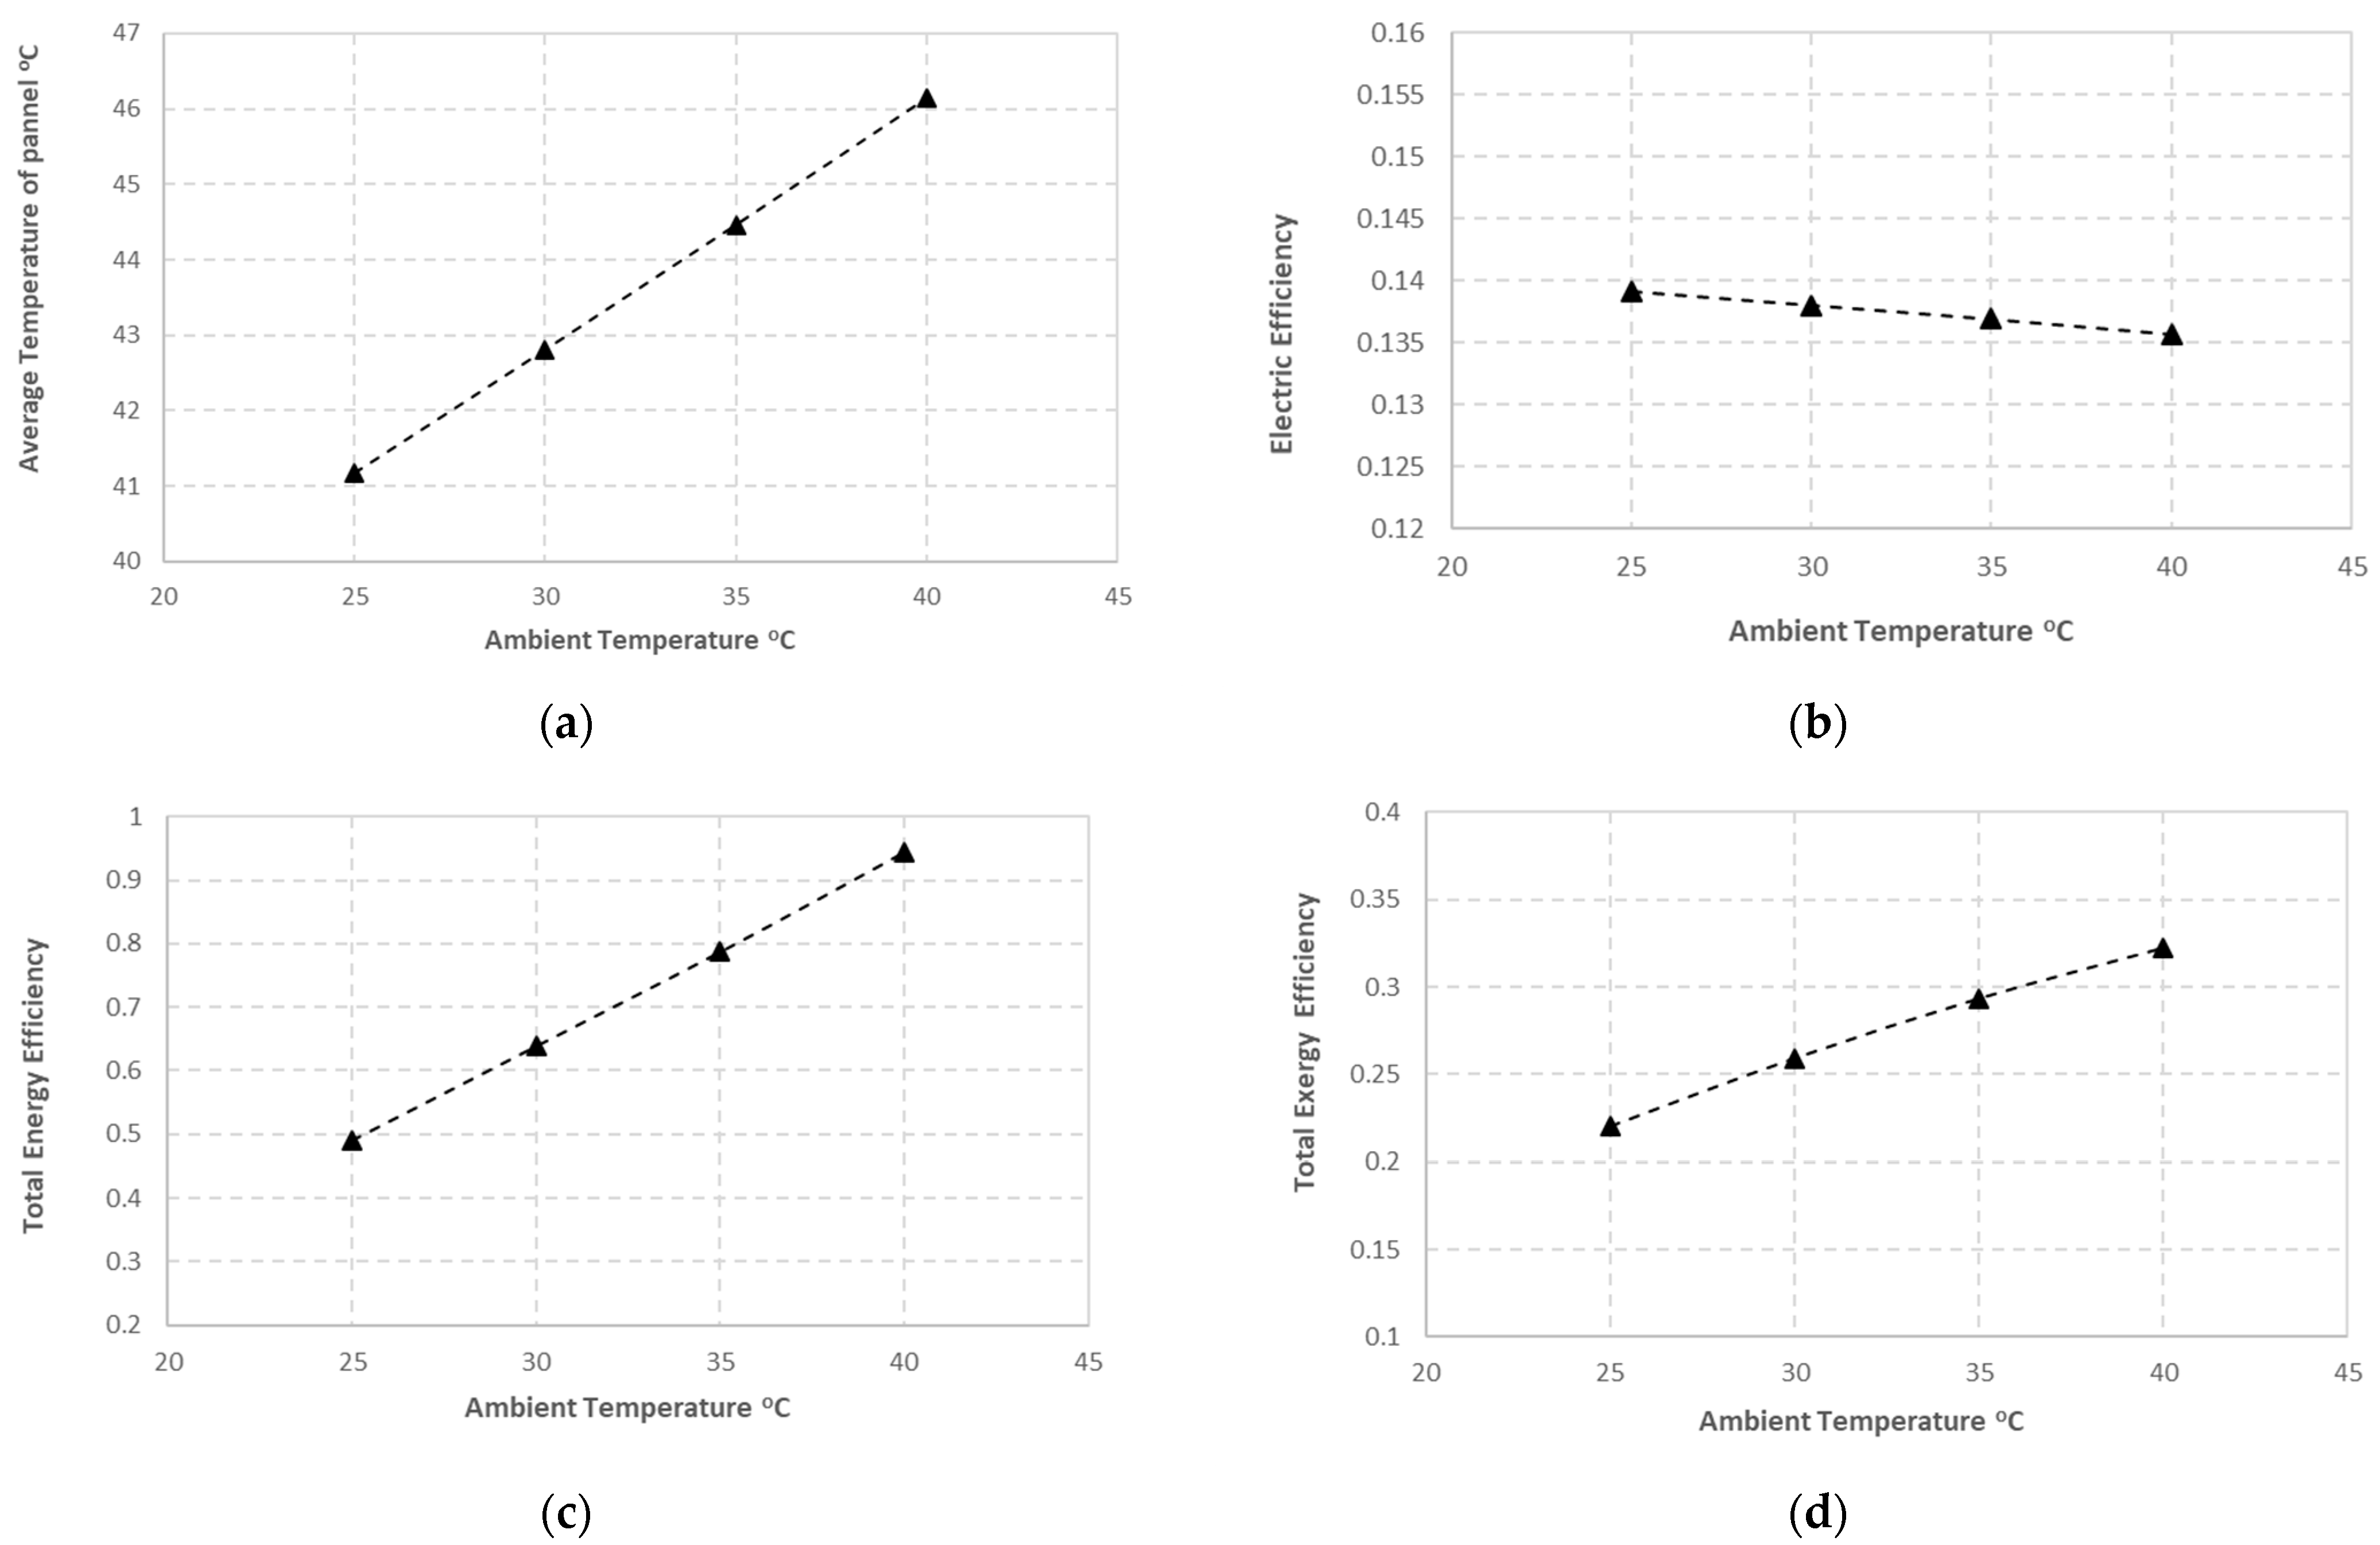
5.2.5. Effect of Ambient Temperature
The effects of ambient temperature (25 to 40 °C) on panel average temperature, total energy, and efficiency are shown in Figure 21. Increasing the ambient temperature leads to two effects. The first effect is to increase the temperature (by 5 °C) of the panel, which causes a decrease in the electrical energy efficiency (by 0.5%). The second effect is a decrease in the thermal energy lost, which causes an increase in the thermal energy gained, so the thermal energy efficiency of the system tends to increase. As the ambient temperature rises, all of these factors contribute to an increase in the total energy efficiency of the system (by 40%). The same analysis applies to the total exergy efficiency of the system.
6. Conclusions
In this work, PVT systems are simulated with different cooling patterns. The proposed model was validated with other published works, and energy and exergy analyses were performed to obtain the following results:
- The best cooling system is using water at the bottom of the panel (pattern 5), followed by using air at the top of the panel and water at the bottom of the panel, and the worst is using air at the bottom and top of the panel (pattern 2). The average panel temperature of pattern 5 is 21 °C lower than the average panel temperature of pattern 2.
- The highest efficiency of total energy is achieved with 90% when water is used as coolant at the bottom of the panel and air at the top (pattern 1); 34% is the lowest efficiency of total energy when air is used as coolant at the bottom of the panel (pattern 4).
- The performance of the PVT system was improved by increasing the water flow rate up to 0.05 kg/s. Above 0.05 kg/s, the improvement is insignificant.
- An increase in solar radiation has no effect on the performance of the PVT system.
- Increasing the ambient temperature will increase the collector temperature, decreasing the electrical energy efficiency by up to 13.5% but increasing the total energy efficiency in the PVT system by up to 90%.
Funding
The author acknowledges the financial support from Jouf University, Saudi Arabia, (Grant No. 39/801).
Data Availability Statement
The data presented in this study are available on request from the corresponding author.
Conflicts of Interest
The author declare no conflict of interest.
Nomenclature
| A | Area (m2) | Subscripts | |
| D | Diameter | a | Air |
| Cp | Specific heat of fluid (J/kg·K) | amb | Ambient |
| Electric Power (W) | conv | Convection | |
| Exergy | eff | Effective | |
| h | Coefficient of heat transfer (W/m2·K) | f1 | Fluid 1 |
| i | interval | el | Electrical |
| Flow rate of mass (kg/s) | f2 | Fluid 2 | |
| k | Thermal conductivity (W/m·K) | g | Glass cover |
| Nu | Nusslet number | h | Hydraulic |
| P∗ | Power (W) | in | Input |
| Pr | Prandtl number | ins | Insulation |
| PV | Photovoltaic panel | loss | loss |
| PVT | Photovoltaic thermal | max | Maximum |
| q | Heat transfer per unit area (J/m2) | out | Outlet |
| s | Specific entropy (J/kg·K) | pl | plate |
| Re | Reynolds number | pv | Photovoltaic unit |
| t | Time (s) | rad | radiation |
| T | Temperature (K) | ref | Reference |
| th | Specific enthalpy (J/kg) | t | Time |
| x | Interval of length (m) | th | Thermal |
| V | Velocity (m/s) | W | Wind |
| w | Width (m) | w | Water |
| Greeks | |||
| α | Absorptivity | ||
| η | Energy Efficiency | ||
| ρ | Density (kg/m3) | ||
| ζ | Exergy efficiency | ||
| σ | Stefan-Boltzmann constant (W/m2·K4) | ||
| ε | Emissivity | ||
| μ | Dynamic viscosity (kg/m·s) | ||
| ᵟ | Thickness (m) | ||
| τ | Transmissivity of glass cover |
Appendix A
Heat transfer rates:
Heat transfer Coefficients:
The convection heat transfer coefficient between fluid (1) and (or PV)
For fully developed laminar flow
For fully developed turbulent flow
The heat transfer coefficient of convection between fluid (1) and PV panel
The heat transfer coefficient of convection between glass and ambient
The heat transfer coefficient of radiation between glass and ambient
The heat transfer coefficient of radiation between glass and ambient
The heat transfer coefficient of convection between fluid (2) and PV panel
For fully developed laminar flow
For fully developed turbulent flow
The heat transfer coefficient of radiation between PV Panel and plate
The overall heat Transfer coefficients loss
The heat transfer coefficient of convection between ambient and insulation
Properties of water
Properties of air
References
- Said, Z.; Arora, S.; Bellos, E. A review on performance and environmental effects of conventional and nanofluid-based thermal photovoltaics. Renew. Sustain. Energy Rev. 2018, 94, 302–316. [Google Scholar] [CrossRef]
- Bhargava, A.K.; Garg, H.; Agarwal, R.K. Study of a hybrid solar system—Solar air heater combined with solar cells. Energy Convers. Manag. 1991, 31, 471–479. [Google Scholar] [CrossRef]
- Agarwal, R.K.; Garg, H. Study of a photovoltaic-thermal system—Thermosyphonic solar water heater combined with solar cells. Energy Convers. Manag. 1994, 35, 605–620. [Google Scholar] [CrossRef]
- Garg, H.; Agarwal, R.; Joshi, J. Experimental study on a hybrid photovoltaic-thermal solar water heater and its performance predictions. Energy Convers. Manag. 1994, 35, 621–633. [Google Scholar] [CrossRef]
- Garg, H.; Agarwal, R. Some aspects of a PV/T collector/forced circulation flat plate solar water heater with solar cells. Energy Convers. Manag. 1995, 36, 87–99. [Google Scholar] [CrossRef]
- Garg, H.P.; Adhikari, R.S. Conventional hybrid photovoltaic/thermal (PV/T) air heating collectors: Steady-state simulation. Renew. Energy 1997, 11, 363–385. [Google Scholar] [CrossRef]
- Garg, H.P.; Adhikari, R.S. Optical design calculations for CPCs. Energy Int. J. 1998, 23, 907–909. [Google Scholar]
- Garg, H.P.; Adhikari, R.S. Transient simulation of conventional hybrid photovoltaic/thermal (PV/T) air heating collectors. Int. J. Energy Res. 1998, 22, 547–562. [Google Scholar] [CrossRef]
- Garg, H.P.; Adhikari, R.S. System performance studies on a photovoltaic/thermal (PV/T) air heating collector. Renew. Energy 1999, 16, 725–730. [Google Scholar] [CrossRef]
- Garg, H.P.; Adhikari, R.S. Performance analysis of a hybrid photovoltaic/thermal (PV/T) collector with integrated CPC troughs. Int. J. Energy Res. 1999, 23, 1295–1304. [Google Scholar] [CrossRef]
- Sopian, K.; Yigit, K.S.; Liu, H.T.; Kakaç, S.; Veziroglu, T.N. Performance analysis of photovoltaic thermal air heaters. Energy Convers. Manag. 1996, 37, 1657–1670. [Google Scholar] [CrossRef]
- Sopian, K.; Liu, H.; Kakac, S.; Veziroglu, T. Performance of a double pass photovoltaic thermal solar collector suitable for solar drying systems. Energy Convers. Manag. 2000, 41, 353–365. [Google Scholar] [CrossRef]
- Prakash, J. Transient analysis of a photovoltaic-thermal solar collector for co-generation of electricity and hot air/water. Energy Convers. Manag. 1994, 35, 967–972. [Google Scholar] [CrossRef]
- Rejeb, O.; Dhaou, H.; Jemni, A. A numerical investigation of a photovoltaic thermal (PV/T) collector. Renew. Energy 2015, 77, 43–50. [Google Scholar] [CrossRef]
- Al Harbi, Y.; Eugenio, N.N.; Al Zahrani, S. Photovoltaic-thermal solar energy experiment in Saudi Arabia. Renew Energy 1998, 15, 483–486. [Google Scholar] [CrossRef]
- Calise, F.; Figaj, R.D.; Vanoli, L. Experimental and Numerical Analyses of a Flat Plate Photovoltaic/Thermal Solar Collector. Energies 2017, 10, 491. [Google Scholar] [CrossRef] [Green Version]
- Hussain, M.I.; Kim, J.-H.; Kim, J.-T. Nanofluid-Powered Dual-Fluid Photovoltaic/Thermal (PV/T) System: Comparative Numerical Study. Energies 2019, 12, 775. [Google Scholar] [CrossRef] [Green Version]
- El Manssouri, O.; Hajji, B.; Tina, G.M.; Gagliano, A.; Aneli, S. Electrical and Thermal Performances of Bi-Fluid PV/Thermal Collectors. Energies 2021, 14, 1633. [Google Scholar] [CrossRef]
- Van Hoang, V.; Le, H.C.; Nguyen, B.T. Energy, Exergy Efficiency and Thermal-Electrical Production Assessment for an Active Water Heating System Using Four PV/T Module Models. Energies 2022, 15, 9634. [Google Scholar] [CrossRef]
- Charalambous, P.G.; Maidment, G.G.; Kalogirou, S.A.; Yiakoumetti, K. Photovoltaic thermal (PV/T) collectors: A review. Appl. Therm. Eng. 2007, 27, 275–286. [Google Scholar] [CrossRef] [Green Version]
- Ibrahim, A.; Othman, M.Y.; Ruslan, M.H.; Mat, S.; Sopian, K. Recent advances in flat plate photovoltaic/thermal (PV/T) solar collectors. Renew. Sustain. Energy Rev. 2010, 15, 352–365. [Google Scholar] [CrossRef]
- Kazem, H.A.; Chaichan, M.T.; Yousif, J.H. Evaluation of oscillatory flow Photovoltaic/Thermal system in Oman. Int. J. Comput. Appl. Sci. 2019, 6, 1. [Google Scholar]
- Fuentes, M.; Vivar, M.; de la Casa, J.; Aguilera, J. An experimental comparison between commercial hybrid PV-T and simple PV systems intended for BIPV. Renew. Sustain. Energy Rev. 2018, 93, 110–120. [Google Scholar] [CrossRef]
- Souliotis, M.; Arnaoutakis, N.; Panaras, G.; Kavga, A.; Papaefthimiou, S. Experimental study and Life Cycle Assessment (LCA) of Hybrid Photovoltaic/Thermal (PV/T) solar systems for domestic applications. Renew. Energy 2018, 126, 708–723. [Google Scholar] [CrossRef]
- Joshi, A.S.; Tiwari, A. Energy and exergy efficiencies of a hybrid photovoltaic–thermal (PV/T) air collector. Renew. Energy 2007, 32, 2223–2241. [Google Scholar] [CrossRef]
- Fakouriyan, S.; Saboohi, Y.; Fathi, A. Experimental analysis of a cooling system effect on photovoltaic panels’ efficiency and its preheating water production. Renew. Energy 2019, 134, 1362–1368. [Google Scholar] [CrossRef]
- Omer, K.A.; Zala, A.M. Experimental investigation of PV/thermal collector with theoretical analysis. Renew. Energy Focus 2018, 27, 67–77. [Google Scholar] [CrossRef]
- Hu, M.; Zhao, B.; Ao, X.; Zhao, P.; Su, Y.; Pei, G. Field investigation of a hybrid photovoltaic-photothermic-radiative cooling system. Appl. Energy 2018, 231, 288–300. [Google Scholar] [CrossRef]
- Manokar, A.M.; Winston, D.P.; Kabeel, A.; El-Agouz, S.; Sathyamurthy, R.; Arunkumar, T.; Madhu, B.; Ahsan, A. Integrated PV/T solar still- A mini-review. Desalination 2018, 435, 259–267. [Google Scholar] [CrossRef]
- Zondag, H.; de Vries, D.; van Helden, W.; van Zolingen, R.; van Steenhoven, A. The yield of different combined PV-thermal collector designs. Sol. Energy 2003, 74, 253–269. [Google Scholar] [CrossRef]
- Tiwari, A.; Sodha, M. Performance evaluation of solar PV/T system: An experimental validation. Sol. Energy 2006, 80, 751–759. [Google Scholar] [CrossRef]
- Nafey, A.; Fath, H.; El-Helaby, S.; Soliman, A. Solar desalination using humidification dehumidification processes. Part I. A Numer. Investig. Energy Convers. Manag. 2004, 45, 1243–1261. [Google Scholar] [CrossRef]
- Fine, J.P.; Dworkin, S.B.; Friedman, J. A methodology for predicting hybrid solar panel performance in different operating modes. Renew. Energy 2018, 130, 1198–1206. [Google Scholar] [CrossRef]
- Bambrook, S.; Sproul, A. A solvable thermal circuit for modelling PVT air collectors. Sol. Energy 2016, 138, 77–87. [Google Scholar] [CrossRef]
- Kazemiana, A.; Salarib, A.; Hakkaki-Fardb, A.; Maa, T. Numerical investigation and parametric analysis of a photovoltaic thermal system integrated with phase change material. Appl. Energy 2019, 238, 734–746. [Google Scholar] [CrossRef]
- Aberoumanda, S.; Ghamarib, S.; Shabanic, B. Energy and exergy analysis of a photovoltaic thermal (PV/T) system using nanofluids: An experimental study. Sol. Energy 2018, 165, 167–177. [Google Scholar] [CrossRef]
- Kazemiana, A.; Taherib, A.; Sardarabadib, A.; Maa, T.; Passandideh-Fardb, M.; Peng, J. Energy, exergy and environmental analysis of glazed and unglazed PVT system integrated with phase change material: An experimental approach. Sol. Energy 2020, 201, 178–189. [Google Scholar] [CrossRef]
- Nazri, N.S.; Fudholi, A.; Mustafa, W.; Hoy Yen, C.H.; Mohammad, M.; Ruslan, M.H.; Sopian, K. Exergy and improvement potential of hybrid photovoltaic thermal/ thermoelectric (PVT/TE) air collector. Renew. Sustain. Energy Rev. 2019, 111, 132–144. [Google Scholar] [CrossRef]
- Fudholia, A.; Zohria, M.; Rukmana, N.S.B.; Nazria, N.S.; Mustaphaa, M.; Yena, C.H.; Mohammada, M.; Sopian, K. Exergy and sustainability index of photovoltaic thermal (PVT) air collector: A theoretical and experimental study. Renew. Sustain. Energy Rev. 2019, 100, 44–51. [Google Scholar] [CrossRef]
- Sobhnamayan, F.; Sarhaddi, F.; Alavi, M.A.; Farahat, S.; Yazdanpanahi, J. Optimization of a solar photovoltaic thermal (PV/T) water collector based on exergy concept. Renew. Energy 2014, 68, 356–365. [Google Scholar] [CrossRef]
- Menon, G.S.; Murali, S.; Elias, J.; Aniesrani Delfiya, D.S.; Alfiya, P.V.; Samuel, M.P. Experimental investigations on unglazed photovoltaic-thermal (PVT) system using water and nanofluid cooling medium. Renew. Energy 2022, 188, 986–996. [Google Scholar] [CrossRef]
- Evola, G.; Marletta, L. Exergy and thermoeconomic optimization of a water-cooled glazed hybrid photovoltaic/thermal (PVT) collector. Sol. Energy 2014, 107, 12–25. [Google Scholar] [CrossRef]
- Shan, F.; Tang, F.; Cao, L.; Fang, G. Comparative simulation analyses on dynamic performances of photovoltaic–thermal solar collectors with different configurations. Energy Convers. Manag. 2014, 87, 778–786. [Google Scholar] [CrossRef]
- Su, D.; Jia, Y.; Huang, X.; Alva, G.; Tang, Y.; Fang, G. Dynamic performance analysis of photovoltaic–thermal solar collector with dual channels for different fluids. Energy Convers. Manag. 2016, 120, 13–24. [Google Scholar] [CrossRef]
Figure 1.
Various PVT patterns (a) cooling with two fluid (b) cooling with one fluid below the panel (c) cooling with one fluid above the panel.
Figure 1.
Various PVT patterns (a) cooling with two fluid (b) cooling with one fluid below the panel (c) cooling with one fluid above the panel.

Figure 2.
Energy PV/T Model.

Figure 3.
Exergy PV/T Model.

Figure 4.
Flow chart of simulation steps.

Figure 5.
Comparison of the thermal-electrical efficiency of the present work and Vielt [19].
Figure 5.
Comparison of the thermal-electrical efficiency of the present work and Vielt [19].

Figure 6.
(a) Weather conditions of Oussama [18] (b) Comparison of the total efficiency of the present work and Oussama [18].

Figure 7.
Hourly variations in efficiency of electrical energy (a) for present model and [40] (b) for present model and [41].

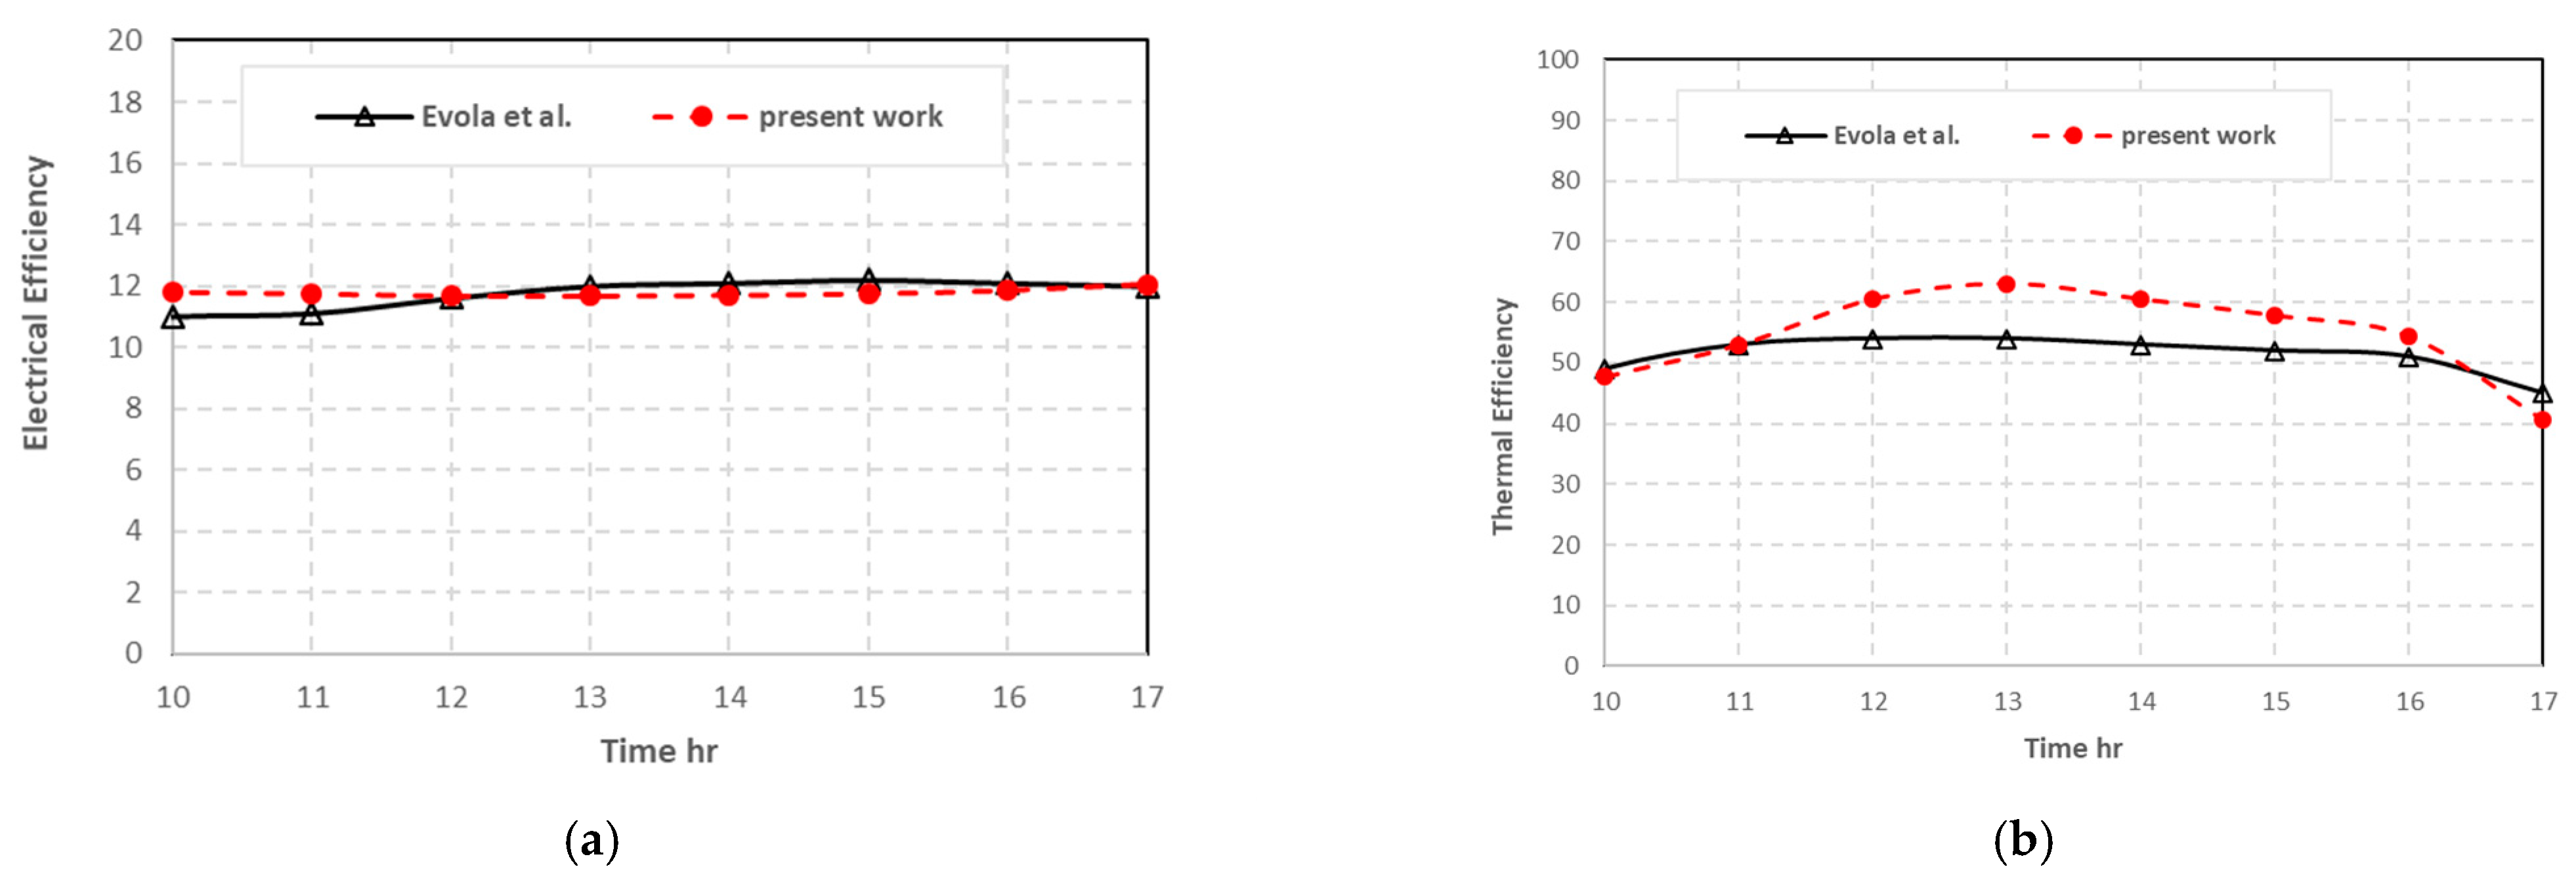
Figure 8.
Hourly variations in (a) electrical efficiency for present model and [42] (b) thermal efficiency for present model and [42].

Figure 9.
Hourly variations in panel temperature (a) for present model and [43] (b) for present model and [44].

Figure 10.
Hourly variations in outlet water temperature (a) for present model and [40] (b) for present model and [41].

Figure 11.
Hourly variations in ambient temperature and solar intensity (a) during Winter day (b) during Summer day.
Figure 11.
Hourly variations in ambient temperature and solar intensity (a) during Winter day (b) during Summer day.

Figure 12.
Hourly variations in panel temperature of PVT system for different configurations. (a) during Winter day (b) during Summer day.
Figure 12.
Hourly variations in panel temperature of PVT system for different configurations. (a) during Winter day (b) during Summer day.

Figure 13.
Hourly variations in efficiency of electrical energy for different configurations. (a) during Winter day (b) during Summer day.
Figure 13.
Hourly variations in efficiency of electrical energy for different configurations. (a) during Winter day (b) during Summer day.

Figure 14.
Hourly variations in efficiency of thermal energy for different configurations. (a) during Winter day (b) during Summer day.
Figure 14.
Hourly variations in efficiency of thermal energy for different configurations. (a) during Winter day (b) during Summer day.

Figure 15.
Hourly variations in the efficiency of total energy of PVT system for different configurations. (a) during Winter day (b) during Summer day.
Figure 15.
Hourly variations in the efficiency of total energy of PVT system for different configurations. (a) during Winter day (b) during Summer day.

Figure 16.
Hourly variations in efficiency of electrical exergy for different configurations (a) during Winter day (b) during Summer day.
Figure 16.
Hourly variations in efficiency of electrical exergy for different configurations (a) during Winter day (b) during Summer day.

Figure 17.
Hourly variations in efficiency of thermal exergy for different configurations. (a) during Winter day (b) during Summer day.
Figure 17.
Hourly variations in efficiency of thermal exergy for different configurations. (a) during Winter day (b) during Summer day.

Figure 18.
Hourly variations in the total exergy efficiency of PVT system for different configurations. (a) during Winter day (b) during Summer day.
Figure 18.
Hourly variations in the total exergy efficiency of PVT system for different configurations. (a) during Winter day (b) during Summer day.

Figure 19.
The influence of coolant water flow rate on (a) average temperature of panel (b) total energy efficiency (c) total exergy.
Figure 19.
The influence of coolant water flow rate on (a) average temperature of panel (b) total energy efficiency (c) total exergy.


Figure 20.
The influence of solar intensity on (a) average temperature of panel (b) electrical energy efficiency (c) total energy efficiency (d) total exergy efficiency.
Figure 20.
The influence of solar intensity on (a) average temperature of panel (b) electrical energy efficiency (c) total energy efficiency (d) total exergy efficiency.


Figure 21.
The influence of ambient temperature on (a) average temperature of panel (b) electrical energy efficiency (c) total energy efficiency (d) total exergy efficiency.
Figure 21.
The influence of ambient temperature on (a) average temperature of panel (b) electrical energy efficiency (c) total energy efficiency (d) total exergy efficiency.


Table 1.
Weather conditions of the PVT water collector [40].
Table 1.
Weather conditions of the PVT water collector [40].
| Time | Solar Intensity (W/m2) | Ambient Temperature (°C) | Inlet Water Temperature (°C) |
|---|---|---|---|
| 8 | 325 | 25 | 27 |
| 9 | 450 | 26 | 30 |
| 10 | 600 | 28 | 34 |
| 11 | 800 | 30 | 38 |
| 12 | 750 | 31 | 40 |
| 13 | 700 | 33 | 44 |
| 14 | 600 | 32 | 46 |
| 15 | 500 | 31 | 48 |
| 16 | 300 | 30 | 50 |
Table 2.
Weather conditions of the PVT water collector [41].
Table 2.
Weather conditions of the PVT water collector [41].
| Time | Solar Intensity (W/m2) | Ambient Temperature (°C) | Inlet Water Temperature (°C) |
|---|---|---|---|
| 10 | 600 | 33 | 33 |
| 11 | 750 | 33.5 | 34 |
| 12 | 900 | 36 | 35 |
| 13 | 850 | 35.8 | 37 |
| 14 | 750 | 35.5 | 42 |
| 15 | 600 | 34.8 | 43 |
| 16 | 450 | 32.5 | 44 |
Table 3.
Weather conditions of the PVT water collector [42].
Table 3.
Weather conditions of the PVT water collector [42].
| Time | Solar Intensity (W/m2) | Ambient Temperature (°C) | Inlet Water Temperature (°C) |
|---|---|---|---|
| 8 | 720 | 26 | 35 |
| 9 | 800 | 28 | 35 |
| 10 | 850 | 30 | 35 |
| 11 | 870 | 32 | 35 |
| 12 | 890 | 35 | 35 |
| 13 | 860 | 36 | 35 |
| 14 | 860 | 35 | 35 |
| 15 | 820 | 34 | 35 |
| 16 | 720 | 33 | 35 |
| 17 | 550 | 30 | 35 |
Table 4.
Weather conditions of the PVT air collector [43].
Table 4.
Weather conditions of the PVT air collector [43].
| Time | Solar Intensity (W/m2) | Ambient Temperature (°C) |
|---|---|---|
| 9 | 200 | 30 |
| 10 | 400 | 31 |
| 11 | 600 | 32 |
| 12 | 900 | 33 |
| 13 | 1000 | 34 |
| 14 | 950 | 35 |
| 15 | 900 | 37 |
| 16 | 800 | 36 |
| 17 | 600 | 35 |
| 18 | 300 | 34 |
Table 5.
Weather conditions of the PVT air collector [44].
Table 5.
Weather conditions of the PVT air collector [44].
| Time | Solar Intensity (W/m2) | Ambient Temperature (°C) |
|---|---|---|
| 8 | 130 | 7 |
| 9 | 220 | 12 |
| 10 | 430 | 15 |
| 11 | 550 | 18 |
| 12 | 680 | 20 |
| 13 | 600 | 22 |
| 14 | 280 | 22 |
| 15 | 260 | 22 |
| 16 | 100 | 21 |
Table 6.
PV panel characteristics.
| Type | Polycrystalline |
|---|---|
| Maximum Power | 300 Watt |
| Open circuit voltage | 45.7 V |
| Short circuit current | 8.55 A |
| 15.45% | |
| Cell size | 156 mm × 156 mm |
| Dimensions | 1956 × 992 × 50 mm |
| The thickness of solar cell | 0.3 mm |
| The thermal conductivity of solar cell | 0.036 W/M·K |
| The absorptivity of solar cell | 0.85 |
| The emissivity of solar cell | 0.97 |
Table 7.
Design parameters of fluid channel.
| The length of fluid channel | 1956 mm |
| The width of fluid channel | 992 mm |
| The depth of fluid channel | 50 mm |
| The thermal conductivity of insulator | 0.035 W/m·K |
| The thickness of insulator | 50 mm |
| The thickness of glass cover | 0.5 mm |
| The thermal conductivity of glass cover | 1 W/m·K |
| The absorptivity of glass cover, | 0.06 |
| The transmissivity of glass cover | 0.84 |
| The emissivity of glass cover | 0.93 |
Disclaimer/Publisher’s Note: The statements, opinions and data contained in all publications are solely those of the individual author(s) and contributor(s) and not of MDPI and/or the editor(s). MDPI and/or the editor(s) disclaim responsibility for any injury to people or property resulting from any ideas, methods, instructions or products referred to in the content. |
© 2023 by the author. Licensee MDPI, Basel, Switzerland. This article is an open access article distributed under the terms and conditions of the Creative Commons Attribution (CC BY) license (https://creativecommons.org/licenses/by/4.0/).
Share and Cite
MDPI and ACS Style
Soliman, A.M. A Numerical Investigation of PVT System Performance with Various Cooling Configurations. Energies 2023, 16, 3052. https://doi.org/10.3390/en16073052
AMA Style
Soliman AM. A Numerical Investigation of PVT System Performance with Various Cooling Configurations. Energies. 2023; 16(7):3052. https://doi.org/10.3390/en16073052
Chicago/Turabian StyleSoliman, Ahmed Mohamed. 2023. "A Numerical Investigation of PVT System Performance with Various Cooling Configurations" Energies 16, no. 7: 3052. https://doi.org/10.3390/en16073052
Note that from the first issue of 2016, this journal uses article numbers instead of page numbers. See further details here.