Article

Thermophysical Parameters and Hygrothermal Simulation of Aerogel-Based Fibre-Enhanced Thermal Insulating Renders Applied on Exterior Walls

by
Marco Pedroso
1,
Maria da Glória Gomes
1,
José Dinis Silvestre
1,
Ahmed Hawreen
2,3,4,* and
Inês Flores-Colen
1,*
1
Civil Engineering Research and Innovation for Sustainability (CERIS), Departamento de Engenharia Civil, Arquitetura e Georecursos (DECivil), Instituto Superior Técnico (IST), Universidade de Lisboa, Av. Rovisco Pais, 1049-001 Lisbon, Portugal
2
Department of Highway and Bridge Engineering, Technical Engineering College, Erbil Polytechnic University, Erbil 44001, Iraq
3
Department of Civil Engineering, College of Engineering, Nawroz University, Duhok 42001, Iraq
4
Civil Engineering, Architecture and Georesources Department, Instituto Superior Técnico, Universidade de Lisboa, Av. Rovisco Pais, 1049-001 Lisbon, Portugal
*
Authors to whom correspondence should be addressed.
Energies 2023, 16(7), 3048; https://doi.org/10.3390/en16073048
Submission received: 21 February 2023 / Revised: 13 March 2023 / Accepted: 13 March 2023 / Published: 27 March 2023

Abstract

:
Aerogel-based renders have been the subject of research in the last few years due to their high thermal insulation characteristics and the need for buildings to become more energy-efficient. This study compares the hygrothermal behaviour of an aerogel-based render (reference) with the same base formulation, replacing the powder with three different fibres (aramid 0.5%, sisal 0.1%, and biomass 0.1%, by total volume) that can be used in buildings’ envelopes. The experimental programme allowed us to characterise and compare the thermophysical properties of the different formulations and then simulate the hygrothermal performance of these solutions when applied to walls for different climatic conditions, considering additional parameters such as total water content, drying potential, water content levels, and thermal insulating performance. These thermophysical parameters were then included in hygrothermal numerical simulations. The results allowed us to verify that the incorporation of fibres improved the hygrothermal properties due to lower capillary absorption and higher water vapour permeability. These renderings showed a high potential for application to building envelopes in different climatic conditions, improving their energy efficiency by up to 20% when compared to other conventional solutions.

1. Introduction

In the last few years, there have been several measures and methods to reduce energy consumption in buildings [1,2] through the study of innovative thermal insulating materials to be applied on their envelope, either in new construction or in retrofit scenarios [3,4], while also considering indoor thermal comfort [5].
The hygrothermal behaviour of the building envelope impacts energy needs, indoor comfort, and indoor air quality [6,7]. This behaviour is a function of the materials’ thermal and hydrostatic performances, depending on several characteristics. The use of hygroscopic materials has been considered a good solution to reduce the internal condensation in the buildings’ envelope while also impacting the reduction of heating and cooling energy consumption [8,9]. To understand and predict the hygrothermal behaviour of a building envelope, it is possible to use numerical models [10]. These models are based on experimental data that, to improve their prediction abilities, demands a complete set of experimental tests characterising the materials [11], e.g., through capillary water absorption, water vapour permeability, sorption curves, and thermal conductivity, among others.
To improve the façade’s performance, silica aerogel, which is one of the most researched nanomaterials for application on buildings’ envelopes for energy efficiency [12,13], has been used as a thermal super-insulating material [14,15]. Silica aerogel is classified as a 3-D nanomaterial (all dimensions above the nanoscale) [16], presenting a high quantity of pores with a reduced dimension (~10 to 100 nm) [17], supported by a silica (SiO2) structure [14]. As a consequence of its nanostructure and highly tortuous paths that limit heat transport by radiation, convection, and conduction [18], it presents high thermal insulation properties with thermal conductivity values as low as 0.012 W m−1 K−1 [19]. Although its cost is usually high, it has been decreasing in the past years due to scale economy effects [20], promoting a higher spread in its application in building solutions.
Due to its properties, silica aerogel granules have been introduced in renders since the 2010s [21]. This shows a significant decrease in the render’s thermal conductivity, with several researchers studying this solution and trying different formulations for new construction and retrofit scenarios [15,22,23]. However, these solutions still present some drawbacks, as their mechanical performance lowers and the thermal conductivity also lowers, as in several other lightweight materials [24]. They also tend to show high capillary water absorption [23], which could impair their outdoor use if no multi-layered coating systems are used [25].
Knowing the aerogel-based renders’ main limitations, it was considered that fibres could be used to improve the overall mechanical and physical properties of these coating solutions [26,27]. Therefore, this study deals with the introduction of three fibres of synthetic (aramid) and natural origin (sisal and biomass-based) in a previously developed aerogel-based thermal render [23] that can potentially be used as coatings on buildings’ envelopes. The used fibre quantities were a result of the improvement in the mechanical properties over the reference, using a substitution of render powder volumes of 0.5% aramid (vol.) and 0.1% (vol.) of sisal and biomass [27].
Although currently there are some research works [21,28,29] studying the hygrothermal properties of aerogel-based renders and plasters, there is a lack of study on the influence of fibres and how their use could potentiate the composites’ multifunctional properties. Moreover, a complete set of hygrothermal results that allow others to simulate the material’s performance under different climatic conditions is also needed. This fact can also be related to the non-existence of requirements in EN 998-1 [30] that could allow further characterisation of hygrothermal parameters needed to carry out hygrothermal simulations.
The present work aims to compare and analyse the hygrothermal behaviour of four different aerogel-based thermal render formulations, with and without fibres. This involved evaluating their influence through an extensive set of tests where their thermal conductivity for several moisture contents and parameters related to moisture behaviour and liquid water conduction were evaluated. Furthermore, other currently used thermal insulation materials were evaluated to benchmark their hygrothermal performance.
With this information, it was possible to carry out subsequent hygrothermal numerical models (using the software WUFI Pro®), which allowed evaluation of the performance of the analysed thermal render formulations under different application scenarios. These scenarios included: two different climatic areas: Lisbon and Zurich; constructive solutions: a new wall (Lisbon—NW—and Zurich—ZNW); and exterior and interior retrofit scenarios (only for Lisbon—RE and RI, respectively). Several hygrothermal analysis parameters were assessed, such as the total water content and drying potential, the mould growth potential, the water content in the thermal insulating layer as well as its performance over time, and finally the outdoor superficial temperatures and surface condensation potentials.
With such data gathered, it was also possible to evaluate how these materials are influenced by moisture over time and the repercussions that such moisture has on the potential increase in the buildings’ energy consumption to keep their indoor conditions comfortable, due to higher thermal conductivities induced by moisture. Therefore, this study allows for further evaluation of these renders’ performance and multifunctional capabilities.
Due to the extensive data presented, this work contributes to a better understanding of the thermophysical behaviour of renders incorporating aerogel and fibres and their implications in the future of energy savings associated with buildings, due to their performance in the hygrothermal simulations. With these findings, other researchers can support their study to improve current thermal insulating render formulations or to define new ones. The most original contribution is the connection between the thermophysical characterisation of the materials through an experimental programme (additional measurements) and the hygrothermal simulations under different application scenarios, for these innovative solutions.

2. Thermophysical Experimental Characterisation
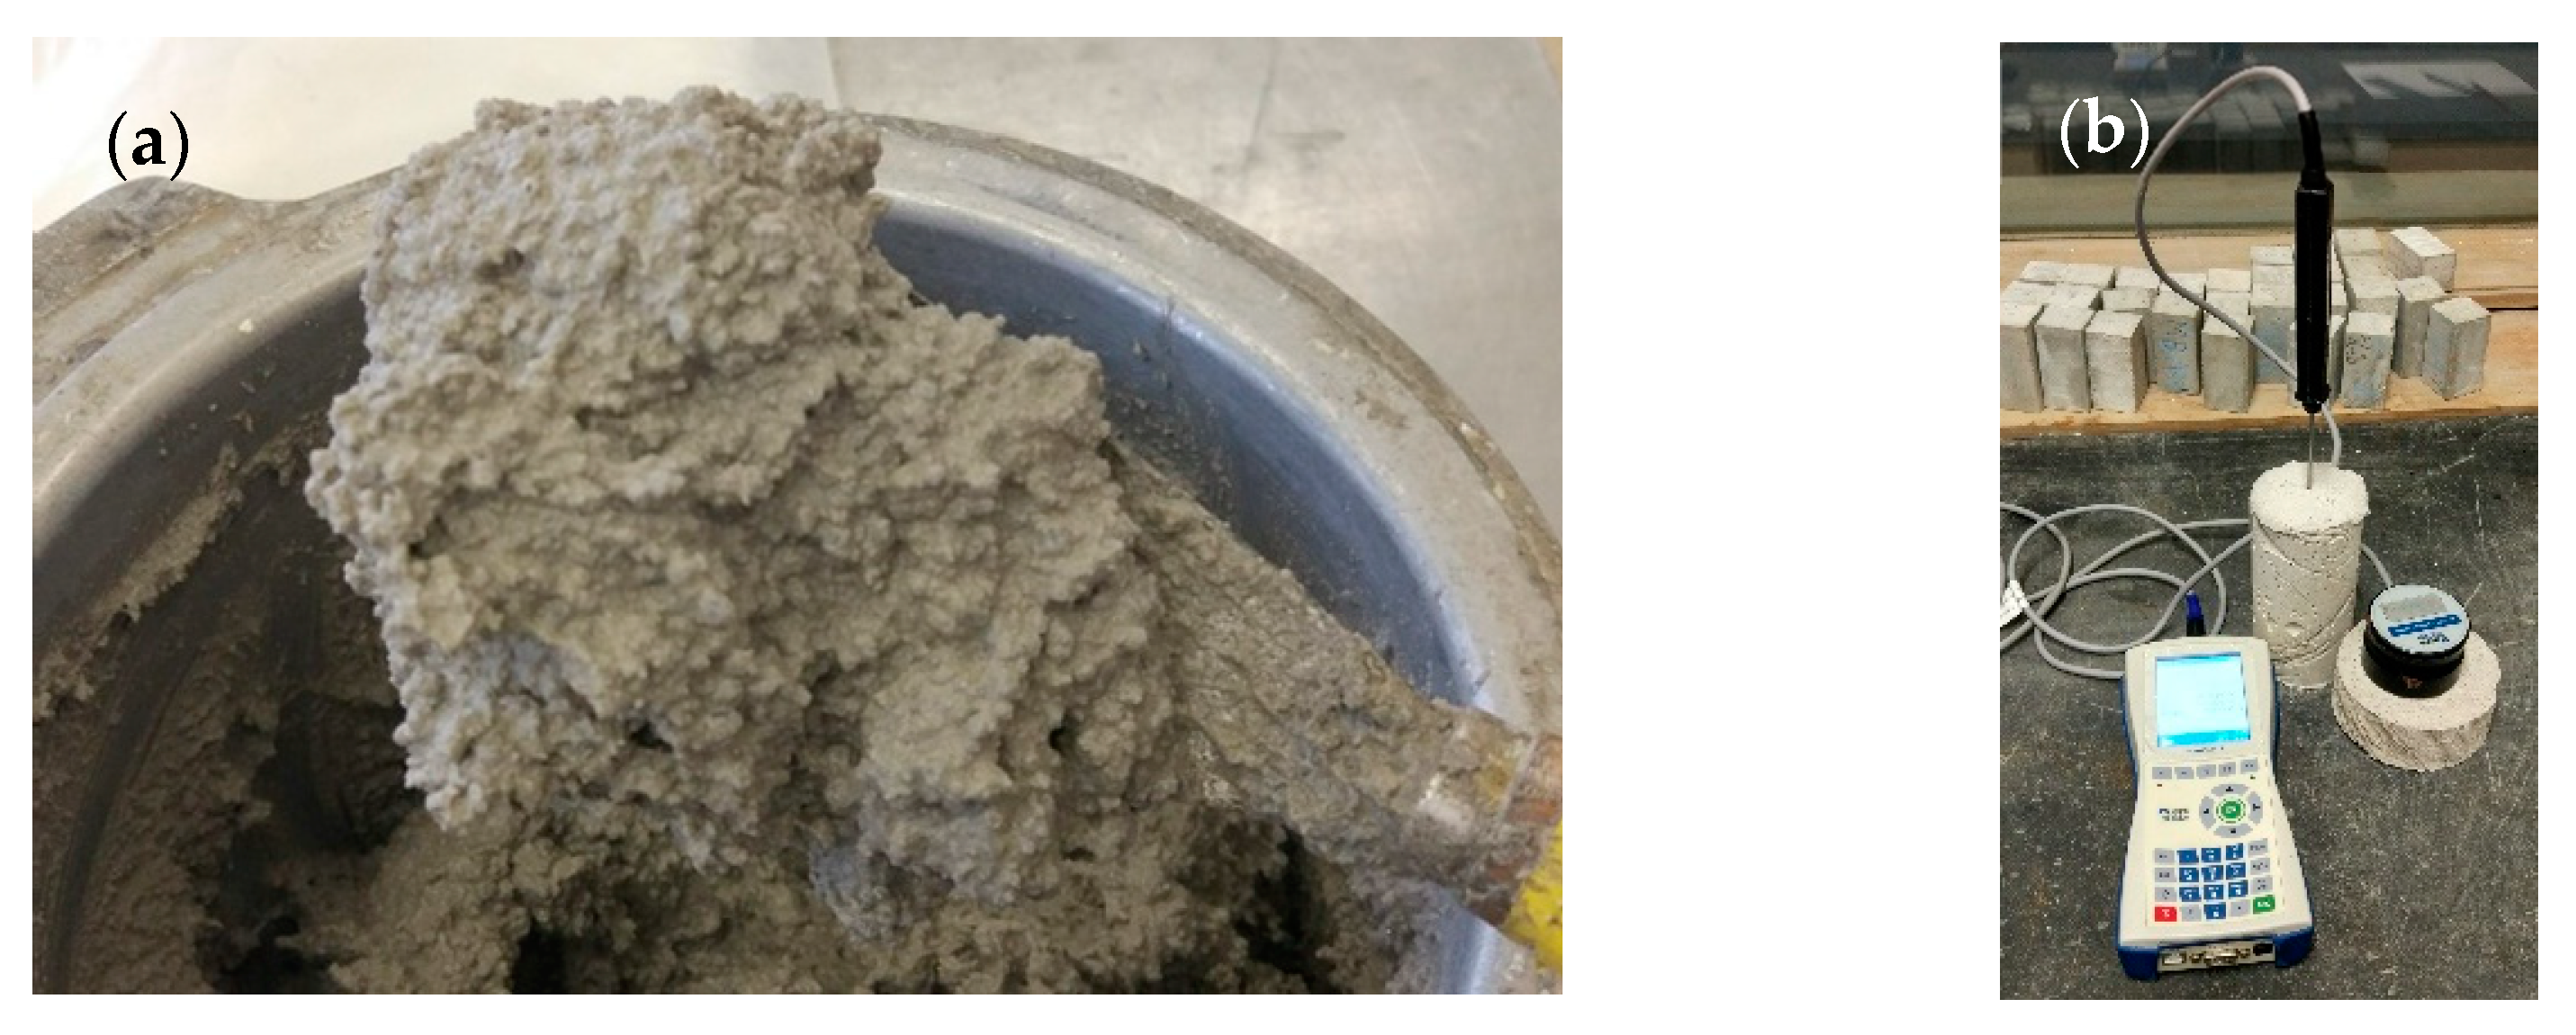
2.1. Materials

To be able to carry out the hygrothermal simulations, a significant set of the materials’ thermophysical parameters must be known. Therefore, in this research and due to its novelty, a laboratory campaign was performed to characterise the thermophysical properties of an aerogel-based thermal render (TR), previously developed [23], while also incorporating fibres. The aerogel-based render (TR reference) is mainly composed of a blend of mineral binders, rheological and hydrophobic agents, and resins, while also incorporating (≈70% (vol./vol.)) Kwark supercritical silica aerogel in the form of granules (diameter ≤ 3500 μm, bulk density ≤ 90 kg m−3, and a thermal conductivity ≤ 0.020 W m−1 K−1 [31], Figure 1a). For those aerogel-based renders, three different fibre types were incorporated: aramid, sisal, and biomass fibres, whose origin, dimensions, and quantities were supported by previous research from the authors [27]. Therefore, the thermophysical characterization was carried out for: TR reference (0.00% vol./vol.), TR aramid (0.50% vol./vol.), TR sisal, and TR biomass (both 0.10% vol./vol.), all fibres with ≈5 mm in length, were produced, cured, and analysed in terms of their mechanical, microstructural, and some physical aspects [27].
To obtain the additional thermophysical data needed for the hygrothermal simulations, some specimens had to be produced, as described in Table 1, where their shape, dimensions, and number of specimens and tests are shown for each formulation. Figure 1b) shows the specimens and the ISOMET equipment used for the thermal conductivity measurement, with two different probes. The specimens’ dimensions were influenced by the minimum size requirements of the ISOMET to perform the measurements [32]. Since the hygrothermal simulations used several materials (e.g., EPS and XPS), the synthesis of their thermophysical properties, as they can be found in the literature, is presented in the Supplementary Data.

2.2. Experimental Methods

To characterise the hygrothermal properties of construction materials, when the objective is to use them in hygrothermal simulation models, as indicated by Fantucci et al. [11] and Barclay et al. [33], there is a need to systematise all the relevant data. As such, a comprehensive set of tests must be carried out to characterise and obtain the input for hygrothermal simulations [34,35].
The usually needed parameters are bulk density (ρhard), open porosity (P0), specific heat capacity (cp), thermal conductivity (λ) from a dry to a saturated state, capillary water absorption (Aw), liquid transport coefficient for suction (Dws), water vapour diffusion resistance factor (μ), and the moisture content (w) for different conditions (hygroscopic and over-hygroscopic states). Table 2 presents the bulk density, open porosity, thermal conductivity in the dry state, capillary water absorption, and water vapour diffusion resistance coefficient for these formulations, as already presented in [27]. Therefore, it was also necessary to additionally characterise the specific heat capacity, the thermal conductivity for several moisture contents, the liquid transport coefficient for suction, and the moisture content for hygroscopic and over-hygroscopic conditions.
Moreover, it was also characterised by their thermal diffusivity (α), thermal inertia (I), thermal penetration depth at 10 min (dp,10min), maximum water content (wmax), and saturation coefficient, adding a greater depth to the potential comparison with other existing materials already characterised. Another studied parameter was the practical moisture buffer value (MBVpractical) since this parameter is one way to quantify the material’s capability to adsorb and desorb moisture [36] and thus evaluate the potential applications in indoor environments for moisture regulation.

2.2.1. Thermal Properties

To evaluate the formulations’ thermal properties, an ISOMET 2114 device from Applied Precision supplier was used. This equipment’s measurement principle is based on the analysis of the sample’s temperature response to heat flow impulses. Heat flow is projected by the resistor’s electrical heating, which is presented inside the probes and in direct heat contact with the sample. The evaluation of the thermal conductivity (λ) and volumetric heat capacity (cρ) (which then allows calculating the specific heat capacity, cp, by dividing it by the bulk density) is based on periodically sampled temperature records as a function of time, where during the same measurement cycle, the thermal diffusivity (α) is also obtained [32]. Since different moisture contents had to be evaluated, which influence the thermal conductivity values, the two available probes (a linear probe with a measurement range between 0.015 and 0.050 W m−1 K−1, and a plane probe with a measurement range between 0.040 and 0.300 W m−1 K−1), were used, as shown in Figure 1b.
To carry out the measurements, and due to the individual probes’ measurement ranges, the cylindric I specimens were selected to make the characterisation from the dry state until 93% RH (relative humidity). Additionally, the cylindric II specimens used in the saturated state were obtained through samples’ immersion in liquid water until equilibrium was reached with the surrounding conditions.
The test procedures followed the indications of the ASTM-D-5334 [37], ASTM-D-5930 [38], EN 22007-2 [39], and Gomes et al. [40,41] studies. In this case, the tests were carried out at an average reference temperature of 20 ± 3 °C. The temperature conversion to 10 °C is in line with EN 10456 [42] for IIa conditions (reference temperature of 23 °C and dry state) and a temperature conversion coefficient of 0.003 K−1. When the samples were evaluated, their weight was measured, and then they were wrapped in plastic film right away so they would not gain or lose moisture.
Since both the mass and thermal properties evaluations are not destructive tests, the same samples (cylindric I and II) were used again for the moisture storage function test. The samples’ moisture variation procedure is presented in the following sub-section.
As the specific heat capacity corresponds to the material’s ability to store heat relative to its weight, it is used to estimate the thermal inertia of the material (I), which can be calculated using Equation (1) [43], where I is the thermal inertia [J m−2 s−1/2], λ is the thermal conductivity [W m−1 K−1], ρ is the bulk density [kg m−3], and cp is the specific heat capacity [J kg−1 K−1].
I = λ × ρ × c p
This study also assessed the thermal diffusivity (α), directly obtained by the equipment, and the thermal penetration depth (dp,10min) at 10 min. The thermal diffusivity (α) indicates the heat transfer rate from the hot end to the cold end. As for the thermal penetration depth (dp,10min), it allows us to directly compare different materials and how, in this case, in 10 min, the material will respond, quicker or slower, to temperature variations on their surface. This is a parameter used in the thermal characterisation of other materials, such as the one conducted by Palumbo et al. [44]. For calculating the penetration depth, Equation (2) [44] was used, where dp,10min is the penetration depth after 10 min [m], α is the thermal diffusivity [m2 s−1], and t is time [s].
d p , 10 m i n = π × α × t

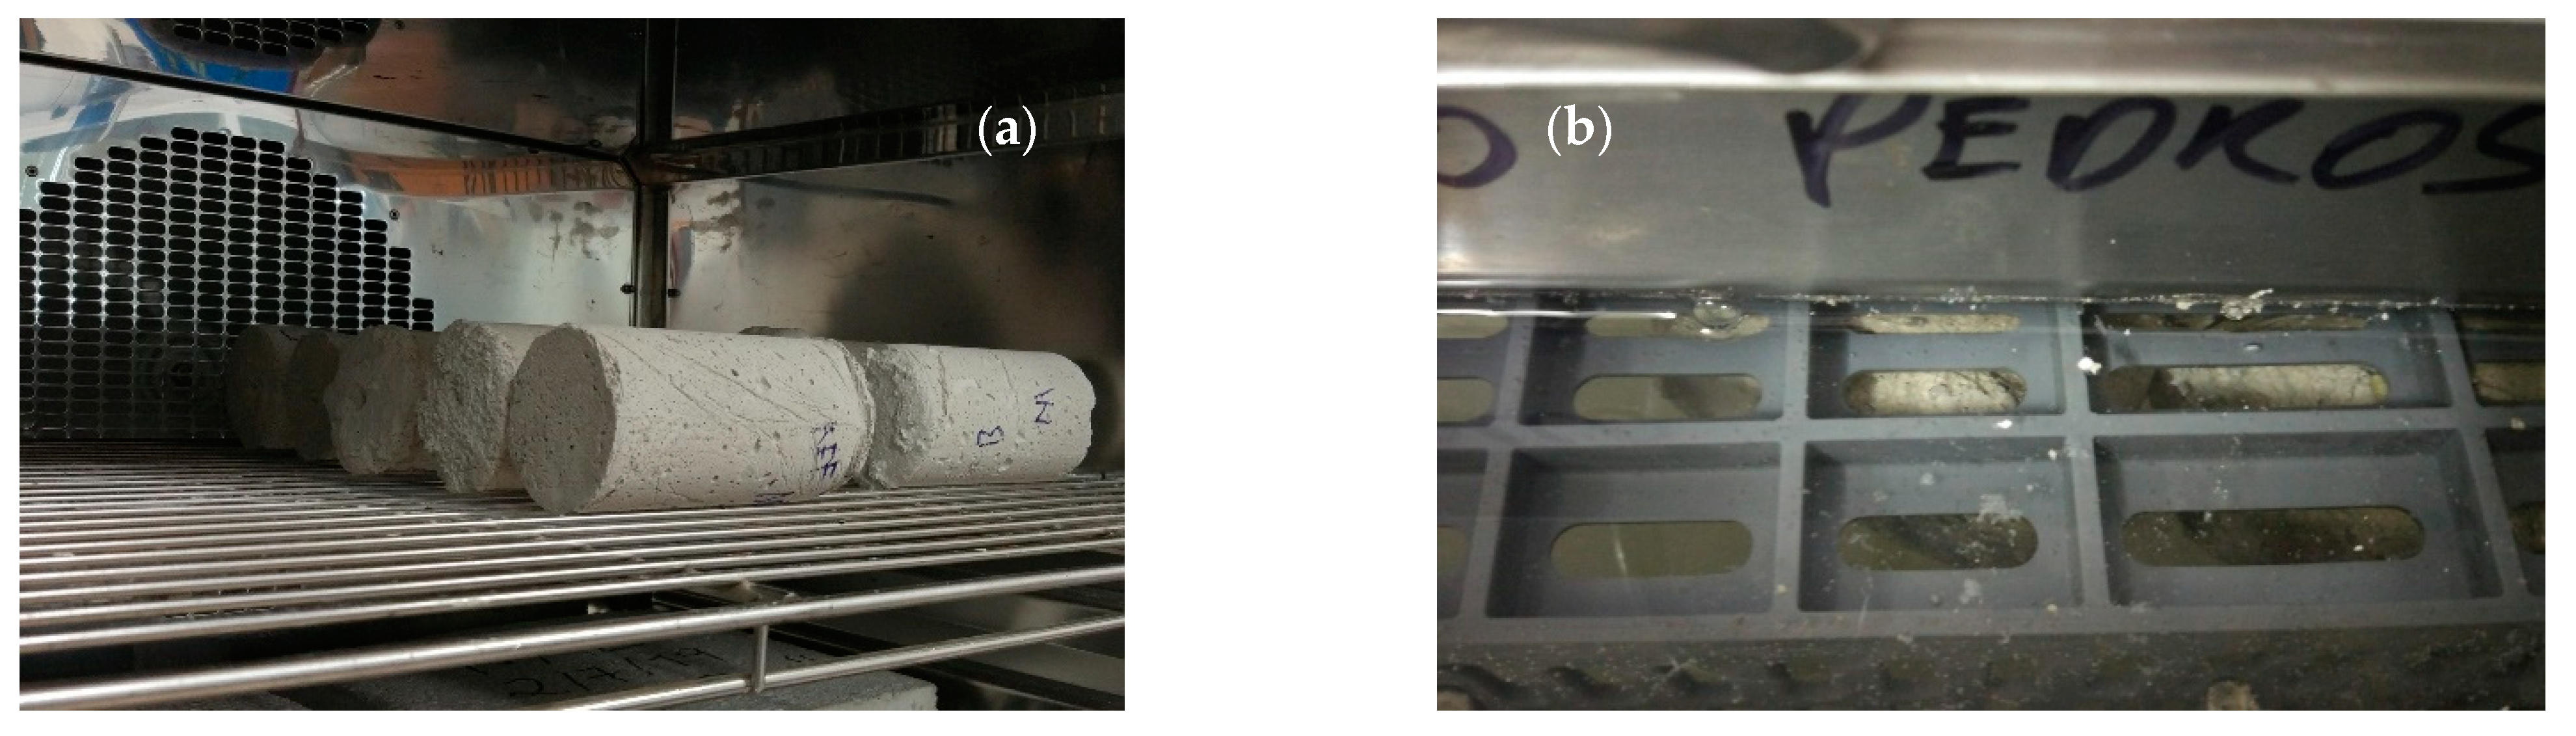
2.2.2. Moisture Storage Function

The moisture storage function relates the amount of equilibrium moisture content to the ambient RH for a given temperature for any given material. The samples used in this evaluation were the same as those used in the thermal properties tests: cylindric I and cylindric II. The cylindric I was for the air moisture (hygroscopic range), and the cylindric II was for the liquid water saturation (over-hygroscopic range).
The hygroscopic sorption properties (Figure 2a) were determined following the main indications and procedures presented in EN ISO 12571 [45], using a Heraeus Vötsch climatic chamber. Five different levels of RH were assessed under isothermal conditions (23 °C): 0, 35, 60, 85, and 93% RH. For each level of RH, when constant mass was achieved (the change in mass between three consecutive weightings, each made 24 h apart, differed by less than 0.10% of the total mass), the specimens’ mass was evaluated.
As for the over-hygroscopic range, i.e., the amount of water that a material absorbs at 100% RH, the samples were immersed in water at 20 °C (Figure 2b) in a sealed plastic box with the need to be restrained since otherwise they would float until achieving constant mass. The weighing occurred after carefully wiping off the sample’s surface with a damp cloth. With this, it was possible to characterise their free water saturation (wf).
For all the RH levels, when constant mass was achieved, the samples’ mass was evaluated. Those different mass measurements allowed for the calculation of the moisture content mass by mass (u) and the moisture content mass by volume (w), in line with EN ISO 12571 [45] and EN ISO 12570 [46]. Using the previously presented parameters, two additional ones can be calculated: the maximum water content (wmax) and the saturation coefficient. The maximum water content (wmax) is the water content at full saturation when the porous structure is considered filled with water [47], in [kg m−3]. This can be estimated by multiplying the material’s open porosity (P0, obtained by the mercury intrusion porosimeter technique, [%]) by the water density (ρw in [kg m−3]) at 20 °C, according to Equation (3) [6]. The MIP equipment is an AutoPore IV from Micromeritics, presenting a maximum intrusion volume for low and high pressure of 1 × 10⁵ mL g−1, and a measuring range from 1 × 10⁻² to 1 × 103 µm.
w m a x = ε × ρ w
Considering both wf and wmax, the saturation coefficient [-] can be calculated, which is a measure of the pore space quantity available after the free water saturation [48]. This parameter is calculated as the ratio between wf in [kg m−3] and wmax in [kg m−3], Equation (4) [47], where the lower it is, the more space is available to accommodate the expansion of liquid water as it freezes [49].
S a t u r a t i o n   c o e f f i c i e n t = w f w m a x

2.2.3. Liquid Water Transport Coefficient for Suction

Another important input parameter to consider in hygrothermal simulations is the liquid water transport coefficient for suction (Dws) [35,50]. This parameter describes the situation where the material is applied to a surface in direct contact with liquid water or is exposed to wetting by rain action (fully wet) [51], while the capillary uptake of liquid water continues to occur [52]. Some techniques can be employed to characterize this parameter, such as nuclear magnetic resonance (NMR) or γ radiography [53,54]. However, since they were not available for this study, a previously used approach as a good estimation method by other researchers [55] was selected—Equation (5) [52,54], where Dws is the liquid transport coefficient for suction [m2 s−1], Aw is the water absorption coefficient [kg m−2 s−1/2]—previously characterised in [27], w is the moisture content [kg m−3], and wf is the free water saturation [kg m−3].
D w s = 3.8 × A w w f 2 × 1000 w w f 1

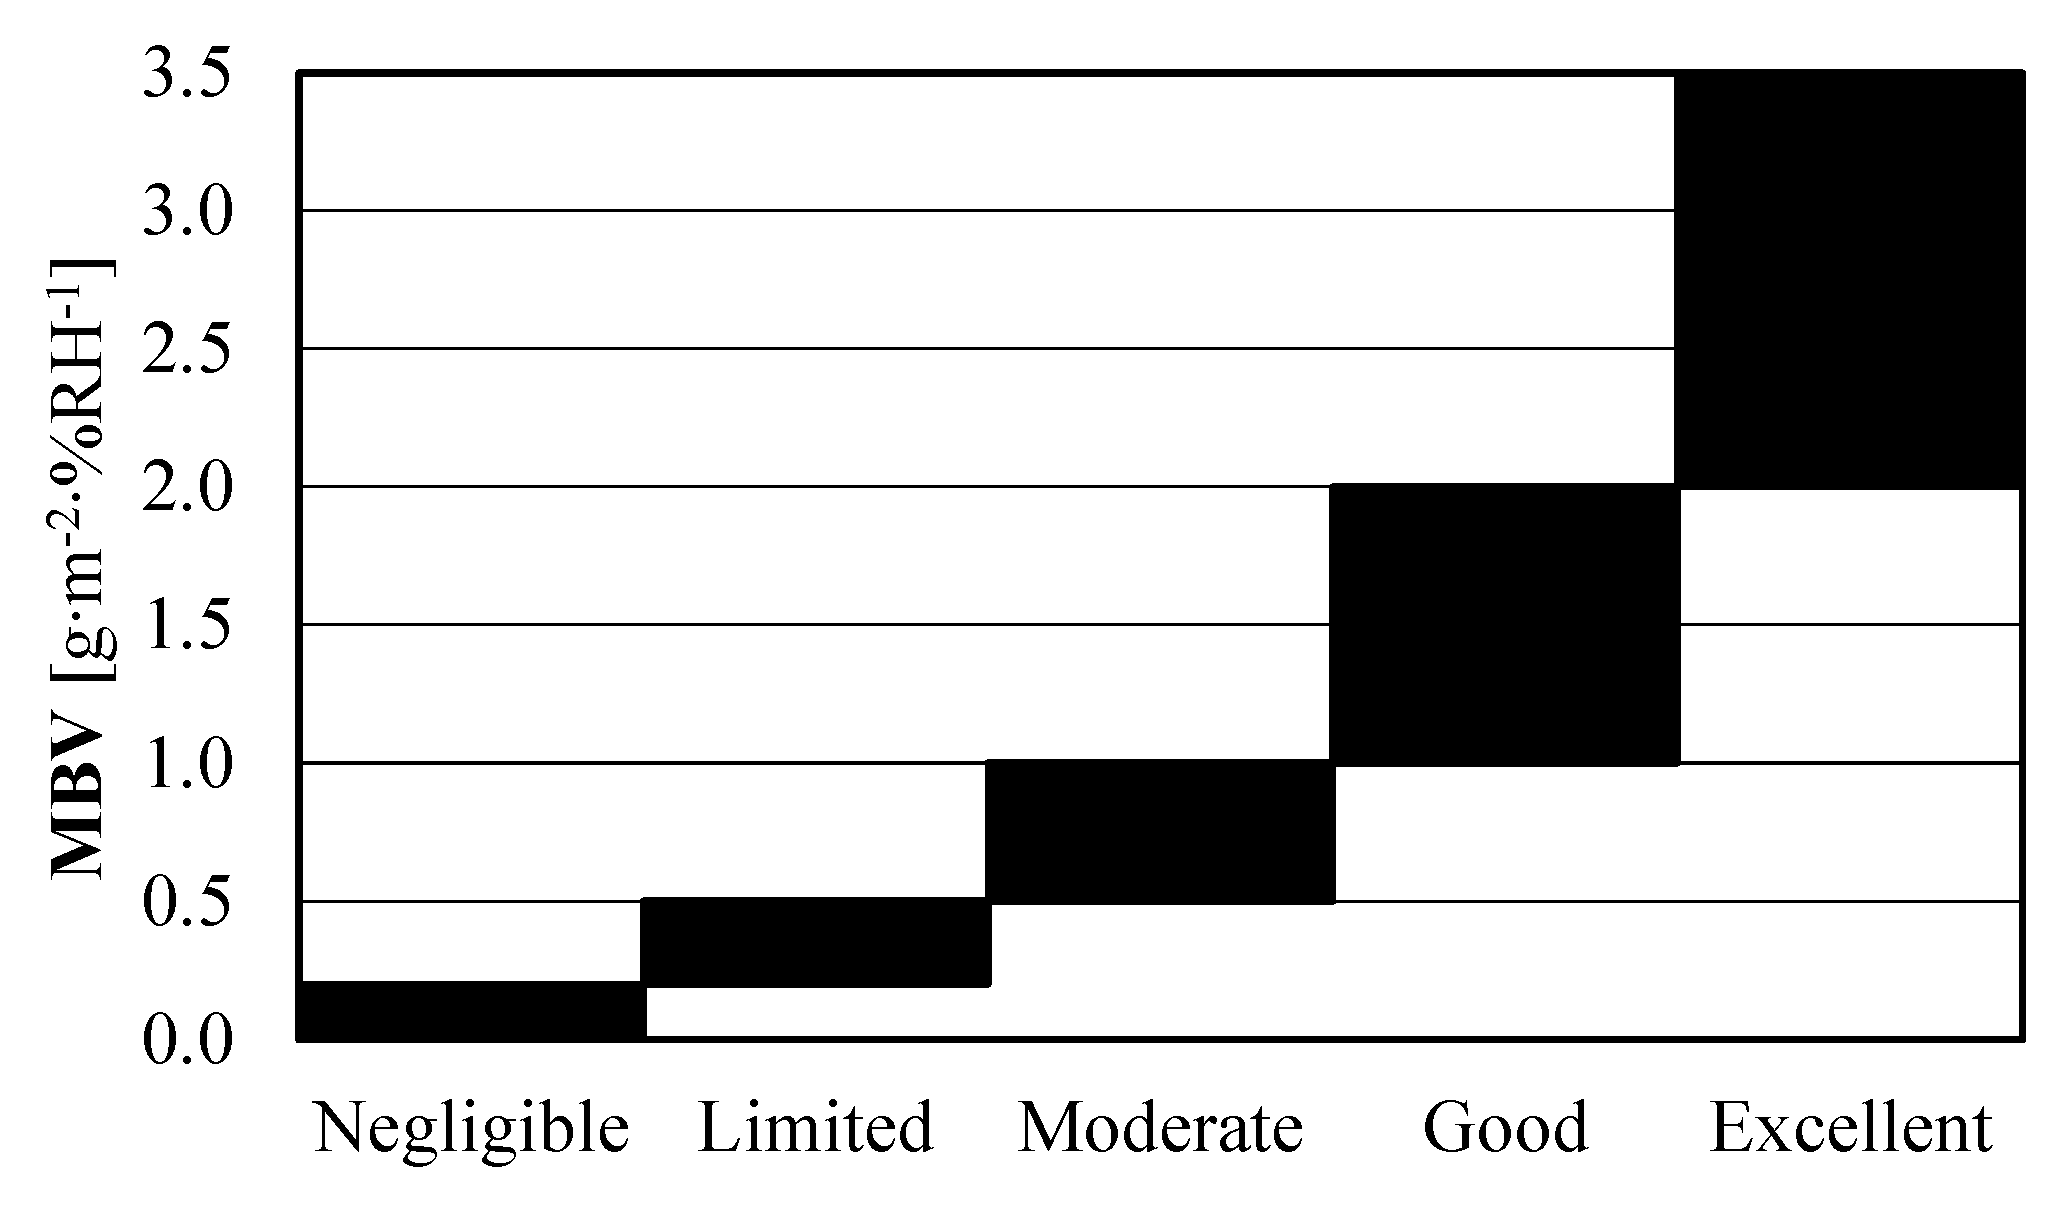
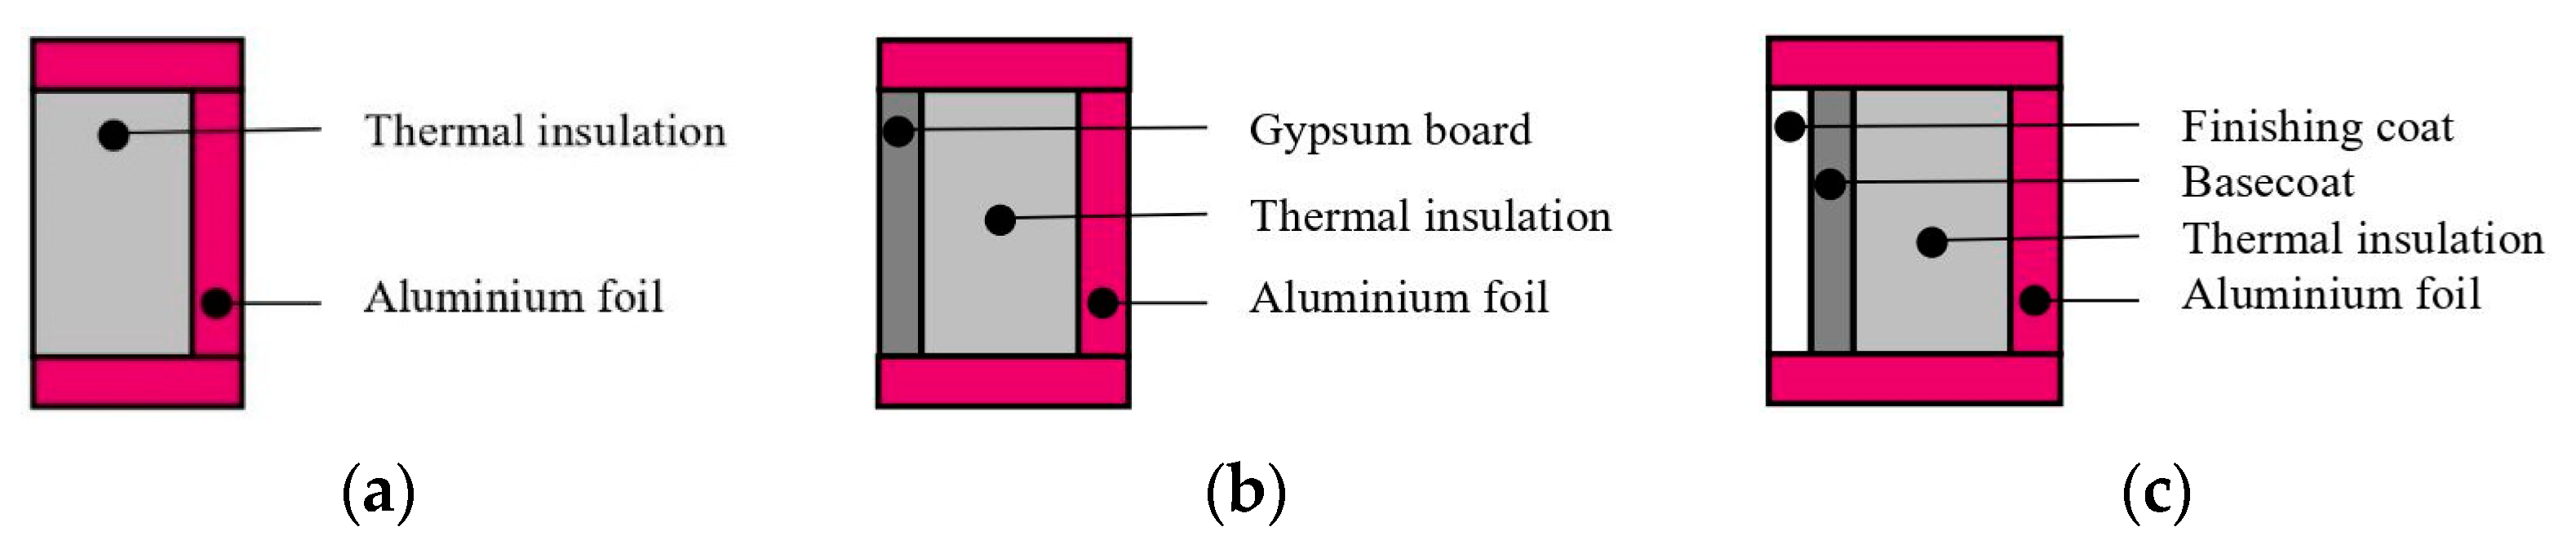
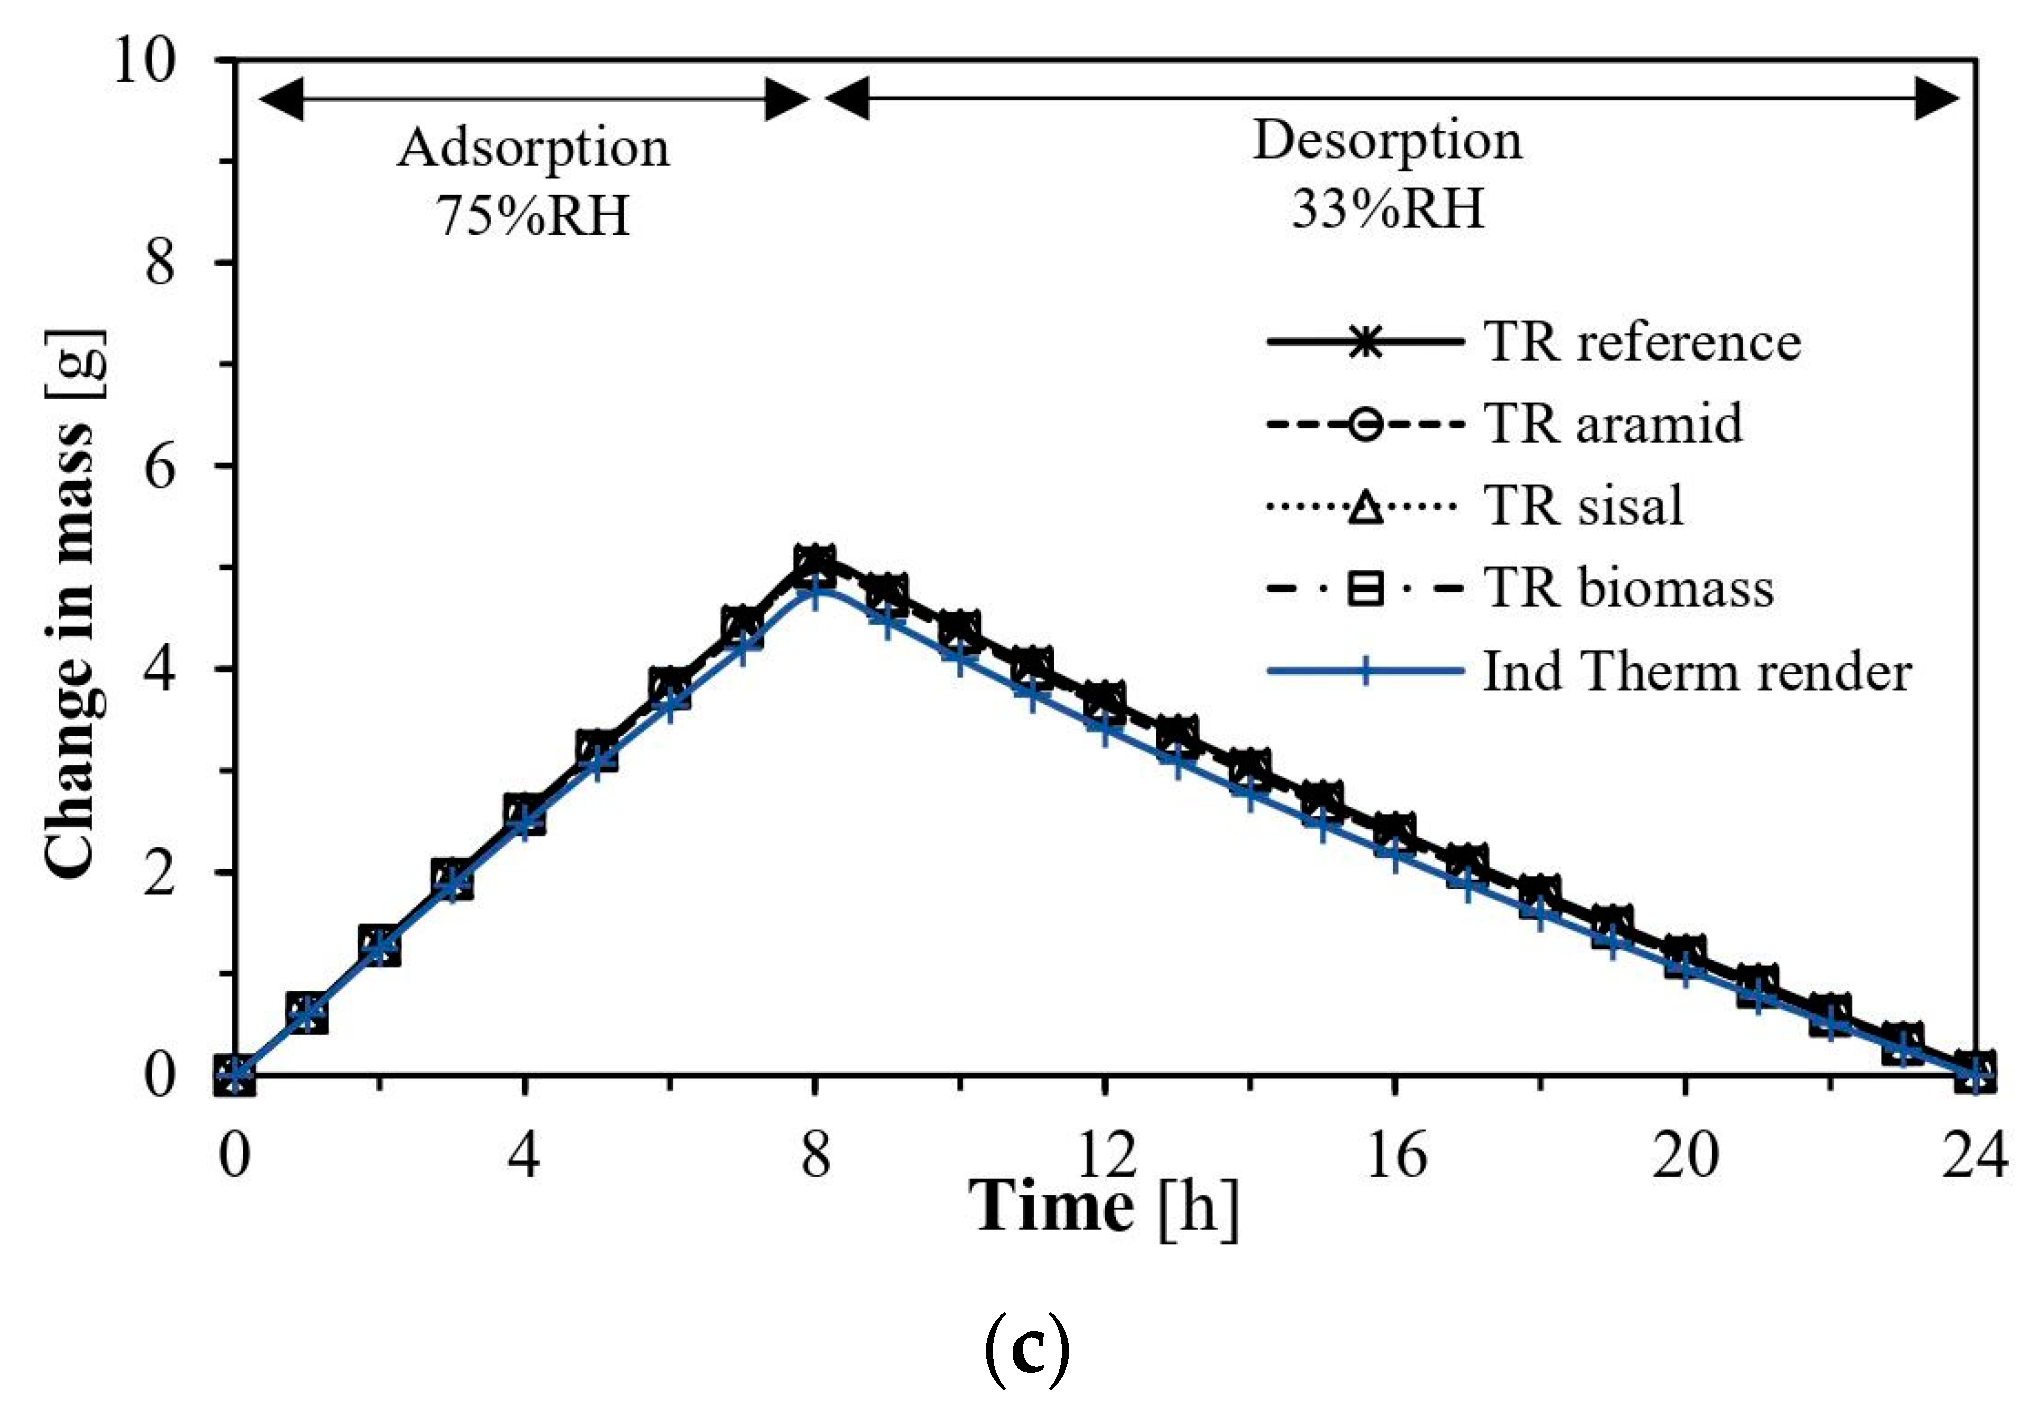
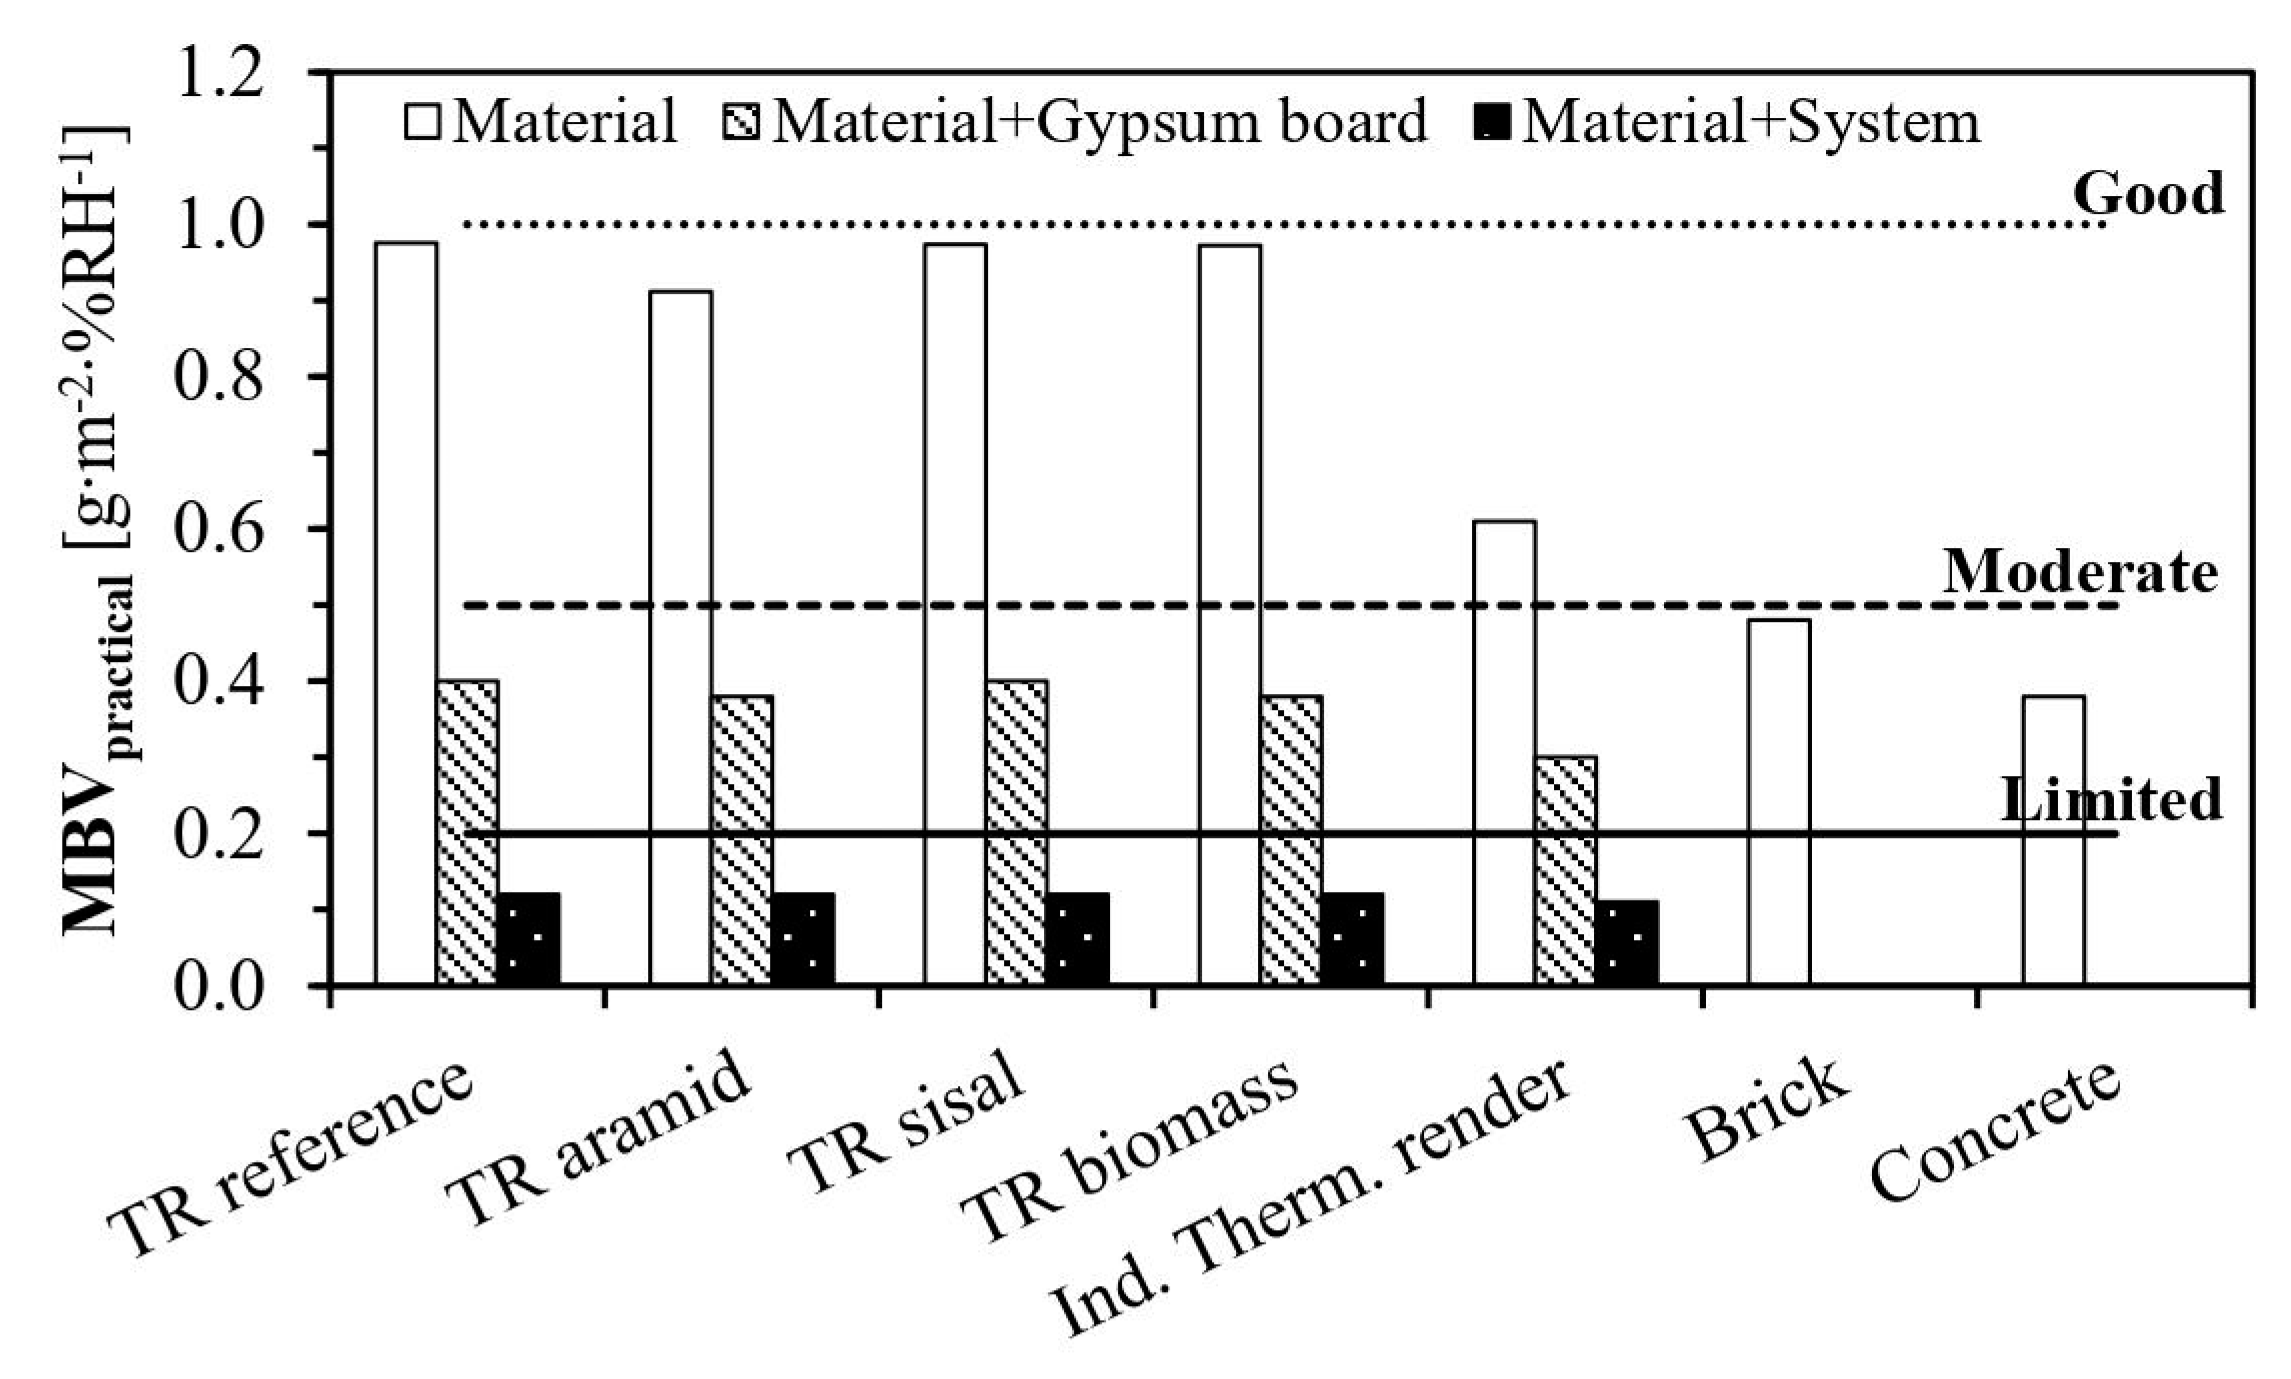
2.2.4. Moisture Buffering Properties

The moisture buffering property of a given material is related to its capabilities to adsorb and desorb environmental moisture [36], as well as being useful to consider when the materials stay in contact with indoor environments [56]. Therefore, this property can help to reduce indoor superficial condensation in the buildings’ envelope [8,9] and can also have an impact on reducing their heating and cooling energy consumption. Due to the novelty of aerogel-based, fibre-enhanced thermal renders (TRFs), this was an interesting characteristic to further evaluate to see the possibility of using these formulations for future indoor application scenarios, promoting their multifunctionality.
Although there are many test procedures, the one most broadly used is described by the NORDTEST project [57,58,59]. For this test procedure, a constant temperature of 23 °C must be attained, and then several cycles of exposure of 8 h with a 75% RH and 16 h with a 33% RH, simulating the usual indoor human occupancy of commercial buildings, are followed until stabilisation [58].
The common method to evaluate this concept is using the practical moisture buffer value, MBVpractical. This parameter is defined as the amount of moisture content that passes through or is captured by the material’s open surface unit (moisture uptake and release) when exposed to variations in the RH of the surrounding air (daily cyclic variations) under the previously described test conditions. To calculate the MBVpractical, Equation (6) can be used [58], where MBVpractical is the practical moisture buffer value [g m−2 %RH−1], Δm is the mass variation of the moisture uptake/release [g], A is the open surface area [m2]—here being considered 1 m2, and the RHhigh/low are the higher and lower air RH limits of the test [%RH].
M B V p r a c t i c a l = Δ m A × R H h i g h R H l o w
A direct comparison of the moisture buffer values of the different materials can be made, but at the same time, they can be classified in terms of their moisture buffer classes [57], as can be seen in Figure 3. With this classification, the materials can be classified as presenting negligible, limited, moderate, good, or excellent moisture buffering capabilities, considering the test conditions.
Usually, this characterisation involves the application of specific test conditions (as previously described) using advanced climatic chambers and several samples. However, as Barclay et al. [33] and Wan et al. [60] showed, there is a good fit between the experimental and numerical simulation results using HAMT (combined heat and moisture transfer) models, such as WUFI software. Therefore, it was possible to simulate several application scenarios to evaluate the studied TRFs and their behaviour when subjected to water vapour cycles. However, for this to be possible, it was necessary to create an artificial weather file replicating the dynamic conditions of air temperature, RH, and time indicated by the NORDTEST project procedures (8 h at 75% RH and 16 h at 33% RH, at 23 °C) [57,58,59]. For the simulation, one square metre of exposed surface (1 × 1 m) with a 0.04 m thickness was considered, where all but one of the sample’s faces were insulated by an aluminium foil, avoiding water vapour penetration while also defining its boundaries. Then, the virtual sample was subjected to the test cycle conditions until it was possible to obtain mass stabilisation of the samples, reached when the change in mass was the same between the last three cycles with a discrepancy of less than 5% [58]. For these simulations, the results from the previous tests and other previously performed tests and materials were used, with their characterisation presented in the Supplementary Data.

2.3. Experimental Results and Discussion

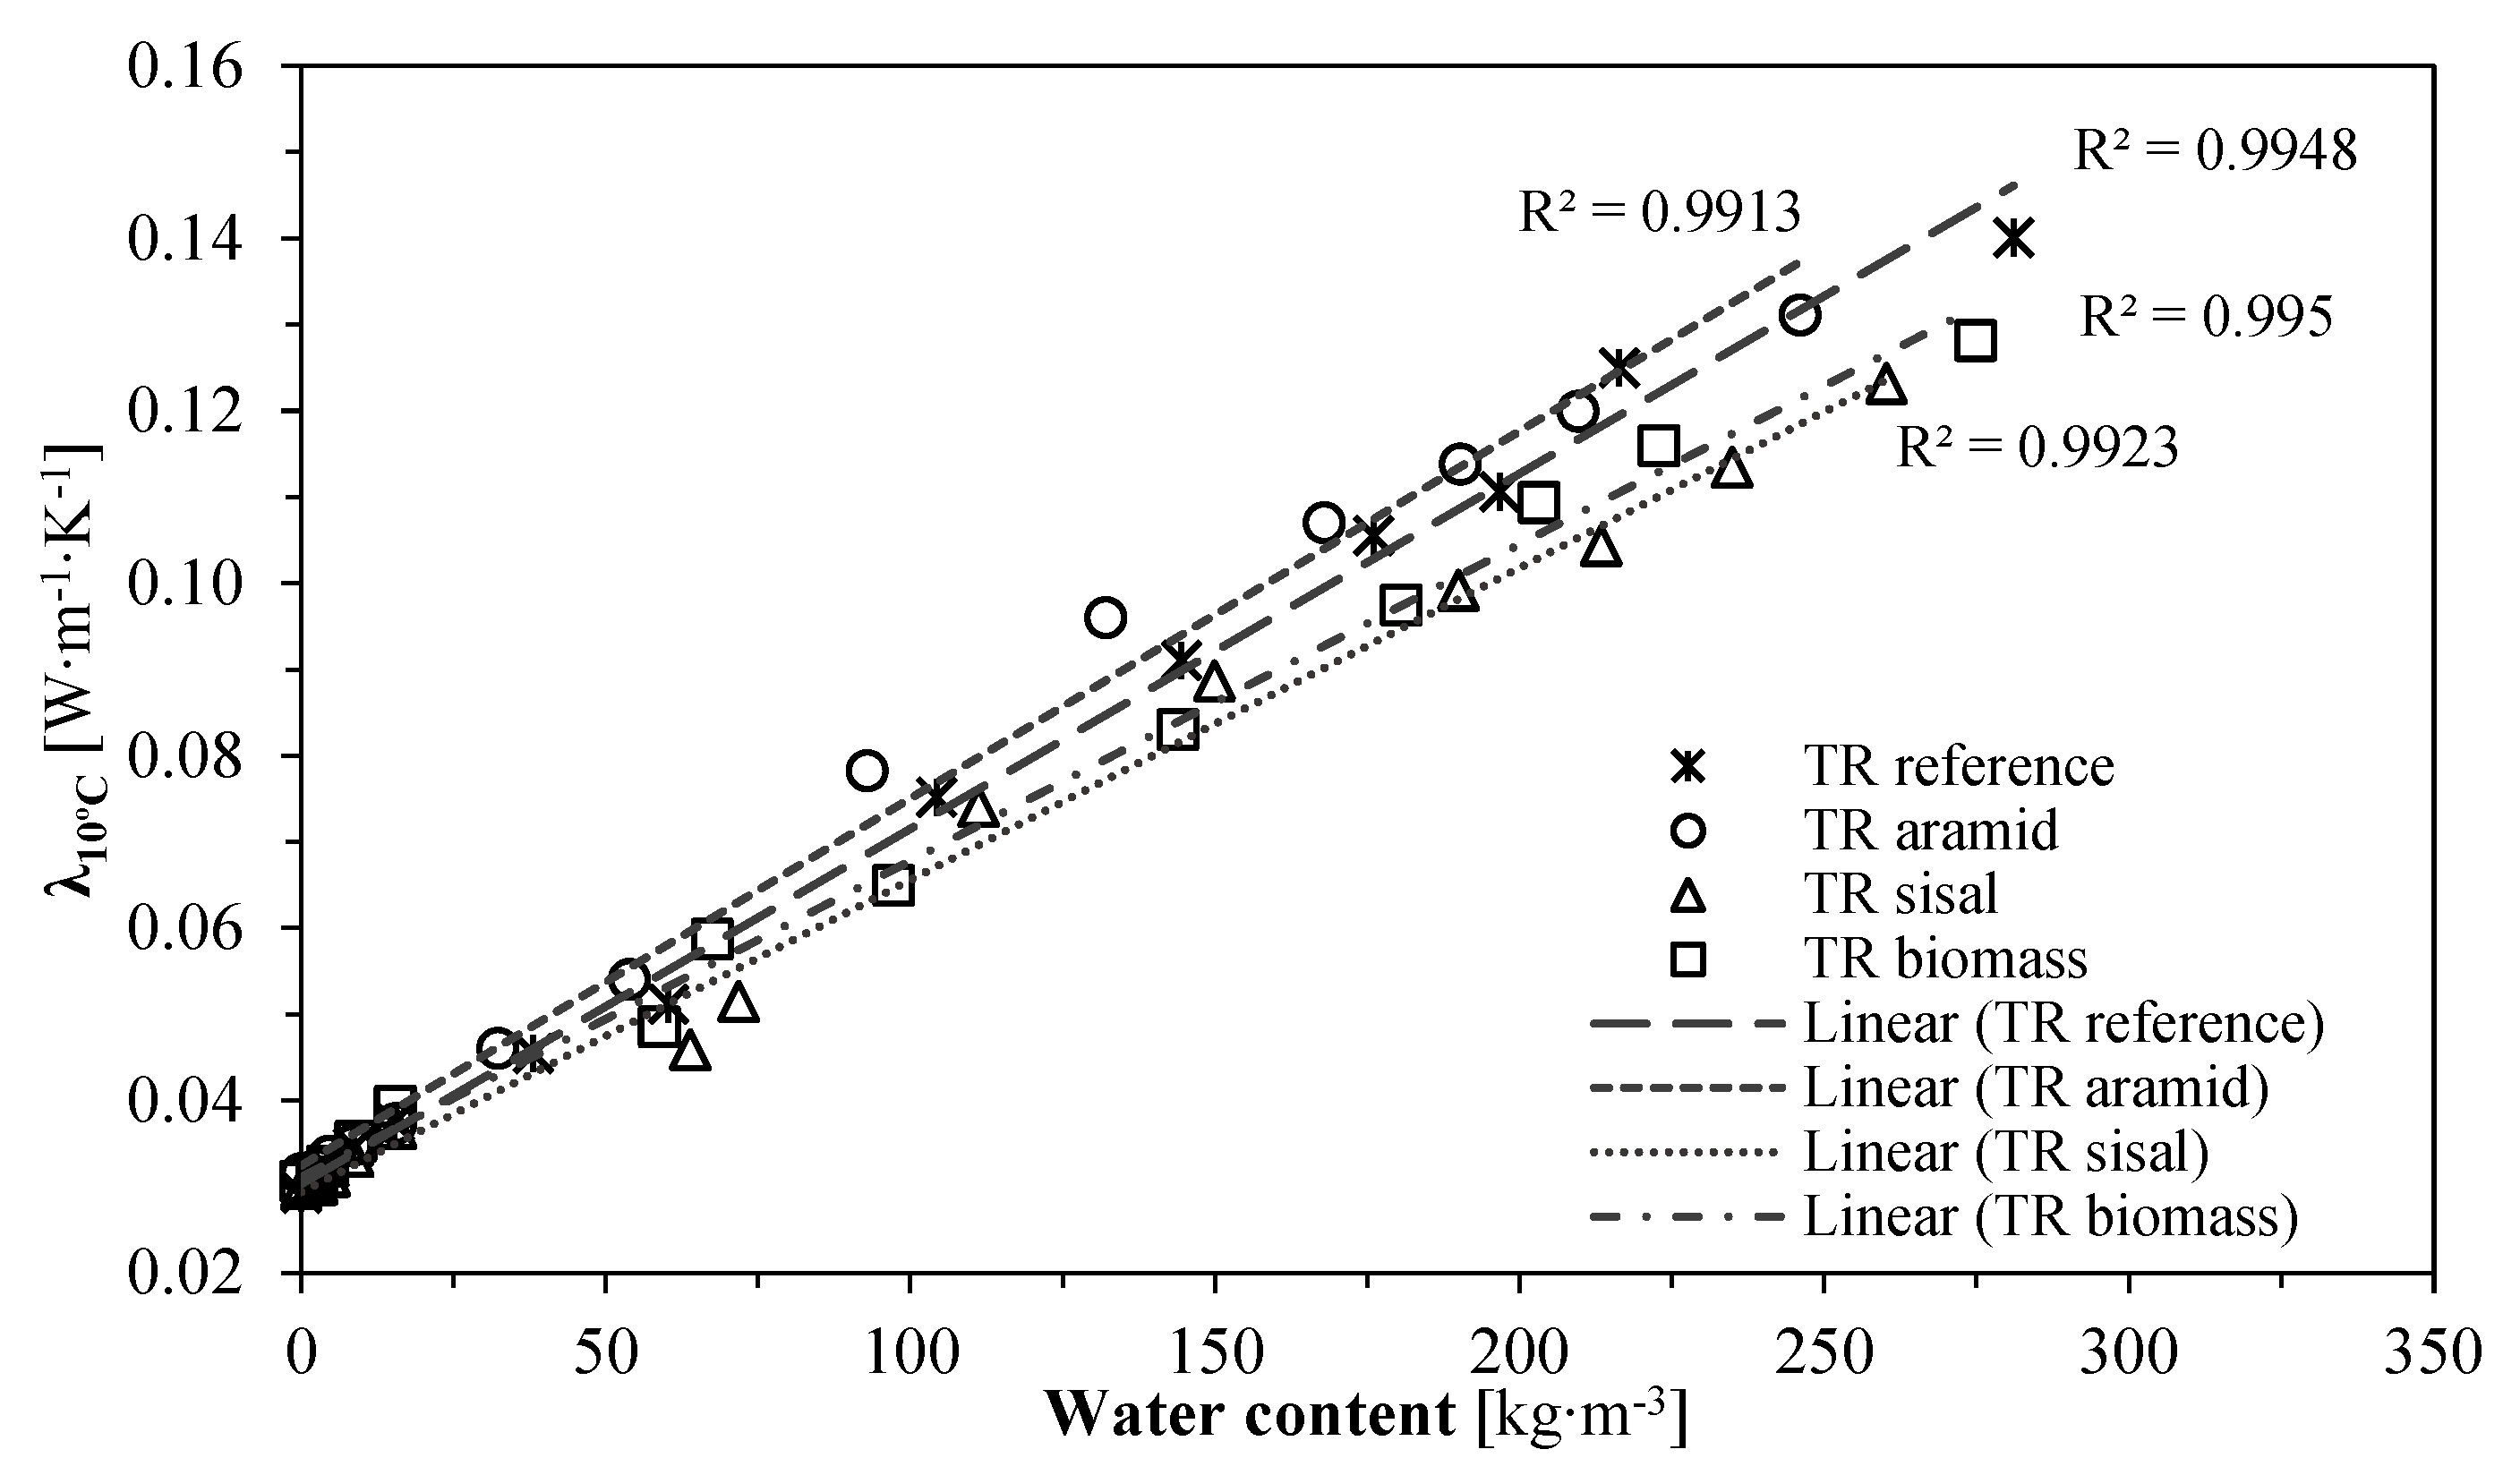
2.3.1. Thermal Properties

Table 3 summarises the results for the thermal properties. It can be seen that these TRF (Aerogel-based fibre-enhanced thermal renders) present very low thermal conductivity, being lower than other materials classified as classic thermal insulators (e.g., EPS λ ≈ 0.036 W m−1 K−1 [61]), and much lower if already commercialised thermal renders are considered (e.g., thermal render with EPS granules λ ≈ 0.050 W m−1 K−1 [62]).
The fibre’s incorporation leads to a thermal conductivity increase when compared to the reference (TR reference) of ≈7%, but with low significance since the results are within the standard deviation values. This can be related to the higher thermal conductivity of the fibres when compared with the silica aerogel, since cellulosic fibres present a λ ≈ 0.050 W m−1 K−1 and aramid fibres a λ ≈ 0.040 W m−1 K−1 [63], but also with the consequently lower aerogel quantity. The thermal conductivity difference between the formulations containing natural and aramid fibres can also be associated with the existence of voids around the fibres that result from the drying and shrinkage of the natural fibres after the hydration reactions. This is accompanied by forming closed pores and influencing their thermal performance (as seen in [27]), but also with the higher quantity of aramid fibres (0.50% vs. 0.10% (vol./vol.)). As a reference, air presents a λ ≈ 0.025 W m−1 K−1 [64], where it can be seen that more pores can also influence the overall thermal conductivity performance.
When the thermal conductivity values in the dry-state (λ10°C,dry) are compared with the ones obtained in the saturated state (λ10°C,sat) it is seen that the highest increase was verified in the reference (TR reference), with the fibres’ presence contributing to maintaining a lower thermal conductivity value for the saturated state. This can be related to the fact that the fibres’ incorporation reduced the capillary pores [65], as observed in the MIP and SEM analysis results presented in [27], reducing the liquid water contribution to increase the thermal conductivity.
The specific heat capacity presented by these aerogel-based thermal renders is much lower than that of expanded moulded polystyrene (EPS) (cp ≈ 1568 J kg−1 K−1 [43]) but very similar to glass wool (cp ≈ 928 J kg−1 K−1 [43]), while not differing by much from a conventional cement-based mortar (cp ≈ 900 J kg−1 K−1 [66]) or industrial thermal renders containing EPS (cp ≈ 1000 J kg−1 K−1 [62]). Considering the specific heat capacity, thermal conductivity, and bulk density, it is seen that the thermal inertia (I) presented by these renders, although with lower thermal conductivity than EPS, presents two times higher thermal inertia than this conventional thermal insulator (I ≈ 27.4 J m−2 K−1 s−1/2 [43]). Depending on the applied thickness, this can influence their potential applications.
Related to the previous characteristics, the thermal diffusivity (α) quantifies the rate of propagation of heat through the material, which relates to the penetration depth (dp,10min), at a time of 10 min. The results show that if there is an increment of temperature applied to one side of a sample, the depth to which the temperature will change significantly after 10 min, being around 20 mm for all renders. Additionally, when compared with EPS (dp,10min = 63 mm) [44] it is significantly lower, being more similar to the behaviour of a wood fibreboard (dp,10min = 26 mm) [44]. Therefore, these renderings respond even slower to temperature variations than an EPS board.
When the thermal conductivity at 10 °C (λ10°C) is evaluated against the moisture content (w), Figure 4, it can be observed that higher moisture content leads to higher thermal conductivity, as expected (since water presents a λ10°C ≈ 0.600 W m−1 K−1 [64]) and verified by other authors for other mortars [40,62,67]. The incorporation of fibres, as previously discussed, seems to reduce the free water saturation (wf) of these renders [68]. Moreover, for the aramid (TR aramid), due to the porosity reduction (less than 1.2% of the TR reference—Table 2), and for the natural fibres (known to present more affinity to water [69]), due to the existence of air pockets trapped inside the matrices, they can maintain lower water contents (≈less than 5%) and consequently lower thermal conductivity (≈less than 6%). With the fibres’ incorporation, it was possible to absorb less capillary water, but also lower thermal conductivity values were verified in the natural fibre-containing formulations (Table 2) [27].

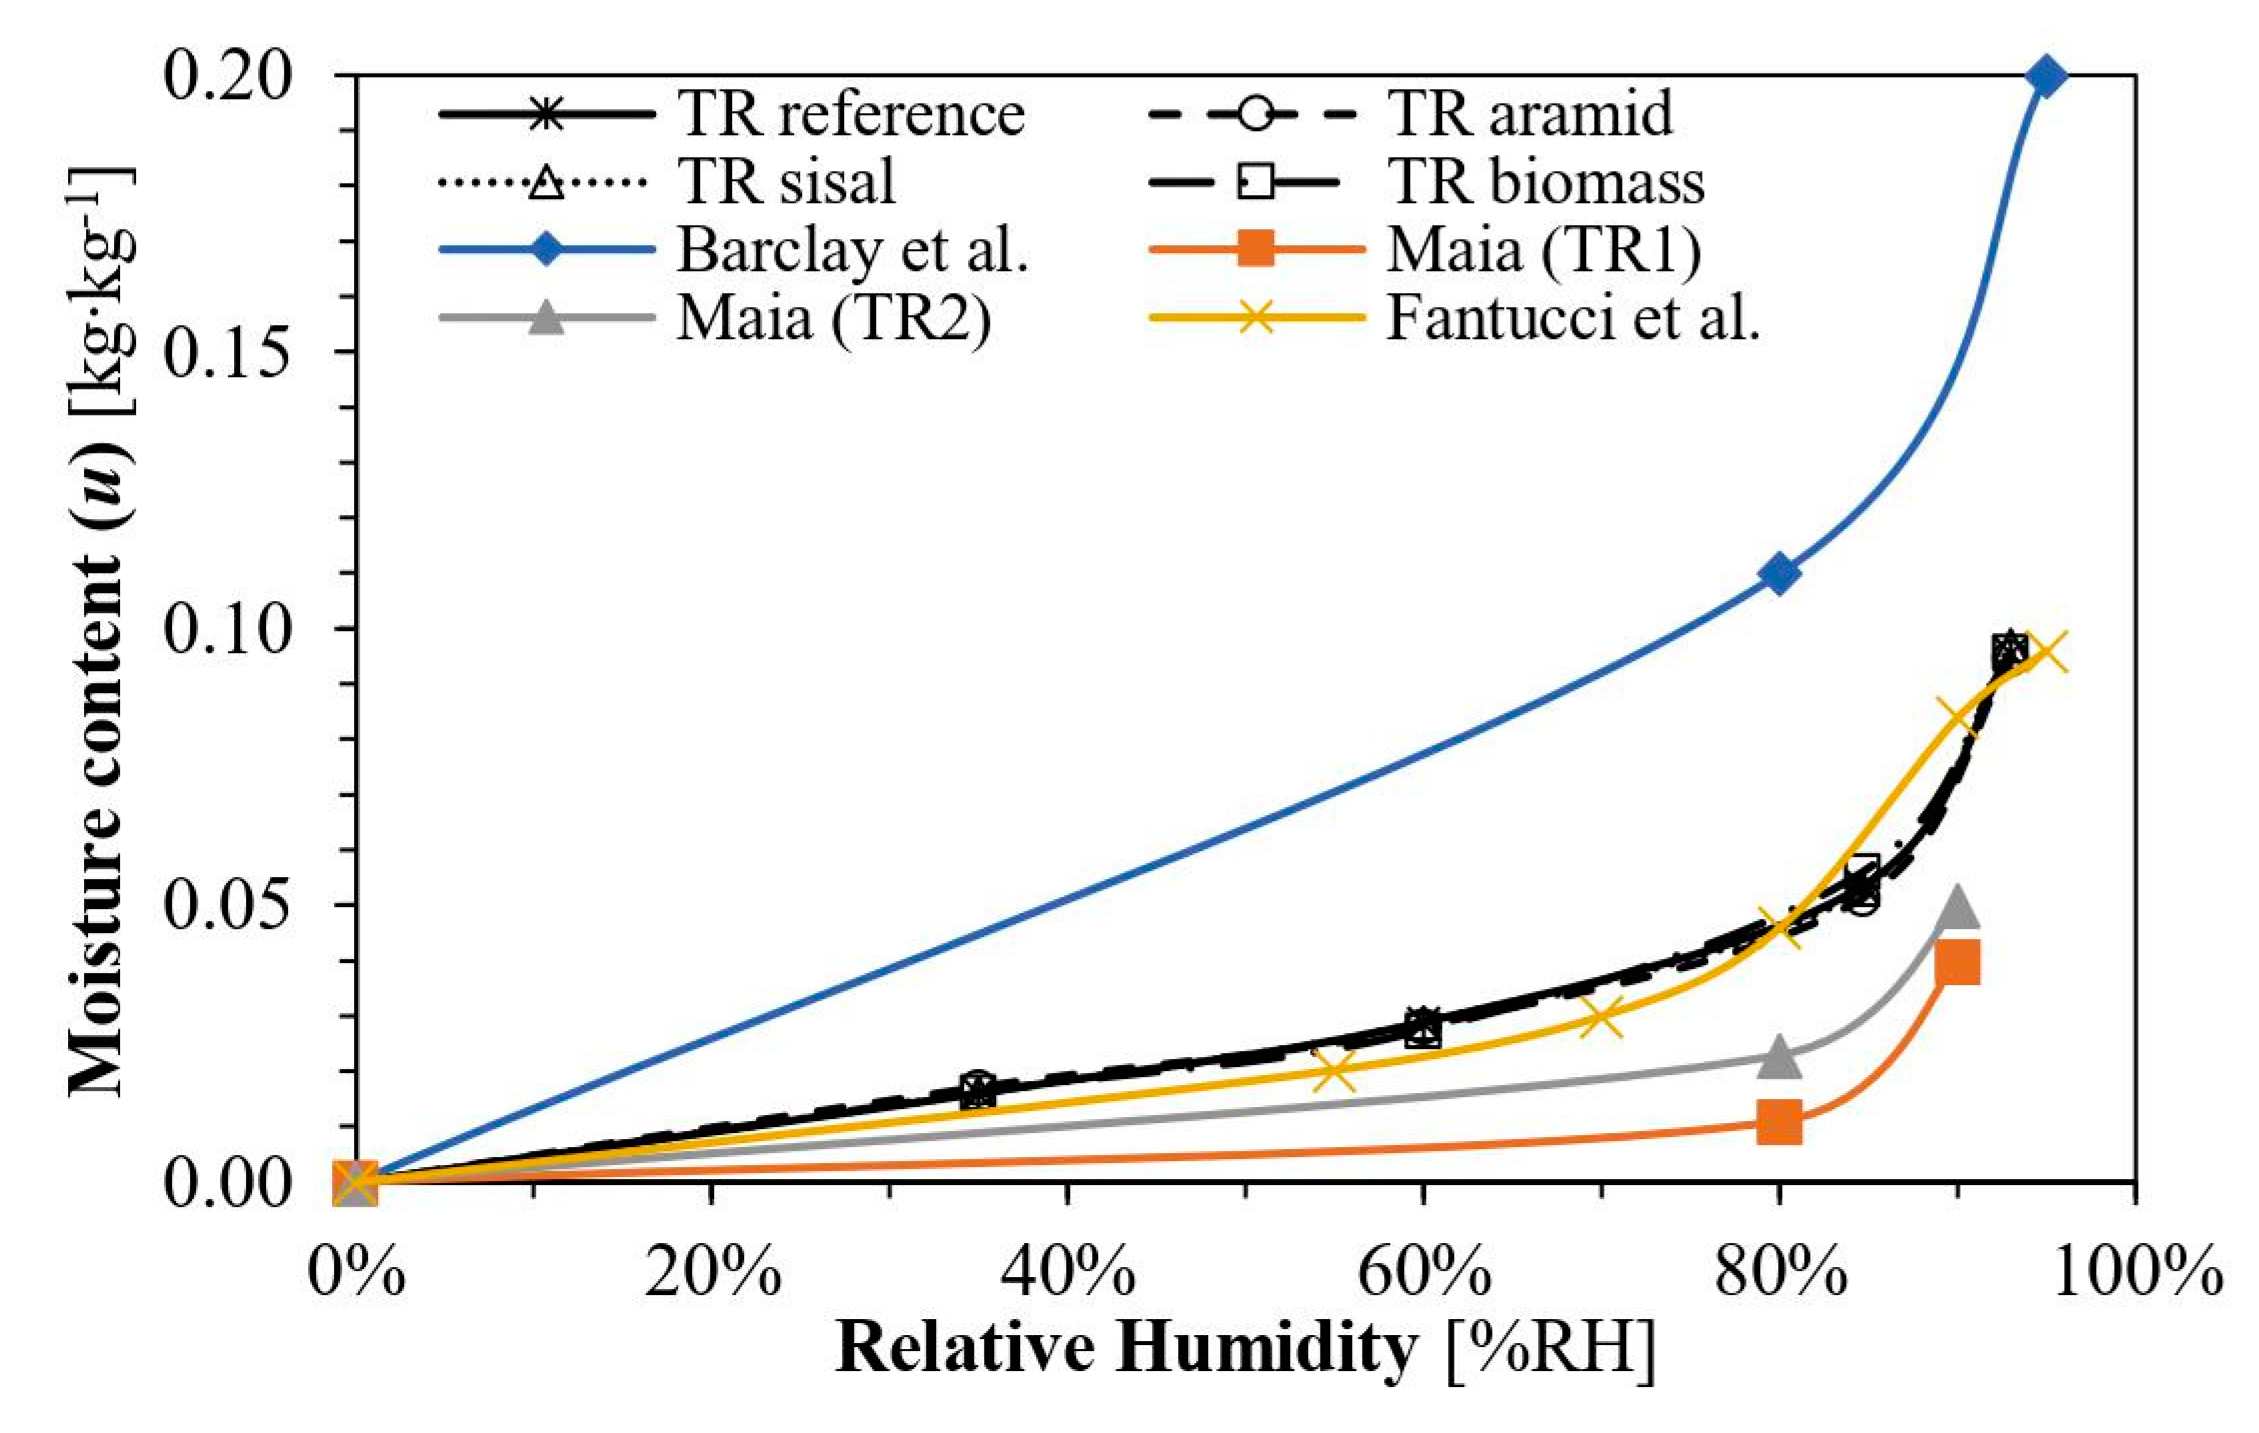
2.3.2. Moisture Storage Properties

To determine the formulations’ moisture content, they were evaluated in the dry state and then for 35, 60, 85, and 93% RH, at 23 °C. This way, it was possible to obtain the average sorption values for different moisture content indicators as shown in Figure 5, the hygroscopic regime of these TRFs is presented following EN ISO 12571 [45]. For comparison purposes, the data presented by Barclay et al. [33] for hemp-lime (Barclay et al.), by Maia et al. [62] for commercial thermal renders (Maia TR1 and Maia TR2), and by Fantucci et al. [11] for an aerogel-based internal plaster are also presented in Figure 5. It is possible to see that these TRFs showed a constant increase in moisture content from the dry state until 60% RH, and then, for higher RH, the moisture content strongly increased, reaching around 0.10 kg kg−1 at 93% RH. This highlights that these renders are hygroscopic materials, with the fibres contributing to decreasing the values of moisture content.
In the same Figure 5, it is also seen that all aerogel-containing formulations (the ones herein studied and the one presented by Fantucci et al. [11]) show similar hygroscopic behaviour; therefore, it seems that the fibres did not significantly influence the hygroscopic behaviour already shown by the reference (TR reference) and other similar products. When compared with the thermal renders studied by Maia et al. [62], these aerogel-based thermal renders showed a higher degree of moisture uptake, but much lower than the hemp-lime studied by Barclay et al. [33]. These behaviours are probably linked to the microstructural aspects seen previously by the authors [27]. If other thermally insulating materials are considered, EPS also shows some significant moisture content from 80% RH onward, since at ≈ 90% RH it shows a water content of about 0.07 kg kg−1 [44], and even if wood wool is considered at ≈ 90% RH, it presents 0.15 kg kg−1 [44], not very far from these renders’ performance.
For the over-hygroscopic range, the free water saturation (wf) and the maximum water content (wmax) were also characterised (Table 4). Here, the formulations containing fibres lowered the wf with the aramid fibres presenting the lowest value, followed by the natural fibres. Once again, the water affinity of the different fibres is the main aspect to consider. When comparing the wf performance of these renders with other aerogel-enhanced insulating materials, it was seen that they showed a behaviour within the expected ranges, between 240 and 500 kg m−3 [11,28].
As for the saturation coefficient, the lower this coefficient, the more space is available to accommodate the expansion of liquid water as it freezes [49]. As a reference, for bricks, this coefficient is considered acceptable if below 0.78 [70], whereas, in this study (Table 4), the values were way below that value (<0.35), with the fibre-containing formulations presenting even lower values than the reference. This indicates that these aerogel-based renders have the potential to effectively accommodate the expansion of liquid water as it freezes.

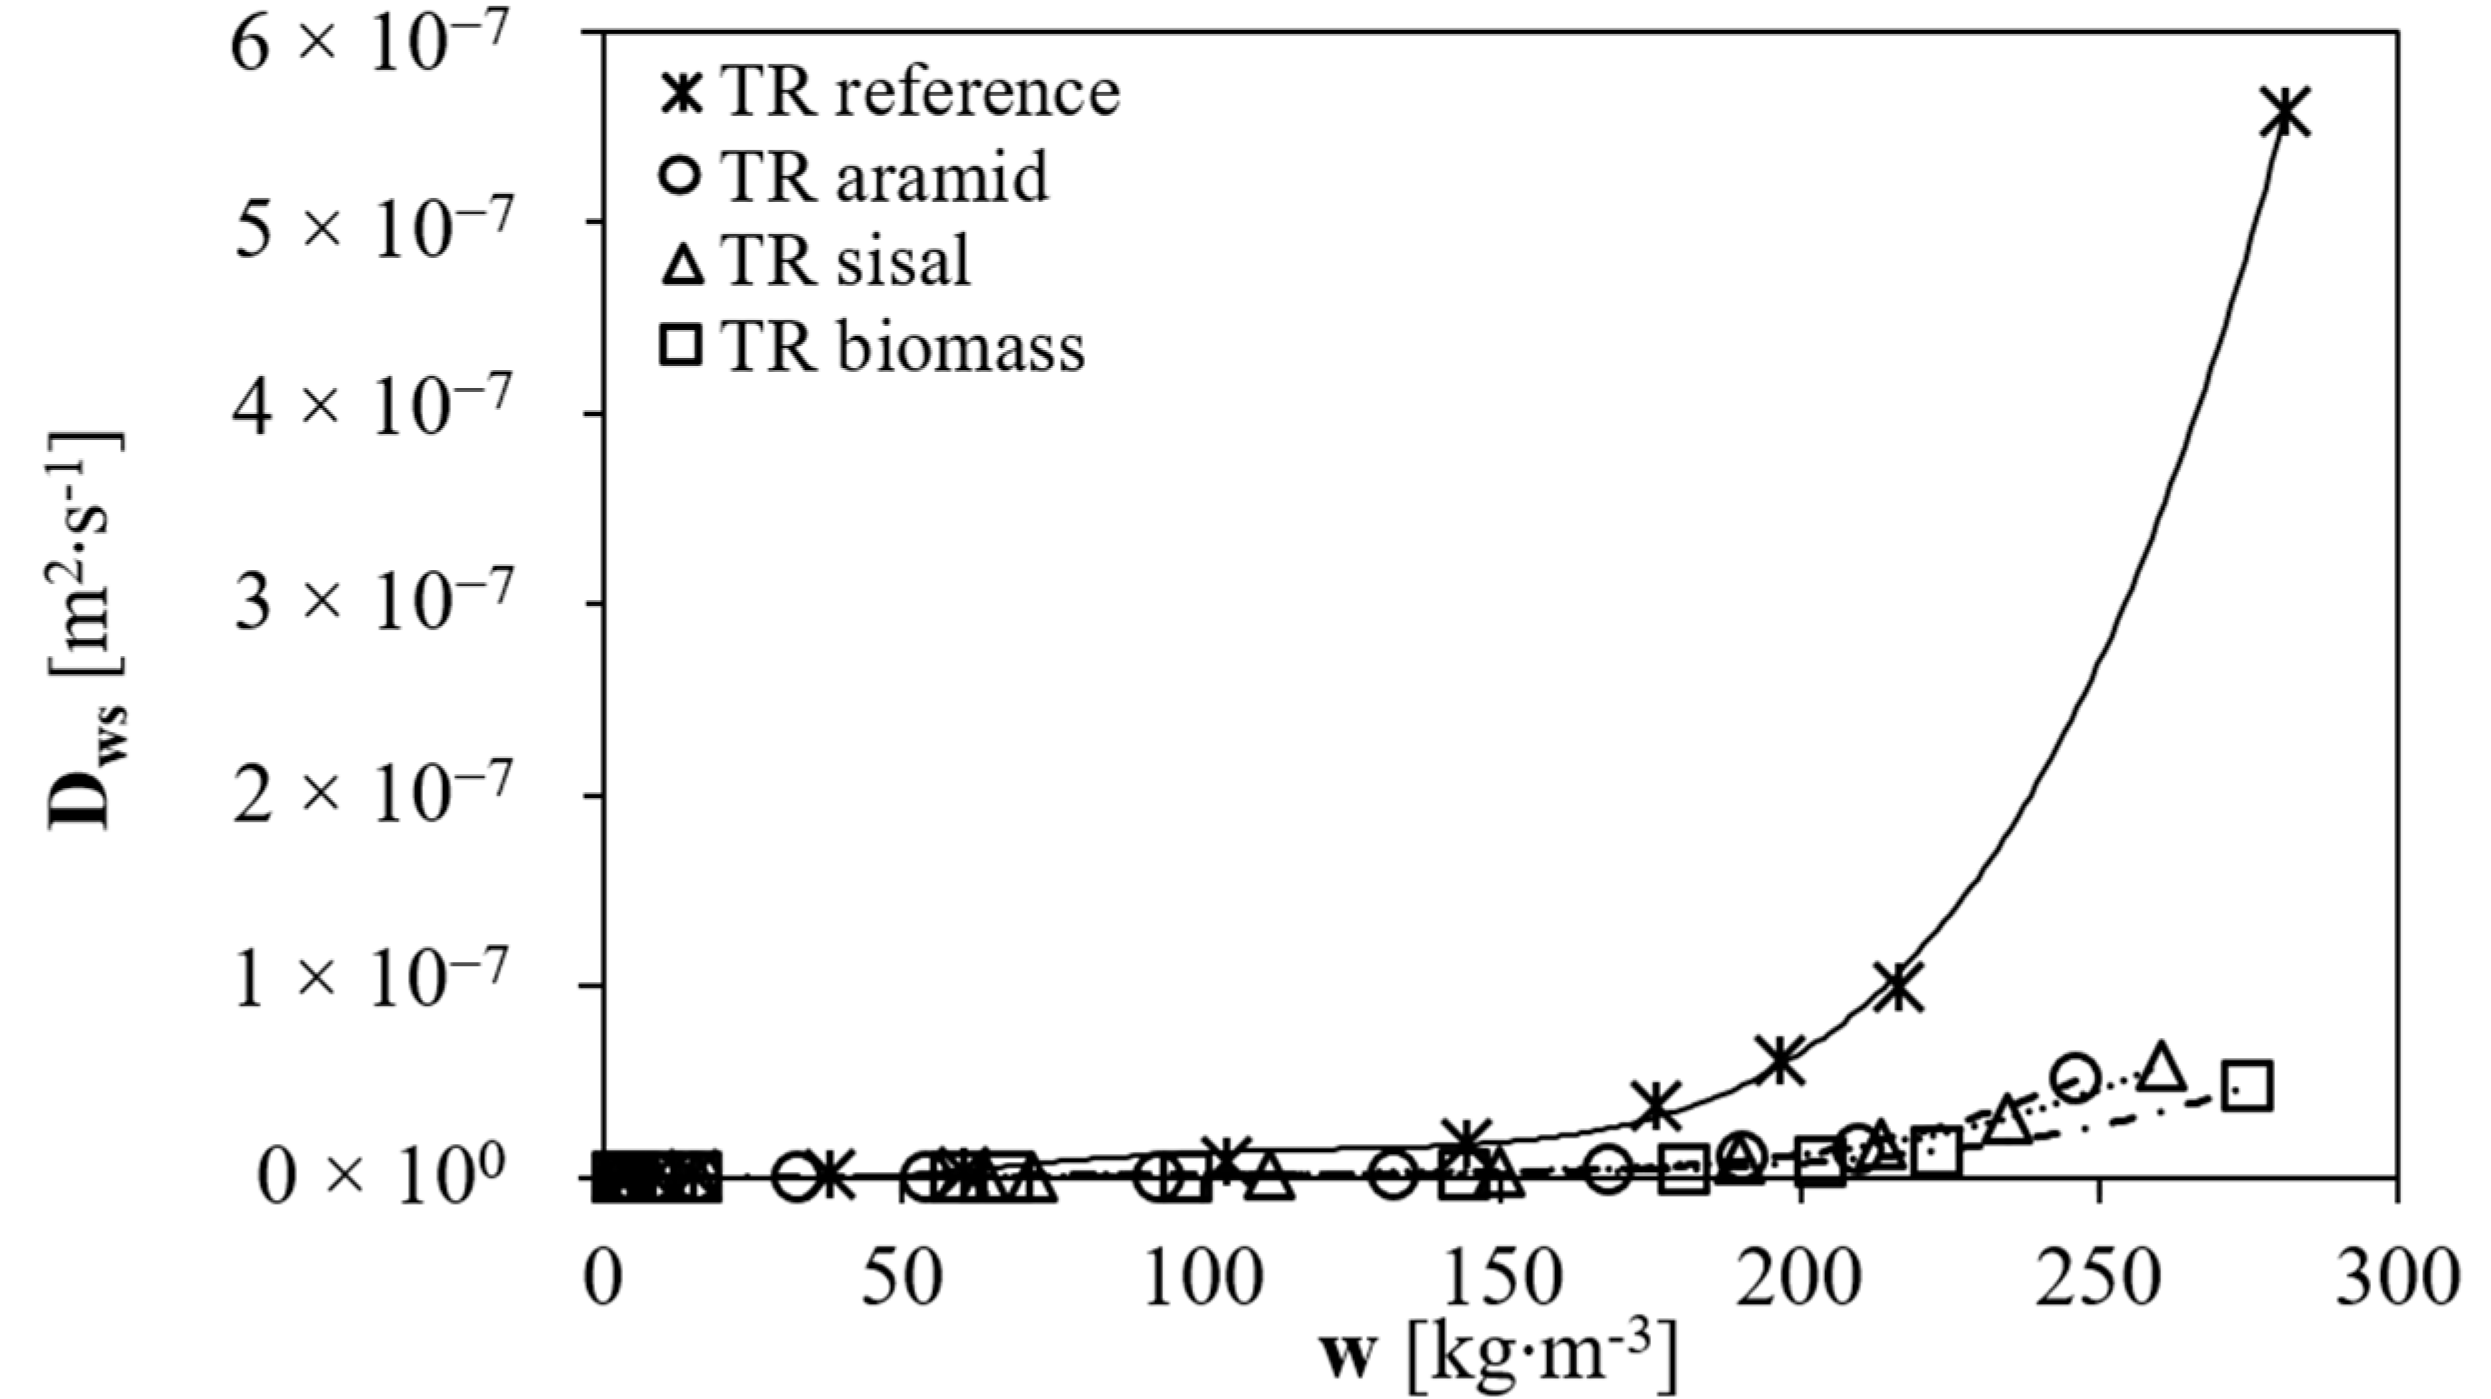
2.3.3. Liquid Water Transport Coefficient for Suction

To calculate the liquid water transport coefficient for the suction (Dws) parameter, the results for capillary water absorption (Aw), previously obtained and presented in Table 2, were used. The fibre’s incorporation by powder substitution led to lower water absorption coefficients (Supplementary Data), as a consequence of the fibres not only obstructing the capillaries but also forming air pockets inside the matrix (natural fibres)—as it could be observed in [27]—and hindering the capillary water progress [68]. This fact was expected to directly influence the liquid water transport coefficient for suction (Dws) results due to the Aw contribution to its calculation.
Figure 6 shows the calculation results, where the fibres’ use (TR aramid, TR sisal, and TR biomass) led to a lower liquid transport coefficient for suction (Dws) when compared with the reference (TR reference), presenting better behaviour, as a construction material. When compared with other thermal renders, the reference (TR reference) shows a higher Dws order of magnitude (≈10−7 m2 s−1), but the fibre-containing formulations present the same order of magnitude as other thermal renders (≈10−8 m2 s−1) [62]. Once again, the positive impact of the fibre’s use is seen, due to its earlier verified impact on water absorption reduction.

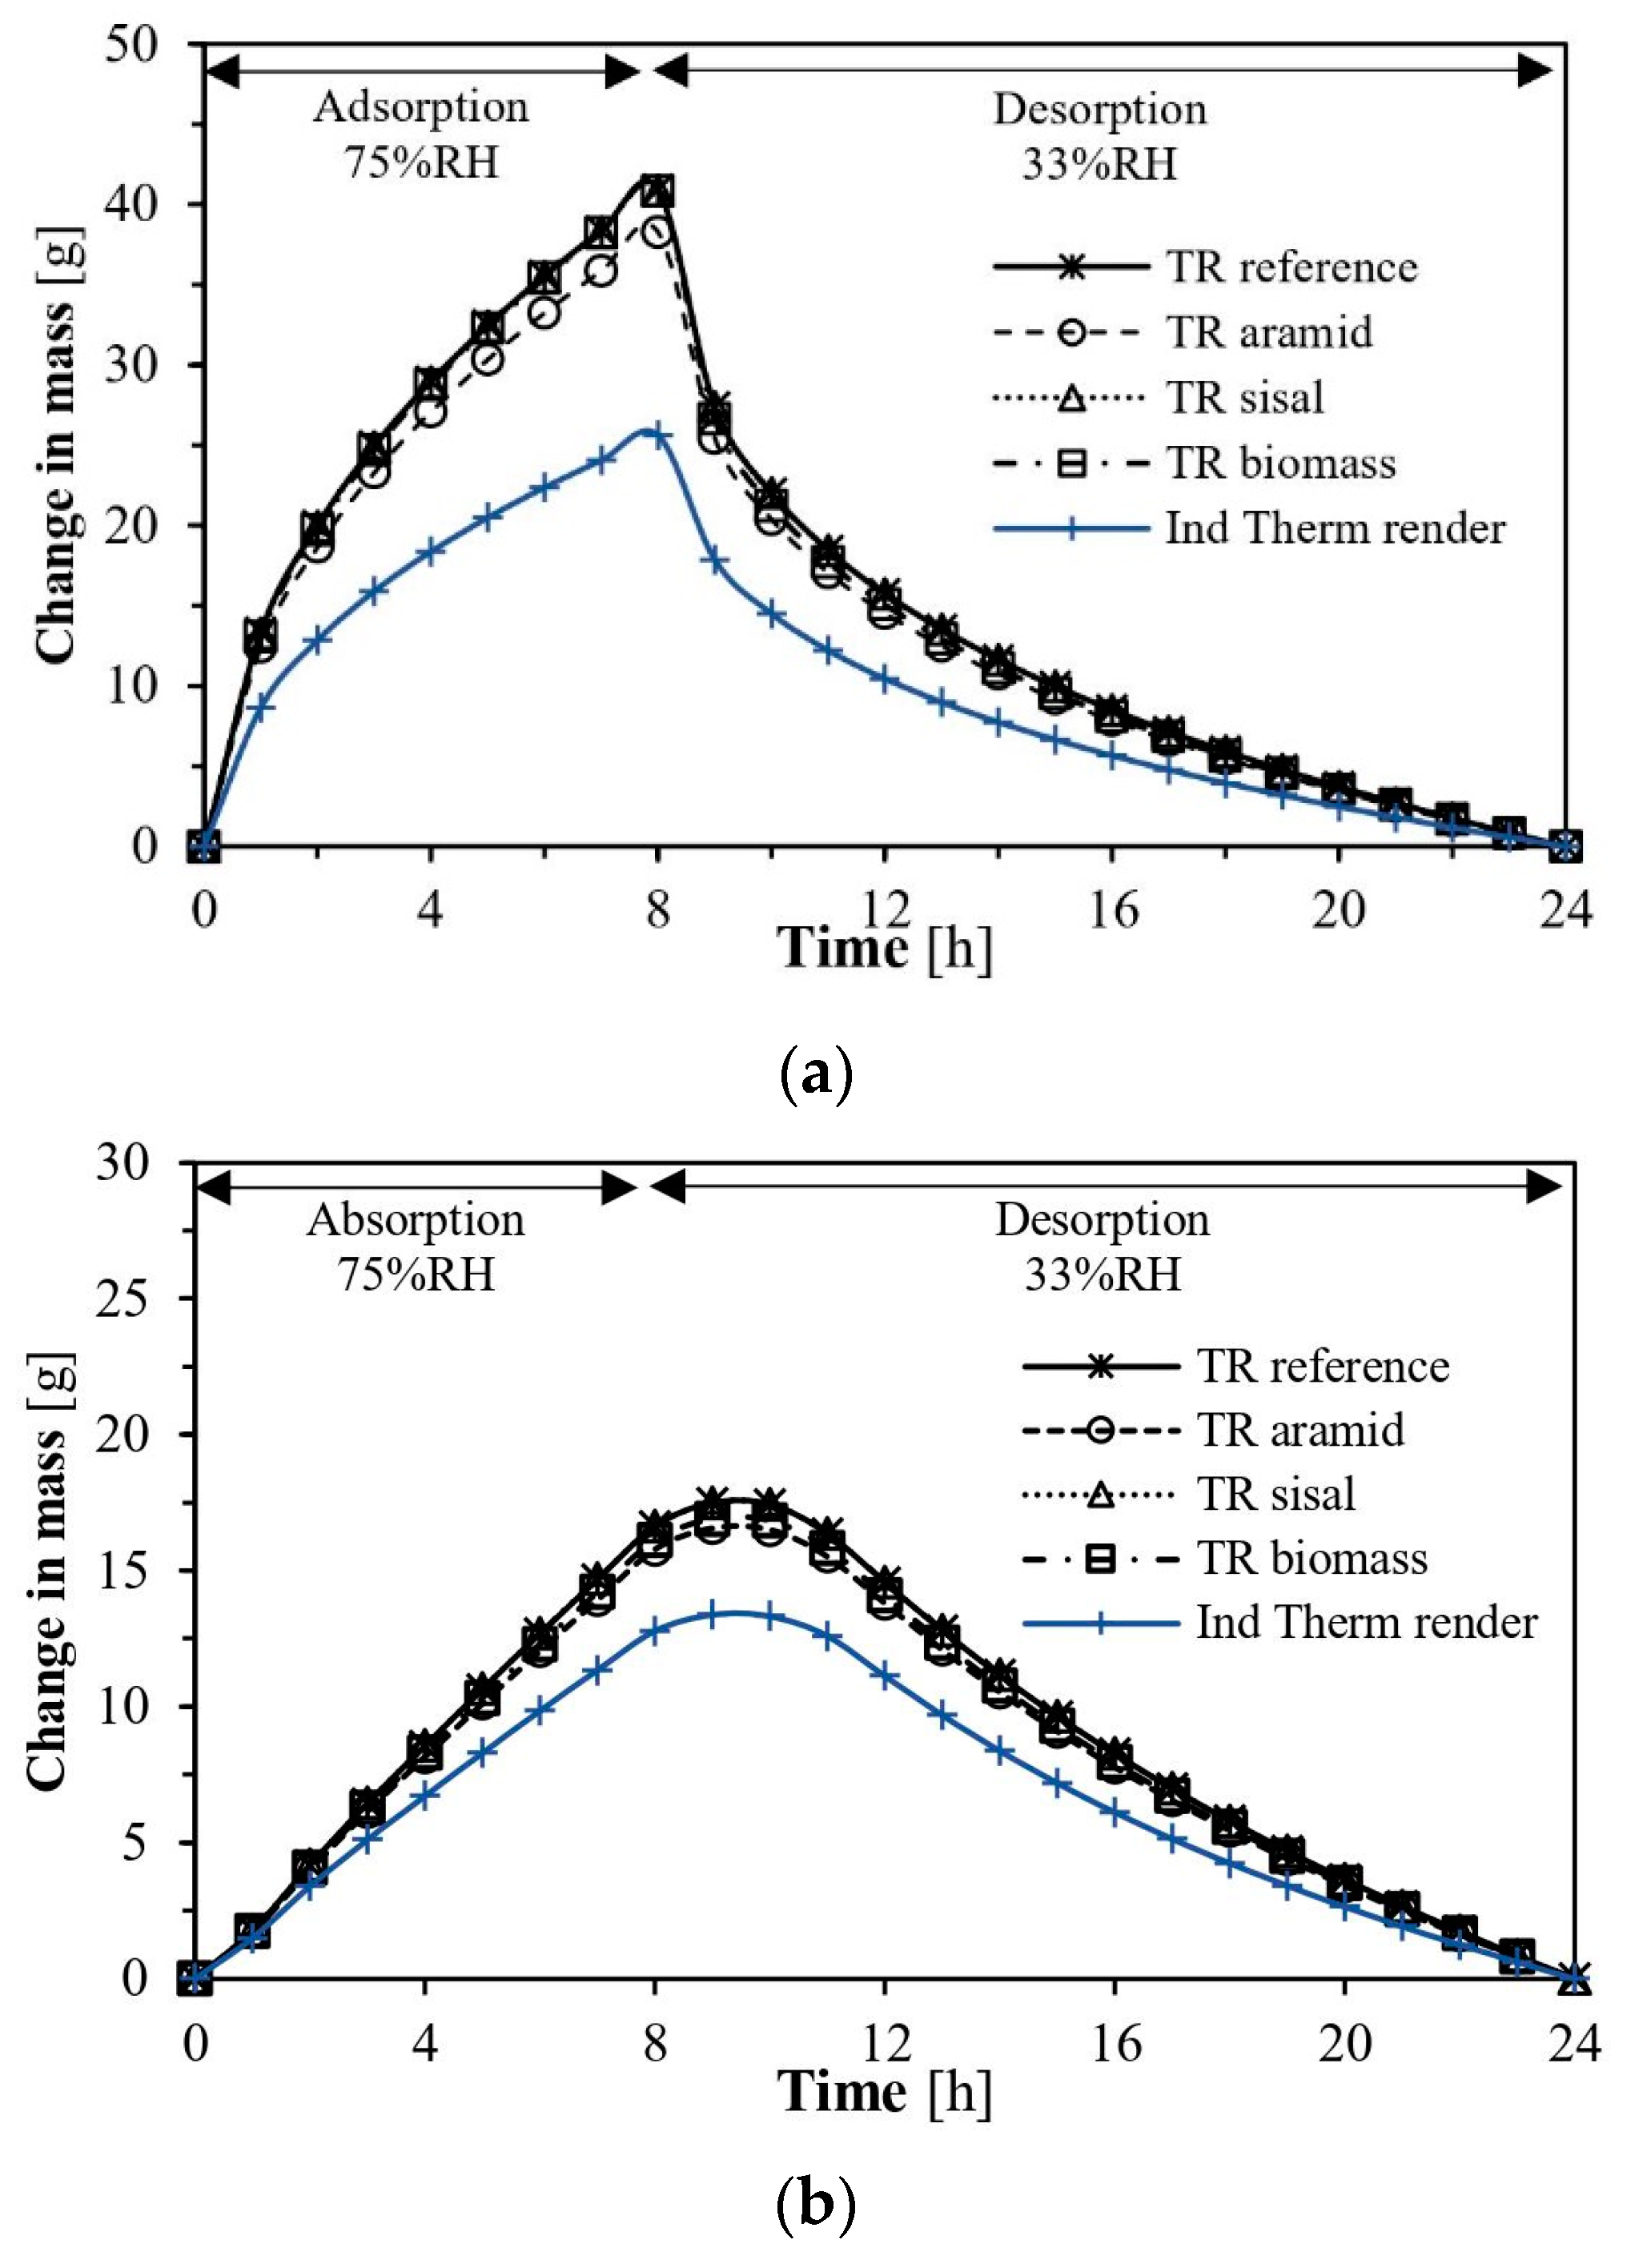
2.3.4. Moisture Buffering Properties

The moisture buffering was another interesting property to be evaluated in these formulations since thermal renders can be applied in several scenarios, such as interior thermal insulation retrofits [28,71,72]. As this parameter is connected to the material’s sorption and desorption properties [73], its evaluation allows for the classification of its potential to regulate indoor moisture [48], making it an interesting aspect to consider and analyse.
Following the work by Barclay et al. [33], three different potential indoor application scenarios were studied (Figure 7). Although the first scenario (Figure 7a) is not usually applied, the other two (Figure 7b,c) reflect real potential applications. The simulation and analysis of values were only carried out for the thermal insulation materials, with the other materials’ influence being considered but not directly quantified. Therefore, a comparison was made between these TRFs and an industrial thermal render presented by Maia et al. [62] (designated as Ind Therm render), since other thermal insulation materials such as EPS and XPS do not present significant hygroscopic behaviours in these RH ranges [43,44].
Figure 8 shows the results for the different simulations and solutions. (Figure 8a) shows that for the aerogel-based renders, the one containing aramid (TR aramid) showed a slightly lower change in mass. However, all presented significantly higher capabilities than the current thermal render (Ind Therm render).
When a gypsum board (0.0125 m) was placed in front of these thermal insulation materials (Figure 7b and Figure 8b), for mechanical protection, some started to emerge with interesting behaviour. The total change in mass due to moisture presence was reduced to half, which was expected since even one coating of paint can reduce their performance [74]. All the aerogel-based formulations presented similar behaviour; a lag appeared between the time where the test RH changed (at the 8 h mark) and where the maximum moisture content appeared (≈10 h mark), being this related to the moisture buffering properties also presented by the gypsum boards [75].
Finally, it was considered the application of a commercially available multi-layered coating system composed of a basecoat (3 mm) and a finishing coat (2.5 mm), as presented in [25]. Figure 8c shows that the maximum change in mass due to moisture was reduced by almost ten times when compared with Figure 8a, with the materials being now limited by the presence of the multilayer coating system. This behaviour was expected since these coating materials show low water vapour permeability due to their moisture-protective function [74,76].
When calculating their MBVpractical and comparing with other materials [59,77], it can be seen in Figure 9 that the TRFs present a moderate-to-good classification, with higher values than the industrial thermal render (Ind Therm render) and much higher than the other materials. When the gypsum board is placed over their surface, the differences between the aerogel-based renders and the current thermal render almost disappear, as their behaviour is similar to that of concrete (however, in a solution like this, the gypsum board contribution should also be considered) and they are classified as presenting limited moisture buffering capabilities. When the multilayer system is applied on the surface, the moisture buffering behaviour of the renders is compromised by the performance of the coating system, with their classification now being negligible (MBVpractical < 0.2 g m−2 %RH−1 [58]) relative to their moisture buffering capabilities.
These results show that these TRFs can effectively improve the indoor environment, given that their performances are not impaired by surface coatings that degrade this property. In terms of differences between the fibre-containing formulations and the reference, the only variation worthy of note was when the render was directly exposed to the environment, with the aramid-containing render (TR aramid) showing a smaller change in mass (≈less than 3 g m−2), with any difference eliminated in the other cases. The differences between the TRFs and the industrial thermal render can be related to their higher hygroscopicity, as previously seen.

3. Hygrothermal Simulation

3.1. General Considerations

The hygrothermal simulations were carried out considering two approaches: new construction and retrofitting of building walls. Two geographical places were chosen for the new construction scenario: Lisbon, Portugal, and Zurich, Switzerland. Lisbon presents, according to the Köppen-Geiger climate classification [78,79], a hot summer Mediterranean climate (Csa), while Zurich presents, according to the same classification, a marine west coast climate (Cfb). These two areas present quite distinctive characteristics and are representative of generic European climates. At the same time, it is known that Switzerland already has a large construction market using aerogel-based thermal renders [71,80]. Therefore, it was important to see how these formulations would behave in such distinct conditions.
For the retrofit approach, since Lisbon has a significant number of buildings from the 1990s lacking thermal insulation [81,82], which leads to high energy consumption [83], two different retrofit approaches were selected: (i) thermal insulation material on the walls’ inside surface and (ii) thermal insulation material on the walls’ outside surface.
This study also compares the main thermal insulating materials used in this type of solution: EPS and XPS, and an industrial thermal render currently commercialised and applied in Portugal [62]. Due to their high capillary water absorption [23], these thermal renders need to be used in multilayer coating systems, like EPS and XPS in ETICS (External Thermal Insulating Composite System) or even in other thermal insulating renders [25]. Therefore, those coating layers were also considered when the solutions were applied outside the wall. When considered for application on the inside, a gypsum board was added as a protective and finishing element.

3.2. Simulations of Climatic and Boundary Conditions

With the formulations’ hygrothermal characterisation, it was possible to study their performance in different solutions and geographic and climatic conditions. This was achieved using numerical models that predict the coupled heat, air, and moisture transport (HAMT) of building materials [33,84].
In the present study, WUFI Pro 6.4 (Wärme Und Feuchte Instationär—heat and moisture transiency) was the software used, allowing for realistic hygrothermal simulations [34]. This software needs as input: the composition and properties of the individual materials used; the solution’s physical orientation and slopes; the initial simulation conditions (indoor and outdoor climates); and the duration of the simulation. Then, the numerical model, based on EN 15026 [10], evaluates, for the simulation period and chosen time step, the heat and moisture fluxes and the transient profiles of temperature, RH, and moisture content of the solution [85]. The model uses Equations (7) and (8) [85,86], where the storage terms are located on the equations’ left side and the fluxes on the right side are affected by heat and moisture.
w φ × φ t = × D φ φ + δ p φ p s a t
H T × T t = × λ T + h 0 δ p φ p s a t
where ∂w/∂φ is the moisture storage capacity [kg m−3 %RH−1]; ∂H/∂T is the moist heat storage capacity [J kg−1]; w is the moisture content [kg m−3]; λ is the thermal conductivity [W m−1 K−1]; Dφ is the liquid conduction coefficient [kg m−1 s−1]; δp is the water vapour permeability [kg m−1 s−1 Pa−1]; hv is the water evaporation enthalpy [J kg−1]; psat is the water vapour saturation pressure [Pa]; T is the temperature [K]; φ is the RH [%]; and t is the time [s].
This software also considers the effects of short- and long-wave radiation on the surfaces, combined into a collective heat source [34,87], and the effect of wind-driven rain (WDR), where factors such as the horizontal rainfall, wind speed, orientation, and type of constructive solution are considered [34,88]. However, the model has some limitations, as it neglects [89]: the convective transport of heat and moisture; some of the liquid transport mechanisms; salts and water transport; the interface resistance between two capillary-active materials; and enthalpy flows resulting from the transport of liquid water due to temperature differentials. With knowledge of its main limitations, this software is widely used in research, with its validity extensively validated through comparisons between in situ and simulation results [88,90,91].

3.2.1. Climatic Conditions

To simulate the solutions’ performance, the climatic conditions must be known, such as the hourly mean values of temperature and RH for the indoor and outdoor climates, solar radiation, wind speed and direction, and precipitation for the outdoor climate conditions to test [85]. For the Lisbon and Zurich outdoor conditions, values available in the WUFI database were used. The average conditions are shown in Table 5. The indoor climatic conditions, and although occupants’ comfort greatly varies from individual to individual [5], are usually established as legal requirements, it is accepted that the comfort zone has temperature threshold values between 19 and 26 °C and RH between 30 and 70% RH [92], being in Portugal usually considered between 18 and 25 °C [93]. Therefore, for the indoor conditions, the high moisture load climate from the EN-15026 was used (temperatures between 20 and 25 °C and RH between 40 and 70% of the RH-standard B curve) [10], simulating an intensive indoor usage, as these are the most commonly used conditions when considering numerical simulations and accepted as a good benchmark for comparison [94,95].

3.2.2. Boundary Conditions

Five years were chosen as the duration of the simulations to check the possibility of attaining some kind of dynamic equilibrium for the solutions [47], starting at the beginning of the rainy season (October) and, therefore, limiting the drying of the solutions at the initial stage. As for the facades’ orientation, the north orientation was selected, as the northern hemisphere’s orientation has less solar radiation, influencing the drying process, and the orientation would lead to the most WDR exposure. Additionally, 1% of the WDR value [96] was considered to penetrate the outer layers of the solutions, simulating construction defects [95,97].
Another parameter influencing the solution’s performance is the short-wave radiation absorptivity (αs) [88]. A lower value is associated with brighter colours while a higher value is associated with darker colours. From other studies, a lower αs reduces the absorbed radiation, leading to lower surface temperatures, slowing the drying fluxes, and contributing to the material’s increased water content. When comparing αs = 0.2 with αs = 0.6 or αs = 0.8 [62], significant differences in the drying of the construction elements were verified, leading to the choice of αs = 0.25 as a conservative approach. The boundary conditions can be seen in Table 6.

3.3. Wall Solutions and Simulations Evaluation Criteria

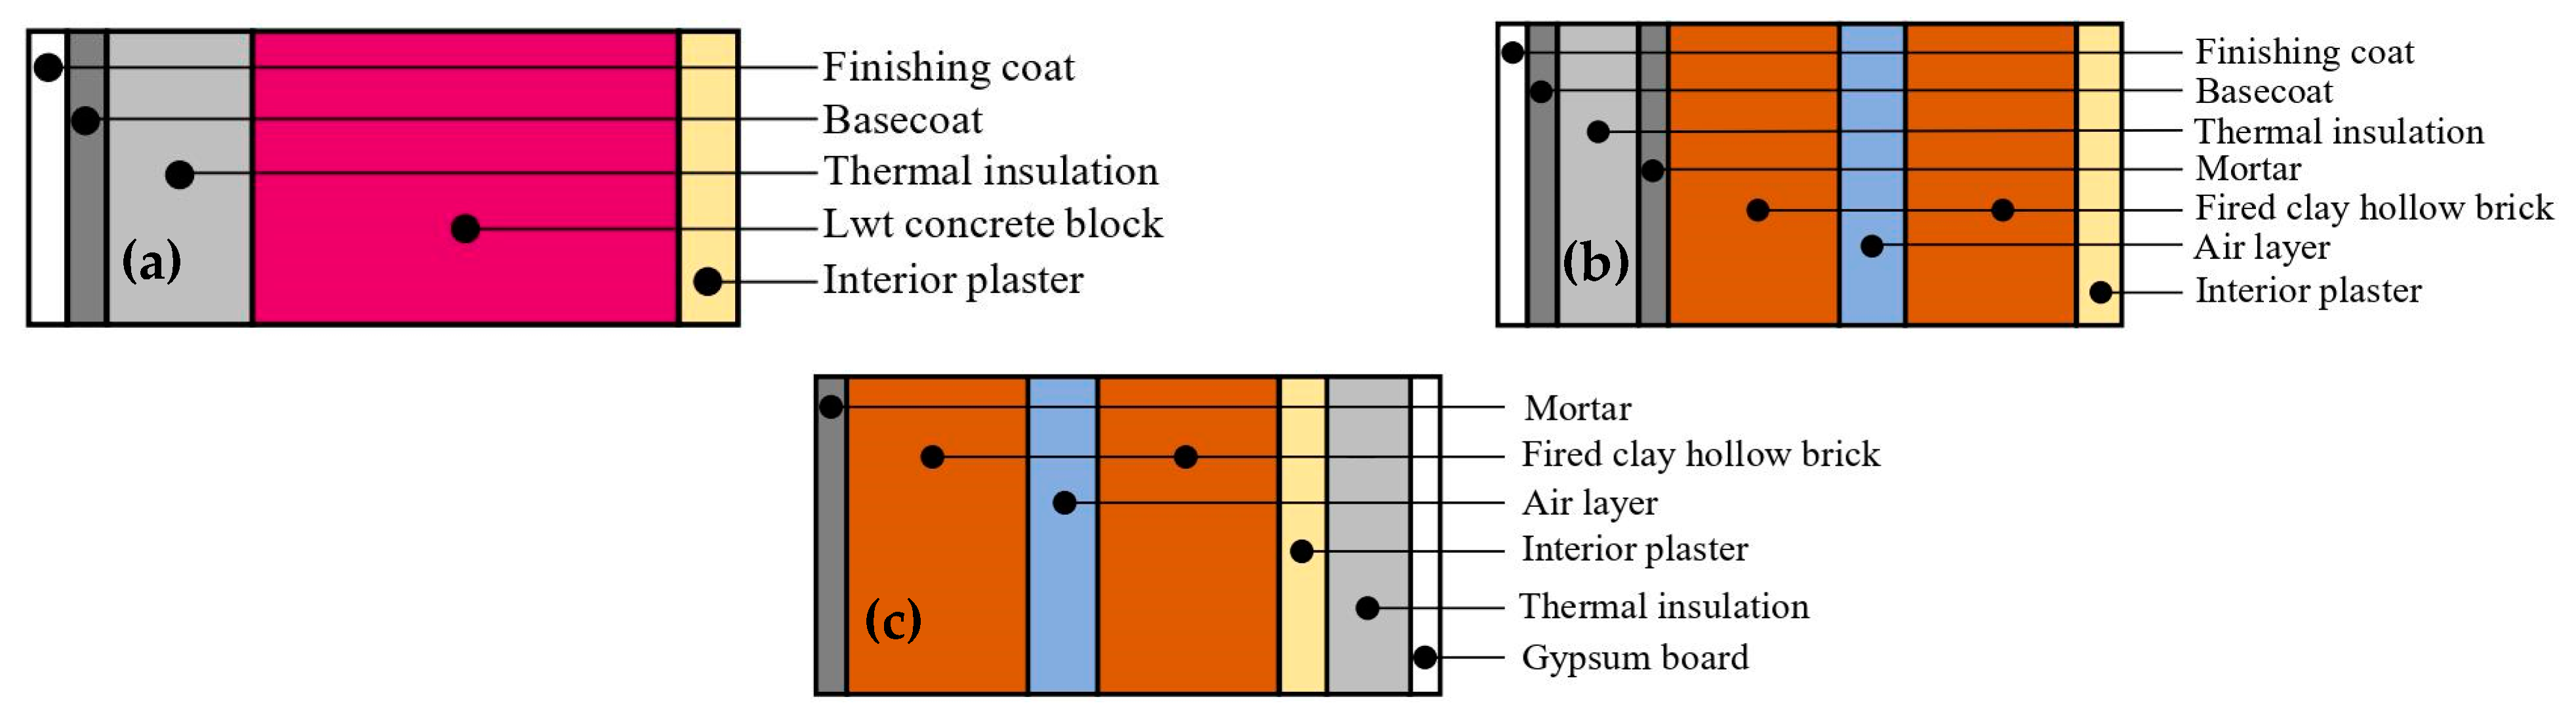
3.3.1. Materials and Wall Assemblies

To model and simulate the behaviour of different wall assemblies, it was necessary to create new material entries in the WUFI database. With the experimental campaign, these TRFs were hygrothermally characterised, but other materials’ properties had to be gathered from the literature. In the Supplementary Data, the detailed properties of the used materials can be seen.
Although it was considered a commercial protective coating system, composed of a basecoat, keycoat, fiberglass, mesh, and finishing coat, in these hygrothermal simulations only the contributions of the basecoat and finishing coat were considered. The fibreglass mesh, due to its open mesh, was considered to present a negligible influence. The keycoat, with a thickness of a few micrometres and a similar formulation to the finishing coat (acrylic co-polymers dispersion [25,98]), was considered a part of such a layer’s properties and thickness.
With the individual materials characterised, to simulate the hygrothermal performance of a new wall scenario, one of the most common solutions was chosen: a multilayer coating protective system with a thermal insulation material, a lightweight concrete block, and an interior plaster (Figure 10a). Then, depending if it was applied in Lisbon or Zurich, due to the thermal insulating requirements (Lisbon: U ≤ 0.50 W m−2 °C−1 [99]; Zurich: U ≤ 0.25 W m−2 °C−1 [100]), the thermal insulating layer and the lightweight concrete block thicknesses varied to fulfil the requirements. For Lisbon, a thermal insulation of 0.025 m and a lightweight concrete block of 0.25 m were used, and in Zurich, the same materials but with 0.06 m and 0.38 m, respectively.
For the retrofit scenario, two different thermal insulation applications were considered: one applied on the exterior (Figure 10b) and one applied on the interior surface (Figure 10c). The base wall was one of the most common types existent in buildings constructed in Lisbon in the 1980s [101]: double-leaf fired clay hollow bricks with an air layer in-between. This construction typology presents severe thermal insulation deficits due to the lack of thermal insulation materials [102]. The thickness of the thermal insulation was chosen to comply with the new buildings’ requirements: U ≤ 0.50 W m−2 °C−1 [99]. This way, it would be possible to evaluate the impact that moisture has on the constructive solutions’ thermal insulating performance, since their starting point, from a hygrothermal point of view, was the same. The layers and respective thicknesses of all the studied solutions are presented in Supplementary Data.
The new wall solutions, both for Lisbon (NW) and Zurich (ZNW), had a similar constitution, only differing in the lightweight concrete block thickness. Solutions 1 to 4 represent the TRFs (TR reference, TR aramid, TR sisal, and TR biomass, respectively); solution 5 contains an industrial thermal render; solution 6 uses EPS; and solution 7 uses XPS. The full description of the solutions can be seen in the Supplementary Data.
The retrofit solutions carried out on the exterior surface of the wall (RE) had a reference solution without thermal insulating materials—solution RE1—and then RE2 to RE5 corresponded to TR reference, TR aramid, TR sisal, and TR biomass, respectively. The industrial thermal render was the solution RE6, and finally, the solutions RE7 and RE8 correspond to EPS and XPS, respectively. The retrofit carried out on the interior surface of the wall (RI) followed the same thermal insulator distribution as in the RE scenario. Once again, the full description of the solutions used in these scenarios can be seen in the Supplementary Data.

3.3.2. Hygrothermal Simulations Evaluation Criteria

This type of research returns several results, but they need to be contextualised to be valuable. As a result, different aspects of hygrothermal performance were considered in this study in order to evaluate and compare the solutions.
(i)
Total water content and drying potential
One of the most critical factors in a hygrothermal analysis is the progression of a solution’s total water content over time [4]. Hence, it is important for the simulation period to be long enough to see if a given solution can reach a dynamic equilibrium, or if it continues to accumulate moisture over the years. As a result, the total water content and the drying potential were analysed, where the first represents the progression of moisture over time and the second helps to verify if the solutions are drying, using Equation (9) [72]. A positive value is related to moisture drying (pass) and a negative value to moisture increase (fail) over that period.
D P = W C y e a r n 1 W C y e a r n W C y e a r n 1 × 100
where DP is the drying potential [%]; WCyear n−1 is the solution’s water content at year n − 1, and WCyear n is the solution’s water content at year n, both in [kg m−3].
(ii)
Mould growth potential
The appearance of mould in construction materials can lead to hygrothermal and mechanical performance deterioration [5]. This is usually only assessed for the indoor environment due to air quality and material integrity; for the exterior surfaces, it is harder to evaluate as temperatures, UV exposure, and washing of the spores due to rain tend to limit their growth [103]. For indoor conditions, the factors to avoid mould growth are a specific temperature, RH ranges [104], and substrate quality [105]. Mould appearance and growth can be evaluated in the simulations through two different tools. A graph (temperature vs. RH) that shows the limiting isopleths for building materials, LIM B I (for situations where there is a bio-utilisable substrate) and LIM B II (for substrates with porous structures), below which no mould growth is expected [106]. The other tool is the WUFI Bio postprocessor, which allows conducting a biohygrothermal evaluation by comparing the simulated transient ambient conditions with the needed growth conditions [106]. The simulated moisture content of the mould spores is compared with the critical water content, which allows a spore to germinate, and once germination occurs, it estimates its growth (fail) [104]—the objective being not to have any growth at all (pass). Figure S3 from Supplementary Material shows an example of an isopleth whose behaviour was shared by all solutions using the WUFI Bio postprocessor: no significant risk of mould growth since its results were kept below the identified LIM limits (the darkest area corresponds to the most common conditions).
(iii)
Water content in the thermal insulation layers
Since this study involves highly porous thermal renders, one important assessment to be made was related to their water content over time. This directly influences the durability due to the potential running off of water inside the layer and on the frost resistance and thermal performance. Therefore, it is essential to know how the water content of the thermal insulating material is behaving relative to its maximum moisture capacity (wf), where values of the ratio w/wf below one indicate a low probability of water running off [85].
As for the frost damage risk, following the WTA guideline 6-5-12/D [107] referred to in [34], the contact area between the insulation and the most external layer (basecoat) should present a water content ratio (w/wmax) below 0.30, minimising the probability of frost damage. Since wmax for all solutions was much higher than wf (more than three times higher), a ratio of w/wf below 0.30 was considered a conservative approach in this study (pass).
  • (iv) Temperature variations
Temperature is a well-known factor that influences construction materials’ expansion and retraction characteristics [108]. As such, the temperature on the solution’s surface is an important parameter to evaluate since it can directly impact its durability [62]. If a given solution has a higher surface temperature for the same insulating performance, its durability can be decreased due to localised tensions on the material’s surface [62,88]. Another important factor to be evaluated is the temperature gradients within the thermal insulating material since they can lead to internal tensions, degrading the material’s structure and durability [109]. Therefore, the exterior surface temperature (99th percentile and maximum) and the temperature gradient (99th percentile) between the opposing surfaces of the thermal insulating materials were assessed.
  • (v) Surface condensation
One of the main pathologies that degrade buildings’ coating systems is related to the defacement of some areas due to biological growth (e.g., mould and algae), usually related to surface condensation [90]. As water condensation occurs when the water vapour partial pressure in the air exceeds the water vapour saturation pressure on the surface [103], this risk for the construction solutions can be evaluated by two indicators: the risk of surface condensation [110] and the number of hours that the superficial RH φ = 100% RH [62], both evaluated for the 5th year of the simulation. As described by Zheng et al. [110], the condensation potential (CP) [Pa], Equation (10), is a result of the difference between the water vapour partial pressure in the air (Pv(air)) [Pa] and the water vapour saturation pressure on the surface (Psat(surface)) [Pa]. If CP > 0, it is considered that there is condensation, and its value is accumulated for the evaluation period; otherwise, it is discarded. The other method considers the number of hours that superficial RH is equal to 100% (φ = 100%RH); the result is given in the simulation results and it is only necessary to accumulate the number of hours for the evaluation period.
C P = P v a i r P s a t s u r f a c e
(vi)
Thermal insulating performance—potential heat loss
The previous points are linked to the solution’s hygrothermal integrity and durability, while this factor is more geared towards its thermal insulating performance. This was evaluated using two indicators: the ratio between the solution’s monthly average U-value (Uavg) and its reference design’s initial U-value (Uref), and the heat loss (q) through the wall during a full winter season.
For the evaluation of the Uavg/Uref ratio, the WUFI Thermal Transmission post-processor [34] was used, which calculates the solution’s Uavg for each month, making it possible to evaluate if the solution is losing its thermal insulation performance. Then, knowing the Uref, it is possible to see, for the different months, how the solution is behaving, with a ratio above 1 indicating loss of thermal insulation capacity. The post-processor uses Equation (11) [34] for its calculations.
Since during summer months, the direction of the interior heat flux usually changes twice a day, it can lead to a meaningless ratio—because more heat flows from the wall to indoors during the day than heat flows from indoors to the wall during the night. Therefore, some care must be taken when executing the analysis in these months. This fact contributed to the analysis period defined for the element’s heat loss.
U a v g = Q Δ T a
where Uavg is the monthly average U-value [W m−2 °C−1]; Q is the monthly mean heat flux per area through the interior surface [W m−2]; and ΔTa is the monthly mean value of the temperature difference (indoor and outdoor) [°C].
For the calculation of the solution’s potential heat loss, the heat loss equation (Equation (12) [72]) is used. This was evaluated as a sum of the heat losses during the period from 1 October of the 4th year until 1 May of the 5th year, representing a full winter.
q = U i × A i × T i n T o u t × Δ t 1000
where q is the element’s heat loss [kW h]; Ui is the thermal transmittance of the assembly [W m−2 °C−1]; Ai is the surface area [m2]; Tin is the indoor temperature [°C]; Tout the outdoor temperature [°C] and Δt the time [h].

3.4. Hygrothermal Simulations and Discussion

This analysis was divided into three main scenarios: (i) a new wall with the thermal insulation material applied on the exterior surface (NW for Lisbon and ZNW for Zurich); (ii) a retrofit with the thermal insulation applied on the exterior surface (RE); and (iii) a retrofit with the thermal insulation applied on the interior surface (RI). The Supplementary Data presents graphics for all the scenarios and analyses of evaluation criteria that can further support the reading of these results.

3.4.1. New Wall Scenario (NW and ZNW)

Table 7 presents the most noteworthy results related to the solutions’ total water content, both for Lisbon (NW) and Zurich (ZNW)—in the Supplementary Data, the graphics of these simulations can be seen. There, it is possible to see that the application under different conditions influences the materials’ performance. In Lisbon, only solution NW5 (wall composition in the Supplementary Data) showed some water accumulation in year five, with the other solutions showing the capability to dry during the year. However, when the climate of Zurich (ZNW) is considered, with more accumulated rain, lower temperatures, and less solar radiation, it is seen that solutions ZNW5, ZNW6, and ZNW7 (wall compositions in the Supplementary Data) for the WDR exposed façade showed a lack of drying abilities, significantly impacting their potential integrity and durability. This lack of drying is also related to the penetrating 1% of driving rain due to construction defects. As for the aerogel-containing renders (NW1 to NW4, and ZNW1 to ZNW4), they showed the ability, in both climates, to attain a quicker dynamic equilibrium (around 3 years), whereas the natural fibre-containing formulations (NW3 and NW4, and ZNW3 and ZNW4) presented even better performance.
The industrial thermal render (NW5 and ZNW5) was the solution that presented the lower performance in both locations, probably related to a higher wf and the coating system limiting its drying. For the aerogel-based solutions (NW1 to NW4 and ZNW1 to ZNW4), since they present a lower wf than the industrial thermal render (NW5 and ZNW5) but at the same time lower μ than EPS (NW6 and ZNW6) and XPS (NW7 and ZNW7), which can contribute to quicker drying, they could present better performance. The natural fibre formulations (NW3 and 4 and ZNW3 and 4) showed improved performance on this indicator due to their higher hygroscopic behaviour [27].
As for the mould growth, all solutions presented values of temperature and humidity that would not lead to mould development, although considering a high moisture indoor climate. These results were also verified, case by case, using the WUFI Bio postprocessor.
In Lisbon (NW), the aerogel-based renders share a similar behaviour with a higher baseline than the industrial thermal render (NW5). However, when the influence of the WDR is accounted for, the industrial thermal render (NW5) starts to show an increasing water accumulation, surpassing the aerogel-based thermal renders (NW1 to NW4 and ZNW1 to ZNW4). During most of the rainy season, for the North façade, all renders showed similar behaviours. In Lisbon, the higher number of days with solar radiation has a considerable influence on the solutions’ drying [86]. From October to April, there is an increase in the water content, then drying until reaching the minimum water content in August.
For Zurich, all the aerogel-containing renders (NW1 to 4 and ZNW1 to 4) maintained similar behaviours throughout the year, being able to dry from one year to the next. The industrial thermal render (ZNW5) that was presenting good performance in Lisbon started to show signs of not being able to dry during the year. Where in Lisbon the industrial thermal render (NW5) can dry out relatively quickly due to higher solar radiation and a lower moisture presence, in Zurich (ZNW5), this was greatly reduced due to climate characteristics, also seen in the very similar values between the SW and the N façades. The industrial thermal render’s (ZNW5) performance in Zurich seems limited by its higher wf than the aerogel-containing renders (ZNW1 to 4).
In both Lisbon and Zurich, it can be seen the influence that the more exposed façade to the WDR has on the solutions. However, the ratio w/wf was less than 30%, indicating negligible risk of frost damage. In both locations, the natural fibre-containing renders (TR sisal—NW3 and ZNW3—and TR biomass—NW4 and ZNW4) showed less water content year-round than the reference, once again certainly linked to their lower μ. The TR aramid renders (NW2 and ZNW2) with slightly higher μ and decreased porosity showed marginally lower performance than the TR reference (NW1 and ZNW1).
As can be seen, the maximum temperatures present in Lisbon are approximately 10 °C higher than in Zurich, as expected. Those higher temperatures can generate durability issues due to the materials’ expansion and retraction [88,108]. In terms of drying, it is once again understood why in Lisbon, the solutions present a quicker drying process: the overall rainfall quantity is lower, and the temperatures are higher. Here, the coating system also limits the overall performance, since it is the same in all solutions.
As for the temperature gradients inside the thermal insulating material, in both places they are between 4 and 7 °C, indicating that the majority of times they are below those values, which are not very significant [109]. With the solutions containing XPS (NW7 and ZNW7) showing a lower gradient, this behaviour is potentially linked with a marked difference in this material’s thermal diffusivity.
As expected, it is seen that the risk of surface condensation significantly increases in Zurich. This fact is related to the most demanding outdoor climatic conditions in Zurich and increased thermal insulation thicknesses. The higher thermal insulation needs lead to less heat migrating to the exterior surface, which increases the solutions’ condensation potential [110].
When all solutions are compared, in Lisbon, the North façade is the one with the highest risk of exterior surface condensation, but in Zurich, the behaviours are similar between the SW and the N façades, and both are higher than Lisbon. The aerogel-containing solutions (NW1 to 4 and ZNW1 to 4) showed similar behaviours to the other materials, whereas the TR biomass solutions (NW4 and ZNW4) showed a slightly better performance. The industrial thermal renders (NW5 and ZNW5) showed lower values, which can be related to higher water content and lower thermal insulation, letting indoor heat pass and heat the exterior surface.
The climatic conditions differ between Lisbon (SW different from N) and Zurich (SW similar to N). In Lisbon’s SW façade, due to the high number of non-raining days and solar radiation, there are a substantial number of months where the average thermal transmittance is below the initial values (20 °C and 80% RH conditions). For the north façade, due to the sun’s low influence (without direct solar radiation), the values are maintained above the initial conditions, with the values increasing in late summer due to inversion, as previously seen. The industrial thermal renders (NW5 and ZNW5), due to their higher water absorption, have more months with lower performance (above 1.0) than the aerogel-containing renders (NW1 to 4 and ZNW1 to 4).
In Zurich, the differences between the SW and the N façades are much smaller, with all solutions lowering their thermal transmittance performances. Here, the most significant increase was related to the industrial thermal render (ZNW5), due to its higher water content, which influences its thermal conductivity and increases the solution’s overall thermal transmittance.
Although all solutions were analysed for their 4th to 5th year, it should be noted that solutions ZNW5 (industrial thermal render), ZNW6 (EPS), and ZNW7 (XPS) in the subsequent years would start to exhibit lower performance due to water content accumulation. Therefore, from all solutions, the ones that could maintain better performance throughout the year were the ones containing aerogel and fibres: TR aramid (NW2 and ZNW2), TR sisal (NW3 and ZNW3), and TR biomass (NW4 and ZNW4).
Finally, for the solutions’ heat loss, it can be seen that the aerogel-containing solutions (NW1 to 4 and ZNW1 to 4), although presenting a higher initial hygroscopicity, can contribute to higher energy savings than the other solutions containing industrial thermal render (NW5 and ZNW5), EPS (NW6 and ZNW6), and XPS (NW7 and ZNW7). This is more noticeable in Zurich than in Lisbon since, as could be seen in this analysis, the climate has a significant impact on the type of materials to be chosen and applied. This can be related to the fact that although EPS (NW6 and ZNW6) and XPS (NW7 and ZNW7) do not present significant hygroscopicity, from 80% RH on, they start to suffer the impact of moisture [44]. Therefore, when applied in a climate where moisture is always present, it impairs their performance since when moisture enters the solution, due to their very low water vapour permeability [43,44] it is retained due to the low number of drying hours in Zurich. The industrial thermal render (NW5 and ZNW5), even with an 8 cm thickness (the maximum allowed by the manufacturer), did not comply with Zurich’s legal requirements.
The aerogel and fibre-containing renders (NW2 to 4 and ZNW2 to 4) showed good performances in both climates. The TR sisal (NW3) showed better performance than the TR reference (NW1) (less 3% of kWh), the industrial thermal render (NW5) (less 10%), and EPS (NW6) (less 5%) in Lisbon, being only surpassed by XPS (NW7) (more 5%); however, this latter solution tends to accumulate water during the service life, significantly decreasing its performance over time.
For Zurich, considering the SW orientation, the best solutions were the aerogel-based fibre-containing formulations (ZNW2 to 4), with the TR aramid (ZNW2) presenting the best performance (less than 4% kWh of the TR reference (ZNW1) and less than 9% of the XPS (ZNW7)). When considering the N orientation, the TR sisal (ZNW3) showed less than 3% of the TR reference (ZNW1) and less than 4% of the XPS (ZNW7). Where in Zurich industrial thermal render (ZNW5), EPS (ZNW6), and XPS (ZNW7) tend to degrade their performances due to an increase in water content. The difference in the industrial thermal render (ZNW5) is related to its being considered the same construction solution for all cases, but due to its higher thermal conductivity and maximum acceptable application thickness (0.08 m), it could not perform adequately.
Therefore, these aerogels and fibre-containing renders’ hygrothermal properties could be evaluated against other currently used materials and showed potential to be applied while excelling in more demanding climates with a higher presence of rain and moisture, such as Zurich.

3.4.2. Wall Retrofit over the Exterior Surface (RE)

The presence of a superficial acrylic paint with two layers was considered for the existing reference wall (RE1) (see composition in the Supplementary Data), reducing the WDR water absorption (by 20% due to the usual low maintenance) while increasing the water vapour diffusion-equivalent air layer thickness (sd = 0.56 m) [111]. This layer was considered to be removed when the new exterior multilayer coating systems were applied. Here, the defects were considered to be 1% of the WDR in the exterior mortar, even for the new systems.
In Table 8, it can be seen that the introduction of these thermal insulation systems drastically reduced the total water content, improving the integrity and durability of the construction. The reference solution (RE1), as well as the aerogel-based renders (RE2 to 5), quickly showed dynamic equilibrium. However, the solutions with EPS (RE7) and XPS (RE8) showed a limited capability of drying, while the solutions with TR sisal (RE4) and TR biomass (RE5) showed quicker drying. This, as previously seen, can be related to the water vapour permeability shown by these materials (lower in the EPS-RE7- and XPS-RE8-solutions) [43], associated with the high μ of the coating system, slowing their drying process. The solutions that reached a quasi-steady state took around 3 years.
Due to the low thermal insulation performance, it can be seen in Table 8 that the existing reference wall (RE1) showed a significant probability for mould to develop, but when the thermal insulation solutions were applied, that probability became negligible, being similar for all solutions. This shows the importance of adequate thermal insulation for improving indoor air quality.
The results are shown in Table 8, which also shows that the whole solution absorbed less water when the thermal insulation systems were used. This could be because the coating system is better at keeping liquid water from getting in, which lowers the water content. The TR sisal (RE4) and TR biomass (RE5) formulations were able to maintain lower water contents for SW and N orientations. The increase in total water content (ratio < 20%) when compared with the new wall solution for Lisbon can be related to the high water absorption properties presented by the existing mortar and fired clay hollow brick. If at the same time, the high of the coating system is considered, it can be explained that the rise in water content is due to the water vapour’s difficulty exiting and, therefore, does not contribute to the solutions’ drying.
The inclusion of the thermal insulating systems led to an increase in the exterior surface temperature over the reference (RE1). This seems linked to the coating system present in all solutions and the presence of the thermal insulators behind it that do not disperse heat as efficiently as other materials with higher thermal conductivity. The same type of behaviour was seen in the temperature gradient inside the thermal insulating materials, where all solutions presented similar performances.
When the thermal insulating systems were applied to the old walls, the risk of surface condensation was drastically reduced. The only situation worse than the reference (RE1) was related to the number of hours, over a year, with 100% RH. This fact can be associated with the increase in thermal insulation, in which, due to the lower influence of the WDR on the north façade, there was a loss of superficial heating, from indoor losses, which could maintain higher surface temperatures and, therefore, a lower risk of existing 100% RH. Nonetheless, all materials, for the analysis period, showed similar performance.
With the analysis of the thermal insulation loss over the year and the relationship with the heat losses during the winter season, it can be readily seen that all new retrofit solutions presented significant improvements in the building’s thermal insulation efficiency.
These thermal insulation systems could maintain a better thermal performance over the year, with the TR sisal (RE4) showing a more equilibrated performance on both façades. The EPS (RE7) and XPS (RE8) tend to degrade their performance over the years due to their difficulty to dry. The industrial thermal render (RE6) solution, in this case, showed similar performance.
Table 8 shows that the inclusion of the thermal insulation systems reduced heat loss by 10 times, drastically increasing energy efficiency. Since EPS (RE7) and XPS (RE8) solutions suffer an increase in their water content, their performance will degrade over time. As for the solutions with lower heat loss, for the SW façade, the TR aramid formulation (RE3) improved over the TR reference (RE2) by around 2%, while for the N façade, TR sisal (RE4) showed a 3% improvement over the TR reference (RE2). TR aramid (RE3) showed the best overall performance (for SW and N façades conjugated), reducing heat loss by 1.5% kWh over TR reference (RE2) and ≈10-fold when compared to the original solution (RE1). With these results, the TRFs once again showed multifunctional application potential.

3.4.3. Wall Retrofit over the Interior Surface (RI)

Another application of thermal insulation on buildings’ façades is usually considered an interior application [101]. In Table 9, it can be seen that in this retrofit scenario, all solutions except the aerogel and fibre-containing renders (RI2 to 5) showed high affinity to keep the water content increases. When compared with the exterior retrofit, all solutions present a higher baseline water content, linked with the reduction of heating of the walls in winter, which limits their drying, as well as the indoor environment presenting a high moisture content [112], also impairing such a drying process.
Only the reference solution (RI1) presented a significant probability for mould development, as previously observed in the exterior retrofit study, where RE1 is the same as RI1 (see Supplementary Data). As in the other retrofit scenario, it took about 3 years for the solutions to reach a quasi-steady state.
Since the thermal insulation in this retrofit scenario was placed on the interior side of the wall, but with a gypsum board protecting it, it can be seen in Table 9 that in this case, the solutions’ behaviour is very similar between the SW and the N façades.
On the SW façade, there is a more significant influence of the solutions’ drying due to higher solar exposure. For the industrial thermal render (RI6), it is seen that it absorbs more water during the winter, although it loses it in the summer, being slower in this process than when applied on the exterior. This fact can be related to the influence that the outer climatic elements have on the drying of this material, and it can also be related to its lower MBV (moisture buffer value), showing more difficulty eliminating moisture in a short time.
However, for the aerogel-fiber-containing renders (RI3–5), there was a higher degree of stability. This could also have something to do with the fact that these aerogel renders had higher MBV values, which can help to keep their performance even throughout the year. In this specific case, the TR biomass formulation (RI5) showed better performance for both façades over the year, closely followed by TR sisal (RI4).
With the interior retrofit, the maximum exterior temperatures were not significantly affected (Table 9), since the exterior surface was similar. Regarding the temperature gradient for the thermal insulating layer, it is almost negligible since the indoor environment has a direct influence over it.
With this retrofit solution, the condensation risk increased significantly (Table 9), as expected. This is related to the indoor heat not being able to heat the exterior surface during the winter months, increasing that risk.
Both EPS (RI7) and XPS (RI8) solutions showed worse performance, not only for accumulating water but also by seeing their thermal performance degrade over time, probably related to their low water vapour permeability that impairs their drying.
Due to the much lower drying influence of the solar radiation in these solutions, they tended to present higher thermal transmittance values (Table 9) than their respective reference values over the year. Once again, the thermal inversion influence during the summer can be verified. Here, the TR sisal formulation (RI5) showed the best overall performance.
In Table 9, it can be seen the potential heat losses, per m2, during the winter season for all solutions. As in the exterior retrofit scenario, all solutions decreased the heat losses over the reference wall (RI1) by almost 10 times. Once again, solutions EPS (RI7) and XPS (RI8) accumulate water, with their performance further decreasing over time. The other solutions show that the TR aramid (RI3) applied in the SW façade lowers the heat losses by almost 20% over the TR reference (RI2), while for the N façade, the best performance is from the TR sisal formulation (RI4), with less than 4% of the heat losses of the TR reference formulation (RI2).
When considering the overall performance (SW and N façades), the TR aramid (RI3) shows less than 8% heat loss compared to the TR reference (RI2). In this case, since the thermal insulation is inside, it seems that the higher moisture affinity of the natural fibre-containing solutions had some influence on their overall performance, as already described in other research works [9]. Additionally, in this case, the aerogel-based fibre-containing formulations (RI3–5) showed better performance, confirming, once again, their multi-functionality.

4. Critical Analysis of the Results

4.1. Thermophysical Properties of the Materials

When considering the thermal properties, the fibres’ incorporation, due to their higher thermal conductivities and reduction of aerogel quantity, increased the overall thermal conductivity in the dry state, but by less than 7% relative to the reference, and still below EPS (λ10°C ≈ 0.036 W m−1 K−1 [61]) or thermal renders with EPS (λ10°C ≈ 0.050 W m−1 K−1 [62]). This was an interesting aspect since the incorporation of fibres in cement-based composites is usually linked with lowering thermal conductivity [113]. In this case, as the silica aerogel has a low thermal conductivity, such behaviour was not verified. However, the formulations with fibres could lower the water saturation, contributing to lower thermal conductivity (at least by 7%) in the presence of moisture. This fact was attributed to the presence of air pockets trapped in the pore structure and to the capillaries’ interruption due to the fibres’ presence, seen in [27], which impaired water progression. Here, the TR aramid showed less water absorption and could maintain a more stable thermal conductivity increase. As for thermal inertia and penetration depth, significant differences between the distinct formulations were not found.
For the moisture storage, it seems that the fibres did not significantly influence the TR reference’s hygroscopic behaviour. As seen through the dynamic vapour sorption (DVS) results [27], the paste already presented considerable influence in the hygroscopic range; therefore, the similar behaviour between all the formulations seems related to the paste. However, when tested in the over-hygroscopic range, it started to show differences, with less water absorbed by the fibre-containing formulations, either by reduction of capillaries or reduction of pores linked to the exterior [65,68]. Additionally, the water vapour permeability increased with the use of natural fibres.
Here, it was also found that the fibres’ inclusion led to a lower liquid transport coefficient for suction (Dws), since its calculation is dependent on the Aw coefficient. As seen in [27], the fibres’ use led to a significant reduction of the capillary water absorption coefficient (Aw), therefore the difference between the Dws parameters between the reference (TR reference) and the fibre-containing formulations was already expected, representing better behaviour as a construction material.
Finally, for the analysis of moisture buffering properties, it was seen that when only considering the TRFs, the TR aramid formulation showed a slightly lower performance but still presented higher capabilities than the studied industrial thermal render. Nonetheless, the TR sisal and TR biomass showed very promising performances. When a gypsum board was placed in front of these materials, the total moisture-absorbing capability was reduced to half, with all the aerogel-based formulations presenting similar behaviours. When the application of a commercial multilayer coating system was considered, the maximum moisture absorbing capability for all thermal insulating materials was reduced almost ten times due to its intrinsic properties [25].
With this experimental campaign, it was seen that the most significant influence of the fibres’ use was related to the reduction of capillary water absorption, either by reducing capillary paths or by changing the render’s pore structure [27]. This factor greatly influenced the thermal conductivity of the fibre-containing formulation, since less water uptake led to overall lower thermal conductivities.

4.2. Hygrothermal Simulation Performance

In this study, several scenarios were studied, from new walls placed in different climates (Lisbon and Zurich) to thermal insulation retrofit scenarios on the exterior and interior. From the results, it could be seen that the climate and the legal requirements should dictate the choice of the materials since their hygrothermal behaviour influences the performance of the construction solutions where they are applied.
For the new wall solution, in both Lisbon and Zurich, the TRFs presented better performance than the other solutions (industrial thermal render with EPS granules, EPS, and XPS). The best performance was attained by the natural fibres (TR sisal and TR biomass), as it seems that their higher water vapour permeability conjugated with their low capillary water absorption contributed to a quicker drying of the respective solutions.
In the exterior thermal insulation retrofit scenario, the TR sisal and TR biomass formulations continued to present better performance than the other solutions (industrial thermal render, EPS, and XPS). This continued in the same line as in the new wall scenario; however, EPS and XPS solutions showed higher water contents, probably related to the constructive solution’s differences. Nonetheless, these innovative TRFs showed their multifunctionality potential, presenting better performances than the other solutions, and even better than the TR reference formulation, achieving dynamic equilibrium more quickly.
When the interior thermal insulation retrofit scenario was considered, although the fibre-containing formulations (TR aramid, TR sisal, and TR biomass) continued to show better performance, the best formulation of all was the TR aramid. This can be related to this fibre’s lower moisture affinity (as seen in the DVS analysis in [27]) in an indoor environment, where the solutions have more difficulties drying due to the presence of the gypsum board. Nonetheless, the TR sisal could present some reliable performance. In this type of solution, since the indoor temperature is higher than the outdoor temperature (during Winter), moisture is transferred from the inside to the outside. Therefore, the materials’ water-vapor permeability has a significant influence on the behaviour of the whole constructive system, contributing to or not increasing its water content. With indoor thermal insulation, the wall becomes in contact with the cold environment outside (during winter), lowering the constructive system’s temperature, which significantly increased the risk of surface condensation [114].
As expected, the application of thermal insulation on the exterior side of the walls presented more advantages than on the inside [34,88,90]: reduction of global heat losses and energy consumption; a higher temperature of the wall, improving drying and lowering condensation risk; reduction of thermal bridges; more mass in contact with the interior, contributing to better indoor temperature regulation.
Another aspect that must be considered is that the protective coating system significantly limits the water vapour permeability of the solutions [25], lowering it by more than 90%. Nonetheless, due to the higher water vapour permeability of the TR sisal and TR biomass when compared with, for example, EPS or XPS, they contribute to a higher overall water vapour permeability of the multilayer coating systems, improving their drying capabilities.

4.3. Study Considerations

Nonetheless, for all the simulations made, several limiting factors should be considered:
  • The hygrothermal simulations of Lisbon and Zurich, which were based on this analysis, were run with validated files made available by the WUFI software. However, those files represent one year (1998) of hourly data for several climatic parameters. This is one important factor to consider, as in different years the conditions can be quite different, which can impact the performance of constructive solutions;
  • It is currently known that climate change is happening [115]. This can further impact the performance of constructive solutions since climate variations can lead to more moisture and rainfall, influencing the solutions’ performance and needs. This fact can also be limited by microclimatic phenomena, which should be considered when evaluating the applicability of any given material [116];
  • Another aspect that was not considered, even in the simulations, was the presence of rising damp and salts in buildings, which is one of the significant building defects verified in Portugal [117]. Although this factor was not considered, it should be accounted for, mainly in retrofit scenarios, since it can lead to several anomalies;
  • The indoor occupancy can also greatly influence the overall performance (users’ occupancy 100% of the time vs. 40%, for example), as well as the type of use (e.g., kitchen vs. bedroom);
  • As these simulations represented broad application scenarios, each singular case should be analysed, since the geographic location, utilisation conditions, used materials, and climate, among other factors, will influence the obtained results.

5. Conclusions

In this study, the influence of a synthetic fibre (TR aramid) and two natural fibres (TR sisal and TR biomass) on the hygrothermal properties of an aerogel-based thermal render (TR reference—without fibers) was evaluated. For hygrothermal evaluation, the water content with time and its effect on the thermal insulation of the solution were the primary considerations. Both of these factors affected a number of other variables. Moreover, the behaviour of these renders was evaluated when applied in new construction and retrofit scenarios under different conditions compared with other current thermal insulating solutions. From the gathered results and respective analyses, it is possible to draw the following conclusions:
  • Although low amounts of fibres were used (0.5% (vol./vol.) for the TR aramid and 0.1% (vol./vol.) for the TR sisal and TR biomass), they significantly improved the hygrothermal properties over the TR reference.
  • These aerogel and fibre-containing formulations showed adequate moisture buffering potential; therefore, their future use indoors can be considered as presenting an air moisture regulation capacity, contributing to their application multifunctionality;
  • The aerogel and fibre-containing formulations, especially the ones containing natural fibres (TR sisal and TR biomass), showed the most balanced hygrothermal performance of all the studied solutions, either in quickly attaining dynamic equilibrium or dealing with moisture throughout the year. However, depending on the application scenario, the choice of materials must be a careful process. Nonetheless, these aerogel-based thermal renders showed that they could be applied in several distinct geographical and climatic conditions while maintaining good hygrothermal performance;
  • In new construction, the aerogel and fibre-containing solutions presented better characteristics than the other studied solutions (industrial thermal render, EPS, and XPS), mainly due to lower capillary water absorption and higher water vapour permeability. Moreover, when a colder and moister climate was chosen (Zurich), these TRFs excelled over the other solutions, since after two years they showed dynamic equilibrium, whereas other solutions (e.g., with EPS and XPS) did not, showing their application potential;
  • It was found that the used finishing coating (with an acrylic base) and basecoat have a big effect on the multilayer systems that were looked at. Other materials might have different effects. Although such a protective coating reduced the liquid water penetration from the outside, it also presented low water vapour permeability, hindering the elimination of water that penetrated the interior layers; therefore, they usually contributed to the increase in the solutions’ interior water content;
  • In a retrofit scenario, it was seen that the exterior application of the thermal insulation is more effective in reducing energy losses than the interior application. Additionally, in both cases (interior and exterior retrofit), the aerogel and fibre-containing solutions (TR aramid, TR sisal, and TR biomass) presented better performances than the other solutions. In addition, when applied to the interior retrofit, those renderings can improve the indoor environment due to their moisture buffering capabilities;
As it has been seen, the incorporation of fibres (aramid, sisal, and biomass) in the aerogel-based formulation of thermal render has shown improvements over the reference physical properties, which led to an improvement in their hygrothermal performance. With such findings, it can be attributed to some multifunctionality in these formulations, since they can show benefits for different uses and applications while also contributing to energy savings in buildings when compared with other solutions, with a reduction of heat transfer of more than 20%.
In future research, these formulations should be studied in terms of their environmental impacts and how their demonstrated capabilities of saving energy consumption would influence the overall performance over the life cycle of a building. These formulations could also benefit from their simulation with FEM models and, above all, be applied in situ to validate the results of these simulations. Climate change scenarios and occupancy internal rates could also be investigated.

Supplementary Materials

The following supporting information can be downloaded at: https://www.mdpi.com/article/10.3390/en16073048/s1, Table S1. Thermal insulation materials’ properties. Table S2. Properties of other materials used in the simulations. Table S3. New wall solutions for Lisbon (NW). Table S4. New wall solutions for Zurich (ZNW). Table S5. Retrofit solutions are applied on the wall’s external surface (RE). Table S6. Retrofit solutions are applied on the wall’s internal surface (RI). Figure S1. Flowchart of the conducted hygrothermal simulations. Figure S2. Total water content and drying rates for Lisbon (NW) and Zurich (ZNW). Figure S3. Isopleth example for the ZNW1 solution. Figure S4. Ratio of water content to wf for the renders. Figure S5. Temperatures were verified for the different solutions. Figure S6. Superficial condensation potential. Figure S7. Thermal insulation losses over the reference performance during the year. Figure S8. Heat loss during the winter per square metre of wall. Figure S9. Total water content and drying rates of the solutions (RE scenario). Figure S10. Mould growth potential. Figure S11. Ratio of water content to wf for the renders. Figure S12. Temperatures were verified in the simulation. Figure S13. Conditions for the formation of superficial condensation. Figure S14. Thermal insulation loss over the year. Figure S15. Heat loss during the winter, per square metre of wall. Figure S16. Total water content and drying potential rate. Figure S17. Ratio of water content to wf for the renders. Figure S18. Temperatures were verified in the simulation. Figure S19. Verification of the conditions for the formation of superficial condensation. Figure S20. Thermal insulation loss over the year. Figure S21. Heat loss during the winter, per square metre of wall.

Author Contributions

M.P.: Conceptualization, Methodology, Investigation, Writing—original draft. M.d.G.G.: Supervision, Writing—review and editing. J.D.S.: Supervision, Writing—review and editing. A.H.: Writing—review and editing. I.F.-C.: Supervision, Writing—review and editing. All authors have read and agreed to the published version of the manuscript.

Funding

This research was funded by Fundação para a Ciência e a Tecnologia (F.C.T.), Ph.D. grant SFRH/BD/132239/2017, and CERIS Research Unit (UIDB/04625/2020).

Acknowledgments

The authors wish to acknowledge Saint-Gobain Weber Portugal for making available the aerogel-based thermal render used in this study. The authors gratefully acknowledge the support of the CERIS Research Centre (UIDB/04625/2020), IST—University of Lisbon, and the FCT—Foundation for Science and Technology. The first author also wants to thank FCT for the Ph.D. grant SFRH/BD/132239/2017.

Conflicts of Interest

The authors declare no conflict of interest.

Abbreviations

RHRelative humidity
TRThermal render
TR aramidAerogel-based render with 0.5% (volume) of aramid fibre
TR biomassAerogel-based render with 0.1% (volume) of biomass fibre
TR referenceAerogel-based render without fibres
TR sisalAerogel-based render with 0.1% (volume) of sisal fibre
TRFAerogel-based fibre-enhanced thermal renders with either aramid or biomass or sisal
WDRwind-driven rain

References

  1. Berardi, U. A cross-country comparison of the building energy consumptions and their trends. Resour. Conserv. Recycl. 2017, 123, 230–241. [Google Scholar] [CrossRef]
  2. Marwan, M. The effect of wall material on energy cost reduction in building. Case Stud. Therm. Eng. 2020, 17, 100573. [Google Scholar] [CrossRef]
  3. Berardi, U. Aerogel-enhanced systems for building energy retrofits: Insights from a case study. Energy Build. 2018, 159, 370–381. [Google Scholar] [CrossRef]
  4. Fenoglio, E.; Fantucci, S.; Serra, V.; Carbonaro, C.; Pollo, R. Hygrothermal and environmental performance of a perlite-based insulating plaster for the energy retrofit of buildings. Energy Build. 2018, 179, 26–38. [Google Scholar] [CrossRef]
  5. Bui, R.; Labat, M.; Lorente, S. Impact of the occupancy scenario on the hygrothermal performance of a room. Build. Environ. 2019, 160, 106178. [Google Scholar] [CrossRef] [Green Version]
  6. Reuge, N.; Collet, F.; Pretot, S.; Moisette, S.; Bart, M.; Style, O.; Shea, A.; Lanos, C. Hygrothermal effects and moisture kinetics in a bio-based multi-layered wall: Experimental and numerical studies. Constr. Build. Mater. 2019, 240, 117928. [Google Scholar] [CrossRef]
  7. Buratti, C.; Belloni, E.; Merli, F. Water vapour permeability of innovative building materials from different waste. Mater. Lett. 2020, 265, 127459. [Google Scholar] [CrossRef]
  8. Zhang, H.; Yoshino, H.; Hasegawa, K. Assessing the moisture buffering performance of hygroscopic material by using experimental method. Build. Environ. 2012, 48, 27–34. [Google Scholar] [CrossRef]
  9. Latif, E.; Lawrence, M.; Shea, A.; Walker, P. Moisture buffer potential of experimental wall assemblies incorporating formulated hemp-lime. Build. Environ. 2015, 93, 199–209. [Google Scholar] [CrossRef] [Green Version]
  10. CEN EN 15026; Hygrothermal Performance of Building Components and Building Elements—Assessment of Moisture Transfer by Numerical Simulation. Comité Européen de Normalisation: Brussels, Belgium, 2007.
  11. Fantucci, S.; Fenoglio, E.; Serra, V.; Perino, M.; Dutto, M.; Marino, V. Hygrothermal Characterization of High-Performance Aerogel-Based Internal Plaster. In Sustainability in Energy and Buildings. Smart Innovation, Systems and Technologies, 1st ed.; Littlewood, J., Howlett, R., Capozzoli, A., Jain, L., Eds.; Springer: Singapore, 2020; pp. 259–268. [Google Scholar] [CrossRef]
  12. European Commission. HOMES Key INsulating Material-HOMESKIN. 2019. Available online: http://cordis.europa.eu/project/rcn/193413_en.html (accessed on 27 December 2019).
  13. Hipin, Hipin Project—High Performance Insulation Based on Nanostructure Encapsulation of Air. 2019. Available online: http://www.hipin.eu/ (accessed on 29 December 2019).
  14. Baetens, R.; Jelle, B.P.; Gustavsen, A. Aerogel insulation for building applications: A state-of-the-art review. Energy Build. 2010, 43, 761–769. [Google Scholar] [CrossRef] [Green Version]
  15. Westgate, P.; Paine, K.; Ball, R.J. Physical and mechanical properties of plasters incorporating aerogel granules and polypropylene monofilament fibres. Constr. Build. Mater. 2018, 158, 472–480. [Google Scholar] [CrossRef] [Green Version]
  16. Vajtai, R. (Ed.) Springer Handbook of Nanomaterials; Springer: Berlin/Heidelberg, Germany, 2013. [Google Scholar] [CrossRef]
  17. de Fátima Júlio, M.; Soares, A.; Ilharco, L.M.; Flores-Colen, I.; de Brito, J. Aerogel-based renders with lightweight aggregates: Correlation between molecular/pore structure and performance. Constr. Build. Mater. 2016, 124, 485–495. [Google Scholar] [CrossRef]
  18. Ebert, H.-P. Thermal Properties of Aerogels. In Aerogels Handb, 1st ed.; Aegerter, M., Leventis, N., Koebel, M.M., Eds.; Springer: New York, NY, USA, 2011; pp. 537–564. [Google Scholar] [CrossRef]
  19. Aegerter, M.A.; Leventis, N.; Koebel, M.M. (Eds.) Aerogels Handbook; Springer: New York, NY, USA, 2011. [Google Scholar] [CrossRef]
  20. Garrido, R.; Silvestre, J.D.; Flores-Colen, I.; de Fátima Júlio, M.; Pedroso, M. Economic assessment of the production of subcritically dried silica-based aerogels. J. Non-Cryst. Solids 2019, 516, 26–34. [Google Scholar] [CrossRef]
  21. Stahl, T.; Brunner, S.; Zimmermann, M.; Wakili, K.G. Thermo-hygric properties of a newly developed aerogel based insulation rendering for both exterior and interior applications. Energy Build. 2012, 44, 114–117. [Google Scholar] [CrossRef]
  22. Fantucci, S.; Fenoglio, E.; Grosso, G.; Serra, V.; Perino, M.; Marino, V.; Dutto, M. Development of an aerogel-based thermal coating for the energy retrofit and the prevention of condensation risk in existing buildings. Sci. Technol. Built Environ. 2019, 25, 1178–1186. [Google Scholar] [CrossRef] [Green Version]
  23. Pedroso, M.; Flores-Colen, I.; Silvestre, J.D.; Gomes, M.G.; Silva, L.; Ilharco, L. Physical, mechanical, and microstructural characterisation of an innovative thermal insulating render incorporating silica aerogel. Energy Build. Energy Build. 2020, 211, 109793. [Google Scholar] [CrossRef]
  24. Pedroso, M.; Flores-Colen, I.; Silvestre, J.D.; da Glória Gomes, M. Nanomaterials’ Influence on the Performance of Thermal Insulating Mortars—A Statistical Analysis. Appl. Sci. 2020, 10, 2219. [Google Scholar] [CrossRef] [Green Version]
  25. Pedroso, M.; Flores-Colen, I.; Silvestre, J.D.; Gomes, M.G.; Silva, L.; Sequeira, P.; de Brito, J. Characterisation of a multilayer external wall thermal insulation system. Application in a Mediterranean climate. J. Build. Eng. 2020, 30, 101265. [Google Scholar] [CrossRef]
  26. Dams, B.; Amornrattanasereegul, N.; Shepherd, P.; Ball, R.J. Cement-fibre composites for additive building manufacturing. In 39th Cement and Concrete Science Conference; Ball, R.J., Dams, B., Ferrandiz-Mas, V., Ke, X., Paine, K., Tyrer, M., Walker, P., Eds.; University of Bath: Bath, UK, 2019; pp. 14–18. [Google Scholar]
  27. Pedroso, M. Eco-Efficient and Multifunctional Thermal Renders Based on Silica Aerogel and Fibres. Ph.D. Thesis, University of Lisbon, Lisbon, Portugal, 2021. [Google Scholar]
  28. Stahl, T.; Wakili, K.G.; Hartmeier, S.; Franov, E.; Niederberger, W.; Zimmermann, M. Temperature and moisture evolution beneath an aerogel based rendering applied to a historic building. J. Build. Eng. 2017, 12, 140–146. [Google Scholar] [CrossRef]
  29. Nosrati, R.H.; Berardi, U. Hygrothermal characteristics of aerogel-enhanced insulating materials under different humidity and temperature conditions. Energy Build. 2018, 158, 698–711. [Google Scholar] [CrossRef]
  30. CEN EN 998-1: 2010; Specification for Mortar for Masonry–Part 1: Rendering and Plastering Mortar. Comité Européen de Normalisation: Brussels, Belgium, 2010.
  31. Enersens, Product Data Sheet: Aerogel Kwark. 2019. Available online: http://enersens.fr/en/home/ (accessed on 7 January 2020).
  32. Applied Precision Ltd. Isomet 2114 Thermal Properties Analyzer User’s Guide; Version 120712; Applied Precision Ltd.: Bratislava, Slovakia, 2019. [Google Scholar]
  33. Barclay, M.; Holcroft, N.; Shea, A.D. Methods to determine whole building hygrothermal performance of hemp–lime buildings. Build. Environ. 2014, 80, 204–212. [Google Scholar] [CrossRef] [Green Version]
  34. Fraunhofer-IBP. WUFI Pro 5.0; Fraunhofer-IBP: Holzhirchen, Germany, 2009. [Google Scholar]
  35. Kehrer, M. Determination of Material Properties for Hygrothermal Calculation with WUFI; Munich, Germany, 2019. Available online: https://wufi.de/img_wufiforum/WUFI-Materialmessung_EN.pdf (accessed on 12 March 2023).
  36. Ansell, M.P.; Ball, R.J.; Lawrence, M.; Maskell, D.; Shea, A.; Walker, P. Green composites for the built environment. In Green Composites; Elsevier: Amsterdam, The Netherlands, 2017; pp. 123–148. [Google Scholar] [CrossRef]
  37. ASTM D5334-14; Standard Test Method for Determination of Thermal Conductivity of Soil and Soft Rock by Thermal Needle Probe Procedure, USA. American Society for Testing and Materials: West Conshohocken, PA, USA, 2014. [CrossRef]
  38. ASTM D5930-17; Standard Test Method for Thermal Conductivity of Plastics by Means of a Transient Line-Source Technique, USA. American Society for Testing and Materials: West Conshohocken, PA, USA, 2009.
  39. ISO/TC 61/SC 5, ISO 22007-2: 2015; Plastics—Determination of Thermal Conductivity and Thermal Diffusivity—Part 2: Transient Plane Heat Source (Hot Disc) Method. ISO: Geneva, Switzerland, 2015.
  40. Gomes, M.G.; Flores-Colen, I.; Manga, L.M.; Soares, A.; de Brito, J. The influence of moisture content on the thermal conductivity of external thermal mortars. Constr. Build. Mater. 2017, 135, 279–286. [Google Scholar] [CrossRef]
  41. Gomes, M.G.; Flores-Colen, I.; da Silva, F.; Pedroso, M. Thermal conductivity measurement of thermal insulating mortars with EPS and silica aerogel by steady-state and transient methods. Constr. Build. Mater. 2018, 172, 696–705. [Google Scholar] [CrossRef]
  42. ISO/TC 163/SC 2, ISO 10456: 2007; Building Materials and Products—Hygrothermal Properties—Tabulated Design Values and Procedures for Determining Declared and Design Thermal Values. ISO: Geneva, Switzerland, 2007.
  43. Ducoulombier, L.; Lafhaj, Z. Comparative study of hygrothermal properties of five thermal insulation materials. Case Stud. Therm. Eng. 2017, 10, 628–640. [Google Scholar] [CrossRef]
  44. Palumbo, M.; Lacasta, A.M.; Giraldo, M.P.; Haurie, L.; Correal, E. Bio-based insulation materials and their hygrothermal performance in a building envelope system (ETICS). Energy Build. 2018, 174, 147–155. [Google Scholar] [CrossRef] [Green Version]
  45. CEN EN ISO 12571; Hygrothermal Performance of Building Materials and Products—Determination of Hygroscopic Sorption Properties. Comité Européen de Normalisation: Brussels, Belgium, 2013.
  46. CEN EN ISO 12570:2000+A1; Hygrothermal Performance of Building Materials and Products–Determination of Moisture Content by Drying at Elevated Temperature. Comité Européen de Normalisation: Brussels, Belgium, 2013.
  47. Dhakal, U.; Berardi, U.; Gorgolewski, M.; Richman, R. Hygrothermal performance of hempcrete for Ontario (Canada) buildings. J. Clean. Prod. 2017, 142, 3655–3664. [Google Scholar] [CrossRef]
  48. Evrard, A.; De Herde, A. Hygrothermal Performance of Lime-Hemp Wall Assemblies. J. Build. Phys. 2010, 34, 5–25. [Google Scholar] [CrossRef]
  49. Mensinga, P. Determining the Critical Degree of Saturation of Brick Using Frost Dilatometry. Master’s thesis, University of Waterloo, Waterloo, ON, Canada, 2009. [Google Scholar]
  50. Abadie, M.O.; Mendonça, K.C. Moisture performance of building materials: From material characterization to building simulation using the Moisture Buffer Value concept. Build. Environ. 2009, 44, 388–401. [Google Scholar] [CrossRef]
  51. CEN EN 1015-18; Methods of test for mortar for masonry—Part 18: Determination of Water Absorption Coefficient Due to Capillary Action of Hardened Mortar. Comité Européen de Normalisation: Brussels, Belgium, 2002.
  52. Krus, M. Moisture transport and storage coefficients of porous mineral building materials. In Theoretical Principles and New Test Methods; IRB-Verlag Stuttgart: Stuttgart, Germany, 1996. [Google Scholar]
  53. de Freitas, V.P.; Krus, M.; Kunzel, H.; Quenard, D. Determination of the water diffusivity of porous materials by gamma-ray attenuations and nmr. In Proceedings of the International Symposium On Moisture Problems In Building Walls, Porto, Portugal, 11–13 September 1995; pp. 445–460. [Google Scholar]
  54. Krus, M.; Holm, A. Simple methods to approximate the liquid transport coefficients describing the absorption and drying process. In Proceedings of the Symposium on Building Physics in the Nordic Countries 1999, Göteborg, Sweden, 24–26 August 1999; pp. 241–248. [Google Scholar] [CrossRef]
  55. Maia, J.; Ramos, N.M.M.; Veiga, R. A new durability assessment methodology of thermal mortars applied in multilayer rendering systems. Constr. Build. Mater. 2019, 222, 654–663. [Google Scholar] [CrossRef]
  56. Zhang, M.; Qin, M.; Chen, Z. Moisture Buffer Effect and its Impact on Indoor Environment. Procedia Eng. 2017, 205, 1123–1129. [Google Scholar] [CrossRef] [Green Version]
  57. Rode, C. Moisture Buffering of Building Materials—DTU BYG-Rapporter; No. R-126; Technical University of Denmark: Lyngby, Denmark, 2006. [Google Scholar]
  58. Rode, C.; Peuhkuri, R.; Time, B.; Svennberg, K.; Ojanen, T. Moisture Buffer Value of Building Materials. In Heat-Air-Moisture Transport: Measurements on Building Materials; ASTM International: West Conshohocken, PA, USA, 2009; p. 33-33-12. [Google Scholar] [CrossRef] [Green Version]
  59. Rode, C.; Peuhkuri, R.; Time, B.; Svennberg, K.; Ojanen, T.; Mukhopadhyaya, P.; Kumaran, M.; Dean, S.W. Moisture Buffer Value of Building Materials. J. ASTM Int. 2007, 4, 100369. [Google Scholar] [CrossRef] [Green Version]
  60. Wan, H.; Sun, Z.; Huang, G.; Xu, X.; Yu, J. Calculation of the maximum moisture buffering thickness of building wall layer of hygroscopic material. Build. Environ. 2019, 160, 106173. [Google Scholar] [CrossRef]
  61. Abu-Jdayil, B.; Mourad, A.-H.; Hittini, W.; Hassan, M.; Hameedi, S. Traditional, state-of-the-art and renewable thermal building insulation materials: An overview. Constr. Build. Mater. 2019, 214, 709–735. [Google Scholar] [CrossRef]
  62. Maia, J.F. Durability of Thermal Rendering and Plastering Systems. Ph.D. Thesis, University of Porto, Porto, Portugal, 2019. [Google Scholar]
  63. Guyer, E.; Brownell, D. (Eds.) Handbook of Applied Thermal Design, 1st ed.; Taylor & Francis: Philadelphia, PA, USA, 1999. [Google Scholar]
  64. Pina dos Santos, C.; Matias, L. ITE50—Thermal Transmittance of Building Envelope Elements, 1st ed.; LNEC: Lisbon, Portugal, 2006. (In Portuguese) [Google Scholar]
  65. Broda, J. Application of Polypropylene Fibrillated Fibres for Reinforcement of Concrete and Cement Mortars. In High Performance Concrete Technology and Applications, 1st ed.; Yilmaz, S., Ozmen, H., Eds.; InTechOpen: London, UK, 2016; pp. 189–204. [Google Scholar] [CrossRef] [Green Version]
  66. Kumaran, M.K. Heat, Air, and Moisture Transfer in Insulated Envelope Parts: Final Report; Task 3: Material Properties; National Research Council Canada: Ottawa, ON, Canada, 1996. [Google Scholar]
  67. Mňahončáková, E.; Jiřičková, M.; Pavlík, Z.; Fiala, L.; Rovnaníková, P.; Bayer, P.; Černý, R. Effect of Moisture on the Thermal Conductivity of a Cementitious Composite. Int. J. Thermophys. 2006, 27, 1228–1240. [Google Scholar] [CrossRef] [Green Version]
  68. Richardson, A.E. Freeze/thaw durability in concrete with fibre additions. Struct. Surv. 2003, 21, 225–233. [Google Scholar] [CrossRef]
  69. Filho, R.D.T.; Ghavami, K.; England, G.L.; Scrivener, K. Development of vegetable fibre–mortar composites of improved durability. Cem. Concr. Compos. 2003, 25, 185–196. [Google Scholar] [CrossRef]
  70. Crawford, C.B. Frost durability of clay bricks—Evaluation criteria and quality control. In CBAC/DBR Manufacturers’ Symposium; NRC of Canada: Ottawa, ON, Canada, 1984. [Google Scholar]
  71. Ganobjak, M.; Brunner, S.; Wernery, J. Aerogel materials for heritage buildings: Materials, properties and case studies. J. Cult. Herit. 2020, 42, 81–98. [Google Scholar] [CrossRef]
  72. Ibrahim, M. Improving the Buildings Envelopes Energy Performance Using Aerogel-Based Insulating Mineral Rendering. Ph.D. Thesis, Ecole Nationale Supérieure des Mines de Paris, Paris, Frnace, 2014. [Google Scholar]
  73. Collet, F.; Chamoin, J.; Pretot, S.; Lanos, C. Comparison of the hygric behaviour of three hemp concretes. Energy Build. 2013, 62, 294–303. [Google Scholar] [CrossRef]
  74. Ramos, N.M.M.; Delgado, J.M.P.Q.; de Freitas, V.P. Influence of finishing coatings on hygroscopic moisture buffering in building elements. Constr. Build. Mater. 2010, 24, 2590–2597. [Google Scholar] [CrossRef]
  75. Cerolini, S.; D’Orazio, M.; Di Perna, C.; Stazi, A. Moisture buffering capacity of highly absorbing materials. Energy Build. 2009, 41, 164–168. [Google Scholar] [CrossRef]
  76. Yu, S.; Cui, Y.; Shao, Y.; Han, F. Research on the Comprehensive Performance of Hygroscopic Materials in an Office Building Based on EnergyPlus. Energies 2019, 12, 191. [Google Scholar] [CrossRef] [Green Version]
  77. Wu, Y.; Gong, G.; Yu, C.W.; Huang, Z. Proposing ultimate moisture buffering value (UMBV) for characterization of composite porous mortars. Constr. Build. Mater. 2015, 82, 81–88. [Google Scholar] [CrossRef]
  78. Beck, H.E.; Zimmermann, N.E.; McVicar, T.R.; Vergopolan, N.; Berg, A.; Wood, E.F. Present and future Köppen-Geiger climate classification maps at 1-km resolution. Sci. Data 2018, 5, 180214. [Google Scholar] [CrossRef] [PubMed] [Green Version]
  79. Peel, M.C.; Finlayson, B.L.; McMahon, T.A. Updated world map of the Köppen-Geiger climate classification. Hydrol. Earth Syst. Sci. 2007, 11, 1633–1644. [Google Scholar] [CrossRef] [Green Version]
  80. Koebel, M.M.; Wernery, J.; Malfait, W.J. Energy in buildings—Policy, materials and solutions. MRS Energy Sustain. 2017, 4, E12. [Google Scholar] [CrossRef] [Green Version]
  81. Alves, S.; Ferreira, C.; de Freitas, V.P.; Guimarães, A. Existing Buildings—Improvement Measures of Energy Performance and Indoor Air Quality; 2011. [Google Scholar]
  82. CCE. Energy Rehabilitation Methodology for Buildings Located in Urban Areas—A SAVE II Programme Action; CCE: Amadora, Portugal, 2000. [Google Scholar]
  83. Uidhir, T.M.; Rogan, F.; Collins, M.; Curtis, J.; Gallachóir, B.P.Ó. Improving energy savings from a residential retrofit policy: A new model to inform better retrofit decisions. Energy Build. 2020, 209, 109656. [Google Scholar] [CrossRef]
  84. Yang, J.; Fu, H.; Qin, M. Evaluation of Different Thermal Models in EnergyPlus for Calculating Moisture Effects on Building Energy Consumption in Different Climate Conditions. Procedia Eng. 2015, 121, 1635–1641. [Google Scholar] [CrossRef] [Green Version]
  85. Künzel, H.M. Simultaneous Heat and Moisture Transport in Building Components. In One- and Two-Dimensional Calculation Using Simple Parameters; IRB-Verlag Stuttgart: Stuttgart, Germany, 1995. [Google Scholar]
  86. Künzel, H.M.; Kiessl, K. Calculation of heat and moisture transfer in exposed building components. Int. J. Heat Mass Transf. 1996, 40, 159–167. [Google Scholar] [CrossRef]
  87. Kehrer, M.; Schmidt, T. Radiation effects on exterior surfaces. In Proceedings of the 8th Symposium on Building Physics in the Nordic Countries, Copenhagen, Denmark, 16–18 June 2008; DTU: Copenhagen, Denmark, 2008; pp. 207–212. [Google Scholar]
  88. Barreira, E.; de Freitas, V.P. External Thermal Insulation Composite Systems: Critical Parameters for Surface Hygrothermal Behaviour. Adv. Mater. Sci. Eng. 2014, 2014, 650752. [Google Scholar] [CrossRef] [Green Version]
  89. Mendes, N.; Chhay, M.; Berger, J.; Dutykh, D. Numerical Methods for Diffusion Phenomena in Building Physics: A Practical Introduction; PUCPress: Curitiba, Brazil, 2016. [Google Scholar] [CrossRef]
  90. Barreira, E.; de Freitas, V.P. External Thermal Insulation Composite Systems (ETICS); Springer International Publishing: Cham, Switzerland, 2016. [Google Scholar] [CrossRef]
  91. Delgado, J.M.P.Q.; Barreira, E.; Ramos, N.M.M.; de Freitas, V.P. Inputs for Hygrothermal Simulation Tools. In Hygrothermal Numerical Simulation Tools Applied to Building Physics, 1st ed.; Delgado, J., Barreira, E., Ramos, N.M.M., de Freitas, V.P., Eds.; Springer: Dordrecht, The Netherlands, 2013; pp. 7–20. [Google Scholar] [CrossRef]
  92. ASHRAE ANSI/ASHRAE 55; Thermal Environmental Conditions for Human Occupancy. ANSI/ASHRAE: Peachtree Corners, GA, USA, 2017.
  93. Decree-Law 118/2013; Energy Certification of Buildings (SCE), Regulation of Energy Performance of Residential Buildings (REH) and Regulation of Energy Performance of Buildings Trade and Services (RECS). Diário da República 2013. Volume 159, pp. 4988–5005. (In Portuguese)
  94. Cho, H.M.; Park, J.H.; Wi, S.; Chang, S.J.; Yun, G.Y.; Kim, S. Energy retrofit analysis of cross-laminated timber residential buildings in Seoul, Korea: Insights from a case study of packages. Energy Build. 2019, 202, 109329. [Google Scholar] [CrossRef]
  95. Lee, J.; Wi, S.; Chang, S.J.; Choi, J.; Kim, S. Prediction evaluating of moisture problems in light-weight wood structure: Perspectives on regional climates and building materials. Build. Environ. 2020, 168, 106521. [Google Scholar] [CrossRef]
  96. ASHRAE ANSI/ASHRAE 160-2016; Criteria for Moisture-Control Design Analysis in Buildings (ANSI Approved). ANSI/ASHRAE: Peachtree Corners, GA, USA, 2016.
  97. Park, J.H.; Kang, Y.; Lee, J.; Wi, S.; Chang, J.D.; Kim, S. Analysis of walls of functional gypsum board added with porous material and phase change material to improve hygrothermal performance. Energy Build. 2019, 183, 803–816. [Google Scholar] [CrossRef]
  98. Weber, S.-G. Technical Datasheet: Weberplast Decor Plus; 2019. (In Portuguese) [Google Scholar]
  99. Assembleia da República, Statute 379-A/2015—1st Alteration to Statute 349-B/2013, Presenting the Thermal Insulation Requisites for Buildings; Diário da República: Portugal, 2015; Volume 207. (In Portuguese)
  100. SIA 180; Protection Thermique, Protection Contre L’humidité et Climat Intérieur Dans les Bâtiments. SIA: Zürich, Switzerland, 2014.
  101. de Freitas, V.P. (Ed.) Support Manual for the Rehabilitation Project of Old Buildings, 1st ed.; Ordem dos Engenheiros da Região Norte: Porto, Portugal, 2012. (In Portuguese) [Google Scholar]
  102. Appleton, J. Old Buildings Rehabilitation (In Portuguese), 2nd ed.; Editora ORION: Lisboa, Portugal, 2011. [Google Scholar]
  103. Trechsel, H.R.; Bomberg, M.T. Moisture Control in Buildings: The Key Factor in Mold Prevention, 2nd ed.; ASTM International: Baltimore, MD, USA, 2009. [Google Scholar]
  104. Sedlbauer, K.; Krus, M. A new model for mould prediction and its application in practice. In 2nd International Building Physics Conference; Carmeliet, J., Hens, H., Vermeir, G., Eds.; CRC Press: Leuven, Belgium, 2003; pp. 276–282. [Google Scholar]
  105. Ojanen, T.; Viitanen, H.; Peuhkuri, R. Modelling of Mould Growth in Building Envelopes—Existing Models, Discussion on Improvement Aspects, Sensibility Analysis. In Proceedings of the Annex 41 ST4, Porto, Portugal, 22–24 October 2007. [Google Scholar]
  106. Sedlbauer, K. Prediction of Mould Fungus Formation on the Surface of/and Inside Building Components; Universität Stuttgart: Stuttgart, Germany, 2001. [Google Scholar]
  107. WTA. WTA-Merkblatt E 6-5-12/D: Innendämmung nach WTA II—Nachweis von Innendämmsystemen Mittels Numerischer Berechnungsverfahren, Germany; WTA: London, UK, 2012. [Google Scholar]
  108. Ashby, M.; Jones, D. Engineering Materials: An Introduction to Their Properties and Applications, 2nd ed.; Pergamon Press: Cambridge, UK, 1982. [Google Scholar]
  109. Le, Q.X.; Dao, V.T.; Torero, J.L.; Maluk, C.; Bisby, L. Effects of temperature and temperature gradient on concrete performance at elevated temperatures. Adv. Struct. Eng. 2018, 21, 1223–1233. [Google Scholar] [CrossRef] [Green Version]
  110. Zheng, R.; Janssens, A.; Carmeliet, J.; Bogaerts, W.; Hens, H. An evaluation of highly insulated cold zinc roofs in a moderate humid region—Part I: Hygrothermal performance. Constr. Build. Mater. 2004, 18, 49–59. [Google Scholar] [CrossRef]
  111. Šadauskiene, J.; Monstvilas, E.; Stankevicius, V. The impact of exterior finish vapour resistance on the moisture state of building walls. Technol. Econ. Dev. Econ. 2007, 13, 73–82. [Google Scholar] [CrossRef]
  112. Hamid, A.A.; Wallentén, P. Hygrothermal assessment of internally added thermal insulation on external brick walls in Swedish multifamily buildings. Build. Environ. 2017, 123, 351–362. [Google Scholar] [CrossRef]
  113. Pedroso, M.; Flores-Colen, I.; Silvestre, J.D.; Gomes, M.G. Study on the thermal conductivity performance of cement-based composites incorporating natural organic fibres. In 39 th Cement and Concrete Science Conference 2019; Ball, R., Dams, B., Ferrandiz-Mas, V., Ke, X., Paine, K., Tyrer, M., Walker, P., Eds.; University of Bath: Bath, UK, 2019; pp. 112–115. [Google Scholar]
  114. Hansen, E. RIBuild—Internal Insulation in Historic Buildings—Horizon 2020 Project. 2020. Available online: https://www.ribuild.eu/ (accessed on 28 September 2020).
  115. Rubel, F.; Kottek, M. Observed and projected climate shifts 1901-2100 depicted by world maps of the Köppen-Geiger climate classification. Meteorol. Zeitschrift. 2010, 19, 135–141. [Google Scholar] [CrossRef] [Green Version]
  116. Graham, J.; Berardi, U.; Turnbull, G.; McKaye, R. Microclimate Analysis as a Design Driver of Architecture. Climate 2020, 8, 72. [Google Scholar] [CrossRef]
  117. Freitas, A.M.; de Freitas, V.P. Miranda, Main Pathologies Associated with External Thermal Insulation Composite Systems (ETICS)—LFC-IC-282A-2014; APFAC: Porto, Portugal, 2014. (In Portuguese) [Google Scholar]
Figure 1. Aerogel-based render’s visual aspect during the mixing process (a) and the specimens (cylindric I with a linear probe; closer—cylindric II with a plane probe) and ISOMET 2114 equipment from Applied Precision supplier (b).
Energies 16 03048 g001
Figure 2. Aspects of the hygroscopic range evaluation (a) and the over-hygroscopic using a Heraeus Vötsch climatic chamber, with the samples immersed in water (b) in a sealed plastic box.
Energies 16 03048 g002
Figure 3. Ranges for practical moisture buffer value (MBVpractical) classes, adapted from [59].
Energies 16 03048 g003
Figure 4. Thermal conductivity as a function of water content, at 10 °C.
Energies 16 03048 g004
Figure 5. Sorption isotherms for the renders (black) at 23 °C, compared with other results [11,33,62].
Energies 16 03048 g005
Figure 6. Liquid transport coefficient for suction (Dws), as a function of moisture content (w).
Energies 16 03048 g006
Figure 7. Section view of each analysed application: (a) thermal render; (b) thermal render with gypsum board; (c) multilayer system.
Energies 16 03048 g007
Figure 8. Moisture buffering performance for different applications: (a) thermal render; (b) thermal render + gypsum board; (c) thermal render + protective coating system—Ind thermal render from [62].
Energies 16 03048 g008aEnergies 16 03048 g008b
Figure 9. MBVpractical when compared to other materials—Ind therm render [62], brick and concrete [59,77].
Energies 16 03048 g009
Figure 10. Section view of the studied wall assemblies: (a) new construction (NW and ZNW); (b) outdoor retrofit (RE); (c) indoor retrofit (RI).
Energies 16 03048 g010
Table 1. Specimens produced, per formulation.
Specimens’ ShapeDimension [mm]Number of Specimens
Cylindric Iϕ ≥ 70; h ≥ 1303
Cylindric IIϕ ≥ 100; h ≥ 403
Note: ϕ—specimens’ diameter; h—specimens’ height; each test conducted at least three times for each specimen to obtain some statistical significance.
Table 2. Synthesis of some of the parameters previously characterised—average values adapted from [27].
Render Formulationρhard [kg m−3]P0 [%]λ10°C,dry [W m−1 K−1]μ [-]Aw [kg m−2 s−1/2]
TR reference (0.0%)158.786.30.029313.70.1090
TR aramid (0.50%)164.585.10.031513.30.0286
TR sisal (0.10%)160.386.90.029812.70.0325
TR biomass (0.10%)161.687.00.030612.40.0310
Note: ρhard—bulk density in the hardened state [kg m−3]; P0—open porosity by mercury intrusion porosimeter [%]; λ10°C,dry—thermal conductivity at 10 °C and hardened dry state [W m−1 K−1]; μ—water vapour diffusion resistance factor [-]; Aw—capillary water absorption [kg m−2 s−1/2].
Table 3. Thermal properties result in synthesis.
Render Formulationλ10°C,dry
[W m−1 K−1] [41]
λ10°C,sat
[W m−1 K−1]
cp
[J kg−1 K−1]
I
[J m−2 K−1 s−1/2]
α
[m2 s−1]
dp,10min
[mm]
TR reference (0.0%)0.0293 ± 0.00310.1401 ± 0.0052930.1 ± 5.165.81.99 × 10−7 ± 1.91 × 10−919
TR aramid (0.5%)0.0315 ± 0.00190.1311 ± 0.0071800.0 ± 7.964.42.39 × 10−7 ± 2.63 × 10−921
TR sisal (0.1%)0.0298 ± 0.00270.1230 ± 0.0035894.5 ± 10.265.42.08 × 10−7 ± 2.70 × 10−920
TR biomass (0.1%)0.0306 ± 0.00320.1285 ± 0.0044957.3 ± 12.868.81.98 × 10−7 ± 2.77 × 10−919
Note: ±SD—standard deviation. λ10°C,dry—thermal conductivity at 10 °C and dry-state [W m−1 K−1]; λ10°C,sat—thermal conductivity at 10 °C and saturated-state [W m−1 K−1]; cp—specific heat capacity [J kg−1 K−1]; I—material’s thermal inertia [J m−2 K−1 s−1/2]; α—thermal diffusivity [m2 s−1]; dp,10min—heat penetration depth at 10 min after exposure [mm].
Table 4. Moisture storage properties and porosity results in synthesis.
Render Formulationw80%RH,eq
[kg m−3]
wf
[kg m−3]
wmax
[kg m−3]
Saturation Coefficient
[-]
TR reference (0.0%)7.80 ± 0.04281.04 ± 5.128630.33
TR aramid (0.5%)7.12 ± 0.07246.08 ± 7.888510.29
TR sisal (0.1%)7.28 ± 0.06260.20 ± 8.298690.30
TR biomass (0.1%)7.56 ± 0.03274.83 ± 9.878700.32
Note: ±SD—standard deviation. Parameters: w80%RH,eq—moisture content at 80%RH [kg m−3]; wf—free liquid water saturation [kg m−3]; wmax—maximum liquid water content [kg m−3].
Table 5. Outdoor and indoor average climatic conditions are available in the WUFI database.
Climatic ParameterLisbonZurich
Outdoor climate average conditions
LocationLat. 38.736946; Long. −9.142685Lat. 47.373878; Long. 8.545094
Temperature [°C]15.68.3
Relative humidity [%]74.678.2
Global radiation emitted by the sun
[kW h m−2 year−1]
-2751.7
Mean cloud index [-]-0.7
Driving rain directionSouth-westWest southwest
Rain (accumulated) [mm year−1]674.91007.9
Indoor climate average conditions
According to EN 15026—high moisture load [10]
Table 6. Simulation boundary conditions.
PropertyAdopted Values
Analysis periodFive years, starting and ending on 1 October
Timestep1 h
Initial relative humidity80%RH
Initial temperature20 °C
OrientationsNorth and orientation with higher WDR:
Lisbon—North and South West
Zurich—North and West Southwest
Wind-driven rainASHRAE 160 [96] medium exposure, building with height ≤ 10 m and below a sloped roof; 1% of defects
Solar absorption coefficientsWhite smooth surface: 0.25
Long-wave radiation emissivity0.9 (non-metallic component surface)
Rain absorption factor0.70 (vertical wall)
Table 7. Synthesis of the new wall simulations for Lisbon (NW) and Zurich (ZNW).
Solution
SW–N
TWC and DPMouldw/wf ≤ 0.30Ext Surface Temp (max) [°C]Temp Gradient Insulator
[°C]
CP > 0
[Pa]
φ = 100%RH
[h]
Uavg/Uref ≤ 1
[month]
q
[kWh m−2]
NW1pass–passpass–passpass–pass39.1–35.57.0–3.91608–1711164–16812–311.92–13.84
NW2pass–passpass–passpass–pass39.1–35.56.9–3.91618–1704166–16712–311.84–13.94
NW3pass–passpass–passpass–pass39.1–35.57.0–4.01629–1729164–16812–311.53–13.55
NW4pass–passpass–passpass–pass39.1–35.56.9–3.91603–1700164–16712–311.97–14.00
NW5fail–failpass–passpass–pass38.9–35.57.3–4.21510–1670155–16612–113.79–15.04
NW6pass–passpass–passpass–pass39.1–35.57.3–4.11599–1658163–16712–111.67–14.20
NW7pass–passpass–passpass–pass39.2–35.54.3–4.31685–1746167–17112–010.64–12.91
ZNW1pass–passpass–passpass–pass33.0–27.56.9–4.027141–262631998–21346–212.34–13.01
ZNW2pass–passpass–passpass–pass33.0–27.56.8–4.026914–233032056–22506–211.84–13.26
ZNW3pass–passpass–passpass–pass33.0–27.56.8–3.927107–263922020–22126–212.48–12.67
ZNW4pass–passpass–passpass–pass33.0–27.56.8–4.026605–260832136–19886–212.48–13.20
ZNW5fail–failpass–passpass–pass32.8–27.47.2–4.426799–250102100–20001–115.24–16.09
ZNW6fail–passpass–passpass–pass33.0–27.67.2–4.226980–271722119–19803–212.94–13.0
ZNW7fail–failpass–passpass–pass33.0–27.64.2–4.227002–269922111–21362–213.05–13.10
Note: TWC and DP—total water content during the five years and respective drying potential; Mould—potential for mould appearance; w/wf ≤ 0.30—low probability of water running off and frost damage; Ext surface temp (max)—99th percentile of the maximum verified temperature at the surface [°C]; Temp gradient insulator—temperature gradient between the opposite surfaces of the thermal insulator [°C]; CP > 0—condensation potential [Pa]; φ = 100% RH—number of hours where it could be attained an air relative humidity of 100% RH [h]; Uavg/Uref ≤ 1—number of months in which the thermal transmittance of the solution was similar to or below the reference conditions [month]; q—element’s heat loss during the full winter of the 5th [kWh], for a square meter.
Table 8. Synthesis of the exterior retrofit simulation for Lisbon (RE).
Solution
SW–N
TWC and DPMouldw/wf ≤ 0.30Ext Surface Temp (max) [°C]Temp Gradient Insulator
[°C]
CP > 0
[Pa]
φ = 100%RH
[h]
Uavg/Uref ≤ 1
[month]
q
[kWh m−2]
RE1pass–passfail–failfail–fail35.6–33.3-5036–3040282–394–081.45–96.82
RE2pass–passpass–passpass–pass39.3–35.69.2–5.11704–1793165–17112–511.85–13.79
RE3pass–passpass–passpass–pass39.2–35.69.2–5.11606–1766159–17110–211.84–14.23
RE4pass–passpass–passpass–pass39.2–35.69.2–5.11642–1807159–1719–312.90–13.57
RE5pass–passpass–passpass–pass39.2–35.69.2–5.11592–1764158–1706–313.64–14.27
RE6pass–passpass–passpass–pass39.1–35.69.4–5.31586–1736164–1648–114.21–15.14
RE7fail–passpass–passpass–pass39.2–35.69.4–5.21597–1675160–16711–013.72–15.66
RE8fail–passpass–passpass–pass39.4–35.79.5–5.31747–1848169–17510–011.47–12.64
Note: TWC and DP—total water content during the five years and respective drying potential; Mould—potential for mould appearance; w/wf ≤ 0.30—low probability of water running off and frost damage; Ext surface temp (max)—99th percentile of the maximum verified temperature at the surface [°C]; Temp gradient insulator—temperature gradient between the opposite surfaces of the thermal insulator [°C]; CP > 0—condensation potential [Pa]; φ = 100%RH—number of hours where it could be attained an air relative humidity of 100%RH [h]; Uavg/Uref ≤ 1—number of months in which the thermal transmittance of the solution was similar or below than the reference conditions [month]; q—element’s heat loss during full Winter of the 5th [kWh], for a square meter.
Table 9. Synthesis of the interior retrofit simulation for Lisbon (RI).
Solution
SW–N
TWC and DPMouldw/wf ≤ 0.30Ext Surface Temp (max) [°C]Temp Gradient Insulator
[°C]
CP > 0
[Pa]
φ = 100%RH
[h]
Uavg/Uref ≤ 1
[month]
q
[kWh m−2]
RI1pass–passfail–failpass–pass35.6–33.3-5036–3040282–393–081.45–96.82
RI2pass–passpass–passpass–pass35.5–33.21.0–0.211358–7887311–429–014.91–18.40
RI3pass–passpass–passpass–pass35.5–33.21.0–0.211303–7839292–428–011.84–18.70
RI4pass–passpass–passpass–pass35.5–33.21.0–0.211457–7839281–399–014.41–17.80
RI5pass–passpass–passpass–pass35.5–33.21.0–0.211304–7970282–398–015.17–18.74
RI6pass–failpass–passpass–pass35.5–33.20.6–0.211286–7832304–556–015.42–18.99
RI7fail–failpass–passpass–pass35.5–33.21.1–0.310968–7589290–384–016.93–20.79
RI8fail–failpass–passpass–pass35.5–33.21.2–0.312033–8552270–604–011.94–14.54
Note: TWC and DP—total water content during the five years and respective drying potential; Mould—potential for mould appearance; w/wf ≤ 0.30—low probability of water running off and frost damage; Ext surface temp (max)—99th percentile of the maximum verified temperature at the surface [°C]; Temp gradient insulator—temperature gradient between the opposite surfaces of the thermal insulator [°C]; CP > 0—condensation potential [Pa]; φ = 100%RH—number of hours where it could be attained an air relative humidity of 100%RH [h]; Uavg/Uref ≤ 1—number of months in which the thermal transmittance of the solution was similar or below than the reference conditions [month]; q—element’s heat loss during full Winter of the 5th [kWh], for a square meter.
Disclaimer/Publisher’s Note: The statements, opinions and data contained in all publications are solely those of the individual author(s) and contributor(s) and not of MDPI and/or the editor(s). MDPI and/or the editor(s) disclaim responsibility for any injury to people or property resulting from any ideas, methods, instructions or products referred to in the content.

