Article

Acceleration-Insensitive Pressure Sensor for Aerodynamic Analysis

1
Faculty of Mechanical Engineering and Aeronautics, Rzeszów University of Technology, al. Powstańców Warszawy 12, 35-959 Rzeszów, Poland
2
Faculty of Mechanical Engineering and Robotics, AGH University of Science and Technology, al. A. Mickiewicza 30, 30-059 Krakow, Poland
*
Author to whom correspondence should be addressed.
Energies 2023, 16(7), 3040; https://doi.org/10.3390/en16073040
Submission received: 22 February 2023 / Revised: 18 March 2023 / Accepted: 24 March 2023 / Published: 27 March 2023
(This article belongs to the Collection Energy Efficiency and Environmental Issues)

Abstract

:
This paper presents a method for preparing a pressure sensor that is insensitive to acceleration along with experimental evidence of its efficacy in aerodynamic analysis. A literature review and preliminary studies revealed the undesirable effect of acceleration on sensors that are located on moving elements, as evidenced by deviations from actual pressure values for piezoresistive pressure sensors that are made using MEMS technology. To address this, the authors developed a double-membrane sensor geometry that eliminated this imperfection; a method of implementing two solo pressure sensors as a new geometry-designed sensor was also proposed. Experimental tests of this suggested solution were conducted; these measurements are presented here. The results indicated that this new sensor concept could be used to measure the dynamic pressures of rotating and moving objects in order to obtain measurement results that are more reliable and closer to the true values that are derived from aerodynamic analyses. The published results confirm the reliability of the proposed device.

1. Introduction

This publication presents the concept of designing pressure transducers that are free from errors of sensitivity to static and dynamic accelerations. The paper is a logical consequence of the research on this issue that is presented in [1,2]. The origin of the issue and the problem of the sensitivity of pressure sensors to accelerations (which is a continuation of the topic of sensitivity that was published in [1,2]) is presented at the first part of the study. Acceleration sensitivity means that a sensor output generates a signal that is proportional to the value of the acceleration to which the sensor is subjected; this mainly applies to sensors for low pressures (up to 100 kPa). The smaller the range, the more noticeable this effect is (and, it has a greater contribution to a measured pressure signal). This means that pressure measurements could be carried out with noticeable errors for measurements of moving and rotating objects, flying planes, moving cars, or rotating wind turbine rotor blades [3]. Measurements of the elementary flight parameters of airplanes are based on pressure measurements. If an object is in motion, accelerations usually cause some measurement errors; consequently, measurement inaccuracies could cause the inappropriate control of a flying unit, and the reaction of the unit’s autopilot might be incorrect. A similar difficulty occurs in wind energy tests that are carried out in a wind tunnel, the purpose of which is to determine the pressure loads on the blades during operation. The only method is a multi-point measurement with a transducer scanner of the pressure distribution on the airfoil. Then, transducers rotate and are exposed to significant centrifugal acceleration; this, in turn, results in a large share of the measured pressure in the signal from the acceleration. For example, the centrifugal accelerations are at a level of 350 g for a V-type wind turbine with a diameter of D = 1 m at a rotational speed of 800 r 1/min, where g is the acceleration due to gravity. In a classic measurement that uses MPX2010D silicon piezoresistive pressure sensors (which provide very accurate and linear output voltage that is directly proportional to the applied pressure), the acceleration signal in this method would be 4500 Pa. Therefore, measured pressure values would be of this order of magnitude; so, the uncertainty of the measurements could be as high as 100%. Furthermore, it follows that the transducer that is used should be in accordance with the concept that is proposed in the presented study. This very important observation is not widely known in the literature, especially since the manufacturers of sensors do not include information on this subject on their data sheets. Extensive studies on this topic could not be found in any available modern publications or books.
Partial results of the conducted research were published in [1,2]. The important thing is that the effect of acceleration is quite diverse in sensors that are manufactured by different companies and cannot be applied directly (in addition to measuring acceleration in the form of a fixed correction). The result of the conducted research on the influence of acceleration on pressure measurements was the development of the construction geometry, which is independent from the sensitivity of pressure sensors to accelerations. The proposed solution is dedicated to a modern construction that is based on MEMS technology, which enables the construction of a structure that features millimeter sizes. Both membranes are pressure-active in a double-membrane construction. Tests that were carried out in the Department of Aeronautical and Space Engineering at Rzeszów University of Technology (PL) and the Department of Energy Systems and Environmental Protection Devices at AGH University of Science and Technology (PL) on the designed and manufactured sensor that is based on single structures showed significant changes towards reduction of the influence of acceleration on pressure measurement results. The prepared differential-pressure transducer has been patented [4]. An extensive literature exploration on the issue of the impact of acceleration on the accuracy of pressure measurements was conducted; it was noted that no such analysis exists. In many publications that concern silicon transducers [5,6,7,8,9,10,11,12,13,14,15,16,17,18,19,20,21,22,23,24,25], technological issues are most often discussed; however, the issue of the influence of acceleration is not analyzed at all. Only refs. [18,26] concerned the complex structures of transducers for measuring some factors: temperature, pressure, acceleration, and radiation in one silicon multi-sensor. Apart from the presence of accelerometers in multi-sensors, the contents of the publication were not related to the influence of acceleration on pressure measurement.
The issue of the effect of acceleration on pressure measurement is not well known and has not been widely discussed in the literature. The construction of an integrated transducer was presented in [10], where the authors proposed two structures for measuring high pressures up to 450 kPa and accelerations up to 125 g and assembling them as one transducer. Any acceleration information that is obtained from such measurements from an accelerometer allow us to take the influence of acceleration on a pressure sensor with known characteristics into account. Many publications have described semiconductor pressure sensors that operate on the principle of determining the deflection of a silicon membrane that is exposed to normal stress based on strain gauges. It was noted that, since the membrane can bend under acceleration, sensor solutions should be used to compensate for these undesirable effects. A reliable solution is the double-membrane construction that is proposed in the current paper.
The issue of sensitivity to the acceleration of measurement structures concerns many research situations. Being aware of this, the issues that are presented in this paper mainly concern those areas that are related to aviation and wind energy. Sensitivity to excitations of different natures is related to those installation situations in which structure vibrations may be generated both from the vortices that are created in an installation itself and those that are caused by compressor devices or drives of various types. The introduced vibrations can be in the form of acceleration variabilities of an impact or polyharmonic nature or in the case of tests that are carried out in a two-phase environment. Examples may be the very interesting studies of two-phase flows in installations using the pressure method that are presented in [27,28]. The vibrations that were analyzed in these papers may increase the uncertainty, which may depend on the installation method of the transmitters. Similarly, the vortex methods that were used in these studies (i.e., von Karman vortices) to address the problem of increasing the measurement uncertainty are very important, as the flow is estimated based on the measurements of local pressure variations in the vortex area. In such cases of measurement studies, flow-measuring devices are particularly sensitive to vibrations. When analyzing publications on media flow, the research issue that was presented in [29] was related to the topic of vortex flowmeters. The publication presented research on the flexible structures of generation transducers that use the piezoelectric effect. The piezoelectric phenomenon can be dedicated to applications in vortex flowmeters for measuring small changes in the local pressure in a vortex’s path behind the exciter. The solution of the double-membrane sensor that is proposed in the current publication should also likely compensate for this problem in such cases.
Pressure sensors (transducers) convert the physical values of the pressure of a medium (gas, liquid) into voltage or electrical current signals. Pressure-to-voltage converters are critical in all process and production systems. The presented acceleration-insensitive pressure sensor represents a design concept of a pressure transducer that is free from errors of sensitivity to any static and dynamic accelerations that are obtained at a sensor’s output. This allows us to obtain a signal that is proportional to the pressure to which the sensor is subjected regardless of any external accelerations. This makes it possible to carry out a wide range of research both in aviation technology and in the wind energy sector. The benefits that result from the correct design of a wind turbine blade are not limited to profits that are related to the saving of material for the structure; they can be interpreted in a broader context. This invention enables the more detailed design of wind turbine elements and, thus, the more precise determination of the environmental benefits of wind energy. These benefits include the possible reduction of greenhouse gas emissions and favorable energy balances in the life cycles of products. Other benefits include a shorter time for paying off our carbon debt (producing such an amount of clean energy that will allow us to avoid CO2 emissions that are equivalent to those emissions that are related to the life cycle of a power plant) of up to fewer than 8 months. Another profit source comes from a shorter time for paying off the energy debt (the energy that is used for the production of a single windmill) of up to fewer than 6 months. Hence, the potential environmental benefits of wind energy development also include the possibility of producing more than 80 times more energy than the wind farm will consume during its entire 25–35-year life cycle. A life cycle is counted as the period that starts at the production stage of a device through the costs of installation and operation to the stage of its decommissioning, recovery, and secondary processing of raw materials [30,31,32,33]. Each of these benefits can be considered to be the result of correct airfoil design that is the result of proper aerodynamic testing. All of these environmental benefits of using wind turbines can be intensified through the more detailed results of aerodynamic analyses of wind turbine blades and rotors that can be implemented by using an innovative and newly patented design.

Origin of Research on Influence of Acceleration on Pressure Processing

In the experiments on aerodynamic research with the use of wind tunnels that were conducted by the authors for some years, the authors’ team dealt with pressure measurements in a broad sense; however, they did so in a way that was markedly different from the research that has been presented by other teams [6,7,8,9,10,11,12,13,14,15,16,17,18,19,20,21,22,23,24]. During the research, discrepancies between the measurements and the theoretical analyses could be noticed. Errors were observed during the tests in situations where sensors changed their positions; for example, changing the angle of attack of an unmanned aircraft caused errors in measuring the speed using the pressure method during its ascent and descent. This situation was even more noteworthy and resulted in greater pressure measurement errors in rotating assembly studies. These noticeable measurement errors prompted the authors to seek out a solution to the problem of the inaccuracy of measurement results. The indicated that the influence of acceleration on the accuracy of pressure measurements resulted in research interest in this issue in order to develop a minimization of this influence. Preliminary research results were published in [1,2] with explanations of the presence of this effect.
A developed measurement methodology that allowed for the elimination of this influence has also been presented [1,5]. Continuing research in this area led to the development of a geometry of the construction of a dedicated sensor that was free from the influence of acceleration, which is the distinguishing feature of this device. The concept of an intelligent pressure sensor solution included the use of microelectromechanical system (MEMS) technology and piezoresistive silicon structures. An analysis of the proposed concept of a double-membrane construction showed double the sensitivity as related to the solution that was proposed as a measurement method with the use of two transducers in [2] and the experimental tests that were performed on the models. A full compensation of the acceleration effect was also observed. As a result, the measurement uncertainty was significantly lower. In all pressure measurement methods, the basic principle is to measure the deformation of a membrane that is caused by the pressure difference between one side and the other in membrane-based sensors. Depending on the deformation measurement method that is used, the sensor is classified. The measurement can be carried out inductively, capacitively, or by using the piezoresistive phenomenon (i.e., strain gauges in a silicon structure). The pressure measurement is performed by interpreting the deformation of the membrane wall that separates the two spaces.
Figure 1 shows a schematic diagram of miniaturized silicon strain gauge elements—a pressure sensor with MEMS technology that uses a silicon structure. Using the diffusion method, a bridge was created on the measuring membrane (which was made up of local semiconductor strain gauges).
Under normal conditions, the areas above and below the membrane should be under the same pressure (the bridge is balanced); however, when pressure is applied to one side, the pressure difference between the sides causes the diaphragm to deform. The deformation introduces a change in the resistance of a silicon structure, resulting in the appearance of a voltage at the output of the bridge. The magnitude of this voltage is proportional to the pressure difference. The described process is the basic function of a pressure sensor. Pressure transducers also react to changes in the output voltage because of the acceleration to which they will be subjected; therefore, the output signal from the sensor will be the sum of the pressure and acceleration values. Figure 2 shows a standard MEMS-technology pressure transducer cross-section.
The piezoresistive principle of pressure measurement is important; it has also been developed in MEMS technology. In piezoresistive sensors, resistors are placed on a silicon membrane, and the change in resistance is converted into the output voltage. The development of the measurement technology is related to the development of silicon microcircuits and is the result of research on the piezoelectric effect, which is the change in resistivity under the influence of an applied stress. The acceleration tests were carried out using a classic MEMS transducer and the newly patented design solution.

2. Study of the Influence of Acceleration in Classic MEMS Transducers

2.1. Methodology

The acceleration tests were carried out using classic MEMS transducers; they were carried out using the measurement system that is presented in Figure 3a,b.
Because of the mV version of the transducer that was used, a measurement system with a measurement card for strain gauge bridge measurements was used, allowing for high amplification in the input path.
A modular measurement system was used, which consisted of a DaqBook 2001 (Ethernet-based 200 kHz data-acquisition system) with DBK41 (10-slot analog expansion module), DBK16 (two-channel strain gauge expansion card), and DBK80 (16-channel differential voltage input card with excitation) expansion cards. A 16-bit system was used, along with a sampling frequency of up to 200 kHz and the input amplifier gain of the DBK16 up to 1200. The prepared system for handling the process of recording the measurement data was completed in the DasyLab 2020 environment (as shown in Figure 4).
The measurement system made it possible to simplify complex measurements and obtain measurement results quickly and easily according to the guidelines. In the first stage of the analysis, the sensitivity of the transducer to static acceleration was verified.

2.2. Initial Verification of Transducer Sensitivity to Static Acceleration

In order to check the influence of the static acceleration, a method that was used to calibrate piezoresistive accelerometers was used. The orientation of the transducer was changed by 90 degrees (as shown in Figure 5).
This is equivalent to an acceleration increase per a silicon structure of 1 g. The popular MPX2010D bidirectional piezoresistive differential converter with mV output was used in the research.
Regardless of the processing method that was related to the technology of the transducer, the way it worked remained the same. The pressure difference between p1 and p2 resulted in the fact that the pressure force Fp on the elastic element caused its deformation according to the following formula:
F p = S · Δ p ,
where:
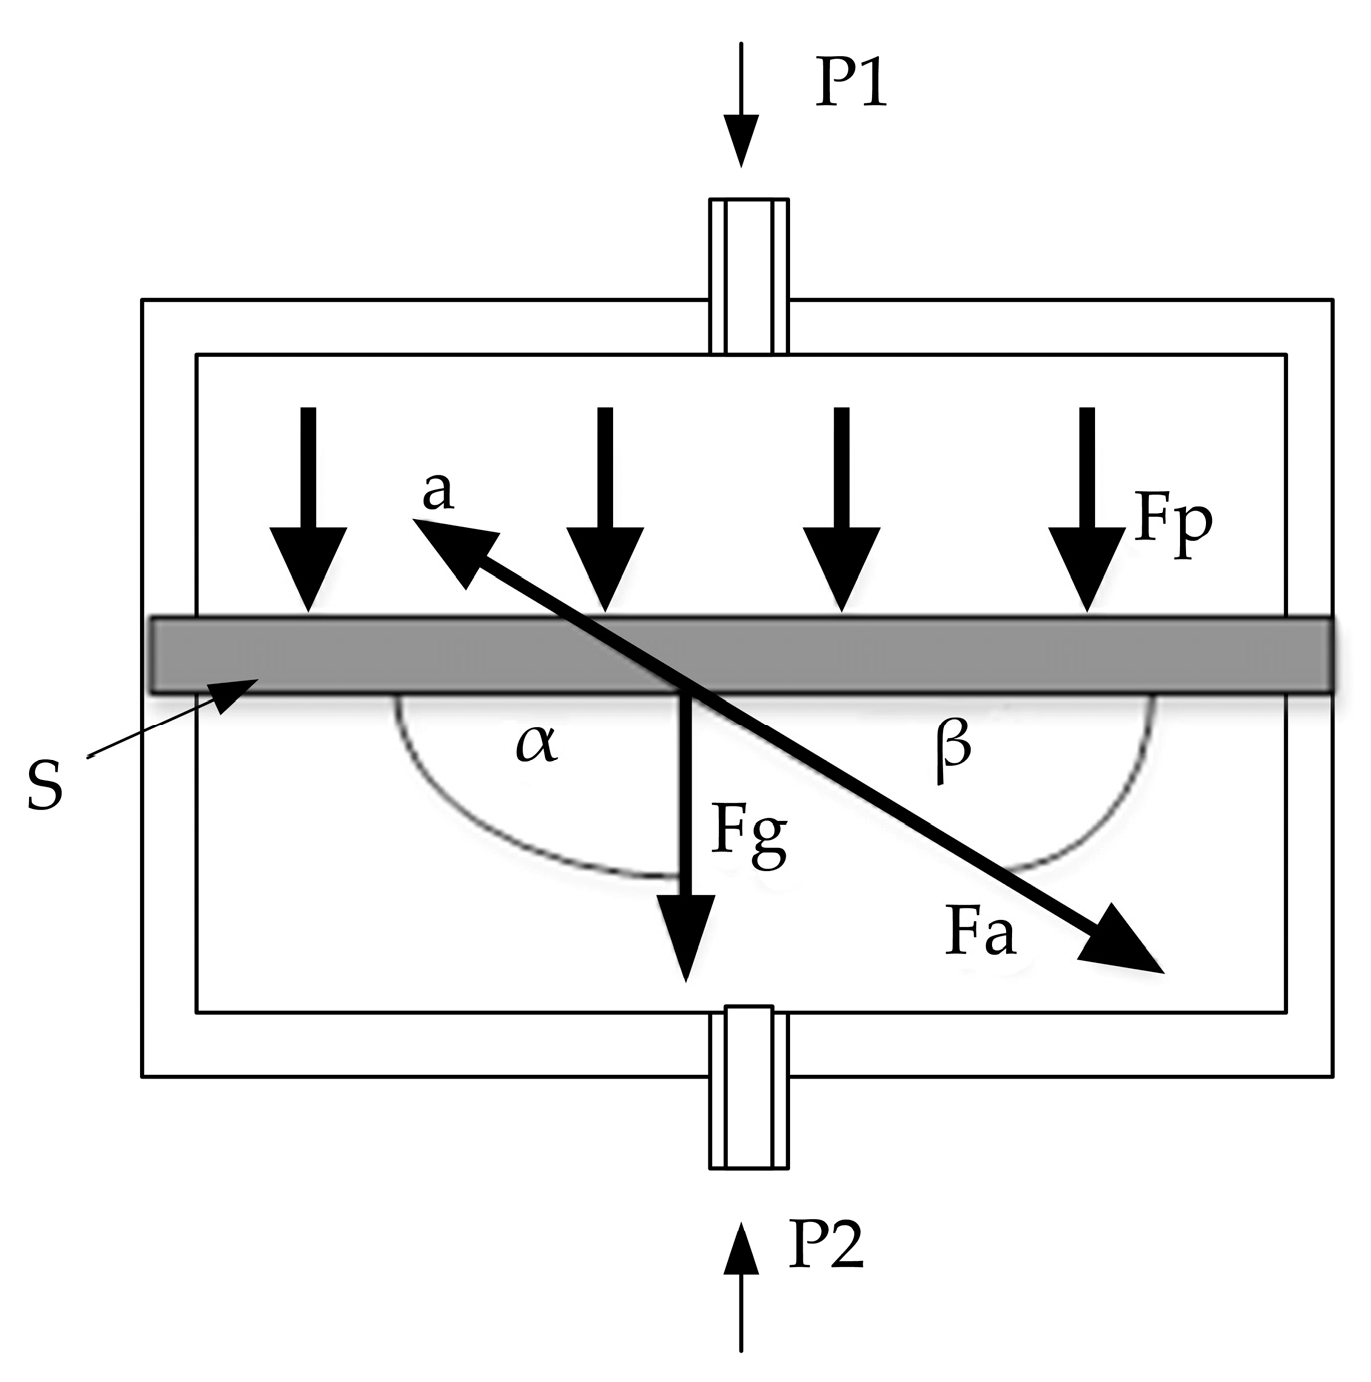
  • Fp—pressure force, N;
  • S—surface of the membrane, m2;
  • Δp—pressure difference, Pa.
Therefore, it was enough to measure the deformation that was caused by the pressure difference Δp using one of the known methods and represent it in the form of pressure. The measuring membrane was a silicon structure with a specific mass (mm) in the form of a gel mass that added mass to the structure; additionally, there was a separator (mz). Therefore, forces acted on the membrane in accordance with the laws of physics, causing its deformation depending on the angle to the acceleration vector according to the following formulas:
F g = ( m m + m z ) g ,  
U o u t = U z K F g sin α ,
where:
  • Fg—gravitational force, N;
  • mm—mass of the membrane, kg;
  • mz—mass of the gel separator, kg;
  • g—gravitational acceleration; 9.81 ms−2;
  • α—angle between the plane of the membrane and the vertical direction in which gravitational force acts, °;
  • Uout—output signal from the transducer, V;
  • Uz—supply voltage of the transducer’s bridge; V;
  • K—amplification of transducer.
The output signal Uout from the bridge of the membrane depended on the size of the membrane mass together with the separating gel and on the angle of the transducer plane to the vertical direction. The transducer reacted to static acceleration. This was not the only force that acted on the membrane because, when an object with a transducer is moving, there is dynamic acceleration due to the motion. This force that acted on the membrane can be defined according to the following formulas:
F a = ( m m + m z ) d v d t ,
U o u t = U z K F a sin β ,
where:
  • Fa—acceleration force, N;
  • mm—mass of the membrane, kg;
  • mz—mass of the gel separator, kg;
  • dv/dt—acceleration of the moving sensor or object with a sensor; ms−2;
  • β—angle between the plane of the membrane and the direction of movement of the object, °;
  • Uout—output signal from the transducer, V;
  • Uz—supply voltage of the transducer’s bridge; V;
  • K—amplification of the transducer.
If the sensor responds to the static acceleration, it must also respond to the dynamic acceleration (which is related to the movement of the sensor relative to the Earth). This relationship is presented by Equation (4). Thus, the sum of the forces acts on the measuring structure; in addition to the force that is responsible for the pressure, there are also forces that are related to acceleration. These forces are expressed by the relationship in Formula (6). Formula (7) shows the balance of the output signal from the transducer. The last two terms represent the acceleration and direction parameters according to the following formulas:
F = S Δ p + ( m m + m z ) g + ( m m + m z ) d v d t ,
U o u t = U z K ( S Δ p + F g s i n   α + F a s i n   β ) ,  
where:
  • ΣF—sum of forces, N;
  • S—surface of the membrane, m2;
  • Δp—pressure difference, Pa;
  • mm—mass of the membrane, kg;
  • mz—mass of the gel separator, kg;
  • (mm + mz)—mass of the membrane and gel separator, kg;
  • g—gravitational acceleration; 9.81 ms−2;
  • dv/dt—acceleration of the moving sensor or the object with a sensor, ms−2;
  • Uout—output signal from the transducer, V;
  • Uz—supply voltage of the transducer’s bridge; V;
  • K—amplification of the transducer;
  • Fg—gravitational force, N;
  • Fa—acceleration force, N;
  • α—angle between the plane of the membrane and the vertical direction in which gravitational force acts, °;
  • β—angle between the plane of the membrane and direction of movement of the object, °.
The presented analysis that was based on physics proved that there was a sensitivity of the pressure transducers to acceleration. A number of experimental studies have been carried out to confirm this fact. A transducer without an amplifier was used for the tests; this was a version of the converter in which there was only a silicon structure with a bridge inside. This structure ensured that the transducer had the ability to convert bidirectionally (+/−). The disadvantage was the need to use a system with an amplifier at the input due to the very low signal level at the output. The research showed that the impact factor for the MPX2010D was 13 Pa/1 g; for 10 g, this would be 130 Pa. The increase in the output signal from the converter for the MPX2010D structure under testing is represented by the analytical relationship that is shown in Equation (3) (as shown in Figure 6).
During the second stage of the analysis, the sensitivity of the transducer to dynamic acceleration was verified.

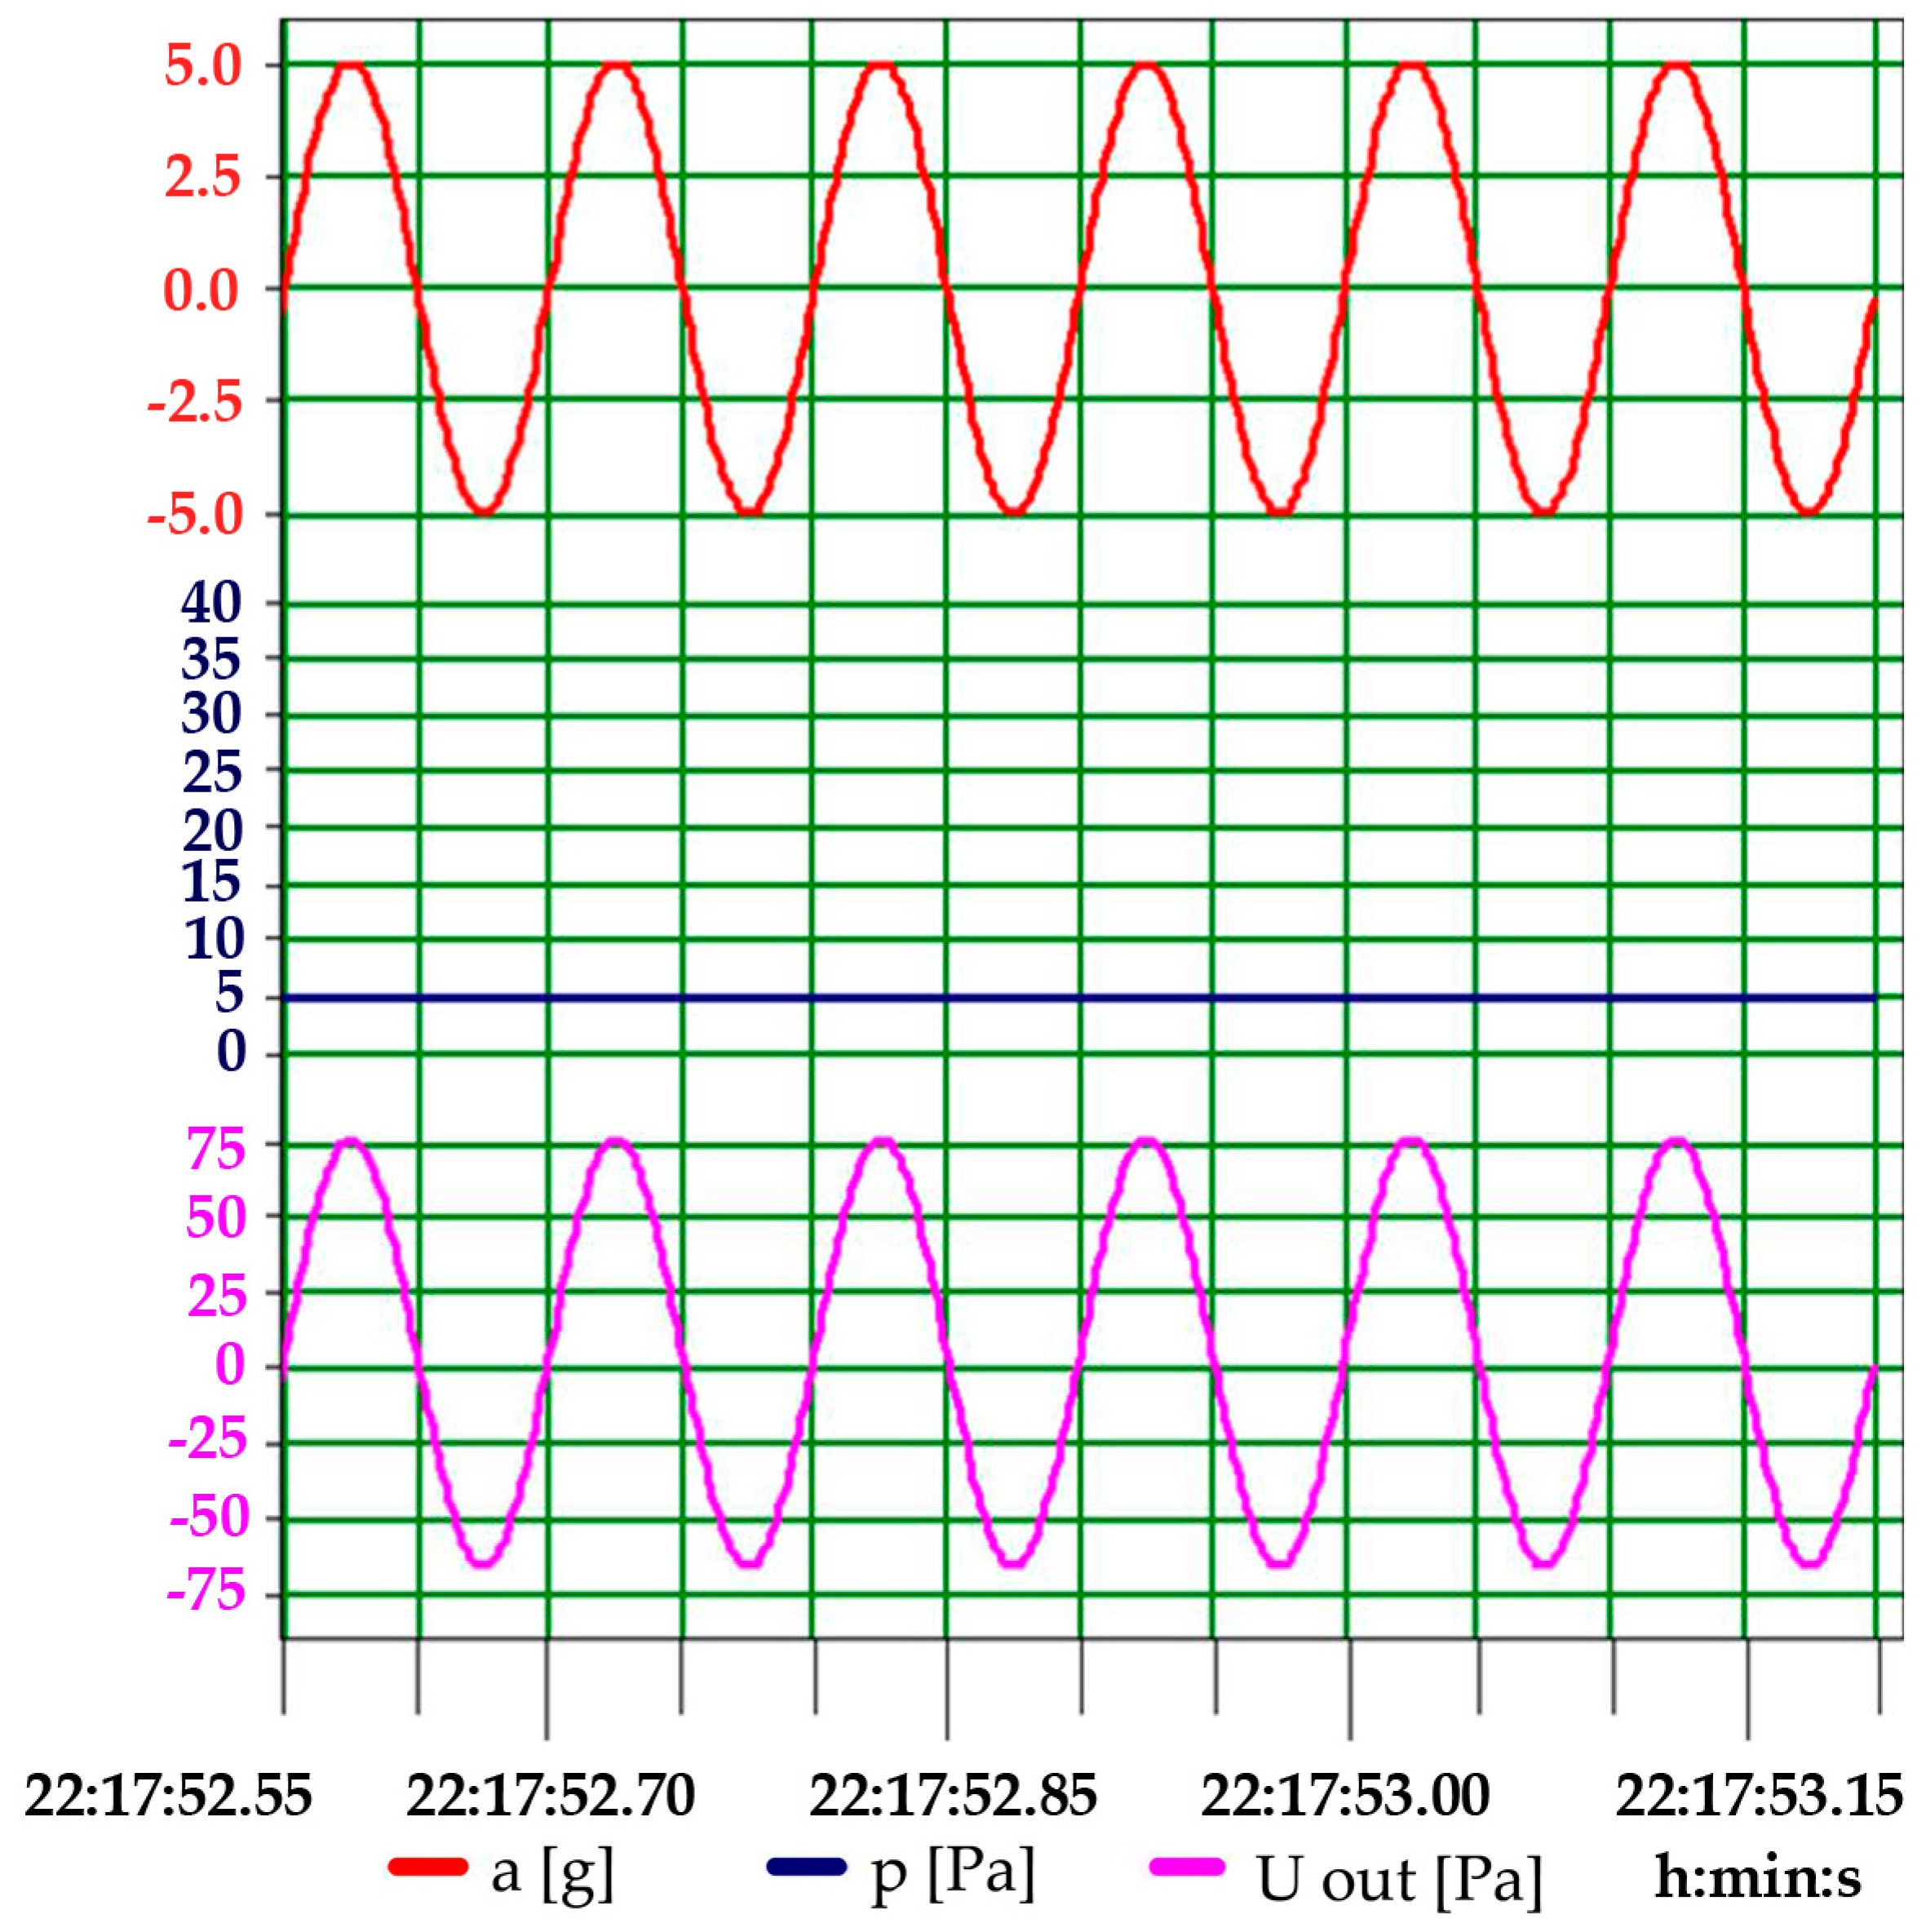
2.3. Verification of Transducer Sensitivity to Dynamic Acceleration

The tests were carried out on an electrodynamic vibrating table (as shown in Figure 7). The amplitude of the harmonic acceleration and the frequency were changed.
The waveforms from the experiment are shown in Figure 8, where a is the dynamic acceleration (which was forced by vibrations with an amplitude of 1 g and a frequency of f = 10 Hz), Uout is the output signal from the converter (which is scaled in Pa), and the pressure of p = 0 Pa. These were the pressure conditions in the experiment. In this system configuration, the output signal should be zero because of the lack of pressure at the transmitter inputs. However, there was a harmonic response that was consistent with the excitation with an amplitude of 13.2 Pa that resulted in an RMS value of Uo(Rms) = 9.3 Pa. The transducer in this form acted as an accelerometer.
The next waveforms from the experiment are shown in Figure 9, where the dynamic acceleration was forced by vibrations with an amplitude of 1 g and a frequency of f = 30 Hz, Uout was the output signal from the converter (which was scaled in Pa), and the pressure was p = 5 Pa. In this system configuration, the output signal should have been 5 Pa because of the applied reference pressure at the transmitter inputs. The values on the Uout curve varied from Uout max = 18 Pa to Uout min = −8 Pa, resulting in an RMS value of Uo(Rms) = 10 Pa.
The subsequent waveforms from the experiment are shown in Figure 10, where the dynamic acceleration was forced by vibrations with an amplitude of 5 g and a frequency of f = 10 Hz, Uout was the output signal from the converter (which was scaled in Pascal), and the pressure was p = 5 Pa.
In this system configuration, the output signal should have been 5 Pa because of the applied reference pressure at the transmitter inputs. The values on the Uout curve varied from Uout max = 76 Pa to Uout min = −66 Pa, resulting in an RMS value of Uo(Rms) = 50.45 Pa. The output signal was a highly modulated harmonic signal that was ten times the measured actual pressure.
The series of experiments for the various excitations of the accelerations and frequencies confirmed that the sensors reacted to accelerations to which they were subjected on the moving objects, therefore making measurements of particularly low pressures impossible. A relatively small level of acceleration was analyzed, and such an acceleration (1 g) may occur for a vibrating structure on which a pressure measurement is performed or for the variability of the flight parameters of an aircraft (including popular unmanned aerial vehicles). Under such conditions and with the use of the analyzed measuring devices, pressure measurements can be questionable.

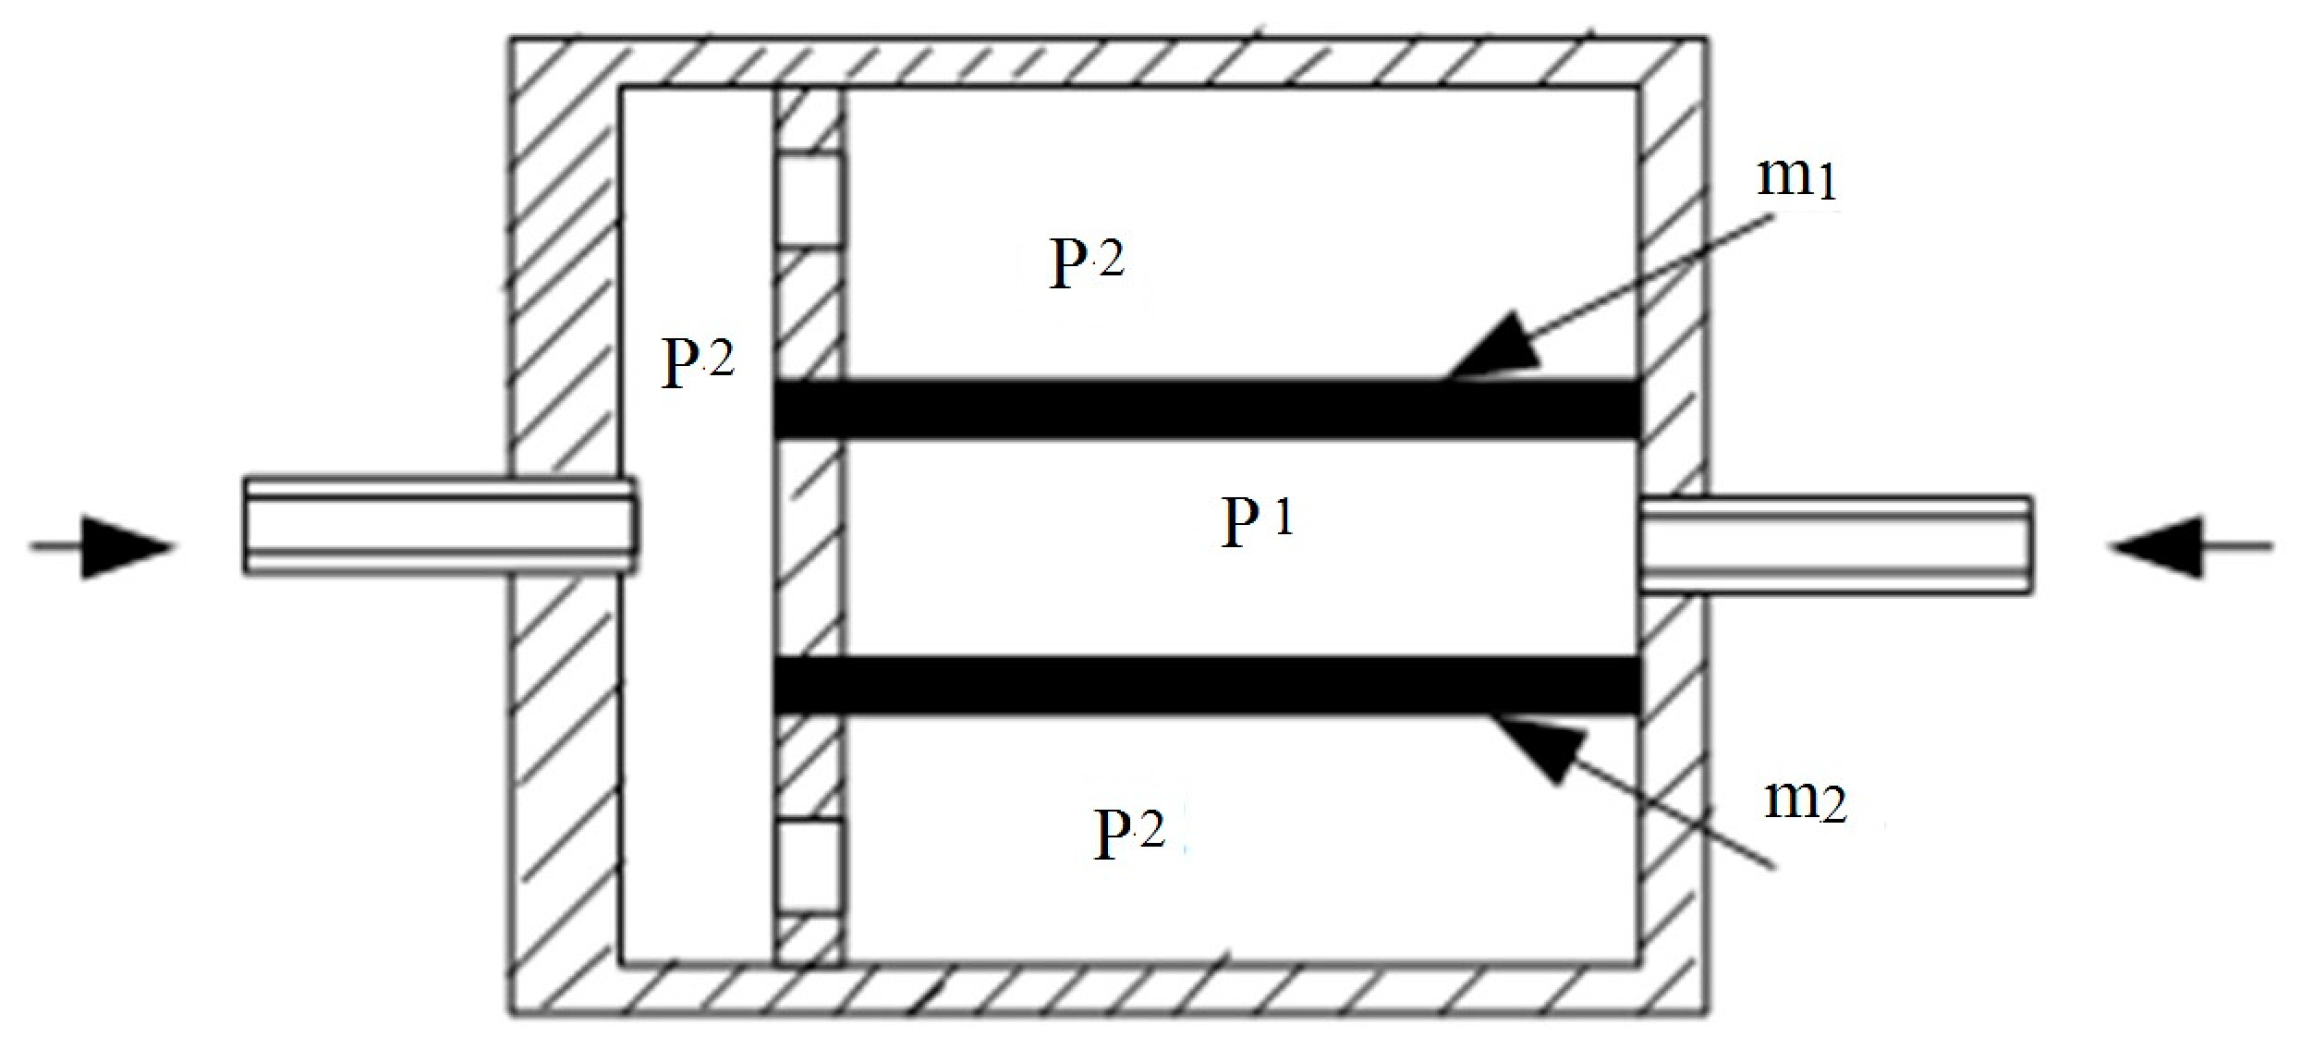
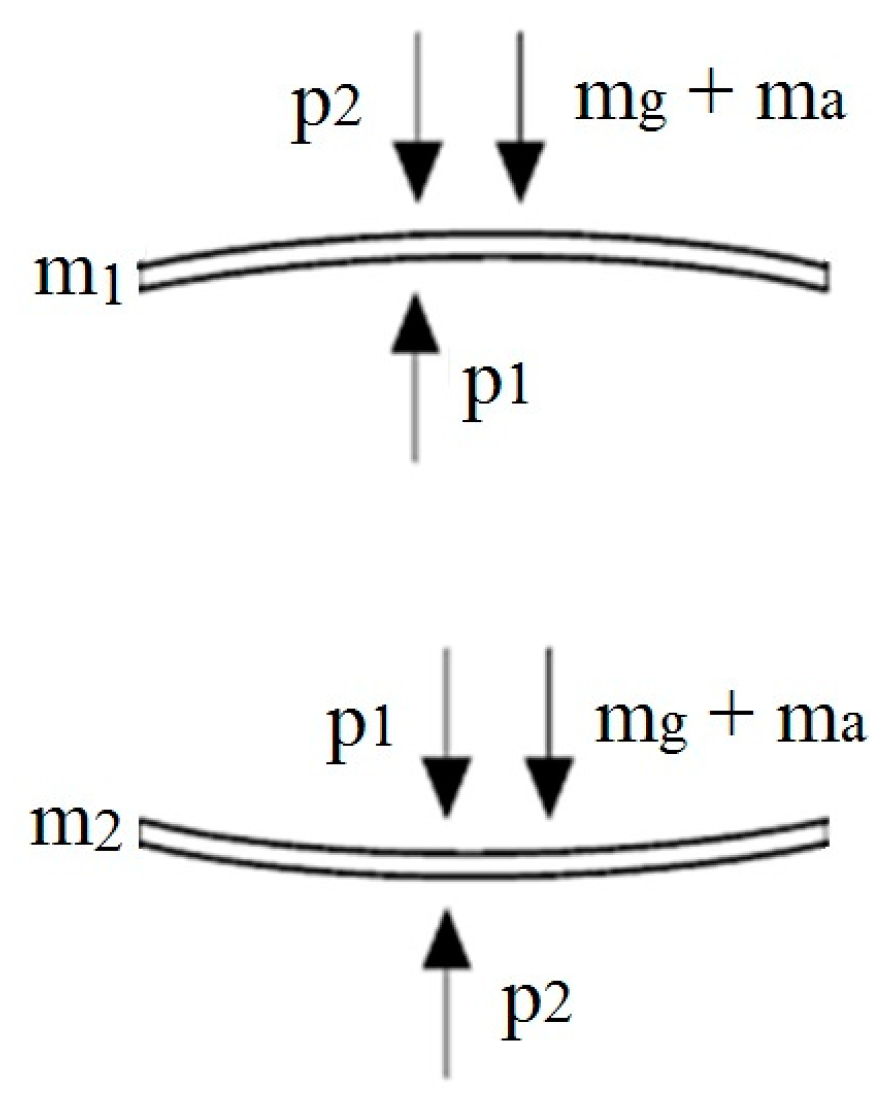
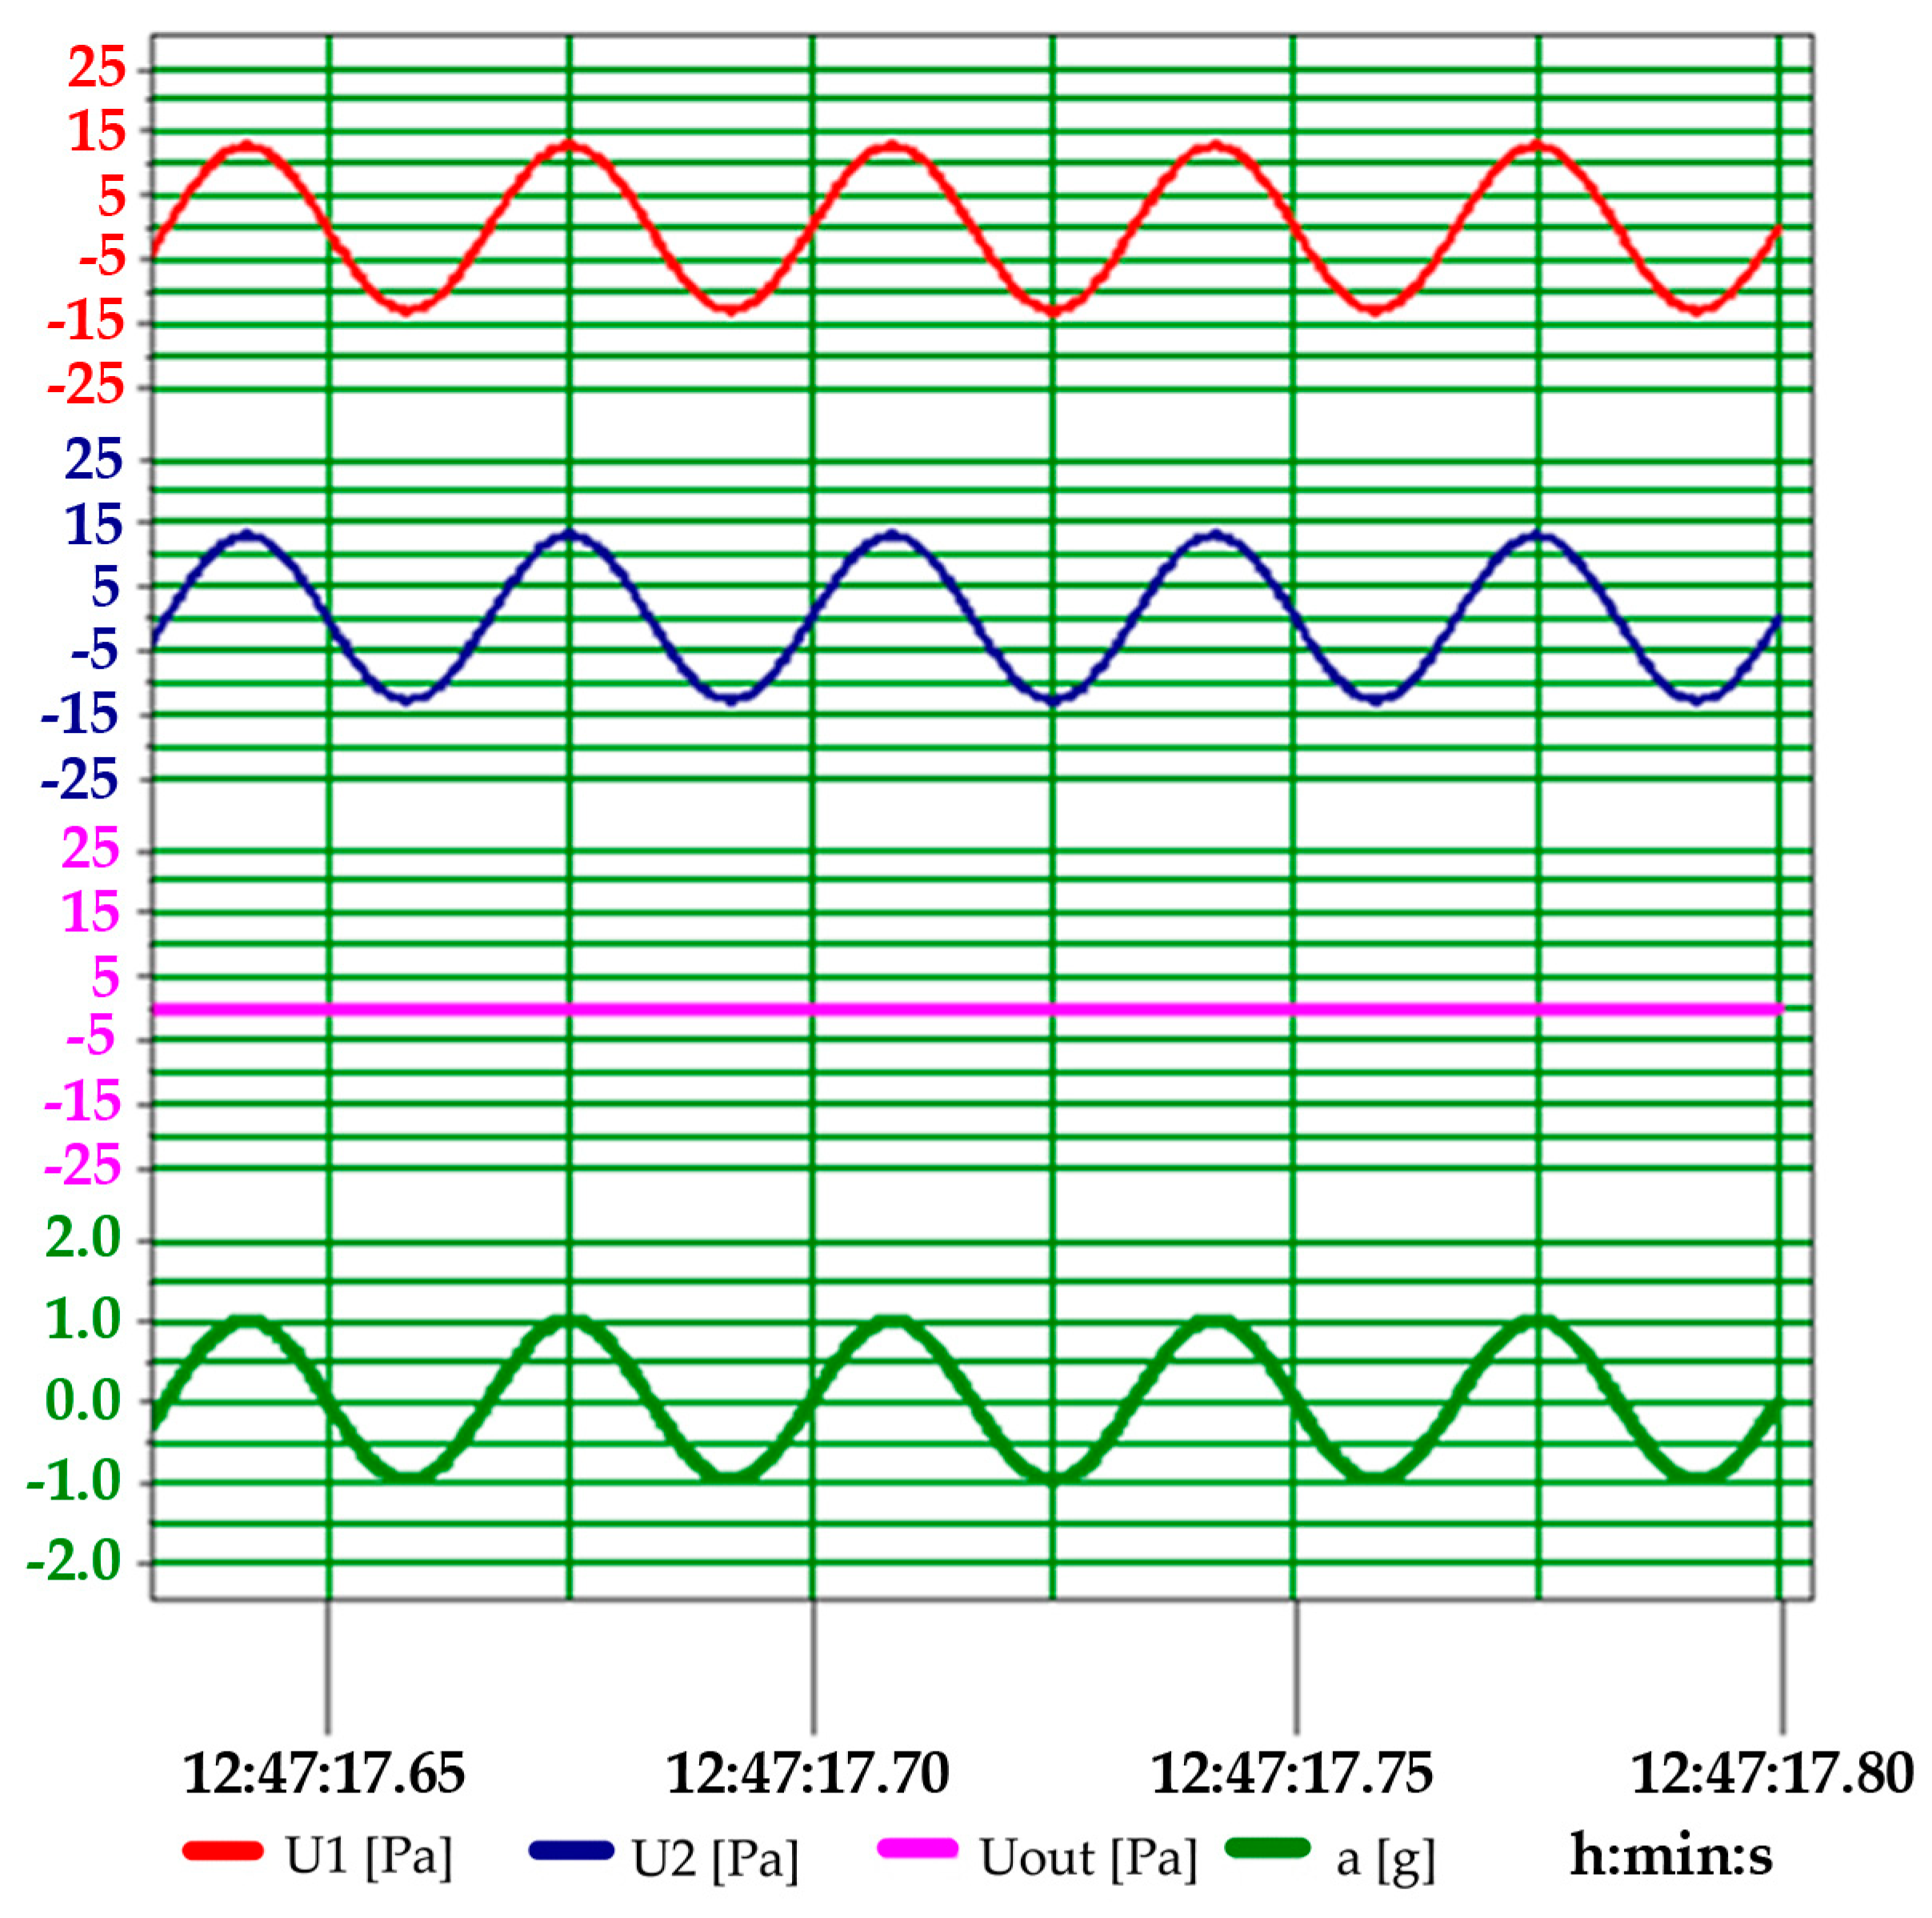
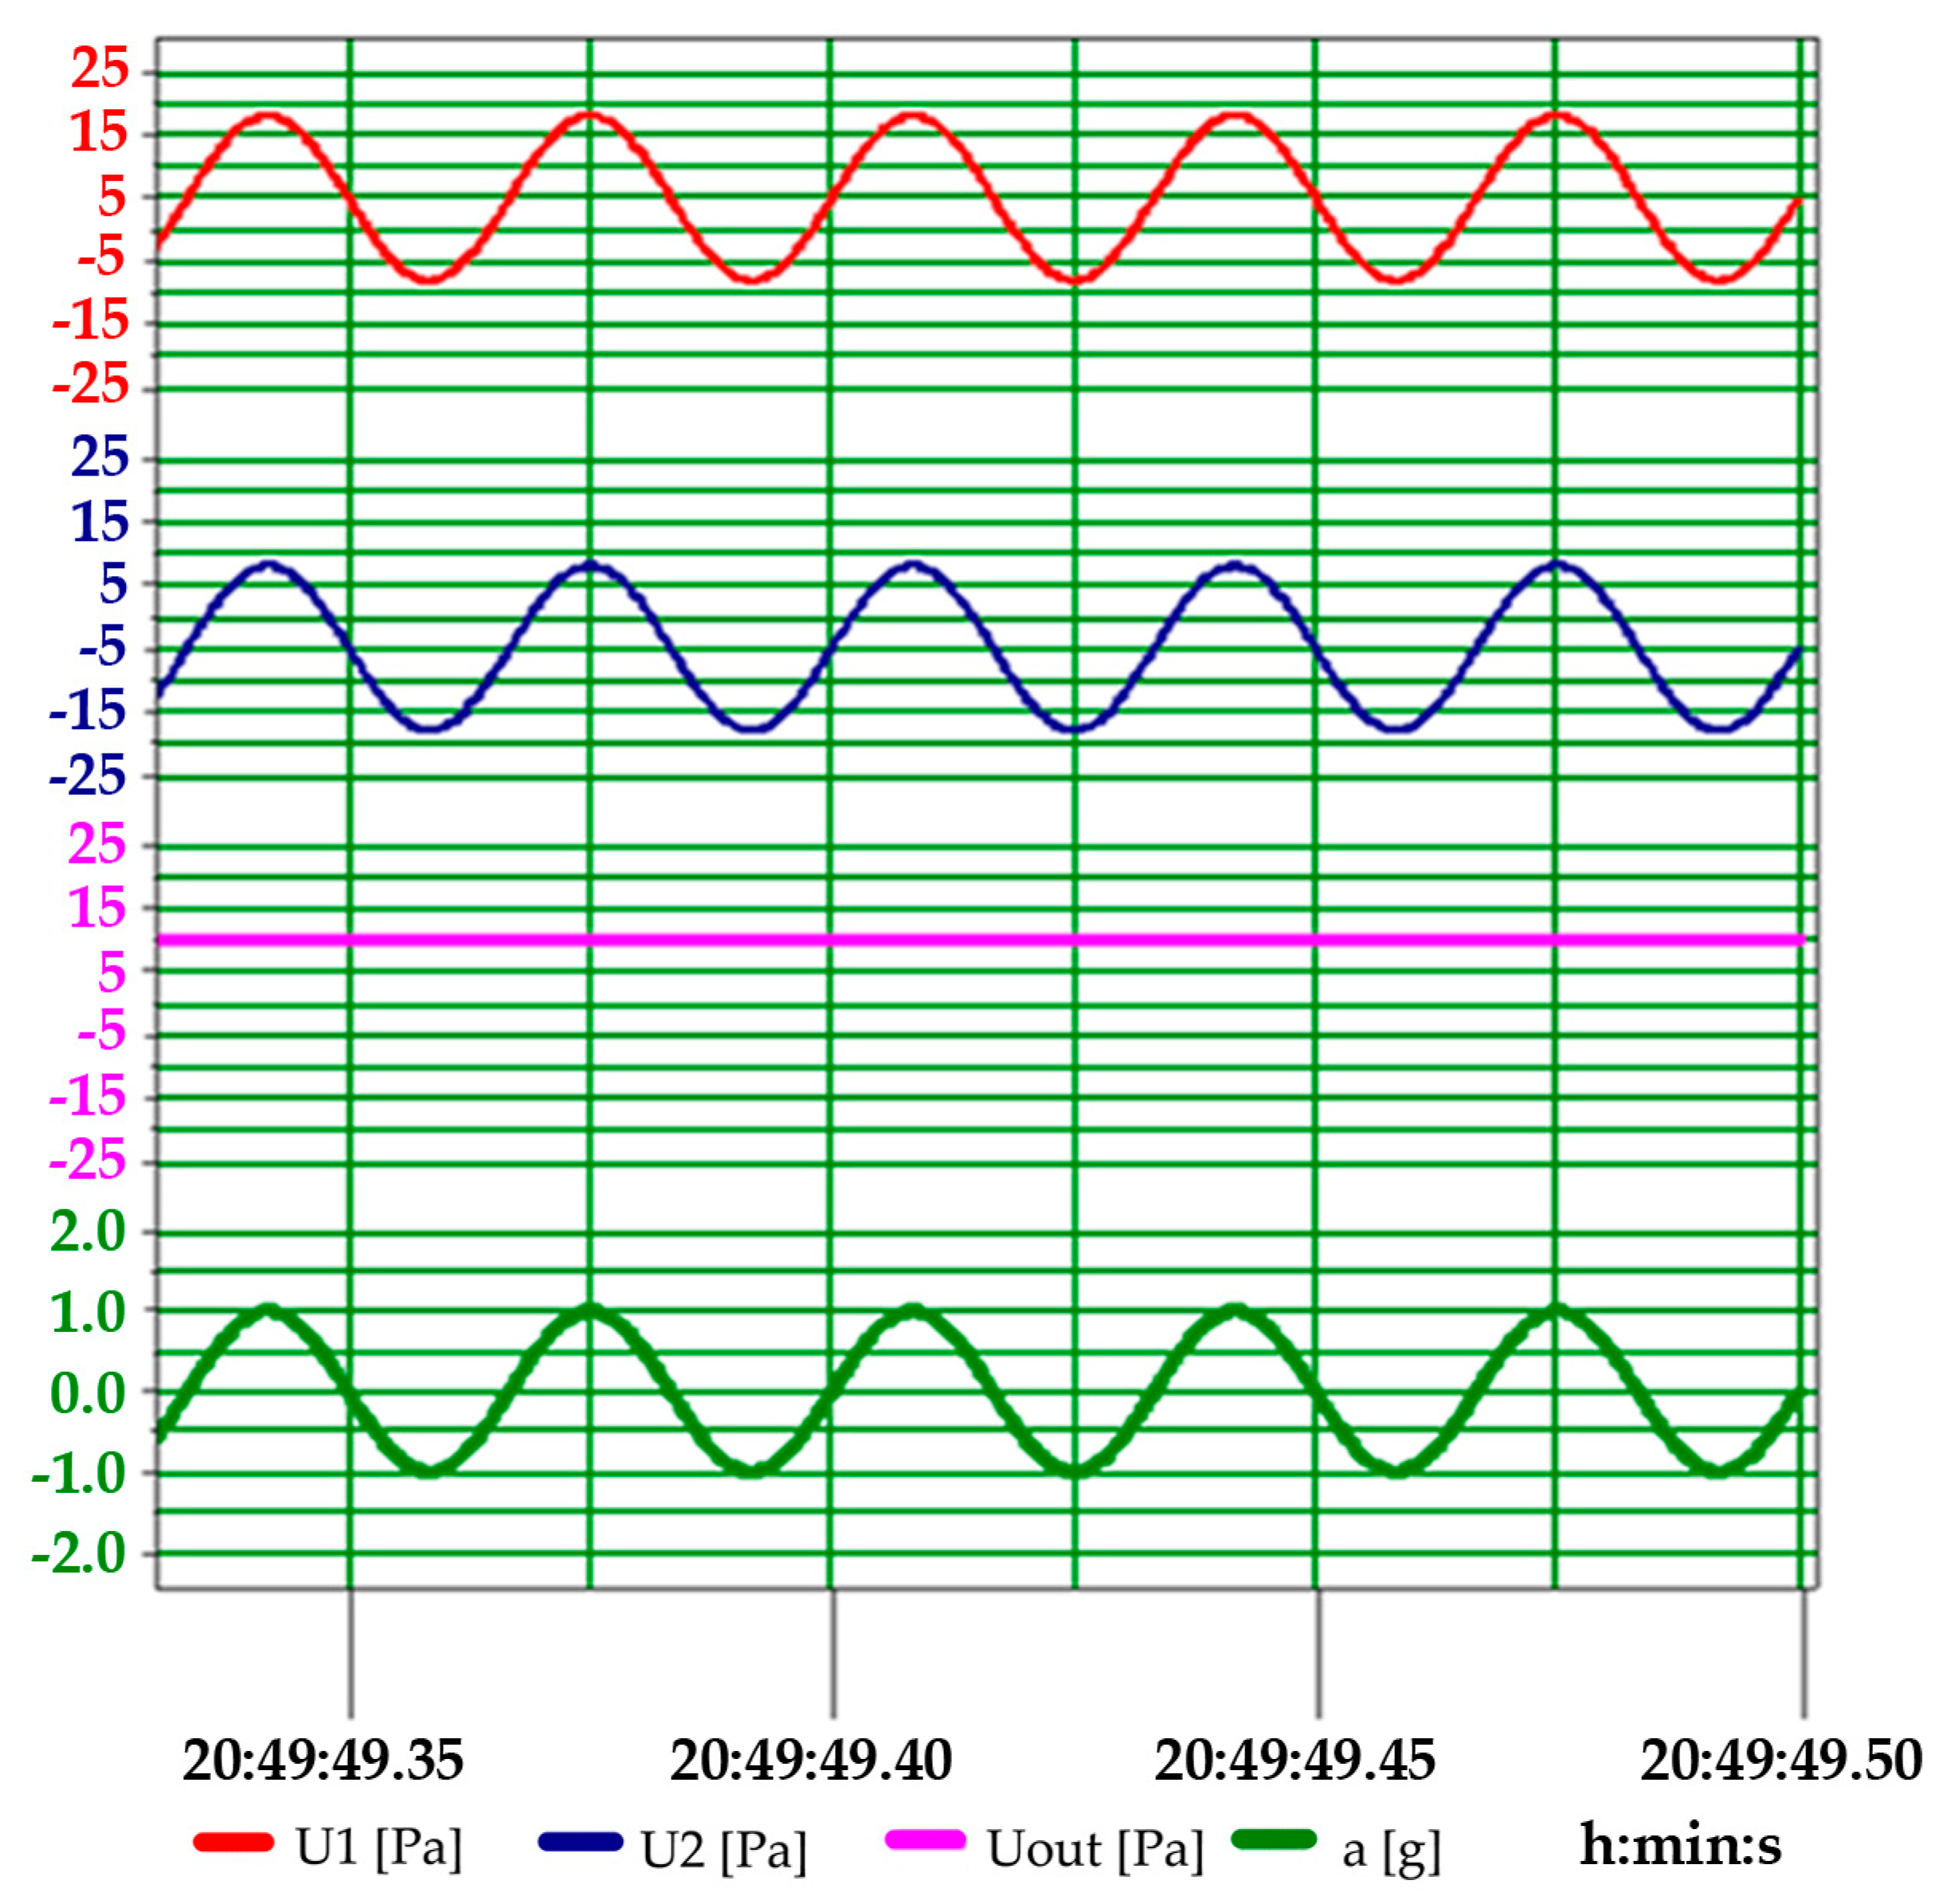
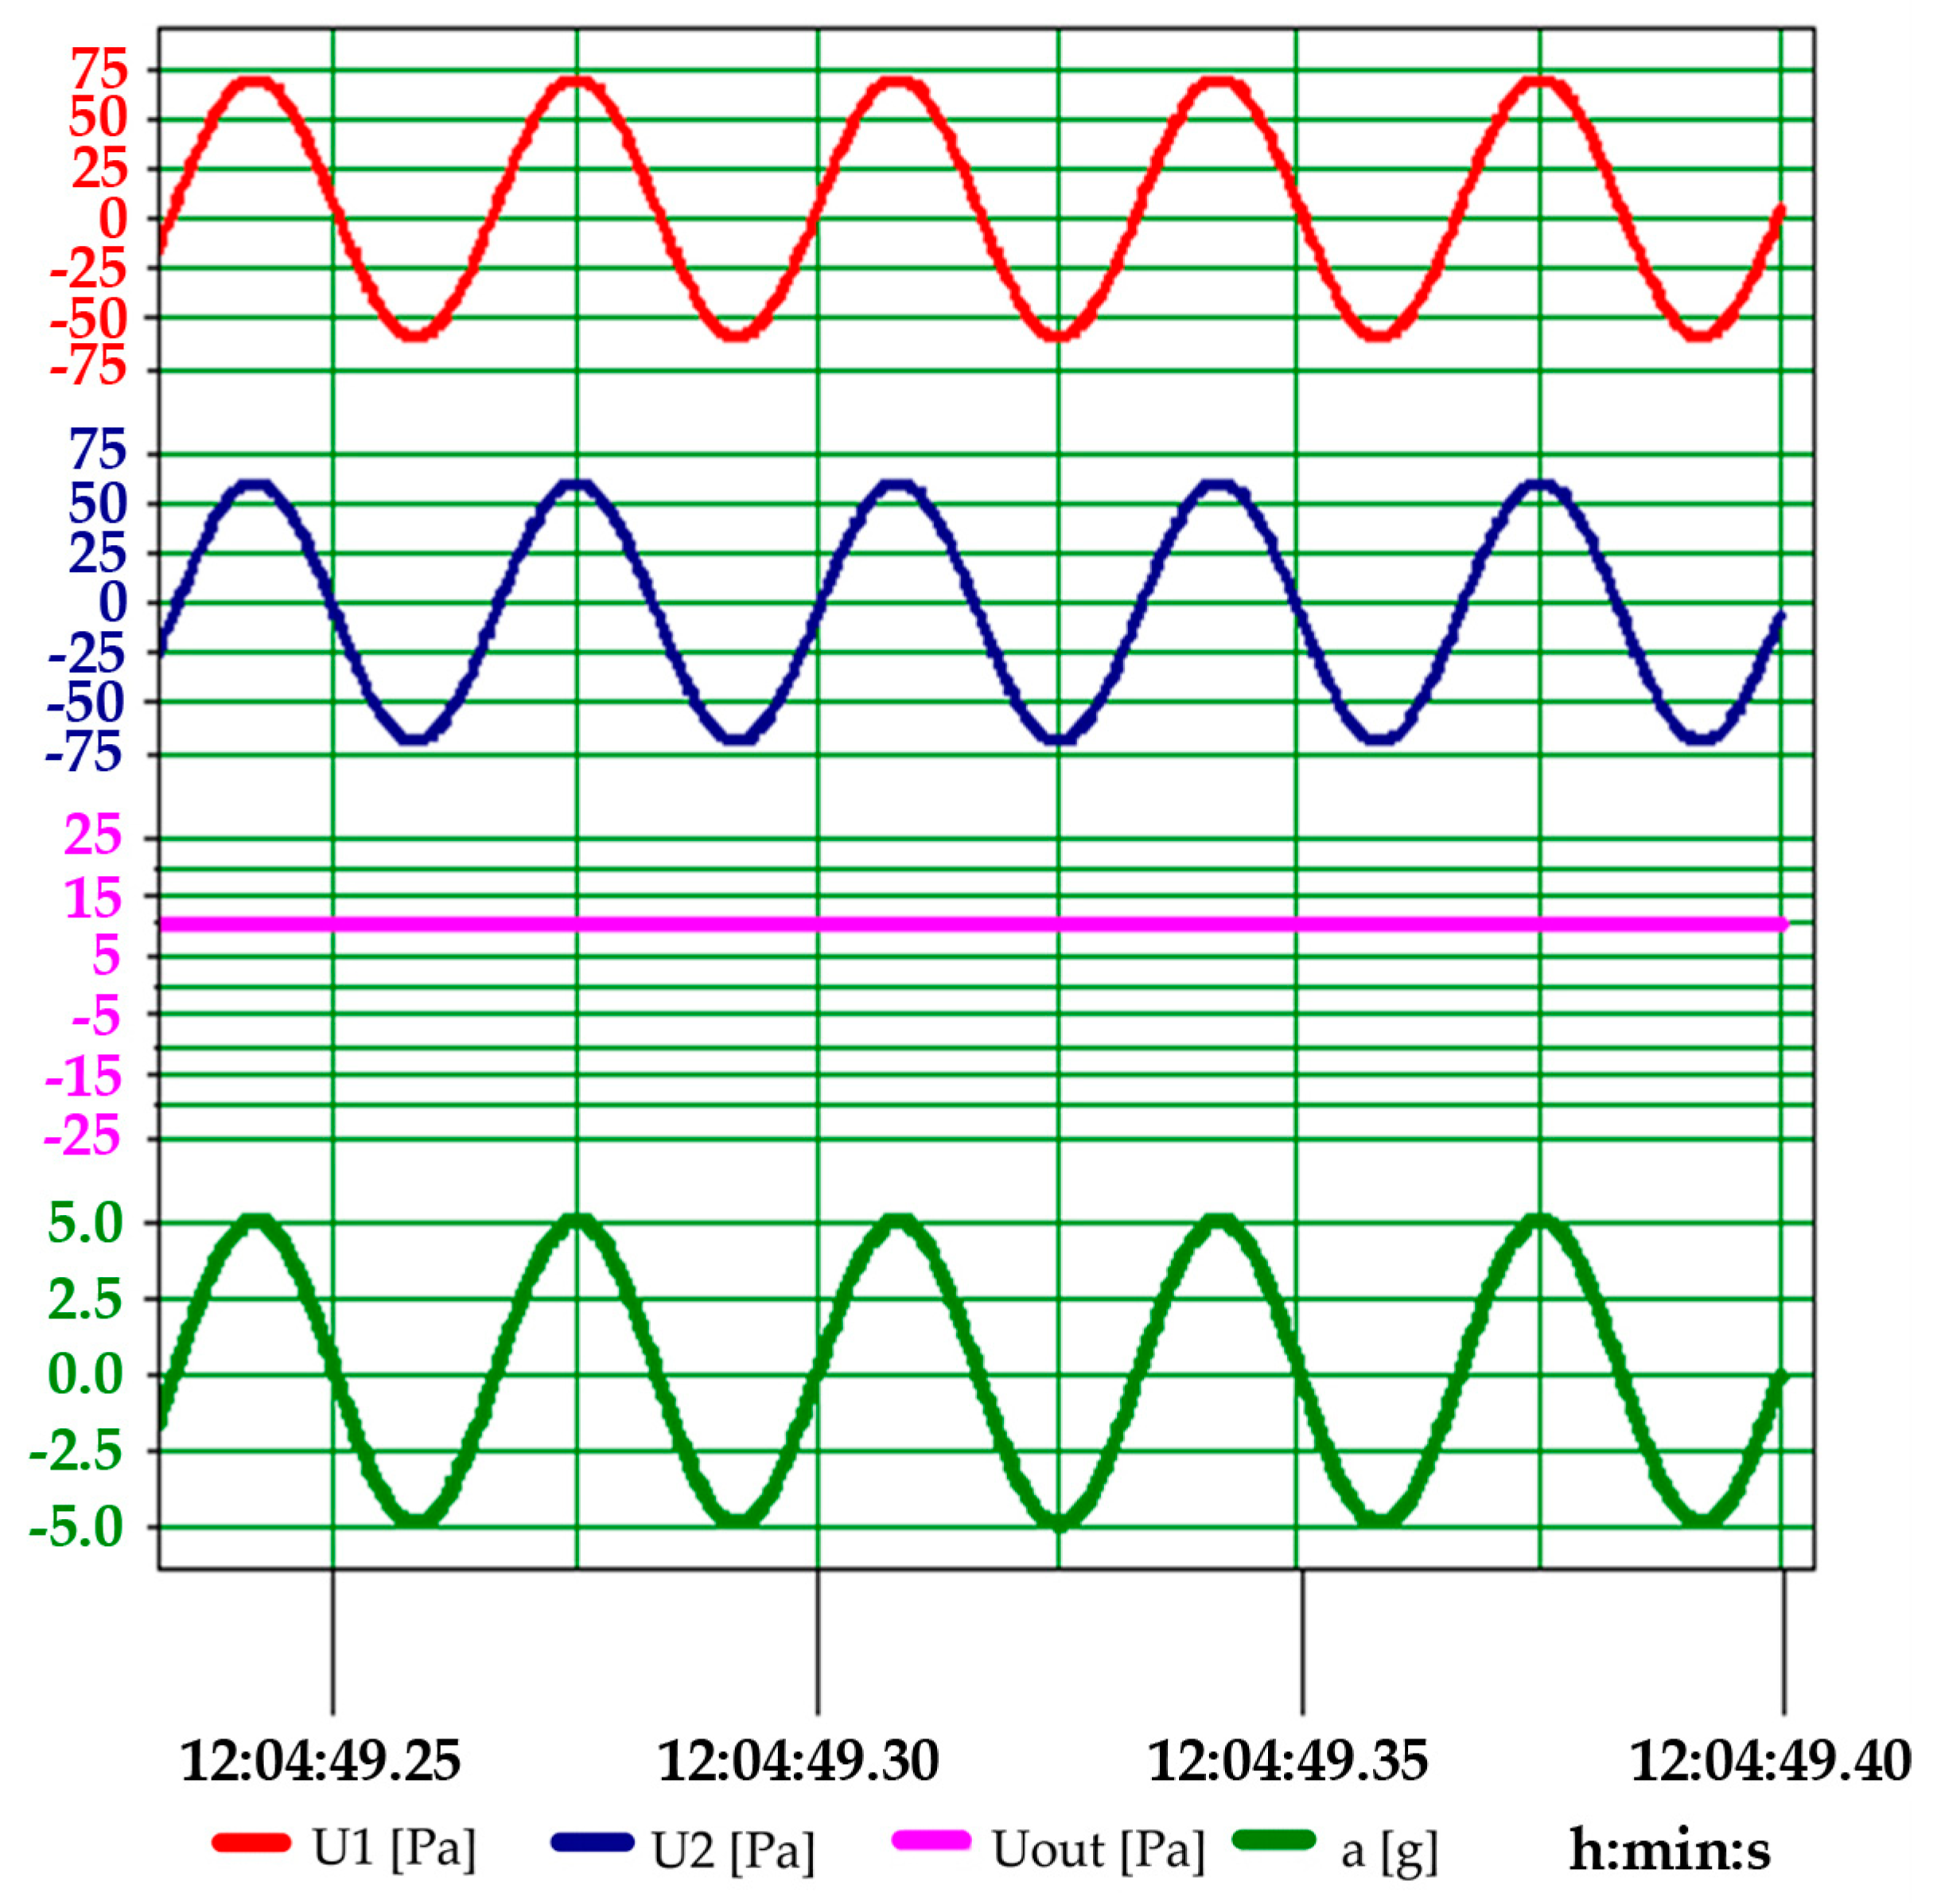
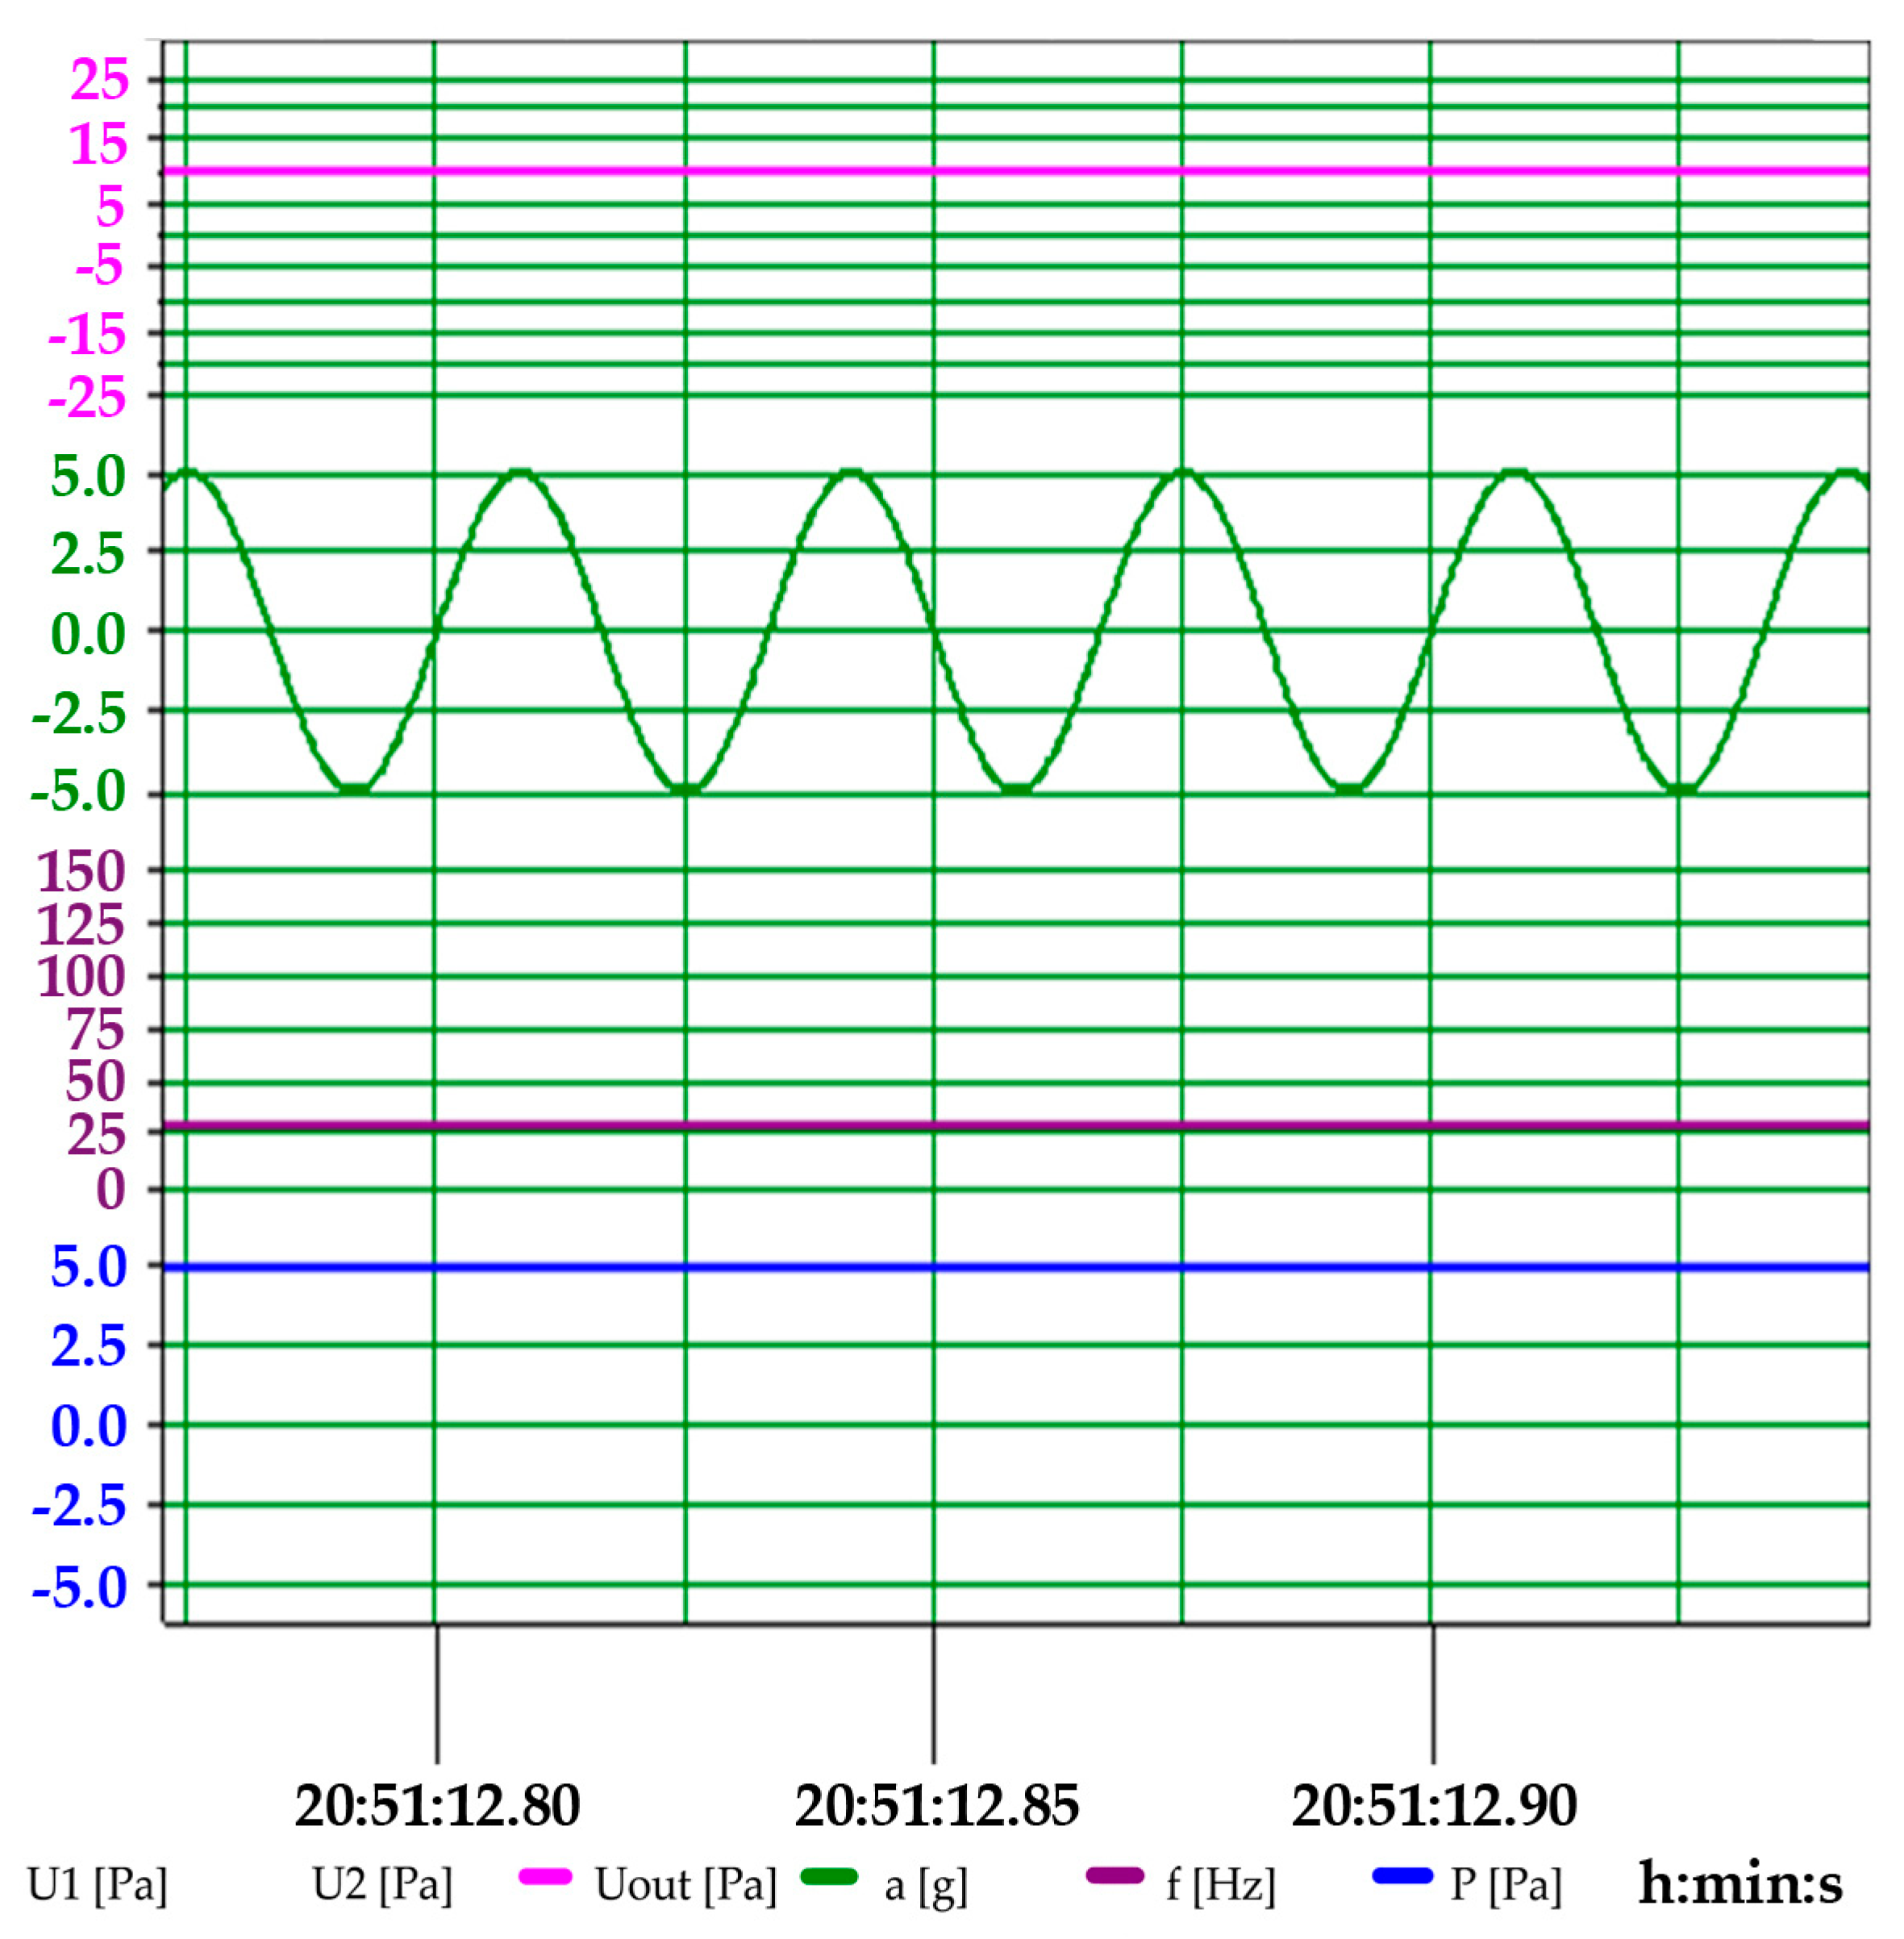
3. Acceleration-Insensitive Transducer Concept

Research on the errors that are caused by acceleration resulted in the proposal of a measurement methodology that utilized a hybrid system that consisted of two transducers, where one performed the task of acceleration compensation (described in [2]). The next stage was to develop the geometry of the transducer that was based on a double-membrane structure and was dedicated to be made piezoresistive with MEMS technology (as shown in Figure 11).
The basis of this construction was the labyrinth of channels (spaces p2 and p1) and two active identical measurement membranes (m1 and m2) as shown in Figure 12.
The output signal U1 from bridge m1 depended on pressure p1 (more precisely, on the pressure difference between the stub pipes of transducer p1 − p2) and the influence of the acceleration forces (as shown):
U 1 = k f ( Δ p ,   m g ,   m a ) ,
where:
  • U1—output signal, V;
  • k—amplification factor;
  • Δp—pressure difference, Pa;
  • m = mm + mz—mass of the membrane and gel separator, kg;
  • mm—mass of the membrane, kg;
  • mz—mass of the gel separator, kg;
  • g—gravitational acceleration; 9.81 ms−2;
  • a—acceleration of the moving sensor or the object with a sensor; ms−2.
The output signal U2 from bridge m2 depends on the pressure difference p1 − p2 (but with the opposite sign) and the influence of the acceleration forces (as shown):
U 2 = k f ( Δ p ,   m g ,   m a ) ,
where:
  • U2—output signal, V;
  • k—amplification factor;
  • −Δp—pressure difference, Pa;
  • m = mm + mz—mass of the membrane and gel separator, kg;
  • mm—mass of the membrane, kg;
  • mz—mass of the gel separator, kg;
  • g—gravitational acceleration; 9.81 ms−2;
  • a—acceleration of the moving sensor or the object with a sensor; ms−2.
Finally, a comparison of Equations (8) and (9) was obtained (as shown):
U = U 1 U 2 = k f [ ( 2 Δ p ;   ( m g ) ( m g ) ; ( m a ) ( m a ) ] = k 2 Δ p .  
The output signal represented by the differential Equation (10) depends only on the pressure difference and the constant k as the bridge gain. A very important assumption is that the mass of the gel separator should be applied in the same amount in each chamber. Then, the influence of acceleration will be eliminated in this configuration.

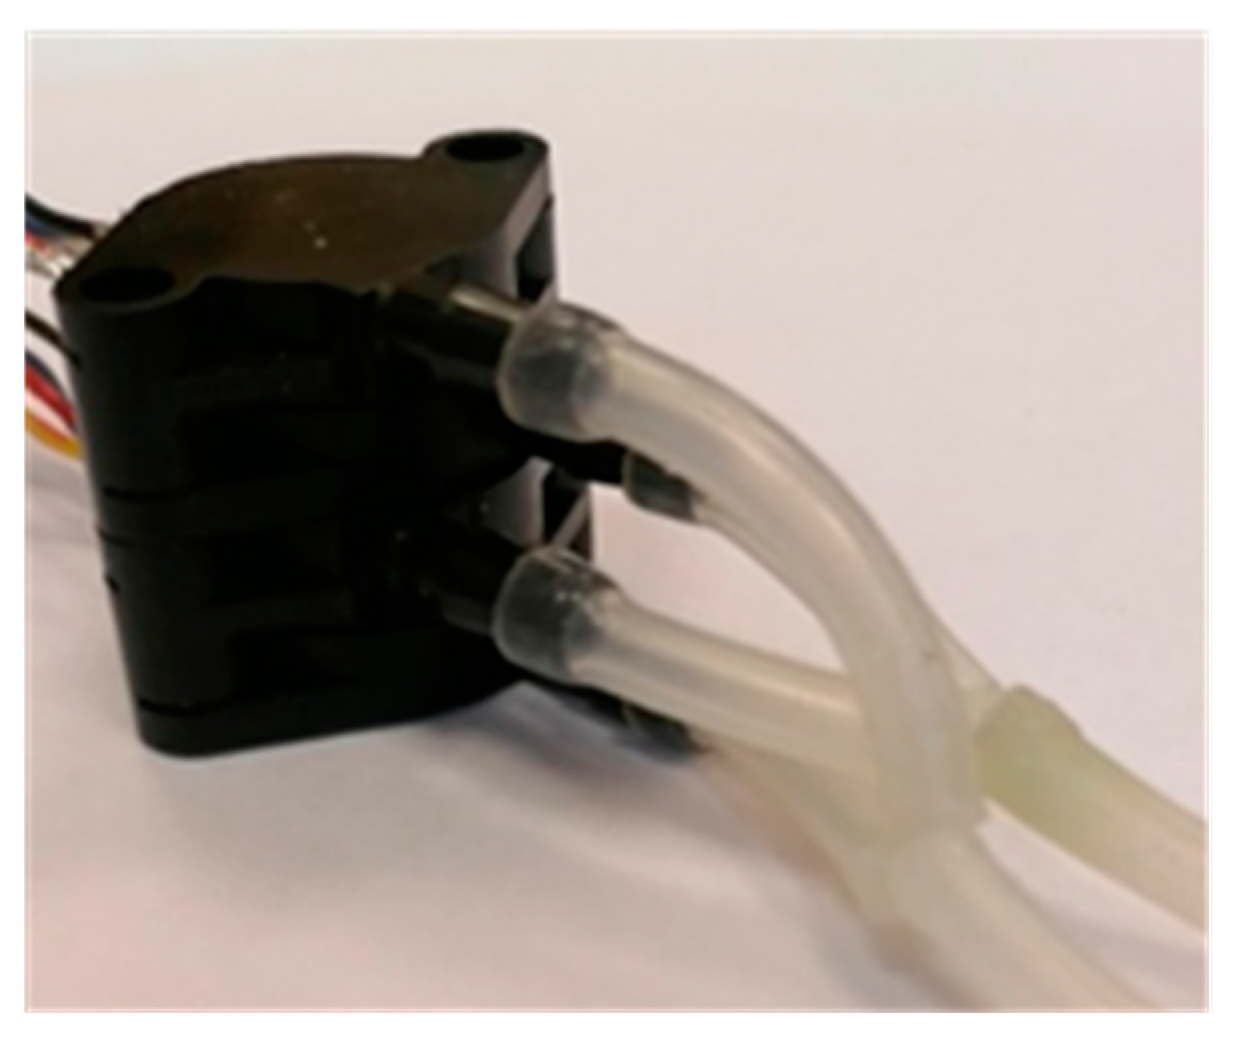
Results of Experiment with a Double-Membrane Sensor

In order to verify the practical correctness of the solution, a transducer that was composed of two single structures that were connected in such a way as to enable us to obtain the geometry of the proposed solution was prepared (as shown in Figure 13).
The system that is shown in Figure 4 and the electrodynamic exciter that is shown in Figure 7 were used for the tests (as in the previous series of experiments). The obtained results for several cases of exciting the acceleration and the excitation frequency values confirmed the correct operation of the transducer. An important issue was the proper connection of the pneumatic part, which was related to the parallel connection of the two structures. The “plus” pressure was connected from the m1 structure to the “minus” of the m2 structure, and the “minus” of the m1 structure was attached to the “plus” of the m2 structure. This connection method responded to the nature of the structure that is shown in Figure 11 and Figure 12. The waveforms of the excitation signals and output voltages U1; U2; and Uout (in the form of harmonic vibrations of acceleration) for the conducted experiments with the double-membrane transducer are shown in Figure 14, Figure 15 and Figure 16.
Figure 14 shows the results of the interaction of the signals from both structures for the excitation that originated in the vibrations from an acceleration of a = 1 g. The measured pressure took on the following value:
p1 − p2 = 0 Pa.
The obtained response signals at the output were as follows:
U1 = 13.2 Pa;
U2 = 13.2 Pa;
Uout = 0 Pa.
A differential signal was obtained from both structures (Uout = 0 Pa) both in terms of instantaneous values U(t) and RMS, as the reference (measured) pressure was equal to zero. It can be seen that the impact of the vibrations was smoothed over by the proposed solution.
Figure 15 shows the waveforms of the output signals from individual membranes U1 and U2 and total output signal Uout for a harmonic input of a = 1 g and the measured constant pressure of p = 5 Pa. The output signal from the transducer represented a double value of the pressure that was measured in accordance with Analytical Derivation Formula (10). Because of such a construction of the sensor, the influence of the accelerations was imperceptible (as it was in the classical system). This allowed us to draw conclusions regarding the actual elimination of those errors that were related to the generation of the output signal regardless of the acceleration value to which the sensor was subjected.
Figure 16 shows the waveforms of the output signals from individual membranes U1 and U2 and total output signal Uout for the harmonic with a = 5 g excitation. It can be seen that the pressure values from the individual membranes were modulated by the vibration signal changing its value within a range of −70 to 70 Pa, while the output signal from the transducer showed a constant value of 10 Pa. This was double the reference pressure of 5 Pa (as shown in Formula (10)).
Figure 16 shows no acceleration effect. As a result, the pressure value was doubled; so, the amplification factor k needed to ultimately be reduced to half so that the indicated pressure value was equal to the reference one.
Sensitivity analyses of the changes in the excitation frequencies were carried out within a frequency range of 0 to 120 Hz for the harmonic signal; within this range, no significant dependence of the frequency effect on the output signal for harmonic excitation was observed. This was fulfilled for the condition of ensuring a constant acceleration during the changes in the excitation frequency for a = const. The double-membrane structure compensated for this phenomenon.
Figure 17 presents the results of the transducer tests for the set pressure value from the pressure calibrator with a value of P = 5 Pa (blue line) for the amplitude and frequency of the set vibrations with values of a = 5 g (green line) and f = 30 Hz (purple line), respectively, in the form of graphs. The response of the transducer was Uout = 10 Pa (pink line). It can be seen from the graph that the vibrations to which the transducer was subjected did not affect the constant output signal. The output signal was equal to double the value of the measured pressure according to Equation (10).
Figure 18 presents the results of the transducer tests for the set pressure value from the pressure calibrator with a value of P = 25 Pa (blue line) for the amplitude and frequency of the set vibrations with values of a = 5 g (green line) and f = 30 Hz (purple line), respectively, in the form of graphs. The response of the transducer was Uout = 50 Pa (pink line). It can be seen from the graph that the vibrations to which the transducer was subjected did not affect the constant output signal. The output signal was equal to double the value of the measured pressure according to Equation (10).
Figure 19 presents the results of the transducer tests for the set pressure value from the pressure calibrator with a value of P = 50 Pa (blue line) for the amplitude and frequency of the set vibrations with values of a = 5 g (green line) and f = 30 Hz (purple line), respectively, in the form of graphs. The response of the transducer was Uout = 100 Pa (pink line). It can be seen from the graph that the vibrations to which the transducer was subjected did not affect the constant output signal. The output signal was equal to double the value of the measured pressure according to Equation (10).
Figure 20 presents the results of the transducer tests for the set pressure value from the pressure calibrator with a value of P = 50 Pa (blue line) for the amplitude and frequency of the set vibrations with values of a = 2 g (green line) and f = 10 Hz (purple line), respectively, in the form of graphs. The response of the transducer was Uout = 100 Pa (pink line). It can be seen from the graph that the vibrations to which the transducer was subjected did not affect the constant output signal. The output signal was equal to double the value of the measured pressure according to Equation (10).
Figure 21 presents the results of the transducer tests for the set pressure value from the pressure calibrator with a value of P = 50 Pa (blue line) for the amplitude and frequency of the set vibrations with values of a = 5 g (green line) and f = 50 Hz (purple line), respectively, in the form of graphs. The response of the transducer was Uout = 100 Pa (pink line). It can be seen from the graph that the vibrations to which the transducer was subjected did not affect the constant output signal. The output signal was equal to double the value of the measured pressure according to Equation (10).
From the conducted analyses, it can be concluded that the influence of the presence of the accelerations to which the transducer was subjected was eliminated in each of the presented cases of testing the analyzed concept of a double-membrane solution. In addition, the sensitivity of the solution was twice as high as the classic solution (which is an advantage for the device). This will allow for the use of the smaller amplification of the measurement path and, thus, reduce system noise.

4. Conclusions

The issue of the possibility of incorrectly processing measured pressure that is affected by the reactions to accelerations of a classical transducer for measurements of relatively small pressures is very important. The literature review that was carried out in the publication proved the lack of any current information on this subject.
This publication showed that the measured values that are derived from accelerations could be dimensionally greater than the measured pressure levels in the tests. Knowledge in this area is very important for researchers.
The proposed concept of a double-membrane system solution is addressed to the manufacturers of this technology and seems to be most appropriate (as was shown by the conducted research). In the research that was presented in this publication, modified transducers were used with success according to the presented concept.

Author Contributions

Conceptualization, Z.S.; methodology, Z.S., P.S. and K.S.; software, P.S. and Z.S.; validation, K.S., P.S., Z.S. and K.P.; formal analysis, Z.S., P.S. and K.S.; investigation, Z.S., P.S., K.S. and K.P.; resources, Z.S., P.S., K.S. and K.P.; data curation, Z.S. and P.S.; writing—original draft preparation, Z.S. and K.P.; writing—review and editing, K.P. and Z.S.; visualization, Z.S. and K.P.; supervision, Z.S. and K.P.; project administration, Z.S. All authors have read and agreed to the published version of the manuscript.

Funding

This research received no external funding.

Data Availability Statement

The datasets used and/or analyzed during the current study available from the corresponding author on reasonable request.

Conflicts of Interest

The authors declare no conflict of interest.

References

  1. Szczerba, Z.; Szczerba, P. Selected properties of modern pressure transducers. Electro Technical Rev. 2016, 1, 192–195. [Google Scholar] [CrossRef]
  2. Szczerba, Z.; Szczerba, P.; Szczerba, K. Sensitivity of Piezoresistive Pressure Sensors to Acceleration. Energies 2022, 15, 493. [Google Scholar] [CrossRef]
  3. Mazur, D.; Szczerba, Z.; Gołębiowski, L.; Smoleń, A.; Gołębiowski, M. Modeling and Analysis of the AFPM Generator in a Small Wind Farm System. In Methods and Techniques of Signal Processing in Physical Measurements; MSM 2018. Lecture Notes in Electrical Engineering; Hanus, R., Mazur, D., Kreischer, C., Eds.; Springer Nature: Basel, Switzerland, 2019; Volume 548, pp. 202–210. [Google Scholar] [CrossRef]
  4. Szczerba, Z.; Szczerba, P.; Szczerba, K. Differential Pressure Transducer Patent P—240391. Available online: https://ewyszukiwarka.pue.uprp.gov.pl/search/pwp-details/P.431352 (accessed on 1 January 2023).
  5. Szczerba, Z. Pressure Sensor and Pressure Measuring Method, Patent P-225030. Available online: https://ewyszukiwarka.pue.uprp.gov.pl/search/pwp-details/P.406992?lng=Pl (accessed on 1 January 2023).
  6. August, R.; Maudie, T.; Miller, T.F.; Thompson, E. Acceleration sensitivity of micromachined pressure sensors. Proc. SPIE 3876 Micromachined Devices Compon. 1999, 46–53. [Google Scholar] [CrossRef]
  7. Bao, M.H. Micro Mechanical Transducers. Handbook of Sensors and Actuators; Elsevier: Amsterdam, The Netherlands, 2000; ISBN 9780080524030/9780444505583. [Google Scholar]
  8. Bishop, R.H. The Mechatronics Handbook; The University of Texas at Austin: Austin, TX, USA, 2002; ISBN 0-8493-0066-5. [Google Scholar]
  9. Büttgenbach, S.; Constantinou, I.; Dietzel, A.; Leester-Schädel, M. Case Studies in Micromechatronics; Springer: Cham, Switzerland, 2020; ISBN 978-3-662-61319-1/978-3-662-61320-7. [Google Scholar]
  10. Changzheng, W.; Wei, Z.; Quan, W.; Xiaoyuan, X.; Xinxin, L. TPMS (tire-pressure monitoring system) sensors: Monolithic integration of surface-micromachined piezoresistive pressure sensor and self-testable accelerometer. Microelectron. Eng. 2012, 91, 167–173. [Google Scholar]
  11. Dhanaselvam, P.S.; Kumar, D.S.; Ramakrishnan, V.N.; Ramkumar, K.; Balamurugan, N.B. Pressure Sensors Using Si/ZnO Heterojunction Diode. Silicon 2021, 14, 4121–4127. [Google Scholar] [CrossRef]
  12. Gao, L.; Wang, M.; Wang, W.; Xu, H.; Wang, Y.; Zhao, H.; Cao, K.; Xu, D.; Li, L. Highly Sensitive Pseudocapacitive Iontronic Pressure Sensor with Broad Sensing Range. Nano-Micro Lett. 2021, 13, 1–14. [Google Scholar] [CrossRef]
  13. Jiang, B.; Xing-lin, Q.; Jiakai, L.; Bo, J. Design of Piezoresistive MEMS Pressure Sensor Chip for Special Environments. Sens. Transducers IFSA 2014, 174, 1. [Google Scholar]
  14. Kordrostami, Z.; Hassanli, K.; Akbarian, A. MEMS piezoresistive pressure sensor with patterned thinning of diaphragm. Microelectron. Int. 2020, 37, 147–153. [Google Scholar] [CrossRef]
  15. Palczynska, A.; Gromala, P.J.; Mayer, D.; Han, B.; Melz, T. In-situ investigation of EMC relaxation behavior using piezoresistive stress sensor. Microelectron. Reliab. 2016, 62, 58–62. [Google Scholar] [CrossRef]
  16. Nag, M.; Kumar, A.; Pratap, B. A novel graphene pressure sensor with zig–zag shaped piezoresistors for maximum strain coverage for enhancing the sensitivity of the pressure sensor. Int. J. Simul. Multidiscip. Des. Optim. 2021, 12, 14. [Google Scholar] [CrossRef]
  17. Menna, F.; Nocerino, E.; Chemisky, B.; Remondino, F.; Drap, P. Accurate scaling and levelling in underwater photogrammetry with a pressure sensor. ISPRS—Int. Arch. Photogramm. Remote. Sens. Spat. Inf. Sci. 2021, XLIII-B2-2, 667–672. [Google Scholar] [CrossRef]
  18. Ni, Z.; Yang, C.; Xu, D.; Zhou, H.; Zhou, W.; Li, T.; Xiong, B.; Li, X. Monolithic Composite “Pressure + Acceleration + Temperature + Infrared” Sensor Using a Versatile Single-Sided “SiN/Poly-Si/Al” Process-Module. Sensors 2013, 13, 1085–1101. [Google Scholar] [CrossRef] [Green Version]
  19. Ouyang, H.; Li, Z.; Gu, M.; Hu, Y.; Xu, L.; Jiang, D.; Cheng, S.; Zou, Y.; Deng, Y.; Shi, B.; et al. A Bioresorbable Dynamic Pressure Sensor for Cardiovascular Postoperative Care. Adv. Mater. 2021, 33. [Google Scholar] [CrossRef]
  20. Raab, C.; Rohde-Brandenburger, K. Dynamic flight load measurements with MEMS pressure sensors. CEAS Aeronaut. J. 2021, 12, 737–753. [Google Scholar] [CrossRef]
  21. Rónai, L.; Lénárt, J.; Szabó, T. Development of a Low-cost Pressure Sensor. Int. J. Eng. Manag. Sci. 2020, 5, 33–38. [Google Scholar] [CrossRef]
  22. Wang, J.; Xia, X.; Li, X. Monolithic Integration of Pressure Plus Acceleration Composite TPMS Sensors with a Single-Sided Micromachining Technology. J. Microelectromechanical Syst. 2011, 21, 284–293. [Google Scholar] [CrossRef]
  23. Wilson, J.S. Sensor Technology Handbook; Elsevier: Amsterdam, The Netherlands, 2005; ISBN 0-7506-7729-5. [Google Scholar]
  24. Xu, F.; Ma, T. Modeling and Studying Acceleration-Induced Effects of Piezoelectric Pressure Sensors Using System Identification Theory. Sensors 2019, 19, 1052. [Google Scholar] [CrossRef] [Green Version]
  25. Xu, J.; Zhao, Y.; Jiang, Z.; Sun, J. A monolithic silicon multi-sensor for measuring three-axis acceleration, pressure and temperature. J. Mech. Sci. Technol. 2008, 22, 731–739. [Google Scholar] [CrossRef]
  26. Kapuscinski, T.; Szczerba, P.; Rogalski, T.; Rzucidlo, P.; Szczerba, Z. A Vision-Based Method for Determining Aircraft State during Spin Recovery. Sensors 2020, 20, 2401. [Google Scholar] [CrossRef]
  27. Rzasa, M.; Czapla-Nielacna, B. Analysis of the Influence of the Vortex Shedder Shape on the Metrological Properties of the Vortex Flow Meter. Sensors 2021, 21, 4697. [Google Scholar] [CrossRef]
  28. Tomaszewska-Wach, B.; Rzasa, M. A Correction Method for Wet Gas Flow Metering Using a Standard Orifice and Slotted Orifices. Sensors 2021, 21, 2291. [Google Scholar] [CrossRef] [PubMed]
  29. Mariello, M.; Blad, T.; Mastronardi, V.; Madaro, F.; Guido, F.; Staufer, U.; Tolou, N.; De Vittorio, M. Flexible piezoelectric AlN transducers buckled through package-induced preloading for mechanical energy harvesting. Nano Energy 2021, 85, 105986. [Google Scholar] [CrossRef]
  30. Pytel, K.; Szczerba, Z.; Farmaha, I.; Kurdziel, F.; Kalwar, A.; Gumula, S. Acquisition of Signals in a Wind Tunnel Using the Dasylab Software Package. In Proceedings of the 2020 IEEE XVIth International Conference on the Perspective Technologies and Methods in MEMS Design (MEMSTECH), Lviv, Ukraine, 22–26 April 2020. [Google Scholar] [CrossRef]
  31. Pytel, K.; Hudy, W.; Kurdziel, F.; Kalwar, A.; Gumula, S.; Soliman, M.H. Application of Correlation Analysis for Impact Assessment of Air Quality on the Possibility of Using Chosen Source of Renewable Energy. In Proceedings of the 2020 IEEE XVIth International Conference on the Perspective Technologies and Methods in MEMS Design (MEMSTECH), Lviv, Ukraine, 22–26 April 2020. [Google Scholar] [CrossRef]
  32. Pytel, K.; Marikutsa, U.; Szczerba, Z.; Kurdziel, F.; Kalwar, A.; Soliman, M.H. Application of Information Technology Engineering Tools to Simulate an Operation of a Flow Machine Rotor. In Proceedings of the 2020 IEEE XVIth International Conference on the Perspective Technologies and Methods in MEMS Design (MEMSTECH), Lviv, Ukraine, 22–26 April 2020. [Google Scholar] [CrossRef]
  33. Hudy, W.; Piaskowska-Silarska, M.; Pytel, K.; Gumula, S.; Marikutsa, U.; Farmaha, I. Application of evolutionary algorithms to analysis the possibilities of wind energy use. In Proceedings of the 2019 20th International Carpathian Control Conference (ICCC), Krakow-Wieliczka, Poland, 26–29 May 2019. [Google Scholar] [CrossRef]
Figure 1. Functional diagram of classic pressure transducer: S—elastic membrane; Fp—pneumatic force; Fa—dynamic acceleration force; β—angle between the membrane and dynamic acceleration force; Fg—membrane weight; α—angle between the membrane and membrane weight; p1—pressure applied to the pressure side; p2—pressure applied to the vacuum side.
Energies 16 03040 g001
Figure 2. MEMS technology pressure sensor cross-section: a—protective gel cover; b—silicon membrane; c—metal part of the cover; d—main cover; e—measuring the structural place of the attachment; f—signal output; g—pins [2].
Energies 16 03040 g002
Figure 3. Compiled measuring system: (a) completed DaqBook 2001 measurement computing system equipped with expansion cards; (b) transducer test block diagram for harmonic excitations (K—FLUKE718 1G pressure calibrator; W—adjustable vibrating table; A—ADXL accelerometer; C—tested transducer; S—DaqBook 2001 measurement system + DBK41 expansion module + DBK16 strain gage expansion card + DBK80 differential voltage input card with excitation; PC—computer with DasyLab 2020 software).
Energies 16 03040 g003
Figure 4. Diagram of program that controlled the Daqbook 2001 system.
Energies 16 03040 g004
Figure 5. Sensor positioning scheme for testing the effect of static acceleration on the output signal from the transducer: (a) position indicating zero effect of static acceleration on the membrane structure; (b) position representing a 90 degree change in the position of the transducer (indicating a maximum effect of static acceleration on the diaphragm structure).
Energies 16 03040 g005
Figure 6. Waveform of the output signal from the transducer as a function of static excitation.
Energies 16 03040 g006
Figure 7. Electrodynamic exciter for testing the influence of dynamic acceleration.
Energies 16 03040 g007
Figure 8. Waveforms of experimental values of acceleration (a), pressure (p), and output signal (Uout) for dynamic acceleration with vibrations and with an amplitude of 1 g and a frequency of f = 10 Hz.
Energies 16 03040 g008
Figure 9. Waveforms of the experimental values of acceleration (a), pressure (p), and output signal (Uout) for dynamic acceleration with vibrations and with an amplitude of 1 g, frequency of f = 30 Hz, and pressure excitation of p = 5 Pa.
Energies 16 03040 g009
Figure 10. Waveforms of the experimental values of acceleration (a), pressure (p), and output signal (Uout) for dynamic acceleration with vibrations and with an amplitude of 5 g, frequency of f = 10 Hz, and pressure excitation of p = 5 Pa.
Energies 16 03040 g010
Figure 11. Acceleration-free transducer geometry [4].
Energies 16 03040 g011
Figure 12. Deformation of membranes for the occurrence of pressure difference p1 > p2 and for the occurrence of forces from acceleration.
Energies 16 03040 g012
Figure 13. Completed double-membrane sensor.
Energies 16 03040 g013
Figure 14. Waveforms of the experimental values of acceleration (a), pressure (p), and output signals (U1; U2; Uout) for dynamic acceleration with vibrations and with an amplitude of 1 g, frequency of f = 30 Hz, and pressure excitation of p = 0 Pa for the double-membrane transducer.
Energies 16 03040 g014
Figure 15. Waveforms of the experimental values of acceleration (a), pressure (p), and output signals (U1; U2; Uout) for dynamic acceleration with vibrations and with amplitude of 1 g, frequency of f = 30 Hz, and pressure excitation of p = 10 Pa for double-membrane transducer.
Energies 16 03040 g015
Figure 16. Waveforms of the experimental values of acceleration (a), pressure (p), and output signals (U1; U2; Uout) for dynamic acceleration with vibrations and with an amplitude of 1 g, frequency of f = 30 Hz, and pressure excitation of p = 5 Pa for the double-membrane transducer.
Energies 16 03040 g016
Figure 17. Waveforms of the experimental values of acceleration (a), pressure (p), and output signal (Uout) for dynamic acceleration with vibrations and with an amplitude of 5 g, frequency of f = 30 Hz, and pressure excitation of p = 5 Pa for the double-membrane transducer.
Energies 16 03040 g017
Figure 18. Waveforms of the experimental values of acceleration (a), pressure (p), and output signal (Uout) for dynamic acceleration with vibrations and with an amplitude of 5 g, frequency of f = 30 Hz, and pressure excitation of p = 25 Pa for the double-membrane transducer.
Energies 16 03040 g018
Figure 19. Waveforms of the experimental values of acceleration (a), pressure (p), and output signal (Uout) for dynamic acceleration with vibrations and with an amplitude of 5 g, frequency of f = 30 Hz, and pressure excitation of p = 50 Pa for the double-membrane transducer.
Energies 16 03040 g019
Figure 20. Waveforms of the experimental values of acceleration (a), pressure (p), and output signal (Uout) for dynamic acceleration with vibrations and with an amplitude of 2 g, frequency of f = 10 Hz, and pressure excitation of p = 50 Pa for the double-membrane transducer.
Energies 16 03040 g020
Figure 21. Waveforms of the experimental values of acceleration (a), pressure (p), and output signal (Uout) for dynamic acceleration with vibrations and with an amplitude of 5 g, frequency of f = 50 Hz, and pressure excitation of p = 50 Pa for the double-membrane transducer.
Energies 16 03040 g021
Disclaimer/Publisher’s Note: The statements, opinions and data contained in all publications are solely those of the individual author(s) and contributor(s) and not of MDPI and/or the editor(s). MDPI and/or the editor(s) disclaim responsibility for any injury to people or property resulting from any ideas, methods, instructions or products referred to in the content.

