Article

Enhancing User Engagement in Local Energy Initiatives Using Smart Local Energy Engagement Tools: A Meta Study

Low Carbon Building Research Group, School of Architecture, Oxford Brookes University, Headington Campus, Oxford OX3 0BP, UK
*
Author to whom correspondence should be addressed.
Energies 2023, 16(7), 3037; https://doi.org/10.3390/en16073037
Submission received: 9 February 2023 / Revised: 18 March 2023 / Accepted: 23 March 2023 / Published: 27 March 2023

Abstract

:
Deploying smart local energy engagement tools (SLEETs) in local energy projects enables users to better observe and control energy, and potentially become active participants in local energy management. Using a cross-project approach, this paper examines the prevalence, effectiveness and inclusiveness of 84 SLEETs deployed in 72 local energy projects in the UK from 2008 to 2018. An original framework for the characterisation of SLEETs was employed, which grouped them into seven types and characterised them in terms of their level of interaction and interface design. Our study shows that information-driven tools were the most popular in community energy groups, while digital energy platforms or interaction tools with numeric interfaces were the most popular in smart local energy system (SLES) initiatives. In contrast, interaction tools with visual interfaces, and tools offering control were found to be less popular. Spatial analysis revealed that SLEETs were mostly deployed in areas with grid constraints (technology), active community energy groups (people) and engaged local authorities (policy). Effective SLEETs were found to stimulate engagement amongst people (social engagement), and between people and technology (operation and control), while inclusive SLEETs enabled the inclusion of vulnerable and low-income households. The acceptance and implementation of SLES initiatives can be enhanced by creating effective and inclusive SLEETs that align with local users’ requirements and are supported by local stakeholders in order to foster trust. In future, there is a need to develop appropriate metrics (key performance indicator) or scoring methods to measure the prevalence, effectiveness, and inclusiveness of SLEETs in a consistent manner.

1. Introduction

The UK government has committed to a net-zero emissions target by 2050 [1], in order to address the growing concerns related to the climate emergency, by limiting the global temperature rise to 1.5 °C [2,3]. To meet its long-term carbon emissions reduction plan, the UK energy system is going through rapid change, becoming decarbonised, decentralised and digitised [4,5]. Local energy initiatives, whether they are community energy (CE), local energy (LE) or smart local energy system (SLES) initiatives, can help to meet this obligation by delivering cleaner and cheaper energy services. They can also help to accelerate the energy transition by enhancing user engagement with the support of smart (digital) tools [6]. In response to changing policy and with the development of technological innovations, the community energy sector in the UK has experienced rapid change. This showed a comparative upturn in 2019 [7] with the majority of initiatives, including Community Benefit Societies (47%) and Community Interest Companies (CIC) (11%), focusing on energy generation, low-carbon transport, energy storage and energy efficiency. CE initiatives include shared community actions to generate, manage, reduce and purchase local renewable energy [8], and emphasise community ownership, leadership and control [9]. However, LE initiatives play a key role in the transformation of local energy systems through public–private partnership and with the active participation of local authorities, driven by local economic growth, job creation and skill development [10] through local energy generation, storage and distribution [2]. In contrast, SLES initiatives enable public and private organisations to develop smart technologies by addressing local energy issues, which can intelligently and locally link energy supply, storage and use. These can then be used along with power, heating and transport, in ways that dramatically improve energy efficiency and reduce energy costs to create more resilient communities through the innovative and smart (digital) use of data in energy systems [11].
Deploying smart local energy engagement tools (SLEETs) in such local energy projects enables users to better observe and control energy, and change their energy use behaviour while becoming active participants in local energy management. This can potentially reduce carbon emissions and align energy demand and supply [12]. SLEETs are not only technical devices, but also offer a means of interaction between the following actors: people and people, for social engagement [13]; people and technology, for operation and control [14]; and technologies and technologies, for connectivity and communication [15]. SLEETs can be effective in enabling reductions in energy use, carbon and cost, while improving user engagement [16,17,18] and empowering users to participate in local energy markets and interact with neighbours in order to exchange energy.
User engagement is a key factor in the deployment of SLEETs, as identified by Balta-Ozkan, Davidson [19] and Gangale, and Mengolini [20], and so the organisation offering the SLEETS can have a great impact on how they are received. However, users have low levels of trust in utilities and rarely engage in energy projects with them. A survey conducted by Koirala and Araghi [21] on 956 participants, conducted in order to identify the impact of user trust on participation in community energy systems projects, revealed that community trust plays a vital role in user engagement. This was followed by community resistance, energy independence, and environmental concerns, as well as energy-related education and awareness about local energy initiatives [21]. Such concerns can be overcome if SLEETs are delivered through local and trusted organisations, such as local authorities and local community groups, and use appropriate user engagement methods. Local government and local organisations are highly trusted by local people [22], making it easier for users to accept new energy interventions when delivered through these reliable bodies. Such trustworthy intermediaries could develop new technology that is tailored to users’ needs, including those of vulnerable users and those on low incomes, in order to ensure the fair distribution of benefits generated by new interventions at a local scale. Despite the growing interest in SLEETs, comprehensive studies that investigate the various types of SLEETs deployed in local energy projects and that examine how effective and inclusive they are in engaging users by setting out standard criteria are lacking.
This paper examines the prevalence, effectiveness and inclusiveness of SLEETs deployed in local energy projects undertaken in the UK from 2008 to 2018 using a meta-study (cross-project) approach and a statistical analysis of the meta-data gathered. The experience gained from this study in the UK can be applied to other developed countries that are currently deploying smart tools in local energy projects. The study begins with an assessment of the prevalence of SLEETs in the UK in order to indicate how widespread they have become across the country in recent years. This is used to highlight which areas have a greater level of activity in deploying SLEETs, along with the reasons why. The study also evaluates the effectiveness and inclusiveness of SLEETs in identifying how user attitudes, requirements and socio-economic benefits have been accounted for in delivering smart energy interventions designed to bring a meaningful change to support the net-zero emissions targets, and achieve the UN Sustainable Development Goals (SDGs). These goals include delivering affordable and clean energy for all, taking climate action and establishing sustainable cities and communities. Such an investigation can help to bridge the knowledge gap regarding the acceptance of SLEETs by answering questions regarding how valuable and usable SLEETs are in supporting users to become active participants in managing and controlling energy. It looks at how they become active participants in the energy market, and how to ensure SLEETs are deployed in a socially responsible manner. The learning from this study can be used to inform the next generation of SLES initiatives in which the UK government might invest in order to meet the carbon emissions plan, as well as to inform future local energy projects in developed countries that implement the same energy interventions to tackle climate change.

2. Background on SLEETs

2.1. Characteristics of SLEETs

In this paper, SLEETs are categorised into seven groups of digital tools (Table 1) based on the type of communications offered; these were identified through the meta-data gathered as a part of this study on local energy projects. These were grouped into three forms of communication: information-driven, interaction and control communication.

2.1.1. Information-Driven

Information-driven tools support users in monitoring energy-related data and provide feedback to users with numeric or visual interfaces, which include in-home displays (IHDs), thermal imaging and spatial mapping tools [23,24,30,31,53,54]. An effective feedback method is crucial to encouraging users in their decision-making process, to changing their behaviour in terms of their energy use in order to save energy costs [18] and allowing users to contribute to local energy plans. IHD, as one type of information-driven tool, provides real-time energy feedback in a numeric format, thus allowing users to notice sudden spikes in energy use, energy costs and carbon emissions. Schultz and Estrada [25] studied the impact of providing energy feedback through IHDs on users’ energy use in 393 single-family homes in South California, and identified that providing energy feedback via IHD could reduce households’ energy use up to 9%; this was because users became more responsible when consuming energy by understanding the spikes that affect energy costs. Darby and Liddell [26] identified that the smart meter roll-out in the UK, along with deployment of IHDs in the domestic sector, could improve user engagement with local energy projects and encourage them to reduce energy use. Although implementing such technology supports reductions in energy use and energy costs, it does not enable users to bring about meaningful change in their behaviour by managing and controlling the energy services, and users may stop using feedback tools after a while due to a lack of this ability.
Information-driven tools with a visual interface can also encourage user engagement, as identified in a study carried out by Boomsma and Goodhew [32] in Cornwall within the Eden Project. The project revealed that householders were more likely to improve their energy efficiency measures when they received tailored thermal images of their homes, enabling them to visually explore the degree of heat lost through the buildings fabric. Similarly, spatial mapping tools encourage users to interact with the real world visually in order to obtain an energy flow across the scale at different locations, e.g., SSEN power tracking mapping tools [27] and the Leeds Heat Planning tool [28]. This was also confirmed by a local energy project that was carried out in Dublin, facilitating decision-making plans by allowing users to visually explore local energy demand and supply through a GIS-based mapping tool [29,31]. This tool successfully enabled local authorities to design evidence-based energy policy by matching local energy demand with local energy resources and fuel poverty, and improve the development of local energy projects at an early stage. Despite the benefits provided by SLEETs with a visual interface, it can be challenging for users to interpret the visual data or navigate through the digital systems without prior knowledge, making it vital to train users so that they can take advantage of such tools.

2.1.2. Interaction-Based

Digital energy platforms (DEPs) and Gamification are two types of SLEETs that facilitate interaction between users, peer neighbours and local organisations, enabling reductions in energy use and energy costs, and helping to change behaviour.
DEPs integrate smart systems to deliver user-friendly, personalised smart home energy service plans that incorporate flexibility, grid service and management platforms. These systems support users to manage energy services [33,55,56] and reduce network pressure during peak hours by reducing energy demand, as demonstrated in a Dutch local energy project [36]. As highlighted by Bird and Chitchyan [37], and Dorahaki and Rashidinejad [38], providing financial rewards to shift energy use from the peak hours could motivate users to participate in grid-balancing programmes and overcome the issues of peak energy demand. Such interventions were successfully implemented in Greenwich Energy Hero [39] and the SAVE programme [57], which were undertaken in the UK to encourage user engagement. According to the US Regulatory Assistance Projects (RAP) [58], these tools were beneficial for low-income users; by matching peak energy demand and supply, savings of up to 15% in annual energy costs were achieved. DEPs can facilitate peer-to-peer (P2P) platforms, allowing local energy trading between users and prosumers [40]. Parag and Sovacool [41] revealed that P2P platforms could turn demand-responsive energy trading into profitable deals at local community levels in order to reduce peak loads and balance the grid. However, to ensure the sustainable participation of users and prosumers in the existing P2P electricity market, it is vital to deliver motivational psychology through a trusted intermediary so that surplus energy can be sold through energy platforms at a cheaper rate than the national rate.
Gamification-based tools have also been found to encourage user engagement in local energy projects [42], which can be accessible through interactive software or apps [44]. Through their game-based features, and without direct dialogue [59], users can compete with peer neighbours in an entertaining way to reduce energy demand during the peak hours and gain economic benefit [60,61], as integrated in the California HomeBeat tool [62]. AlSkaif and Lampropoulos [63] revealed that these tools can improve user engagement by providing bespoke energy feedback and advice, while Kazhamiakin and Marconi [45], and Konstantakopoulos and Barkan [43] confirmed that the visualisation of information, and a chance to win a game and obtain financial rewards can maintain long-term engagement. Although interactive tools can be effective in changing behaviour and reducing energy use by incentivising users to perform compare themselves with their peers, vulnerable users, such as the elderly and those who are not digitally skilled, may find it hard to access the tool.

2.1.3. Control

Control-driven tools interact with users manually (user-driven) or automatically. Energy management systems, such as control-driven tools, enhance user engagement by allowing users to manage smart energy appliances, obtain energy feedback and monitor energy use remotely via smart phones, tablets or voice-assisted devices. These tools were found to encourage reductions in energy use if coupled with peak banded pricing technology and a dynamic pricing scheme, as identified in the UK SAVE project [50], which developed a customer model app to monitor energy use. This tool provided real-time and historic energy data, allowing users to track and control energy use remotely and to receive rewards for reducing energy use at peak hours. Dwivedi and Shimi [64] found that users preferred to use energy management systems in order to obtain energy feedback and save on energy bills, since the tools reduced the effort involved in data collection and in controlling energy use. This is a similar finding to that from the British Gas HIVE project, which supported users in controlling heating energy and hot water remotely via an app to save energy [51]. In contrast to energy management systems, using smart energy automation hubs (e.g., Alexa-driven tools) [52] or digital voice assistants allows users to verbally control energy services and obtain feedback; this was adopted in SCENe projects in Nottingham [14,15]. The voice command technique was found effective in encouraging energy-efficient behaviour by enabling users to identify how their behaviour affected energy use. This technique is a vital instrument in local energy projects in which an inclusive mode of delivery is planned, allowing the tool to act on the user’s behalf in order to improve energy efficiency and provide a valuable capability to vulnerable users or those who prefer not to use a smart app.

2.2. Effective SLEET

To achieve net-zero carbon emissions through the transformation of the whole energy system, SLEETs need to be effective in enabling reductions in energy use, carbon and costs [17], and empowering users to take control of energy services and interact with peer neighbours [65]. These tools, when combined with time-of-use (TOU) and dynamic pricing tariffs, have been found to mitigate grid constraints during peak hours by shifting energy demand [66]. Users can be supported to save energy costs by making habitual changes in their energy use in order to shift their energy use from peak hours with high-energy rates to periods with cheap rates [67]. Interactive SLEETs, such as gamification-tools, were found to encourage behavioural change and enable learning [18] by providing support and advice, or offering financial incentives. SLEETs can also facilitate energy efficiency, which is the most cost-effective strategy to enable reductions in carbon emissions, energy use and energy costs, which is a pillar of the governments’ efforts to tackle fuel poverty [68]. Users can control their home energy efficiency and track their real-time energy usage remotely, and can use energy-saving apps that provide tips on how to save upon energy costs, as deployed in the Greenwich Energy Hero project in the UK [39]. A study conducted by Dorahaki and Rashidinejad [38] on the coordination of energy efficiency and demand response confirmed that effective energy management plans can shift the energy load and lead to behavioural change, as well as energy use and energy cost reduction. Effective SLEETs that match with users’ requirements can encourage engagement amongst energy users (people), and people and technology.

2.3. Inclusive SLEET

To increase user engagement in local energy projects, it is vital to deploy inclusive SLEETs by considering the basic requirements of users in order to improve their quality of life [69], to construct fair and resilient communities, and mitigate unjustified outcomes [70]. User experiences and their requirements play a key role in the development of inclusive SLEETs, by being reliable and providing valuable energy services, tailored to users’ needs [70]. This can support users to become more active participants in managing energy services [71]. Inclusiveness means recognising broader diversity within the community, and identifying different requirements, expectations and differing degrees of familiarity and technical expertise [72]. These range from addressing the needs of vulnerable users, including the elderly and people with disabilities, to those in fuel poverty, to those who do not have access to digital technologies [56], or to those who do not want to take risks [73]. A research study on the impacts of user engagement in rolling-out smart meters in UK dwellings revealed that elderly and vulnerable users were less engaged in the project since they experienced difficulties in finding data and understanding new technology, while they required additional support to improve their knowledge [74]. Brown and Markusson [75] revealed that although the elderly were more aware of the benefits of energy use reduction and its positive impact on energy costs and the environment, they were less confident about engaging in it because they were concerned about losing comfort. However, a nationwide survey on the acceptance of smart meters in New Zealand confirmed that if elderly people could maintain a sense of control over personal expenses by using smart tools, they may switch to a smart metering system [76]. Digital voice assistant tools with automated systems were found to promote energy efficiency by vulnerable users valuable capabilities and linking energy systems to users through automated services, allowing them to monitor energy effortlessly [48].

2.4. User Engagement and SLEETs

Involving end-users in local energy projects to ensure that their requirements are considered is vital for the acceptance of SLEETs. To encourage user engagement, different engagement pathways are available to be delivered by project partners or intermediaries. As identified by Nobles and Perez [77], an engagement pathway defines the key concepts (e.g., recruitment) and their relationships in an energy intervention. The social and technical aspects of SLEETs can be delivered through five engagement pathways: informing, communicating, involving, empowering and technologizing; these use the associated methods, as identified by Gupta and Zahiri [78] and as outlined in Table 2. Integrating the social aspects of engagement with the technical aspects of SLEETs can improve user knowledge and awareness by delivering tailored guidance, advice and learning materials. This improves trust and supports long-term user engagement if delivered through trustworthy intermediaries [70]. Through interviews with key stakeholders in the Energy-SHIFTS project, Suboticki et al. [70] found that, in order to make the projects successful, inclusive engagement with users needs to be presented at all stages of these projects, alongside continual feedback loops, allowing for mutual learning and continual interaction over time. Such an approach confirms that continuous engagement, with follow up, is key to building trust, getting wider communities interested, and validating the project socially at the local level.
Despite the growing interest in SLEETs, there is a lack of comprehensive studies that investigate the various types of SLEETs deployed in local energy projects, and that examine how effective and inclusive they are in engaging vulnerable users, those in fuel poverty, and those not digitally connected [73].

3. Methods

A meta-study (cross-project) approach was adopted in this study to identify what types of SLEETs were deployed across local energy projects. The scope of the study was limited to local energy projects undertaken in the UK from 2008 to 2018, covering major funding programmes in local energy initiatives. The learning gained from this study can then be applied to other developed countries that implement the same smart interventions. The methodological approach used the systematic examination of the academic (journal publications) and grey literature (e.g., project reports) in order to identify local energy projects and the type of SLEETs deployed in them so as to deliver social, economic or environmental benefits. An analysis framework was also developed to characterise SLEETs through meta-data gathered to study how prevalent, effective and inclusive SLEETs have become across the UK in recent years.

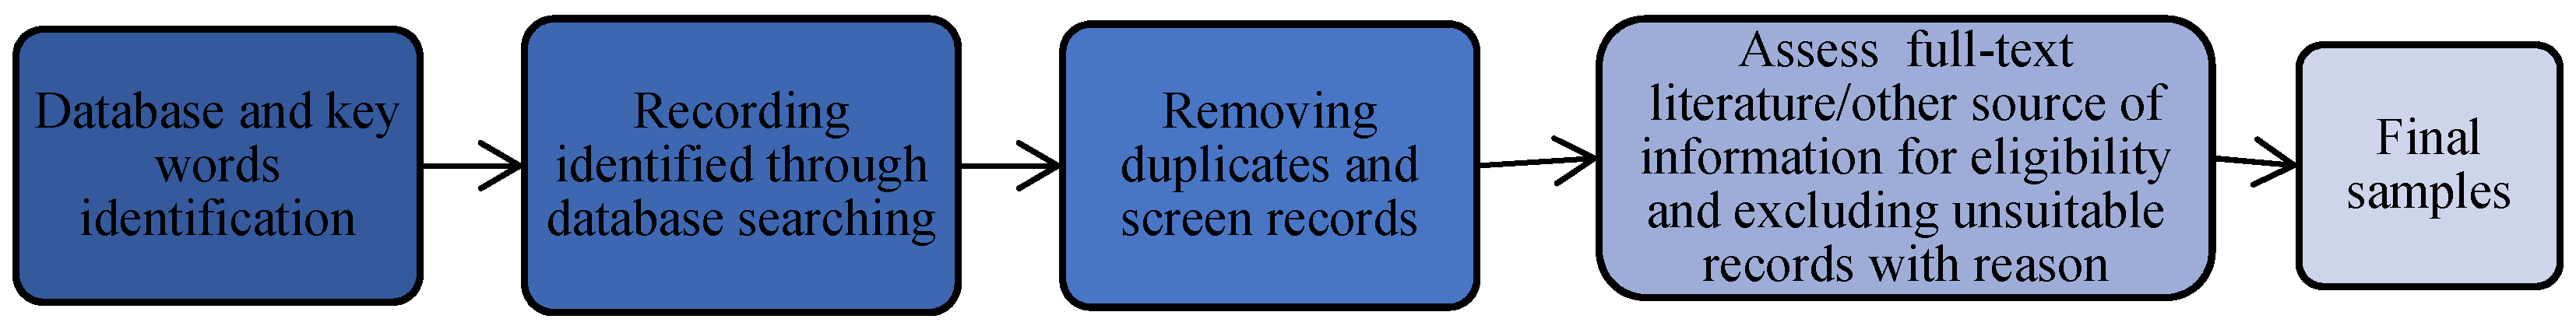
3.1. Meta-Data Search Applied in This Paper to Identify the Case Studies

The search process started with local energy projects undertaken in the UK from 2008 to 2018 using major funding programmes. To identify the demonstrator projects, the websites of likely funding bodies were searched as an initial source of information. These included EU Cordis, Gateway-to-Research (Gtr) and UK Research and Innovation (UKRI)/InnovateUK. To identify projects that were not recorded in these data sources, the literature was explored using the search engines Web of Science, Science Direct, Scopus, Google Scholar and Google, using specific terms under the main key research areas, namely ‘energy projects’, ‘user engagement’ and ‘smart energy tool’s. The search also provided information about the projects from the following sources:
A range of keywords were used to explore the extent of the study in terms of local energy projects, smart energy tools and user engagement, namely ‘community energy’, ‘local energy’, ‘smart local energy system’, ‘trial’, ‘initiative’, ‘project’, ‘smart’, ‘grid’, ’renewable’, ‘energy management’, ‘demand response’, ‘demand management’, ‘smart control’, ‘storage’, ‘district heating’, ‘distributed generation’, ‘electric vehicles’, ‘EV charging’, ‘microgrid’, ‘smart energy technology’, ‘smart energy tool’, ‘user engagement’, and ‘user participation’. The meta-study brings together data from major funding programmes, including the Low Carbon Communities Challenge (LCCC) and Localised Energy Systems, funded by the UK government, the Network Innovation Allowance, (NIA) funded by regulators, the Energy and Communities programme, funded by UK Research Councils, Horizon 2020, funded by the EU, and the Local Energy Assessment Fund (LEAF), funded by the UK Government. The systematic literature data flow is presented in Figure 1.
To categorise the local energy projects under community energy (CE), local energy (LE) and smart local energy system (SLES) initiatives, key characteristics were established, drawing upon the study by Devine-Wright [11], as well as a meta-data search; these are listed in Table 3.
The association of user engagement methods with SLEETs in the identified projects was also assessed in the meta study. To encourage users to become involved in local energy projects or to enhance engagement, different engagement methods were deployed in local energy projects. These were categorised into different groups (social pathways and the associated methods) based on the examination of the academic and grey literature and a meta study of local energy projects in the UK that was carried out by Gupta and Zahiri [78]. These pathways included informing, communicating, involving and empowering, as detailed in Table 2.
A pool of 384 initiatives (CE (176), LE (86), and SLES (123)) were identified from an extensive review of the literature. However, only 72 projects deployed smart energy tools to engage users, and these were used for meta-data analysis. In total, 84 SLEETs were found to be deployed across the 72 projects, with some projects deploying multiple SLEETs.

3.2. Analysis Framework

An analysis framework was devised in order to characterise the 84 SLEETs by interface–numeric, visual or voice-based (aural), and the extent of interaction offered–information, interaction or control (Table 4), in conjunction with the 7 types of SLEETs provided in Table 1.
The prevalence of SLEETs was studied against the analysis framework to identify the functionality and applicability of the tools in the local energy projects and to indicate how prevalent SLEETs have become across the UK in the last few years. This was used to highlight which areas have a greater level of activity in deploying SLEETs, along with the reasons why. The projects were characterised based on the UK Energy Research Centre’s (UKERC’s) report on UK energy system demonstrators [70]. These characteristics included lead actor (DNO, university, private sector, community group, local authority and partnership collaboration), funder (government, UKRI, DNO, EU and regulator), start year (2008 to 2018), type of initiative for community energy (CE), local energy (LE) and smart local energy systems (SLES), and energy vector (Electricity, Heating, Transport), as well as user engagement pathways.
The study also evaluated the effectiveness and inclusiveness of SLEETs to identify how users’ attitudes, requirements and socio-economic benefits were accounted for in delivering smart energy interventions to bring a meaningful change to support net-zero emission. The criteria for effective and inclusive SLEETs were selected based on the UN Sustainable Development Goals (SDG), which aim to deliver affordable and clean energy for all, and to make cities sustainable and inclusive. This was used because no systematic criteria were found in the projects or in the reviewed grey and academic literature to evaluate the inclusiveness and effectiveness of smart tools in local energy projects (Table 5). Ensuring access to affordable, reliable, sustainable and modern energy for all will offer opportunities for all people through new economic opportunities, empowerment and better education. This can also provide more sustainable, equitable and inclusive communities (gender, age, income), and greater protections from, and resilience to, climate change, by reducing energy use and carbon emissions [79].
Effective SLEETs enable behavioural response, carbon reduction and energy use reduction, as well as learning. They also empower users to be active participants in local energy management systems or become involved in local energy markets to trade surplus energy generated by prosumers or stored in battery storage. Inclusive SLEETs improve project acceptance and enhance user engagement by focusing on socio-demographic (e.g., age, gender) and socio-economic factors, vulnerability and barriers (trust, privacy and knowledge).
Pearson’s Chi-square independence test was also carried out to identify the relationship between the characteristics of SLEETs, and the factors affecting prevalence, effectiveness and inclusiveness. To indicate the strength of association, Cramer’s V test (Pearson’s Chi-square based measure of association) was also carried out for unviolated data (if more than 20% of the data in each category have an expected count of less than 5, the assumption of the Chi-square test is violated) giving a value between 0 (no association) and 1 (complete association).

4. Results

The meta-study identified 84 SLEETs that were deployed across 72 local energy initiatives, with some projects using multiple SLEETs to enhance user engagement (for more detail see Appendix A). Dominant SLEETS used IHD, providing energy feedback (n: 23), and thermal imaging, highlighting heat losses from the building fabric (n: 23). These were followed by DEPs (n: 22), which help to manage and control energy services or empower users to participate in the local energy market (Figure 2).
It was apparent that information-driven tools (49 out of 84 SLEETs) with numeric (IHDs) and visual (thermal imaging or spatial map) interfaces (58%) were dominant amongst the projects, although they only allow users to monitor data. These were followed by interaction tools, which covered 30% of SLEETs (n: 25) and enable users to interact with peer neighbours to exchange energy and to change behaviour. However, control tools (n: 10), despite enabling users to manage and control energy use and energy costs remotely, were less popular (12%). These included energy management systems (n: 8), as well as digital voice assistants (n: 2). Gamification tools with a visual mode of communication were also found to be unpopular (n: 3). To identify the relationship between the characteristics of SLEETs and the projects’ key characteristics (prevalence, inclusiveness and effectiveness), as well as the choice of SLEETs in relation to the form of user engagement, whether informing, communicating, involving or empowering, the Pearson Chi-square test was undertaken. It should be noted that if more than 20% of the data in each category have an expected count less than 5, the assumption of the Chi-square test is violated and the result may not be reliable, despite a statistically significant p-value (e.g., 0.01 and 0.05).

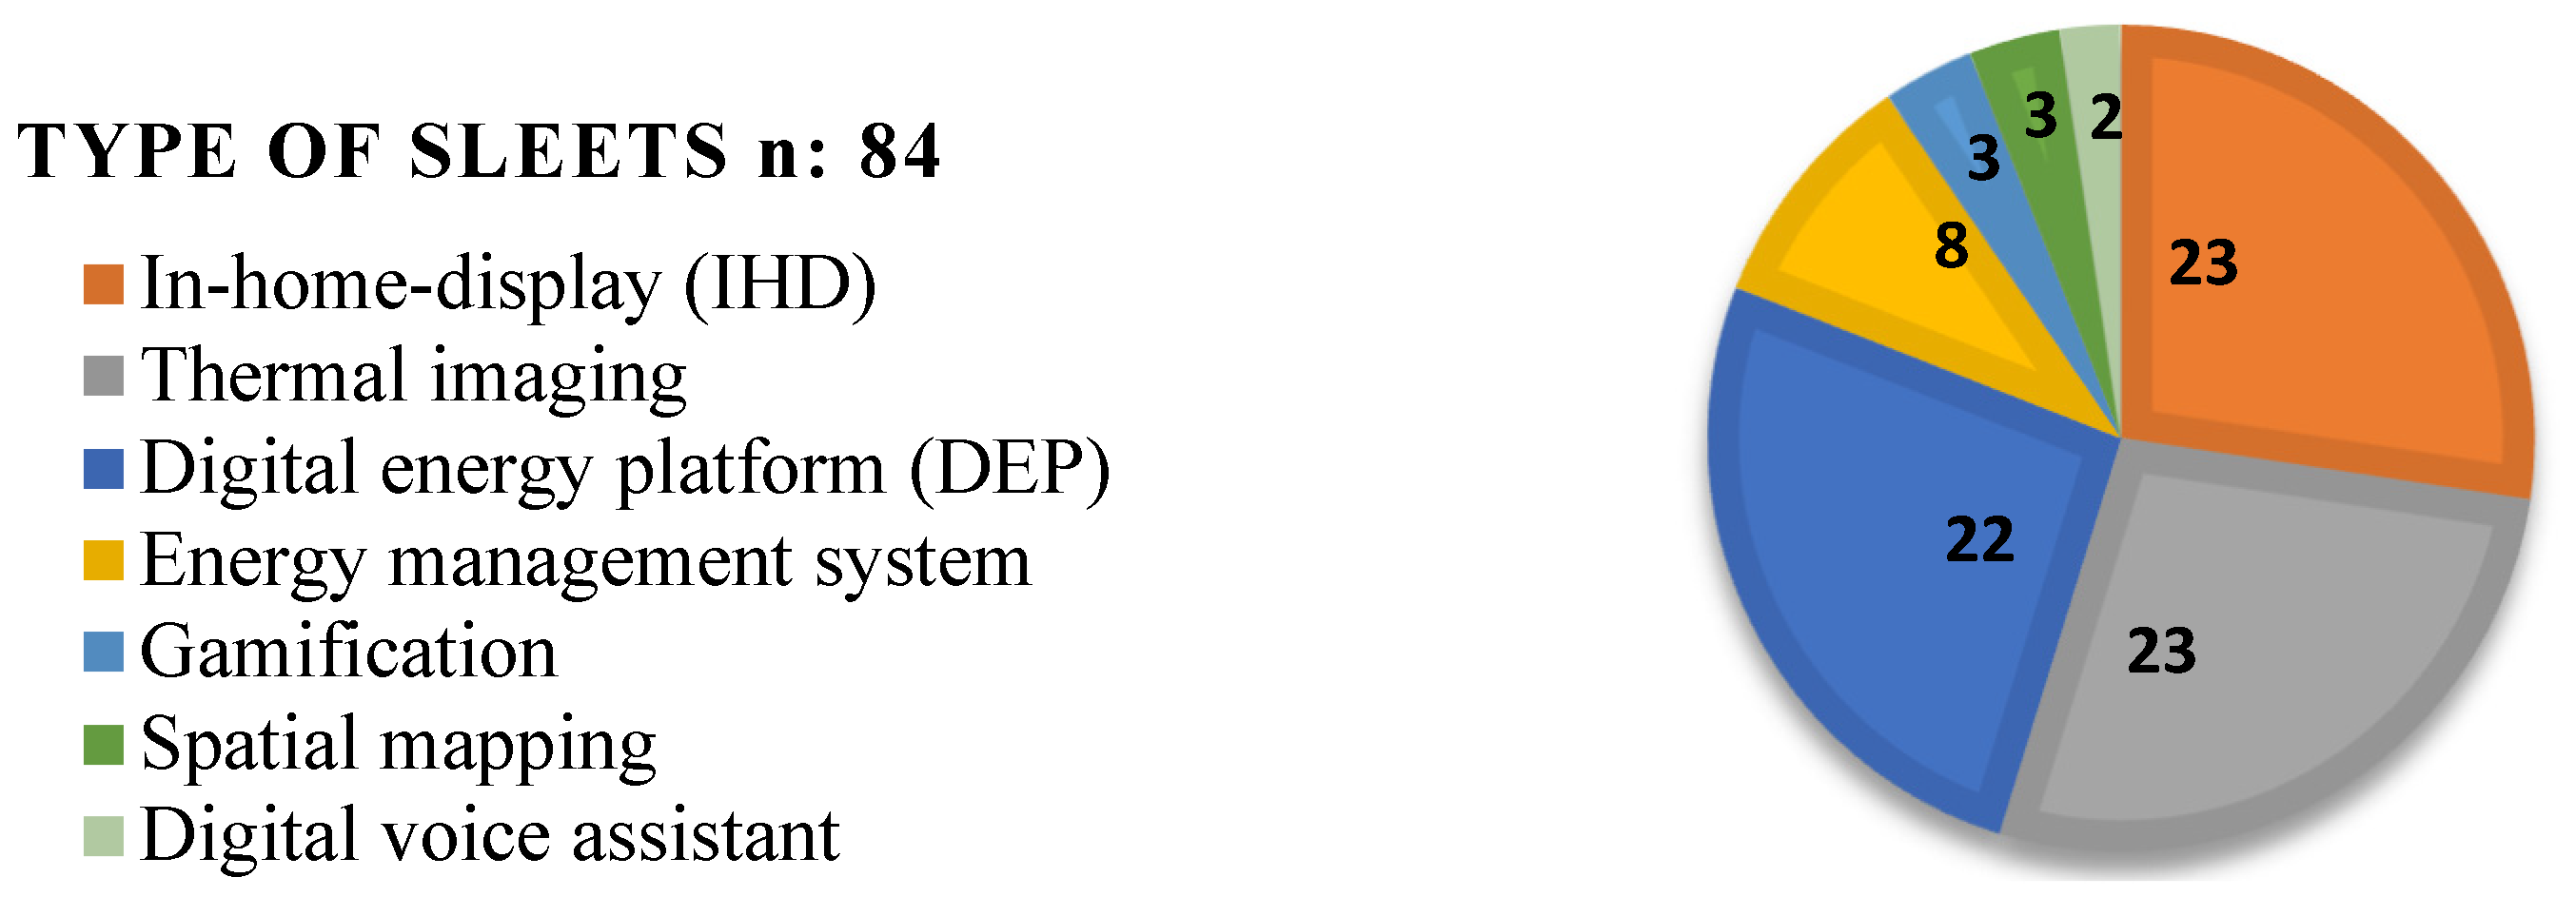
4.1. Prevalence of SLEETs in Local Energy Projects

The prevalence of SLEETs was studied in relation to the characteristics of local energy projects, which included the energy vector (Energy (E), Heat (H) and Transport (T)), the type of local energy project (CE, LE and SLES), the start year (2008–2018), the geographic location, and the lead actor and funder. The popularity of SLEETs across the multiple energy vectors was also closely examined. This was because clean and multiple energy vectors can contribute to the decarbonisation of energy systems by using an alternative option in order to store renewable energy through services that can be enabled by SLEETs, offering more dynamic and flexible low-carbon energy systems.

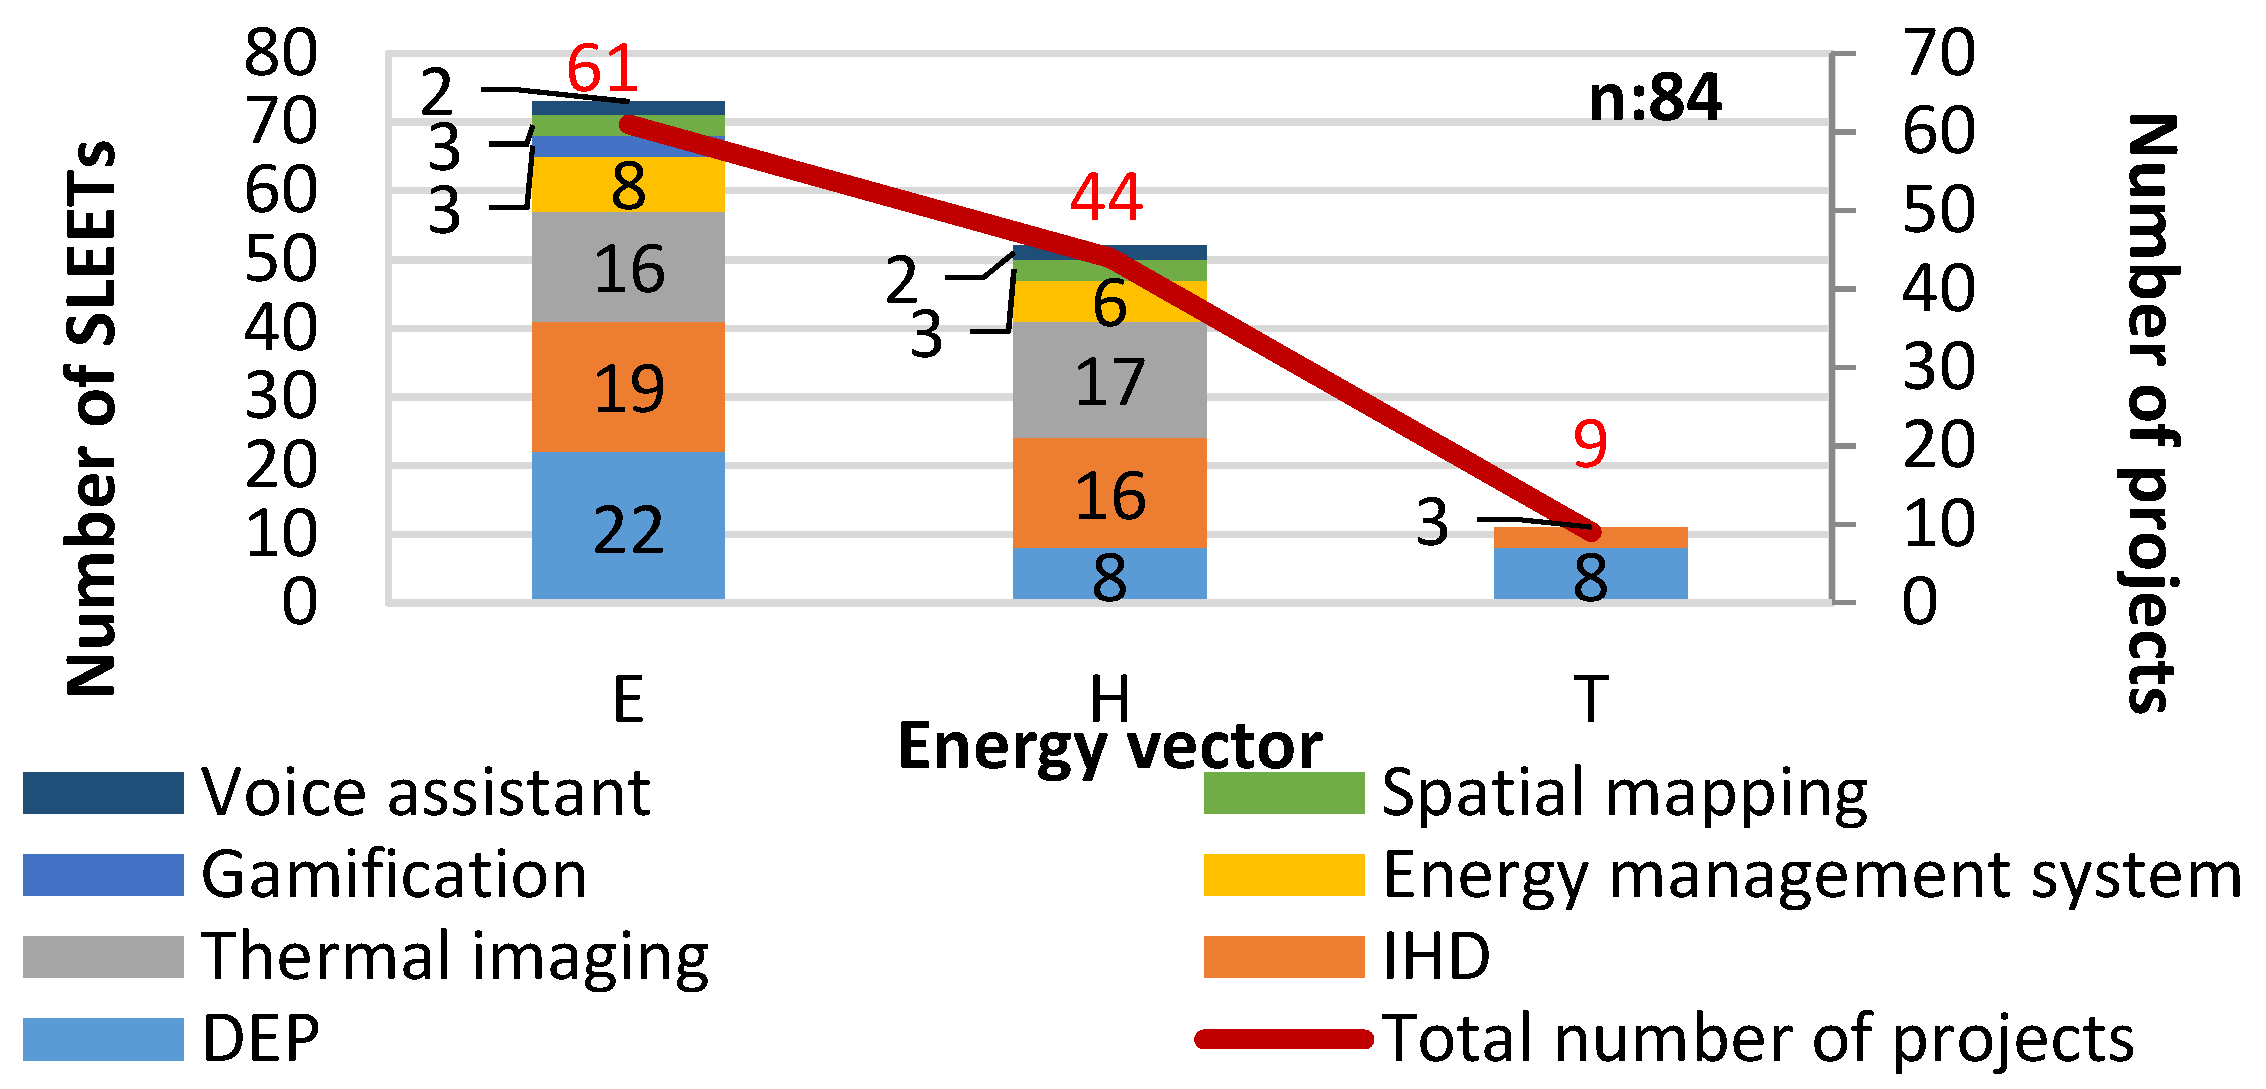
4.1.1. Energy Vector

The majority of local energy projects deployed multiple vectors, with E vector being dominant (n: 61), followed by H vector (n: 44), while T vector (e.g., EV charging points) was included in only 9 out of the 72 projects (Figure 3). Out of the total of 84 SLEETs, the number of SLEETs associated with E, H and T vectors was 73, 53 and 11, respectively; a SLEET could be deployed in projects with more than one vector, with the greatest amount of overlap occurring with the E and H vectors (n: 31). It was evident that DEPs with numeric interfaces were a popular tool (22 out of 73 SLEETs) in the projects with the E vector; this was followed by IHDs (n: 19) with a numeric interface, and then thermal imaging with a visual interface (n: 16). Thermal imaging with a visual interface was also found to be popular in the projects with H vectors (17 out of 52 SLEETs).

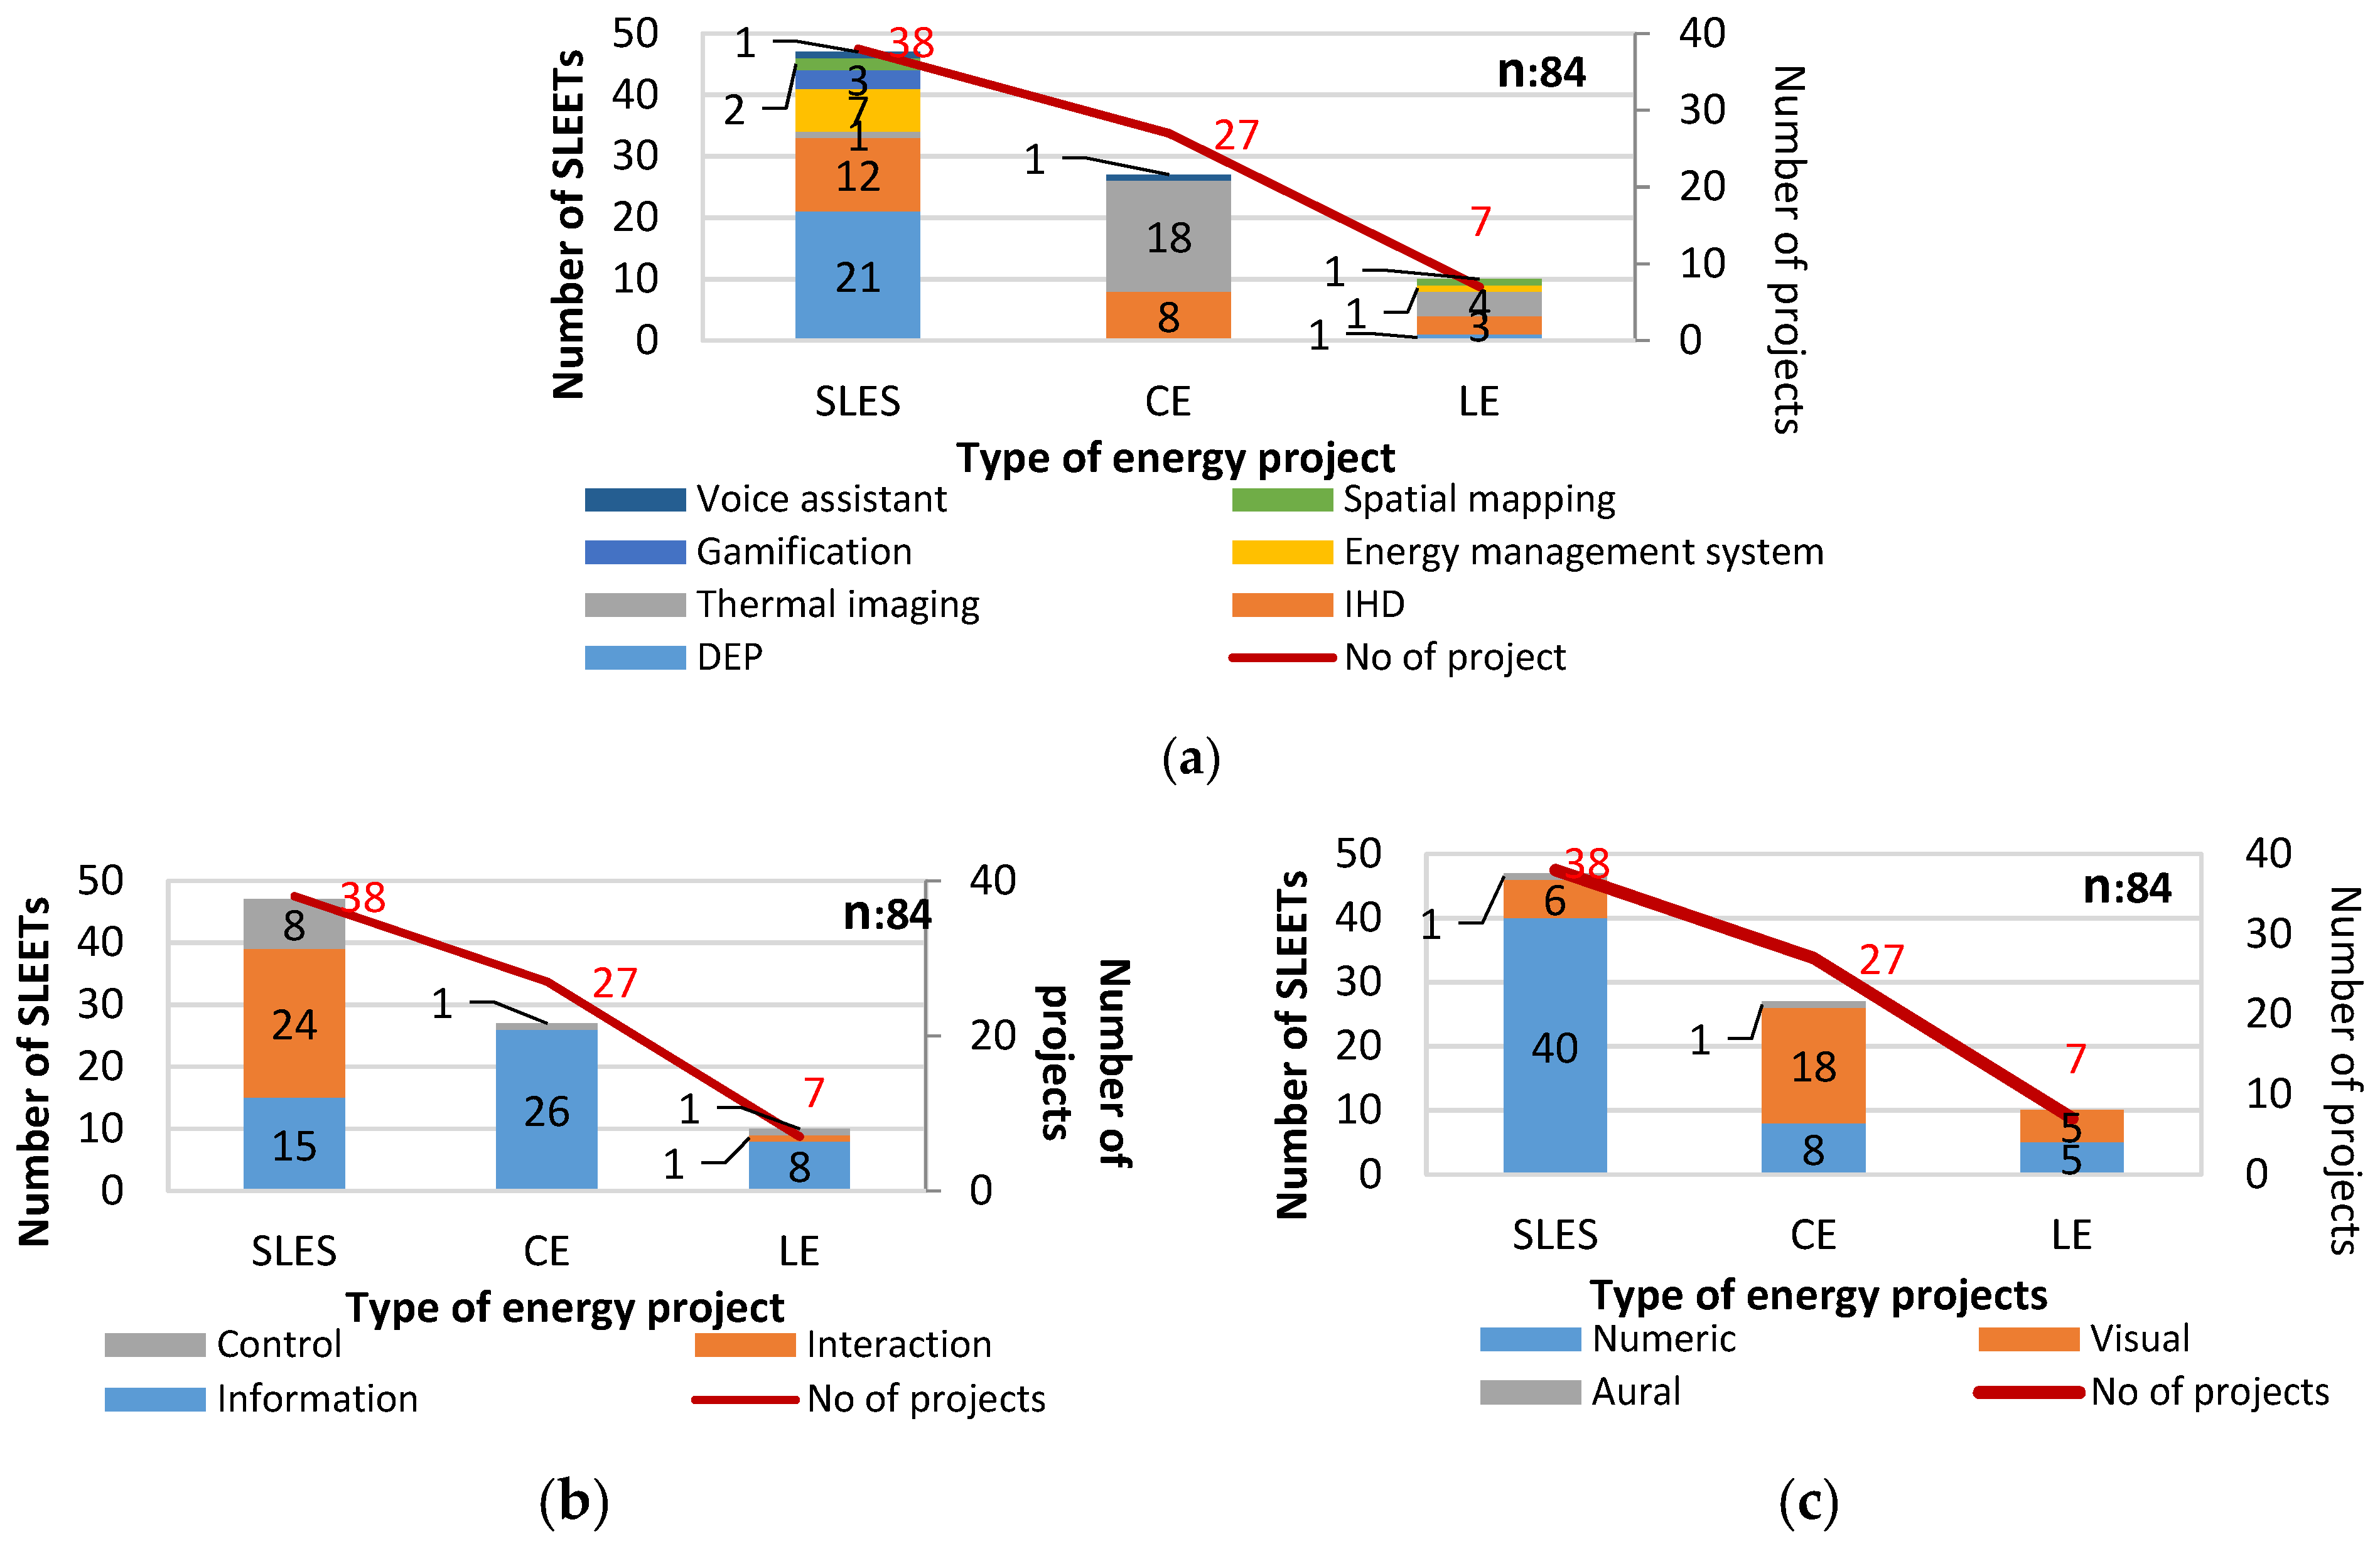
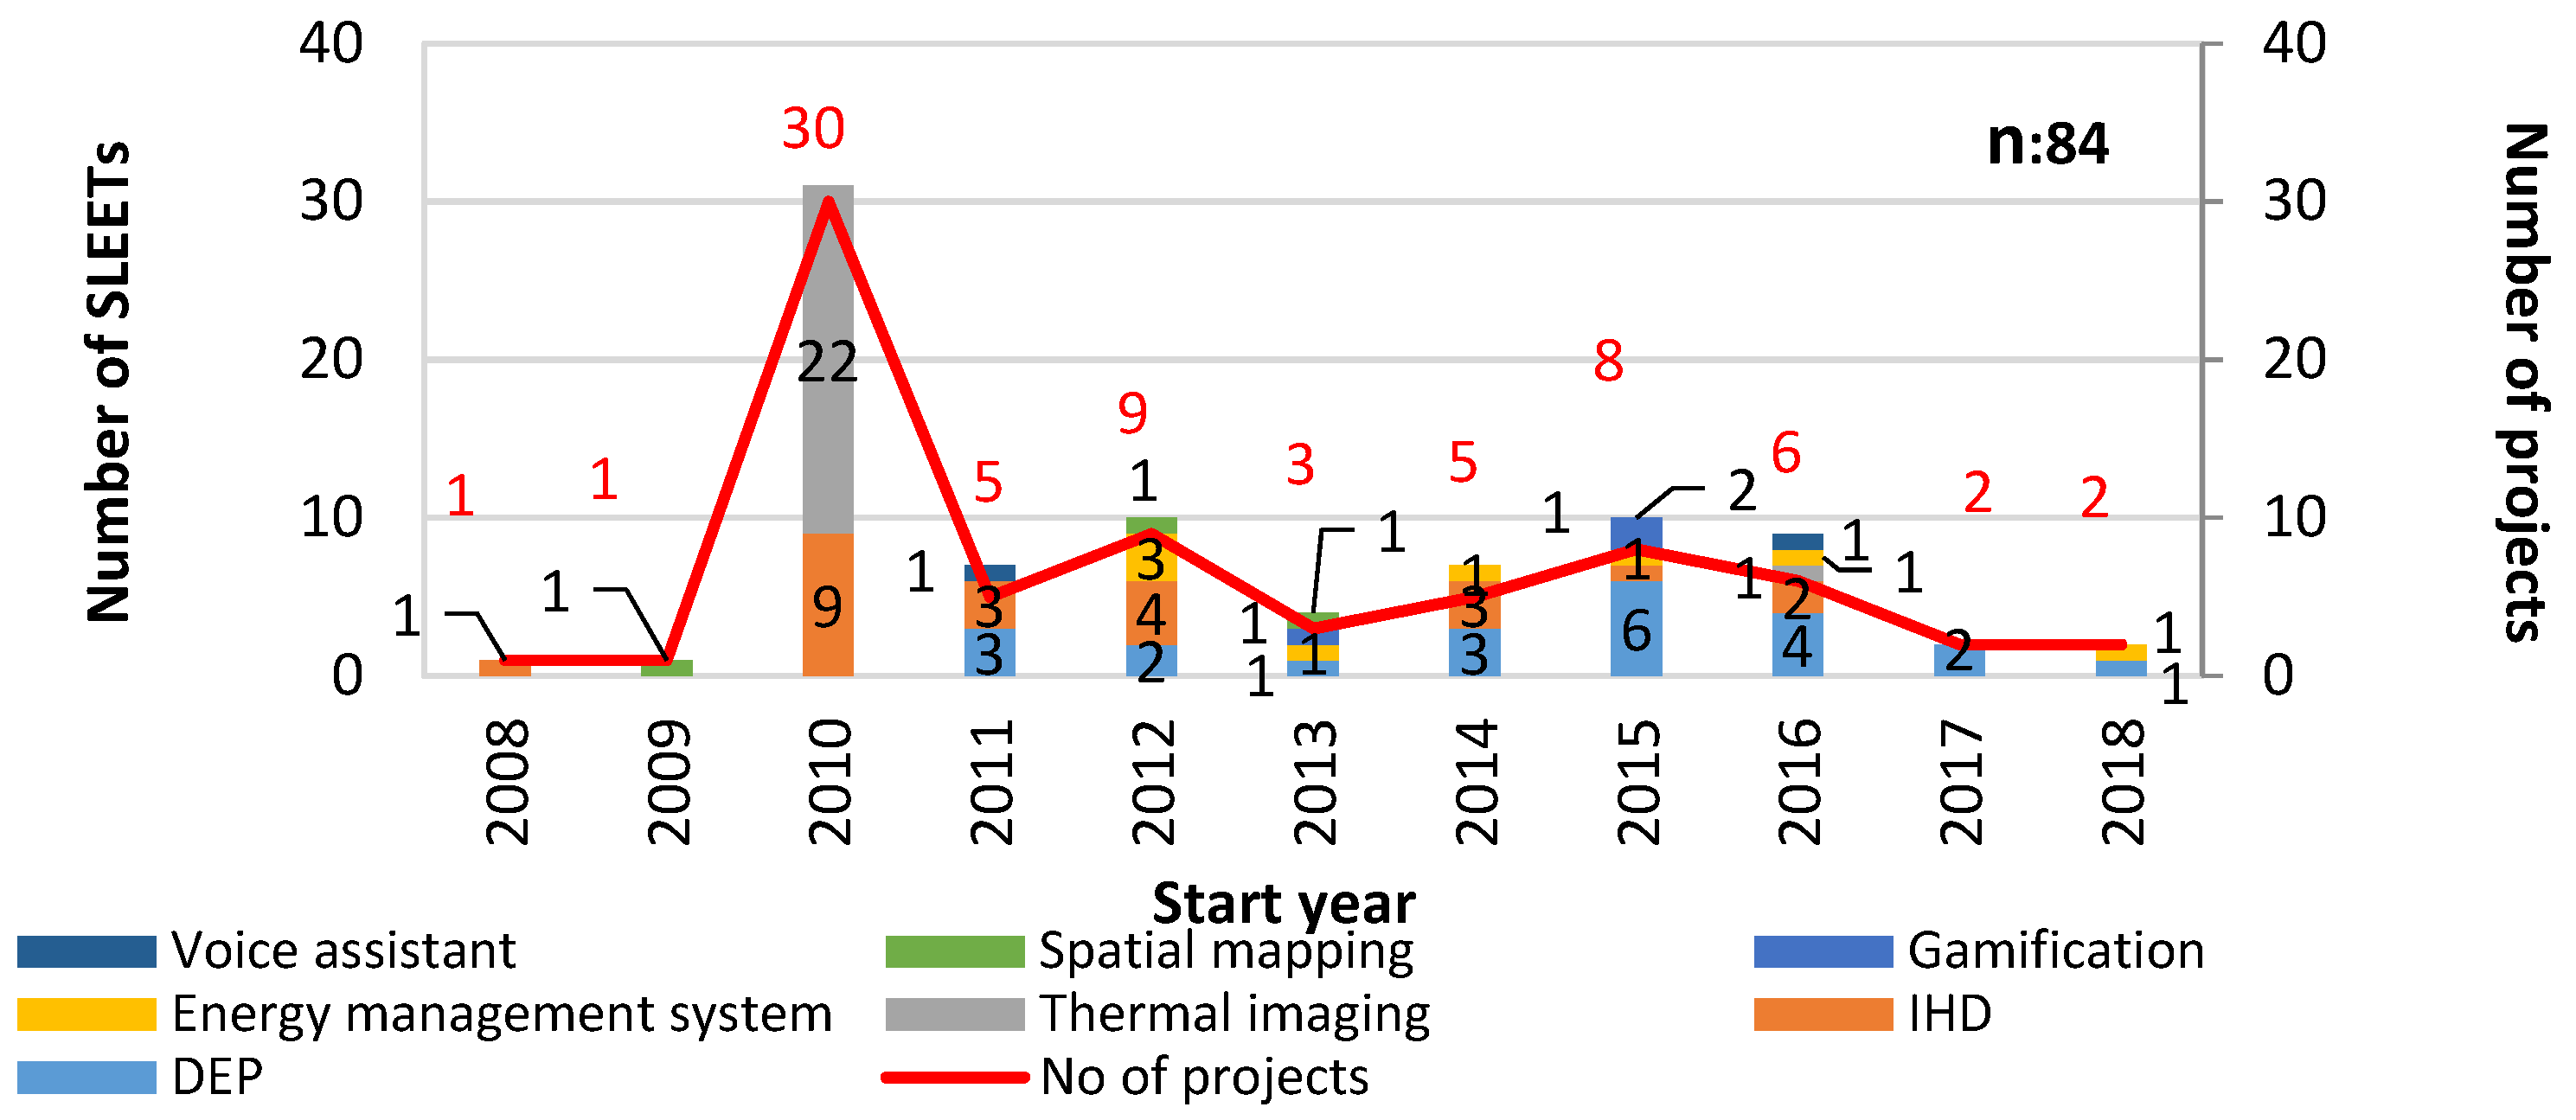
4.1.2. Type of Energy Initiatives and Start Year

The majority of SLEETs were deployed in SLES projects (38 out of 72 projects), followed by CE projects (27 out of 72 projects). DEPs, as interaction tools with numeric interfaces, were popular in SLES initiatives (21 out of 84 SLEETs), while thermal imaging, as an information-driven tool with a visual interface, was found to be dominant in CE initiatives (n: 18) (Figure 4). A Pearson Chi-square test between the SLEETs and the type of local energy project (CE, LE and SLES) revealed strong associations between DEPs in SLES and thermal imaging in CE projects (0.55 ≤ Cramer’s V ≤ 0.70 with df = 2, p-values < 0.001). Such relationships confirmed the interest in enhancing user engagement by digitalisation where smart energy systems were implemented. However, deploying thermal imaging across CE projects indicated the importance of improving energy efficiency in buildings in order to save energy costs and to reduce energy use and carbon emissions by getting local users involved at the heart of local energy services.
Only SLES projects deployed a substantial proportion of interaction-driven SLEETs (24 out of 47 SLEETs). While there were no interaction-driven SLEETs deployed in CE projects, information-driven SLEETs were dominant in CE and LE projects. Interestingly, control-driven SLEETs were only of note in SLES projects (8 out of 47 SLEETs). It might be expected that smart systems would be associated with a level of control.
A meta-study analysis revealed that information-driven tools became popular in 2010 when the UK government introduced the LEAF programme to support communities to take action regarding energy efficiency and renewable energy within CE projects. Thermal imaging was dominant (22 out of 84 SLEETs) for highlighting heat losses from the fabric of buildings; this was followed by IHDs (n: 9), for providing energy feedback (Figure 5). However, the increase was not sustained in subsequent years, as there were changes to the UK’s energy policy for decarbonised energy systems. Further analysis on the extent of the interaction showed that before 2011, SLEETs were only information-based. From 2011 onwards, interaction- and control-based SLEETs began to appear, with interaction-based SLEETs becoming dominant from 2015.
Following the publication of the first ever community energy strategy in 2014 [8], which presented a decentralised vision of energy transition, the majority of the projects were found to use DEPs as interaction tools. DEPs supported users to become digitised in energy management and the local energy market, covering 16 out of 30 SLEETs deployed in the projects undertaken from 2014. This interest in the use of DEPs confirms how the popularity of SLEETs has changed over time, whether driven by digitalisation, grid balancing, or community inclusion, in order to take advantage of the opportunities offered by national government policies encouraging the use of smart technologies and improvements in energy efficiency.

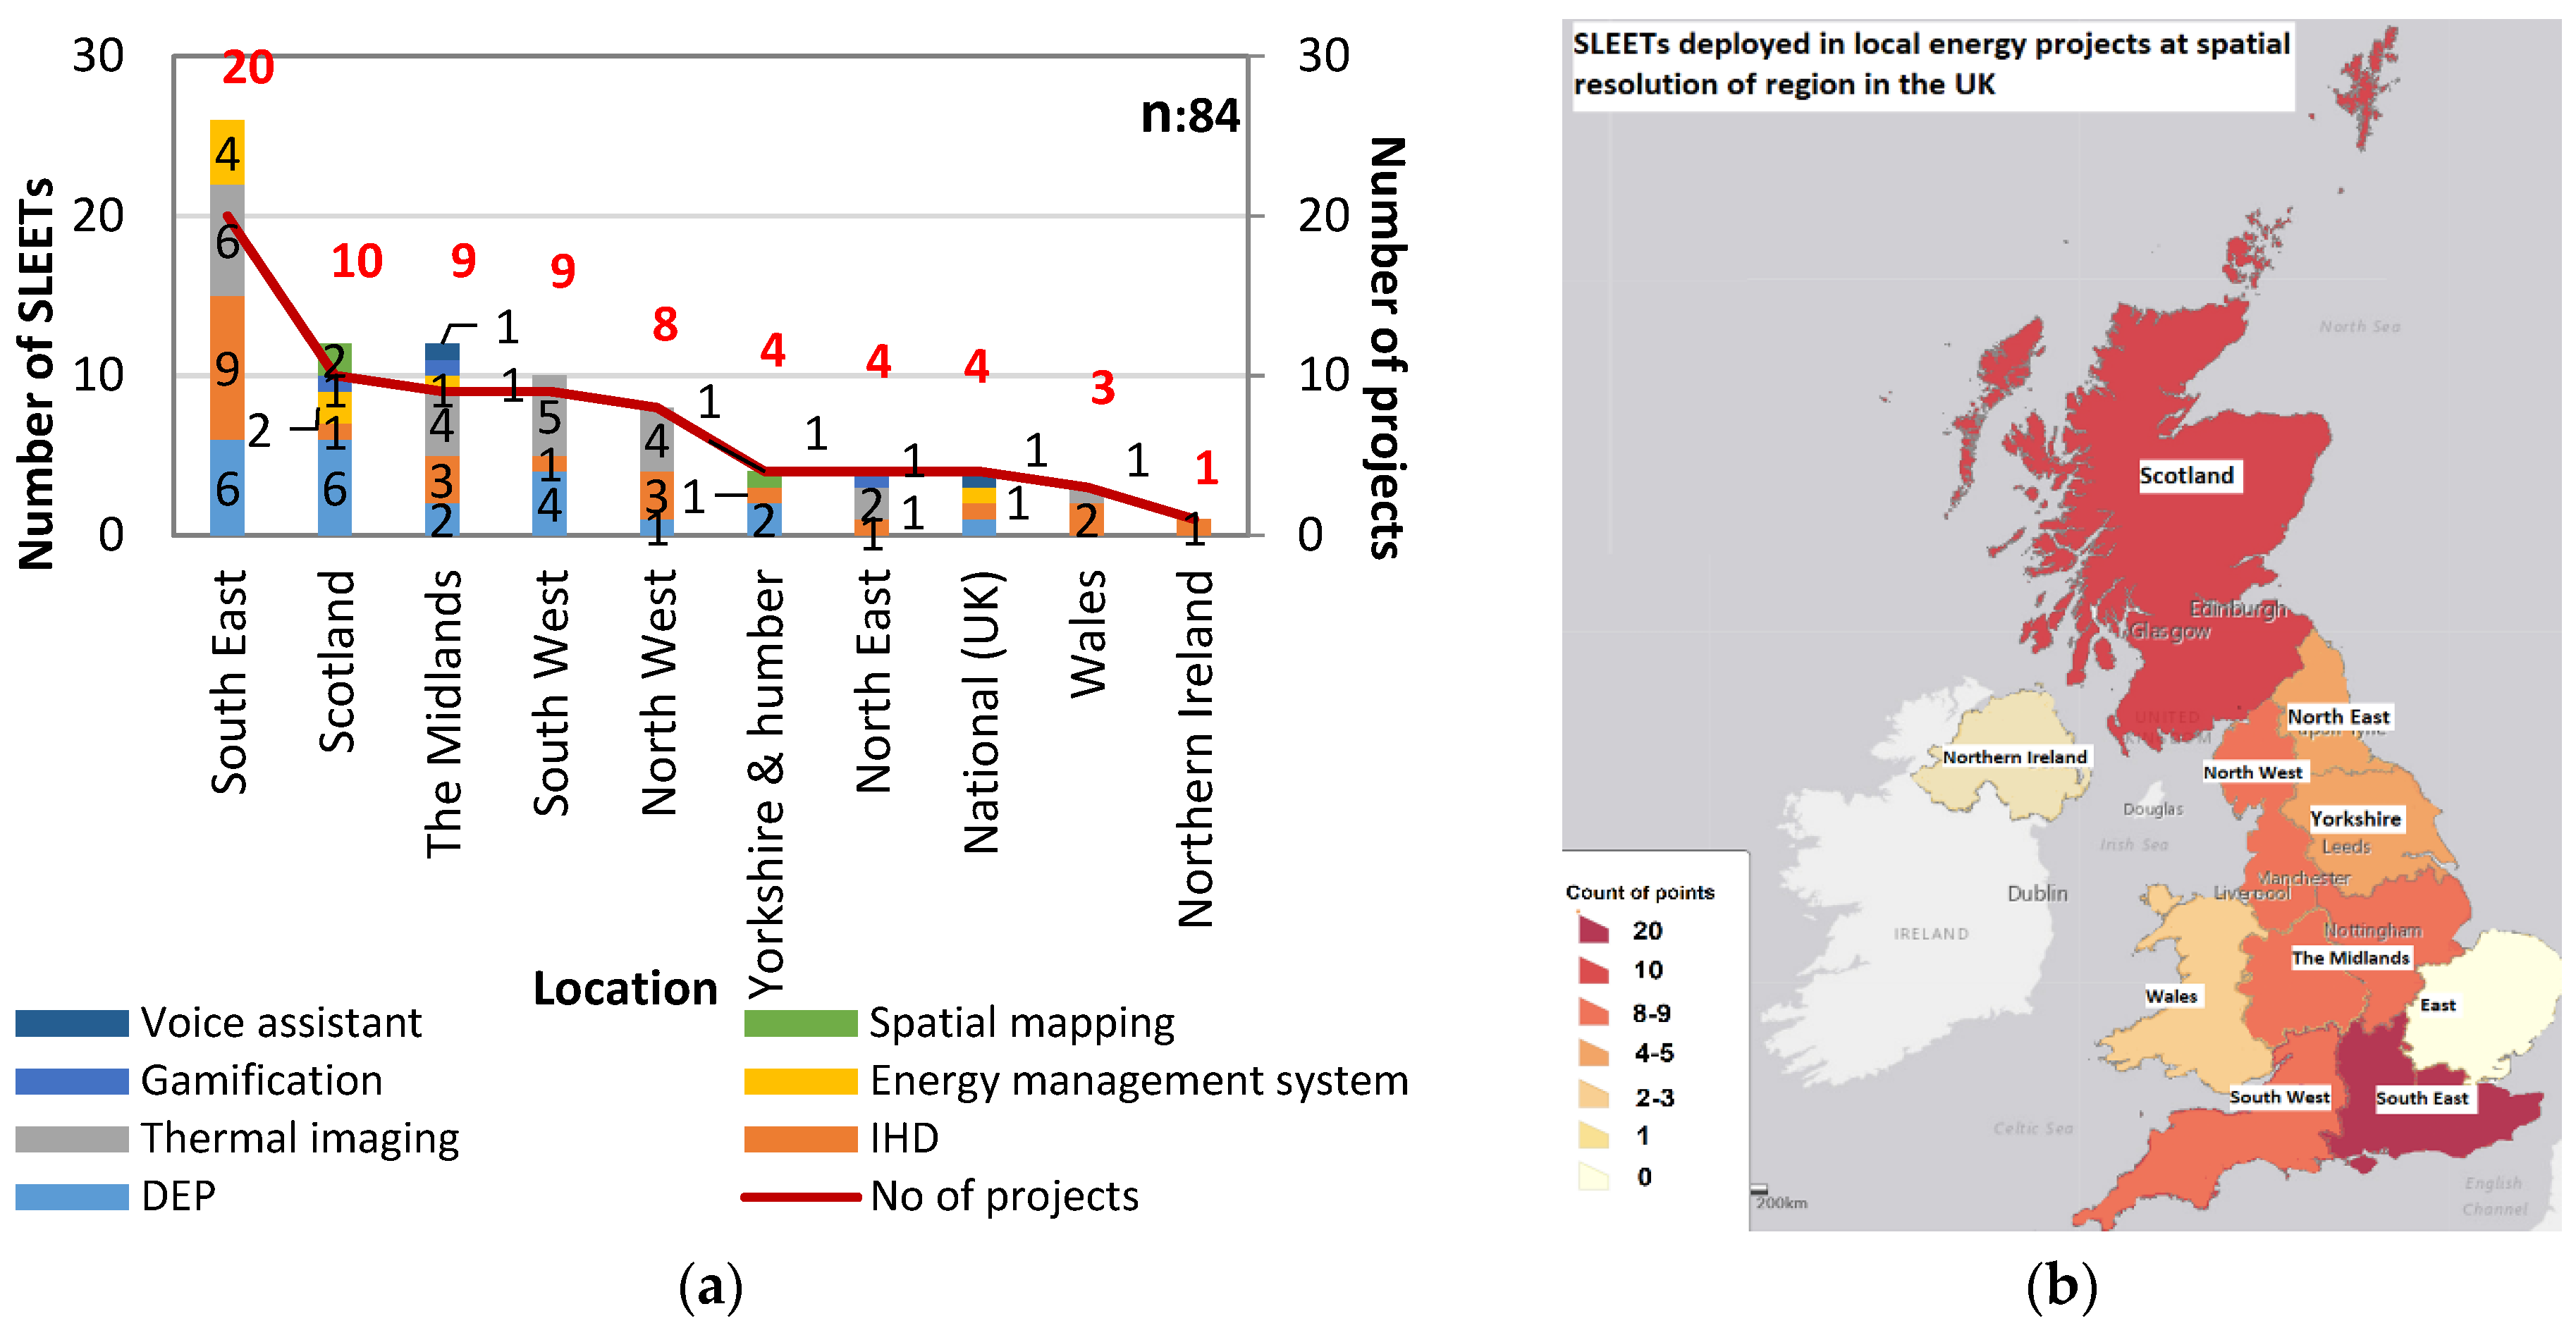
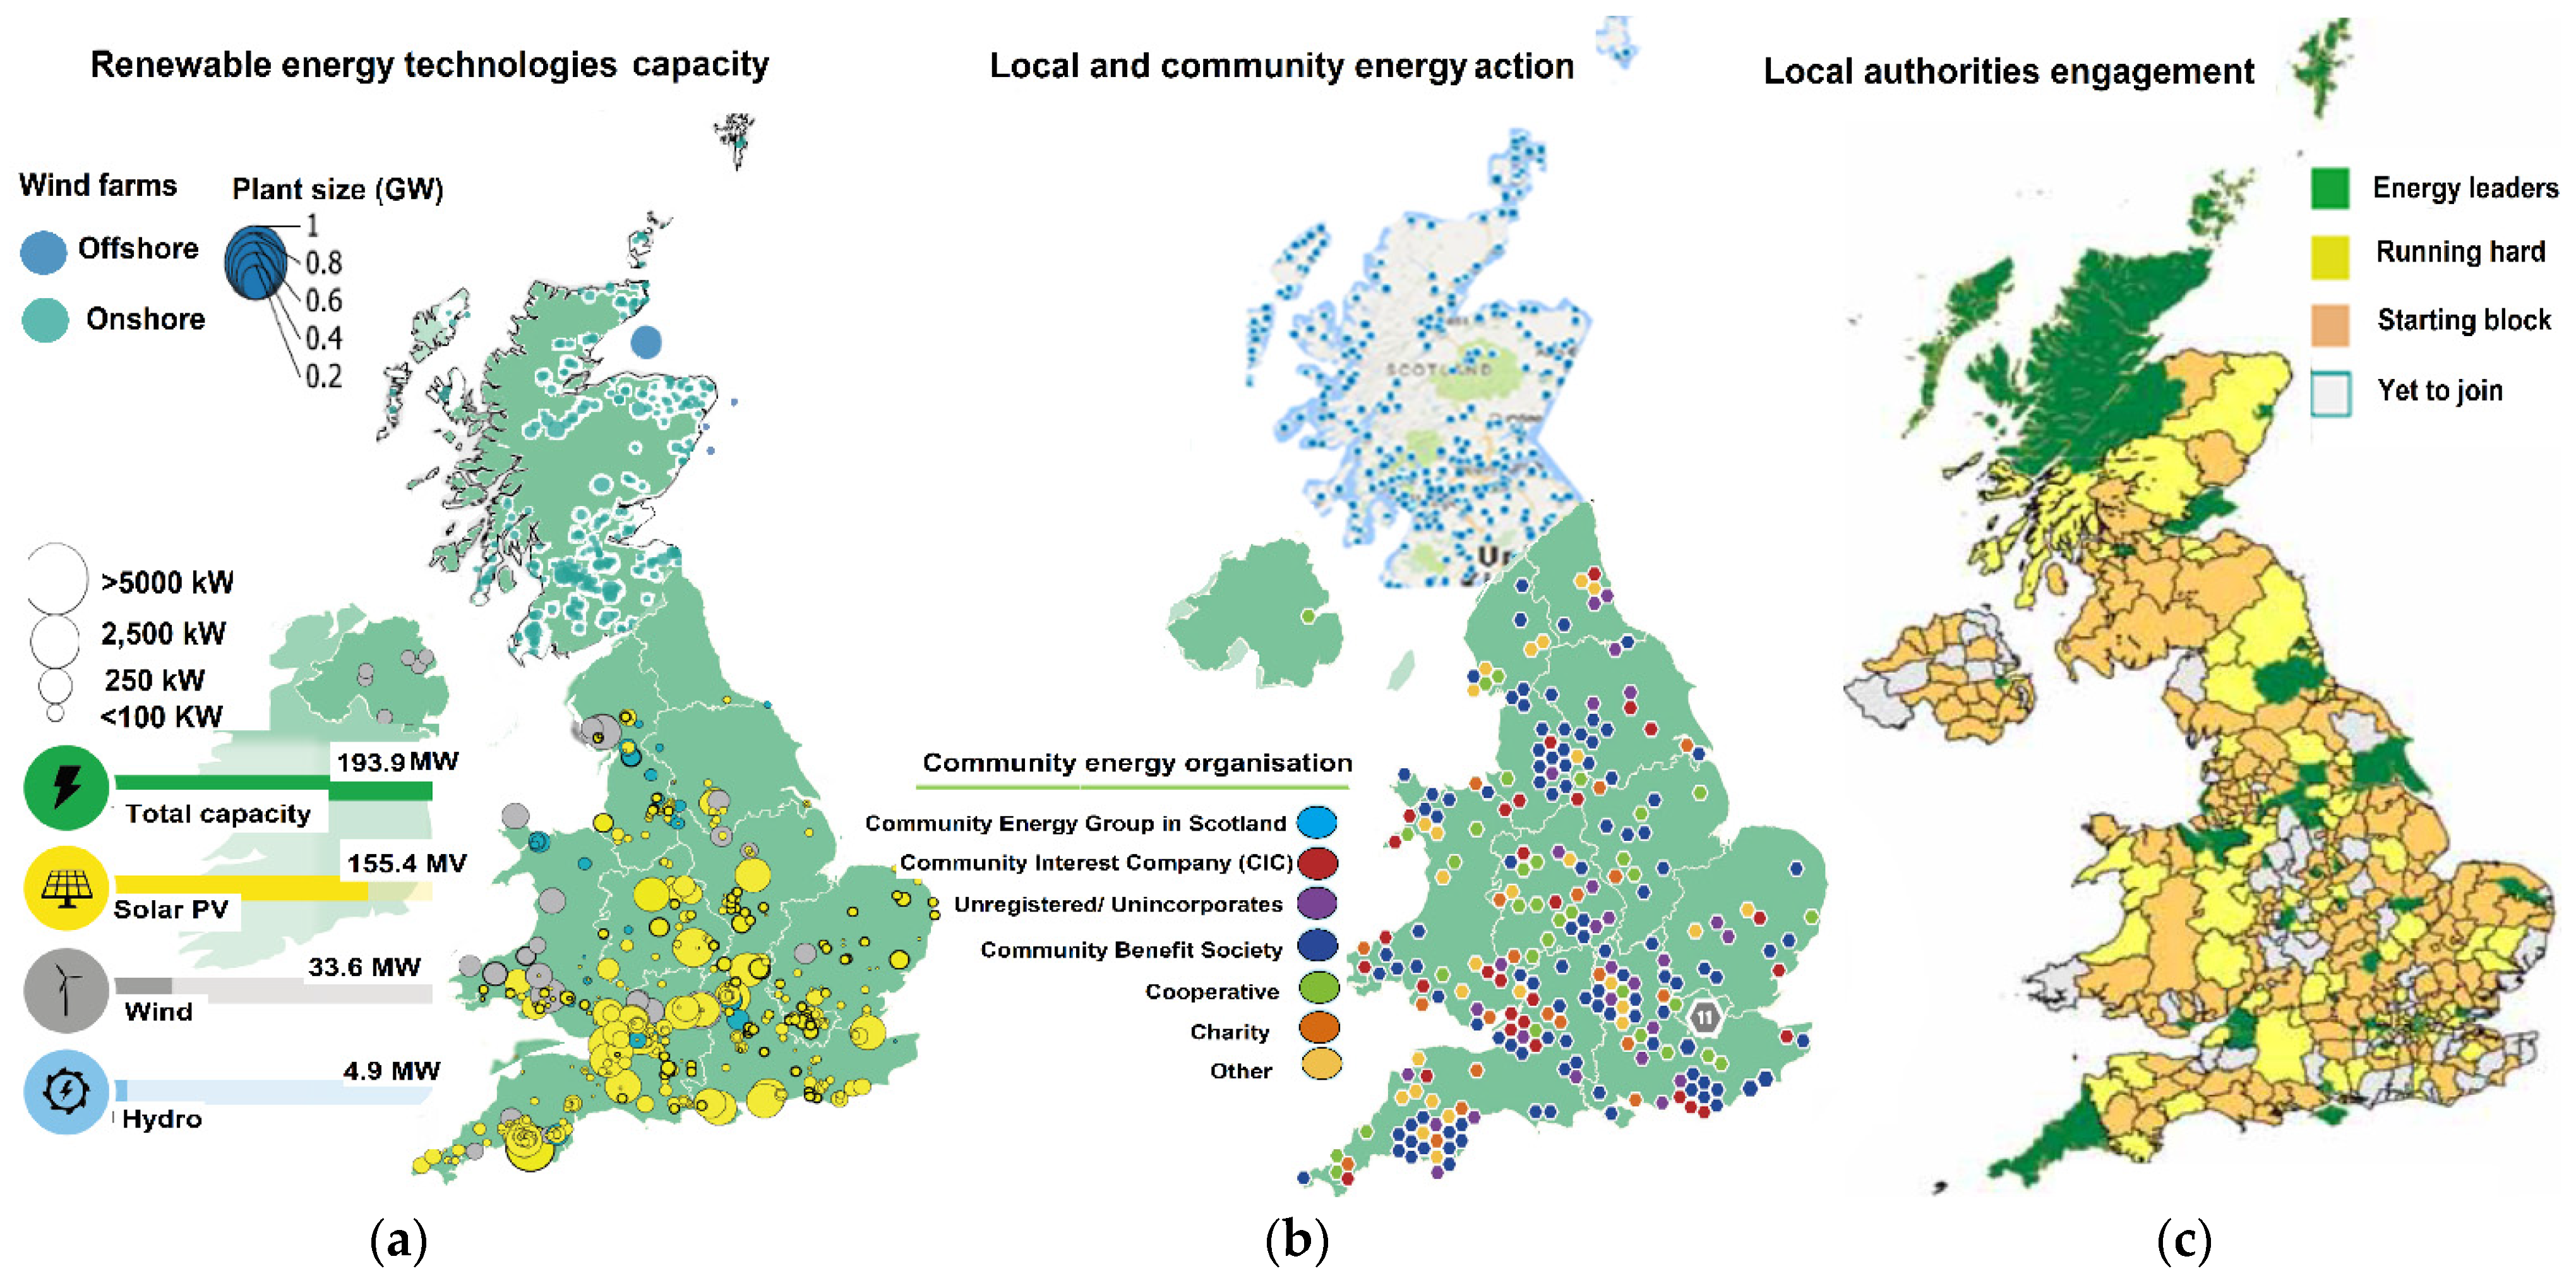
4.1.3. Geographic Location

Because local energy initiatives are area-based, the geographic location under different UK regions was closely examined and is presented in Figure 6. The majority of SLEETs were deployed in projects in areas with both network constraints and a high concentration of community energy groups, as mentioned in the Community Energy Strategy 2014 [8] and presented in the Community Energy Hub online map [80]. These areas included South East England (25 SLEETs in 20 projects), Scotland (12 SLEETs in 10 projects) and the Midlands (12 SLEETs in 9 projects), with IHDs, DEPs or thermal imaging being dominant. Interestingly, while information-driven tools were popular among the projects undertaken in South East England (15 out of 20 projects) and the Midlands (7 out of 9 projects), the majority of the projects in Scotland deployed interaction tools (7 out of 10 projects), possibly to overcome grid constraint [81,82,83]. These SLEETs may have been deployed in Scotland due to the surge in renewable electricity generation that had met 97% of its electricity demand by 2020 [84].
The spatial diffusion of SLEETs at the spatial resolution of the region, presented in Figure 6b, confirmed that the deployment of SLEETs was prevalent in South East and South West England, Scotland and the Midlands. As is evident in Figure 7, the deployment of SLEETs matched the engagement of active community energy groups [7,85,86], who acted as intermediaries in order to improve user engagement and maintain long-term participation in local energy projects [87]. Local authorities and renewable energy technologies were also present [7,88,89]. It was apparent that the energy engagement of local authorities in Scotland, Yorkshire and the Humber, South East, South West, North East and North West England (Figure 7c) was broadly matched with the distribution of SLEETs (Figure 6b), despite being at different stages in terms of engagement.

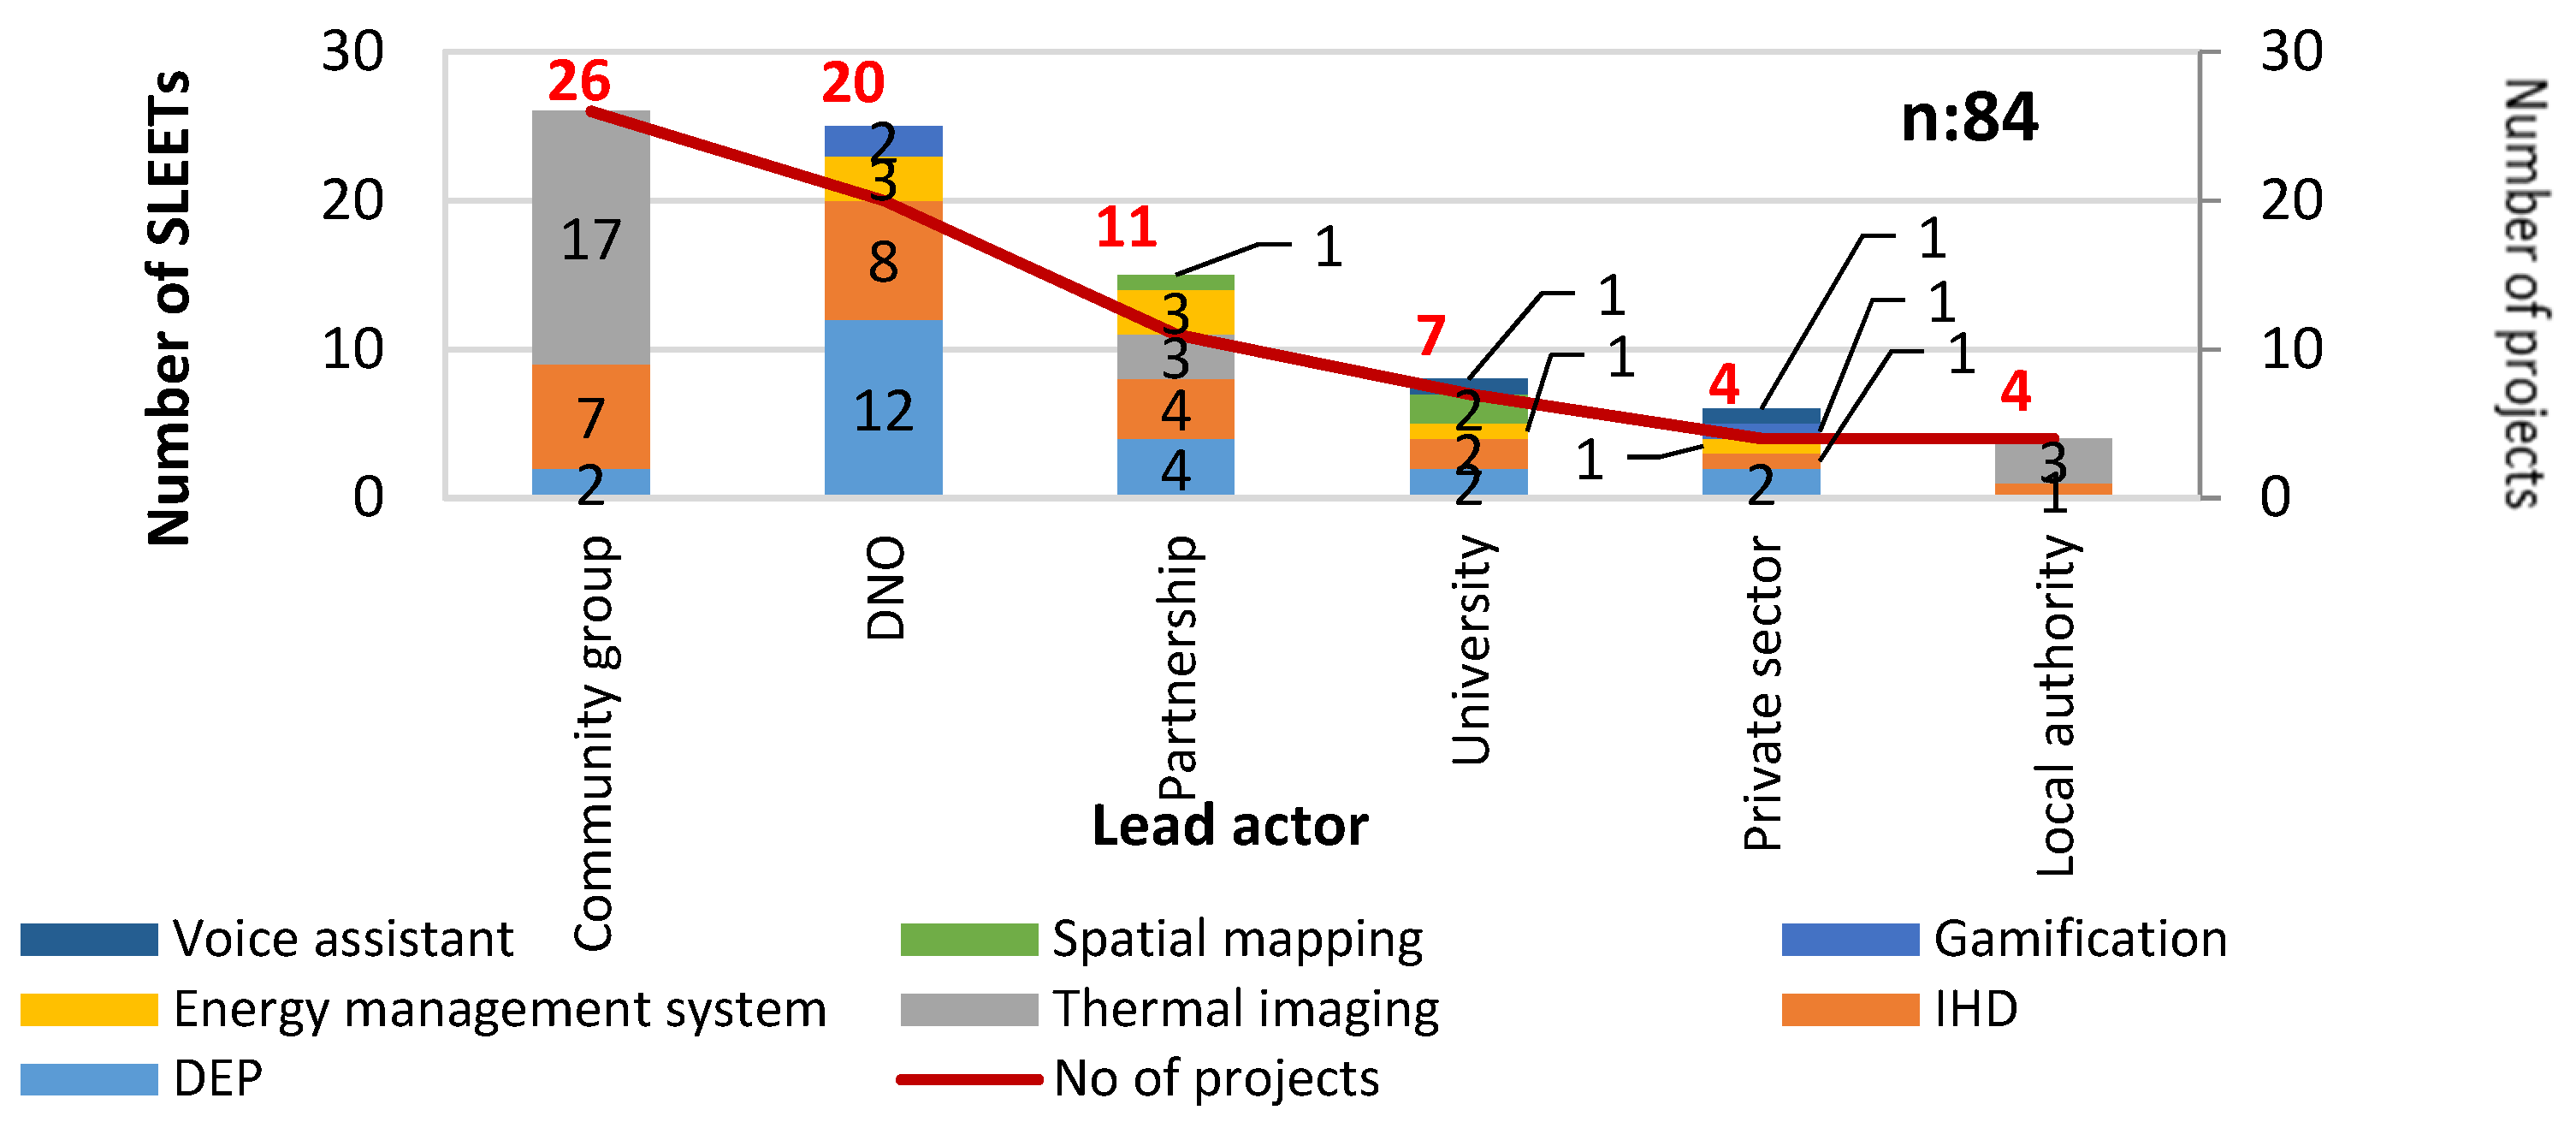
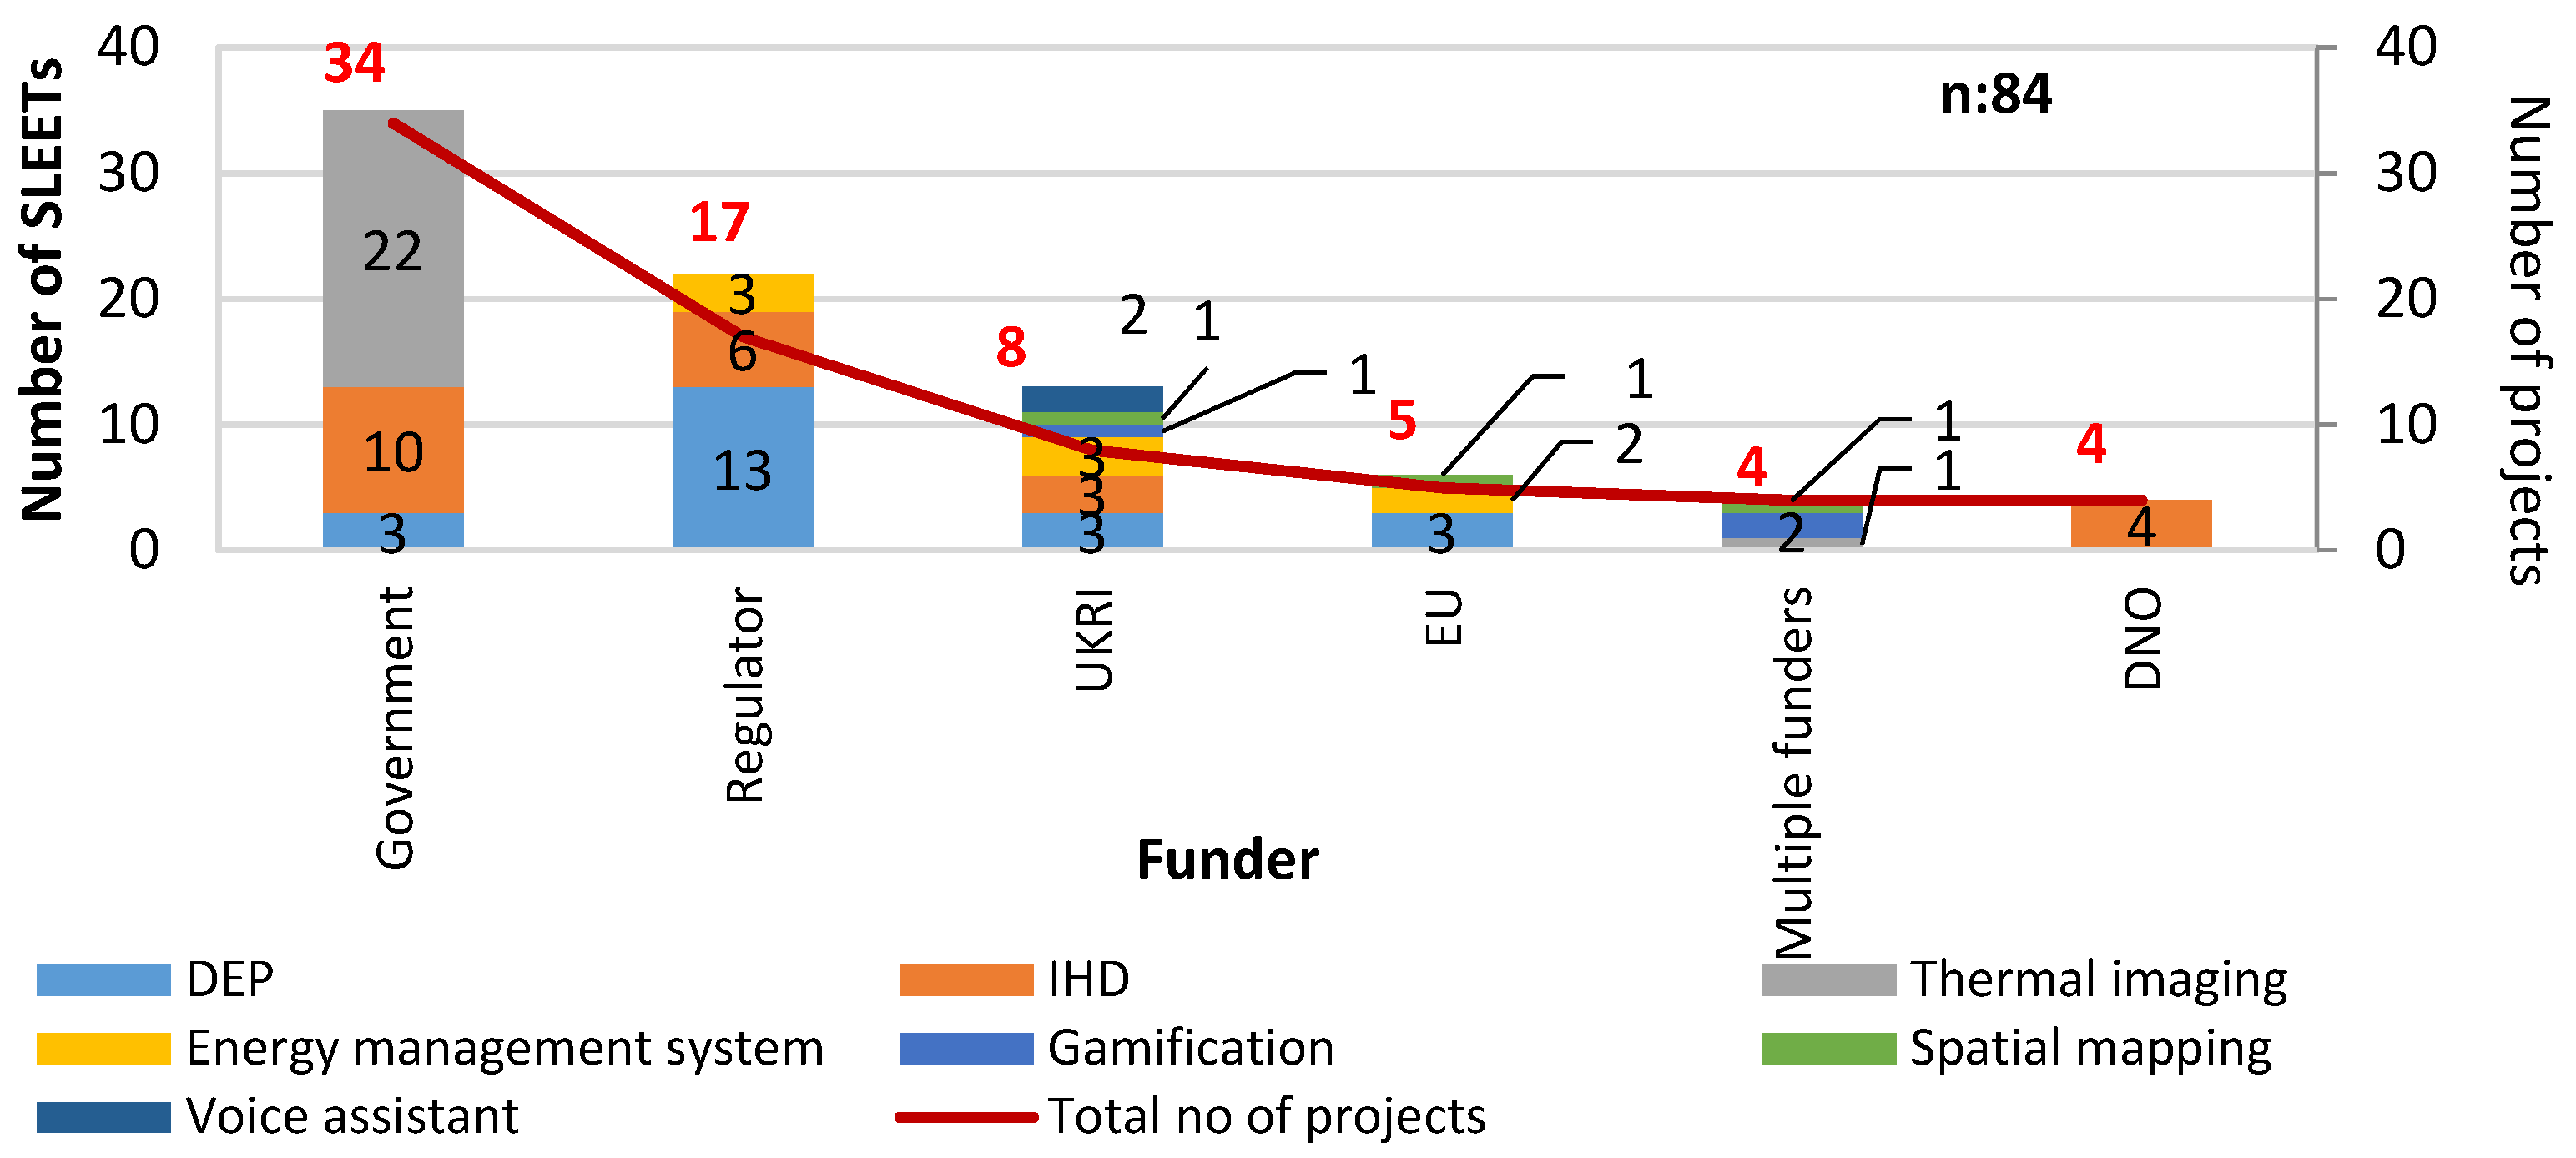
4.1.4. Lead Actors and Funders

The meta-study revealed that the majority of DEPs, as interaction tools, were deployed in the projects led by DNOs and carried out to improve energy management and reduce network pressure. Thermal imaging with visual interface was popular in community group-led projects aiming to improve energy efficiency (Figure 8). Analysis using the extent of the interaction showed that information-driven tools were popular among community group-led projects (24 out of 26 SLEETs) to engage users with local energy projects. For projects led by DNOs, SLEETs were mainly interaction-based (14 out of 25 SLEETs), and numeric SLEETs were dominant (23 out of 25 SLEETs).
The majority of the projects that deployed SLEETs were funded by the government in order to support net-zero carbon emission plans by reducing energy use and carbon emissions. In these, thermal imaging and IHDs were dominant (22 and 10 out of 34 SLEETs, respectively). The majority of the projects funded by regulators deployed DEPs (n: 13) in order to involve users as active participants in local energy projects and engage them in local energy management and energy trading (Figure 9).
Analysis also showed statistically significant relationships between user engagement methods and SLEETs. It was evident that where engagement was about informing and involving, information-driven tools with visual or numeric interfaces were deployed in order to encourage users to be involved in local energy projects, or to support them to engage through different activities, such as training and consultation events, or by providing incentives and offers. However, where user engagement was about involving, DEPs were used to involve users in local energy management and in the trading of local energy through interactive tools that allow users to interact with peer neighbours who can offer energy services.

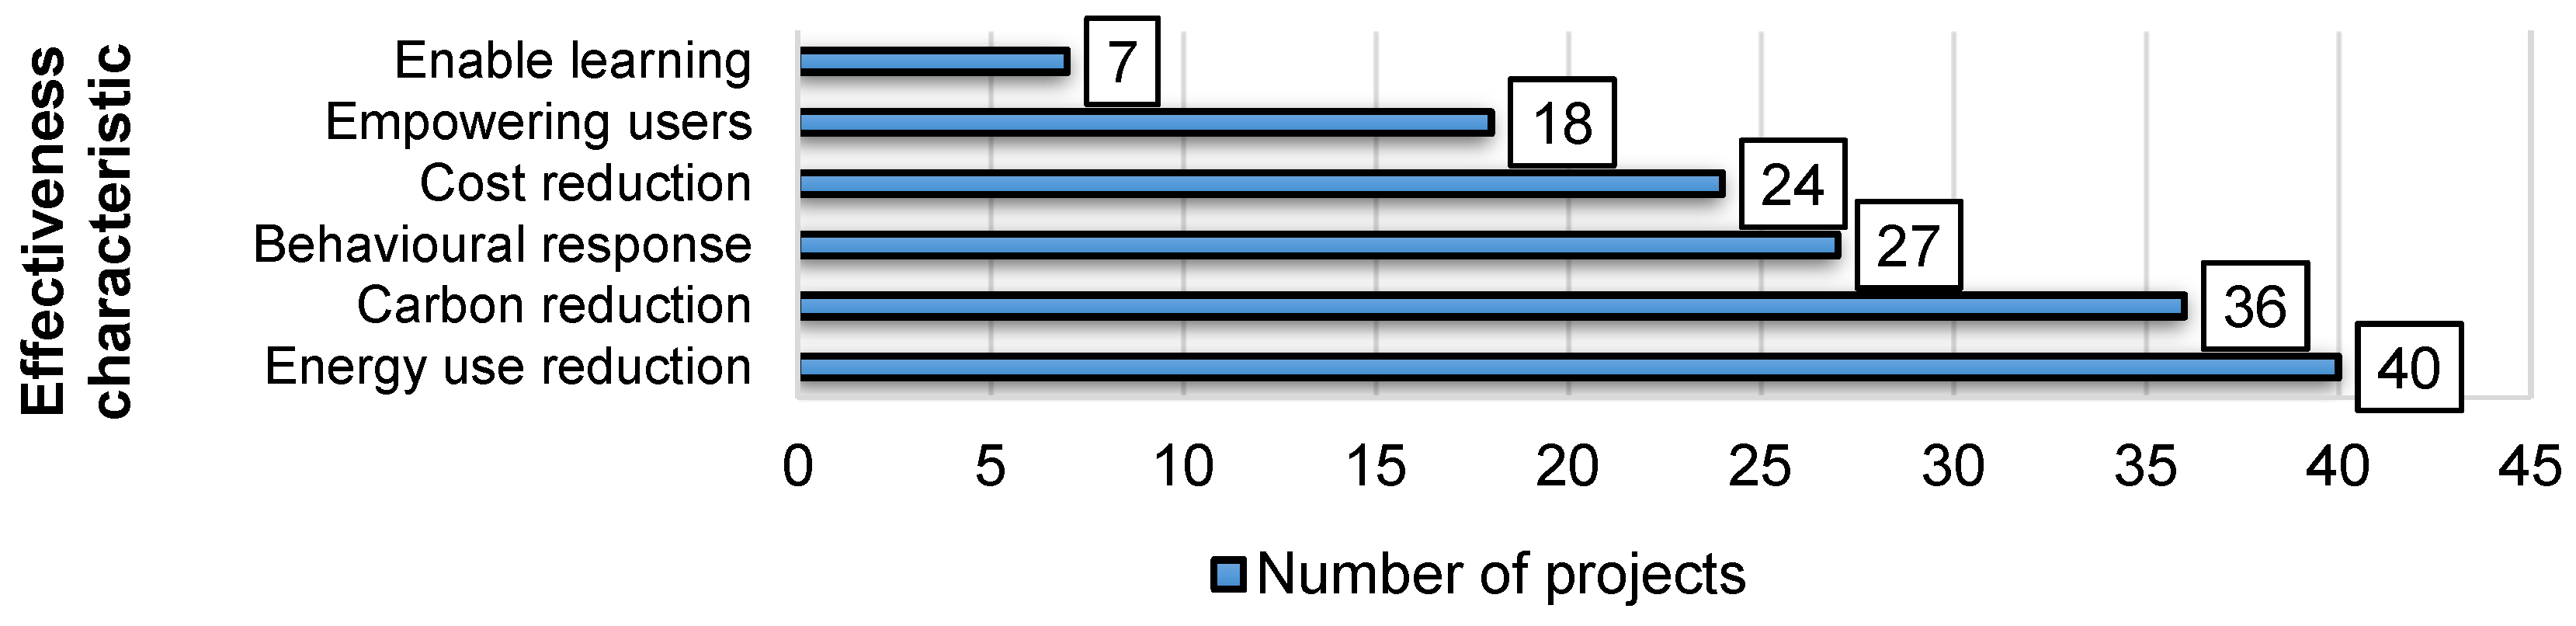
4.2. Effectiveness and Inclusiveness of SLEETs

The meta-study also evaluated the effectiveness and inclusiveness of SLEETs in local energy projects by the type of project and the energy vector, geographic location, start year, lead actor and funder. Effective SLEETs enable behavioural response, as well as carbon and energy use reduction; they also enable learning and empower users to become actively involved in local energy management or local energy markets so that they can trade the surplus energy generated by prosumers or stored in battery storage. Figure 10 provides the number of projects that reported specific effectiveness characteristics following the deployment of SLEETs. Each of the 72 projects exhibited multiple characteristics of effectiveness and inclusiveness. Energy use reduction and carbon reduction were the foremost characteristics, present in 40 and 36 projects, respectively, followed by behavioural response, cost reduction and empowering users. Only seven projects deployed SLEETs that enabled learning.
Analysis using Pearson’s Chi-square test identified a strong association between the type of energy initiative (CE, LE and SLES) and the effectiveness characteristics; these included behavioural responses, energy cost reduction, carbon reduction and empowering users (p-value < 0.01, 0.40 < Cramer’s V < 0.35 with df = 2). In CE projects, SLEETS were deployed to enable energy use and carbon reductions (n: 17 and 12 respectively) (Figure 11). Within SLES projects, SLEETs were deployed to support users in behavioural response (n: 21 projects), as well as cost reduction (n: 21) and carbon reduction (n: 20). SLEETs were also found to be effective in empowering users in SLES projects to manage and control energy or to trade surplus energy generated by prosumers or stored in battery storage (n: 18). Only SLES projects deployed SLEETs that empowered users.
SLEETs were more effective in enabling energy use and carbon reduction in the projects led by community groups (14 and 12 projects, respectively). Where the projects were led by DNOs and funded by regulators (n: 5), SLEETs were effective in empowering users to become active participants in local energy projects. In contrast, when the projects were led by community groups and funded by government, SLEETs were deployed to enable reductions in energy use and carbon (n: 14 and 12 projects, respectively).
Meta-study analysis revealed that the majority of the projects did not consider whether the delivery mode of SLEETs was inclusive, since only 15 out of the 72 projects deployed inclusive SLEETs to enhance user engagement and support vulnerable users and those on low incomes to save and control energy use effectively. The majority of SLEETs were found to exclude inclusive mode delivery, with only 15 out of the 72 projects considering the inclusiveness of SLEETs in order to enhance user engagement.
Within the limited number of inclusive SLEETs, the majority of the tools were deployed to actively involve users on low incomes in order to alleviate fuel poverty (14 out of 15 projects); this was followed by involving vulnerable users (n: 7). The majority of projects that deployed inclusive SLEETs were SLES projects (n: 10). Out of the projects that deployed inclusive SLEETs, 11 projects occurred between 2014–2016, coinciding with the introduction of the Renewable Heat Incentive (RHI) for the domestic sector in 2014 and the publication of the first ever community energy strategy in the UK. This demonstrates how local energy policies can involve diverse users to overcome local obstacles such as fuel poverty. Despite the low number of projects with inclusive SLEETs, it appeared that vulnerability became supported across the projects over time. Communities and the public sector were more likely to deploy inclusive SLEETS. These included groups led by DNOs (n: 7), universities (n: 6) or community groups (n: 5), and groups funded by the government (n: 6), UKRI (n: 6) and regulators (n: 5).

5. Discussion

Findings from the meta-study revealed that the majority of SLEETs were deployed in areas with a high capacity for renewable energy technologies (technology) and grid constraints, with the involvement of active community energy groups (people) and the engagement of local authorities in local area energy action (policy).
Information-driven SLEETs were found to be the most popular, focusing on analytics and unidirectional information (58%). In total, 30% of SLEETs offered some level of interaction that enabled user engagement, allowing users to interact with other local users or organisations to stimulate behavioural change. This was evident in the Ofgem-funded SAVE trial (Solent Achieving Value in Efficiency), with 4000 dwellings [90]. An online hub was trialled in this project, allowing residents to access real-time energy data and communicate with energy suppliers. This was supplemented by other forms of communication (e.g., emails and text messages) that encouraged residents to reduce their peak time electricity use by 10% [90,91]. Given the restrictions on face-to-face interaction imposed by the COVID-19 pandemic and the move to digital forms of communication and interaction, the role of SLEETs has become increasingly vital in allowing interaction amongst people (social engagement), and enabling control between people and technology (operation and control).
Despite the fact that SLEETs with some level of control can play a key role in energy demand reduction, as detailed in UKERC’s ‘Smart Power Sector’ scenario of smart grid futures [19], the meta-study revealed that only 12% of the studied tools gave users the ability to manage and control energy. The reviewed British gas HIVE projects, which used a smart-meter-enabled energy management system, confirmed that the personalised service, which was tested on over 500 dwellings, could successfully help over two thirds of residents to control their energy use, keeping them within their target energy budget [92]. Greensfelder [93] also found that enabling users to manage energy use remotely, such as pre-heating the building when the energy price is low, could help people save up to 14% on energy costs. SLEETs with the capability to control heating and electricity use can also help to shift energy use during the peak hours in response to price signals for local grid balancing [94,95]. The long-term impact of the Greenwich Energy Hero project, which enabled residents to manage and control their energy use through the use of smart energy management systems, revealed an 80% reduction in residents’ energy use across 665 homes [96]. This reduction in energy consumption successfully alleviated pressure on the local electricity network during the peak period [96], indicating the key role of SLEETs with control capabilities.
This study found associations between the type of local energy project and the type of SLEET that was deployed. Following the launch of the UK Industrial Strategy, there has been a rise in SLES projects focussed on the local economy and routes to the market, with DEPs possessing engagement interaction levels found to be popular. The majority of DEPs aimed to enhance local grid balancing and facilitate local energy trading between peers and local organisations. This was detailed in a working paper on digital energy platforms [65] that was prepared as a part of the Energy Revolution (EnergyREV) research programme, established in 2018. In contrast, information-driven tools were found to be dominant in CE projects (96% of SLEETs in CEs), possibly driven by UK Government-funded programmes, such as the Low-Carbon Communities Fund and LEAF, which aimed to improve energy efficiency through social learning. The role of community groups in providing advice and supporting reductions in energy use and changes in behaviour was identified by Klein and Coffey [97], Boyle et al. [98] and Watson et al. [99], who studied the role of community energy groups in the transition to sustainable energy.
It is evident that in order to enhance user engagement with local energy, SLEETs need to move beyond information-driven flow [13,14]. They should not only offer users information about energy, but also facilitate interaction between local users and organisations and allow users to manage energy use. Such SLEETs would help users to participate in local energy markets, possibly through DEPs and gamification, while enabling control through energy management systems and digital voice assistants. The reviewed GenGame tool revealed how the interaction aspect of SLEETs could promote the smart charging of EVs, saving over GBP 110 a year for over 250 drivers and cutting their carbon footprint by over 20% [100]. To deliver the best experience for users and encourage user engagement, SLEETs need to be accompanied by adequate training and be delivered through trusted intermediaries, such as local community groups. These intermediaries can facilitate the aggregation of learning, providing advice, creating networks and shaping policy, as identified by Sovacool, Turnheim [86], Grandclément, Karvonen [101] and Hyysalo, Juntunen [102]. Interestingly, none of the SLEETs identified were accompanied by the training of users through inclusive modes of delivery (e.g., in-home visits, community events). The training of users in SLEETs is vital for sustaining user interest in SLEETs and avoiding unintended consequences.
SLEETs can potentially enhance user engagement by addressing the requirements of vulnerable users [69]. However, the meta-study identified that only 21% of the local energy projects deployed SLEETs with an inclusive mode of delivery that engaged with vulnerable and low-income groups. Bent and Kmetty [103] found that inclusive SLEETs tend to be tailored to user interests and requirements. For example, for low-income groups, this could mean framing advisory messages through SLEETs that utilize the economic benefits of shifting energy use during the peak period. For those users with an interest in technology, SLEETs can provide advice to users on how smart thermostats can help them manage heating remotely through a mobile app. In contrast, for the elderly, an appropriate voice-controlled SLEET could be developed that allows users to control energy verbally and advise them on how to adjust time and temperature controls to reduce energy use without compromising their comfort. Such SLEETs were used in only two out of the 72 projects. The voice-activated control that was deployed in the studied SCENe project confirmed how voice-based interaction could support residents in gaining energy feedback, and provide a socially inclusive interface for vulnerable users in order to monitor and control energy [48]. Likewise, control-driven SLEETs, such as gamification, were used only in 3 out of the 72 projects, even though delivering financial incentives, such as vouchers through gamification methods, could encourage low-income users to get involved in local energy management [37].
It was apparent that there was a lack of interest in deploying SLEETs to address the requirements of vulnerable users, such as elderly and disabled users, those in fuel poverty and those who do not have access to digital technologies. The inclusiveness of SLEETs is vital for improving users’ acceptance of smart local energy initiatives, as identified by Suboticki and Swiatkiewicz-Mosny [70], who emphasise the impact of socio-demographic characteristics and users’ habits on energy use. Digital voice assistants can be appropriate for vulnerable users and those who do not prefer to use a smart mobile app or a smart thermostat. They can also allow people with reduced mobility to interact effectively with energy systems. The acceptance and implementation of smart energy initiatives in local areas can be enhanced by having effective and inclusive SLEETs in place that align with local users’ requirements and are supported by local stakeholders to foster trust. To maintain long-term user engagement and in order for SLEETs to become widespread, data transparency is also vital so that users know what data are being collected, for what purpose, by whom and for how long, as found by Suboticki et al. [70] and Schweiger et al. [94]. Without data transparency, users may lose trust in SLEETs, despite showing initial interest in engaging with SLEETs. Data transparency was not a key aspect considered in the projects identified in this meta study.
With the announcement of the UK Government’s ten-point plan for a green industrial revolution [104] in order to achieve net-zero, it is expected that SLEETs may become widespread with the growth in smart communities and local energy projects. Given that a key dimension of such projects is user engagement, it is necessary to move towards developing appropriate scoring methods (Key Performance Indicators) to measure the prevalence, effectiveness and inclusiveness of SLEETs in a consistent manner.

6. Conclusions

This paper adopted a systematic meta-study approach to investigate the prevalence, effectiveness and inclusiveness of SLEETs deployed in local energy projects undertaken in the UK from 2008 to 2018. An extensive review of the grey and academic literature identified 84 SLEETs deployed across 72 local energy projects. An analysis framework was devised in order to characterise the seven identified SLEETs (i.e., IHDs, thermal imaging, spatial mapping, gamification, DEPs, energy management systems and digital voice assistants) using the extent of the interaction (information, interaction and control), the model of communication and the interface design (numeric, visual or aural). The meta-study found that only 12% of SLEETs offered control and 30% offered interaction, as opposed to 58% of information-driven SLEETs.
The prevalence of SLEETs revealed that SLES projects were dominant with a focus on digitalisation of energy, while DNOs were identified as the dominant lead actor in the deployment of interaction-driven tools, enabling users to become active participants in local energy management. In contrast, community energy projects focused on information-driven tools, such as IHDs and thermal imaging, in order to encourage energy efficiency and energy demand reduction activities. The majority of SLEETs were deployed in areas with a high capacity for renewable energy technologies, with the involvement of active community energy groups and the engagement of local authorities. Looking forward, this provides an opportunity for community energy groups to take a role in advocating interactive tools to enable users and communities to experience the energy management benefits they provide. Interestingly, while the inclusiveness of SLEETs is recognised to be vital for the scalability and replicability of smart local energy initiatives, only 21% of the projects deployed inclusive SLEETs for vulnerable groups and users on a low income. This highlights the key role of control-driven and interactive SLEETs that allow diverse users to manage energy use effectively; if coupled with incentivising users to reduce their energy use, this may shift energy consumption from peak hours. Digital voice assistant controls were deployed across 2 out of the 72 identified projects. This is an area that requires further development in order to ensure that inclusive modes for delivery are provided for vulnerable users.
As the energy system in the UK and internationally becomes increasingly decarbonised, decentralised, digitalised and democratised, SLEETs play a role in bringing local energy systems closer to the people who will use or benefit from them. This is more evident following the release of the recent Net-Zero review in the UK [105], which highlighted the lack of digital technologies in decentralised energy projects. Past experience shows that the outcomes of SLEETs may not naturally filter their way through to policy makers. Understanding user engagement and participation gathered through SLEETs may require the increased efforts of policy makers. To sustain user acceptance and trust, policy makers need to ensure that data transparency is promoted in terms of what data are collected, by whom and for what purpose. This will require capturing the actual experiences of different user groups (socio-demographics, vulnerabilities, low-income) with SLEETs in the future.

Author Contributions

Conceptualization, R.G.; methodology, R.G. and S.Z.; formal analysis, R.G. and S.Z.; investigation, R.G. and S.Z.; data curation, R.G., S.Z. and J.M.; writing—original draft preparation, R.G., S.Z. and J.M.; writing—review and editing, R.G., S.Z. and J.M.; supervision, R.G. All authors have read and agreed to the published version of the manuscript.

Funding

The study is financially supported by the EPSRC funded EnergyREV Plus project on User influence tools, grant number EP/S03188X/1, EnergyRev-Core project, grant number EP/S031723/1, and Innovate UK funded Project LEO, Project ref: 104781.

Data Availability Statement

Meta-data used in the paper are available in Appendix A. Detailed data presented in this study are available on request from the corresponding author.

Acknowledgments

We are grateful to reviewers for their helpful comments and feedback.

Conflicts of Interest

The authors declare no conflict of interest. The funders had no role in the design of the study; in the collection, analyses, or interpretation of data; in the writing of the manuscript; or in the decision to publish the results.

Appendix A

Table A1. List of SLEETs deployed in local energy projects that were examined in this paper.
No.Title of the ProjectIHDThermal ImagingSpatial MappingGamificationDEPEnergy Management SystemVoice Assistant
1Accelerating Renewable Connections (ARC)
2Project SCENe
3Creative Energy Homes
4Distributed Storage and Solar Study
5Flexible Networks for a Low Carbon Future
6Fusion
7Glasgow Future Cities–Demand Side Management
8inteGRIDy
9Low Carbon London
10LV Connect and Manage
11My Electric Avenue (Invation Squared)
12Network Equilibrium
13Power Saver Challenge
14Shift & Save
15Smart Fintry
16Smart Hooky
17Smart Street
18SMILE Orkney
19SoLa Bristol
20Sunshine Tariff
21Thames Valley Vision
22Zero Plus
23ACE (Action in Caerau and Ely)
24Act on Energy
25Action for Sustainable Living
26Activating Community Engagement (ACE)
27APAtSCHE project
28Arcola Theatre Production Company
29Barldswick Town Council
30Bathford Energy Group
31Bishops Lydeard, Nr Taunton, Somerset.
32British Gas HIVE
33Burnage Tenants
34CEGADS
35Chorlton Refurb
36Climate Friendly Bradford on Avon
37Coleshill Parish Council
38Consumer preferences for smart homes
39Craghead Development Trust
40Customer Led Network Revolution (CLNR)
41Danby Village Hall
42Developing “The GenGame” domestic smart grid platform
43DTC ENERGY: Technologies for a low carbon future
44East Hampshire Environmental Network (EHEN)
45Ebbs and flows
46Electric Nation
47Energyzing Insch
48Exmoor National Park
49FALCON
50Friends of Earsdon
51Glen Parva LEAF
52Green Team Resident Champions
53Greenwatt way
54Greenwich Energy Heros
55Hackney Co-operative Developments CIC
56Heat Smart Orkney
57LESS (Lancaster District) CIC
58ORIGIN
59Poole Tidal Energy Partnership
60REFIT: Personalised Retrofit Decision Support Tools
61Smart metering implementation programme
62Solent Achieving Value from Efficiency (SAVE)
63St. John on Bethnal Green, LB Tower
64Sustainability Invention & Energy demand
65Taunton Transition Town
66Transition Belper
67Transition Bro Gwaun
68Transition Cleeve
69Transition Eynsham Area (GreenTEA)
70Transition Town Peckham
71Tring in Transition
72Villages Housing Association—Stockbridge

References

  1. BEIS; Skidmore, C. UK Becomes First Major Economy to Pass Net Zero Emissions Law, 27th ed.; Department for Business, Energy & Industrial Strategy: London, UK, 2019. [Google Scholar]
  2. Committee on Climate Change. Net Zero Technical Report; Committee on Climate Change: London, UK, 2019. [Google Scholar]
  3. Committee on Climate Change. Net Zero—The UK’s Contribution to Stopping Global Warming; Committee on Climate Change: London, UK, 2019. [Google Scholar]
  4. Ford, R.; Maidment, C.; Vigurs, C.; Fell, M.J.; Morris, M. Smart Local Energy Systems (SLES): A Conceptual Review and Exploration; University of Strathclyde Publishing: Strathclyde, UK, 2019. [Google Scholar]
  5. Foxon, T.J. Transition pathways for a UK low carbon electricity future. Energy Policy 2013, 52, 10–24. [Google Scholar] [CrossRef]
  6. UKRI. Prospering from the Energy Revolution. 2019. Available online: https://www.ukri.org/innovation/industrial-strategy-challenge-fund/prospering-from-the-energy-revolution/ (accessed on 9 June 2020).
  7. Robinson, S.; Stephen, D. Community Energy—State of the Sector 2020 Infographics; Community Energy England: London, UK, 2020. [Google Scholar]
  8. DECC. Community Energy Strategy: Full Report; Department of Energy and Climate Change (DECC): London, UK, 2014. [Google Scholar]
  9. Walker, G.; Devine-Wright, P. Community renewable energy: What should it mean? Energy Policy 2008, 36, 497–500. [Google Scholar] [CrossRef]
  10. Bridgeman, T.; Lamley, A.; Goaman, D. Evidence Assessment of Local Energy; Centre for Sustainable Energy (CSE): Bristol, UK, 2019. [Google Scholar]
  11. Devine-Wright, P. Community versus local energy in a context of climate emergency. Nat. Energy 2019, 4, 894–896. [Google Scholar] [CrossRef]
  12. Global Data Energy. The Role of Consumer Engagement in Major Markets’ Smart Grid Aspirations. 2019. Available online: https://www.power-technology.com/comment/smart-grid-technology/ (accessed on 10 April 2020).
  13. Moustaka, V.; Theodosiou, Z.; Vakali, A.; Kounoudes, A.; Anthopoulos, L.G.; Change, S. Enhancing social networking in smart cities: Privacy and security borderlines. Technol. Forecast. Soc. Chang. 2019, 142, 285–300. [Google Scholar] [CrossRef]
  14. Rodrigues, L.; Gillott, M.; Waldron, J.A.; Cameron, L.; Tubelo, R.; Shipman, R. Community Energy Networks in the Making- Project SCENe, Nottingham. In Proceedings of the Smart and Healthy within the 2-Degree Limit-PLEA, Hong Kong, China, 10–12 December 2018; pp. 839–844. [Google Scholar]
  15. Kleiminger, W.; Mattern, F.; Santini, S.J. Predicting household occupancy for smart heating control: A comparative performance analysis of state-of-the-art approaches. Energy Build. 2014, 85, 493–505. [Google Scholar] [CrossRef]
  16. Morris, M.; Hardy, J.; Bray, R.; Elmes, D.; Ford, R.; Hannon, M.; Radcliffe, J. Working Paper 3: Decarbonisation of Heat: How Smart Local Energy Systems Can Contribute; University of Strathclyde: Glasgow, UK, 2022. [Google Scholar]
  17. Casals, M.; Gangolells, M.; Macarulla, M.; Forcada, N.; Fuertes, A.; Jones, R.V. Assessing the effectiveness of gamification in reducing domestic energy consumption: Lessons learned from the EnerGAware project. Energy Build. 2020, 210, 109753. [Google Scholar] [CrossRef]
  18. Vlaev, I.; Dolan, P. Action change theory: A reinforcement learning perspective on behavior change. Rev. Gen. Psychol. 2015, 19, 69–95. [Google Scholar] [CrossRef]
  19. Balta-Ozkan, N.; Davidson, R.; Bicket, M.; Whitmarsh, L. Social barriers to the adoption of smart homes. Energy Policy 2013, 63, 363–374. [Google Scholar] [CrossRef]
  20. Gangale, F.; Mengolini, A.; Onyeji, I. Consumer engagement: An insight from smart grid projects in Europe. Energy Policy 2013, 60, 621–628. [Google Scholar] [CrossRef]
  21. Koirala, B.P.; Araghi, Y.; Kroesen, M.; Ghorbani, A.; Hakvoort, R.A.; Herder, P.M. Trust, awareness, and independence: Insights from a socio-psychological factor analysis of citizen knowledge and participation in community energy systems. Energy Res. Soc. Sci. 2018, 38, 33–40. [Google Scholar] [CrossRef]
  22. Barry, C.; Han, H.; McGinty, B. Trust in Science and COVID-19. Johns Hopkins Bloomberg School of Public Health Expert Insights. 2020. Available online: https://www.jhsph.edu/covid-19/articles/trust-in-science-and-covid-19.html (accessed on 8 February 2023).
  23. HC. Evidence Check: Smart Metering of Electricity and Gas. In Sixth Report of Session 2016–17; House of Commons, Science and Technology Committee: London, UK, 2016. [Google Scholar]
  24. Herrmann, M.R.; Brumby, D.P.; Oreszczyn, T.; Gilbert, X.M. Does data visualization affect users’ understanding of electricity consumption? Build. Res. Inf. 2018, 46, 238–250. [Google Scholar] [CrossRef] [Green Version]
  25. Schultz, P.W.; Estrada, M.; Schmitt, J.; Sokoloski, R.; Silva-Send, N. Using in-home displays to provide smart meter feedback about household electricity consumption: A randomized control trial comparing kilowatts, cost, and social norms. Energy 2015, 90, 351–358. [Google Scholar] [CrossRef] [Green Version]
  26. Darby, S.; Liddell, C. Communicating ‘Smartness’: Smart Meter Installers in UK Homes. 1991–2001; European Council for an Energy-Efficient Economy Summer Study: Hyres, France, 2015. [Google Scholar]
  27. SSEN. Power Track Map. 2019. Available online: https://www.ssen.co.uk/Powertrack/ (accessed on 10 December 2019).
  28. Bush, R.; Bale, C. Energy planning tools for low carbon transitions: An example of a multicriteria spatial planning tool for district heating. J. Environ. Plan. Manag. 2019, 62, 2186–2209. [Google Scholar] [CrossRef] [Green Version]
  29. Gartland, D. Dublin City Spatial Energy Demand Analysis; Codema and Dubline City Council: Dublin, Ireland, 2015. [Google Scholar]
  30. Bale, C.; Bush, R.; Taylor, P. Spatial Mapping Tools for District Heating (DH): Helping Local Authorities Tackle Fuel Poverty; Centre for Integrated Energy Research, University of Leeds: Leeds, UK, 2014. [Google Scholar]
  31. Gartland, D. GIS Techniques Applied to Energy Mapping for Local Authority Energy Spatial Planning; Codema Dublin’s Energy Agency: Dublin, Ireland, 2015. [Google Scholar]
  32. Boomsma, C.; Goodhew, J.; Goodhew, S.; Pahl, S.; Science, S. Improving the visibility of energy use in home heating in England: Thermal images and the role of visual tailoring. Energy Res. Soc. Sci. 2016, 14, 111–121. [Google Scholar] [CrossRef] [Green Version]
  33. ESC. Energy System Catapult: Digital Lanscape; Energy Systems Catapult: London, UK, 2019. [Google Scholar]
  34. ESC. Smart Systems and Heat: Phase 2; Energy Systems Catapult: London, UK, 2019; Available online: https://es.catapult.org.uk/impact/projects/smart-systems-and-heat/smart-systems-and-heat-phase-2/ (accessed on 24 April 2020).
  35. Hardy, J.; Morris, M.; Hannon, M.; Morstyn, T.; Gaura, E. Policy & Regulatory Landscape Review Series–Working Paper 2: Digital Energy Platforms; University of Strathclyde Publishing: Strathclyde, UK, 2020. [Google Scholar]
  36. Verkade, N.; Höffken, J. Is the Resource Man coming home? Engaging with an energy monitoring platform to foster flexible energy consumption in the Netherlands. Energy Res. Soc. Sci. 2017, 27, 36–44. [Google Scholar] [CrossRef]
  37. Bird, C.; Chitchyan, R. Towards Requirements for a Demand Side Response Energy Management System for Households. arXiv 2019, arXiv:1908.02617. [Google Scholar]
  38. Dorahaki, S.; Rashidinejad, M.; Abdollahi, A.; Mollahassani-pour, M. A novel two-stage structure for coordination of energy efficiency and demand response in the smart grid environment. Int. J. Electr. Power Energy Syst. 2018, 97, 353–362. [Google Scholar] [CrossRef]
  39. Greenwich Energy Hero. What is Greenwich Energy Hero? 2020. Available online: https://greenwichenergyhero.org/ (accessed on 22 April 2020).
  40. OFGEM. OFGEM’s Future Insights Series: Flexibility Platforms in Electricity Markets; OFGEM: London, UK, 2019. [Google Scholar]
  41. Parag, Y.; Sovacool, B.K. Electricity market design for the prosumer era. Nat. Energy 2016, 1, 16032. [Google Scholar] [CrossRef]
  42. Beck, A.L.; Chitalia, S.; Rai, V. Not so gameful: A critical review of gamification in mobile energy applications. Energy Res. Soc. Sci. 2019, 51, 32–39. [Google Scholar] [CrossRef]
  43. Konstantakopoulos, I.C.; Barkan, A.R.; He, S.; Veeravalli, T.; Liu, H.; Spanos, C. A deep learning and gamification approach to improving human-building interaction and energy efficiency in smart infrastructure. Appl. Energy 2019, 237, 810–821. [Google Scholar] [CrossRef]
  44. Johnson, D.; Horton, E.; Mulcahy, R.; Foth, M. Gamification and serious games within the domain of domestic energy consumption: A systematic review. Renew. Sustain. Energy Rev. 2017, 73, 249–264. [Google Scholar] [CrossRef] [Green Version]
  45. Kazhamiakin, R.; Marconi, A.; Martinelli, A.; Pistore, M.; Valetto, G. A gamification framework for the long-term engagement of smart citizens. In Proceedings of the 2016 IEEE International Smart Cities Conference (ISC2), Trento, Italy, 12–15 September 2016; pp. 1–7. [Google Scholar]
  46. Alla, A.; Nafil, K. Gamification in IoT Application: A Systematic Mapping Study. Procedia Comput. Sci. 2019, 151, 455–462. [Google Scholar] [CrossRef]
  47. Morganti, L.; Pallavicini, F.; Cadel, E.; Candelieri, A.; Archetti, F.; Mantovani, F. Gaming for Earth: Serious games and gamification to engage consumers in pro-environmental behaviours for energy efficiency. Energy Res. Soc. Sci. 2017, 29, 95–102. [Google Scholar] [CrossRef]
  48. SCENe. How Can Smart Technology Improve Your Houshold Energy Experience and Save You Money. 2018. Available online: https://www.projectscene.uk/how-can-smart-technology-improve-your-household-energy-experience-and-save-you-money/ (accessed on 23 December 2019).
  49. SCENe. Project SCENe. 2016. Available online: https://www.projectscene.uk/ (accessed on 22 April 2020).
  50. SSEN. Save (Solent Achieving Value from Efficiency) Close Down Report; Scottish & Southern Electricity Networks: London, UK; University of Southampton: Southampton, UK; DVN GL and Neighbourhood Economics (NEL): London, UK, 2019. [Google Scholar]
  51. British Gas. HIVE Products. 2019. Available online: https://www.hivehome.com/?cid=ppc.goo.bran...&gclsrc=aw.ds&&gclid=EAIaIQobChMI4t74iP6y5gIVg7HtCh2maQeFEAAYASAAEgKvPfD_BwE&gclsrc=aw.ds (accessed on 10 December 2019).
  52. Colon, A. The Best Smart Home Automation Hubs of 2015. 2015. Available online: https://uk.pcmag.com/home-automation-hubs/35777/the-best-smart-home-automation-hubs-of-2015 (accessed on 10 December 2019).
  53. In Home Displays. In-Home Display Products. 2019. Available online: http://www.in-home-displays.co.uk/ (accessed on 23 December 2019).
  54. Low Carbon Hub. The CAG Project Guide to: Running a Thermal Imaging Project; The CAG Project (Community Action Group): Washington, DC, USA, 2018. [Google Scholar]
  55. ESC. Smart Energy Services for Low Carbon Heat. In Smart Systems and Heat Programme Phase 2—Summary of Key Insights and Emerging Capabilities; Energy Systems Catapult: Birmingham, UK, 2019. [Google Scholar]
  56. Hardy, J.; Morris, M. Policy & Regulatory Landscape Review Series—Working Paper 2: Digital Energy Platforms (Draft); Energy Revolution Research Centre: Strathclyde, UK, 2019. [Google Scholar]
  57. SAVE. Dynamic Pricing Trials. 2019. Available online: https://save-project.co.uk/dynamic-pricing-trials/ (accessed on 22 April 2020).
  58. Lazar, J. Designing Capacity Market for D3 Resources; Belgium Regulatory Assistance Project: Brussels, Belgium, 2011. [Google Scholar]
  59. Wood, G.; Day, R.; Creamer, E.; Van Der Horst, D.; Hussain, A.; Liu, S.; Shukla, A.; Iweka, O.; Gaterell, M.; Petridis, P.; et al. Sensors, sense-making and sensitivities: UK household experiences with a feedback display on energy consumption and indoor environmental conditions. Energy Res. Soc. Sci. 2019, 55, 93–105. [Google Scholar] [CrossRef]
  60. Strengers, Y. Smart Energy Technologies in Everyday Life: Smart Utopia; Springer: Berlin/Heidelberg, Germany, 2013. [Google Scholar]
  61. Faheem, M.; Butt, R.A.; Raza, B.; Ashraf, M.W.; Ngadi, M.A.; Gungor, V. Energy efficient and reliable data gathering using internet of software-defined mobile sinks for WSNs-based smart grid applications. Comput. Stand. Interfaces 2019, 66, 103341. [Google Scholar] [CrossRef]
  62. Greany, S. How Homebeat App Used Gamification and Mobile to Incentivize Customers to Adopt New Habits? 2016. Available online: https://www.elucidat.com/blog/gamification-mobile-homebeat-app/ (accessed on 23 December 2019).
  63. AlSkaif, T.; Lampropoulos, I.; van den Broek, M.; van Sark, W. Gamification-based framework for engagement of residential customers in energy applications. Energy Res. Soc. Sci. 2018, 44, 187–195. [Google Scholar] [CrossRef]
  64. Dwivedi, A.K.; Shimi, S.L. Home Automation and Energy Management using Android App. Int. J. Eng. Res. Technol. 2015, 4, 265101. [Google Scholar]
  65. Morris, M.; Hardy, J.; Guara, E.; Hannon, M.; Morstyn, T. Working Paper 2: Digital Energy Platforms; Policy and Regulatory Landscape Review Series; EnergyRev: Glasgow, UK, 2020. [Google Scholar]
  66. ECC. Local Energy; Energy and Climate Change Committee: London, UK, 2013. [Google Scholar]
  67. Rosenow, J.; Lowes, R. Heating without the Hot Air: Principles for Smart Heat Electrification; Belgium Regulatory Assistance Project: Brussels, Belgium, 2020. [Google Scholar]
  68. DECC. The Energy Efficiency Strategy: The Energy Efficiency Opportunity in the UK; Department of Energy and Climate Change: London, UK, 2012. [Google Scholar]
  69. Francis, C.; Costa, A.S.; Thomson, R.C.; Ingram, D.M. Developing the Framework for Multi-Criteria Assessment of Smart Local Energy Systems; EnergyREV: Glasgow, UK, 2020. [Google Scholar]
  70. Suboticki, I.; Swiatkiewicz-Mosny, M.; Ryghaug, M.; Skjolsvold, T.M. Inclusive Engagement in Energy-With Special Focus on Low Carbon Transport Solution; EnergyShift: Cambridge, UK, 2019. [Google Scholar]
  71. Olivadese, R.; Alpagut, B.; Revilla, B.P.; Brouwer, J.; Georgiadou, V.; Woestenburg, A.; van Wees, M. Towards Energy Citizenship for a Just and Inclusive Transition: Lessons Learned on Collaborative Approach of Positive Energy Districts from the EU Horizon2020 Smart Cities and Communities Projects. Multidiscip. Digit. Publ. Inst. Proc. 2021, 65, 20. [Google Scholar]
  72. DCLG. Engagement Strategy to Meet the Needs of Statistics Users; Department for Communities and Local Government: London, UK, 2015. [Google Scholar]
  73. Roberts, S. Making ‘No One Left Behind’meaningful in Our Future Energy System; Centre for Sustainable Energy, Citizen Advice: Bristol, UK, 2018. [Google Scholar]
  74. Darby, S.; Liddell, C.; Hills, D.; Drabble, D. Smart Metering Early Learning Project: Synthesis Report; Department of Energy and Climate Change (DECC): London, UK, 2015. [Google Scholar]
  75. Brown, C.J.; Markusson, N. The responses of older adults to smart energy monitors. Energy Policy 2019, 130, 218–226. [Google Scholar] [CrossRef] [Green Version]
  76. Barnicoat, G.; Danson, M. The ageing population and smart metering: A field study of householders’ attitudes and behaviours towards energy use in Scotland. Energy Res. Soc. Sci. 2015, 9, 107–115. [Google Scholar] [CrossRef]
  77. Nobles, J.D.; Perez, A.; Skelton, J.A.; Spence, N.D.; Ball, G.D. The engagement pathway: A conceptual framework of engagement-related terms in weight management. Obes. Res. Clin. Pract. 2018, 12, 133–138. [Google Scholar] [CrossRef] [Green Version]
  78. Gupta, R.; Zahiri, S. Evaluation of User Engagement in Smart Local Energy System Projectss in the UK. Energy Evaluation Europe: London, UK, 2020. [Google Scholar]
  79. UN SDGs. UN SDG Goals. 2020. Available online: https://sdgs.un.org/goals (accessed on 8 February 2023).
  80. Community Energy Hub. Community Energy Projects Map. 2020. Available online: https://hub.communityenergyengland.org/projects/ (accessed on 7 January 2020).
  81. Jones, P.; Oswald, D.; Blacklaws, K.; Williams, L. How Data Can Inform the Deployment of Renewable Electricity Generating Capacity—Using the Renewable Energy Planning Database; Eunomia: Bristol, UK, 2018. [Google Scholar]
  82. National Grid. Electricity Ten Year Statement; National Grid: London, UK, 2020. [Google Scholar]
  83. ENS Group. Our Electricity Transmission Network: A Vision for 2020; ENS Group: Burnsville, MN, 2012. [Google Scholar]
  84. Scottish Energy Statistics Hub. Energy Statistics for Scotland; Scottish Government: Edinburgh, UK, 2021. [Google Scholar]
  85. Community Energy Scotland. Interactive Map for Community Energy Organisations. 2020. Available online: https://www.communityenergyscotland.org.uk/ (accessed on 28 October 2020).
  86. Braunholtz-Speight, T.; Mander, S.; Hannon, M.; Hardy, J.; McLachlan, C.; Manderson, E.; Sharmina, M. The Evolution of Community Energy in the UK; UK Energy Research Centre (UKERC): London, UK, 2018. [Google Scholar]
  87. Department of Energy and Climate Change. Community Energy Strategy Update; Department of Energy and Climate Change (DECC): London, UK, 2015. [Google Scholar]
  88. BEIS. Digest of UK Energy Statistics (DUKES)—Chapter 6: Renewable Sources of Energy; Department for Business, Energy & Industrial Strategy (BEIS): London, UK, 2022. [Google Scholar]
  89. Tingey, M.; Webb, J.; Hawkey, D. Local Authority Engagement in UK Energy Systems: Highlights from Early Findings; Energy Technologies Institute: London, UK, 2017. [Google Scholar]
  90. Behaviour Change. SAVE: Large-Scale Energy Efficiency Trial. 2019. Available online: https://behaviourchange.org.uk/case-studies/save-energy-efficiency-trial (accessed on 2 March 2023).
  91. SAVE. Solent Achieving Value from Efficiency. 2019. Available online: https://save-project.co.uk/ (accessed on 22 April 2020).
  92. Nhede, N. British Gas Unveils Smart Meter-Enabled Energy Management Service. 2021. Available online: https://www.smart-energy.com/regional-news/europe-uk/british-gas-unveils-smart-meter-enabled-energy-management-service/ (accessed on 2 March 2021).
  93. Greensfelder, E.M.; Henze, G.P.; Felsmann, C. An investigation of optimal control of passive building thermal storage with real time pricing. J. Build. Perform. Simul. 2011, 4, 91–104. [Google Scholar] [CrossRef]
  94. Schweiger, G.; Eckerstorfer, L.; Hafner, I.; Fleischhacker, A.; Radl, J.; Glock, B.; Wastian, M.; Rößler, M.; Lettner, G.; Popper, N. Active consumer participation in smart energy systems. Energy Build. 2020, 227, 110359. [Google Scholar] [CrossRef]
  95. Vázquez-Canteli, J.R.; Nagy, Z. Reinforcement learning for demand response: A review of algorithms and modeling techniques. Appl. Energy 2019, 235, 1072–1089. [Google Scholar] [CrossRef]
  96. Sharing Cities. Sharing Cities-Common Solutions for Shared Challenges, Final Technical and Financial Report; Sharing Cities: London, UK, 2022. [Google Scholar]
  97. Klein, S.J.; Coffey, S. Building a sustainable energy future, one community at a time. Renew. Sustain. Energy Rev. 2016, 60, 867–880. [Google Scholar] [CrossRef] [Green Version]
  98. Boyle, E.; Watson, C.; Mullally, G.; Ó’Gallachóir, B. Regime-based transition intermediaries at the grassroots for community energy initiatives. Energy Res. Soc. Sci. 2021, 74, 101950. [Google Scholar] [CrossRef]
  99. Watson, C.; Boyle, E.; Mullally, G.; Gallachóir, B.Ó. Responding to the Energy Transition in Ireland: The Experience and Capacity of Communities; Department of Sociology and School of Engineering, MaREI Centre: Frankfurt, Germany, 2020. [Google Scholar]
  100. Bevan, G. Smart Charging Can Save Electric Vehicle Drivers £110 a Year—And Cut Carbon Footprint by 20%. 2022. Available online: https://www.specific.eu.com/smart-charging-can-save-electric-vehicle-drivers-110-a-year/ (accessed on 2 March 2023).
  101. Grandclément, C.; Karvonen, A.; Guy, S. Negotiating comfort in low energy housing: The politics of intermediation. Energy Policy 2015, 84, 213–222. [Google Scholar] [CrossRef]
  102. Hyysalo, S.; Juntunen, J.K.; Martiskainen, M. Energy Internet forums as acceleration phase transition intermediaries. Res. Policy 2018, 47, 872–885. [Google Scholar] [CrossRef]
  103. Bent, C.; Kmetty, Z. Intelligent energy feedback: Tailoring advice based on consumer values. In Proceedings of the ECEEE 2017 Summer Study–Consumption, Efficiency & Limits, Hyères, France, 29 May–2 June 2017. [Google Scholar]
  104. HM Government. The Ten Point Plan for a Green Industrial Revolution; HM Government: London, UK, 2020. [Google Scholar]
  105. Skidmore, C. Mission Zero, Independent Review of Net Zero; Department for Business, Energy & Industrial Strategy: London, UK; Department for Energy Security and Net Zero: London, UK; Rt Hon Grant Shapps MP: London, UK, 2023. [Google Scholar]
Figure 1. Information flow of systematic review.
Energies 16 03037 g001
Figure 2. Type of SLEETs deployed in 72 local energy projects.
Energies 16 03037 g002
Figure 3. Energy vectors in relation to type of SLEETs.
Energies 16 03037 g003
Figure 4. (a) Type of local energy initiatives in relation to type of SLEETs; (b) level of engagement; (c) model of communication.
Energies 16 03037 g004
Figure 5. Projects start year in relation to type of SLEETs.
Energies 16 03037 g005
Figure 6. Geographic location of the projects in relation to (a) type of SLEETs; and (b) distribution of SLEETs in local energy projects in the UK at the spatial resolution of the region. Ordnance Survey (ESRI ArcGIS licence).
Energies 16 03037 g006
Figure 7. Spatial distribution of (a) renewable energy technologies in England, Wales, Northern Ireland [7] and wind capacity in Scotland [88]; (b) local/community energy actions in England, Wales, Northern Ireland [7] and in Scotland [85]; (c) local authorities’ engagement across the UK [89].
Energies 16 03037 g007
Figure 8. Lead actors of the projects in relation to type of SLEETs.
Energies 16 03037 g008
Figure 9. Funders of the projects in relation to type of SLEETs.
Energies 16 03037 g009
Figure 10. Number of projects reporting effectiveness characteristics.
Energies 16 03037 g010
Figure 11. Type of local energy initiative in relation to effectiveness.
Energies 16 03037 g011
Table 1. Types of SLEETs [14,17,23,24,25,26,27,28,29,30,31,32,33,34,35,36,37,38,39,40,41,42,43,44,45,46,47,48,49,50,51,52].
Information-Driven SLEETsInteraction SLEETsControl SLEETs
In-home display (IHD)
[23,24,25,26]
Spatial
Mapping
[27,28,29,30,31]
Thermal
Imaging
[32]
Digital energy platform (DEP)
[33,34,35,36,37,38,39,40,41]
Gamification
[17,42,43,44,45,46,47]
Digital voice assistant
[14,48,49]
Energy management system
[50,51,52]
Energies 16 03037 i001Energies 16 03037 i002Energies 16 03037 i003Energies 16 03037 i004Energies 16 03037 i005Energies 16 03037 i006Energies 16 03037 i007
Table 2. Engagement pathways and methods [78].
Engagement PathwayEngagement Methods
SocialInformingMedia, newsletter, video, mail shot, leaflet, brochure, notice boards and social media
CommunicatingPresentation, seminar, conference, exhibition, fair and open days, workshop, events, meetings
Involving Consultation, drop-in session, tele-service, training, webinar, offers (e.g. free smart meter)
Empowering Empower to effectively manage energy load and balance energy demand and supply, generate/store energy, create energy market to trade surplus of energy
TechnicalIn-home display (IHD), gamification, spatial mapping, digital energy platform (DEP), thermal imaging and energy management systems
Table 3. Characteristics used to select CE, LE and SLES initiatives in this study.
Characteristics of Local Energy ProjectsCELESLES
Participating actors/stakeholders
  • Community groups/third parties
  • Local authorities may be involved
  • Individuals acting collectively
  • Local authorities & LEPS
  • Community groups and third parties may be involved
  • Institutions working in partnership with strong focus on private investment
  • Institutions (e.g. DNO, energy suppliers, universities and private sector)- working individually or in a partnership collaboration
  • Local authorities or community groups may be involved
Positioning ofindividuals
  • Active energy users led by a range of motivations
  • Active energy consumers or prosumers- with an aim to maximize personal utility and choice
  • Active energy consumers or prosumers- with and aim to maximize personal utility and choice
Spatial focus
  • Communities of locality
  • Yet also communities of interest
  • Networks of organizations spanning local and non-local areas
  • Networks of organizations spanning local and non-local areas
Goals
  • Addressing local social, economic and environmental needs
  • Contributing to broader environmental challenges
  • Economic growth and prosperity
  • Specifically job creation and skills training, delivered by investments in ‘clean’ energy systems
  • Political, economic, social, environmental and technological dimensions are included in the energy chain
  • Delivering energy services tailored to the local areas
  • Using digital and data-based solutions
Technologies
  • Energy feedback
  • Energy generation
  • Energy efficiency
  • Energy feedback
  • Energy generation
  • Energy efficiency
  • Energy storage
  • Electricity & heat distribution
  • EV charging
  • Having elements of demand & supply
  • Local balancing of supply & demand across multiple domains
  • Having element of ‘smart’
  • Grid balancing & management
Scalability & replicability
  • Predominantly a local focus to address specific needs and requirements
  • Predominantly identifying locally beneficial solutions that are replicable elsewhere
  • The boundary can vary from a single street or estate up to a county or region
  • Accounting for local priorities to meet local needs
  • Wider value-based needs (e.g. Reducing global environmental impacts
Table 4. Framework to characterise SLEETs.
Extent of InteractionMode of Communication (Interface)
NumericVisualAural
Information In-home-displays (IHD)Spatial mapping-
-Thermal imaging-
Interaction Digital energy platforms (DEPs) Gamification -
ControlEnergy management systems-Digital voice assistant
Table 5. Effectiveness and inclusiveness of SLEETs.
SLEETs Effectiveness CharacteristicsSLEETs Inclusiveness Characteristics
  • Enabling behavioural response
  • Enabling carbon reduction
  • Enabling energy use reduction
  • Enabling learning
  • Empowering users
  • Age
  • Gender
  • Socio-economic status
  • Vulnerability
Disclaimer/Publisher’s Note: The statements, opinions and data contained in all publications are solely those of the individual author(s) and contributor(s) and not of MDPI and/or the editor(s). MDPI and/or the editor(s) disclaim responsibility for any injury to people or property resulting from any ideas, methods, instructions or products referred to in the content.

