Article

A Comparative Perspective of the Effects of CO2 and Non-CO2 Greenhouse Gas Emissions on Global Solar, Wind, and Geothermal Energy Investment

1
Institute of Cleaner Production Technology, Pukyong National University, Busan 48547, Republic of Korea
2
Department of Economic and Administrative Sciences, Ferdowsi University of Mashhad, Mashhad 9177948974, Iran
3
Department of Chemical Engineering, Pukyong National University, Busan 48513, Republic of Korea
*
Author to whom correspondence should be addressed.
Energies 2023, 16(7), 3025; https://doi.org/10.3390/en16073025
Submission received: 28 February 2023 / Revised: 12 March 2023 / Accepted: 23 March 2023 / Published: 26 March 2023
(This article belongs to the Topic Energy Economics and Sustainable Development)

Abstract

:
Greenhouse gas emissions, including carbon dioxide and non-CO2 gases, are mainly generated by human activities such as the burning of fossil fuels, deforestation, and agriculture. These emissions disrupt the natural balance of the global ecosystem and contribute to climate change. However, by investing in renewable energy, we can help mitigate these problems by reducing greenhouse gas emissions and promoting a more sustainable future. This research utilized a panel data model to explore the impact of carbon dioxide and non-CO2 greenhouse gas emissions on global investments in renewable energy. The study analyzed data from 63 countries over the period from 1990 to 2021. Firstly, the study established a relationship between greenhouse gas emissions and clean energy investments across all countries. The findings indicated that carbon dioxide had a positive effect on clean energy investments, while non-CO2 greenhouse gas emissions had a negative impact on all three types of clean energy investments. However, the impact of flood damage as a representative of climate change on renewable energy investment was uncertain. Secondly, the study employed panel data with random effects to examine the relationship between countries with lower or higher average carbon dioxide emissions and their investments in solar, wind, and geothermal energy. The results revealed that non-CO2 greenhouse gas emissions had a positive impact on investments only in wind power in less polluted countries. On the other hand, flood damage and carbon dioxide emissions were the primary deciding factors for investments in each type of clean energy in more polluted countries.

1. Introduction

Over the last ten years, global carbon dioxide (CO2) emissions have increased from 25,688 million metric tons in 2003 to 36,310 million metric tons in 2021 [1]. Simultaneously, non-CO2 emissions grew by approximately 20% between 2005 and 2020 worldwide, from 10,506 million metric tons of CO2 equivalent to 12.619 million metric tons of CO2, respectively, which could remarkably affect the internal equilibrium process of worldwide ecosystems [2]. In this respect, investments in renewable energy have been made in order to mitigate climate problems [3]. Thus, an analysis of the impacts of greenhouse gas (GHG) emissions, both CO2 and non-CO2, on the share of clean energy investment is of great importance.
GHG emissions have increased continuously because of human activity and non-renewable energy combustion [2] and have created potential hazards for natural systems [4]. Extreme weather, for example, caused nearly 80% of the large-scale power blackouts from 2003 to 2012 [5], ranging from USD 20 to USD 55 billion per year in the United States [6]. Moreover, disasters induced by GHG emissions influence various areas such as resource management, economic improvement, and population growth [7]. Some unforeseen risks may also affect environmental quality and energy consumption [8,9,10], the fluctuations and functioning of the energy market [10,11,12,13,14,15,16,17,18,19], the stock market [13,20,21,22,23], the world trade network [24], and unemployment and recession [25,26,27,28]. Consequently, policymakers tend to reduce environmental damage through the development of renewable energy [29].
Potentially 90% of global warming was caused by anthropogenic GHG emissions in 2007, according to the Intergovernmental Panel on Climate Change [30]. According to the World Bank [31] and Environmental Protection Agency [32], Figure 1 shows the contribution of CO2 and other GHG emissions in the world in 2021. Two-thirds of the GHG emissions are related to carbon dioxide (CO2) [33,34], the most outstanding gas in the atmosphere [35]. CO2 emissions are only emitted from the burning of fossil fuels (i.e., crude oil, coal, natural gas, and petroleum products) [36]. Meanwhile, among other GHGs, nitrogen oxide (N2O), methane (CH4), water vapor (H2O), and F-gases are the greatest and longest-lasting on earth [35]. They are released from numerous sources, including the combustion of non-renewable energies, the processing and usage of chemicals, land use modifications, manufacturing processes, and livestock capital [37]. Both CO2 and non-CO2 GHG emissions are legally responsible for climate change policies in many countries around the world. Modelers can make plans to include CO2 emissions, non-CO2 emissions, or both in their models. However, non-CO2 greenhouse gas emissions are rarely considered sufficiently, which may lead to misleading results in implementing the best climate change policies [38] and differential impacts of policies in some countries depending on how non-CO2 GHG emissions are taken into consideration [39]. The effect of wind investment on lowering CO2 emissions, for example, has not been proven to be positive when excluding non-CO2 emissions [40]. Therefore, this paper focuses on the impacts of CO2 and non-CO2 GHG emissions on renewable energy investment.
The advantages of clean energy, such as fewer emissions and lower energy input requirements [41,42] are reflected in renewable energy investment dramatically all over the world. It is also expected to be the fastest growing energy source between now and 2030 [43]. Based on a Bloomberg New Energy Finance report [44], Figure 2 exhibits the total clean energy investment between 2004 and 2021 across the globe. From 2008 onward, clean energy investment became more essential, most probably because of climate change and its different levels of environmental losses [45]. The total investment in clean energy accounted for USD 543 billion in 2010, reaching USD 755 billion in 2021 (almost a 40% increase). Since global trends indicate that the use of solar, wind, and geothermal energy is effective in avoiding GHG emissions [46], determining the effects of GHG emissions on renewable energy investment has become an important issue. When discussing the impacts of CO2 and other GHGs on renewable energy investment, GHGs are the reason for global warming. The greater the GHG emissions, the greater the environmental protection awareness internationally, leading to an increase in clean energy consumption [39].
According to the recent trend in renewable energy investment and GHG emissions, several questions arise from this article:
  • Are there differences in the effects of CO2 and non-CO2 GHG emissions on clean energy investment between different kinds of clean energy?;
  • Do floods, which are becoming more frequent in many countries because of climate change, impact solar, wind, and geothermal energy investment similarly?;
  • Do countries with greater and lesser CO2 and non-CO2 GHG emissions respond similarly to solar, wind, and geothermal investment?
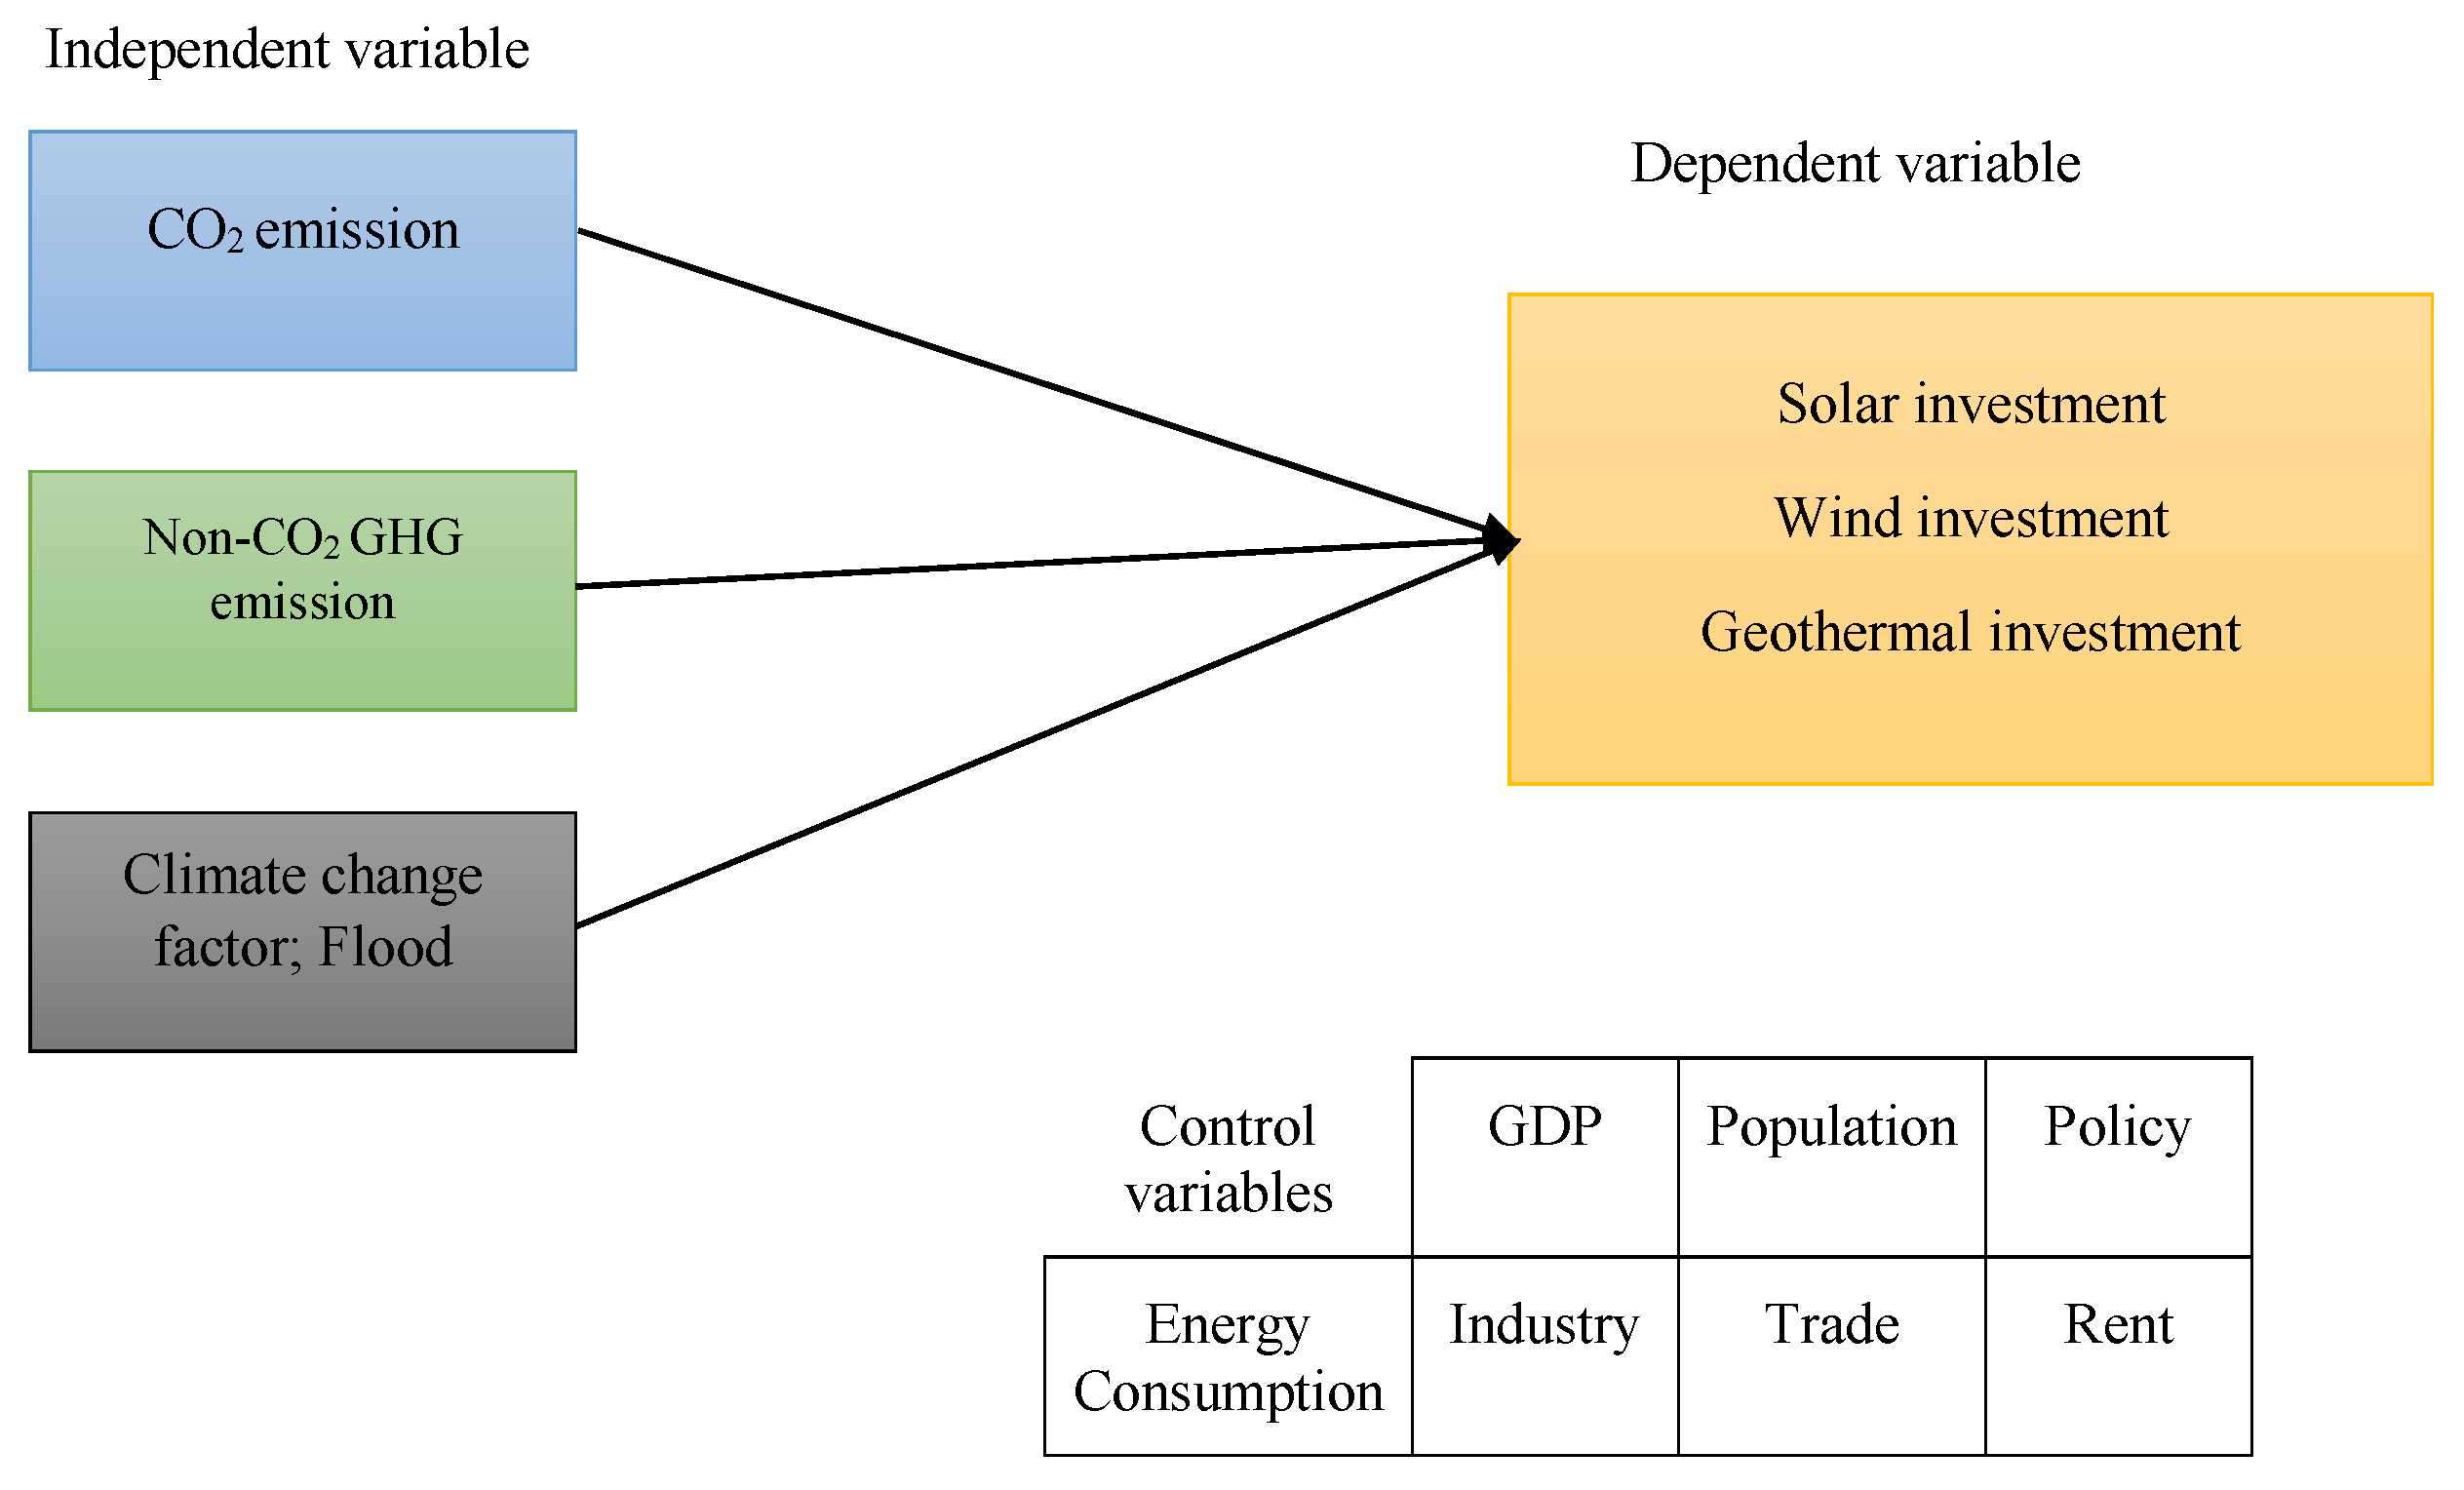
Herein, we utilized the panel data regression model involving 63 countries and using annual data from 1990 to 2021 to provide reliable and reasonable answers to the questions above. The panel regression technique has been commonly used in many fields of energy economics [47,48,49,50,51]. The empirical analysis involved the estimation of random effects models, whereas the Hausman test was employed for selecting the appropriate panel model and was found to be significant at p ≤ 0.10. A collinearity test was applied to examine the linear function of independent variables compared to other variables. A normality test and correlation test are also considered to investigate the relationship between variables. The biggest advantage of the panel data regression approach is that it comes with a panel dataset that includes numerous observations of several individuals over a long period of time [49,50], thereby revealing a range of differences in the analysis of CO2 and non-CO2 GHG emissions impacts on renewable energy investment. As a result, the use of a panel data regression method is particularly necessary for this paper because the impacts of non-CO2 and CO2 GHG emissions on renewable energy investment may differ in different countries and different energy sectors such as wind, solar, and geothermal energies. The existing research shows that many publications have suggested that only CO2 emissions should be considered when studying the impact of greenhouse gas (GHG) emissions on renewable energy investment. However, this study considers both CO2 and non-CO2 GHG emissions and demonstrates that the results vary significantly when non-CO2 emissions are included. Therefore, this paper addresses the gap in knowledge regarding the influence of different types of GHG emissions on a clean energy investment.
This paper is structured as follows: Section 2 briefly summarizes the related literature and the trends of CO2 and non-CO2 GHG emissions, as well as solar, wind, and geothermal investments, which are especially discussed. Data sources and variables are interpreted, and the details of the econometric methodology are provided in Section 3. In Section 4, the empirical results are explained. Finally, the paper is concluded in Section 5 and provides corresponding policy implications.

2. Literature Review

After the 1980s, which coincided with industrial development, CO2 emissions have been accelerated, and non-CO2 GHG emissions continue to grow in both developing and developed countries [52]. Figure 3 compares the average CO2 and non-CO2 emissions between 1990 and 2021, according to the World Bank [31]. As can be seen from the figure, countries with a large population (e.g., India and China) have greater CO2 emissions, whereas countries such as Brazil, Indonesia, Australia, Qatar, the Philippines, Bangladesh, Mexico, and Vietnam reported a share of 40–90% non-CO2 emissions in 2021. This indicates that non-CO2 GHG emissions have risen, probably because of less coal usage and higher renewable energy investment [53]. As large amounts of greenhouse gas emissions have influenced economic [2,13,54,55], energy [56,57], and environmental issues [58,59], modelers can develop plans for different climate change policies [39], depending on which types of GHG emissions are used.
A large number of studies addressed only CO2 emissions, such as [60,61,62,63]. However, overlooking non-CO2 GHG emissions may result in misleading impacts and false results. Studies from China, for instance, focus on CO2 emission levels, and data are published with different selection processes. For example, the authors of [38] showed that the impacts of climate change policy differ with and without non-CO2 GHG emissions. They discovered that, without non-CO2 GHG emissions, China experiences a large volume reduction in real GDP. Other previous studies [64,65,66,67] also estimated that cost savings, for example, can reach up to 70% when additional gases are included. Some studies only examined various gases, such as CO2, CH4, and N2O in [66] and CO2 and CH4 in [65,68]. Many reviewed all GHG emissions, including [38,64,68,69,70,71,72]. This paper focused on both CO2 and non-CO2 GHG emissions to provide more accurate impacts of GHG emissions. The main objective of this paper is to examine how CO2 emissions and other GHG emissions impact renewable energy investment.
Since renewable energy usage is considered an efficient plan to overcome GHG emission problems [73,74,75], many researchers have accomplished research on their relationships. For instance, [45,76,77,78] emphasize that CO2 emissions positively contribute to the consumption of renewable energy. Another study [79] came to a similar conclusion through the implementation of solar energy to minimize SO2, NOx, and CO2 GHG emissions. Meanwhile, some scientists [40,42] thought that the effects of GHG emissions on wind investment were ambiguous. One possible reason is that they considered only CO2 emissions in their calculations. In comparison, others discovered a positive relationship between wind investment and CO2 emissions [80]. According to [37,81,82,83], GHG emissions also responded positively to geothermal energy investment and other variable energy. Therefore, in the analysis of how CO2 and non-CO2 GHG emissions impact clean energy investment, the main idea is that GHG effects and climate change consequences such as flooding are conducive to such investment [84].
Investment in renewable energy has been followed in many countries, including Australia [71], South Korea [38], the European Union [85], New Zealand [86], China [87], Croatia [88], Poland [89], and other regions [90]. Based on IEA reports [43], 
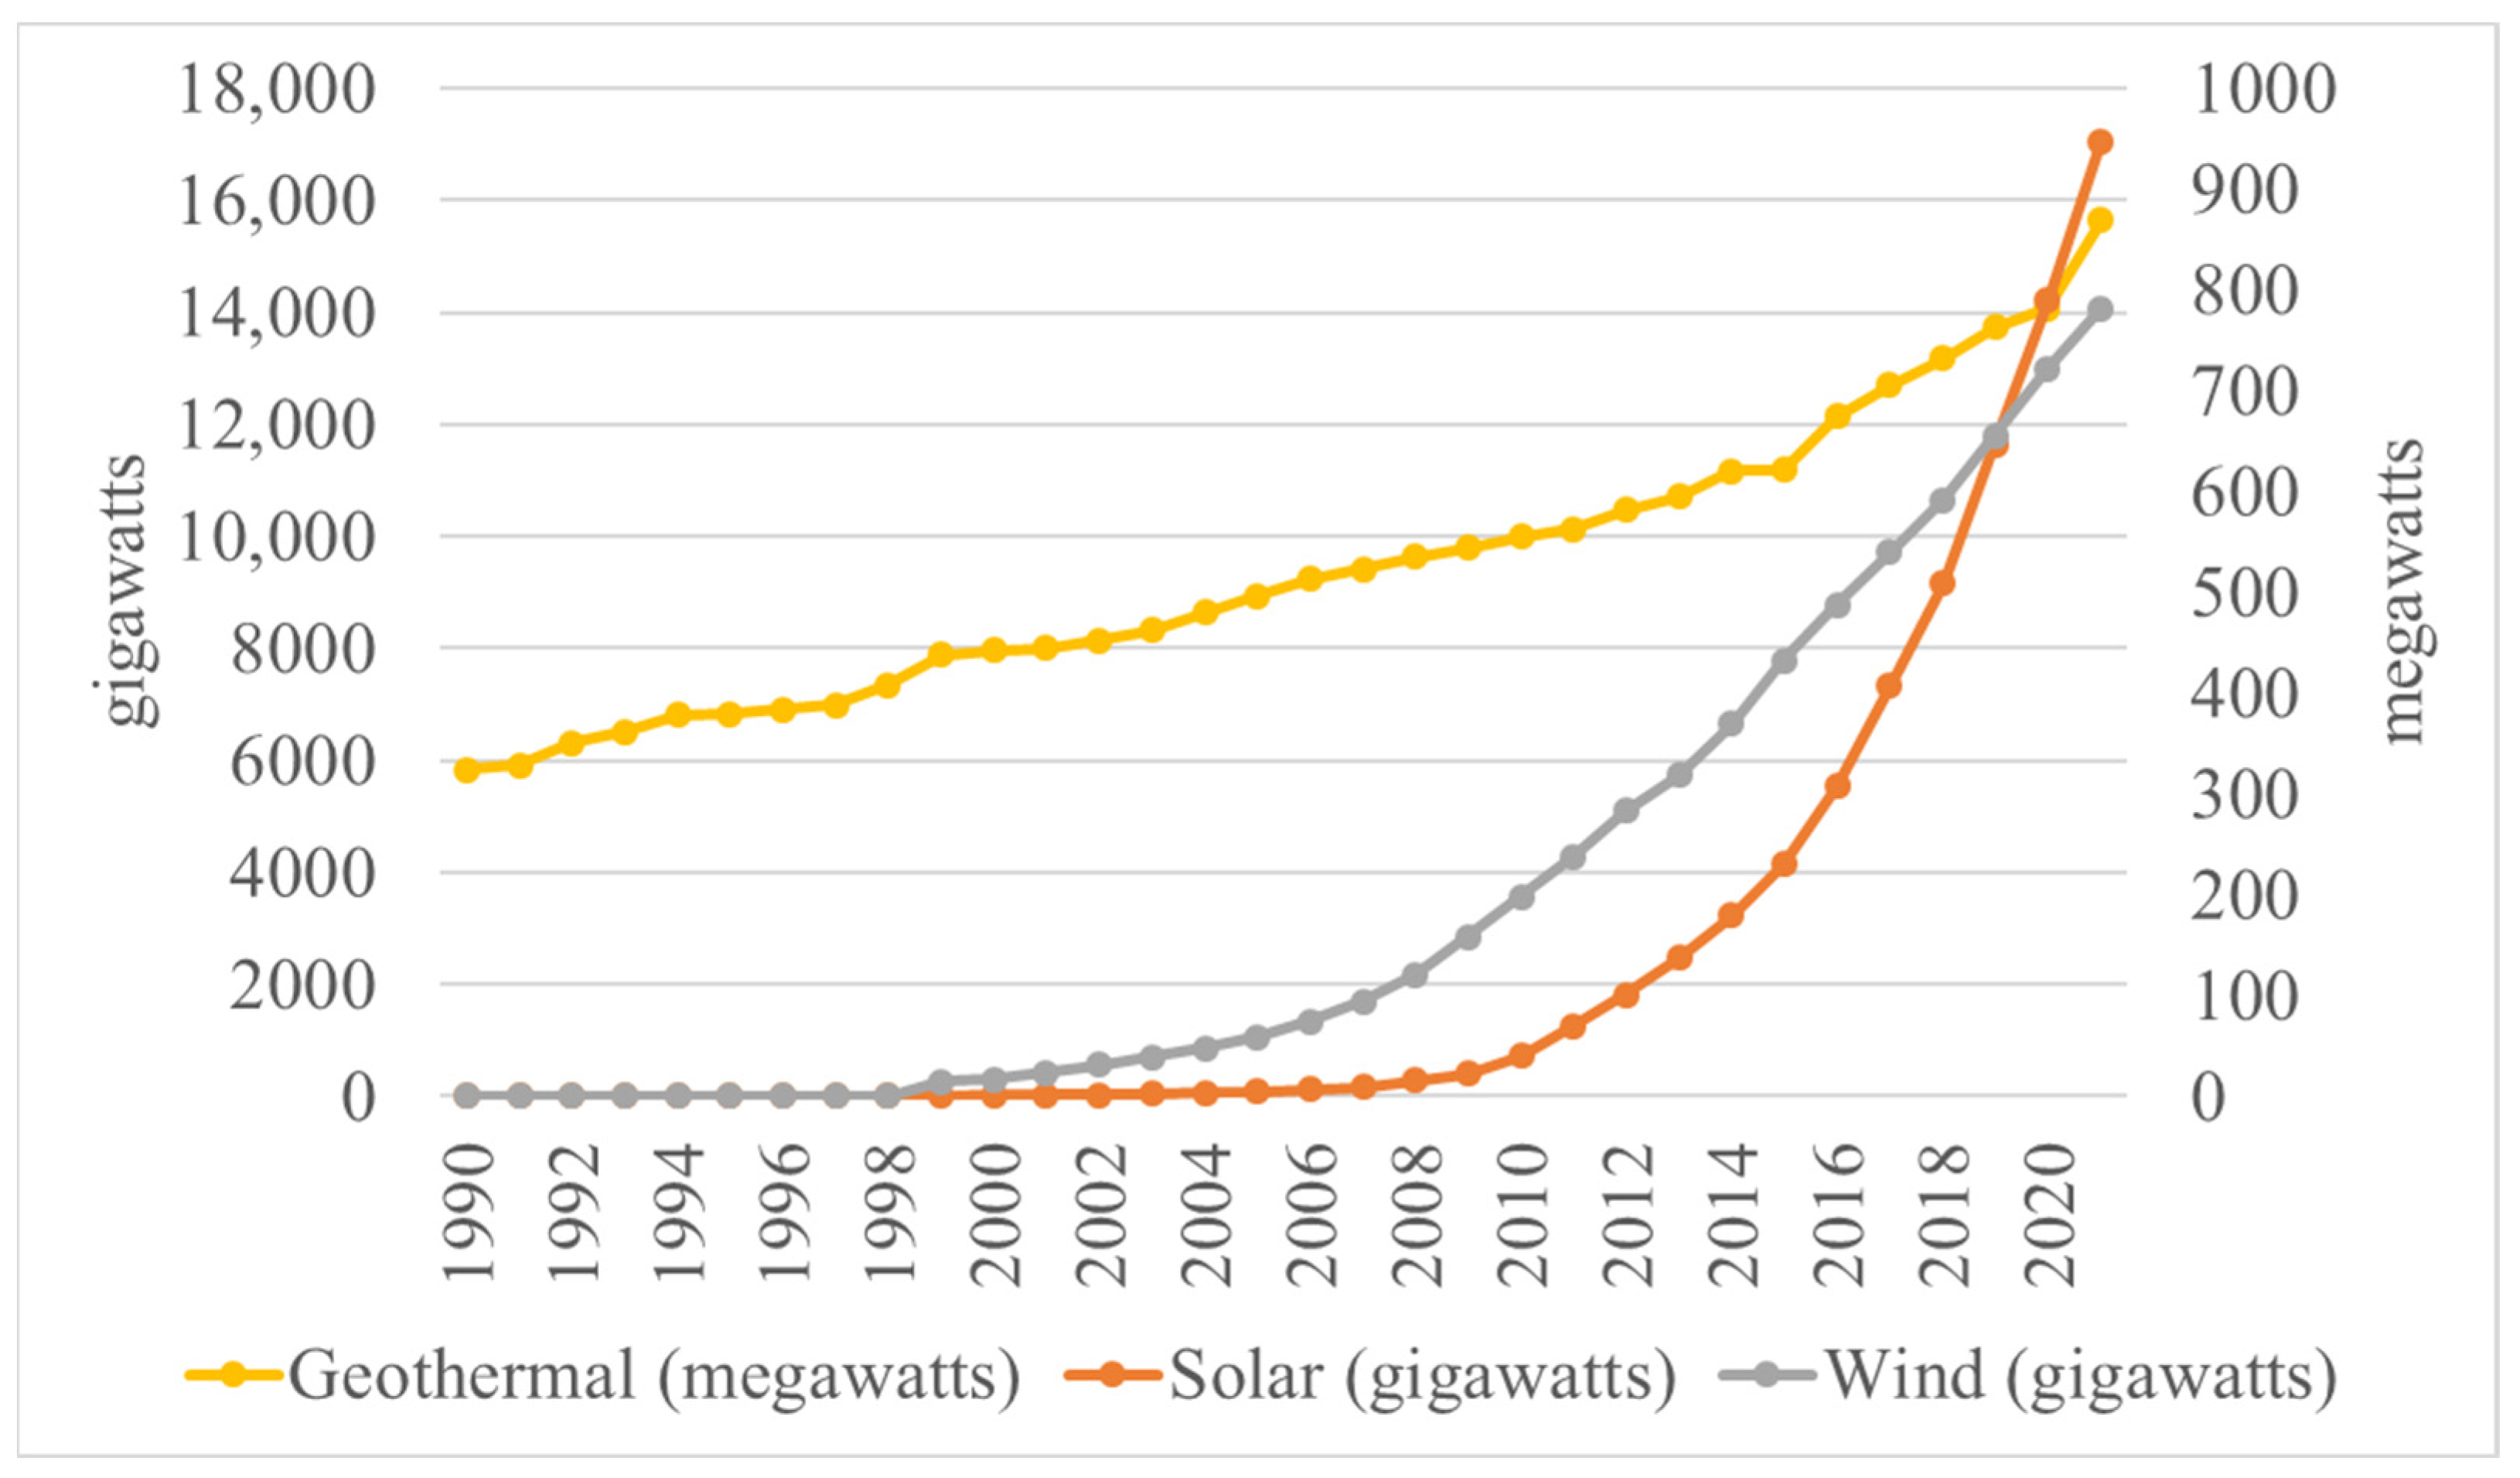
Figure 4 illustrates the installed capacities of wind, solar, and geothermal energy between 1990 and 2021 on a globe scale. According to International Energy Agency reports, renewable energy investment has increased dramatically and is expected to be the fastest growing energy resource from now until 2030. From the datapoint in REN21 [91], a record value of USD 71 billion was invested in solar photovoltaic and wind power, where the share of geothermal and other renewable energy was 4.8% in the United States, 6% in France, 3.2% in Japan, and 16%, 6.5%, 1.7%, and 5.6%, respectively, in Canada, Italy, the United Kingdom, and Germany. By that time, nearly 500 GW had been invested in solar and wind, whereas the installed capacities for geothermal energy were lower at about 15 GW globally in 2018.
The mitigation of CO2 emissions through renewable energy investment is well accepted by some researchers. For instance, in some previous studies [75,92,93,94,95], it was assumed that the share of clean energy could play an important role in making good decisions in energy policy. Meanwhile, [53], consistent with [96], surveyed the correlation between carbon dioxide emissions and clean energy use and suggested that clean energy is productive in dealing with GHG emissions. However, there has been no study in the literature on whether the effect of non-CO2 GHG emissions on clean energy investment is influenced by clean energy development.
From the existing literature, we found that many recent publications advocated only CO2 emission levels to study how GHG emissions affect renewable energy investment. Here, the present study focuses on both CO2 and non-CO2 GHG emissions, with the results diverging when non-CO2 emission levels were included. In this context, this paper fills the gap on how different types of GHG emissions influence clean energy investment separately.

3. Method and Data Description

In this section, the proposed model for discovering the impacts of CO2 and non-CO2 GHG emissions on clean energy investment is presented using panel data analysis. Data and variables are also demonstrated in this section.

3.1. Model

The use of panel data has become increasingly common for analyzing and understanding research problems [50]. Here, the influence of CO2 emissions on energy consumption is estimated using the panel data regression approach developed by [2]. They found that CO2 emissions are, in the long run, the cause of energy consumption. Panel data regression also appears in [97], which investigated the impact factors of energy-related CO2 emissions. The results indicated that reducing CO2 emissions by improving a country’s energy structure can boost renewable energy growth. The panel data model has many advantages as it comes with multidimensional characteristics due to the large number of observations in a panel dataset. One of its main features is its special heterogeneity using two models: a fixed effect model that reduces the bias of omitted variables and a random-effect model [98]. Moreover, non-observable time and region-specific intercepts can be captured through this model [52]. Although omitted variables are not observed in the dataset, the dependent variable can be affected by such variables. Consequently, the panel data manages problems with relevant omitted variables [49].
For selecting the appropriate panel model, the Hausman test can be used in the model. However, the empirical analysis was tested using the fixed-effect and random-effects models. Equations (1)–(3) include the dependent variables Solarit, Windit, and Geothermalit, respectively, which represent the amount of energy produced by solar, wind, and geothermal sources at a given location (i) and time period (t). The right-hand side of the equation contains several independent variables, represented from β1 to β11, which are coefficients that determine the effect of each variable on the dependent variable. Β0 represents the constant or intercept term of the model,
The independent variables include several factors that could affect energy production, including NonCO2it (a measure of non-CO2 emissions), Floodnit (the number of floods that occurred in the region), Floodlit (the level of floods in the region), Policyit (government policies related to energy and climate), Popuit (the population of the region), Rentit (rental rates), GDPit (the gross domestic product of the region), Tradeit (the level of trade), Indusit (industrial production), Energyit (total energy consumption), and CO2it (level of CO2 emissions).
Overall, these equations provide a way to analyze the factors that influence renewable energy production in a given region and can help policymakers and industry leaders make informed decisions about how to increase renewable energy generation. The panel data model is as follows:
S o l a r i t = β 0 + β 1 N o n C O 2 i t + β 2 F l o o d n i t + β 3 F l o o d l i t + β 4 P o l i c y i t + β 5 P o p u i t + β 6 R e n t i t + β 7 G D P i t + β 8 T r a d e i t + β 9 I n d u s i t + β 10 E n e r g y i t + β 11 C O 2 i t + ε i t
W i n d i t = β 0 + β 1 N o n C O 2 i t + β 2 F l o o d n i t + β 3 F l o o d l i t + β 4 P o l i c y i t + β 5 P o p u i t + β 6 R e n t i t + β 7 G D P i t + β 8 T r a d e i t + β 9 I n d u s i t + β 10 E n e r g y i t + β 11 C O 2 i t + ε i t
G e o t e r m a l i t             = β 0 + β 1 N o n C O 2 i t + β 2 F l o o d n i t + β 3 F l o o d l i t + β 4 P o l i c y i t + β 5 P o p u i t             + β 6 R e n t i t + β 7 G D P i t + β 8 T r a d e i t + β 9 I n d u s i t             + β 10 E n e r g y i t + β 11 C O 2 i t + ε i t
Figure 5 presents the model for the panel data regression based on the relationships between dependent and independent variables. The dependent variables are the left-hand side variables in every model, including Solarit, Windit, and Geothermalit, which represent renewable energy investments. Installed solar, wind, and geothermal capacities are representative of clean energy investment-based gigWatts. The variable i represents the country; it ranges from 1 to N, covering 63 countries, and t shows the time period, ranging from 1 to T, from 1990 to 2021. Independent variables and control variables are selected on the right-hand side. Independent variables such as CO2 and non-CO2 are related to GHG emissions (million tons), whereas Flood (n is an equal number and l is the total loss by flood) is a climate change indicator [99]. The control variables include Rent (total natural resource rents equals % of GDP), Policy (renewable energy policy), GDP (economic development; constant 2010 USD), Popu (total population), Trade (merchandise trade; % of GDP), Energy (renewable energy consumption), and Indus (industrial structure). εit represents the error terms. Therefore, considering the effects of CO2 and non-CO2 GHG emissions on wind, solar, and geothermal energy investment, the panel data are shown in Equations (1)–(3).

3.2. Database and Variables

This study investigated the impacts of GHG emissions (both CO2 and non-CO2) on clean energy investment using panel data ranging from 1990 to 2021. Table 1 shows the details related to the research factors, including the number of observations (Obs), average (Mean), deviation (Deviation), and minimum and maximum (Min and Max). Some countries use database sources released directly by official sources, such as national GHG emission inventories in Australia [72] and South Africa [52], or global datasets like those of the World Bank and the Global Trade Analysis Project (GTAP) database [32]. We used the GTAP database for non-CO2 GHG emissions and the World Bank database [31] for receiving CO2 emission data; the base year was 1990, with 63 countries up until 2021. Data for solar, wind, and geothermal energy investment are gathered from BP or the Statistical Review of World Energy [100]. Since capacity is defined as the most accurate proxy for energy investment [101,102], we also used a capacity factor to measure renewable energy investment. The number of flood events and the total loss from floods are based on an international disaster database, referring to [103]. The International Energy Agency provided the national public policy data (Policy) for renewable energy in selected countries. We also account for policy in our analysis based on [102]. For Population which present the population indexes of a country, we used the World Bank dataset, which includes GDP and Trade. As Energy is reflected in the structure of renewable energy usage [104] and Rent is the expenditure of natural sources [105], we applied a series of observations measured by BP [100].

4. Analysis Results

4.1. Preliminary Analysis

The authors of [106] tested for selecting an appropriate model, either fixed-effect or random-effect, as shown in Table 2. The value of the Hausman test indicates that the random effect model is a better choice for the analysis than the fixed-effect model. The F-test is used to select the best model (panel or cross section). As the coefficient is less than 0.10, the panel data is chosen.
The results of the collinearity test, measured by the variance inflation factor (VIF), are given in Table 3. The VIF regression test provides a factor of multicollinearity among the independent variables. If the VIF coefficient is less than 10, then there is no evidence of any collinearity between variables [107].
The proposed method is solved using Stata software.
Table 4 shows the results of the correlation test between all variables (two by two in a matrix environment). The main diagonal of the matrix is equal to 1.000, which approves the correlation of every variable with itself. The amounts closer to 1.000 show greater and more positive correlations. There is no correlation when the obtained value is close to zero. The significant point is the positive and high correlations between non-CO2 GHG emissions and solar energy, the number of deaths due to floods, and the occurrence of floods that were observed, which are equal to 0.535, 0.398, and 0.306 at a 99% significance level, respectively.
From the first results, we found that the proposed model, panel data, was the best method for our estimation. Additionally, the random-effect method should be used to achieve the best regression estimation when performing the Hausman test. In addition, according to the results in Table 4, there was no heterogeneity, variance, or correlation between variables. No omitted variables were observed in the model.

4.2. The Effects of CO2 and Non-CO2 GHG Emissions on Solar Investment

The results of panel data estimation are shown in Table 5. First, the impacts of CO2 and non-CO2 GHG emissions on solar investment were analyzed in the panel random effects model. Table 5 shows that CO2 emissions have a positive relationship with solar energy investment at the 10% level, whereas non-CO2 GHG emissions have a negative relationship with this type of clean energy. The results indicate that only CO2 emissions increase investment in solar energy, whereas other GHG emissions have negative impacts on solar investment. This finding agrees with the previous literature, which shows that among various GHG emissions, only CO2 encourages governments to invest in solar energy [79]. The reason may be that countries with huge amounts of GHG emissions, taking CO2 emissions into consideration, made the most profit in the reduction of GHG effects through solar energy investment [108]. Another study [109] also discovered that the growth of solar investment in a country depends on the effects of CO2 emissions on solar energy. In other words, the greater the CO2 and GHG emissions, the greater the implemented solar investment. However, in countries with less investment in solar energy because of the high cost of solar technology compared with that of traditional energy, CO2 and GHG emissions effects on solar energy are insignificant [110].
Among the control variables, Flood_l tended to decrease the solar investment in countries with greater solar investment. One possible reason may be that the rain and flood cause the failure of photovoltaic and power systems [6,107,111,112,113]. The United States, for example, has incurred USD 20–55 billion in costs due to extreme weather-related power outages [114]. The combination of rain and strong winds, resulting in terrible floods, can significantly threaten solar equipment. This can lead to a loss of confidence in solar investment due to climate change problems, as proven in [115,116], leading to reduced solar investments.
The coefficients of Trade and Rent are negative, which are both statistically insignificant at the 10% level, resulting in decreased solar investments in all countries (both those with higher and lower solar investments). Policy, Energy, and Industry were statistically significant at the 10% level and had positive impacts on solar energy investment. In this regard, some scholars have found that policies on clean energy play an important role in promoting solar investment [102,117]. The authors of [118] indicated that energy policies are conducted in countries with large investments in solar energy, resulting in effective solar usage [119]. Meanwhile, the link between Rent and solar investment is the opposite. The coefficient of Rent is statistically insignificant, implying that the cost of natural resources in countries with lower solar investments is greater than that in countries with higher shares of solar investments. This may be due to the lack of solar technology in the first group of countries, as we mentioned. Meanwhile, the GDP variable is negative and statistically insignificant at the 10% level. Additionally, it appears that Trade is statistically insignificant and has a negative impact on solar investment. Promoting solar investment through trade has not been studied in the literature.

4.3. The Effects of CO2 and Non-CO2 Emissions on Wind Investments

We similarly applied panel data estimation to discover the impacts of non-CO2 GHG and CO2 emissions on wind energy investments. The empirical results are shown in the middle part of Table 5.
As can be seen from the panel random effect model, the effect of non-CO2 GHG emissions on wind investment is negative and statistically insignificant at the 10% level, whereas the impact of CO2 emissions on wind investment is close to that of solar energy. The authors of [120,121], investigated and concluded that no evidence confirmed that wind investment is an effective way to reduce GHG emissions. As a result, policymakers do not consider reducing GHG emissions by investing in wind energy.
The effects of Policy, Energy, and Industry on wind investments are positive and statistically significant at the 10% level. The link between policy and wind investment is similar to the findings of [102]. About the Energy variable, it seems that the vast amount of renewable energy usage spurs wind energy investment just in countries with higher wind investments. When faced with the structure of the industries, it seems that countries with developed industries try to invest in wind technology, which affects GHG emissions reduction. The results show that Rent and Trade produce similar effects on wind investment. Both variables had negative impacts on wind investment. The reason may be similar to that of solar investment.

4.4. Effects of CO2 and Non-CO2 Emissions on Geothermal Investment

In the last part of Table 5, we present the findings on the effects of CO2 and non-CO2 GHG emissions on geo-thermal investment. We looked into panel regression estimation to evaluate how CO2 and non-CO2 GHG emissions affect geothermal energy investments in detail.
From Table 5, the coefficients of non-CO2 GHG emissions and CO2 emissions were negative and statistically insignificant at the 10% level, which differed from the effects of GHG emissions on solar and wind investments. The reason is associated with the impacts of climate change and its consequences, which countries can promote by investing in other renewable energy sources. As Flood, as a factor in climate change, has a negative impact on geothermal energy investments, the reason is similar to that of lower solar investment. According to the existing literature, extreme weather inhibits geothermal investments. As we can see, Policy and Energy had positive effects on geothermal energy investments. They were statistically significant at the 10% significance level. In fact, uncertainties in energy policies closely influence renewable energy investment levels [120]. Other control variables, such as Population, GDP, and Trade, had negative impacts on geothermal investments. Table 6 shows the results, extracted from the random-effect estimation in a panel data model for solar, wind, and geothermal energy investment. The positive sign indicates a positive relationship between two variables in a model, while the negative sign indicates a negative relationship. The multiplication sign indicates that two variables have no effect on each other in any given model.

4.5. Effects of CO2 and Non-CO2 Emissions on Renewable Energy Investments between Countries

We conducted analyses for selecting countries to investigate the relationship between CO2 and non-CO2 GHG emissions on clean energy. Appendix A categorizes countries into two groups based on their level of pollution: “Less-Polluted” and “More-Polluted.” The criterion for grouping the countries is the average of CO2 emissions from 1990 to 2021. The countries listed in the “Less-Polluted” group have a lower average of CO2 emissions during this period, while the countries in the “More-Polluted” group have a higher average of CO2 emissions.
The random-effects model was utilized for our analysis. The results of the panel data estimation for selected countries are as follows in Section 4.6, Section 4.7 and Section 4.8.

4.6. Effects of CO2 and Non-CO2 Emissions on Solar Investment in Selected Countries

In Table 7, the effects of CO2 and non-CO2 GHG emissions on solar investment have been evaluated separately for two groups of countries. The average CO2 emission was chosen to divide countries into less and more polluted regions. According to the results, non-CO2 GHG emissions led to fewer investments in the solar sector in less polluted countries, which is statistically significant at a 10% level. The climate change variable, Flood, shows similar results. Policy also leads to fewer investments in solar energy in the above countries. The reason may be related to the lack of technology or even the inadequate distribution of solar irradiation in such regions of the world. Population and Trade have positive impacts on solar energy investment. The larger the population demands, the greater the amount of renewable energy usage, leading to fewer polluting emissions through solar investments in the mentioned sectors. As Trade is defined based on [122], as the proportion of trade to GDP, trade is a reason for energy consumption, whether in the short or long run; thus, the relationship between solar investment and trade is positive.
The findings for the second group of countries, the more polluted sectors, indicate that non-CO2 GHG emissions do not influence solar investments. However, Flood and Energy consumption spur solar investment, implying that renewable energy consumption is the possible reason for the high solar investments just in countries with huge amounts of investment in the solar sector.

4.7. Effects of CO2 and Non-CO2 GHG Emissions on Wind Investments in Selected Countries

In Table 8, the effects of GHG emissions on wind energy investments are evaluated separately for these two groups. As in the previous section, average CO2 emissions were used to separate more polluted countries from others. Non-CO2 GHG emissions and other emissions show differentiated influences on wind investments. For the first group (more polluted countries), CO2 emissions do not affect wind investments, whereas non-CO2 emissions have a positive impact on wind investments in less polluted regions. In addition, Policy, Flood, and Rent are the main factors for less investment in the second group. Population and Energy result in more investments in wind power.

4.8. Effects of CO2 and Non-CO2 Emissions on Geothermal Investments in Selected Countries

Table 9 shows the results when considering the effects of GHG emissions on geothermal investments. In the first group of countries, the more polluted sectors’ non-CO2 GHG emissions negatively influence geothermal investments. Non-CO2 emissions are not the cause of increasing geothermal investments. Whereas, in the second group of countries, non-CO2 GHG emissions positively influence geothermal energy investments. One point that must be emphasized is that Flood does not affect geothermal energy too much, unlike wind and solar power. The possible reason may be that extreme weather and climate change damage and decrease the use of geothermal energy in less polluted countries. Our results show that GDP is conducive to geothermal investments, which is in line with the results in [123]. Thus, economic development can increase investments in countries with a lower share of CO2 pollution. Likewise, Trade and Energy usage had the same effects on geothermal energy as GDP, leading to increased investments. Therefore, faced with GHG emissions, decision-makers may consider reducing non-CO2 GHG emissions by investing in geothermal energy in less polluted countries.

5. Conclusions and Policy Suggestions

5.1. Conclusions

This study examined the effect of CO2 and non-CO2 emissions on clean energy investments using the panel data regression technique with random effects across 63 countries from 1990 to 2021. This paper also studied whether countries with greater and lower renewable energy investments respond similarly to GHG emission effects. Therefore, the panel data model was applied to the parameter results for countries with large and low carbon dioxide emissions. We investigated the influence of CO2 and non-CO2 GHG emissions on three types of energy (mainly solar, wind, and geothermal). In this study, we also tried to answer some questions as follows: (1) do countries with greater and lesser CO2 and non-CO2 GHG emissions respond similarly to clean energy investments? (2) are there differences in the effects of CO2 and other GHG emissions on clean energy investments between different kinds of clean energy? (3) do the effects of CO2 and non-CO2 emissions on clean energy investments exhibit heterogeneity between different regions? and (4) does Flood as a representative of climate change that shows extreme temperatures, have a positive impact on renewable energy investment? To provide reasonable answers to these questions, the panel data regression model with random effects was used. According to the empirical results, we arrived at various main conclusions. We found that CO2 emissions have a positive effect on solar, wind, and geothermal investments in all countries. In fact, the amount of CO2 emissions is considered a pattern for investing in three types of energy across the globe. The reason may be that the CO2 emission dataset is released directly by official sources, while for choosing the best policy to reduce GHG emissions, non-CO2 emissions are of great significance, as excluding non-CO2 GHG emissions may lead to misleading results.
Non-CO2 GHG emissions had negative impacts on solar and geothermal energy investments. The effects of these emissions on wind energy differed across countries. The average CO2 emissions are accounted for to divide countries into two groups. The first group included countries with low carbon dioxide emissions, and the second group comprised regions with huge amounts of carbon emissions. The estimation results indicated that non-CO2 GHG emissions did not impact solar, wind, and geothermal investments in more polluted countries compared with those in less polluted regions. Meanwhile, the relationship between wind energy and geothermal investments and non-CO2 GHG emissions was positive in the second group of countries. The reason may be that non-CO2 emissions were the cause of pollutants in these types of countries.
Regarding the climate change variable Flood, there was uncertainty about how it could increase renewable energy investments. The relationship between Flood and solar, and geothermal energy was negative, but positive for wind investments. A review of the related literature also approved the same results. When it comes to controlling variables, Energy consumption, Industry level, and Policy all had positive impacts on the three types of clean energy.
We also found that for countries that experience high levels of environmental pollution or CO2 emission levels, Flood and CO2 emission levels are the most important factors in deciding whether to invest in solar, wind, or geothermal energy. Development growth is an effective way to increase wind power investment, which is supported by the literature. Trade was also investigated as an effective method of increasing solar and geothermal investments in less polluted countries.

5.2. Policy Suggestions

According to the empirical results of this study, some policy recommendations and suggestions to improve environmental quality through clean energy investments can be drawn as follows.
First, the results show that non-CO2 GHG emissions have a significant positive correlation with decreasing solar energy investments in less polluted countries. This suggest that such regions should focus more on clean energy, given that the main source of pollution in these countries is comprised of non-CO2 GHG emissions. As policy has a positive effect on renewable energy investment, authorities can apply effective energy policies, such as subsidies, to encourage countries to invest in renewable energy investments.
Moreover, non-CO2 emissions had positive effects on wind and geothermal investments in less polluted countries. Thus, governments should continue to implement policies on clean energy and encourage investors to conduct differentiated clean energy plans based on the different environments of countries.
Furthermore, from an economic perspective, a higher portion of economic growth is deemed beneficial for lowering CO2 emissions in less polluted countries through greater investments in wind power. Hence, developed nations should expand clean energy equipment to achieve CO2 emission reductions.
Finally, all countries should pay more attention to the positive relationship between CO2 emissions and clean energy investment and the negative relationship between non-CO2 GHG emissions and clean energy. Although CO2 emissions are considered agents determining the amounts of investments in renewable energy, we found that non-CO2 emissions are of great importance. The least polluted nations may enjoy lower carbon emissions by reducing the scale of import trades, whereas the most polluted nations should expand their energy policies. This may aid policymakers in achieving more environmentally friendly economic decisions. It seems that reaching the substantial investment levels needed to successfully manage the transition into a renewable energy future in less polluted regions is a topic worthy of discussion. In this respect, energy policies can help them reach greenhouse gas emission reduction goals.
The research only focused on the influence of CO2 and non-CO2 emissions on three specific forms of clean energy, namely solar, wind, and geothermal. It did not take other types of clean energy, like hydropower and bioenergy, into account. In upcoming studies, the effects of emissions from these other types of clean energy could be explored. Additionally, the study did not examine how technological advancements impact investments in clean energy. Future research could investigate this relationship. Additionally, socio-economic factors such as education, income, and population growth were not considered in the study. Including these factors in future research could provide a more comprehensive analysis of the factors that determine investments in clean energy. In forthcoming studies, we intend to employ advanced machine learning techniques to examine the intricate relationship between climate change variables and the progress towards renewable energy adoption.

Author Contributions

Conceptualization, A.G. and J.J.L.; Methodology, A.G., V.K. and S.H.F.; Software, A.G. and S.H.F.; Validation, A.G., S.H.F. and J.J.L.; Formal analysis, A.G., V.K. and S.H.F.; Investigation, A.G. and V.K.; Resources, A.G.; Data curation, A.G., V.K. and S.H.F.; Writing—original draft, A.G.; Writing—review & editing, A.G. and V.K.; Visualization, A.G. and V.K.; Supervision, J.J.L.; Project administration, A.G. and S.H.F.; Funding acquisition, J.J.L. All authors have read and agreed to the published version of the manuscript.

Funding

This work was supported by the Pukyong National University Research Fund in 2022.

Data Availability Statement

Data will be made available on request.

Conflicts of Interest

The authors declare no conflict of interest.

Appendix A

Table A1. Country List.
Less Polluted (The Average CO2 from 1990 to 2021)More Polluted (The Average CO2 from 1990 to 2021)
BrazilMexicoRomaniaUnited Arab EmiratesUSAGermanyUnited Kingdom
El SalvadorPakistanHondurasEthiopiaSouth KoreaChinaSwitzerland
JordanBulgariaNicaraguaBelarusNew ZealandJapanIndia
EgyptPortugalCroatiaBangladeshCanadaSpainSouth Africa
IrelandItalyIcelandHong KongAustraliaFranceDenmark
PolandRomaniaIranMoroccoGermanyBelgiumSweden
ArgentinaCosta RicaNetherlandsItalyPolandCzech RepublicAustria
ThailandVietnamSlovakiaSri LankaNorwayBelgiumFinland
TurkeyArgentinaUruguaySlovenia
The Philippines HungaryKenya

References

  1. EIA. Energy Information Administration 2021. International Energy Statistics Global carbon dioxide. Int. J. Energy Econ. Policy 2020, 3, 34–40. Available online: www.eia.gov/ieo (accessed on 17 February 2023).
  2. Fei, L.; Dong, S.; Xue, L.; Liang, Q.; Yang, W. Energy consumption-economic growth relationship and carbon dioxide emissions in China. Energy Policy 2011, 39, 568–574. [Google Scholar] [CrossRef]
  3. Wüstenhagen, R.; Menichetti, E. Strategic choices for renewable energy investment: Conceptual framework and opportunities for further research. Energy Policy 2012, 40, 1–10. [Google Scholar] [CrossRef] [Green Version]
  4. Wei, Y.M.; Mi, Z.F.; Huang, Z. Climate policy modeling: An online SCI-E and SSCI based literature review. Omega 2015, 57, 70–84. [Google Scholar] [CrossRef] [Green Version]
  5. Panteli, M.; Mancarella, P. Modeling and evaluating the resilience of critical electrical power infrastructure to extreme weather events. IEEE Syst. J. 2017, 11, 1733–1742. [Google Scholar] [CrossRef]
  6. Campbell, R.J. CRS Report for Congress Weather-Related Power Outages and Electric System Resiliency Specialist in Energy Policy Weather-Related Power Outages and Electric System Resiliency Congressional Research Service Weather-Related Power Outages and Electric System Resiliency Congressional Research Service; Congressional Research Service, Library of Congress: Washington, DC, USA, 2012. [Google Scholar]
  7. UNFCCC. 2013. Available online: https://unfccc.int/process-and-meetings/what-is-the-united-nations-framework-convention-on-climate-change (accessed on 17 February 2023).
  8. Hao, Y.; Wu, H. The Role of Internet Development on Energy Intensity in China—Evidence From a Spatial Econometric Analysis. Asian Econ. Lett. 2021, 1, 1–6. Available online: https://ideas.repec.org/a/ayb/jrnael/3.html (accessed on 17 February 2023). [CrossRef]
  9. Ming, W.; Zhou, Z.; Ai, H.; Bi, H.; Zhong, Y. COVID-19 and Air Quality: Evidence from China. Emerg. Mark. Financ. Trade 2020, 56, 2422–2442. [Google Scholar] [CrossRef]
  10. Qin, M.; Zhang, Y.-C.; Su, C.-W. The Essential Role of Pandemics: A Fresh Insight into the Oil Market. Energy Res. Lett. 2020, 1, 13166. [Google Scholar] [CrossRef]
  11. Salisu, A.A.; Sikiru, A.A. Pandemics and the Asia-Pacific Islamic Stocks. Asian Econ. Lett. 2020, 1, 17413. [Google Scholar] [CrossRef]
  12. Salisu, A.; Adediran, I. Uncertainty Due to Infectious Diseases and Energy Market Volatility. Energy Res. Lett. 2020, 1, 14185. [Google Scholar] [CrossRef]
  13. Apergis, N.; Payne, J.E. The renewable energy consumption-growth nexus in Central America. Appl. Energy 2011, 88, 343–347. [Google Scholar] [CrossRef]
  14. Narayan, P.K.; Devpura, N.; Wang, H. Japanese currency and stock market—What happened during the COVID-19 pandemic? Econ. Anal. Policy 2020, 68, 191–198. [Google Scholar] [CrossRef]
  15. Iyke, B.N. COVID-19: The reaction of US oil and gas producers to the pandemic. Energy Res. Lett. 2020, 1, 13912. [Google Scholar] [CrossRef]
  16. Narayan, P.K. Oil price news and COVID-19—Is there any connection? Energy Res. Lett. 2020, 1, 13176. [Google Scholar] [CrossRef]
  17. Narayan, P.K. Has COVID-19 Changed Exchange Rate Resistance to Shocks? Asian Econ. Lett. 2020, 1, 17389. [Google Scholar] [CrossRef]
  18. Liu, L.; Wang, E.-Z.; Lee, C.-C. Impact of the COVID-19 pandemic on the crude oil and stock markets in the US: A time-varying analysis. Energy Res. Lett. 2020, 1, 13154. [Google Scholar] [CrossRef]
  19. Fu, M.; Shen, H. COVID-19 and Corporate Performance in the Energy Industry. Energy Res. Lett. 2021, 1, 1–4. Available online: https://ideas.repec.org/a/ayb/jrnerl/28.html (accessed on 17 February 2023). [CrossRef]
  20. He, P.; Niu, H.; Sun, Z.; Li, T. Accounting Index of COVID-19 Impact on Chinese Industries: A Case Study Using Big Data Portrait Analysis. Emerg. Mark. Financ. Trade 2020, 56, 2332–2349. [Google Scholar] [CrossRef]
  21. Prabheesh, K.P. Dynamics of Foreign Portfolio Investment and Stock Market Returns During the COVID-19 Pandemic: Evidence From India. Asian Econ. Lett. 2020, 1, 1–5. [Google Scholar] [CrossRef]
  22. Sharma, S.S. A Note on the Asian Market Volatility During the COVID-19 Pandemic. Asian Econ. Lett. 2021, 1, 1–6. Available online: https://ideas.repec.org/a/ayb/jrnael/7.html (accessed on 17 February 2023). [CrossRef]
  23. Yan, L.; Qian, Y. The Impact of COVID-19 on the Chinese Stock Market: An Event Study Based on the Consumer Industry. Asian Econ. Lett. 2020, 1, 18068. [Google Scholar] [CrossRef]
  24. Jefferson, M. Accelerating the transition to sustainable energy systems. Energy Policy 2008, 36, 4116–4125. [Google Scholar] [CrossRef]
  25. Vidya, C.T.; Prabheesh, K.P. Implications of COVID-19 Pandemic on the Global Trade Networks. Emerg. Mark. Financ. Trade 2020, 56, 2408–2421. [Google Scholar] [CrossRef]
  26. Qin, M.; Su, C.W.; Zhang, S.-P. Tourism and Unemployment in Hong Kong: Is There Any Interaction? Asian Econ. Lett. 2020, 1, 17222. [Google Scholar] [CrossRef]
  27. Polemis, M.; Soursou, S. Assessing the Impact of the COVID-19 Pandemic on the Greek Energy Firms: An Event Study Analysis. Energy Res. Lett. 2020, 1, 17238. [Google Scholar] [CrossRef]
  28. He, P.; Sun, Y.; Zhang, Y.; Li, T. COVID–19′s Impact on Stock Prices Across Different Sectors—An Event Study Based on the Chinese Stock Market. Emerg. Mark. Financ. Trade 2020, 56, 2198–2212. [Google Scholar] [CrossRef]
  29. Yu, Z.; Xiao, Y.; Li, Y. The Response of the Labor Force Participation Rate to an Epidemic: Evidence from a Cross-Country Analysis. Emerg. Mark. Financ. Trade 2020, 56, 2390–2407. [Google Scholar] [CrossRef]
  30. IPCC Fourth Assessment Report: Climate Change 2007 (AR4). Available online: https://archive.ipcc.ch/publications_and_data/ar4/wg2/en/contents.html (accessed on 17 February 2023).
  31. World Bank. CO2 Emission between Countries, Environment Department Paper Industrialized Countries: An Analysis of Trends; The World Bank: Washington, DC, USA, 2021; Available online: https://data.worldbank.org/indicator/EN.ATM.CO2E.PC (accessed on 17 February 2023).
  32. Global Trade Analysis Project (GTAP), “Global Greenhouse Gas Emissions” Data|US EPA. 2021. Available online: https://cfpub.epa.gov/ghgdata/nonco2/ (accessed on 17 February 2023).
  33. Huaman, R.N.E.; Jun, T.X. Energy related CO2 emissions and the progress on CCS projects: A review. Renew. Sustain. Energy Rev. 2014, 31, 368–385. [Google Scholar] [CrossRef]
  34. Azevedo, V.G.; Sartori, S.; Campos, L.M.S. CO2 emissions: A quantitative analysis among the BRICS nations. Renew. Sustain. Energy Rev. 2018, 81, 107–115. [Google Scholar] [CrossRef]
  35. NASA. Effects of Changing the Carbon Cycle. Available online: https://earthobservatory.nasa.gov/features/CarbonCycle/page5.php (accessed on 17 February 2023).
  36. Nong, D.; Simshauser, P. On energy and climate change policies: The impact of baseline projections. Appl. Energy 2020, 269, 115062. [Google Scholar] [CrossRef]
  37. Aguirre, M.; Ibikunle, G. Determinants of renewable energy growth: A global sample analysis. Energy Policy 2014, 69, 374–384. [Google Scholar] [CrossRef] [Green Version]
  38. Nong, D.; Simshauser, P.; Nguyen, D.B. Greenhouse gas emissions vs. CO2 emissions: Comparative analysis of a global carbon tax. Appl. Energy 2021, 298, 117223. [Google Scholar] [CrossRef]
  39. Chen, X.; Fu, Q.; Chang, C.P. What are the shocks of climate change on clean energy investment: A diversified exploration. Energy Econ. 2021, 95, 105136. [Google Scholar] [CrossRef]
  40. Kuşkaya, S.; Bilgili, F. The wind energy-greenhouse gas nexus: The wavelet-partial wavelet coherence model approach. J. Clean. Prod. 2020, 245, 118872. [Google Scholar] [CrossRef]
  41. Dincer, I.; Acar, C. A review on clean energy solutions for better sustainability. Int. J. Energy Res. 2015, 39, 585–606. [Google Scholar] [CrossRef]
  42. Busu, M. Measuring the Renewable Energy Efficiency at the European Union Level and Its Impact on CO2 Emissions. Processes 2019, 7, 923. [Google Scholar] [CrossRef] [Green Version]
  43. IEA. World Energy Investment 2022. 2022. Available online: https://www.iea.org/news/record-clean-energy-spending-is-set-to-help-global-energy-investment-grow-by-8-in-2022 (accessed on 17 February 2023).
  44. Liebreich, M. Bloomberg New Energy Finance Summit New York. 2017. Available online: https://data.bloomberglp.com/bnef/sites/14/2017/04/2017-04-25-Michael-Liebreich-BNEFSummit-Keynote.pdf (accessed on 25 April 2017).
  45. Sadorsky, P. Renewable energy consumption, CO2 emissions and oil prices in the G7 countries. Energy Econ. 2009, 31, 456–462. [Google Scholar] [CrossRef]
  46. Global Trends in Sustainable Energy Investment, Energy, Efficiency. 2008. Available online: www.unep.fr (accessed on 17 February 2023).
  47. Muhammad, S.; Samia, N.; Talat, A. Environmental Consequences of Economic Growth and Foreign Direct Investment: Evidence from Panel Data Analysis. MPRA Paper, No. 32547. 2011. Available online: https://mpra.ub.uni-muenchen.de/32547/1/MPRA_paper_32547.pdf (accessed on 1 August 2011).
  48. Nguyen-Van, P. Energy consumption and income: A semiparametric panel data analysis. Energy Econ. 2010, 32, 557–563. [Google Scholar] [CrossRef]
  49. Johnston, J.; DiNardo, J. Econometric Methods 4/e; McGraw-Hill Education: New York, NY, USA, 1997; Available online: https://www.amazon.co.uk/Econometric-Methods-4-J-Johnston/dp/007115342X (accessed on 17 February 2023)ISBN 9780071153423.
  50. Olanrewaju, B.T.; Olubusoye, O.E.; Adenikinju, A.; Akintande, O.J. A panel data analysis of renewable energy consumption in Africa. Renew. Energy 2019, 140, 668–679. [Google Scholar] [CrossRef]
  51. Hattori, T.; Tsutsui, M. Economic impact of regulatory reforms in the electricity supply industry: A panel data analysis for OECD countries. Energy Policy 2004, 32, 823–832. [Google Scholar] [CrossRef]
  52. Seymore, R.; Inglesi-Lotz, R.; Blignaut, J. A greenhouse gas emissions inventory for South Africa: A comparative analysis. Renew. Sustain. Energy Rev. 2014, 34, 371–379. [Google Scholar] [CrossRef] [Green Version]
  53. Nyambuu, U.; Semmler, W. Climate change and the transition to a low carbon economy—Carbon targets and the carbon budget. Econ. Model. 2020, 84, 367–376. [Google Scholar] [CrossRef]
  54. Chien, T.; Hu, J.L. Renewable energy and macroeconomic efficiency of OECD and non-OECD economics. Energy Policy 2007, 35, 3606–3615. [Google Scholar] [CrossRef]
  55. Robalino-López, A.; Mena-Nieto, Á.; García-Ramos, J.E.; Golpe, A.A. Studying the relationship between economic growth, CO2 emissions, and the environmental Kuznets curve in Venezuela (1980–2025). Renew. Sustain. Energy Rev. 2015, 41, 602–614. [Google Scholar] [CrossRef] [Green Version]
  56. Añel, J.A.; Fernández-González, M.; Labandeira, X.; López-Otero, X.; de la Torre, L. Impact of Cold Waves and Heat Waves on the Energy Production Sector. Atmosphere 2017, 8, 209. [Google Scholar] [CrossRef] [Green Version]
  57. Chien, T.; Hu, J.-L. Renewable energy: An efficient mechanism to improve GDP. Energy Policy 2008, 36, 3045–3052. [Google Scholar] [CrossRef]
  58. Zeb, R.; Salar, L.; Awan, U.; Zaman, K.; Shahbaz, M. Causal links between renewable energy, environmental degradation and economic growth in selected SAARC countries: Progress towards green economy. Renew. Energy 2014, 71, 123–132. [Google Scholar] [CrossRef]
  59. Fuss, S.; Szolgayová, J.; Khabarov, N.; Obersteiner, M. Renewables and climate change mitigation: Irreversible energy investment under uncertainty and portfolio effects. Energy Policy 2012, 40, 59–68. [Google Scholar] [CrossRef]
  60. Li, W.; Jia, Z.; Zhang, H. The impact of electric vehicles and CCS in the context of emission trading scheme in China: A CGE-based analysis. Energy 2017, 119, 800–816. [Google Scholar] [CrossRef]
  61. Dai, H.; Xie, Y.; Liu, J.; Masui, T. Aligning renewable energy targets with carbon emissions trading to achieve China’s INDCs: A general equilibrium assessment. Renew. Sustain. Energy Rev. 2018, 82, 4121–4131. [Google Scholar] [CrossRef]
  62. Zhang, H.; Duan, M.; Deng, Z. Have China’s pilot emissions trading schemes promoted carbon emission reductions?—The evidence from industrial sub-sectors at the provincial level. J. Clean. Prod. 2019, 234, 912–924. [Google Scholar] [CrossRef]
  63. Lin, B.; Jia, Z. What are the main factors affecting carbon price in Emission Trading Scheme? A case study in China. Sci. Total Environ. 2019, 654, 525–534. [Google Scholar] [CrossRef]
  64. Reilly, J.; Prinn, R.; Harnisch, J.; Fitzmaurice, J.; Jacoby, H.; Kicklighter, D.; Melillo, J.; Stone, P.; Sokolov, A.; Wang, C. Multi-gas assessment of the Kyoto Protocol. Nature 1999, 401, 549–555. [Google Scholar] [CrossRef]
  65. Tol, R.S.J. The Marginal Costs of Greenhouse Gas Emissions. Energy J. 1999, 20, 61–81. [Google Scholar] [CrossRef]
  66. Manne, A.S.; Richels, R.G. An alternative approach to establishing trade-offs among greenhouse gases. Nature 2001, 410, 675–677. [Google Scholar] [CrossRef] [PubMed]
  67. Weyant, J.P.; de la Chesnaye, F.C.; Blanford, G.J. Overview of EMF-21: Multigas Mitigation and Climate Policy. Energy J. 2006, SI2006, 1–32. [Google Scholar] [CrossRef]
  68. Meng, S.; Siriwardana, M.; McNeill, J. The Environmental and Economic Impact of the Carbon Tax in Australia. Environ. Resour. Econ. 2013, 54, 313–332. [Google Scholar] [CrossRef]
  69. Renner, S. Poverty and distributional effects of a carbon tax in Mexico. Energy Policy 2018, 112, 98–110. [Google Scholar] [CrossRef] [Green Version]
  70. García Benavente, J.M. Impact of a carbon tax on the Chilean economy: A computable general equilibrium analysis. Energy Econ. 2016, 57, 106–127. [Google Scholar] [CrossRef]
  71. Adams, P.D.; Parmenter, B.R.; Verikios, G. An Emissions Trading Scheme for Australia: National and Regional Impacts. Econ. Rec. 2014, 90, 316–344. [Google Scholar] [CrossRef] [Green Version]
  72. Tran, T.M.; Siriwardana, M.; Meng, S.; Nong, D. Impact of an emissions trading scheme on Australian households: A computable general equilibrium analysis. J. Clean. Prod. 2019, 221, 439–456. [Google Scholar] [CrossRef]
  73. Gan, L.; Eskeland, G.S.; Kolshus, H.H. Green electricity market development: Lessons from Europe and the US. Energy Policy 2007, 35, 144–155. [Google Scholar] [CrossRef]
  74. Foxon, T.J.; Pearson, P.J.G. Towards improved policy processes for promoting innovation in renewable electricity technologies in the UK. Energy Policy 2007, 35, 1539–1550. [Google Scholar] [CrossRef]
  75. Lipp, J. Lessons for effective renewable electricity policy from Denmark, Germany and the United Kingdom. Energy Policy 2007, 35, 5481–5495. [Google Scholar] [CrossRef]
  76. Zhang, H.; Wang, L.; van Herle, J.; Maréchal, F.; Desideri, U. Techno-economic optimization of CO2-to-methanol with solid-oxide electrolyzer. Energies 2019, 12, 3742. [Google Scholar] [CrossRef] [Green Version]
  77. Mills, D. Advances in solar thermal electricity technology. Sol. Energy 2004, 76, 19–31. [Google Scholar] [CrossRef]
  78. Menyah, K.; Wolde-Rufael, Y. CO2 emissions, nuclear energy, renewable energy and economic growth in the US. Energy Policy 2010, 38, 2911–2915. [Google Scholar] [CrossRef]
  79. Schnitzer, H.; Brunner, C.; Gwehenberger, G. Minimizing greenhouse gas emissions through the application of solar thermal energy in industrial processes. J. Clean. Prod. 2007, 15, 1271–1286. [Google Scholar] [CrossRef]
  80. Güney, T.; Üstündağ, E. Wind energy and CO2 emissions: AMG estimations for selected countries. Environ. Sci. Pollut. Res. 2022, 29, 21303–21313. [Google Scholar] [CrossRef]
  81. Ackermann, T.; Söder, L. An overview of wind energy-status 2002. Renew. Sustain. Energy Rev. 2002, 6, 67–127. [Google Scholar] [CrossRef]
  82. Barbier, E. Geothermal energy technology and current status: An overview. Renew. Sustain. Energy Rev. 2002, 6, 3–65. [Google Scholar] [CrossRef]
  83. Usman, A.; Ullah, S.; Ozturk, I.; Chishti, M.Z.; Zafar, S.M. Analysis of asymmetries in the nexus among clean energy and environmental quality in Pakistan. Environ. Sci. Pollut. Res. 2020, 27, 20736–20747. [Google Scholar] [CrossRef]
  84. Liu, X.; Zeng, M. Renewable energy investment risk evaluation model based on system dynamics. Renew. Sustain. Energy Rev. 2017, 73, 782–788. [Google Scholar] [CrossRef]
  85. Cretí, A.; Joëts, M. Multiple bubbles in the European Union Emission Trading Scheme. Energy Policy 2017, 107, 119–130. [Google Scholar] [CrossRef]
  86. Diaz-Rainey, I.; Tulloch, D.J. Carbon pricing and system linking: Lessons from the New Zealand Emissions Trading Scheme. Energy Econ. 2018, 73, 66–79. [Google Scholar] [CrossRef]
  87. Chen, Z.; Yuan, X.C.; Zhang, X.; Cao, Y. How will the Chinese national carbon emissions trading scheme work? The assessment of regional potential gains. Energy Policy 2020, 137, 111095. [Google Scholar] [CrossRef]
  88. Gelo, T.; Šimurina, N. The Economic Impact of Investment in Renewables in Croatia. Energies 2021, 14, 8215. [Google Scholar] [CrossRef]
  89. Choma, E. The Potential and Development of the Geothermal Energy Market in Poland and the Baltic States—Selected Aspects. Energies 2022, 15, 4142. [Google Scholar]
  90. Simshauser, P.; Tiernan, A. Climate change policy discontinuity and its effects on Australia’s national electricity market. Aust. J. Public Adm. 2019, 78, 17–36. [Google Scholar] [CrossRef] [Green Version]
  91. REN21. Renewables 2007 Global Status Report Renewables 2007 Global Status Report. 2008. Available online: www.martinot.info (accessed on 17 February 2023).
  92. Jacobsson, S.; Sandén, B.; Bångens, L.; Bjo¨, B.; Sandé, B.A.; Lennart, N.; Ngens, B.Å. Transforming the Energy System—The Evolution of the German Technological System for Solar Cells. Technol. Anal. Strateg. Manag. 2010, 16, 3–30. [Google Scholar] [CrossRef]
  93. Wüstenhagen, R.; Bilharz, M. Green energy market development in Germany: Effective public policy and emerging customer demand. Energy Policy 2006, 34, 1681–1696. [Google Scholar] [CrossRef] [Green Version]
  94. Breukers, S.; Wolsink, M. Wind power implementation in changing institutional landscapes: An international comparison. Energy Policy 2007, 35, 2737–2750. [Google Scholar] [CrossRef]
  95. Toke, D.; Breukers, S.; Wolsink, M. Wind power deployment outcomes: How can we account for the differences? Renew. Sustain. Energy Rev. 2008, 12, 1129–1147. [Google Scholar] [CrossRef]
  96. Asumadu-Sarkodie, S.; Owusu, P.A. Carbon dioxide emissions, GDP, energy use, and population growth: A multivariate and causality analysis for Ghana, 1971–2013. Environ. Sci. Pollut. Res. 2016, 23, 13508–13520. [Google Scholar] [CrossRef] [PubMed]
  97. Wang, S.; Fang, C.; Wang, Y. Spatiotemporal variations of energy-related CO2 emissions in China and its influencing factors: An empirical analysis based on provincial panel data. Renew. Sustain. Energy Rev. 2016, 55, 505–515. [Google Scholar] [CrossRef]
  98. Wooldridge, J.M. Econometric Analysis of Cross Section and Panel Data, 2nd ed.; MIT Press: Cambridge, MA, USA, 2010. [Google Scholar]
  99. Burnell, P. Democracy, democratization and climate change: Complex relationships. Democratization 2012, 19, 813–842. [Google Scholar] [CrossRef] [Green Version]
  100. BP Statistical Review of World Energy 2021, Database for Solar, Wind, Geothermal Energy Capacity, Rent, Energy Consumption, GDP, GHG Emissions. Available online: https://www.bp.com/content/dam/bp/business-sites/en/global/corporate/pdfs/energy-economics/statistica (accessed on 1 July 2021).
  101. Popp, D.; Hascic, I.; Medhi, N. Technology and the diffusion of renewable energy. Energy Econ. 2011, 33, 648–662. [Google Scholar] [CrossRef]
  102. Polzin, F.; Migendt, M.; Täube, F.A.; von Flotow, P. Public policy influence on renewable energy investments—A panel data study across OECD countries. Energy Policy 2015, 80, 98–111. [Google Scholar] [CrossRef] [Green Version]
  103. The International Disasters Database, Center for Research on the Epidemiology of Disasters-CRE. Available online: https://www.emdat.be/ (accessed on 26 December 2022).
  104. Bilgen, S. Structure and environmental impact of global energy consumption. Renew. Sustain. Energy Rev. 2014, 38, 890–902. [Google Scholar] [CrossRef]
  105. Ahmadov, A.K.; van der Borg, C. Do natural resources impede renewable energy production in the EU? A mixed-methods analysis. Energy Policy 2019, 126, 361–369. [Google Scholar] [CrossRef]
  106. Hausman, J.A. Specification tests in econometrics. Appl. Econom. 2015, 38, 112–134. [Google Scholar] [CrossRef] [Green Version]
  107. Sun, Y. Estimation of the long-run average relationship in nonstationary panel time series. Econom. Theory 2004, 20, 1227–1260. [Google Scholar] [CrossRef] [Green Version]
  108. Pan, Z.; Segal, M.; Arritt, R.W.; Takle, E.S. On the potential change in solar radiation over the US due to increases of atmospheric greenhouse gases. Renew. Energy 2004, 29, 1923–1928. [Google Scholar] [CrossRef]
  109. Wang, B.; Mi, Z.; Nistor, I.; Yuan, X. How does hydrogen-based renewable energy change with economic development ? Empirical evidence from 32 countries. Int. J. Hydrog. Energy 2017, 43, 11629–11638. [Google Scholar] [CrossRef] [Green Version]
  110. Timilsina, G.R.; Kurdgelashvili, L.; Narbel, P.A. Solar energy: Markets, economics and policies. Renew. Sustain. Energy Rev. 2012, 16, 449–465. [Google Scholar] [CrossRef]
  111. Vmi, M.; Kierrätyspolttoaineiden Ominaisuudet ja Käyttö, C.; Martikainen, A.; Pykälä, M.-L.; Farin, J. Recognizing Climate Change in Electricity Network Design and Construction. 2007. Available online: http://www.vtt.fihttp//www.vtt.fihttp://www.vtt.fi (accessed on 17 February 2023).
  112. Beard, L.M.; Cardell, J.B.; Dobson, I.; Galvan, F.; Hawkins, D.; Jewell, W.; Kezunovic, M.; Overbye, T.J.; Sen, P.K.; Tylavsky, D.J. Key technical challenges for the electric power industry and climate change. IEEE Trans. Energy Convers. 2010, 25, 465–473. [Google Scholar] [CrossRef]
  113. Ward, P.S.; Shively, G.E. Disaster risk, social vulnerability, and economic development. Disasters 2017, 41, 324–351. [Google Scholar] [CrossRef]
  114. Kenward, A.; Raja, U. Blackout: Extreme Weather, Climate Change and Power Outages. 2014. Available online: www.climatecentral.org (accessed on 17 February 2023).
  115. Wang, K.; Yan, M.; Wang, Y.; Chang, C.P. The impact of environmental policy stringency on air quality. Atmos. Environ. 2020, 231, 117522. [Google Scholar] [CrossRef]
  116. Huang, W.; Zheng, Y. COVID-19: Structural Changes in the Relationship Between Investor Sentiment and Crude Oil Futures Price. Energy Res. Lett. 2020, 1, 13685. [Google Scholar] [CrossRef]
  117. Sendstad, L.H.; Hagspiel, V.; Mikkelsen, W.J.; Ravndal, R.; Tveitstøl, M. The impact of subsidy retraction on European renewable energy investments. Energy Policy 2022, 160, 112675. [Google Scholar] [CrossRef]
  118. Simshauser, P.; Gilmore, J. Climate change policy discontinuity & Australia’s 2016–2021 renewable investment supercycle. Energy Policy 2022, 160, 112648. [Google Scholar] [CrossRef]
  119. Chang, C.P.; Wen, J.; Zheng, M.; Dong, M.; Hao, Y. Is higher government efficiency conducive to improving energy use efficiency? Evidence from OECD countries. Econ. Model. 2018, 72, 65–77. [Google Scholar] [CrossRef]
  120. Lin, B.; Li, M. Understanding the investment of renewable energy firms in the face of economic policy uncertainty—Micro-evidence from listed companies in China. China Econ. Rev. 2022, 75, 101845. [Google Scholar] [CrossRef]
  121. Dreveskracht, R.D. Economic Development, Native Nations, and Solar Projects. Am. J. Econ. Sociol. 2013, 72, 122–144. [Google Scholar] [CrossRef]
  122. Sadorsky, P. Trade and energy consumption in the Middle East. Energy Econ. 2011, 33, 739–749. [Google Scholar] [CrossRef]
  123. Steele, A.H.; Warner, T.; Vikara, D.; Guinan, A.; Balash, P. Comparative analysis of carbon capture and storage finance gaps and the social cost of carbon. Energies 2021, 14, 2987. [Google Scholar] [CrossRef]
Figure 1. Contribution of CO2 and non-CO2 greenhouse gas emissions in 2021 (W/m2).
Energies 16 03025 g001
Figure 2. Global investment in clean energy, 1990–2021 (in USD billions).
Energies 16 03025 g002
Figure 3. (a) Average CO2 emissions (tons per capita) (1990–2021). (b) CO2 and non-CO2 GHG emissions from 1990 to 2021.
Energies 16 03025 g003aEnergies 16 03025 g003b
Figure 4. Global renewable energy capacity investment between 1990 and 2021.
Energies 16 03025 g004
Figure 5. Model for panel regression.
Energies 16 03025 g005
Table 1. Descriptive statistics of the variables.
VariableObservationMeanStandard DeviationMinMax
Dependent variable
Solar19910.0340.16603.064
Wind10900.0540.20803.290
Geothermal5500.0420.06400.317
Independent variable
CO2 GHG emissions18905.9864.8820.03031.779
Non-CO2 GHG emissions15360.0570.1360.0021.204
Climate change variable
Flood-n9640.8491.0150.0019.316
Flood-l7460.1390.42206.453
Control variables
Policy4800.1670.3250.0012.973
Population20160.8112.1620.00314.124
Rent19083.8306.253036.707
GDP19890.2500.1900.0061.115
Trade20160.5970.34801.921
Industry184827.7277.7336.09458.902
Energy16630.2000.66408.523
Table 2. Hausman test and F-test results.
Test TypeǷF-ValueChi-Square Statisticp-Value
F-test0.9740.21-0.00
Hausman test--61.830.00
Auxiliary regression--81.380.00
Table 3. VIF regression collinearity test.
VariableVIF1/VIFVariableVIF1/VIF
CO25.440.184Rent1.870.533
Non-CO28.040.124Energy2.780.360
Population7.730.129Flood-n1.930.518
Industry5.370.186Flood-l 1.820.550
GDP3.60277Policy1.280.784
Trade3.410.293
Mean VIF 4.30
Table 4. Results of the correlation matrix of the variables.
SolarNon-CO2Flood-nFlood-lPolicyPopulationRentGDPTradeIndustryEnergyCO2
Solar1.000
Non-CO20.5351.000
Flood-n0.1490.3981.000
Flood-l0.0660.3060.3271.000
Policy−0.0380.0320.1390.1191.000
Population0.3730.7010.5560.6050.2281.000
Rent−0.082−0.0010.045−0.004−0.037−0.0071.000
GDP0.065−0.013−0.201−0.2310.04−0.199−0.1511.000
Trade−0.1080.214−0.043−0.117−0.192−0.2050.0500.1331.000
Industry0.0450.1580.2570.168−0.0690.2340.456−0.0370.2091.000
Energy0.8250.6430.1810.0850.1130.373−0.1050.1030.155−0.0731.000
CO20.0640.208−0.164−0.155−0.046−0.0880.0210.7580.0790.1820.1161.000
Table 5. The estimated results.
VariableSolarWindGeothermal
Coefficientp-ValueCoefficientp-ValueCoefficientp-Value
CO20.0220.0030.0060.809−0.0060.474
Non-CO2−0.3920.042−0.3970.050−0.0590.048
Flood-n−0.0010.6990.0010.8930.0090.043
Flood-l−0.0090.0400.0020.874−0.0070.744
Policy0.0820.0020.0700.0210.0490.100
Population0.0030.3520.0240.305−0.0150.002
Rent−0.0040.0600.0170.000−0.0010.929
GDP−0.5140.0460.3710.294−0.3900.045
Trade−0.0680.0540.1170.049−0.0330.008
Industry0.0070.0610.0080.0200.0010.567
Energy0.2750.0000.2590.0000.0160.022
-CONS−0.1480.160−0.1220.4600.0830.286
Observation1087 1087 1087
R290.12 89.42 71.80
Wald Test 0.000 0.000 0.000
Norm of Residuals0.836 0.565 0.610
Leamer Test6.140.00011.790.00058.880.000
Hausman Test0.0001.0002.960.99121.180.2185
Breusch–pagan Test0.120.7260.000.9491.640.200
Wooldridge Test1.3140.2530.7700.3860.6540.420
Ramsey RESET test0.860.4620.210.8910.6540.420
Table 6. Overview of the results.
GroupModel 1 (Solar)Model 2 (Wind)Model 3 (Geothermal)
CO2+++
Non-CO2
Flood_l+
GDP+
Popu××
Rent×
Energy+++
Trade
Policy+++
Industry++×
Table 7. Estimation results for the solar energy sector in more polluted and less polluted countries.
VariableLess Polluted CountriesMore Polluted Countries
Coefficientp-ValueCoefficientp-Value
CO2−0.0010.857−0.0240.408
Non-CO2−0.0970.029−0.6120.311
Flood-n−0.0050.054−0.0120.002
Flood-l−0.0070.0310.0460.343
Policy−0.0330.024−0.0400.207
Population0.0090.0000.0100.831
Rent0.00020.7090.0100.200
GDP0.0920.5420.4030.243
Trade0.0360.020−0.1140.397
Industry−0.0010.035−0.0010.766
Energy0.0490.2150.3500.000
-CONS0.0060.4990.2280.283
Observation546 541
R291.76 99.70
Wald Test22,220.880.00019,875.310.000
Table 8. Investment estimation results for the wind energy sector by group of polluted and less polluted countries.
VariableLess Polluted CountriesMore Polluted Countries
Coefficientp-ValueCoefficientp-Value
CO2−0.0210.046−0.0450.312
Non-CO20.1590.009−0.670.595
Flood-n−0.0040.001−0.0080.661
Flood-l−0.0030.110−0.0350.662
Policy−0.0140.000−0.0150.834
Population0.0660.0002.0390.000
Rent−0.0050.0010.0120.173
GDP0.2000.1480.5790.444
Trade−0.0090.541−0.8080.042
Industry0.0030.0070.0070.454
Energy0.1040.0000.0600.101
-CONS−0.2780.000−9.9320.000
Observation546 541
R2 90.81 73.58
F-Test137.470.000141.880.000
Table 9. Estimation results for the geothermal energy sector in more and less polluted countries.
Less Polluted CountriesMore Polluted Countries
Coefficientp-ValueCoefficientp-Value
CO2−0.1220.0000.0060.019
Non-CO20.4150.000−0.0830.025
Flood_N 0.003 0.077 0.0003− 0.398
Flood_L0.002 0.886 −0.0020.232
Policy0.0260.0400.0010.565
Population−0.0030.3410.0070.018
Rent−0.00020.898−0.0010.037
GDP1.4990.0000.0350.152
Trade0.0650.0000.0420.061
Industry−0.0010.300−0.00010.749
Energy0.2400.0000.00020.630
-CONS0.1690.000−0.0720.005
Observation 546 541
R2 96.14 96.09
F-Test1194.94000.055.169000.0
Disclaimer/Publisher’s Note: The statements, opinions and data contained in all publications are solely those of the individual author(s) and contributor(s) and not of MDPI and/or the editor(s). MDPI and/or the editor(s) disclaim responsibility for any injury to people or property resulting from any ideas, methods, instructions or products referred to in the content.

