Article

Performance Comparison of Pure Electric Vehicles with Two-Speed Transmission and Adaptive Gear Shifting Strategy Design

1
Tianjin Key Laboratory of New Energy Automobile Power Transmission and Safety Technology, School of Mechanical Engineering, Hebei University of Technology, Tianjin 300130, China
2
Key Laboratory of Hebei Province on Scale-Span Intelligent Equipment Technology, School of Mechanical Engineering, Hebei University of Technology, Tianjin 300401, China
3
School of Vehicle and Mobility, Tsinghua University, Beijing 100190, China
*
Authors to whom correspondence should be addressed.
Energies 2023, 16(7), 3007; https://doi.org/10.3390/en16073007
Submission received: 22 February 2023 / Revised: 20 March 2023 / Accepted: 23 March 2023 / Published: 25 March 2023

Abstract

:
The two-speed automatic transmission can adjust the drive motor speed of electric vehicles and expand their output torque range. This study proposes a rule-based partitioned gear-shifting strategy for pure electric vehicles equipped with a two-speed dual-clutch transmission, combining economic and dynamic shifting strategies to ensure low energy consumption and strong power. Specifically, fuzzy logic is applied to adaptively modify the partition shifting strategy online, to reduce invalid gearshifts, increase the service life of the transmission, and improve driving comfort. Finally, we compare the economic performance and dynamic performance of pure electric vehicles equipped with a two-speed dual-clutch transmission and a single-speed final drive. The results show that the vehicle equipped with the two-speed dual-clutch transmission has better economic and dynamic performance. In addition, its maximum climbing ability was verified by rig testing. These results prove that the two-speed dual-clutch automatic transmission and the gear-shifting strategy proposed in this study can comprehensively improve the performance of pure electric vehicles.

1. Introduction

Currently, energy and pollution problems are becoming increasingly serious worldwide [1]. As a representative solution for clean energy vehicles, the promotion of pure electric vehicles is considered an important way to alleviate fossil fuel consumption and environmental pollution problems [2,3,4]. For a long time, the research hotspot of pure electric vehicles, especially passenger vehicles, has mostly focused on batteries, motors, and configurations [5,6,7]. Meanwhile, the automatic transmission is a very important part of traditional vehicles and hybrid vehicles [8], but it is often neglected in pure electric vehicles. Although pure electric vehicles have made great contributions to energy conservation and emission reduction, from the perspective of the energy industry chain, the electrical energy required for the charging of pure electric vehicles still consumes a lot of fuel and causes huge pollution [9]. Therefore, it is necessary to continuously improve the economic performance of pure electric vehicles, while ensuring dynamic performance. An automatic transmission can adjust the motor speed by shifting gears to ensure that the motor works more efficiently [10]. Moreover, with an automatic transmission, a vehicle’s requirements for motor performance and battery capacity will be reduced, thus saving more resources, reducing pollution, and reducing vehicle manufacturing costs.
Compared with multi-speed transmissions two-speed transmissions are adopted more widely in the field of pure electric vehicles due to their better performance and simpler structure. The commonly used forms of automatic transmissions are dual clutch automatic transmissions (DCTs), automatic manual transmissions (AMTs), and planetary automatic transmissions (ATs). ATs have a more complex structure, higher costs, and lower transmission efficiency than AMTs and DCTs; AMTs and DCTs have excellent dynamic performance, high transmission efficiency, and low manufacturing costs [11,12]. However, AMTs need to cut off the power transmission between the power source and the gears during the shifting process and then switch the gears; thus, there is a power interruption during the shifting process, which will reduce driving comfort [13]. Therefore, DCTs are the preferred transmission mode for pure electric vehicles.
The gear-shifting strategy is very important for transmission-equipped vehicles, and the formulation of the shifting strategy greatly affects the dynamic and economic performance of vehicles. Previous studies are mainly divided into dynamic shifting strategies, economic shifting strategies, and comprehensive shifting strategies. Zhu et al. proposed a dynamic shifting strategy and an economic shifting strategy based on a multi-speed automatic transmission for pure electric vehicles and proved that the two strategies can improve the dynamic and economic efficiency of vehicles [14]. He et al. developed an effective energy management strategy for a two-speed dual-motor transmission pure electric vehicle using an MPC-based longitudinal dynamics model. The offline global optimization method was used to optimize the gear-shifting strategy and the torque distribution [15]. Gao et al. designed the ratio of the two-speed I-AMT and optimized the shifting process, and their research proved that the two-speed I-AMT can improve economy and power [16]. Jeoung et al. applied a greedy algorithm based on speed prediction to find the optimal gear-shift point for the transmission [17]. Lin et al. used dynamic programming and the k-means algorithm to design and compare the hybrid shifting strategy of the multi-speed AMT of urban buses [18]. Shen et al. proposed a dynamic-programming-based hybrid vehicle shifting strategy and optimized the shifting strategy based on the typical Chinese urban driving cycle [19]. Jain designed the electric vehicle transmission shifting strategy with a genetic algorithm and optimized the shifting strategy with the non-dominated sorting genetic algorithm (NSGA-II) [20]. Liu et al. proposed an optimal shifting strategy of the two-speed automatic transmission for electric vehicles based on a multi-objective cuckoo algorithm, considering braking energy recovery efficiency and driving comfort [21]. The dynamic shifting strategy aims to provide the maximum power for the vehicle, while the economic shifting strategy aims to ensure the best energy-saving performance of the vehicle. The comprehensive shifting strategy strives to select a balance point between the dynamic performance and the economic performance through the optimization algorithm, so that the formulated shifting strategy can take into account these two performances [22]. Therefore, optimization-based comprehensive strategies are now more widely adopted.
However, the economic performance and the dynamic performance of a vehicle are usually contradictory [23], causing the equilibrium point found by the optimization algorithm to hurt both dynamic performance and economic performance. This paper adopts a new concept and proposes a partition gear-shifting strategy. In cases where economic performance needs to be more considered (such as urban driving, low-speed driving, and frequent start-stop road sections), the economic gear-shifting strategy is adopted. In contrast, in cases where dynamic performance needs to be more considered (such as in high-speed driving road sections), the dynamic gear-shifting strategy is adopted. In addition, fuzzy logic is introduced to adjust the shifting strategy online to reduce unnecessary shifting, thus obtaining better driving comfort and improving the service life of the transmission. It should also be noted that drivers can also adjust the shift strategy manually, according to their actual situations.
Most of the existing research focuses on formulating gear-shifting strategies for pure electric vehicle transmissions or optimizing transmission parameters. Some researchers have studied the effects of different power systems, different configurations, and other factors on the performance of new energy vehicles through comparative methods. Granovskii et al. compared traditional vehicles, hybrid electric vehicles, pure electric vehicles, and fuel-cell vehicles from the perspectives of economics and environmental pollution [24]. Li et al. compared the economic performance of modular dual-motor electric vehicles and single-motor electric vehicles [25]. Ragheb et al. compared the climbing ability of fuel-cell hybrid vehicles with internal combustion engine vehicles [26]. Wu et al. proposed a dual-motor electric vehicle model with two configurations of planetary gear and parallel gear and compared it with the traditional single-motor electric vehicle from the perspective of economy [27]. Spanoudakis et al. studied the effect of transmission on electric vehicle energy consumption through experiments [28].
To determine the influence of two-speed automatic transmission on the performance of pure electric vehicles and to explore the possibility of widespread application of two-speed transmissions, this research established two identical pure electric vehicle models, without a transmission system. Then, we compared the economic and dynamic performances of a pure electric vehicle with a two-speed dual-clutch transmission and a vehicle equipped with a single-speed final drive only. Finally, the climbing ability of the pure electric vehicle with the two-speed transmission was verified through rig testing.
There are three perspectives on the possible contributions of this research:
(1)
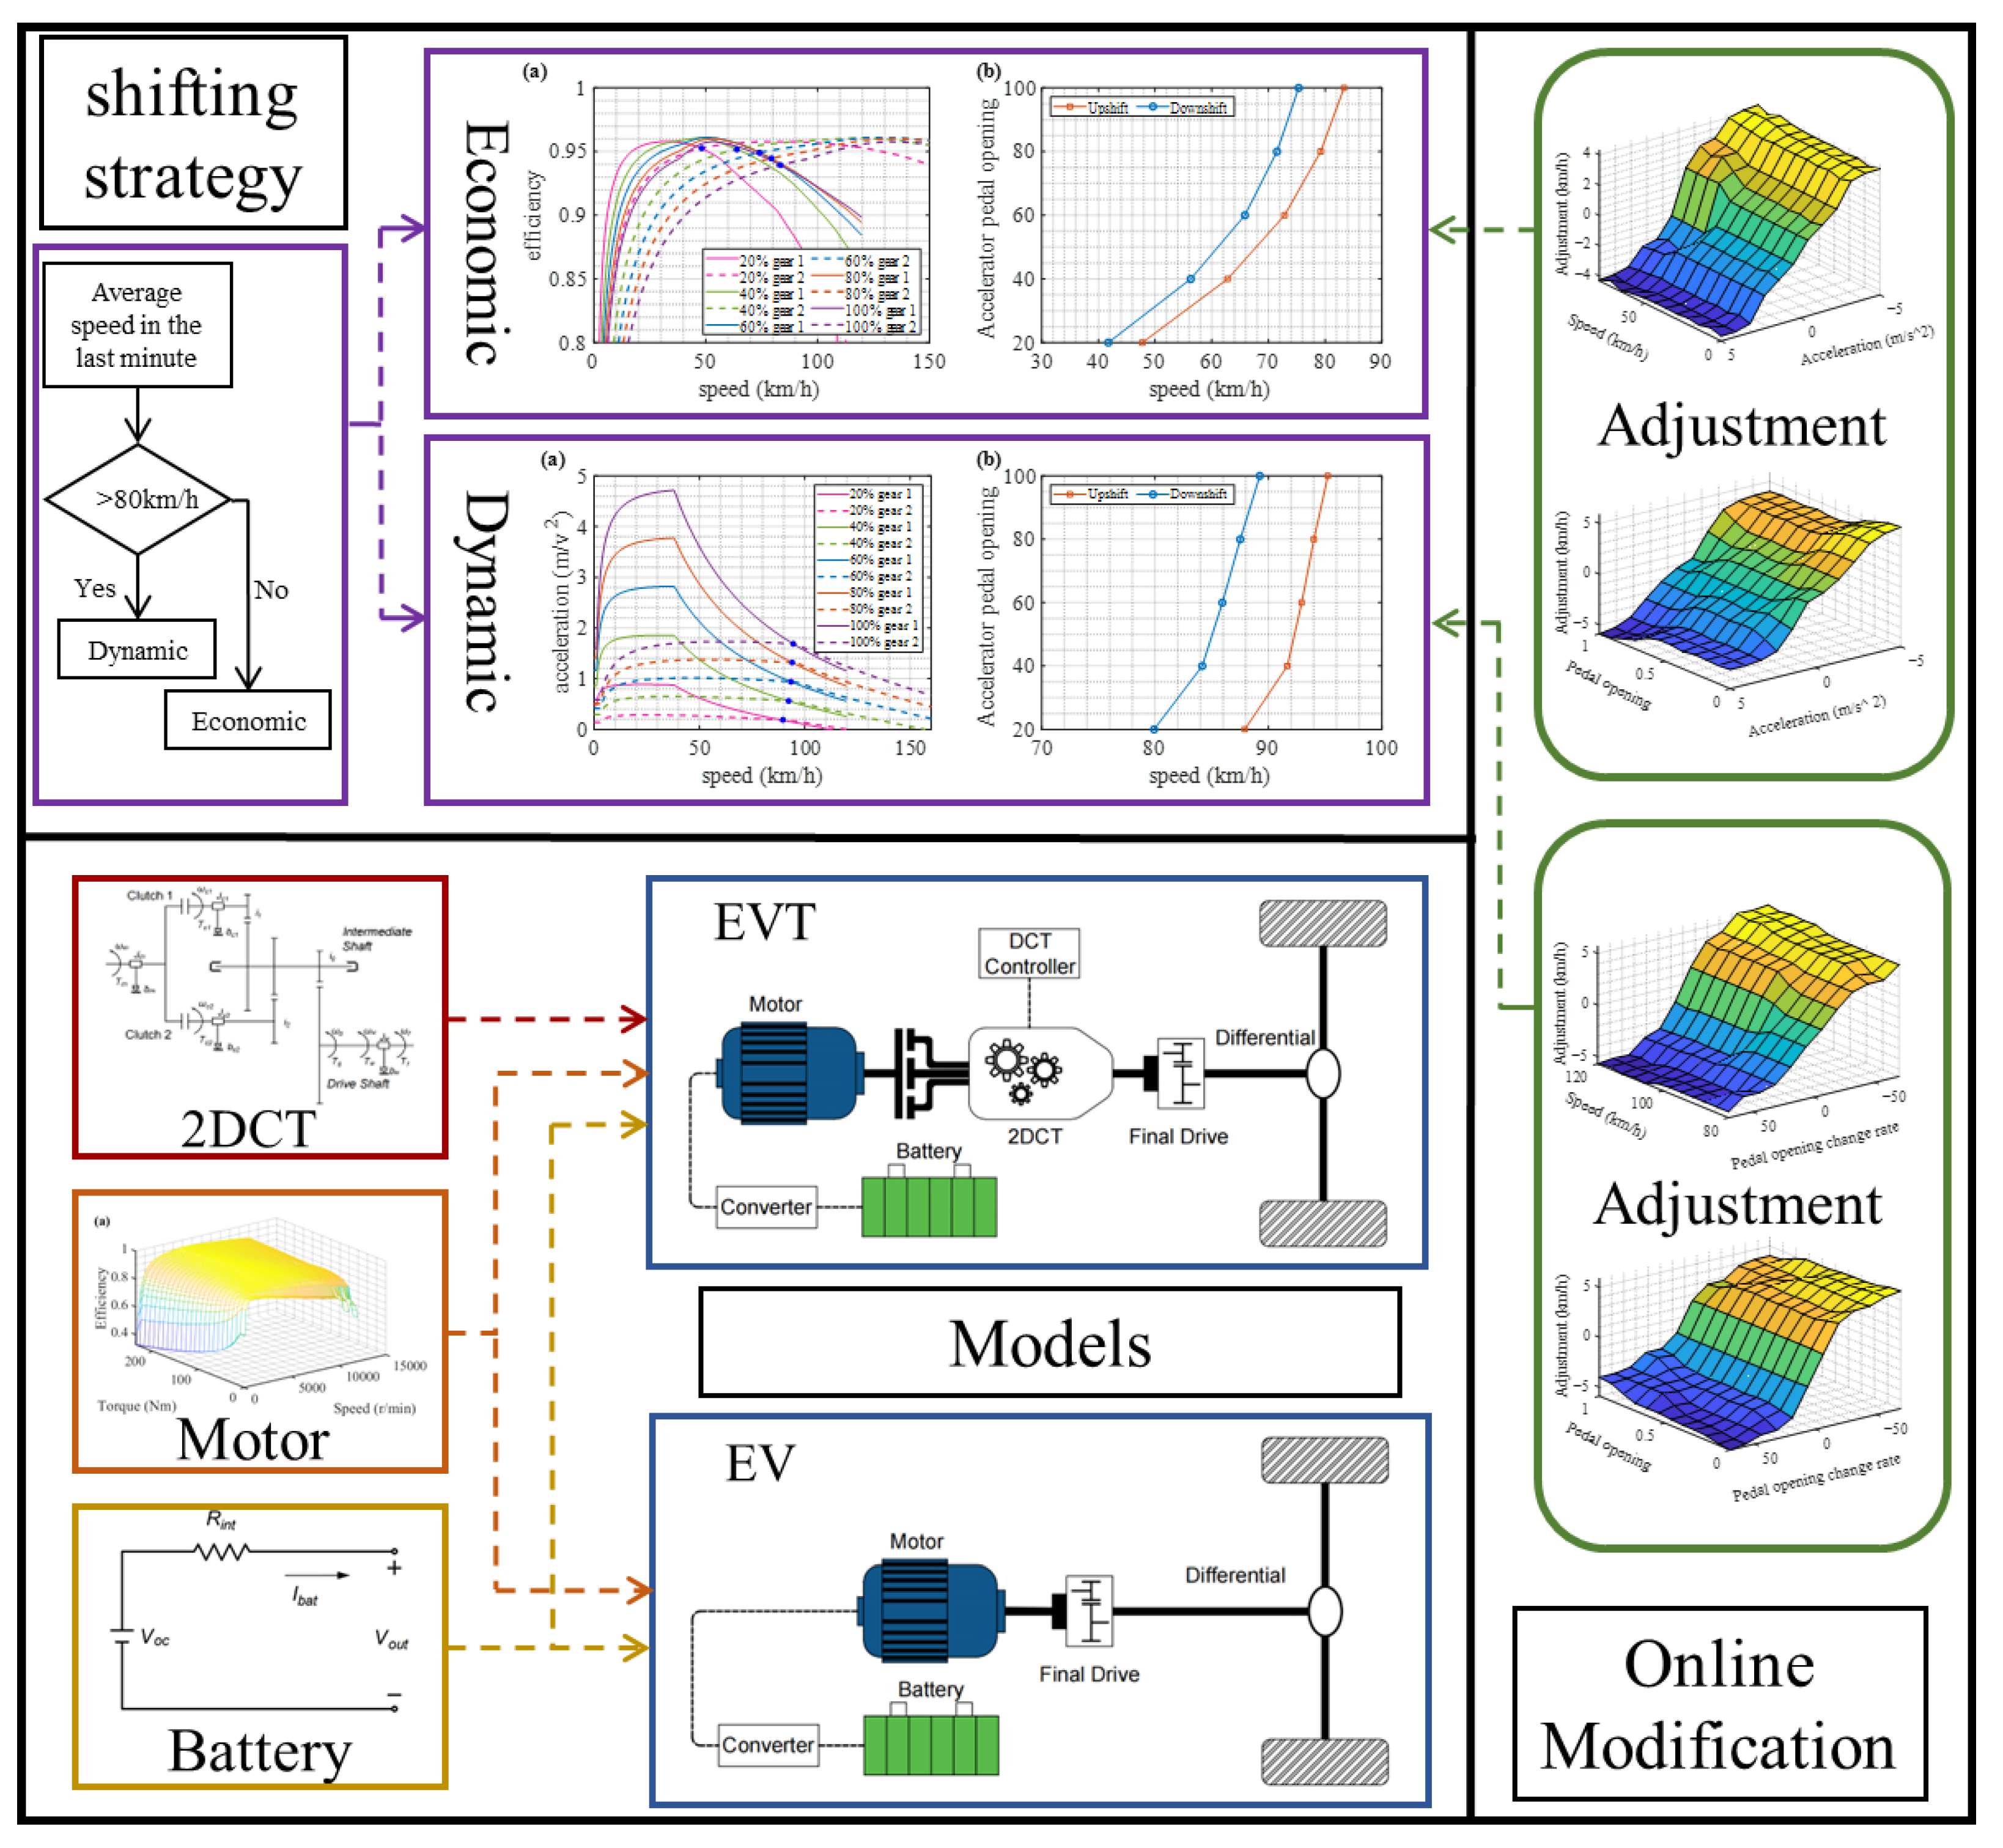
A partition gear-shifting strategy combining the economic and dynamic performances of pure electric vehicle two-speed transmission was designed, and fuzzy logic was utilized to adjust the partition shifting strategy online.
(2)
Via comparison, the influence of the two-speed transmission on the economic and dynamic performances of the pure electric vehicle was revealed.
(3)
A few contributions to the application of automatic transmission in the field of passenger pure electric vehicles are provided.
The remainder of this paper is structured as follows: the battery model, the motor model, the two-speed dual-clutch transmission model, and the longitudinal dynamics model of vehicles are discussed in Section 2. In Section 3, the design of a partitioned gear-shifting strategy is discussed, fuzzy logic is introduced to adjust the shifting strategy online, and the effect of the online adjustment is verified. In Section 4, the two configurations of pure electric vehicles are compared in terms of economic performance and dynamic performance, and the simulation results are analyzed. The research contents of this paper are summarized in Section 5.

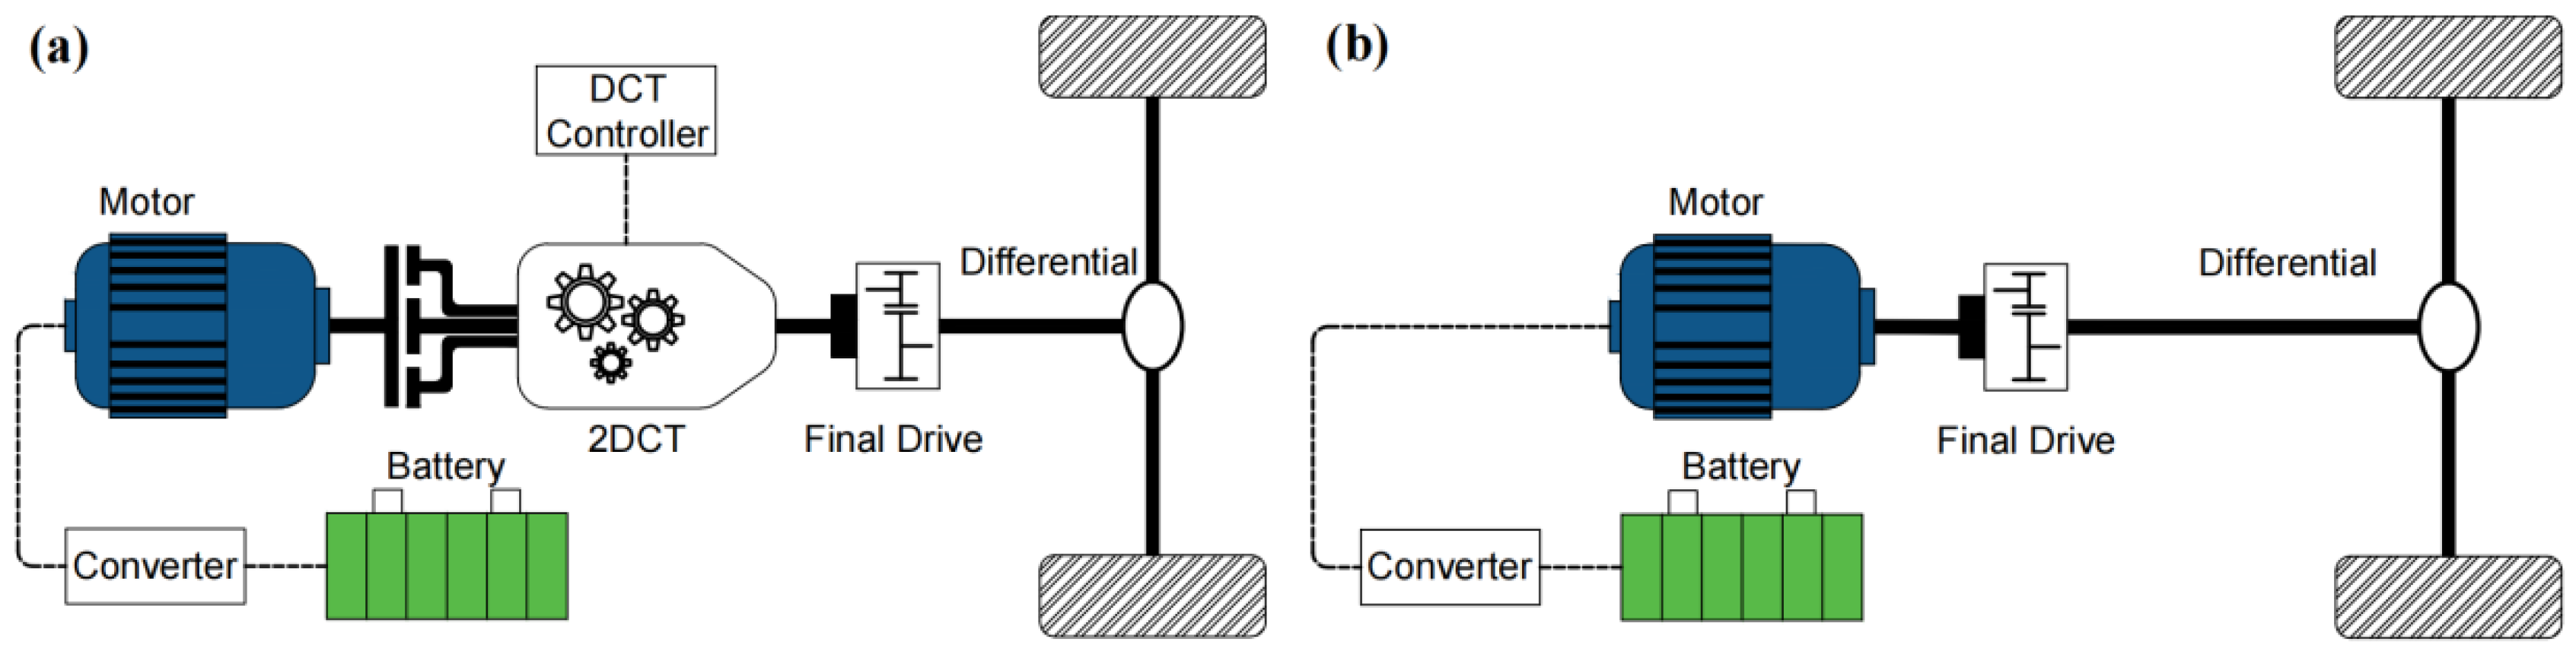
2. Powertrain Structure and System Modeling

In this paper, the research target was to investigate the effect of a two-speed transmission on the performance of pure electric vehicles. The configurations of a pure electric vehicle equipped with a two-speed dry dual-clutch transmission (EVT) and an electric vehicle without transmission (EV) are shown in Figure 1a,b, respectively. The components of the EVT included a motor, a converter, a battery pack, a two-speed dry dual-clutch automatic transmission (2DCT), a final drive, and a differential. Except for the transmission, the other components of the EV were the same as those of the EVT. The major parameters of the two electric vehicle structures are presented in Table 1, including the essential parameters of the primary components and the vehicle body. To investigate and compare the performance of two electric vehicles, the vehicles and the major components of the powertrain system needed to be modeled.

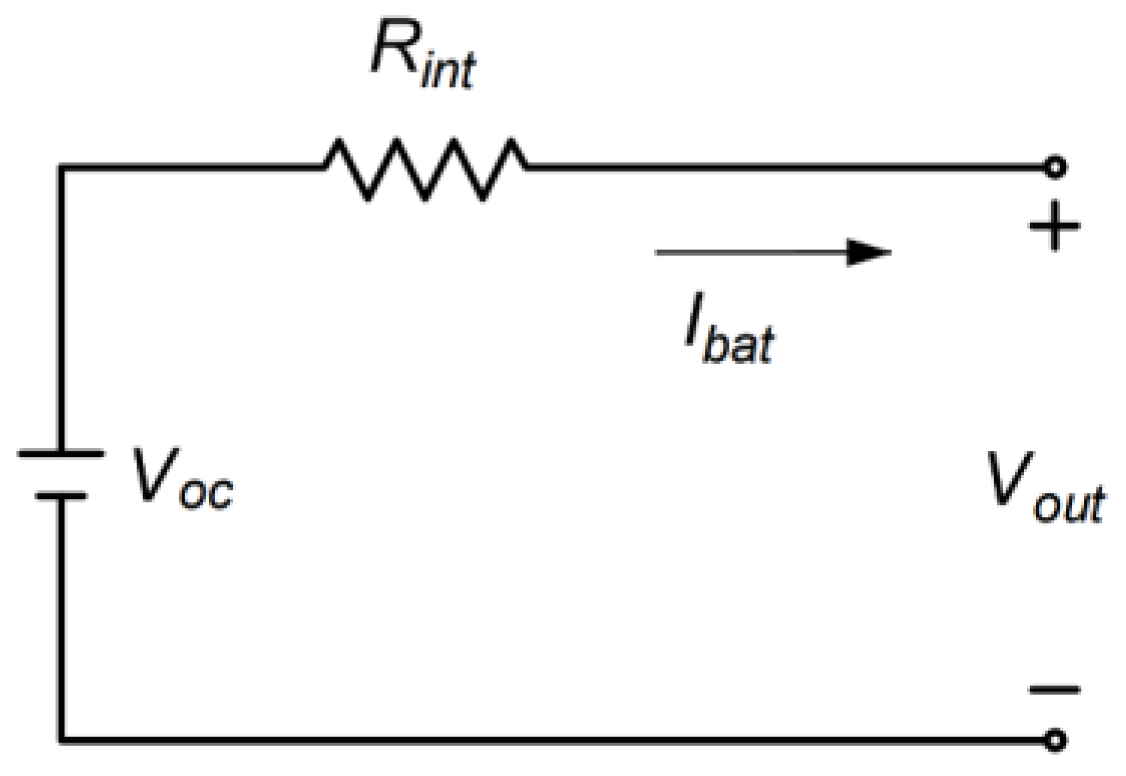
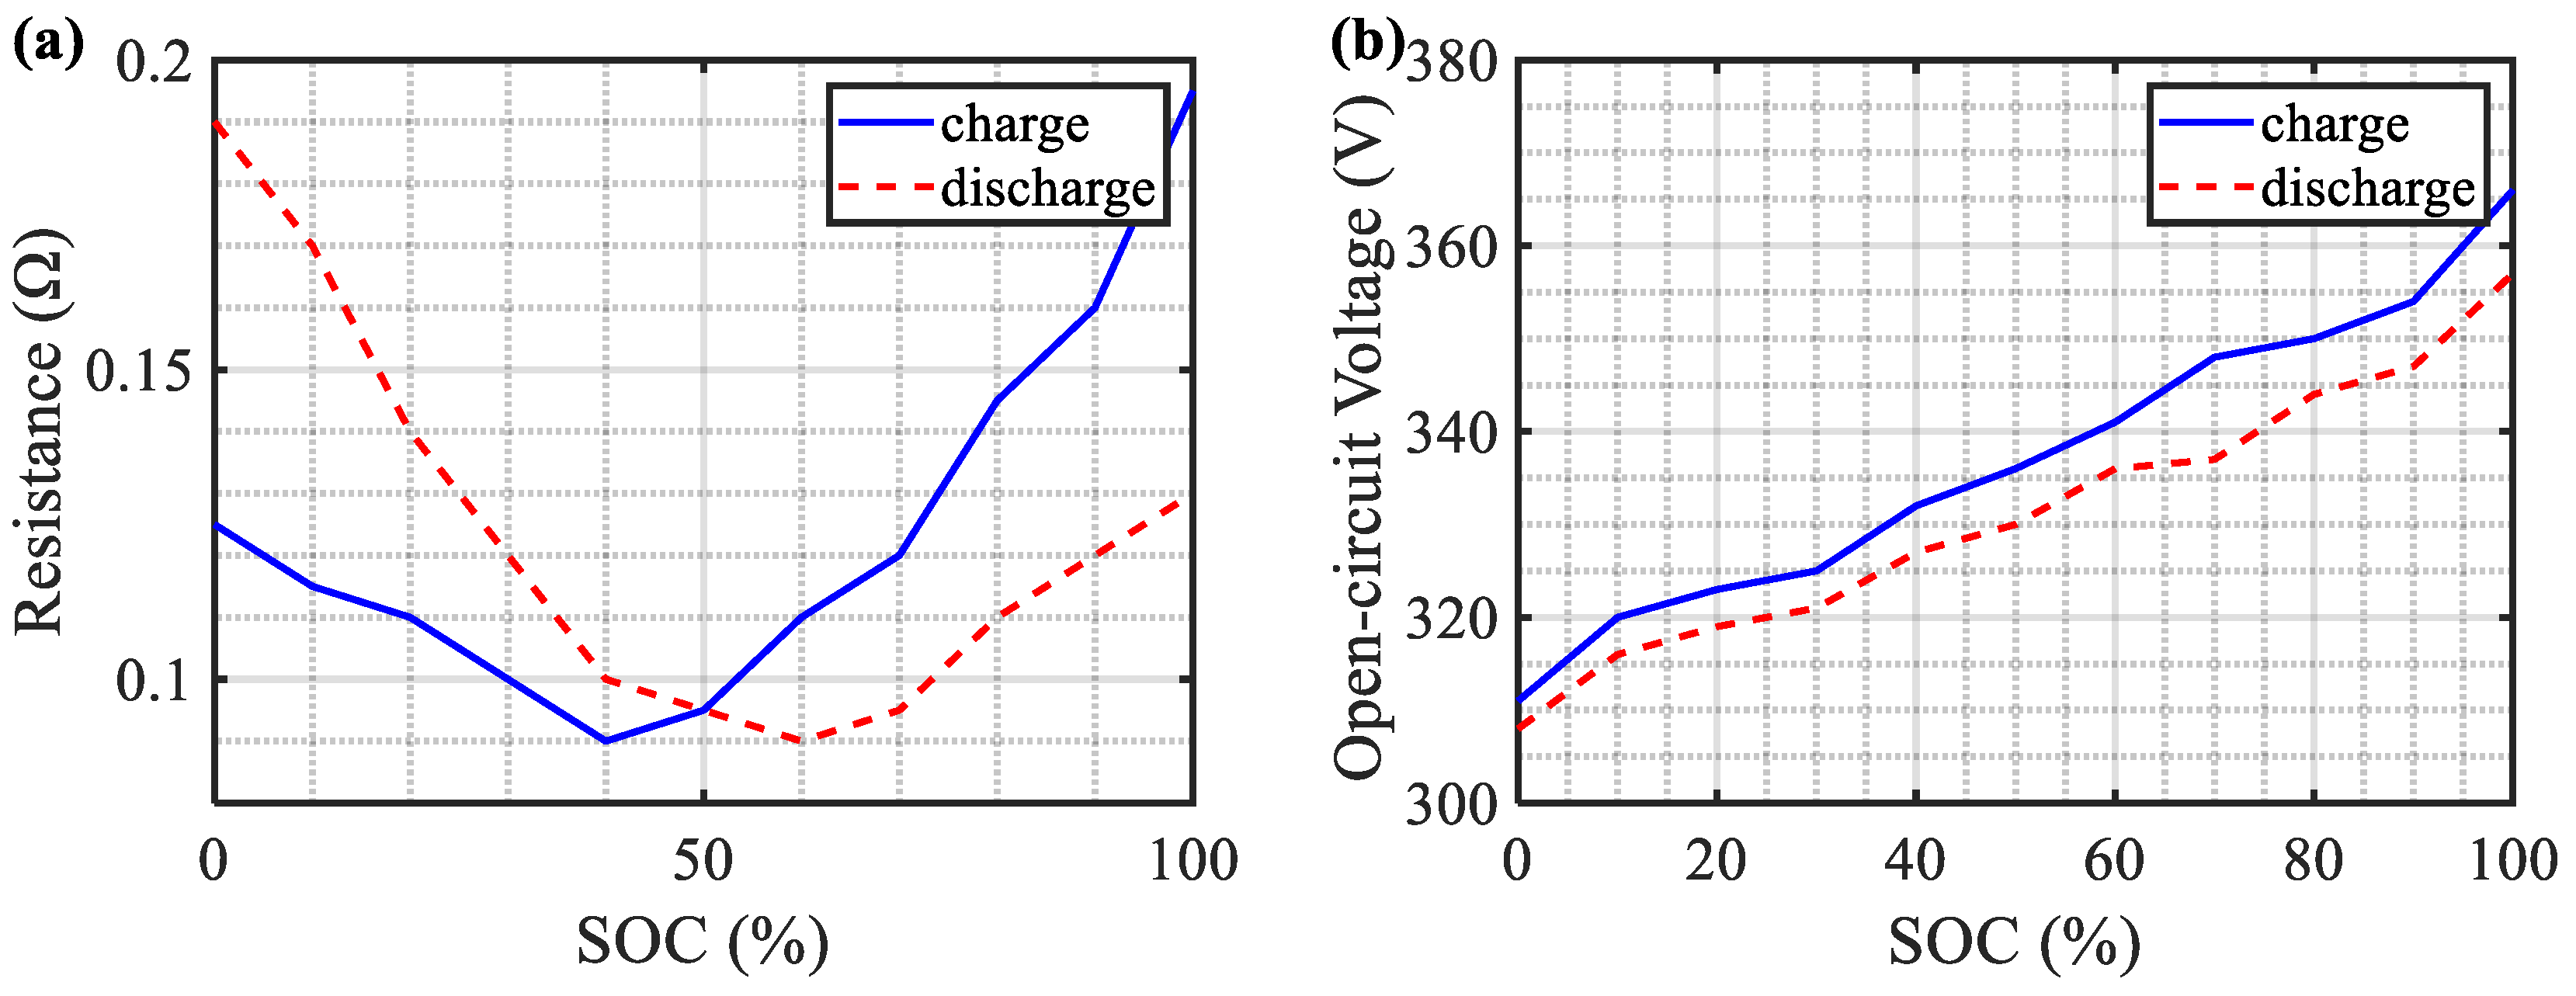
2.1. Battery Modeling

To facilitate the investigation, a simplified internal resistance model was adopted for the battery, ignoring the effect of temperature on the electrical performance of the battery [29]. The equivalent electric circuit for the battery is shown in Figure 2. The internal resistance characteristic curves and the open-circuit voltage curves are shown in Figure 3a,b, respectively. The output voltage Vout is [30]:
V o u t = V o c I b a t R i n t
where Voc refers to the open circuit voltage, Ibat denotes the battery’s output current, and Rint represents the internal resistance.
The battery’s open circuit voltage and equivalent internal resistance have a mapping relationship with the state of charge (SOC) of the battery when the battery is discharged or charged. The changes in battery currents under the two states can be expressed as:
I b a t = { P d V o u t P c V o u t
where Pd is the discharge power of the battery and Pc is the charge power of the battery. The table lookup relationship between Pd, Pc, and battery SOC is shown in Figure 3a,b, respectively. Furthermore, the following relationship can be obtained by substituting Equation (1) into Equation (2):
I b a t = V o u t ( V o u t 2 4 R i n t P ) 0.5 4 R i n t
where P represents the discharge and charging current of the battery. A simplified but reliable SOC estimation based on the ampere integration method was adopted.
S O C = S O C i n t 1 C 0 t 0 I b a t d t
where SOCint is the initial SOC and C0 is the battery capacity.

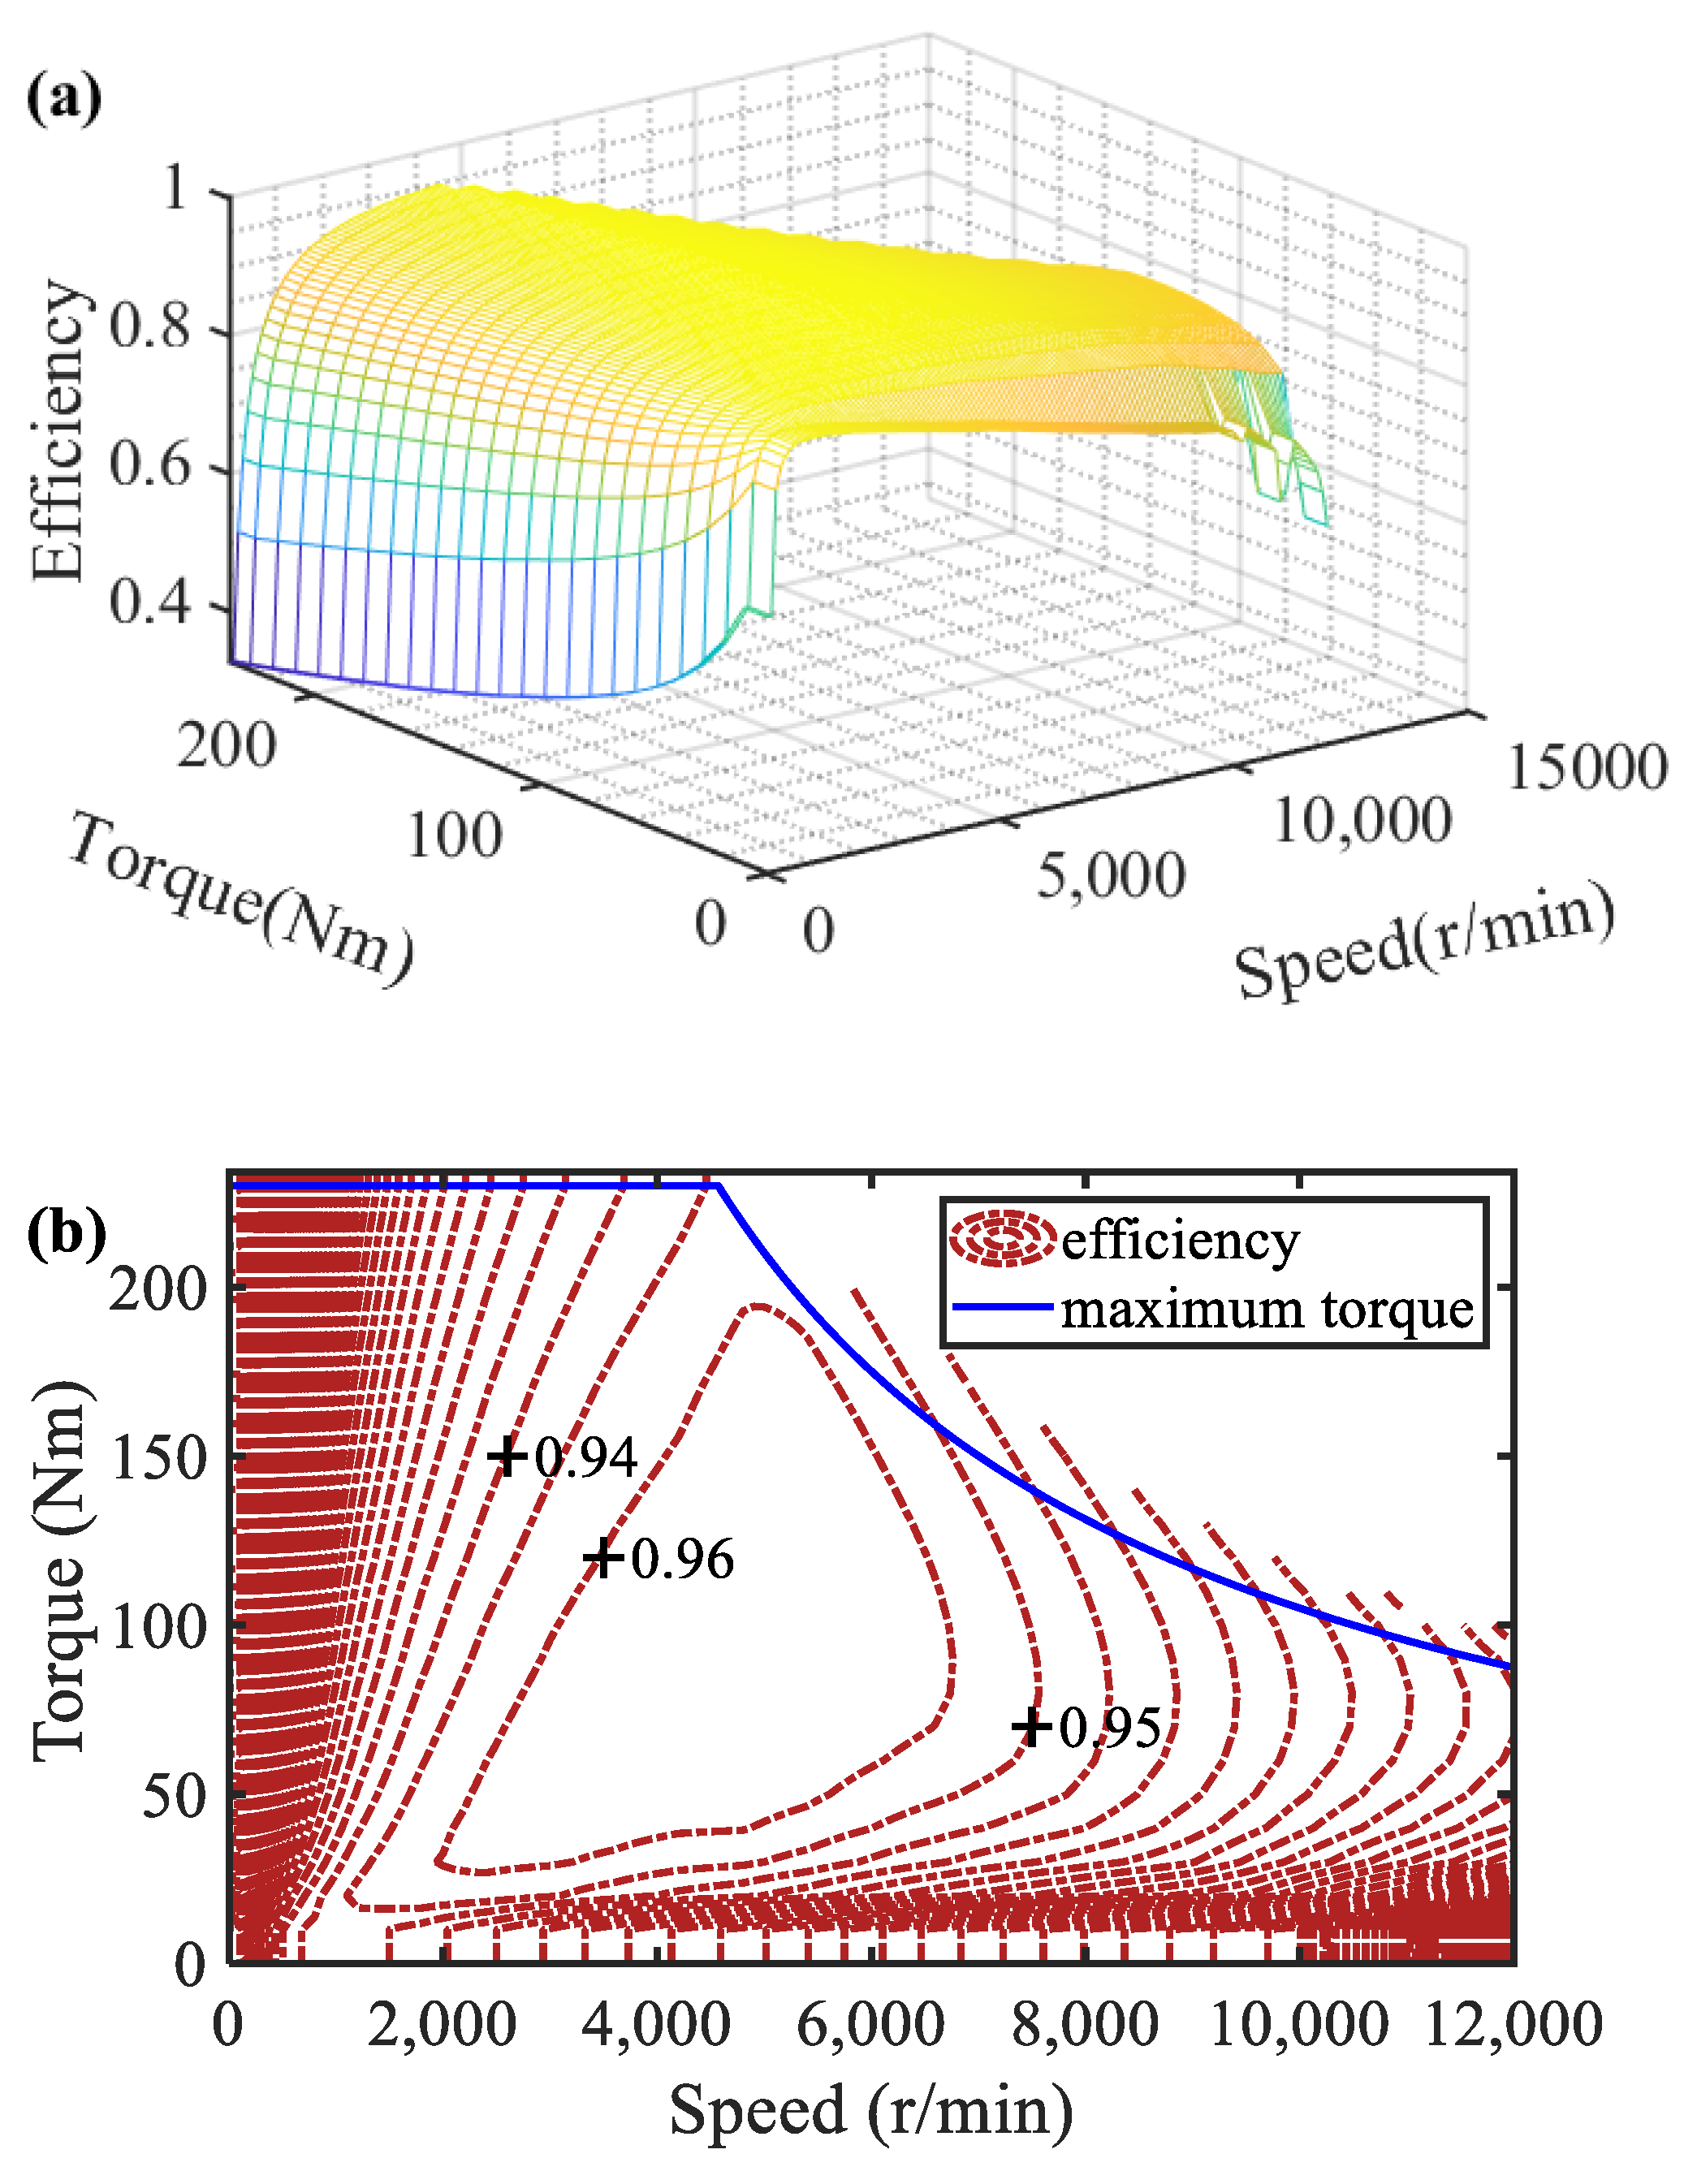
2.2. Electric Motor Model

The motor model was established according to its torque characteristics, and the efficiency map. Under the driving mode, the output torque was produced according to the demanding torque and the motor efficiency, then transmitted to the automatic transmission. When the motor was operating under the generator mode, a part of the braking energy was recovered and stored in the battery according to the motor’s efficiency [31]. The output power in driving mode Pm is:
P m = P r e q η m = T m n m
η m = f ( T m , n m )
The power in generator mode Pg is:
P g = P r e q η m = T m n m
where ηm denotes the electric motor efficiency, Tm and nm refer to the torque and speed of the motor, respectively, Preq refers to the required power, and Pm and Pg represent the output power of the motor, respectively. The motor selected a permanent magnet synchronous motor (PMSM), and the efficiency of the motor is shown in Figure 4.

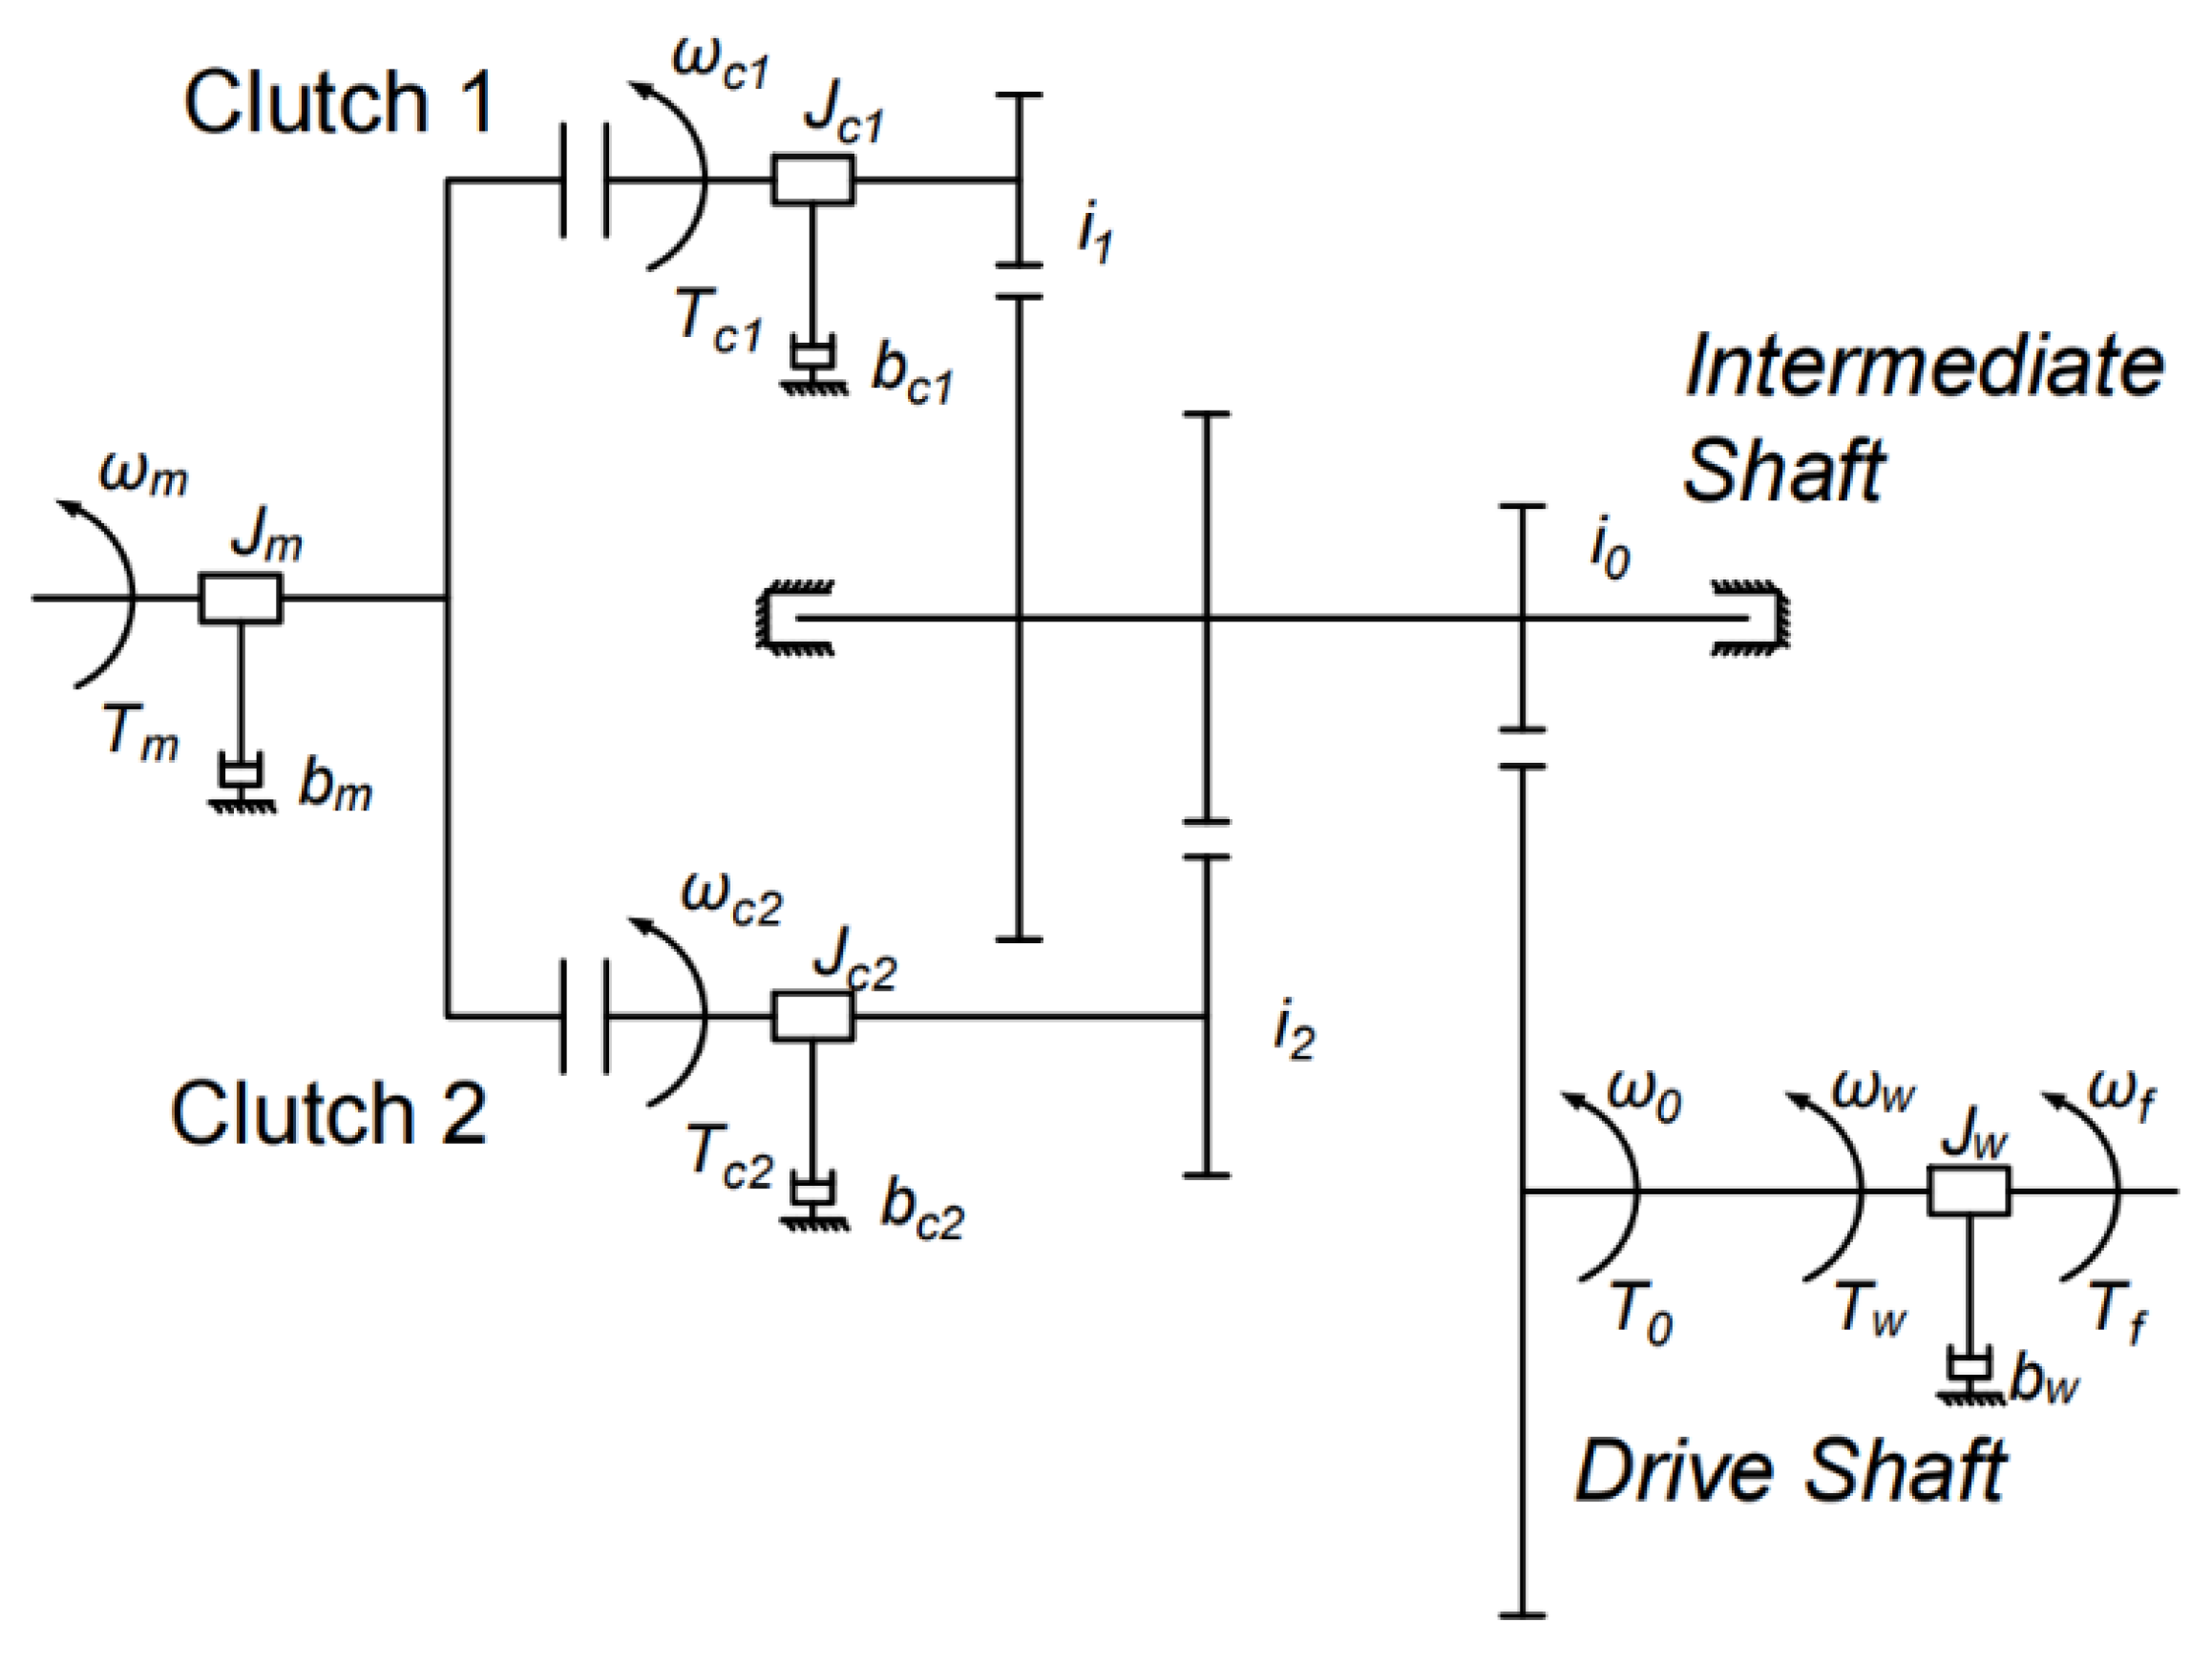
2.3. Transmission Model

In this study, the research object was a two-speed dry dual-clutch automatic transmission (2DCT). The transmission was completely self-developed. The first gear transmission ratio i1, the second gear transmission ratio i2, the key parameters of the vehicle are shown in Table 1, the Structure of 2DCT is shown in Figure 5.
The 2DCT includes two operating states under different driving situationsa a gear-switching state and a normal combination state. When the transmission is shifting gears, the two clutches work together. The dynamic balance equation from the motor output shaft to the clutch active friction plate is [32]:
J m ω m = T m b m ω m T c 1 T c 2
where Jm denotes the rotational inertia of the motor output shaft and clutch drive shaft; ωm means the angular speed of the output shaft of the motor; bm is the rotational damping coefficient of the motor output shaft; and Tc1 and Tc2 represent the torque transferred by clutch C1 and C2, respectively.
{ J c 1 ω c 1 = T c 1 b c 1 ω c 1 T 1 J c 2 ω c 2 = T c 2 b c 2 ω c 2 T 2
where Jc1, Jc2 represent the rotational inertia of the driven part of C1 and C2, respectively; ωc1, ωc2 are the angular velocities of C1 and C2, respectively; bc1, bc2 are the rotational damping coefficients of driven shafts of C1 and C2, respectively; and T1, T2 are the output torque of the clutch driven shafts, respectively. The clutch output torque is:
T c n = 2 3 s g n ( Δ ω ) μ N R F n
s g n ( Δ ω ) = { 1 ω m ω c n > 0 0 ω m ω c n = 0 1 ω m ω c n < 0
where n takes 1, 2; R is the clutch equivalence radius; N is the number of clutch working surfaces; Fn is the pressure applied to the clutch; and μ is the friction coefficient of the clutch friction plate. The dynamic balance equation of the clutch output is:
T 0 = i 0 ( i 1 T 1 + i 2 T 2 )
where T0 indicates the output torque of transmission.
To drive the vehicle, the output torque of the transmission is delivered to the tires through the drive shaft; the dynamic balance equation at the drive shaft is:
J w ω w = T w b w ω w T f
where Jw is the rotational inertia of the drive shaft section, ωw is the rotational damping coefficient of the drive shaft section, and Tf is the total resistance torque applied to the wheel.

2.4. Longitudinal Dynamics Model of Vehicle

The longitudinal dynamics model of vehicles can be described as [33]:
T r q i n i 0 η t r = m g f c o s α + m g s i n α + C d A 21.15 v 2 + δ m d v d t
where Trq is the driving torque demand, ηt is the efficiency of transmission, m is the mass of the vehicle, g is the gravity acceleration, f is the coefficient of rolling resistance, α is the angle of the road slope, A is the frontal area of the vehicle, v is the velocity of the vehicle, Cd is the drag coefficient, and δ is the coefficient of rotational mass conversion.
δ = 1 + J w m r 2 + J f i n 2 i 0 2 η t m r 2
where Jw is the rotational inertia of the wheel and Jf is the moment of inertia of the flywheel.

3. Gear-Shifting Strategy

The rule-based gear-shifting strategy is divided into an economic strategy and a dynamic strategy, etc. A rule-based shifting strategy usually considers a certain type of performance only; although it is unable to cover all targets, it can maximize one single performance with more reliability. The economic shifting strategy selects gears that enable the motor to work more efficiently. The dynamic shifting strategy selects gears with higher acceleration to ensure a greater acceleration. In this paper, a partitioned shifting strategy was adopted, combining the economic strategy with the dynamic strategy. While a vehicle is driving at low and medium speeds (below 80 km/h), in the case of urban roads and rural roads, the economic shifting strategy is adopted to ensure that the vehicle is more energy efficient. During a high-speed range (speeds over 80 km/h), for example on highways and expressways, the dynamic shifting strategy is applied to make sure the vehicle has strong power. The VCU will select the shifting strategy according to the average driving speed at the last minute. When the average speed is less than 80 km/h, the economic shifting strategy will be selected; otherwise, the dynamic shifting strategy will be selected. In addition, drivers can change the strategy manually, according to their actual situations and requirements.

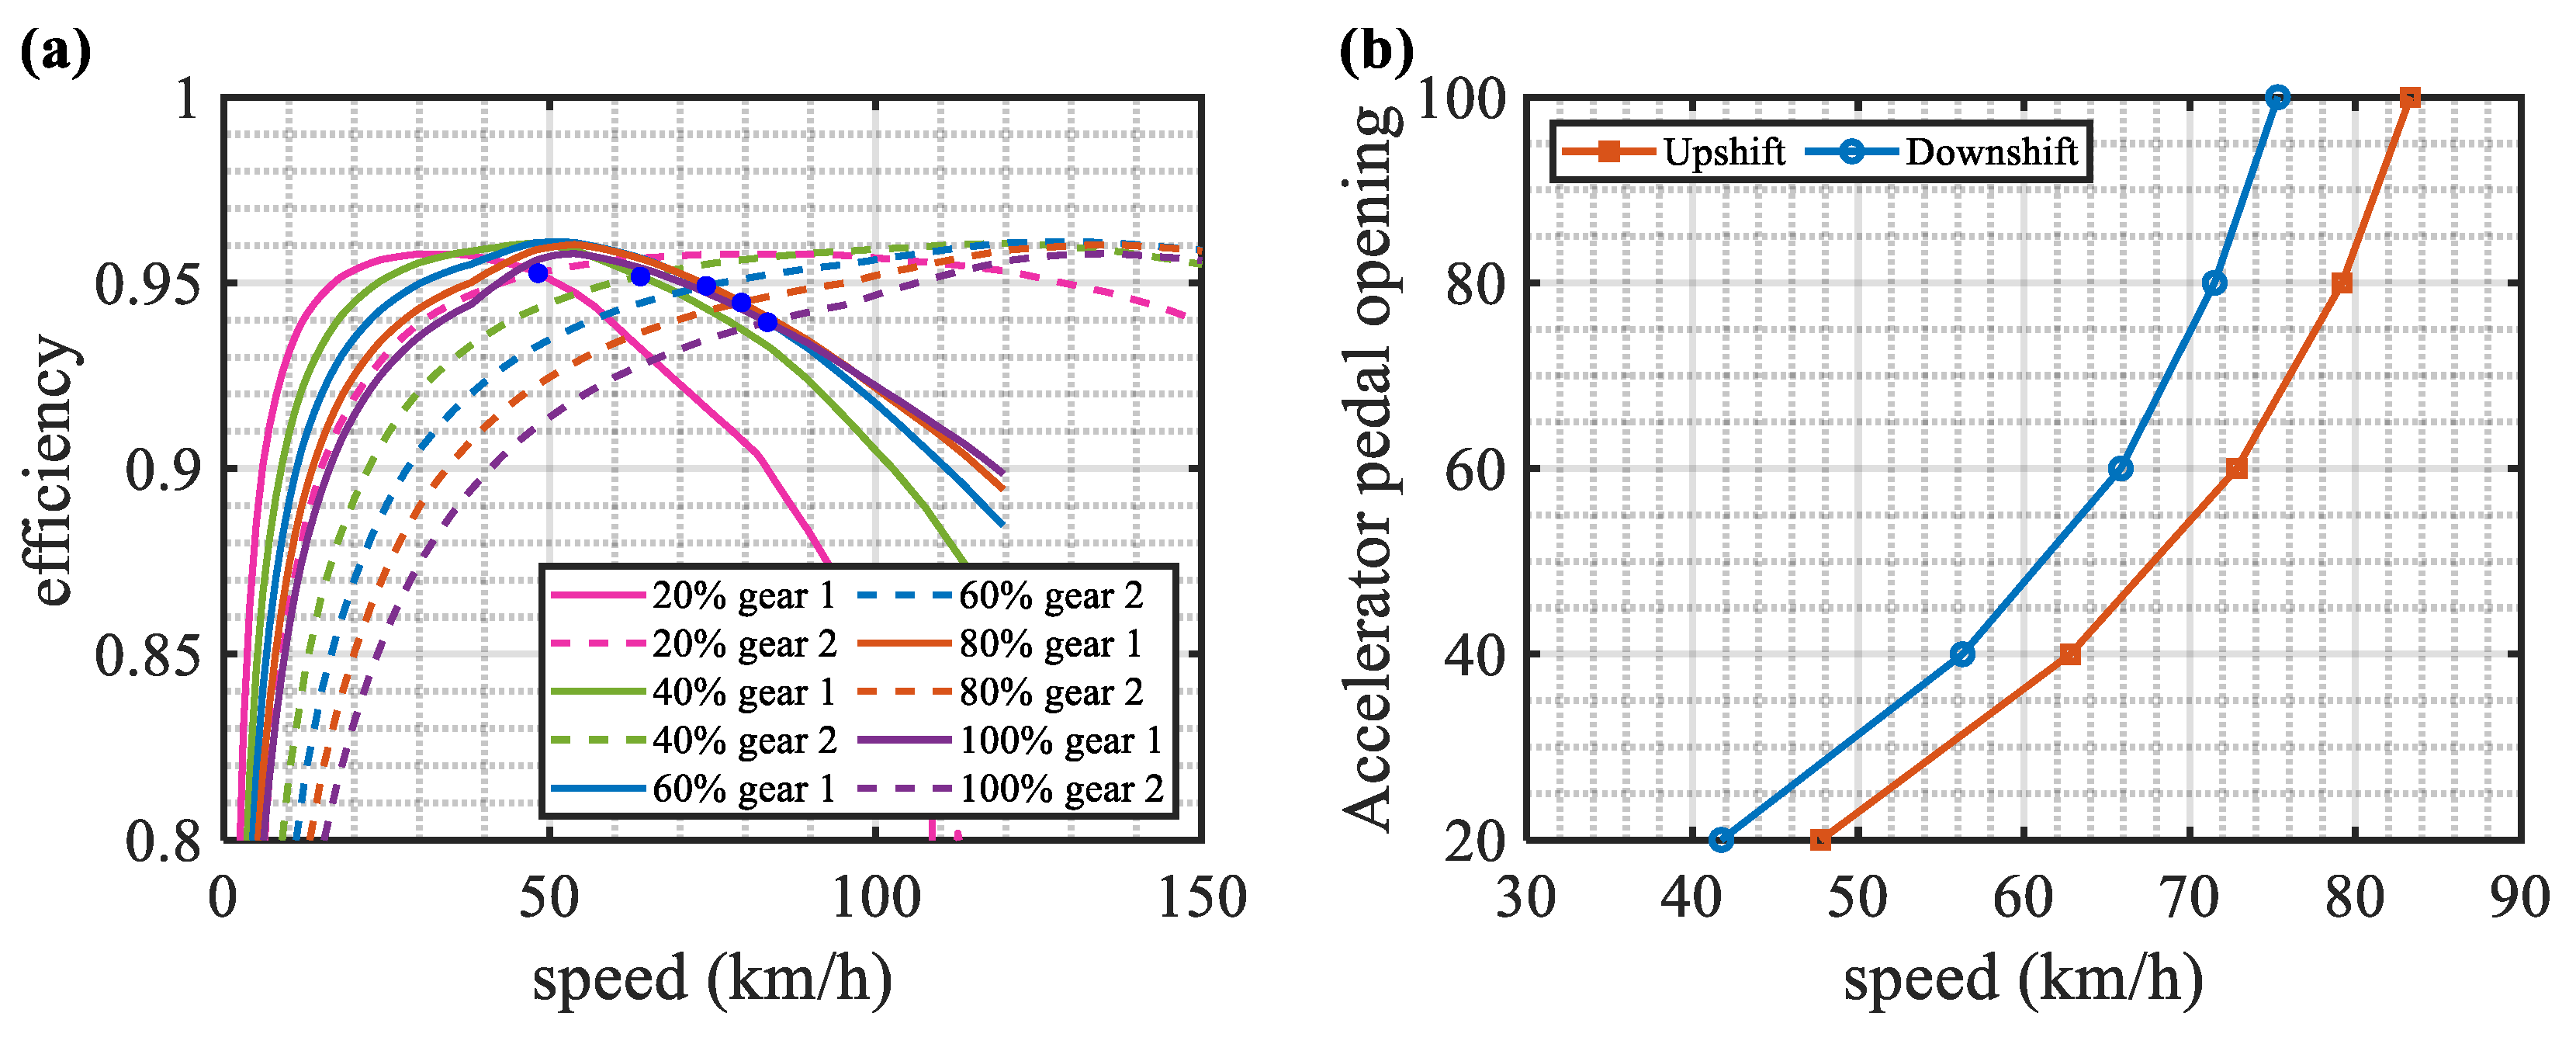
3.1. Economic Gear-Shifting Strategy

The principle of the economic shifting strategy is to select the intersection of motor efficiency curves at different gears as the optimal shifting point under the certain accelerator pedal opening degree. The curves of motor efficiency at different accelerator pedal openings can be obtained according to vehicle speed.
η m = f ( T m , i n i 0 v 0.377 r )
In this study, 20%, 40%, 60%, 80%, and 100% accelerator pedal openings were selected to design the efficiency curves. The motor efficiency curves at different accelerator pedal openings and the economic shifting curves are shown in Figure 6a,b, respectively.
The economic shifting curve obtained by the above method is the upshift curve. The downshift curve is usually chosen to be another curve when the shifting speed is lower than the upshift curve. In this paper, a divergent shift rule was used to determine the economic downshift curve. This meant that the magnitude of the downshift speed delay increased with the increase of the accelerator pedal opening.
With the pedal opening decrease, the speed delay of downshifting becomes smaller, which leads to shifting easily into higher gears, thereby ensuring less energy consumption. When the pedal opening increases, the speed delay of downshifting becomes larger, which is beneficial in reducing invalid shifts.

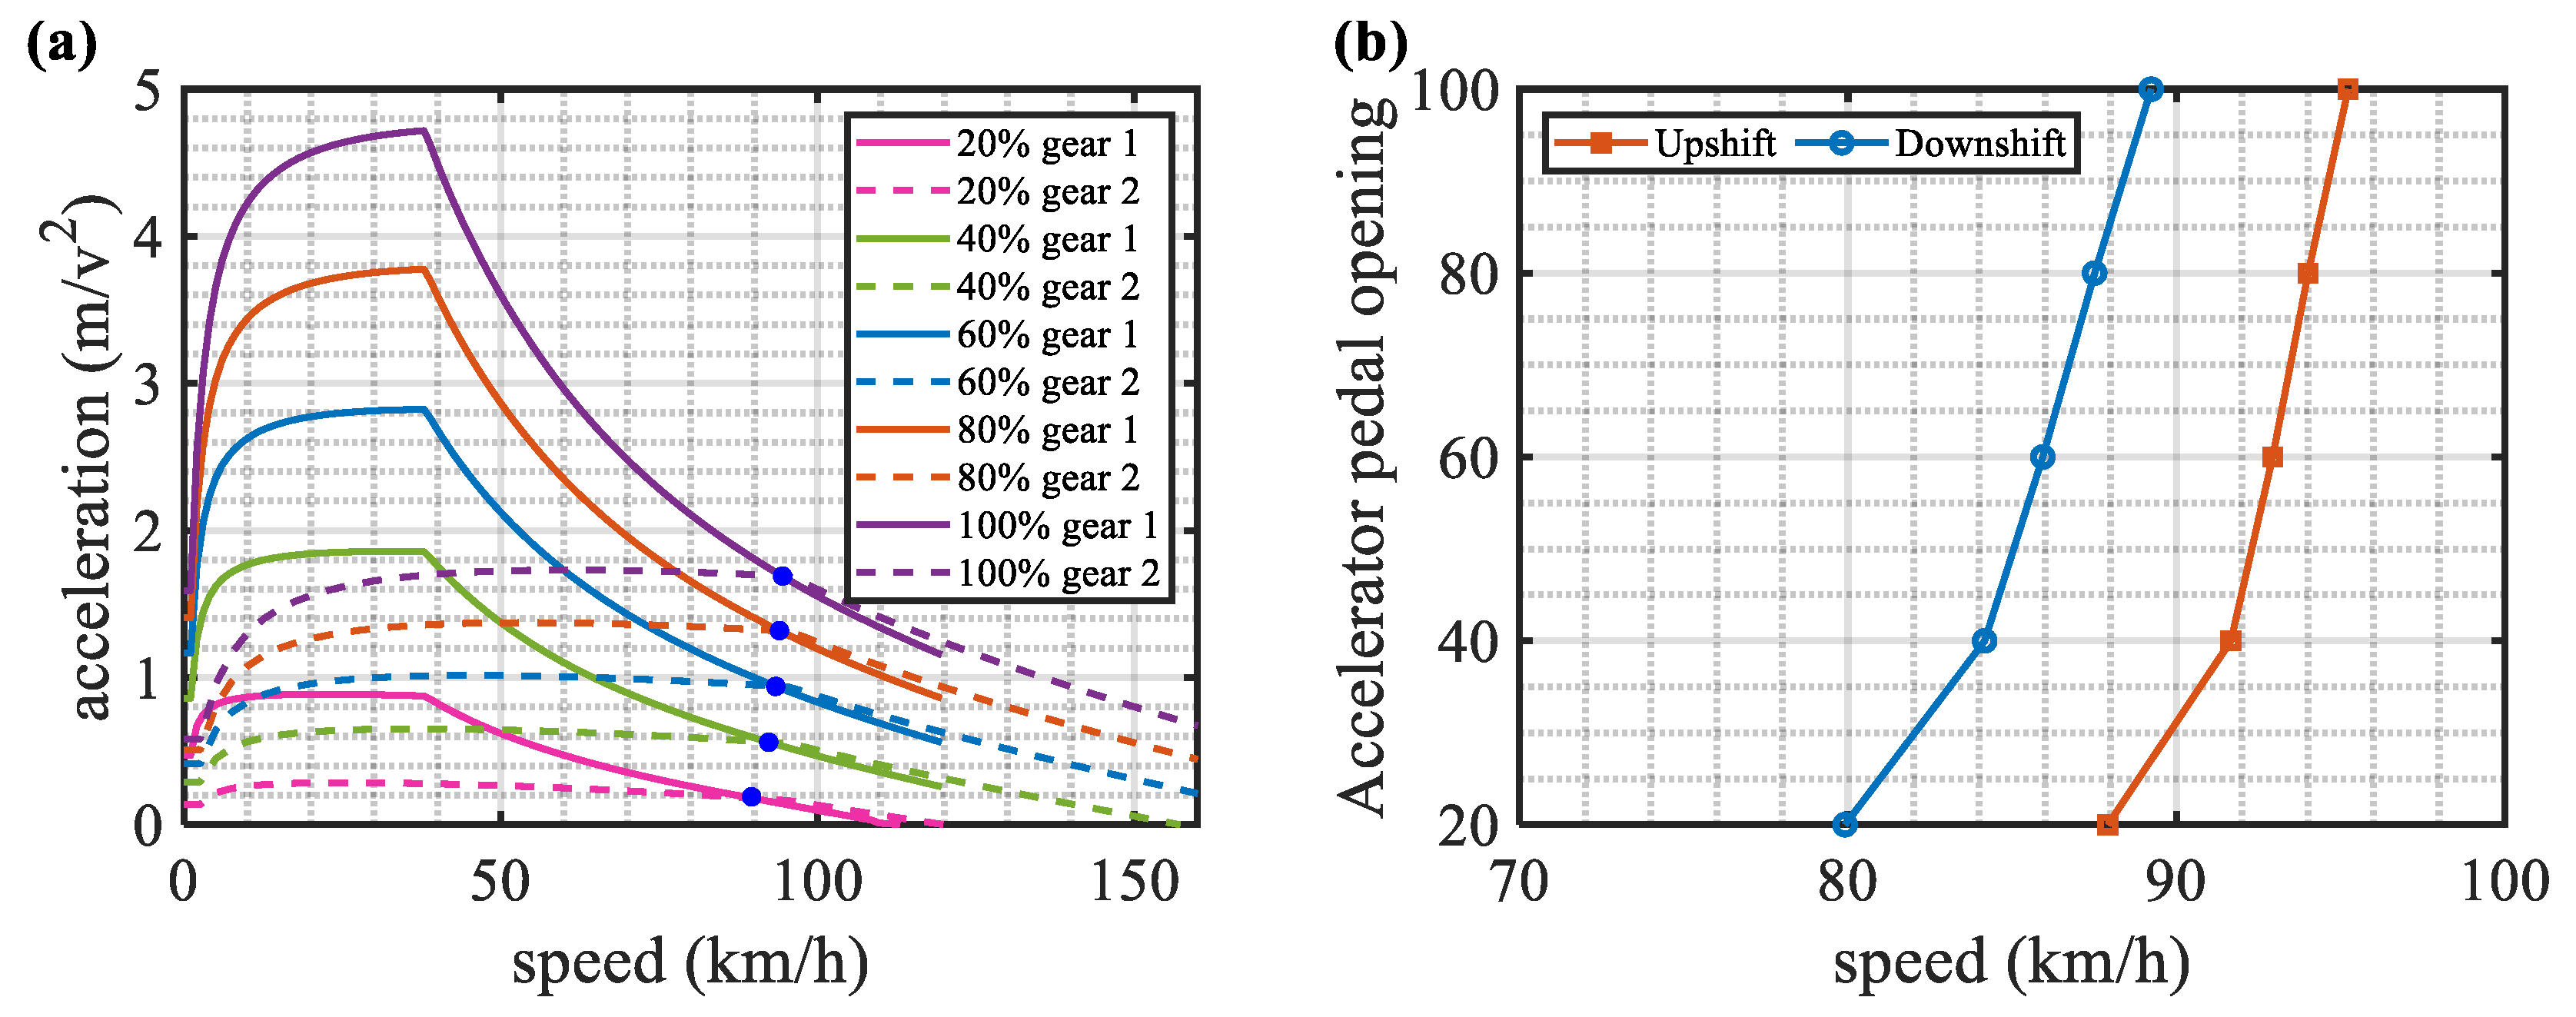
3.2. Dynamic Gear-Shifting Strategy

The principle of the dynamic shifting strategy is to select the intersection of the vehicle acceleration curves at different gears as the optimal shifting point under the certain accelerator pedal opening degree. The curves of vehicle acceleration at different accelerator pedal openings can be obtained according to vehicle speed and Equation (17) [34].
a = 1 δ m ( T r q i n i 0 η t r m g f c o s α m g s i n α C d A v 2 21.15 )
Accelerator pedal openings of 20%, 40%, 60%, 80%, and 100% were selected to design the acceleration shifting curves. The vehicle acceleration curves at different accelerator pedal openings and the dynamic shifting curves are shown in Figure 7a,b, respectively.
The dynamic shifting curve obtained by the above method is the upshift curve. The downshift curve was also chosen to be another curve when the shifting speed was lower than the upshift curve. In this paper, a convergent shift rule was used to determine the dynamic downshift curve. This meant that the magnitude of the downshift speed delay decreased with the increase in the accelerator pedal opening.
With the pedal opening increase, the speed delay of downshifting becomes smaller, which leads to shifting easily into lower gears, thus ensuring better dynamic performance. When the pedal opening decreases, the speed delay becomes larger, which is favorable in reducing invalid shifts.

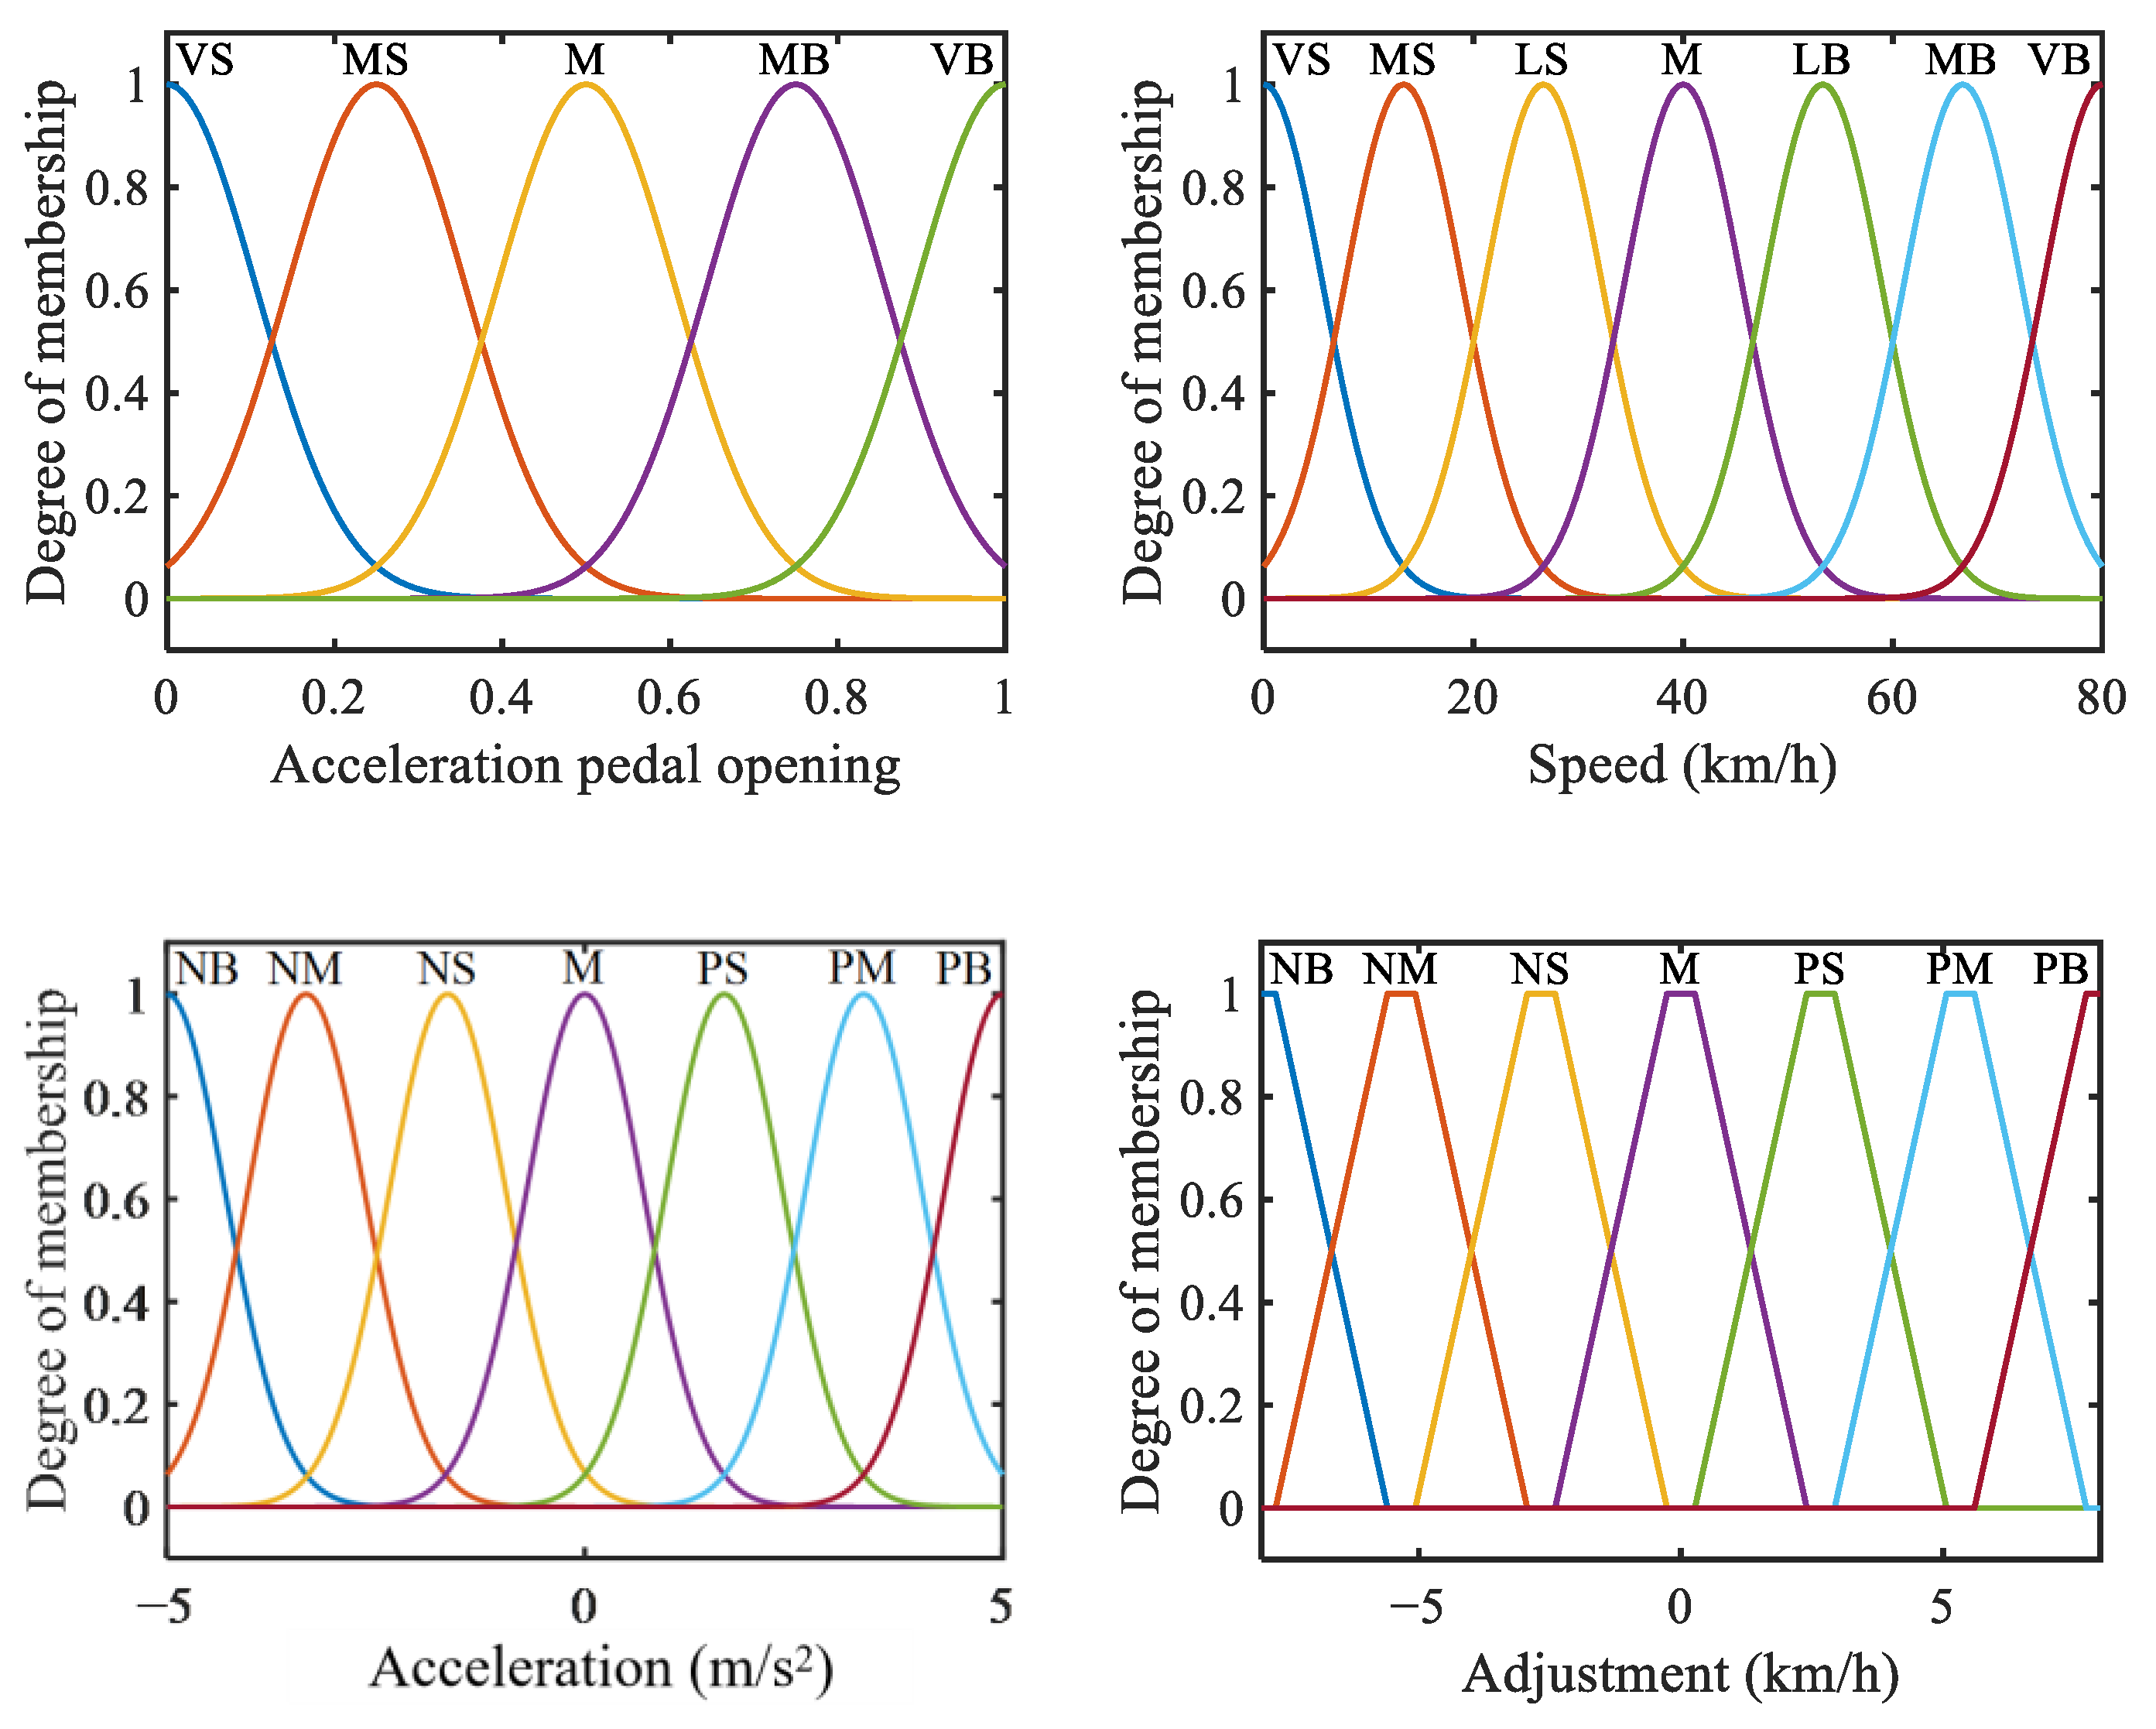
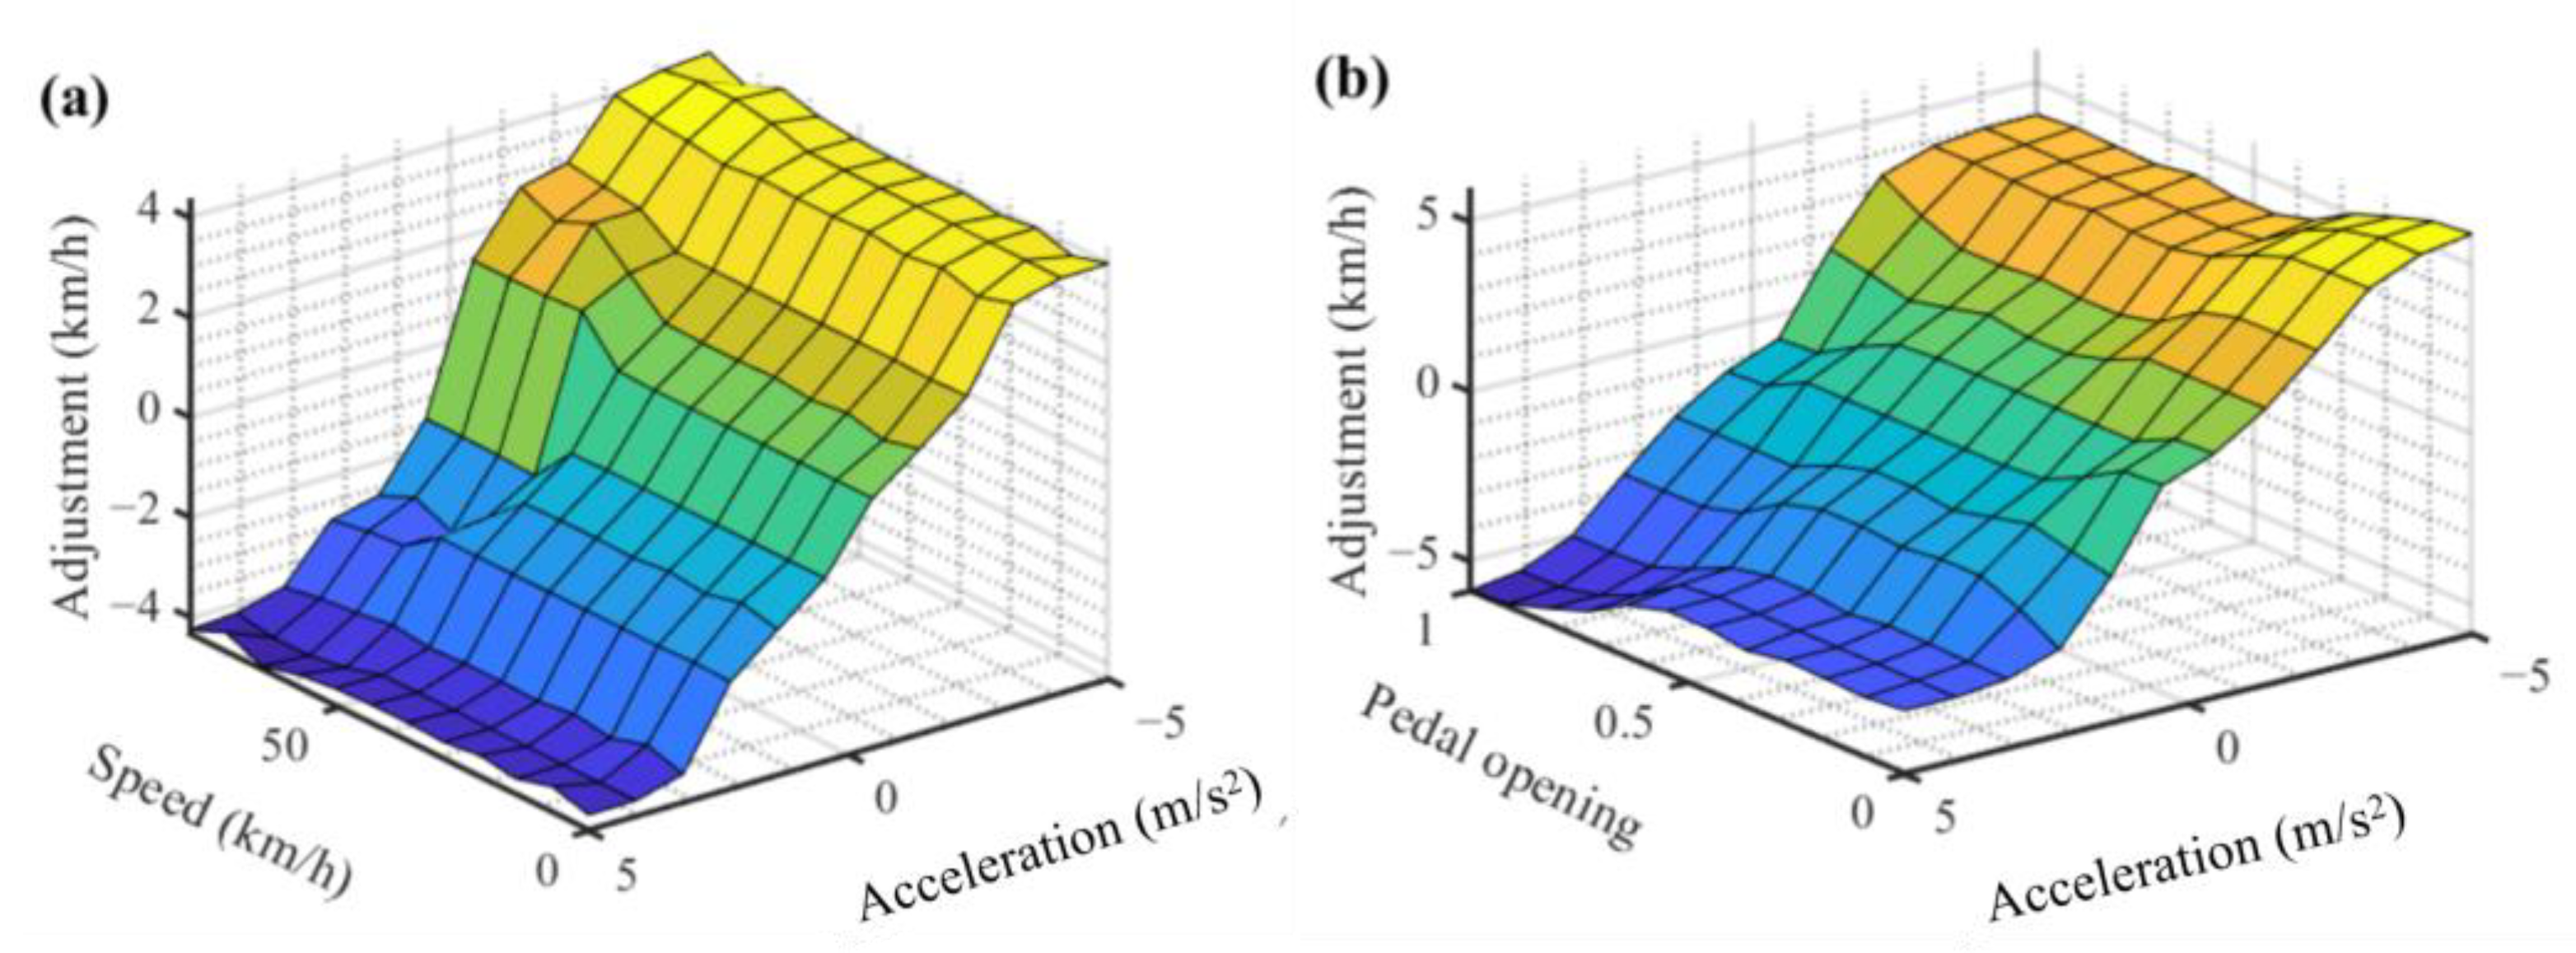
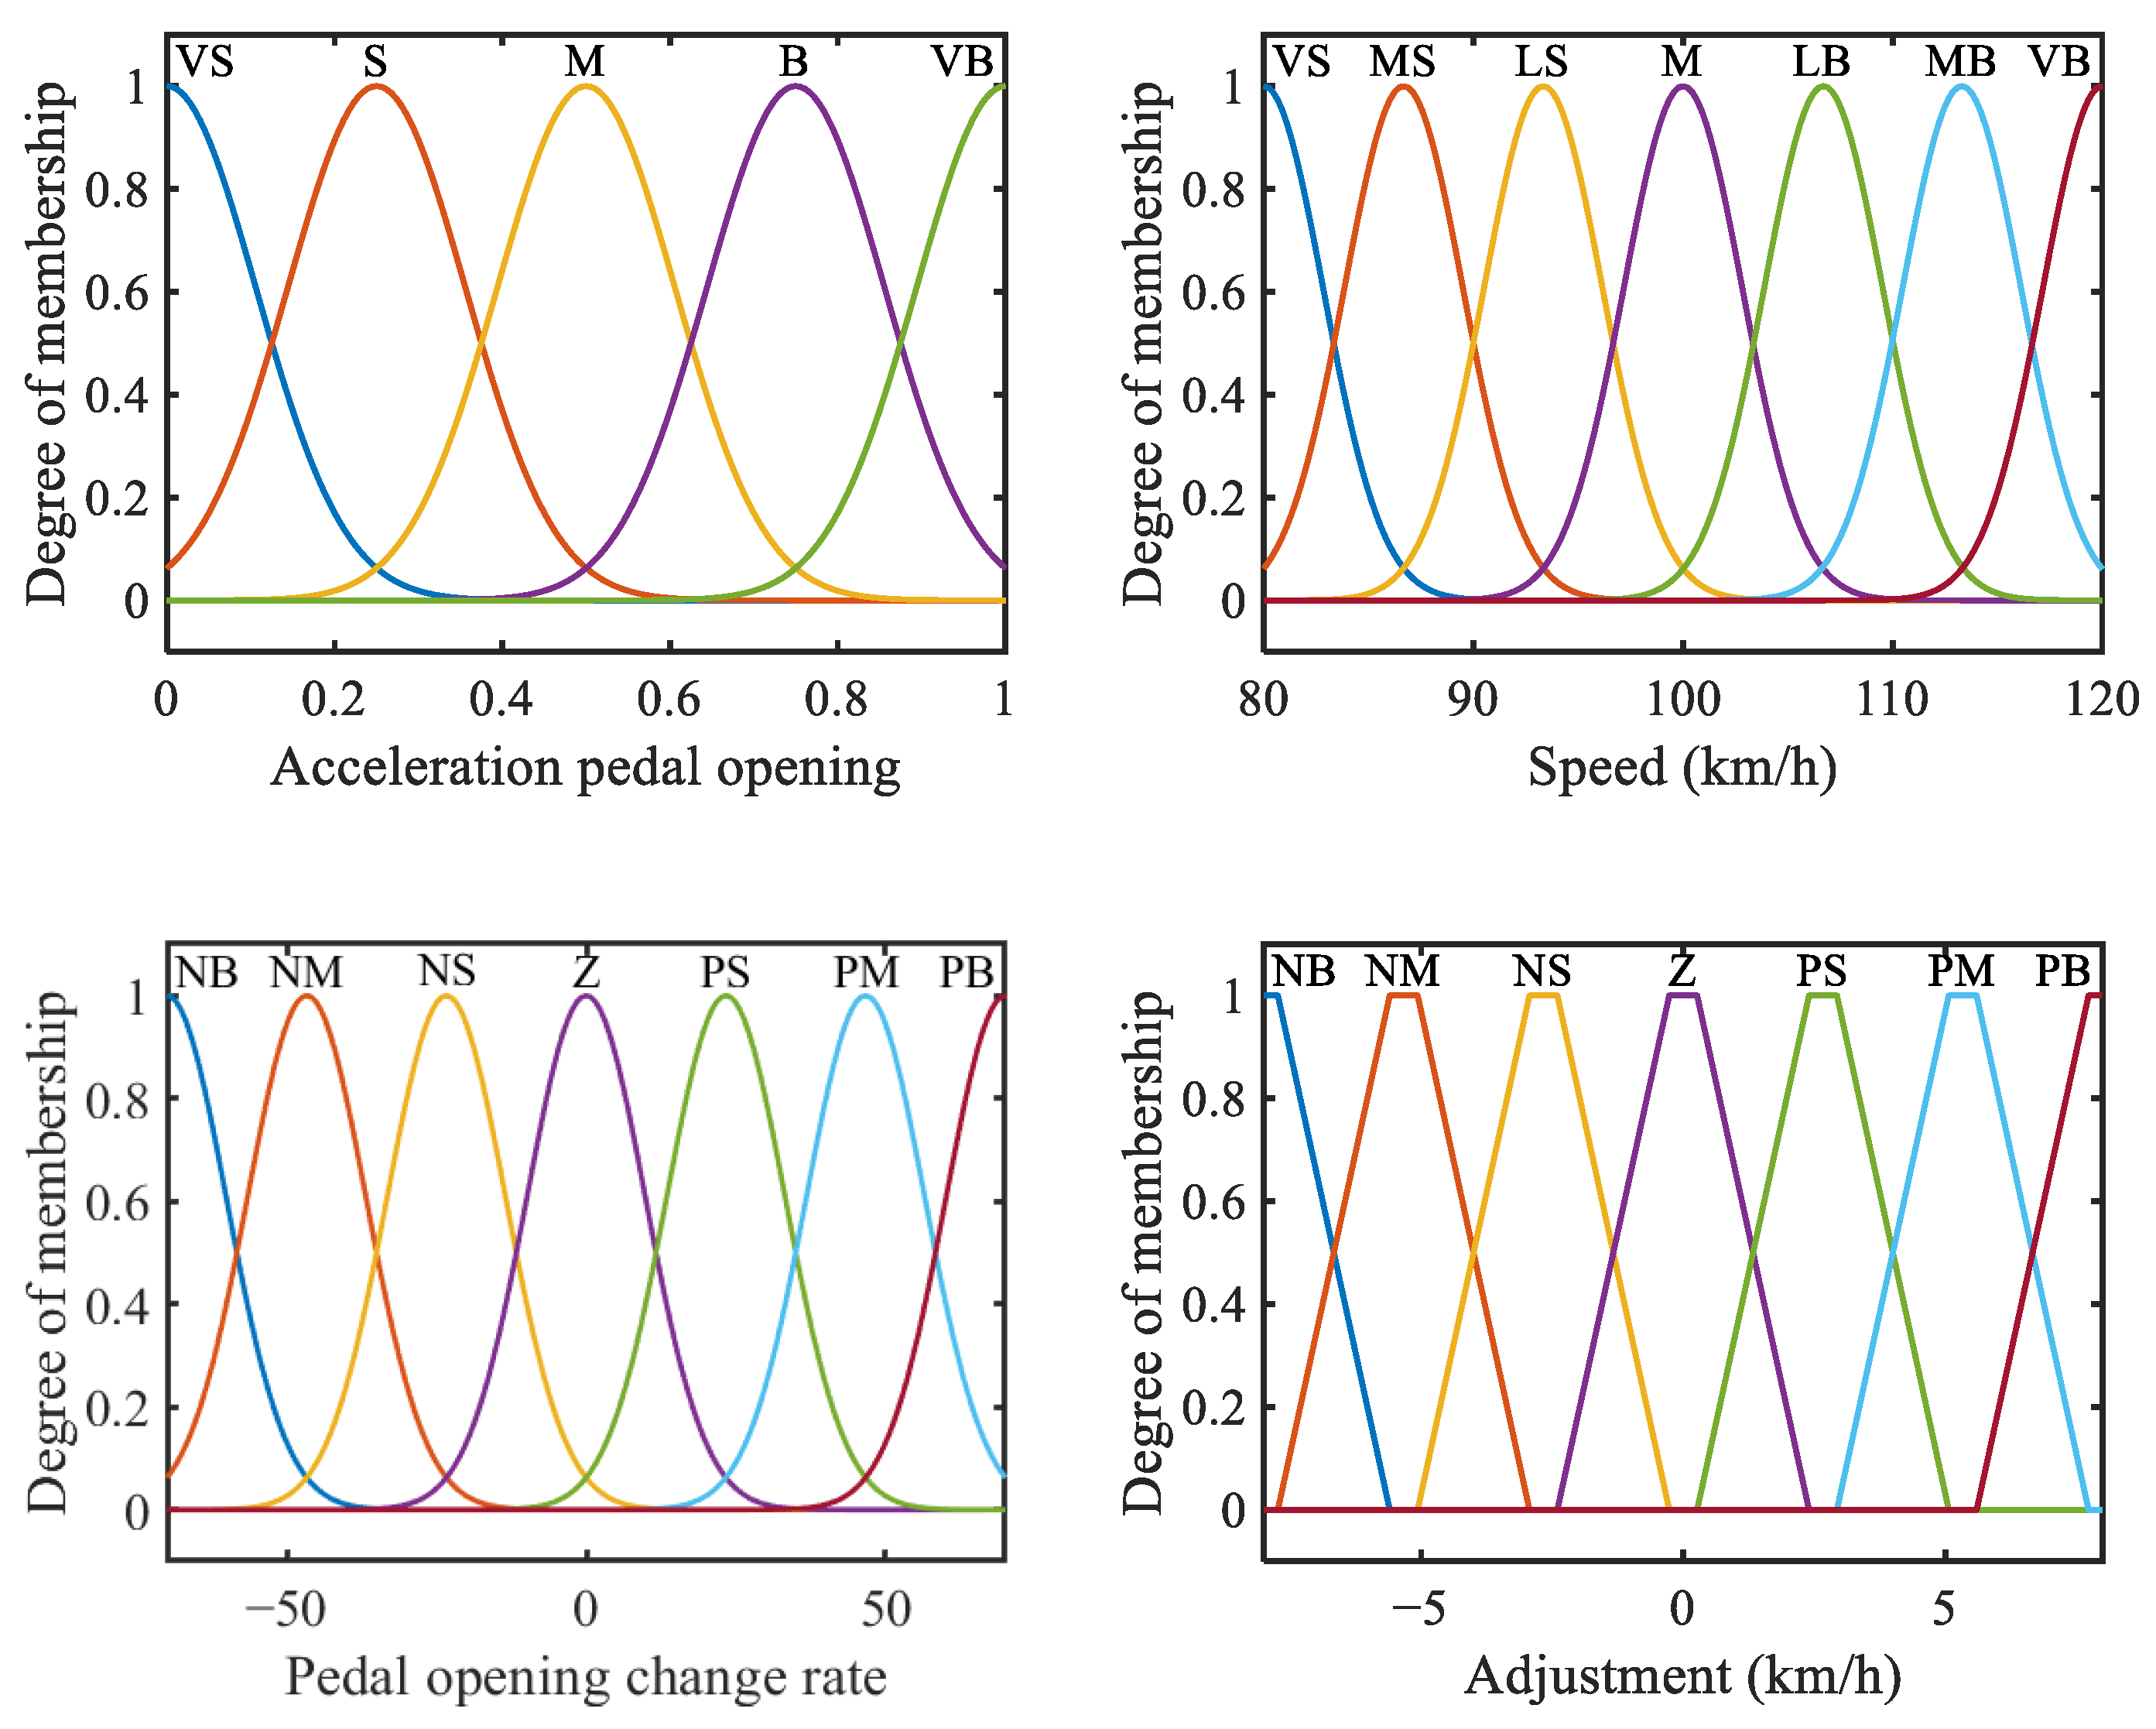
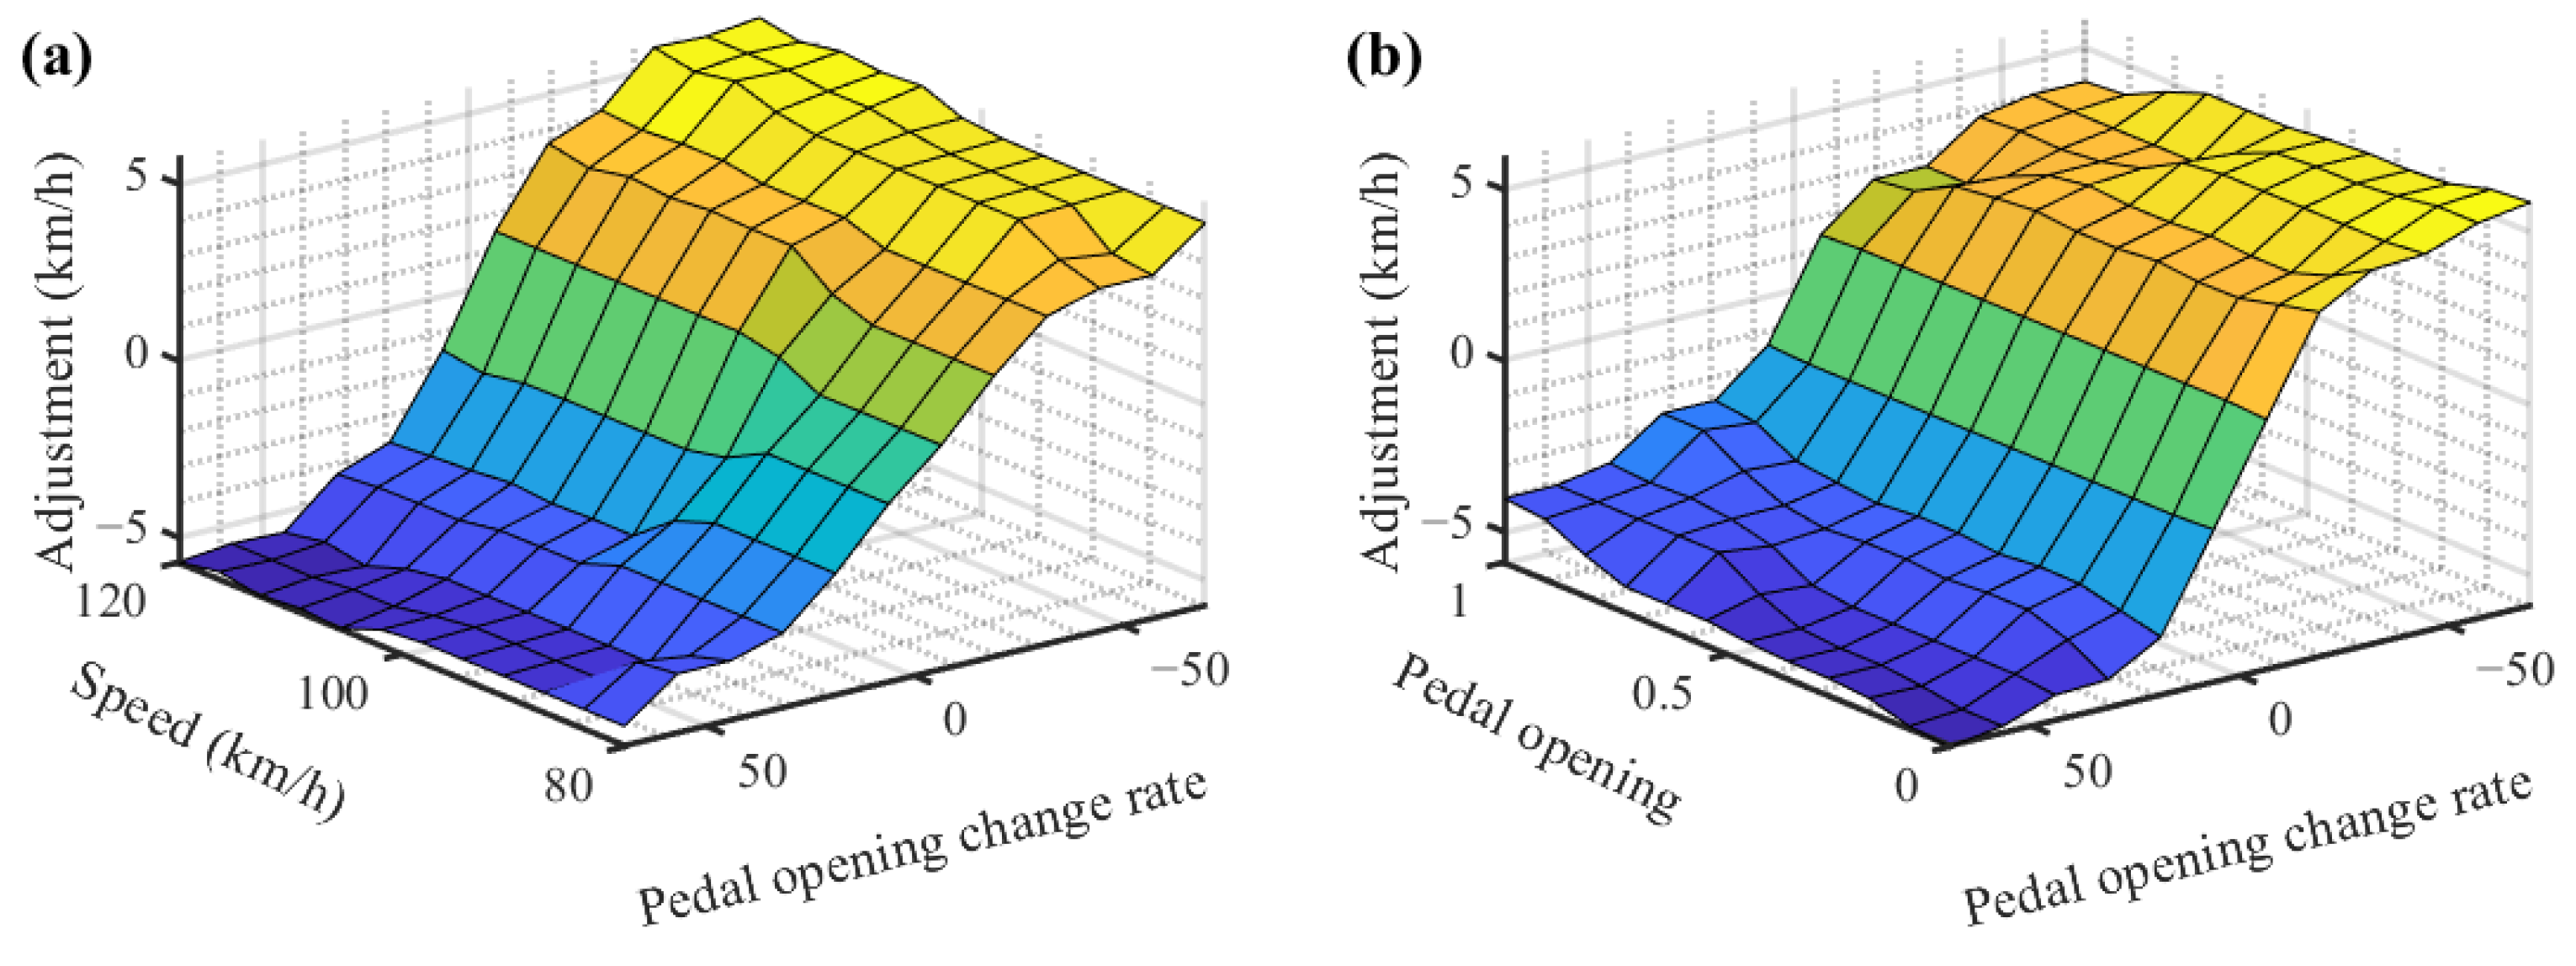
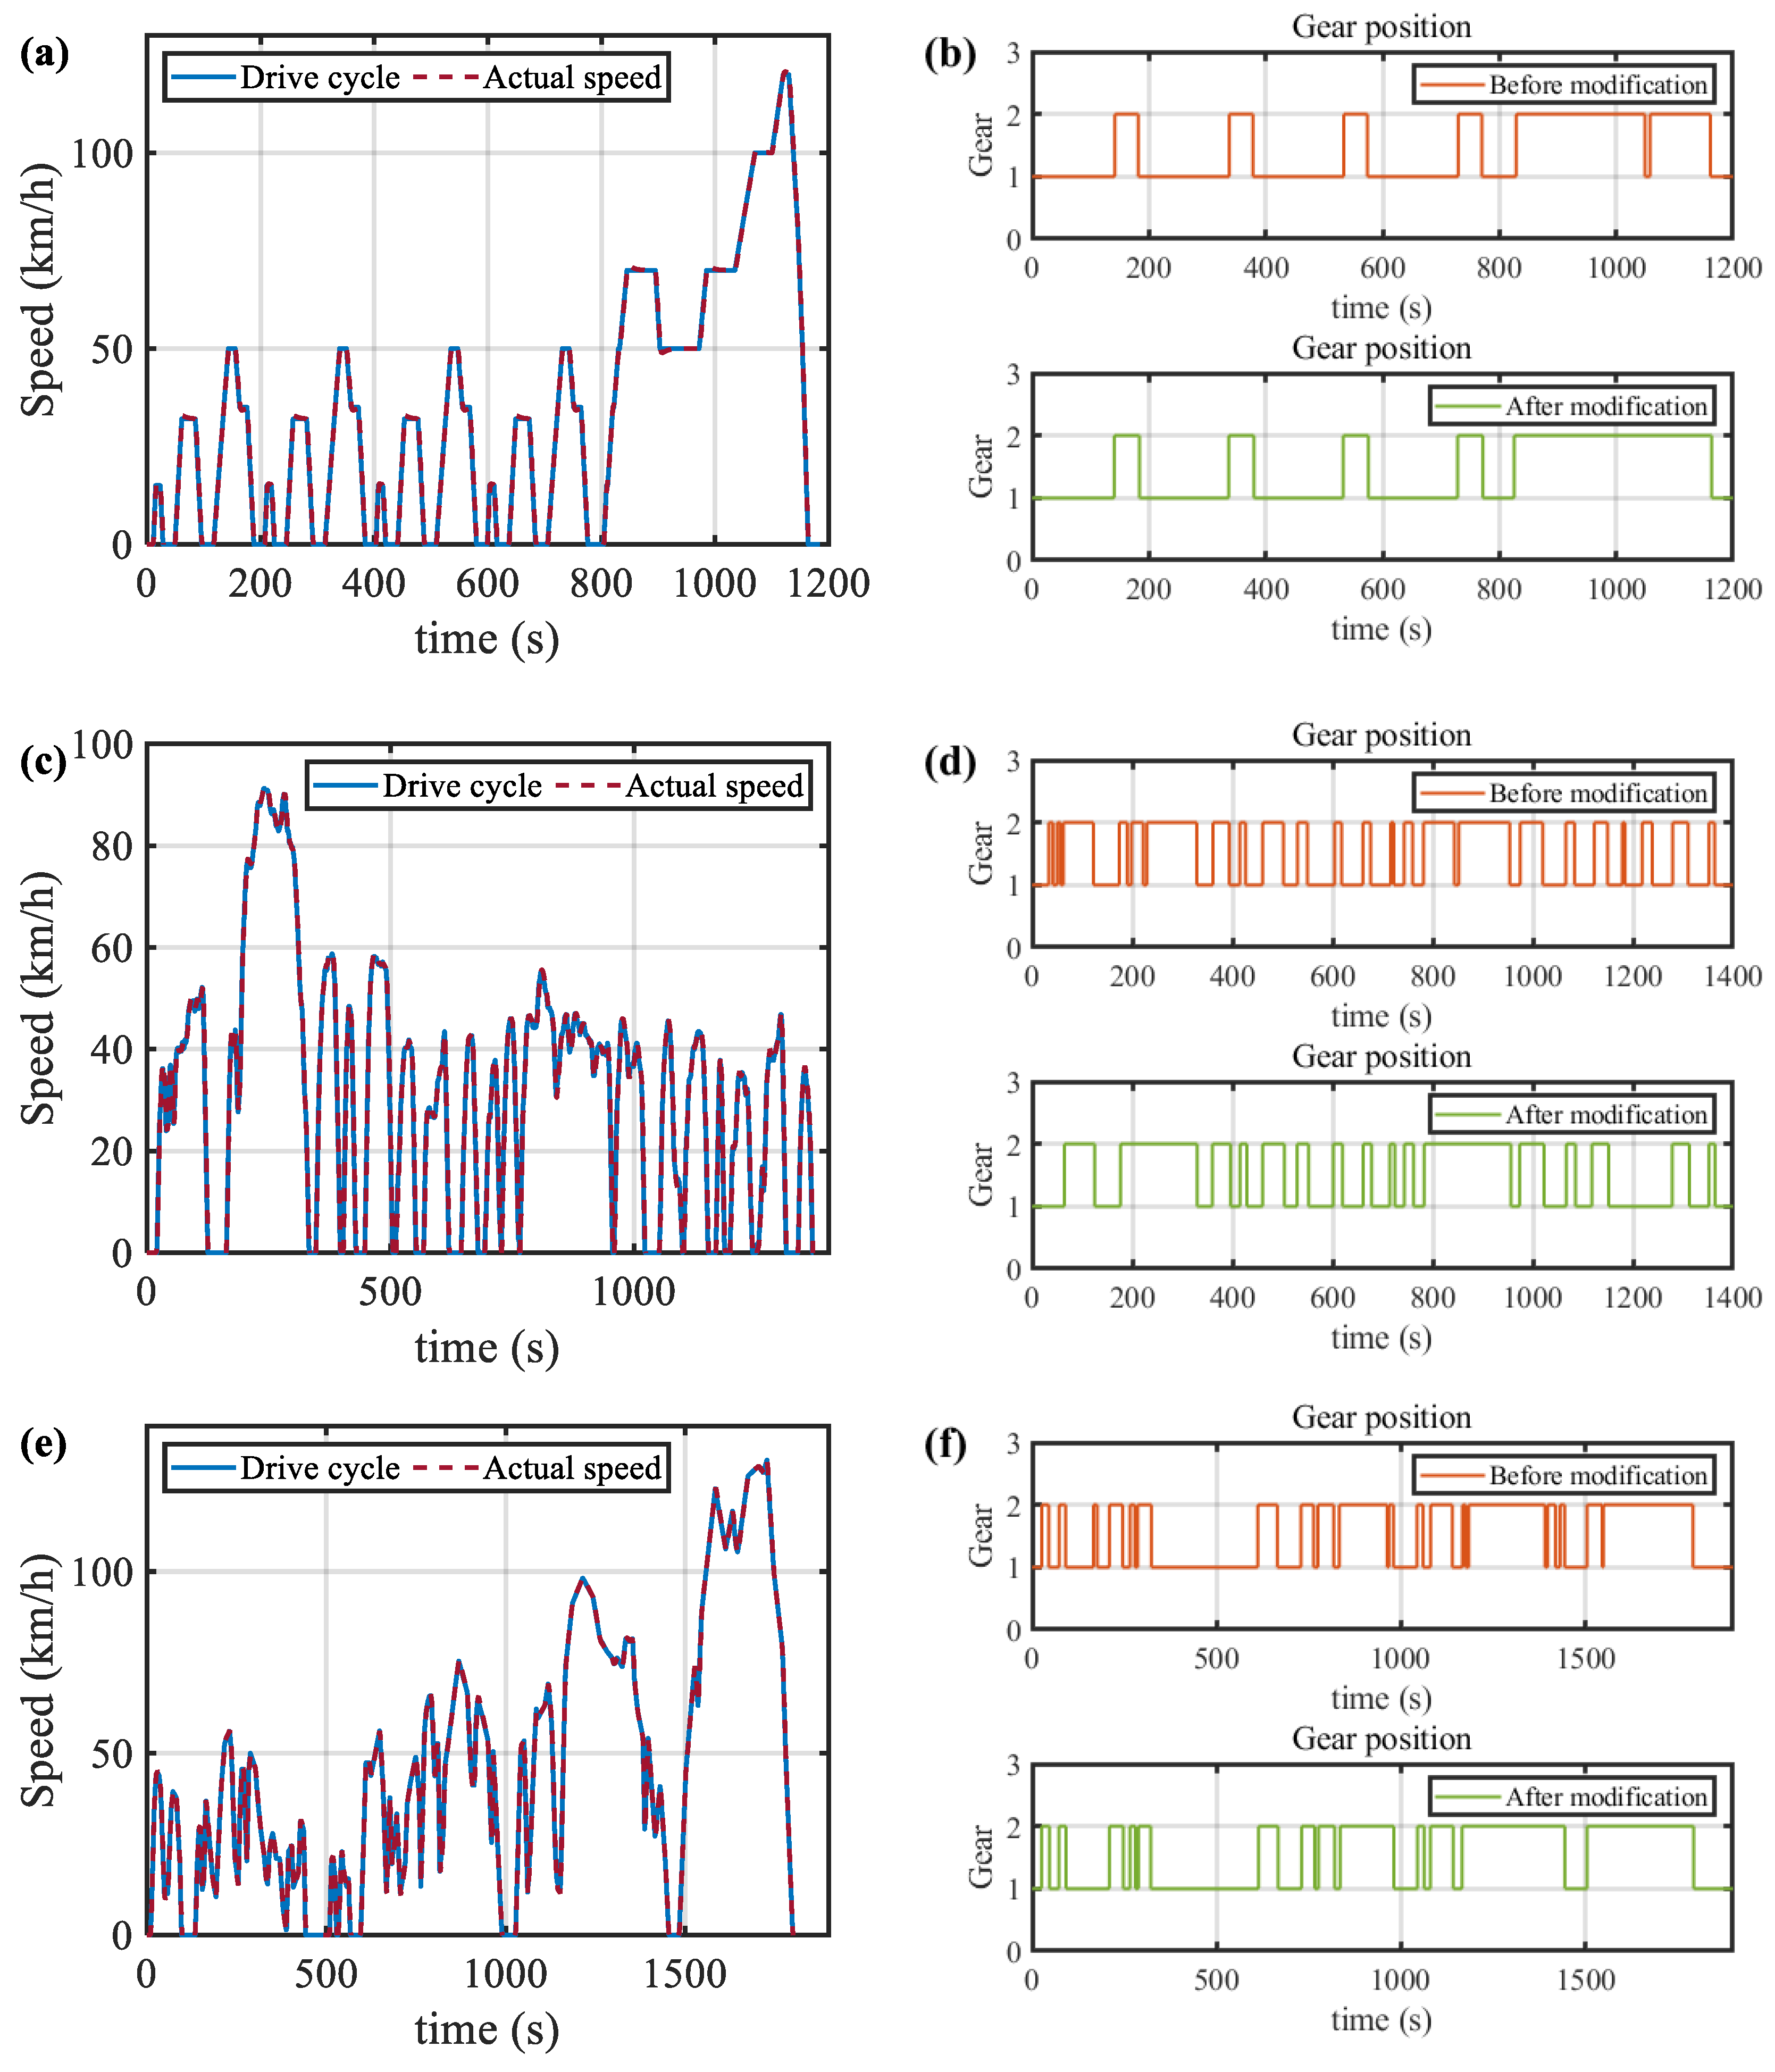
3.3. Gear-Shifting Strategy Online Modification

Due to the characteristics of pure electric vehicles, the motor speed is usually high during gear-shifting, which leads to greater abrasion of the dual-clutch transmission. If there is frequent and meaningless shifting, the service life of the transmission will be seriously diminished, and the jerk of shifting will also diminish driving comfort, which hinders the widespread application of the dual-clutch transmission on pure electric vehicles. This study proposes an adjustment strategy based on fuzzy logic by introducing a third shift parameter considering the dynamic characteristics of the vehicle and making online modifications to the original partitioned shifting strategy to alleviate this problem.
The partitioned shifting strategy can meet the requirements of saving energy in low-speed driving conditions and ensuring dynamic performance in a high-speed situation. However, the strategy is based on the steady-state characteristics of the motor, ignoring the dynamic characteristics of the vehicle while it is moving. The accelerator pedal opening and the speed of the vehicle are utilized as the shifting control parameters. The speed reflects the state of the vehicle’s movement, and the opening of the accelerator pedal reflects the driver’s driving state.
Vehicle acceleration was introduced as the third variable for the economic shifting strategy, together with the vehicle speed and the accelerator pedal opening as the input of the fuzzy logic. Acceleration was chosen because, while adopting an economic shifting strategy, the power should be guaranteed as much as possible. The vehicle acceleration as a dynamic parameter reflects the driver’s intention, which can be taken into account to adjust the shifting strategy. The adjustment amount of the shifting curves is considered an output variable. The online adjustment of the shifting curve enables the strategy to integrate the driver’s intention, which makes the strategy more reasonable, thereby reducing the number of invalid gearshifts. The vehicle speed, the accelerator pedal opening, and the vehicle acceleration were in the range of 0 to 80, 0 to 1, and −5 to 5, respectively. The range of the output was −8 to 8. In the fuzzy rules of the economic shifting strategy, the membership functions of the input and output variables are as shown in Figure 8.
According to the characteristics of the input variables, fuzzy rules were established according to each variable, and a total of 84 rules were formulated based on engineering experience. The characteristic maps of fuzzy logic are shown in Figure 9a,b, respectively. The principle of fuzzy rules design is that the higher the speed of the vehicle, the greater the adjustment; the higher the absolute value of vehicle acceleration, the larger the absolute value of adjustment; the larger the opening of the accelerator pedal, the smaller the adjustment; when the acceleration is positive, the amount of adjustment is negative; when the acceleration is negative, the amount of adjustment is positive. The strategy was modified online, depending on the output variables of the fuzzy logic.
The change rate of the accelerator pedal opening was introduced as the third variable for the dynamic shifting strategy, together with the vehicle speed and the accelerator pedal opening as the input of the fuzzy logic. The change rate of the accelerator pedal was chosen because the driver’s desire for acceleration should be considered more deeply when the dynamic shifting strategy is adopted. As a dynamic parameter, the accelerator pedal change rate can more accurately reflect the driver’s intention, which can be taken into account to adjust the gear-shifting strategy. The adjustment amount of the shifting curves was considered an output variable. The online adjustment of the shifting curve enabled the strategy to be more in line with the driver’s intention, which made the strategy more reasonable, thereby reducing the number of invalid gearshifts. The vehicle speed, the accelerator pedal opening, and the accelerator pedal opening change rate are in the range of 80 to 120, 0 to 1, and −70 to 70, respectively. The range of the output variable is −8 to 8. In the fuzzy rules of dynamic shifting strategy, the membership functions of the variables are as shown in Figure 10.
There were also 84 rules for the fuzzy logic of dynamic shifting strategy; the characteristic maps of fuzzy logic are shown in Figure 11a,b, respectively. The principle of fuzzy rules design is that the higher the speed of the vehicle, the greater the adjustment; the higher the absolute value of the change rate of accelerator pedal opening, the larger the absolute value of adjustment; the larger the opening of the accelerator pedal, the smaller the adjustment; when the accelerator pedal opening change rate is positive, the amount of speed adjustment is negative; and when the change rate is negative, the amount of speed adjustment is positive. When fuzzy logic strategy is integrated in the TCU controller, the overall control system framework is as shown in Figure 12.
In this study, NEDC, UDDS, and WLTC driving cycles were adopted to verify the online modification effect of the fuzzy logic on the shifting strategy. The three driving cycles and vehicle speed tracking are shown in Figure 13a,c,e, respectively. As can be seen from the figures, the vehicle speed was tracked well. The gearshifts before and after the online modification under these three driving cycles are shown in Figure 13b,d,f, respectively.
As shown in Figure 13b, under the NEDC driving cycle, the 2DCT was shifted 12 times before the online modification; after the modification, the number of gearshifts dropped to 10. We eliminated one upshift and one downshift that had very short intervals. As shown in Figure 13d, in the UDDS driving cycle, the gearshift times of the 2DCT before and after the online modification were 46 and 32, respectively, which were reduced by 14 times. It should be noted that before the online modification, the vehicle experienced frequent invalid gearshifts around 50 s and around 200 s, which will damage the clutches, reduce their working life, and affect driving comfort. Fortunately, this phenomenon was significantly reduced after modification. In addition, at other stages during the entire driving cycle, the modification strategy worked, reducing some of the invalid gearshifts.
As shown in Figure 13f, under the WLTC driving cycle, the gearshift times of the 2DCT before and after the online modification were 38 and 26, respectively, which were reduced 12 times. It is worth noting that among the 12 reduced shifts, 10 were invalid frequent shifts, at about 960 s, 1165 s, 1400 s, 1550 s, etc. Overall, the fuzzy logic online modification had good performance and could correct the deficiencies of the previous shifting strategy.

4. Comparison and Verification

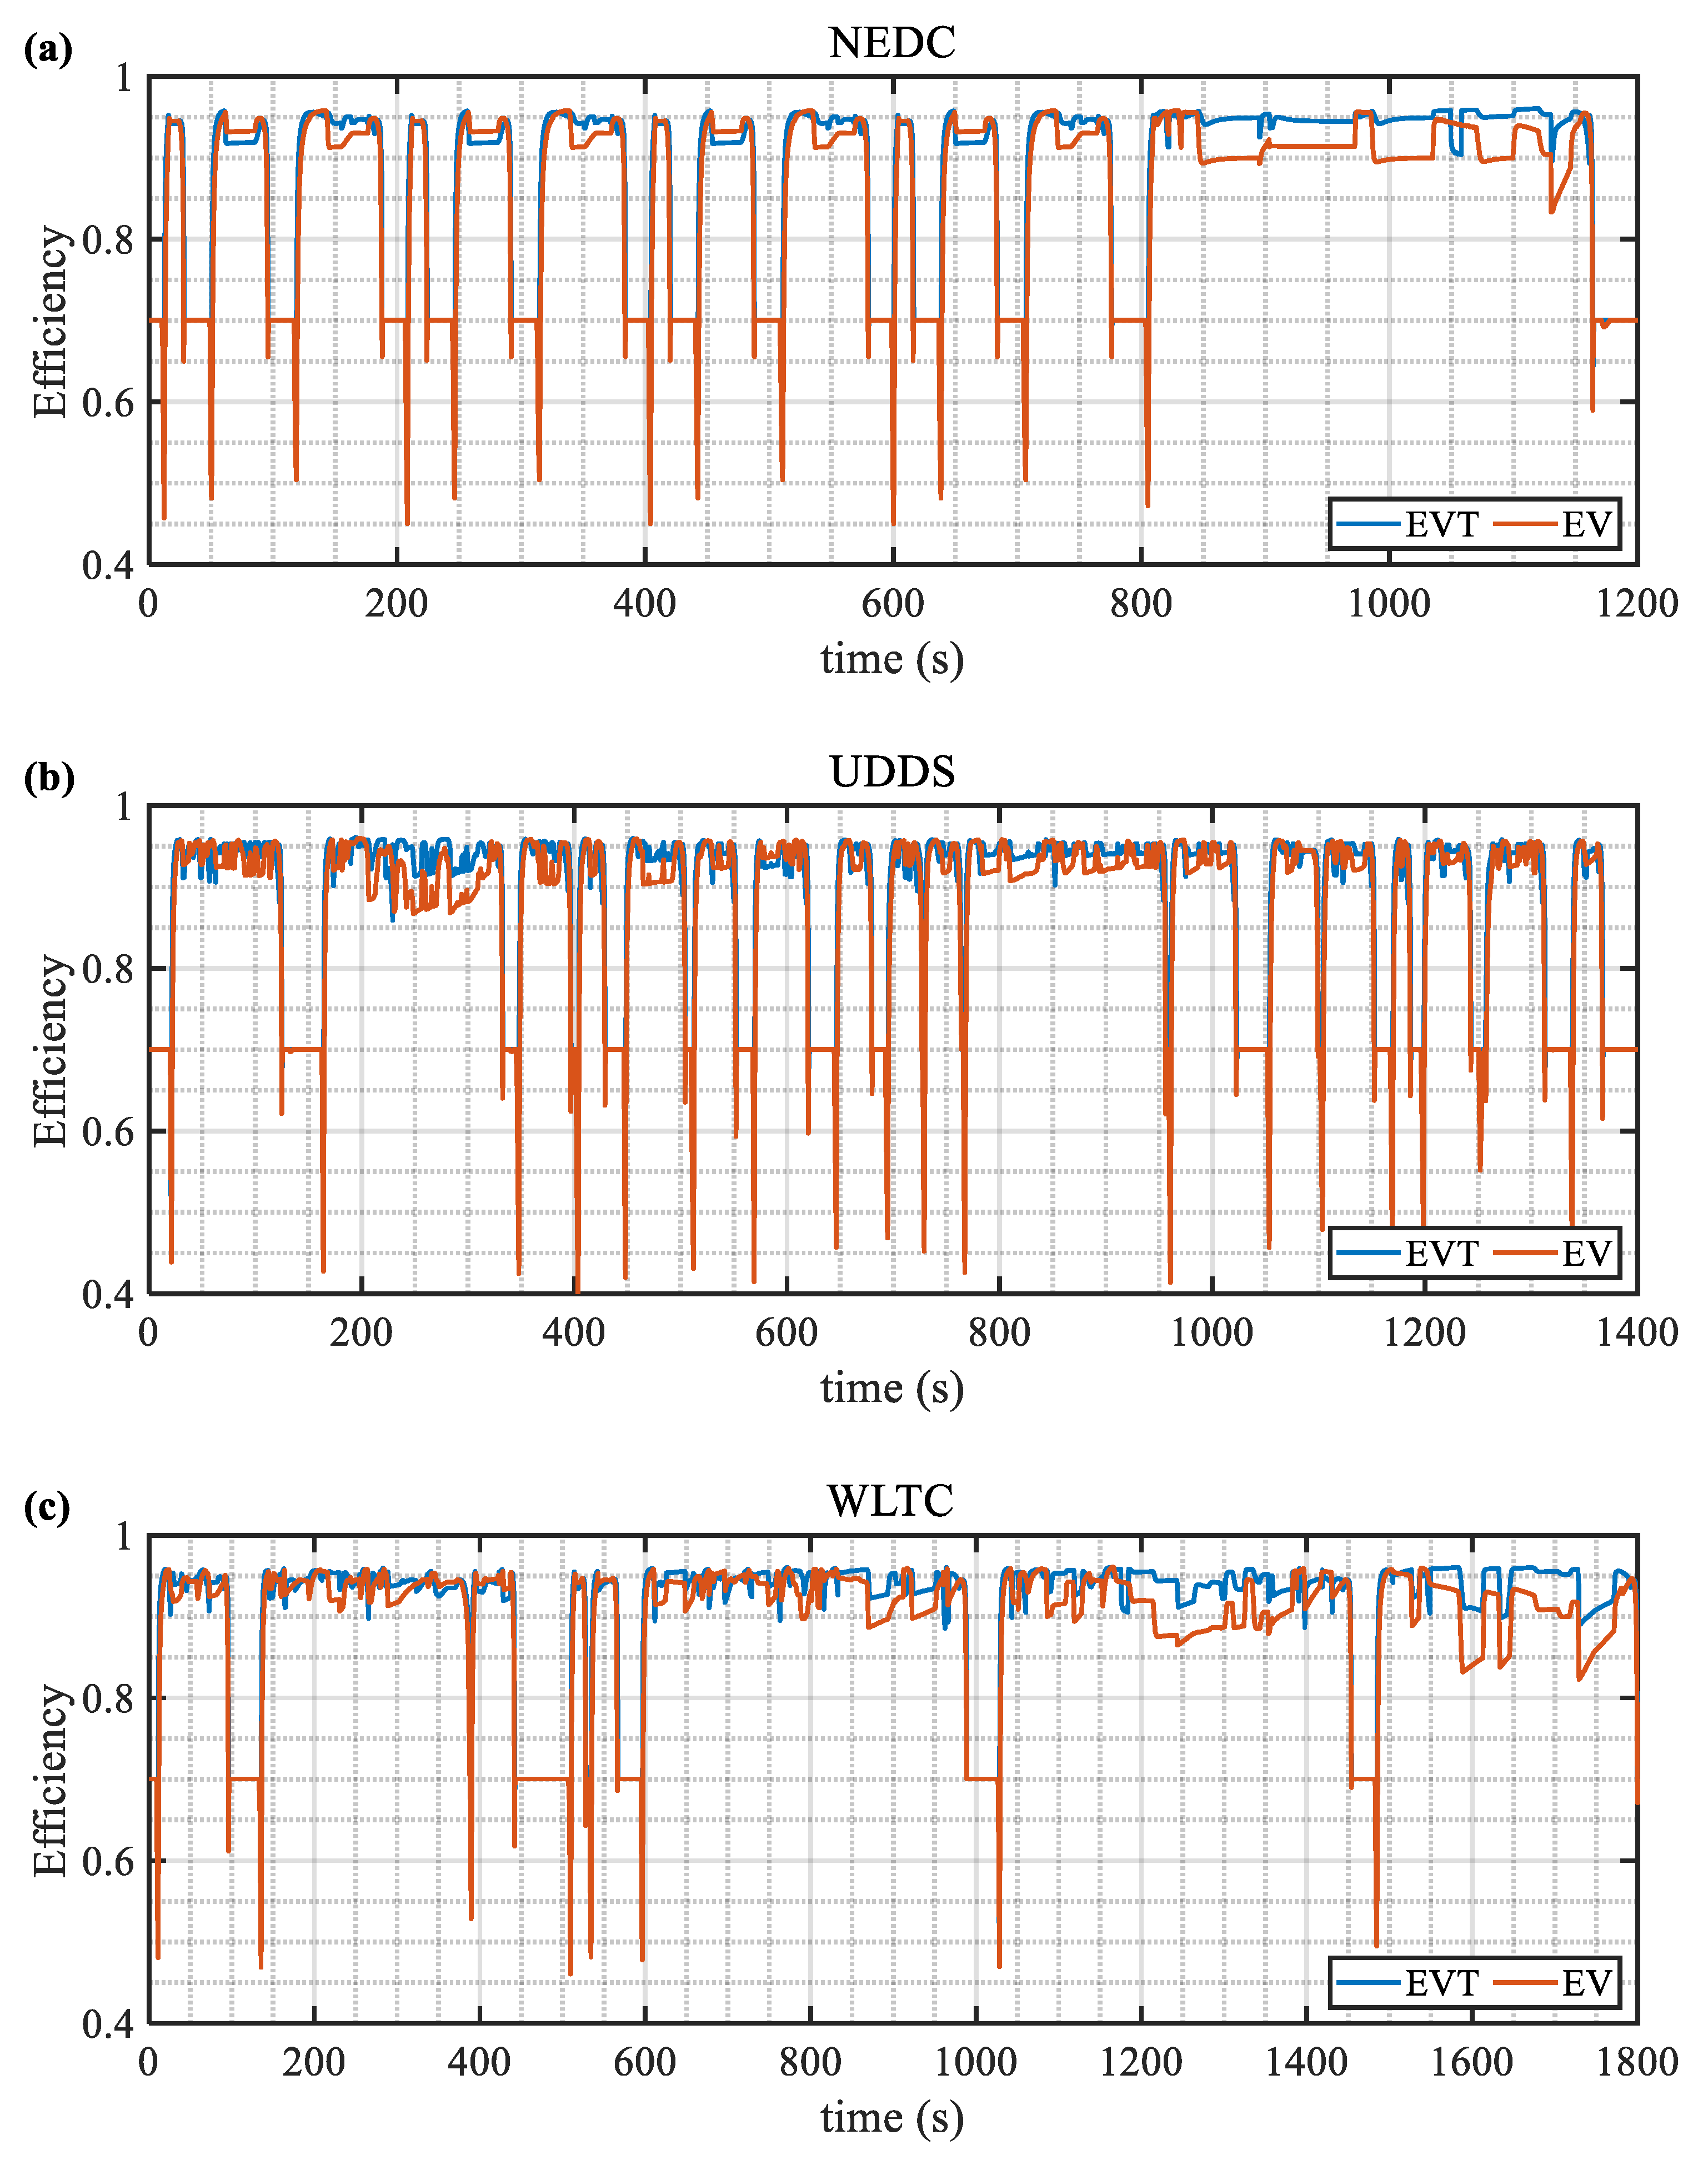
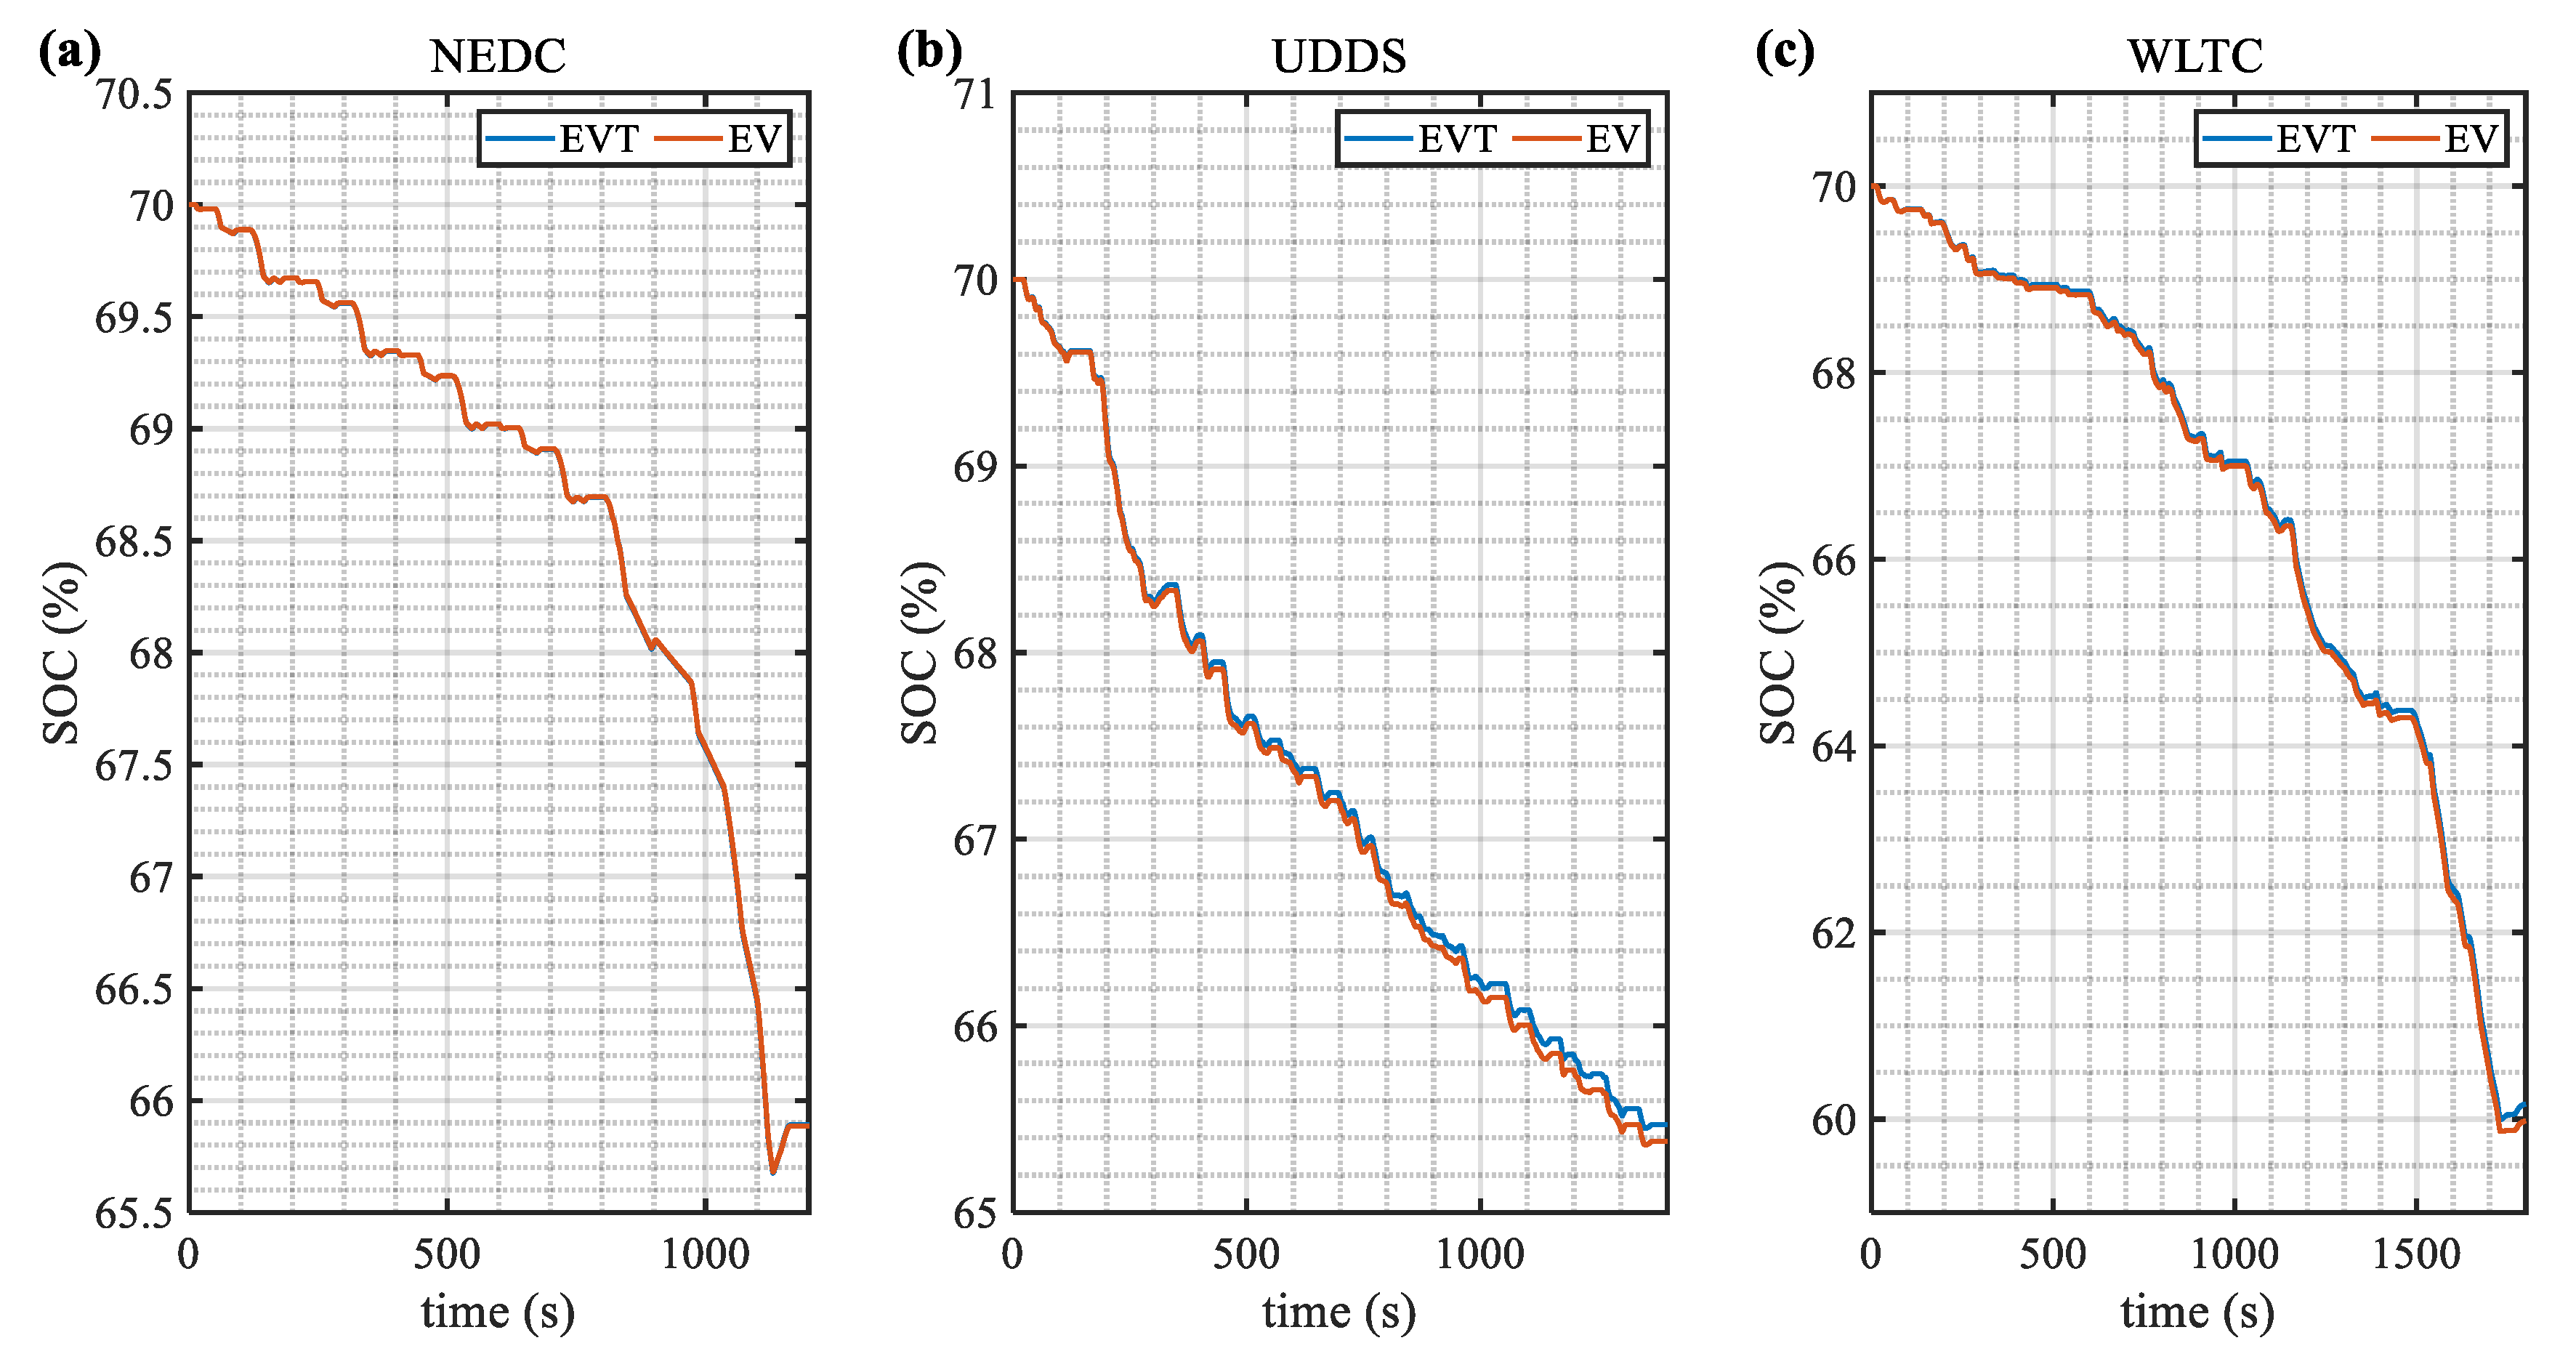
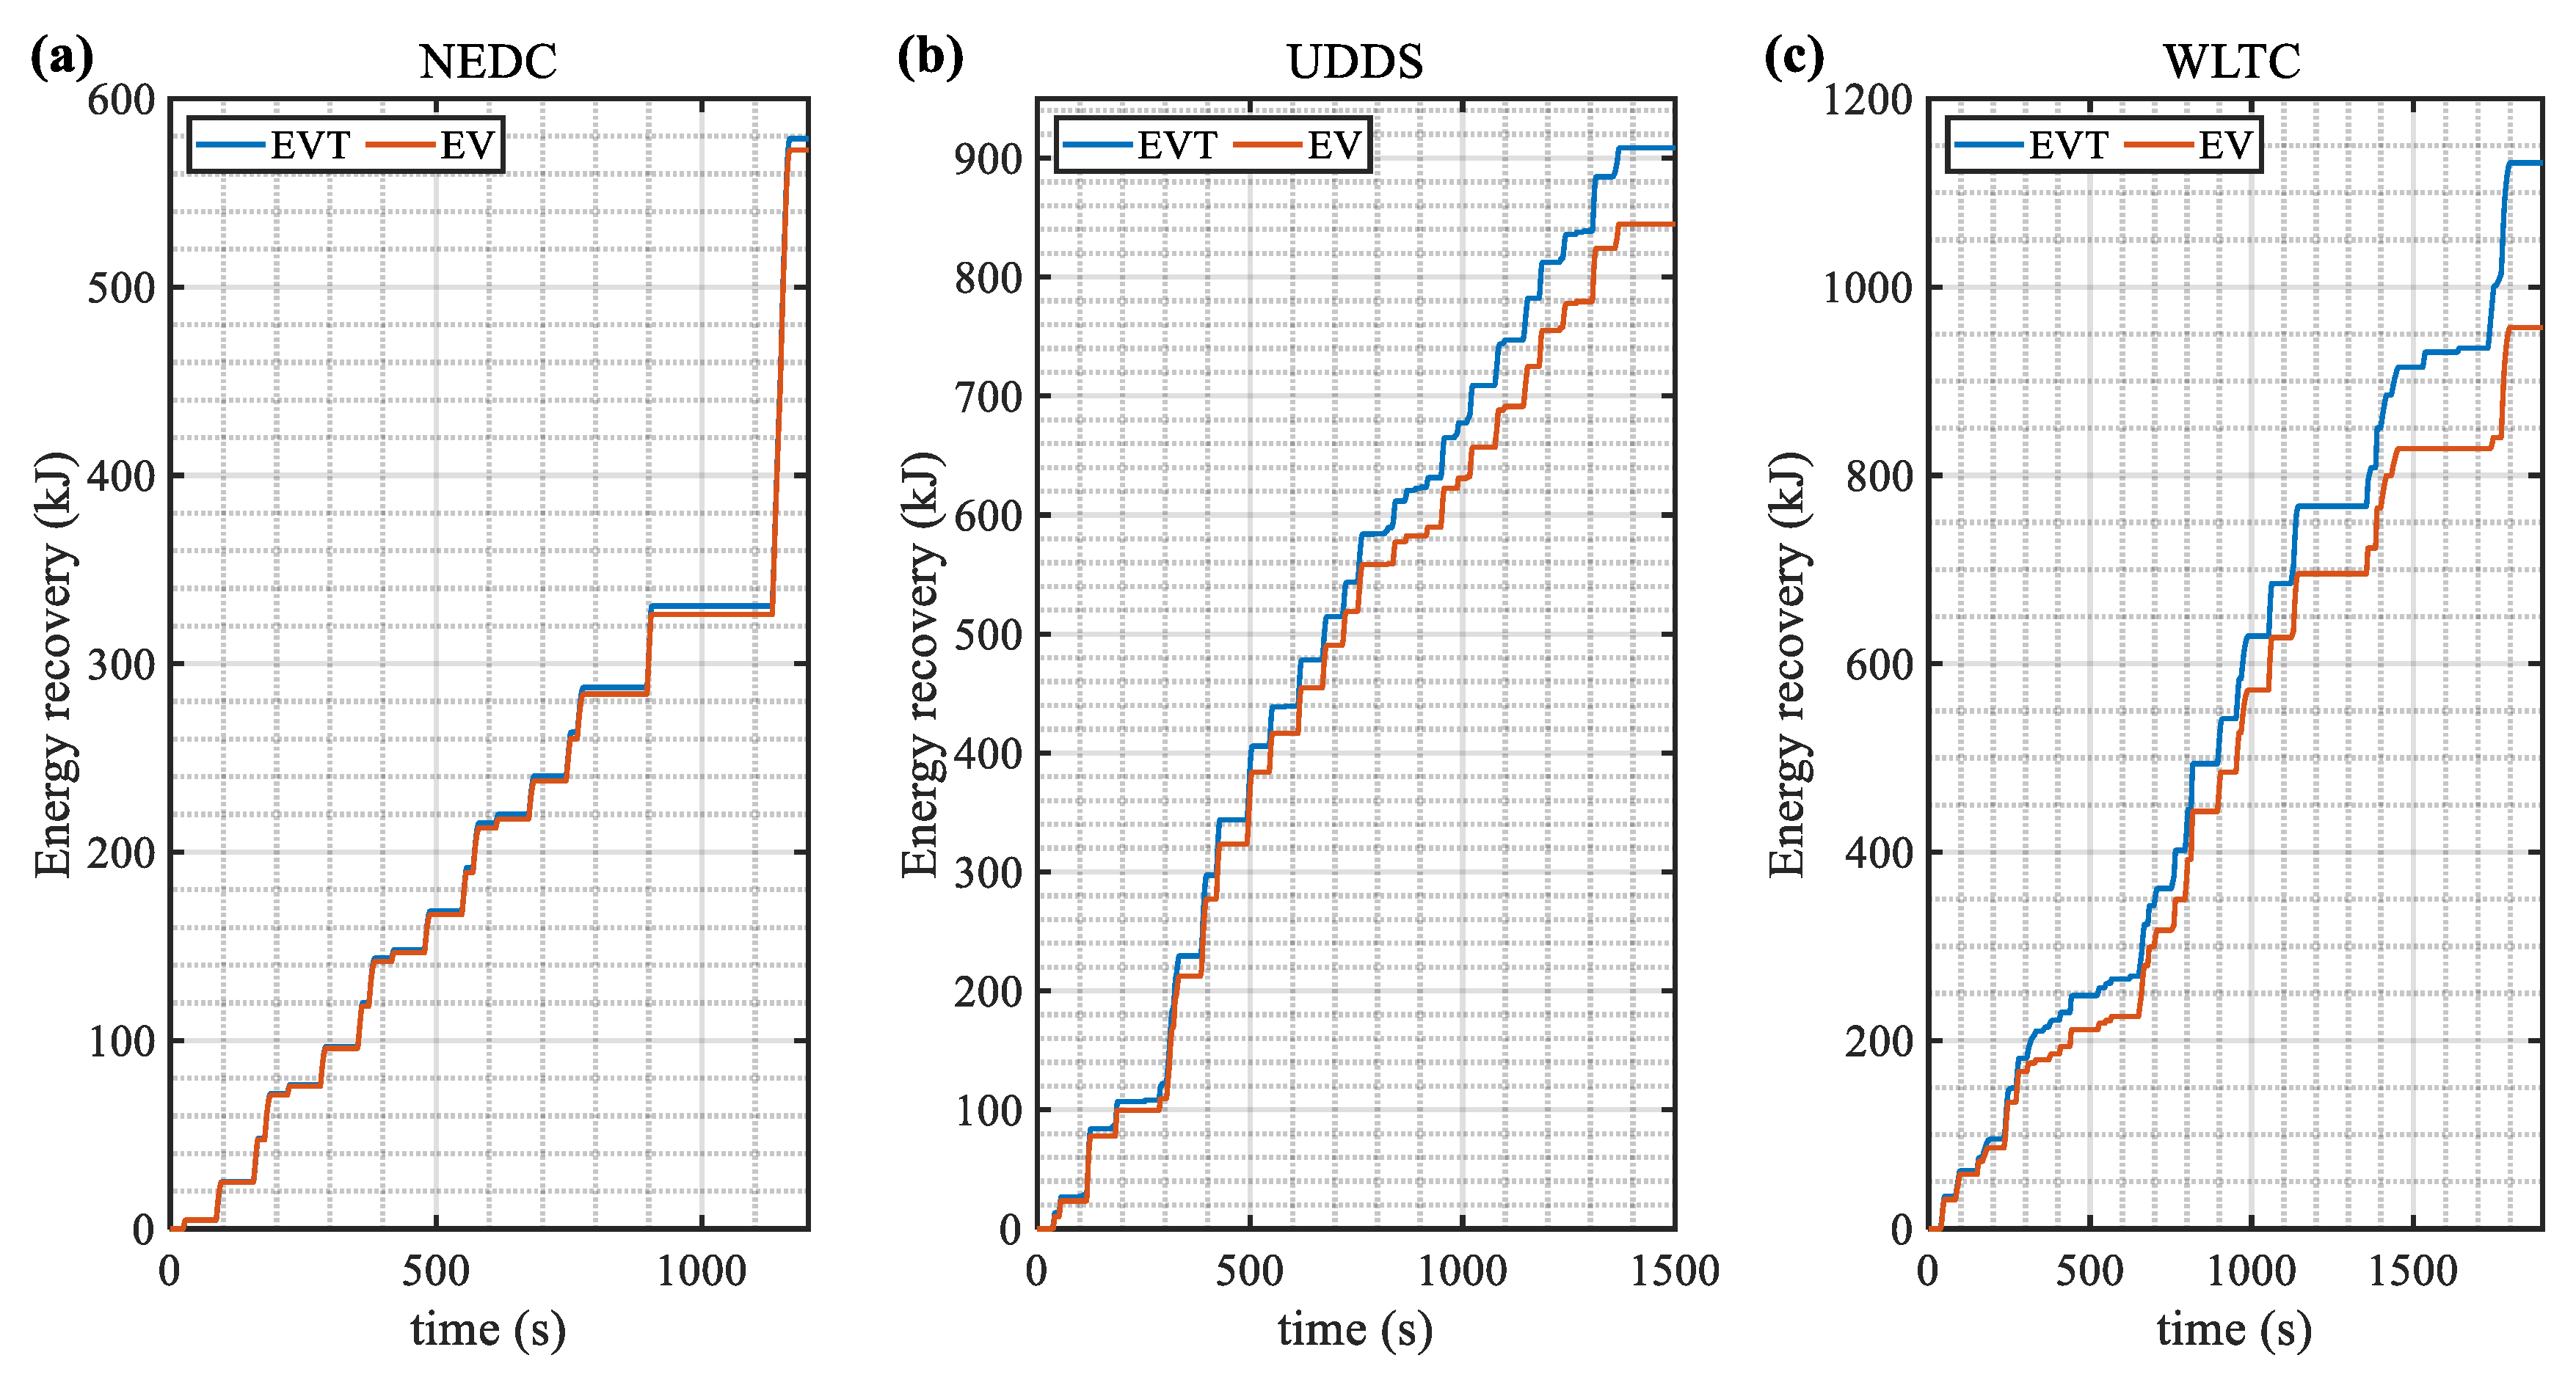
4.1. Comparison of Vehicle Economic Performance

Motor efficiency is critical to economic performance. The three driving cycles, NEDC, UDDS, and WLTC, were applied for the EVT and its gear-shifting strategy to verify the motor efficiency. The motor efficiency curves of the three driving cycles are shown in Figure 14a–c, respectively.
As shown in Figure 14a, in the NEDC driving cycle, the motor efficiency of the EVT was higher than that of the EV most of the time, especially when the vehicle was driven in the high-speed driving phase. According to the shifting strategy, the 2DCT shifted to the second gear state in this phase, and obviously, the working efficiency of the EVT motor was significantly higher than that of the EV in this phase.
As shown in Figure 14b, in the UDDS driving cycle, the motor working efficiency of the EVT was higher than that of the EV in most cases, but the gap was not huge. However, in some relatively high-speed periods, such as 220 s to 340 s, the motor efficiency of the EVT was much higher than that of the EV, because the 2DCT was in second gear state during these periods.
As shown in Figure 14c, under the WLTC driving cycle, the motor efficiencies of the EVT and the EV were not much different in the low-speed period. With increases in the vehicle speed, the motor efficiency of the EVT was slightly higher than that of the EV in the medium speed periods, such as 840 s to 960 s, because the 2DCT switched between first and second gear more frequently during this period. In the high-speed period, since the 2DCT often stays in the second gear state, the motor efficiency of the EVT was significantly higher than that of the EV. These phenomena show that the 2DCT can enhance the efficiency of the motor.
The battery SOC curves of two types of vehicles in the NEDC, UDDS, and WLTC driving cycles are shown in Figure 15a–c, respectively. The braking recovery energy curves are shown in Figure 16a–c, respectively. The final values of the SOC and the braking energy recovery are shown in Table 2. The braking energy was recovered according to a fixed proportion; 30% of the total braking energy was recovered.
As shown in Figure 15a and Figure 16a, the SOC curve of the EVT was not much different than that of the EV under the NEDC driving cycle; the braking recovery energy of the EVT was 6.05 kJ higher than that of the EV. According to Figure 15b and Figure 16b, in the UDDS driving cycle, the SOC curve of the EVT declined more slowly than that of the EV, and the final value improved by 0.09%; the braking recovery energy of the EVT increased by 7.6%. These changes were due to the UDDS driving cycle being more complicated and having more braking periods. With the driving time increases, the gap between the SOC curves and the gap between the braking recovery energy curves both increased, which meant that the longer the driving distance, the more energy the EVT saved. As shown in Figure 15c and Figure 16c, under the WLTC driving cycle, the SOC curve of the EVT declined more slowly than that of the EV; the final values have improved by 0.19%, and the braking recovery energy of the EVT increased by 18.25%. This was because the 2DCT was in the second gear state during the high-speed period, which reduced the motor speed so that the motor could work in a more efficient range whether it was driving or braking. Like the UDDS, with the increase in driving time, the gap between the SOC curves and between the braking recovery energy curves increased.
In summary, the EVT is superior to the EV in terms of economic performance, and the 2DCT made a significant contribution to this superiority. Moreover, for the EVT, the energy-saving control strategy can be more optimized, which also provides a greater potential for energy-saving.

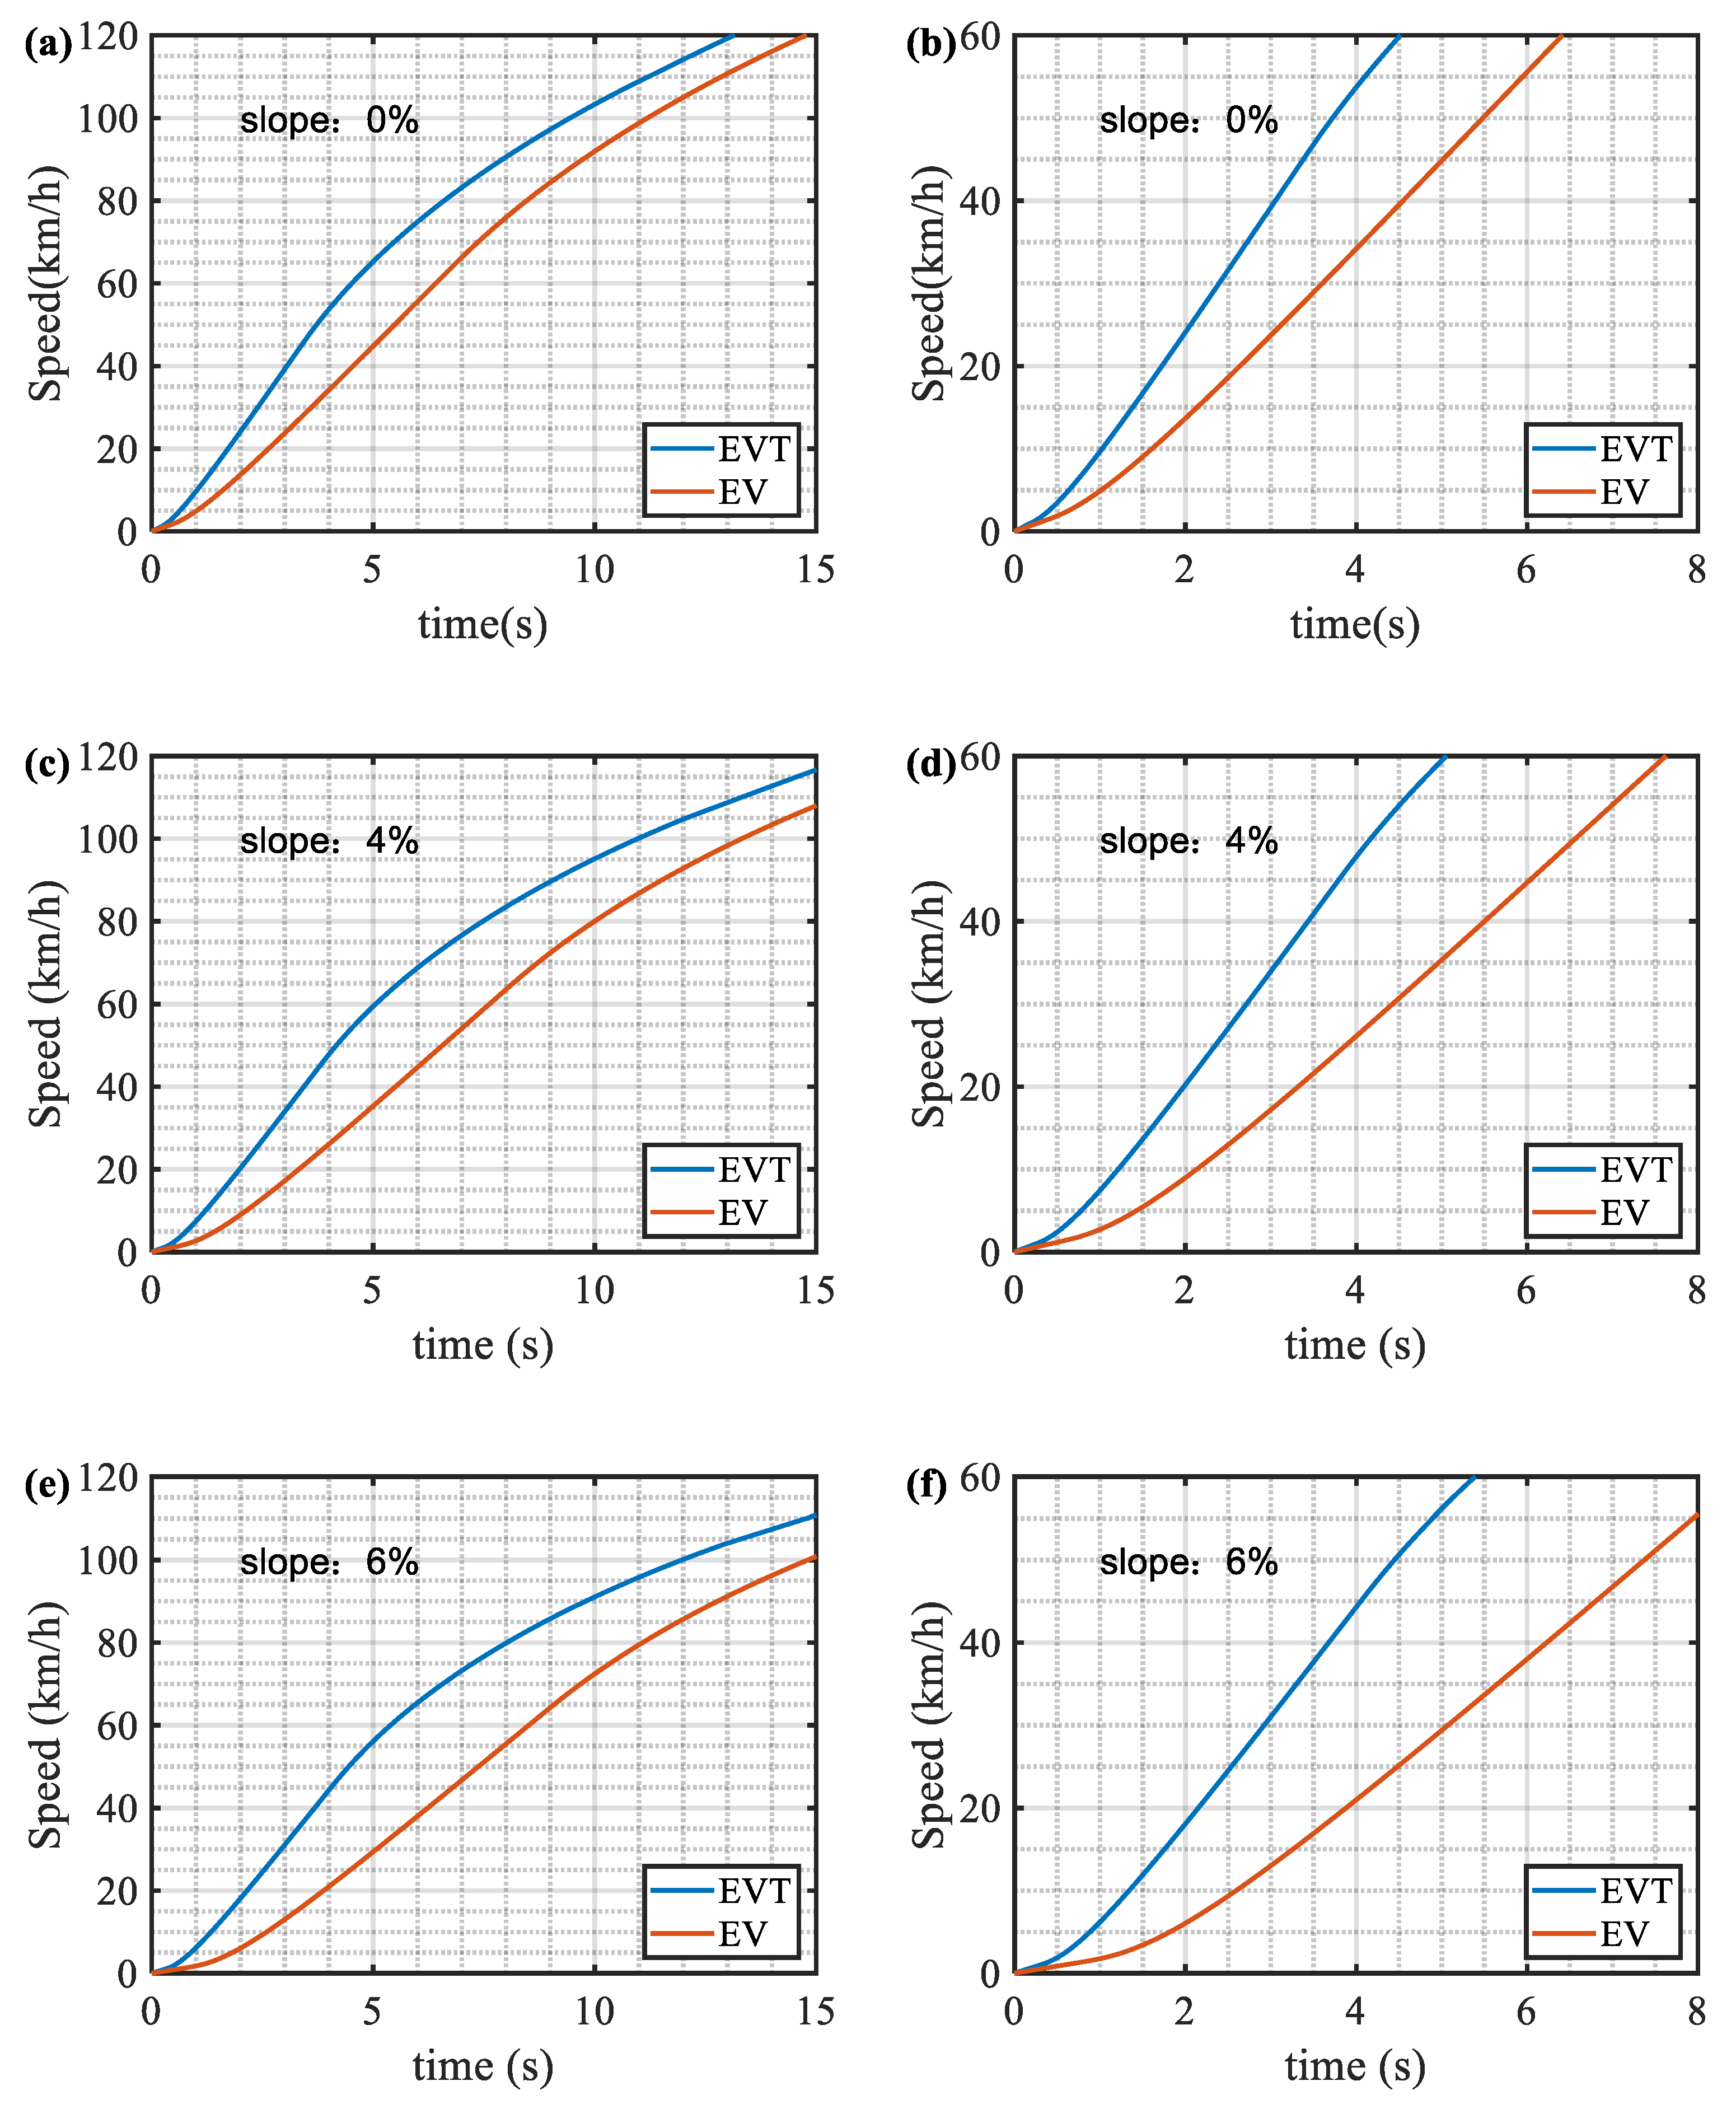
4.2. Comparison of Vehicle Dynamic Performance
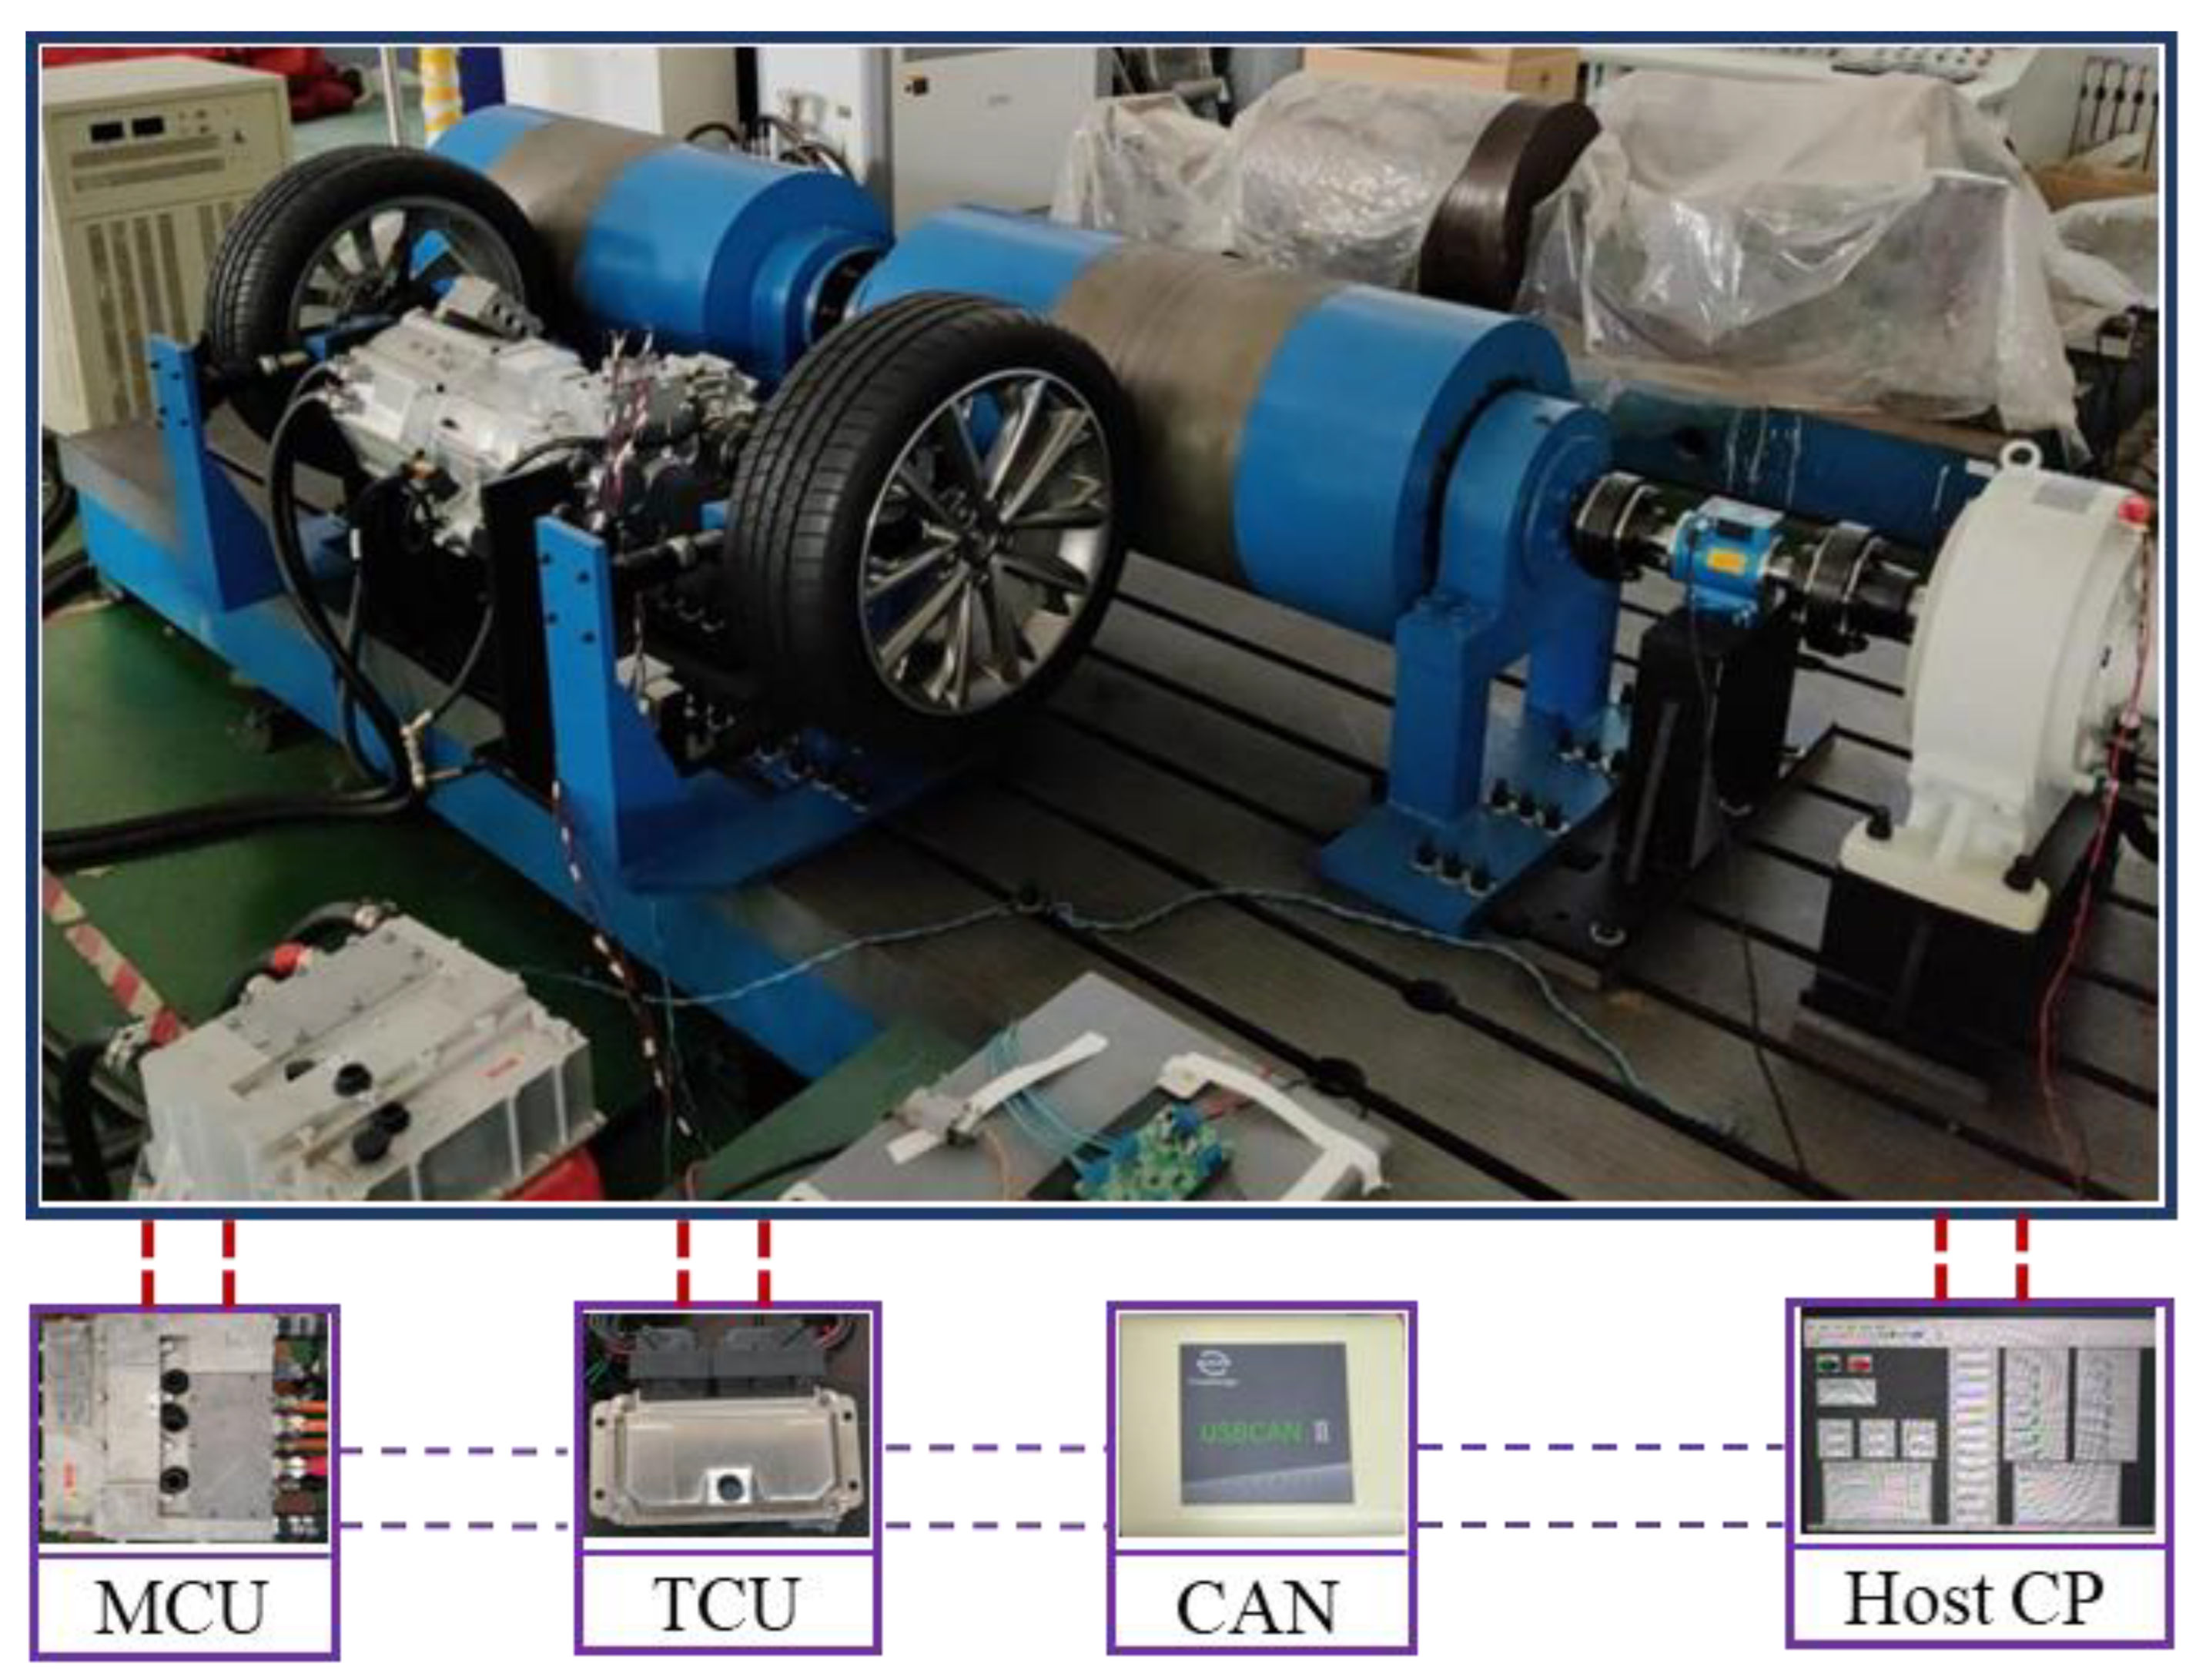
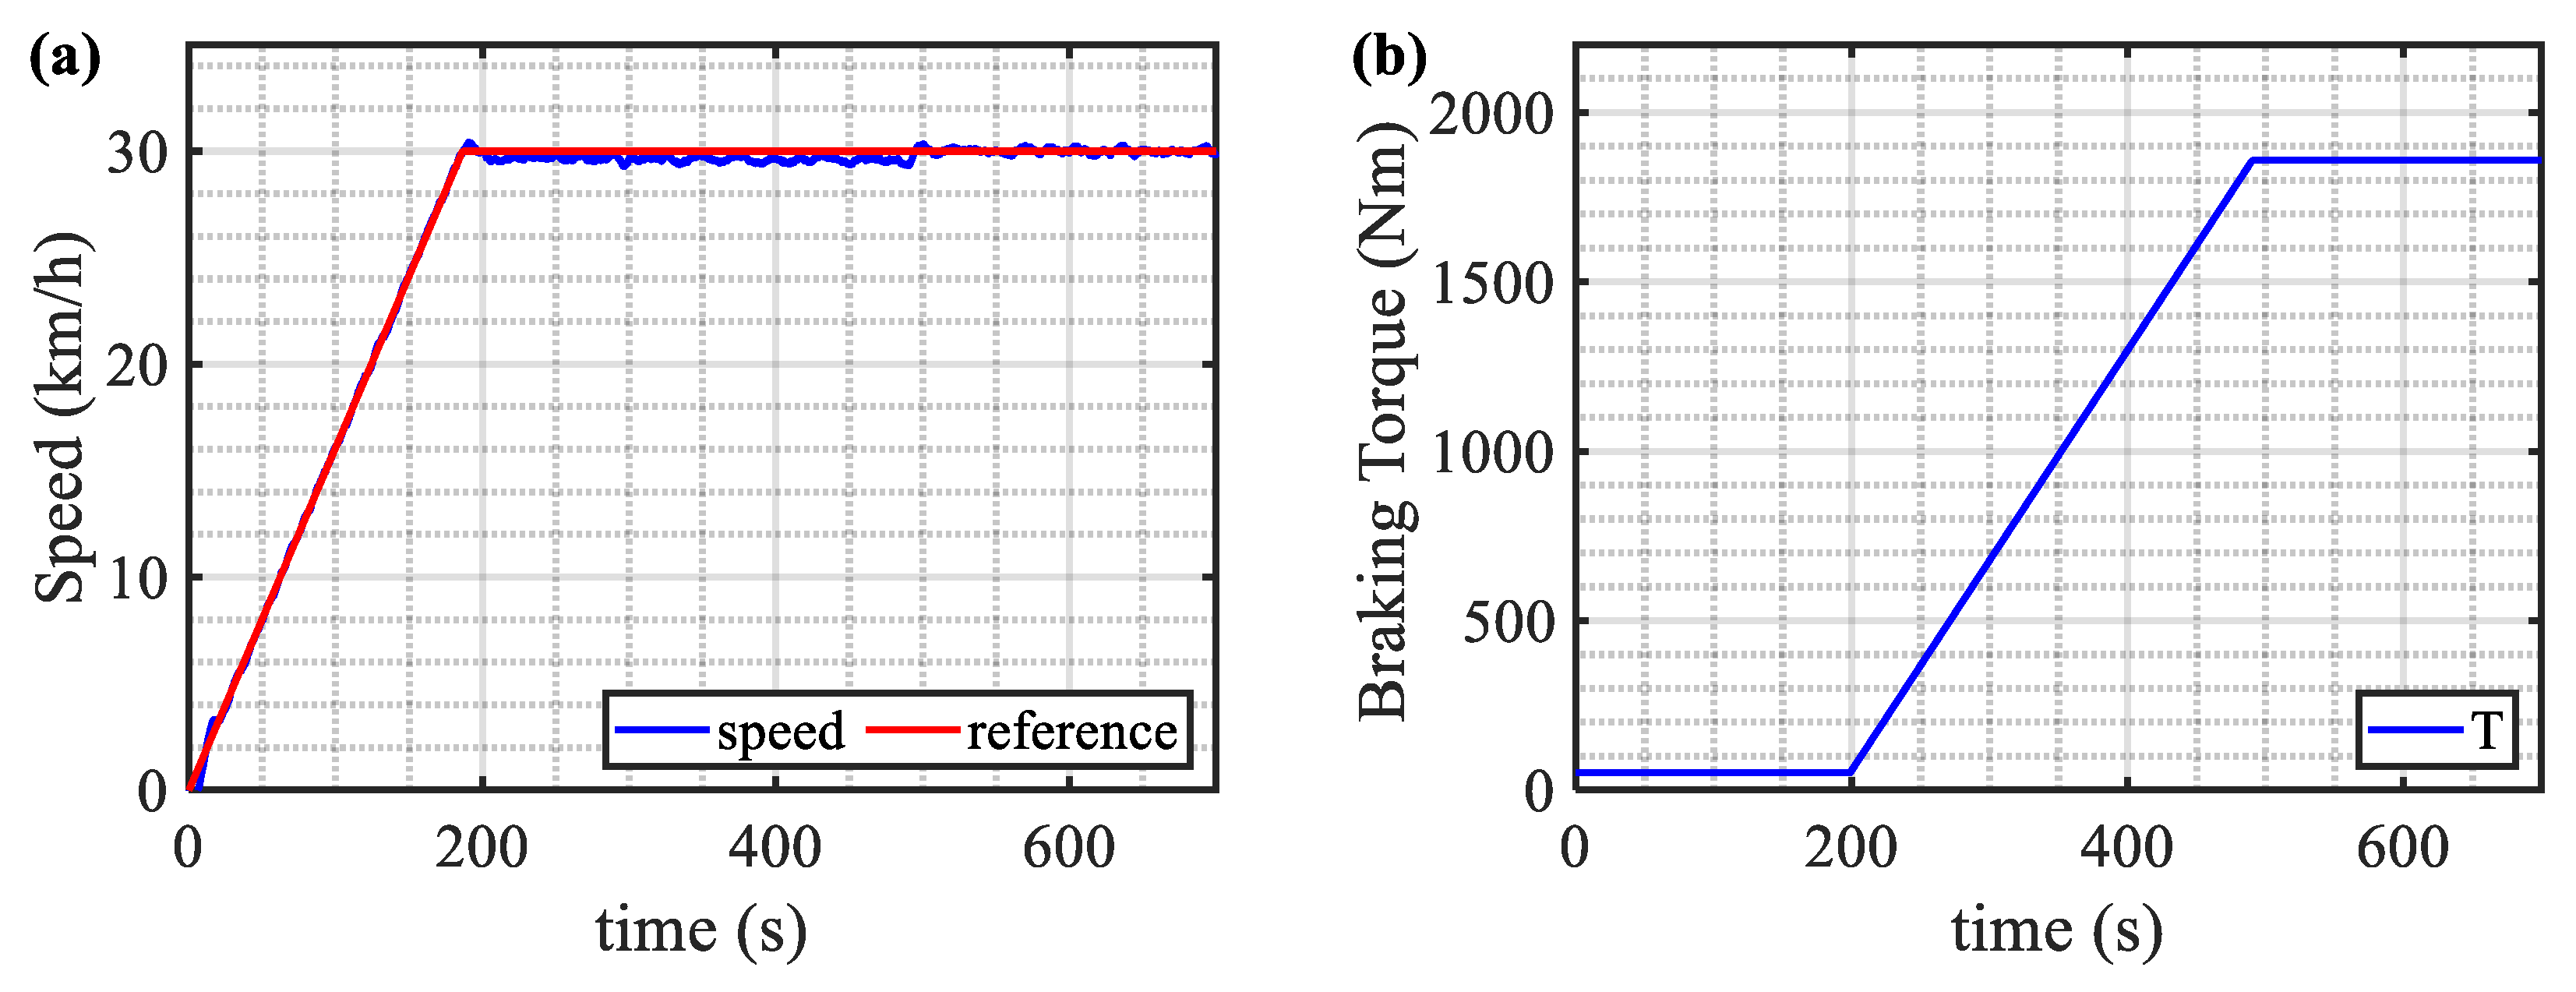
Considering the acceleration time, the climbing ability, and the maximum speed, the dynamic performances of the EVT and the EV were compared and analyzed. Acceleration time reflects the acceleration ability of the vehicle and is one of the most critical indicators of vehicle dynamic performance. The acceleration times from 0 to 100 km/h and 0 to 50 km/h for the EVT and the EV on a flat road with a slope of 0% are shown in Figure 17a,b, respectively. The acceleration times in the 4% road slope are shown in Figure 17c,d, and the acceleration times in the 6% road slope are shown in Figure 17e,f.
The acceleration times of the EVT and the EV are shown in Table 3.
Compared with the EV, the 0–100 km/h acceleration time of the EVT increased by 15.55% and the 0–50 km/h acceleration time increased by 32.29% on the level road. The 0–100 km/h acceleration time of the EVT increased by 17.64% and the 0–50 km/h acceleration time increased by 36.53% at the 4% road slope. At the 6% road slope, the 0–100 km/h acceleration time of the EVT increased by 19.11% and the 0–50 km/h acceleration time increased by 39.62%. In summary, the acceleration ability of the EVT was greatly improved, especially at 0–50 km/h. Specifically, it improved even more in climbing situations, and as the road slope increased, the improvement was more obvious. The maximum vehicle speeds of the EVT and the EV on the level roads and the maximum climbing slopes at a speed of 30 km/h, respectively, are shown in Table 4.
The maximum climbing slope of the EVT increased by 32.4% compared to the EV at a 30 km/h vehicle speed. The theoretical maximum speed of the EVT improved by 34%, compared to that of the EV. The above changes show that equipping with the 2DCT significantly improved the dynamic performance of pure electric vehicles.

4.3. Rig Testing

To prove the accuracy of the model and simulation, a test rig was used to verify the climbing ability of the EVT. The test rig consisted of a power supply, a motor, a transmission, wheels, flywheels, MCU, TCU, a magnetic powder brake, a host computer, etc. The structure of the test rig is shown in Figure 18 and Figure 19. The resistance of the vehicle when it was running is shown in Equation (18) and Equation (19), respectively.
F z = F f + F g + F a + F i
{ F f = m g f c o s α F g = m g s i n α F a = C d A 21.15 v 2 F i = δ m d v d t
where Fz, Ff, Fg, Fa, and Fi are the driving resistance, the rolling resistance, the slope resistance, the air resistance, and the acceleration resistance, respectively.
When the vehicle drove on a level road at a speed of 30 km/h, the driving resistance was 168 N and the torque on the wheels was 52 Nm. When the road slope became 36%, the driving resistance of the vehicle was 5994.9 N and the torque on the wheels was 1858.4 Nm.
The reference speed and the actual speed are shown in Figure 20a. The reference speed gradually increased from 0 to 30 km/h, reaching 30 km/h at 187 s. The test rig accelerated during the period from 0 to 187 s and the actual speed reached 30 km/h at 187 s. The torque curve of the magnetic powder brake is shown in Figure 20b. To simulate the resistance at 30 km/h, the braking torque of the magnetic powder brake was 52 Nm during the period from 0 to 200 s. Then, it increased during the period from 200 to 491 s and reached 1858.4 Nm at 491 s. From this moment, the test rig started to simulate the resistance of driving on a 36% slope road at a speed of 30 km/h. As can be seen from Figure 20, the test rig could drive normally.

5. Conclusions

In this paper, an EV equipped with a two-speed DCT was used as the research target to study the effect of the 2DCT on the performance of electric vehicles. A rule-based partitioned gear-shifting strategy was designed, which combined the economic shifting strategy with the dynamic shifting strategy. Fuzzy logic was introduced to modify the gear-shifting strategy online and was proven to be effective in reducing unnecessary shifts, thereby increasing driving comfort and transmission working life. The model of the EVT and the EV were established based on Matlab/Simulink. The motor working efficiency, the battery SOC curve, and the braking energy recovery were compared under three driving cycles of NEDC, UDDS and WLTC. The EVT outperformed the EV in all of these aspects. According to the research results, in a vehicle equipped with a two-speed transmission, the rotation speed of the motor can be adjusted by shifting gears, allowing the motor to work more effectively in both drive mode and brake recovery mode; thus, the EVT can achieve better economic performance. In addition, when the vehicle is running at a relatively low speed, the two-speed transmission stays in first gear with a larger ratio, which provides the vehicle with greater torque; therefore, the EVT has greater acceleration and climbing ability than the EV. When the vehicle speed is high, the transmission stays in second gear with a smaller ratio, which leads the vehicle to be able to reach a higher speed than that of the EV. With the support of the two-speed transmission, the EVT has better dynamic performance. Finally, the maximum climbing capacity of the EVT was verified by the rig test.
In the future, the effect of various shifting strategies on vehicle performance will be investigated. The impact of shifting jerk on driving comfort during high-speed shifts will also be investigated to further explore the value of two-speed transmissions for widespread use in EVs. In addition, the braking energy recovery strategy will be studied.

Author Contributions

Methodology, B.H.; software, B.H. and C.W. (Changyin Wei); validation, B.H. and Y.C.; formal analysis, X.L. and C.W. (Cong Wang); investigation, Q.W.; resources, Y.C.; data curation, B.H.; writing—original draft preparation, B.H. and X.L.; writing—review and editing, B.H. and X.L.; supervision, Y.C. All authors have read and agreed to the published version of the manuscript.

Funding

This research was funded by Hebei Province full-time introduction of high-end talent projects (NO. 20181228).

Conflicts of Interest

The authors declare no conflict of interest.

References

  1. Wei, C.Y.; Sun, X.X.; Chen, Y.; Zang, L.B.; Bai, S.J. Comparison of architecture and adaptive energy management strategy for plug-in hybrid electric logistics vehicle. Energy 2021, 230, 14. [Google Scholar] [CrossRef]
  2. Nguyen, C.T.; Walker, P.D.; Zhang, N. Shifting strategy and energy management of a two-motor drive powertrain for extended-range electric buses. Mech. Mach. Theory 2020, 153, 17. [Google Scholar] [CrossRef]
  3. Itani, K.; De Bernardinis, A.; Khatir, Z.; Jammal, A.; Oueidat, M. Regenerative Braking Modeling, Control, and Simulation of a Hybrid Energy Storage System for an Electric Vehicle in Extreme Conditions. IEEE Trans. Transp. Electrif. 2016, 2, 465–479. [Google Scholar] [CrossRef]
  4. Cai, W.; Wu, X.; Zhou, M.; Liang, Y.; Wang, Y. Review and Development of Electric Motor Systems and Electric Powertrains for New Energy Vehicles. Automot. Innov. 2021, 4, 3–22. [Google Scholar] [CrossRef]
  5. Sun, X.D.; Shi, Z.; Lei, G.; Guo, Y.G.; Zhu, J.G. Analysis and Design Optimization of a Permanent Magnet Synchronous Motor for a Campus Patrol Electric Vehicle. IEEE Trans. Veh. Technol. 2019, 68, 10535–10544. [Google Scholar] [CrossRef]
  6. Saw, L.H.; Ye, Y.H.; Tay, A.A.O. Integration issues of lithium-ion battery into electric vehicles battery pack. J. Clean Prod. 2016, 113, 1032–1045. [Google Scholar] [CrossRef]
  7. Lin, Q.F.; Niu, S.X.; Cai, F.B.; Fu, W.N.; Shang, L.K. Design and Optimization of a Novel Dual-PM Machine for Electric Vehicle Applications. IEEE Trans. Veh. Technol. 2020, 69, 14391–14400. [Google Scholar] [CrossRef]
  8. You, Y.; Sun, D.Y.; Qin, D.T. Shift strategy of a new continuously variable transmission based wheel loader. Mech. Mach. Theory 2018, 130, 313–329. [Google Scholar] [CrossRef]
  9. Puricelli, S.; Cardellini, G.; Casadei, S.; Faedo, D.; van den Oever, A.E.M.; Grosso, M. A review on biofuels for light-duty vehicles in Europe. Renew. Sust. Energ. Rev. 2021, 137, 19. [Google Scholar] [CrossRef]
  10. Hu, J.J.; Ran, H.L.; Pang, T.; Zhang, Y. Parameter design and performance analysis of shift actuator for a two-speed automatic mechanical transmission for pure electric vehicles. Adv. Mech. Eng. 2016, 8, 15. [Google Scholar] [CrossRef] [Green Version]
  11. Liang, J.; Walker, P.D.; Ruan, J.; Yang, H.T.; Wu, J.L.; Zhang, N. Gearshift and brake distribution control for regenerative braking in electric vehicles with dual clutch transmission. Mech. Mach. Theory 2019, 133, 1–22. [Google Scholar] [CrossRef]
  12. Hu, M.H.; Chen, L.; Wang, D.Y.; Xu, Z.F.; Xu, P.; Qin, D.T.; Zhou, A.J. Modeling and characteristic study of the shifting engagement process in stepped transmission. Mech. Mach. Theory 2020, 151, 12. [Google Scholar] [CrossRef]
  13. Qin, D.T.; Yao, M.Y.; Chen, S.J.; Lyu, S.K. Shifting Process Control for Two-Speed Automated Mechanical Transmission of Pure Electric Vehicles. Int. J. Precis. Eng. Manuf. 2016, 17, 623–629. [Google Scholar] [CrossRef]
  14. Zhu, B.; Zhang, N.; Walker, P.; Zhou, X.X.; Zhan, W.Z.; Wei, Y.Y.; Ke, N.J. Gear shift schedule design for multi-speed pure electric vehicles. Proc. Inst. Mech. Eng. Part D J. Automob. Eng. 2015, 229, 70–82. [Google Scholar] [CrossRef]
  15. He, H.W.; Han, M.; Liu, W.; Cao, J.F.; Shi, M.; Zhou, N.N. MPC-based longitudinal control strategy considering energy consumption for a dual-motor electric vehicle. Energy 2022, 253, 16. [Google Scholar] [CrossRef]
  16. Gao, B.Z.; Liang, Q.; Xiang, Y.; Guo, L.L.; Chen, H. Gear ratio optimization and shift control of 2-speed I-AMT in electric vehicle. Mech. Syst. Signal Proc. 2015, 50-51, 615–631. [Google Scholar] [CrossRef]
  17. Jeoung, D.; Min, K.H.; Sunwoo, M. Automatic Transmission Shift Strategy Based on Greedy Algorithm Using Predicted Velocity. Int. J. Automot. Technol. 2020, 21, 159–168. [Google Scholar] [CrossRef]
  18. Lin, C.; Zhao, M.J.; Pan, H.; Yi, J. Blending gear shift strategy design and comparison study for a battery electric city bus with AMT. Energy 2019, 185, 1–14. [Google Scholar] [CrossRef]
  19. Shen, W.C.; Yu, H.L.; Hu, Y.H.; Xi, J.Q. Optimization of Shift Schedule for Hybrid Electric Vehicle with Automated Manual Transmission. Energies 2016, 9, 220. [Google Scholar] [CrossRef] [Green Version]
  20. Saini, V.; Singh, S.; Nv, S.; Jain, H. Genetic Algorithm Based Gear Shift Optimization for Electric Vehicles. SAE Int. J. Altern. Powertrains 2016, 5, 348–356. [Google Scholar] [CrossRef]
  21. Liu, Y.G.; Gao, D.K.; Zhai, K.N.; Huang, Q.; Chen, Z.; Zhang, Y. Coordinated control strategy for braking and shifting for electric vehicle with two-speed automatic transmission. eTransportation 2022, 13, 16. [Google Scholar] [CrossRef]
  22. Nguyen, C.T.; Walker, P.D.; Zhang, N. Optimization and coordinated control of gear shift and mode transition for a dual-motor electric vehicle. Mech. Syst. Signal Proc. 2021, 158, 18. [Google Scholar] [CrossRef]
  23. Xu, X.; Liang, J.; Hao, Q.; Dong, P.; Wang, S.; Guo, W.; Liu, Y.; Lu, Z.; Geng, J.; Yan, B. A Novel Electric Dual Motor Transmission for Heavy Commercial Vehicles. Automot. Innov. 2021, 4, 34–43. [Google Scholar] [CrossRef]
  24. Granovskii, M.; Dincer, I.; Rosen, M.A. Economic and environmental comparison of conventional, hybrid, electric and hydrogen fuel cell vehicles. J. Power Sources 2006, 159, 1186–1193. [Google Scholar] [CrossRef]
  25. Li, K.B.; Bouscayrol, A.; Han, S.L.; Cui, S.M. Comparisons of Electric Vehicles Using Modular Cascade Machines System and Classical Single Drive Electric Machine. IEEE Trans. Veh. Technol. 2018, 67, 354–361. [Google Scholar] [CrossRef]
  26. Ragheb, H.; Aydin, M.; El-Gindy, M.; Kishawy, H.A. Comparison of gradability performance of fuel cell hybrid electric and internal-combustion engine vehicles. J. Power Sources 2013, 221, 447–454. [Google Scholar] [CrossRef]
  27. Wu, J.L.; Liang, J.J.Y.; Ruan, J.G.; Zhang, N.; Walker, P.D. Efficiency comparison of electric vehicles powertrains with dual motor and single motor input. Mech. Mach. Theory 2018, 128, 569–585. [Google Scholar] [CrossRef]
  28. Spanoudakis, P.; Tsourveloudis, N.C.; Doitsidis, L.; Karapidakis, E.S. Experimental Research of Transmissions on Electric Vehicles’ Energy Consumption. Energies 2019, 12, 388. [Google Scholar] [CrossRef] [Green Version]
  29. Li, X.Y.; Yuan, C.G.; Wang, Z.P.; He, J.T.; Yu, S.K. Lithium battery state-of-health estimation and remaining useful lifetime prediction based on non-parametric aging model and particle filter algorithm. eTransportation 2022, 11, 11. [Google Scholar] [CrossRef]
  30. Li, X.Y.; Yuan, C.G.; Wang, Z.P.; Xie, J.L. A data-fusion framework for lithium battery health condition Estimation Based on differential thermal voltammetry. Energy 2022, 239, 13. [Google Scholar] [CrossRef]
  31. Li, L.; Li, X.J.; Wang, X.Y.; Song, J.; He, K.; Li, C.F. Analysis of downshift’s improvement to energy efficiency of an electric vehicle during regenerative braking. Appl. Energy 2016, 176, 125–137. [Google Scholar] [CrossRef]
  32. Kim, S.; Oh, J.; Choi, S. Gear shift control of a dual-clutch transmission using optimal control allocation. Mech. Mach. Theory 2017, 113, 109–125. [Google Scholar] [CrossRef]
  33. Xu, C.; Geyer, S.; Fathy, H.K. Formulation and Comparison of Two Real-Time Predictive Gear Shift Algorithms for Connected/Automated Heavy-Duty Vehicles. IEEE Trans. Veh. Technol. 2019, 68, 7498–7510. [Google Scholar] [CrossRef]
  34. Huang, R.C.; He, H.W.; Zhao, X.Y.; Wang, Y.L.; Li, M.L. Battery health-aware and naturalistic data-driven energy management for hybrid electric bus based on TD3 deep reinforcement learning algorithm. Appl. Energy 2022, 321, 15. [Google Scholar] [CrossRef]
Figure 1. Configurations of EVT and EV: (a) EVT; (b) EV.
Energies 16 03007 g001
Figure 2. Equivalent circuit of the battery.
Energies 16 03007 g002
Figure 3. (a) Internal resistance of the battery; (b) open circuit of the voltage of the battery.
Energies 16 03007 g003
Figure 4. Motor efficiency map: (a) 3-D efficiency map; (b) Contour efficiency map.
Energies 16 03007 g004
Figure 5. 2DCT transmission structure schematic diagram.
Energies 16 03007 g005
Figure 6. Economic shifting strategy: (a) motor efficiency curves; (b) economic shift curves.
Energies 16 03007 g006
Figure 7. Dynamic shifting strategy: (a) vehicle acceleration curves; (b) dynamic shift curves.
Energies 16 03007 g007
Figure 8. Membership functions of the input and output variables in fuzzy rules of economic shifting strategy.
Energies 16 03007 g008
Figure 9. Characteristic maps of fuzzy logic in economic shifting strategy: (a) Fuzzy logic for speed, acceleration and adjustment; (b) Fuzzy logic for pedal opening, acceleration and adjustment.
Energies 16 03007 g009
Figure 10. Membership functions of the input and output variables in fuzzy rules of dynamic shifting strategy.
Energies 16 03007 g010
Figure 11. Characteristic maps of fuzzy logic in dynamic shifting strategy: (a) Fuzzy logic for speed, pedal change rate and adjustment; (b) Fuzzy logic for pedal opening, pedal change rate and adjustment.
Energies 16 03007 g011
Figure 12. Control system framework.
Energies 16 03007 g012
Figure 13. Vehicle speed tracking and gearshifts trajectories: (a) NEDC driving cycle; (b) Gear position; (c) UDDS driving cycle; (d) Gear position; (e) WLTC driving cycle; (f) Gear position.
Energies 16 03007 g013
Figure 14. Motor efficiency in three driving cycles: (a) Efficiency under NEDC driving cycle; (b) Efficiency under UDDS driving cycle; (c) Efficiency under WLTC driving cycle.
Energies 16 03007 g014
Figure 15. Battery SOC curves in three driving cycles: (a) NEDC driving cycle; (b) UDDS driving cycle; (c) WLTC driving cycle.
Energies 16 03007 g015
Figure 16. Braking recovery energy curves in three driving cycles: (a) NEDC driving cycle; (b) UDDS driving cycle; (c) WLTC driving cycle.
Energies 16 03007 g016
Figure 17. Acceleration time at different road slopes: (a) Acceleration time from 0 to 100 km/h at 0% slope; (b) Acceleration time from 0 to 50 km/h at 0% slope; (c) Acceleration time from 0 to 100 km/h at 4% slope; (d) Acceleration time from 0 to 50 km/h at 4% slope; (e) Acceleration time from 0 to 100 km/h at 6% slope; (f) Acceleration time from 0 to 50 km/h at 6% slope.
Energies 16 03007 g017
Figure 18. Testing rig.
Energies 16 03007 g018
Figure 19. Testing rig composition frame.
Energies 16 03007 g019
Figure 20. Test conditions and results: (a) Vehicle speed tracking; (b) Brake torque trajectory.
Energies 16 03007 g020
Table 1. The parameters of EVT and EV.
ItemParameterUnitValue
VehicleVehicle mass (EVT)kg1758
Vehicle mass (EV)kg1730
Rolling resistance coefficient 0.0083
Rotating mass conversion factor 1.08
Air resistance coefficient 0.28
Vehicle frontal aream22.1
Dynamic radius of the wheelm0.31
BatteryRated capacityAh88.24
Battery voltageV340
MotorPeak powerkw110
Peak speedr/min12,000
Peak torqueNm230
TransmissionFirst gear ratio 3
Second gear ratio 1.19
Final DriveFinal drive ratio (EVT) 3.91
Final drive ratio (EV) 8.28
Table 2. The final value of battery SOC and braking energy recovery.
Drive CycleVehicle TypeFinal SOC (%)Braking Recovery Energy (kJ)
NEDCEVT65.89578.69
EV65.88572.64
UDDSEVT65.47908.43
EV65.38844.60
WLTCEVT60.161131.90
EV59.97957.15
Table 3. Acceleration times of EVT and EV.
SlopeVehicle Type0~100 km/h (s)0~50 km/h (s)
0%EVT9.453.72
EV11.195.48
4%EVT10.974.17
EV13.326.57
6%EVT11.984.45
EV14.817.37
Table 4. Maximum climbing slopes and vehicle speeds of EVT and EV.
Vehicle TypeMax SlopeMax Speed
EVT36%228 km/h
EV25%169 km/h
Disclaimer/Publisher’s Note: The statements, opinions and data contained in all publications are solely those of the individual author(s) and contributor(s) and not of MDPI and/or the editor(s). MDPI and/or the editor(s) disclaim responsibility for any injury to people or property resulting from any ideas, methods, instructions or products referred to in the content.

