Article

Experimental and CFD Investigation of Fuel Mixing in an Optical-Access Direct-Injection NG Engine and Correlation with Test Rig Combustion and Performance Data

1
Energy Department, Politecnico di Torino, 10129 Torino, Italy
2
AVL List GmbH, 8020 Graz, Austria
*
Authors to whom correspondence should be addressed.
Energies 2023, 16(7), 3004; https://doi.org/10.3390/en16073004
Submission received: 20 February 2023 / Revised: 18 March 2023 / Accepted: 21 March 2023 / Published: 25 March 2023
(This article belongs to the Special Issue Experiments and Simulations of Combustion Process)

Abstract

:
The present paper is the result of a cooperation between Politecnico di Torino and AVL List Gmbh within a recent collaborative research project funded by the EC. The research work was focused on the experimental and numerical characterization of mixture formation, combustion, and emissions in direct-injection NG engines, to draw useful indication for the design of innovative, high-performance engine concepts. As a matter of fact, direct-injection IC engines running on NG are believed to be a competitive transition solution towards a sustainable mobility scenario, given their maturity, technological readiness, and flexibility with respect to the fuel quality. Moreover, gaseous-fuel engines can further decrease their carbon footprint if blending of natural gas with hydrogen is considered. Provided that mixture formation represents a key aspect for the design of direct-injection engines, the activity presented in this paper is focused on the characterization of NG injection and on the mixing process, as well as the impact these latter hold on the combustion process as well as on engine-out emissions. The mixture formation process was analyzed by means of combined CFD and optical investigations. Furthermore, a full version of the engine was tested on a dynamic test rig, providing quantitative information on the engine performance and emission characteristics. The CFD results highlighted the correlation between the mixture homogeneity and the combustion stability and hinted at a relevant impact of the jet characteristics on the air charge tumble and turbulence characteristics.

1. Introduction

The recent agreement reached in Paris in 2015 set a challenging goal regarding the transition to ‘net-zero’ CO2 emissions in the next few decades [1]. One of the most challenging aspects is that a ‘net-zero’ scenario on a planet perspective would imply that some area in the world, or some specific energy-consumption sectors, would have to compensate the persisting CO2 emission in other sectors or areas through carbon capture and storage. The continuous increase in the energy-demanding human activities (transportation, industry, heating, and air-conditioning systems) requires a further, general increase in the efficiency of the systems.
With specific reference to the transportation sector, in the past decades natural gas (NG) has been used as an alternative fuel to reduce its overall carbon footprint. As a matter of fact, the use of natural gas as a fuel for transport application has long been based on retrofitting of gasoline engines [2]. One of the positive aspects of NG with respect to gasoline is due to its gaseous nature, which leads to a reduction in THC and CO thanks to a more favorable mixing process with the intake air [3]. On the other hand, the lower fuel density, the lack of refrigerating effect from fuel evaporation, and the higher stoichiometric A/F ratio determine a penalty of around 15–20% of engine torque and power [2,4]. These limitations can be overcome by the design of dedicated, monofuel, NG engines, which can assume higher compression ratio (CR) and turbocharging levels with respect to gasoline [5,6]. In fact, increasing the density of the induced air makes up for the detriment in volumetric efficiency provoked by the gaseous fuel state, whereas the increase in CR further reduces the CO2 footprint of the engine. Besides, the development of NG-optimized engines recently embedded other technologies, such as Variable Valve Actuation (VVA), lean-burn mixtures, direct injection, and have promoted the market share of NG vehicles.
The adoption of VVA allows for a dethrottling of the SI engine, which is beneficial for fuel consumption reduction, as well as internal EGR for NOx control [7]. The principal benefits of a lean-burn operating strategy consist of an apparent reduction in CO2 and NOx emissions. However, lean operation is normally restricted, by the lean operation limit of the engine [8]. The latter is dependent on the fuel properties and on the burning rate enhancement provided by the in-cylinder turbulence. As stated above, natural gas has superior lean-burn capability compared with gasoline; however, it usually does not guarantee a stable operation with homogeneous mixture with relative air-to-fuel ratio λ beyond 1.6. Several studies have been published in recent years, focusing on the enhancement of lean-burn and EGR-diluted combustion processes in SI engines, which are mainly based on the tumble-oriented intake ports or valve masking [9,10,11]. The direct-injection technology, which is well-established for gasoline-fueled SI engines, can be used to further increase the performance and fuel economy of NG ones. Adopting DI leads to advantages in terms of volumetric efficiency, especially for late injection timings, and to an increase in the turbulence level, which is due to the dissipation of the very high kinetic energy of the gaseous fuel jet [12,13,14,15]. A few solutions, which have been studied recently, have proven to help further enhance the benefits of advanced lean-burn-based combustion concepts, namely: hydrogen blending and pre-chamber engines. In detail, the very high laminar burning speed of hydrogen leads to an increase in the combustion stability and, thus, to an extended lean-burn limit [16,17,18]. Moreover, the reduced carbon content of the fuel intrinsically constitutes a step towards decarbonization. Prechamber-based combustion concepts have recently been considered as possible solutions to promote the lean and ultra-lean engine operation. With a limited increase in the engine cost, very good combustion and emissions results have been obtained by running with lambda levels up to almost 2.5 [19].
Internal combustion engines are predicted to continue serving as the dominant technical solution until 2040 [20]. The recent decision from the EU to ban any new car whose propulsion system emits CO2 is expected to have an impact on the passenger car and van market in the mid- or long-term perspective. On the other hand, the transition towards a sustainable, carbon-free, energy scenario can only be achieved if a proper mix of alternative fuels and breakthrough technologies is found [1]. In this framework, alternative fuels with limited CO2 footprint have been investigated and progressively introduced into the market. It is worth pointing out that, according to NGVA, more than 55,000 gas-fueled passenger cars were registered in 2020, along with more than 3000 buses and 6000 trucks [21]. In the same year, the number of CNG filling stations increased by 8%. While most of the NG engines on the market have remained gasoline-compliant, mainly due to issues concerned with the gas distribution infrastructure, the development of high-performance, direct-injection, high-compression engines remains promising. In fact, they can be the technology lever towards the development of high-performance and efficient hydrogen-fueled engines [22].
The present paper is aimed at characterizing the mixture formation process in high-performance direct-injection engines running on NG, through both experimental and CFD investigations. The qualitative and quantitative information about this process are also correlated with the performance and emission data from the test rig. The present paper is complementary to [23] and presents significant advances in both experimental data post-processing and model results. Both papers contribute to fill the gap in the literature, concerning the potential of the combination of several innovative solution in one engine (high structural integrity and compression ratio, advanced boost control, VVA, and direct injection). The application of a piezo-actuated outward-opening poppet-valve injector has been considered in quite few publications in the literature, to the best authors’ knowledge. In addition, the combined CFD, optical, and performance investigations allowed a comprehensive analysis of mixing, combustion, and pollutant formation processes to be carried out.

2. Present Work

The research work presented in this paper was carried out by AVL List GmbH (Graz, Austria) and the Energy Department of Politecnico di Torino (Torino, Italy) within the H2020 Collaborative project Gason [24]. The first outcomes of such activity were published in [23].
The research activity described in the present paper was organized as follows.
  • With reference to a first design variant for the direct-injection engine (‘Engine 1’), the mixture formation was characterized by means of both experimental and simulation activities;
  • The experimental campaign results were used as reference for a semi-quantitative CFD model validation, and provided a significant insight into the mixture formation process. Additional experimental data for the injector model validation were provided by BorgWarner within the Gason research project;
  • The results from CFD and experimental analyses were correlated to the engine performance data from the dyno test rig, substantiating the obtained indications and providing direction for injection and combustion optimization;
  • A second engine variant was considered (‘Engine 2’), in which the charge motion and gas injection was characterized and compared with ‘Engine 1’.

3. Test Engines and Experimental Setup

The ‘Engine 1’ considered in this paper is a 4-cylinder, in-line, monofuel engine equipped with an electro-hydraulic VVA system. The VVA system was introduced to de-throttle the engine and to perform cylinder scavenging when necessary. Moreover, the specific intake valve lift profile at each operating point is optimized to support the turbocharger with sufficient engine flow to deliver requested boost, and to improve the compressor working point and hence its efficiency. While the full CNG capabilities may not be exploited in typical gasoline/CNG bi-fuel engines, due to the restrictions introduced by the gasoline operation mode, the engine compression ratio of the monofuel engine was increased to CR = 13.0 and peak pressure resistance was increased, to take advantage of the superior knock resistance of NG compared with gasoline. The engine was procured in two different versions, namely, a full multicylinder engine (MCE) version for the performance and emission characterization at the test rig, and a single cylinder engine (SCE), with optical access, for the planar laser-induced fluorescence (PLIF) investigation of fuel injection and its mixing with air. A second engine variant (‘Engine 2’) was also considered in the last part of the project, in order to compare the mixture formation process in the presence of a different injection orientation. The full specifications of the engine variants can be found in Table 1.
The main geometric characteristics of the two concepts are represented in Figure 1. More specifically, for both ‘Engine 1’ and ‘Engine 2’, the fist column shows the side view of the combustion chamber, and the second one shows the same chamber in a view from bottom.
Both engine concepts are derived from a production PFI natural gas design. ‘Engine 1’ features a side-injector concept with a flat injector axis inclination, which is typically used for gasoline DI engines, as well as a low–mid tumble design. This choice was motivated by the consideration that the high jet velocity would itself have generated the necessary turbulence intensity, for a good combustion quality. Instead, ‘Engine 2’ features an intake-valve masked geometry for the tumble enhancement, and a much steeper injector orientation. The injector is the same in both the engine solutions and was designed and procured by BorgWarner. It features an outward-opening needle, which is necessary to provide high volume flow rates and to avoid uncontrolled injector opening due to high in-cylinder pressures.
The opportunity to perform experimental activity on fuel injection and mixture formation in the DI engine required the specific design of a SCE prototype, which is represented in Figure 2 and differs from the full MCE mainly in what follows:
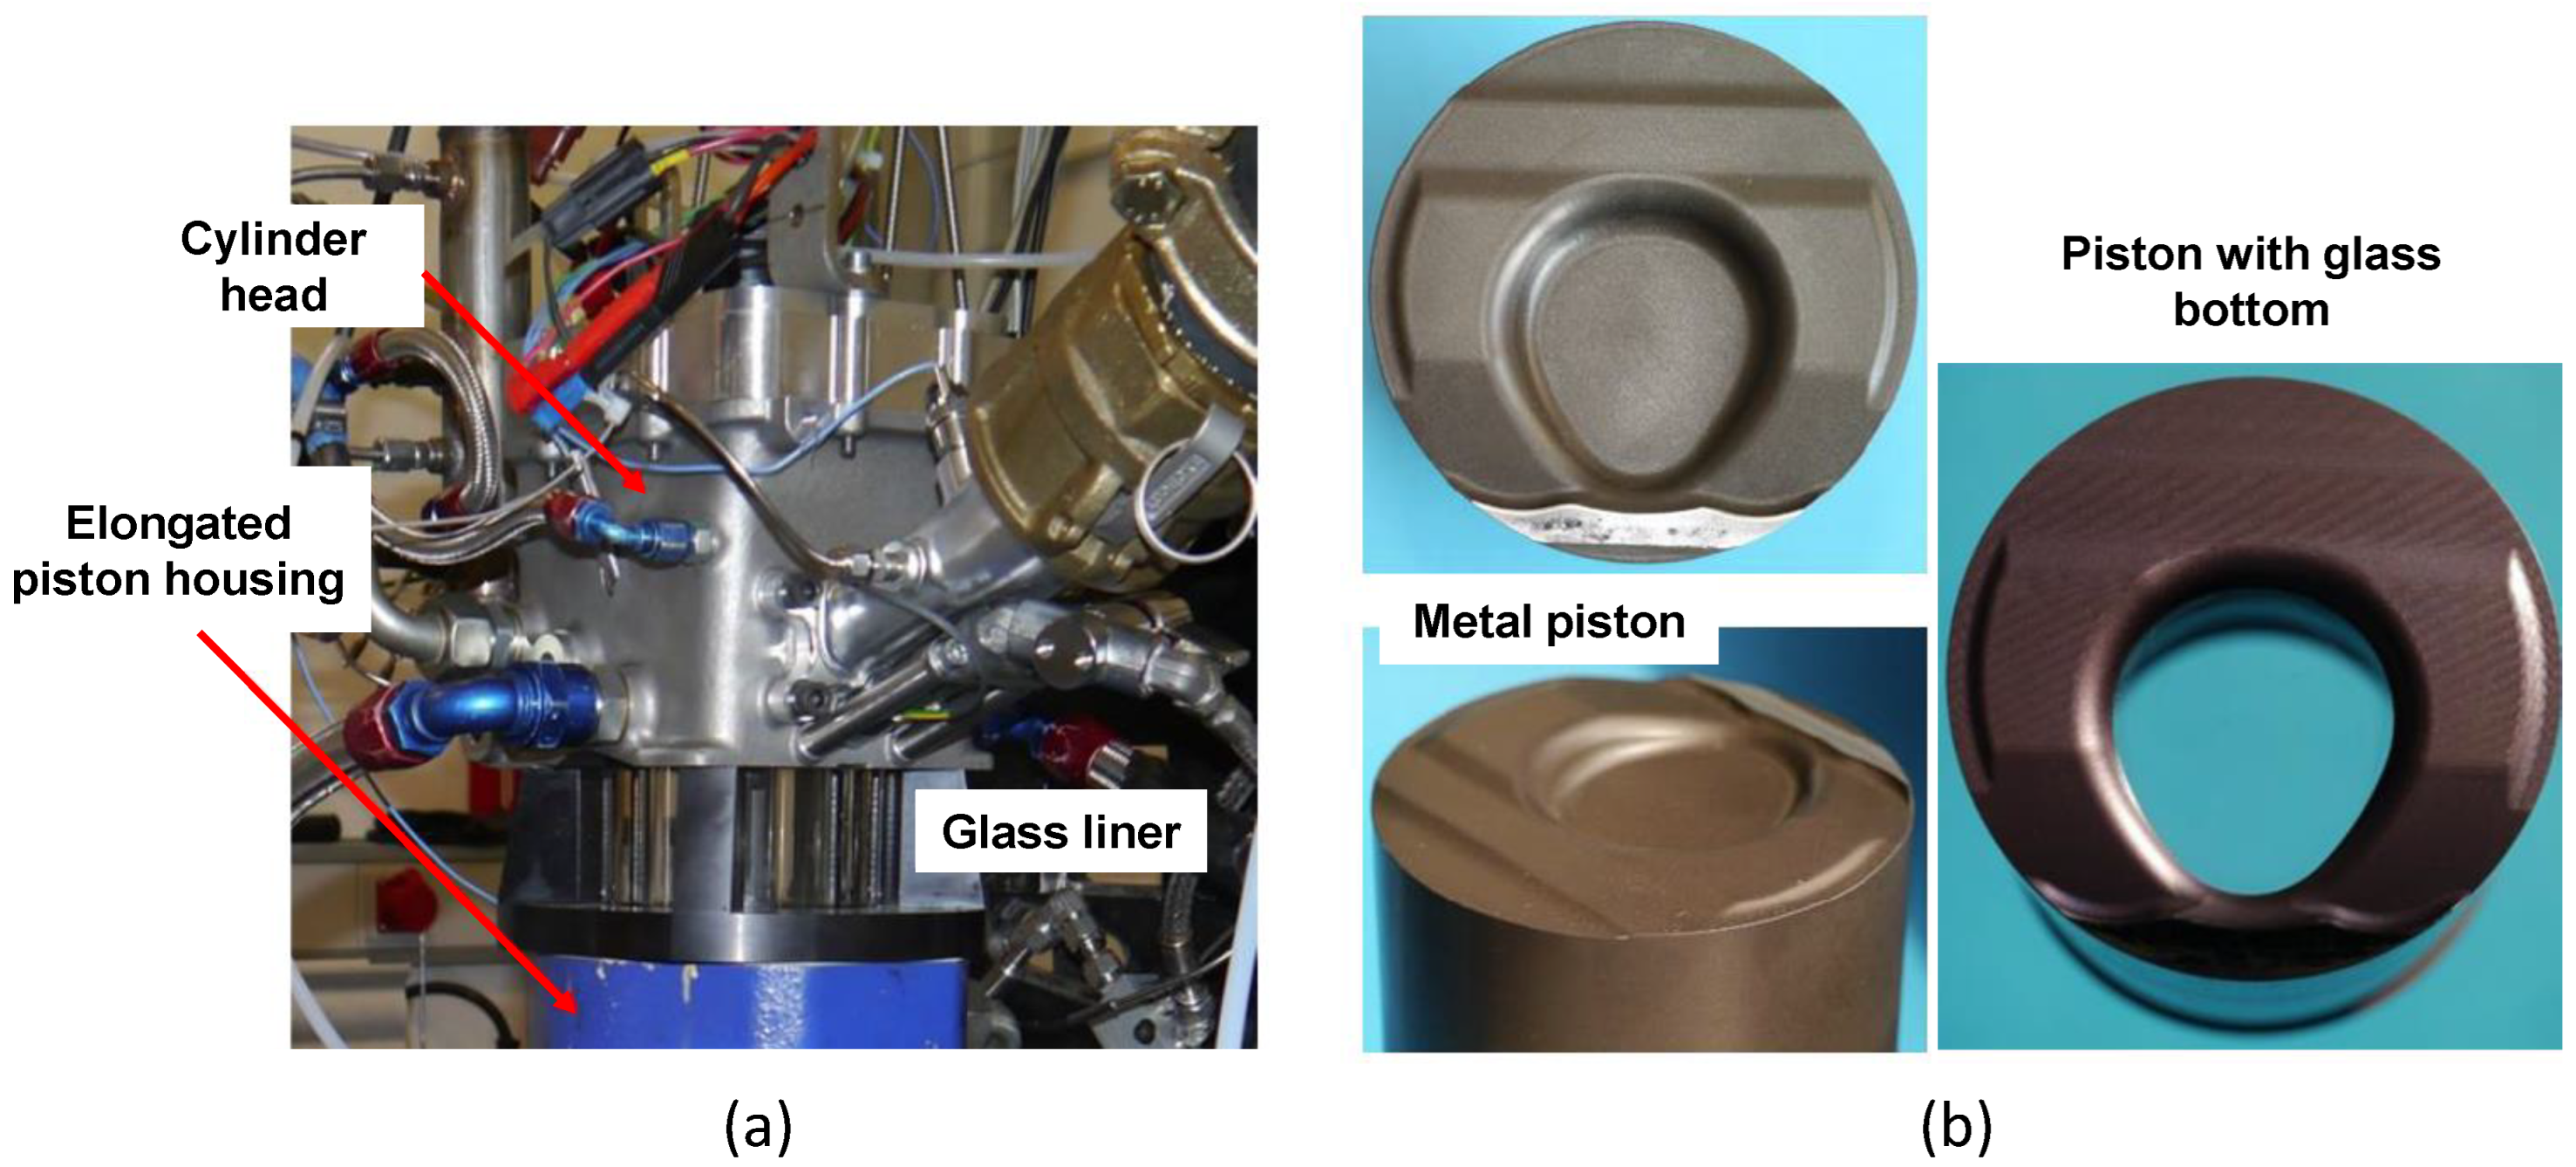
  • Replacement of the metallic liner, along with the cooling jacket and the external block with a transparent fused-silica one, in order to allow the lateral optical access (Figure 2a);
  • Design of a new piston with a glass surface, in order to allow optical access along the cylinder axis (Figure 2b);
  • Design and procurement of three different intake camshafts in order to replace and mimic the valve lift profiles of the fully flexible VVA system in different working conditions. A low-load, a medium load, and a full load configuration were identified;
  • Reduction in the CR from 13 to 11 (see Table 1), due to the increase in the top land volume of the transparent engine, compared with the MCE;
  • Reduction in the spark timing actuation at high load, in order to decrease the mechanical stresses on piston and liner.
The jet evolution and mixture formation processes were experimentally investigated in an optically accessible engine with the planar LIF technique [25]. A full description of the experimental setup can be found in [23]. A double-sided planar laser is used at AVL, in order to reduce the shadow zones due to the piston presence, especially at late crank angles. The test bench for the optical analysis is represented in Figure 3, whereas its main features are reported in Table 2.

4. Post-Processing Techniques for Experimental PLIF Images

LIF intensity is supposed to be directly associated with local fuel concentration [25]. The acquired images are in a grayscale, representing the relative signal intensity that depends on signal intensification and analog-to-digital conversion of the camera sensor. In particular, TMA has well-characterized photophysical properties and, similarly to the tri-ethylamine (TEA) LIF signal, shows a linear correlation between the detected intensity scale and the mixture equivalence ratio at given pressure and temperature (i.e., at each engine crank angle) [26,27,28,29]. However, the raw images actually include noise and distortion effects, such as the presence of a background luminosity level, the reflection of laser and/or PLIF light on metal and glass surfaces, the intrinsic shot-to-shot laser energy variation. Consequently, a suitable post-processing method is necessary. In this project, Politecnico di Torino and AVL proposed two complementary methods for the signal processing, which account for those previously mentioned.

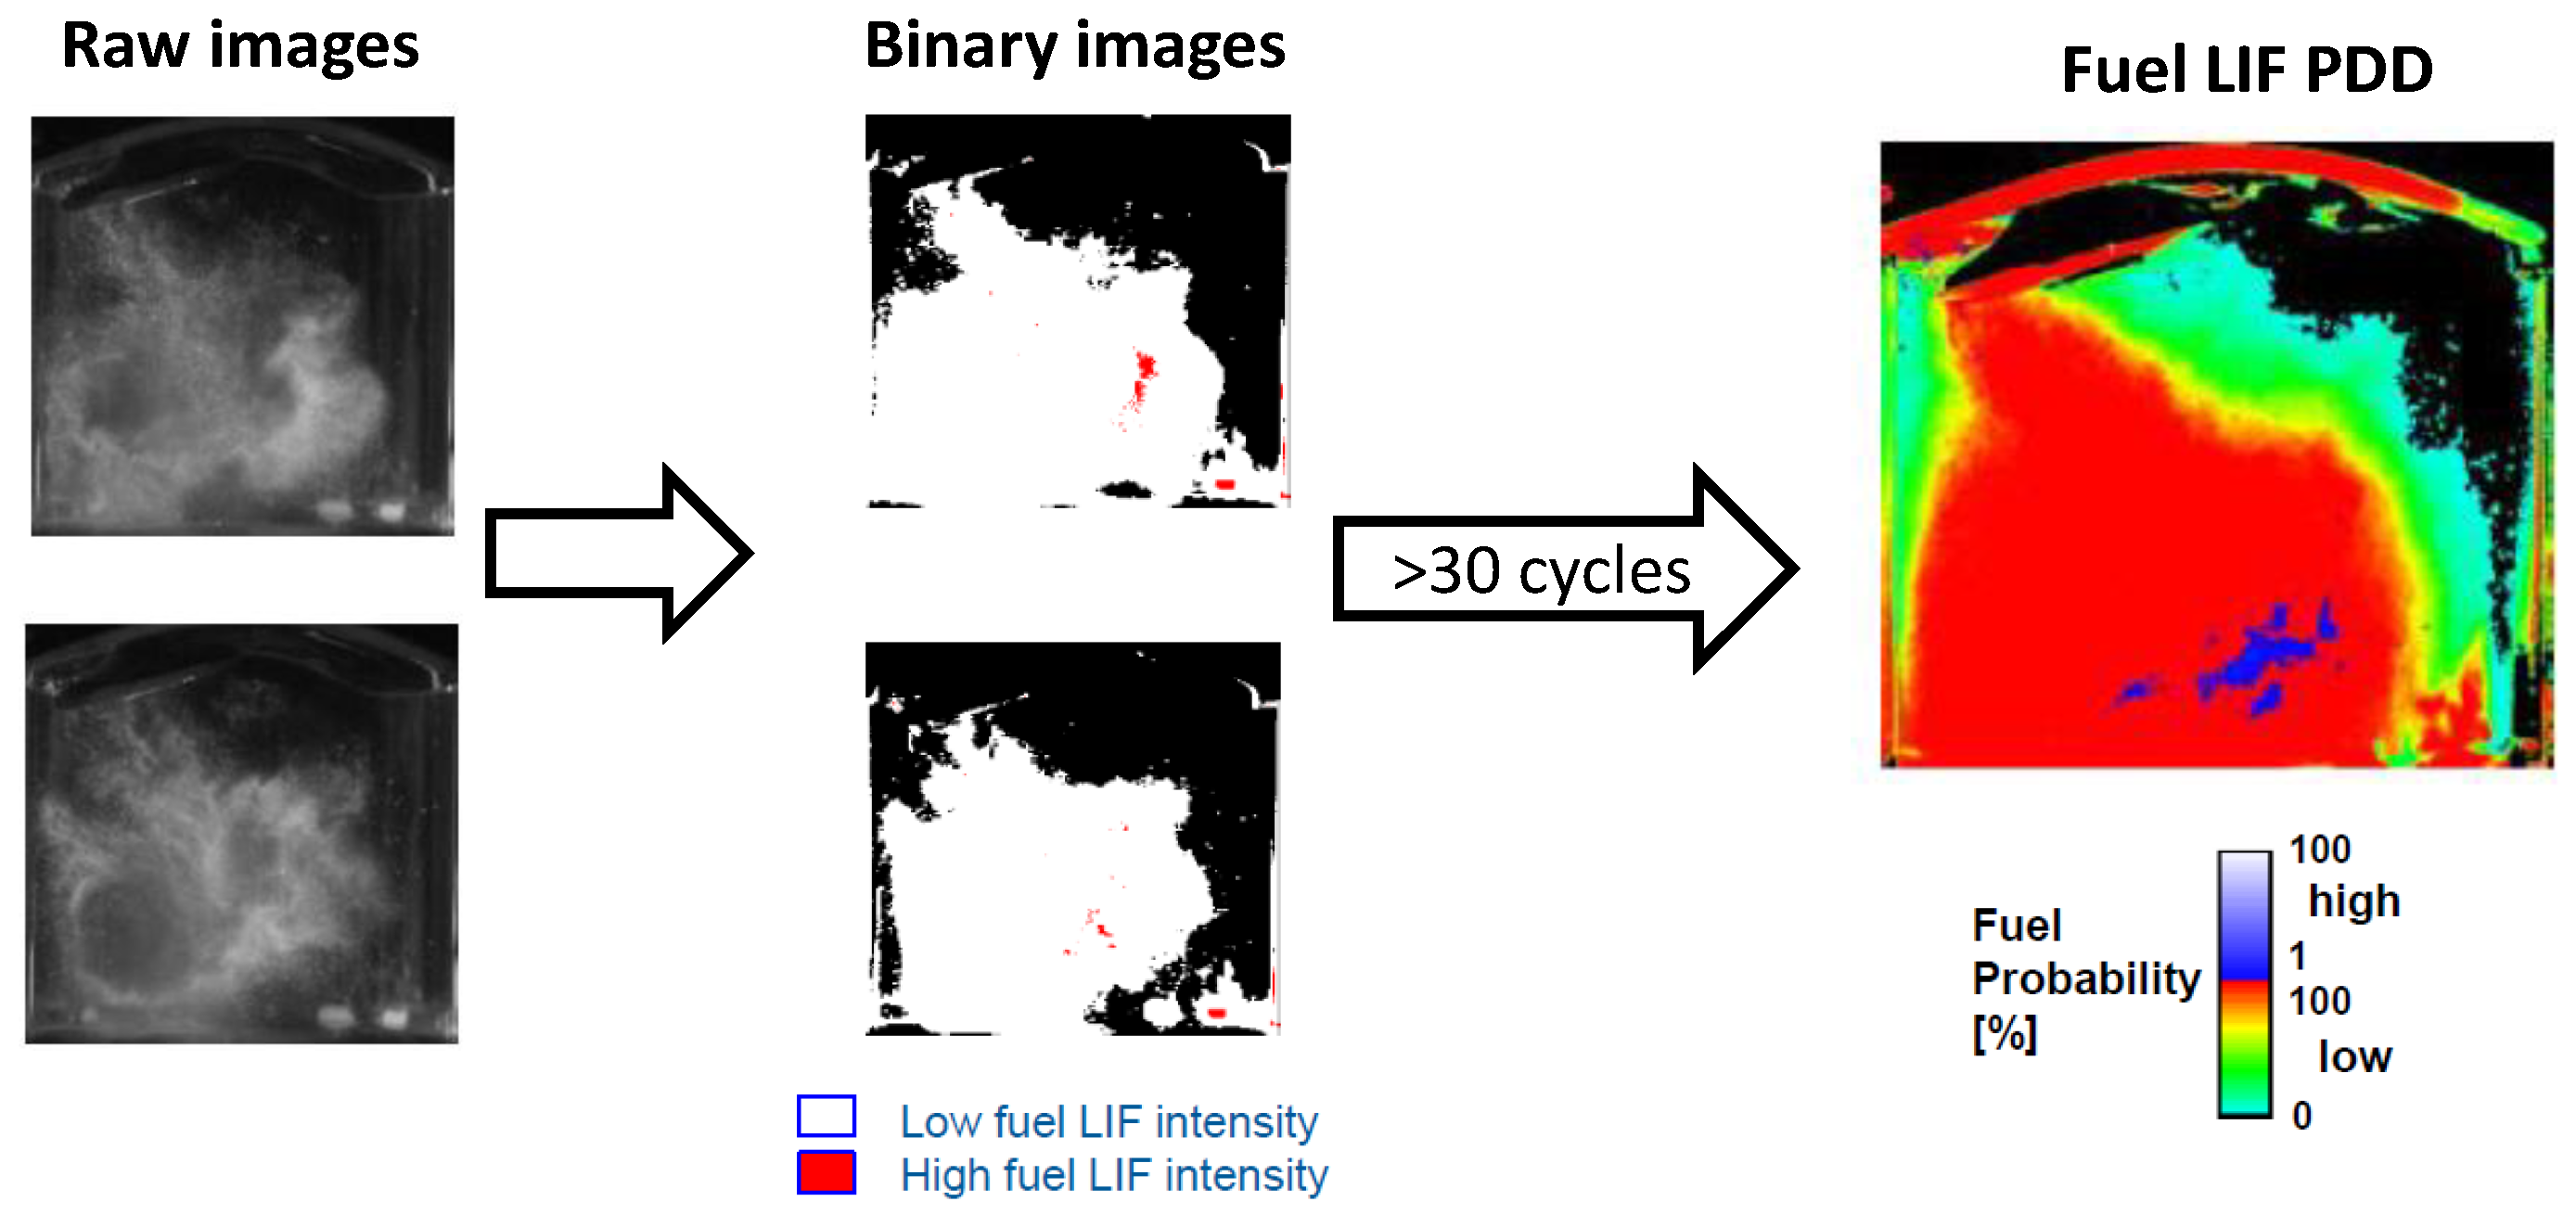
4.1. Statistical Post-Processing

The simplest, fastest, and most straightforward post-processing is the ‘statistical evaluation methodology’, which has been established in AVL since 2004, and has also been used during several integrated or collaborative projects funded by the EC. The basic idea behind this procedure is to post-process each single picture, thus preserving the possibility to obtain information on the cycle-to-cycle behavior of the jet and the mixing process. On the other hand, as is discussed later, it is not possible to extract quantitative information on the local mixture composition. The procedure is based on the definition of three luminosity thresholds and, correspondingly, two ranges: a low-intensity range (between threshold 1 and 2), and a high-intensity range (between threshold 2 and 3). The definition of such ranges allows a corresponding ‘binarized’ image to be defined from each raw picture. A statistical analysis over 30 to 40 cycles finally produces a map of fuel concentration probability, connected to each of the two intensity ranges. The above process is described in Figure 4.
The fuel probability distribution in Figure 4 is an effective means to represent the evolution of the mixture formation process, despite the lack of a quantitative relation with the local fuel concentration. It is worth mentioning that the upper range (high intensity) is only exploited during the injection process, in the vicinity of the nozzle location. Most of the spray region is characterized by a level which is close to the threshold 2 (orange-to-red color). The ‘transition’ between the spray region and the surrounding air is represented by the cyan–green area, and is an indication of the average cycle-to-cycle fluctuation of the jet.

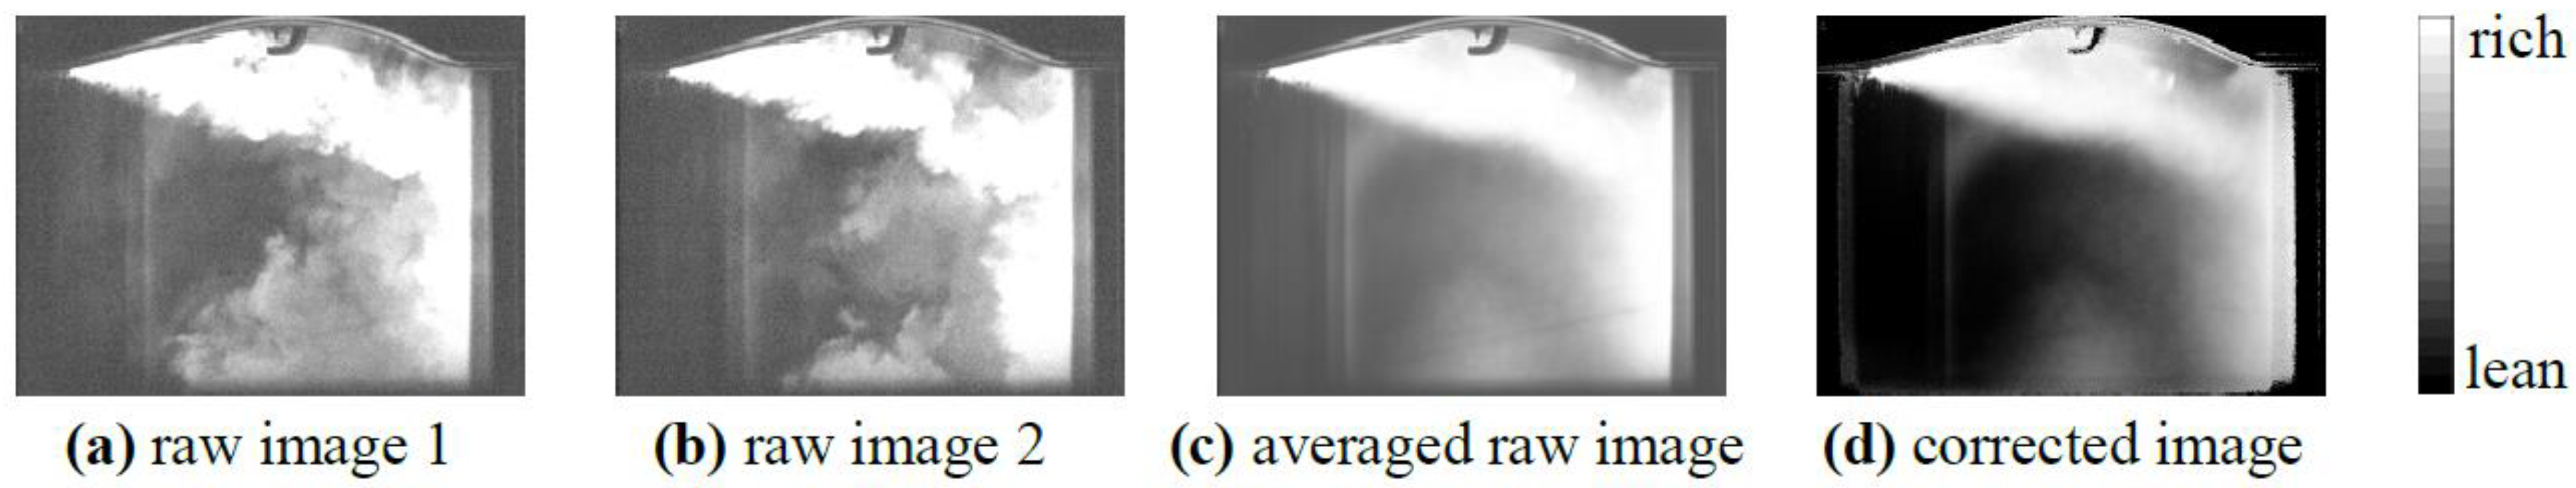
4.2. Semi-Quantitative Post-Processing

In order to make up for the noise and background effects in the raw PLIF images, additional acquisitions were necessary:
  • Background (BG) image: taken at each crank angle with no tracer in the fuel and with otherwise the same engine conditions;
  • Reference (ref) image relative to uniform mixture at each crank angle. The uniform mixture is approximated through a PFI (port-fuel injection) strategy.
At each crank angle of interest and at each pixel location the raw intensity is corrected through Equation (1) below:
I c o r r e c t e d i , j = I r a w i , j I B G i , j I r e f i , j I B G i , j 1 w · h i = 1 w j = 1 h I r e f i , j I B G i , j
where w and h are the number of pixels in the horizontal and vertical directions, respectively. It is worth pointing out that the denominator represents the reference image, corrected by removing the background effect and by normalizing the main by its mean. This provides a unit gain matrix to correct the LIF signal for nonuniform gains and nonlinear response of camera sensor, inhomogeneous laser illumination, and fluorescence reflection and refraction by the cylinder. Moreover, the intrinsic cycle-to-cycle variation in the jet and of the in-cylinder turbulence must be considered, as well as the shot-to-shot laser fluctuation and the slight deviation of the reference image from a perfectly homogeneous one. It was then decided to acquire 36 shots for each of the three groups of images and to substitute the respective averages in Equation (1), so as to represent the ensemble-averaged engine cycle. This procedure allows a semi-quantitative relation between luminosity signal and equivalence ratio to be defined, although the latter is limited to the ensemble-averaged cycle. An example of result of the post-processing technique described above is provided in Figure 5.

5. Numerical Model Development and Validation
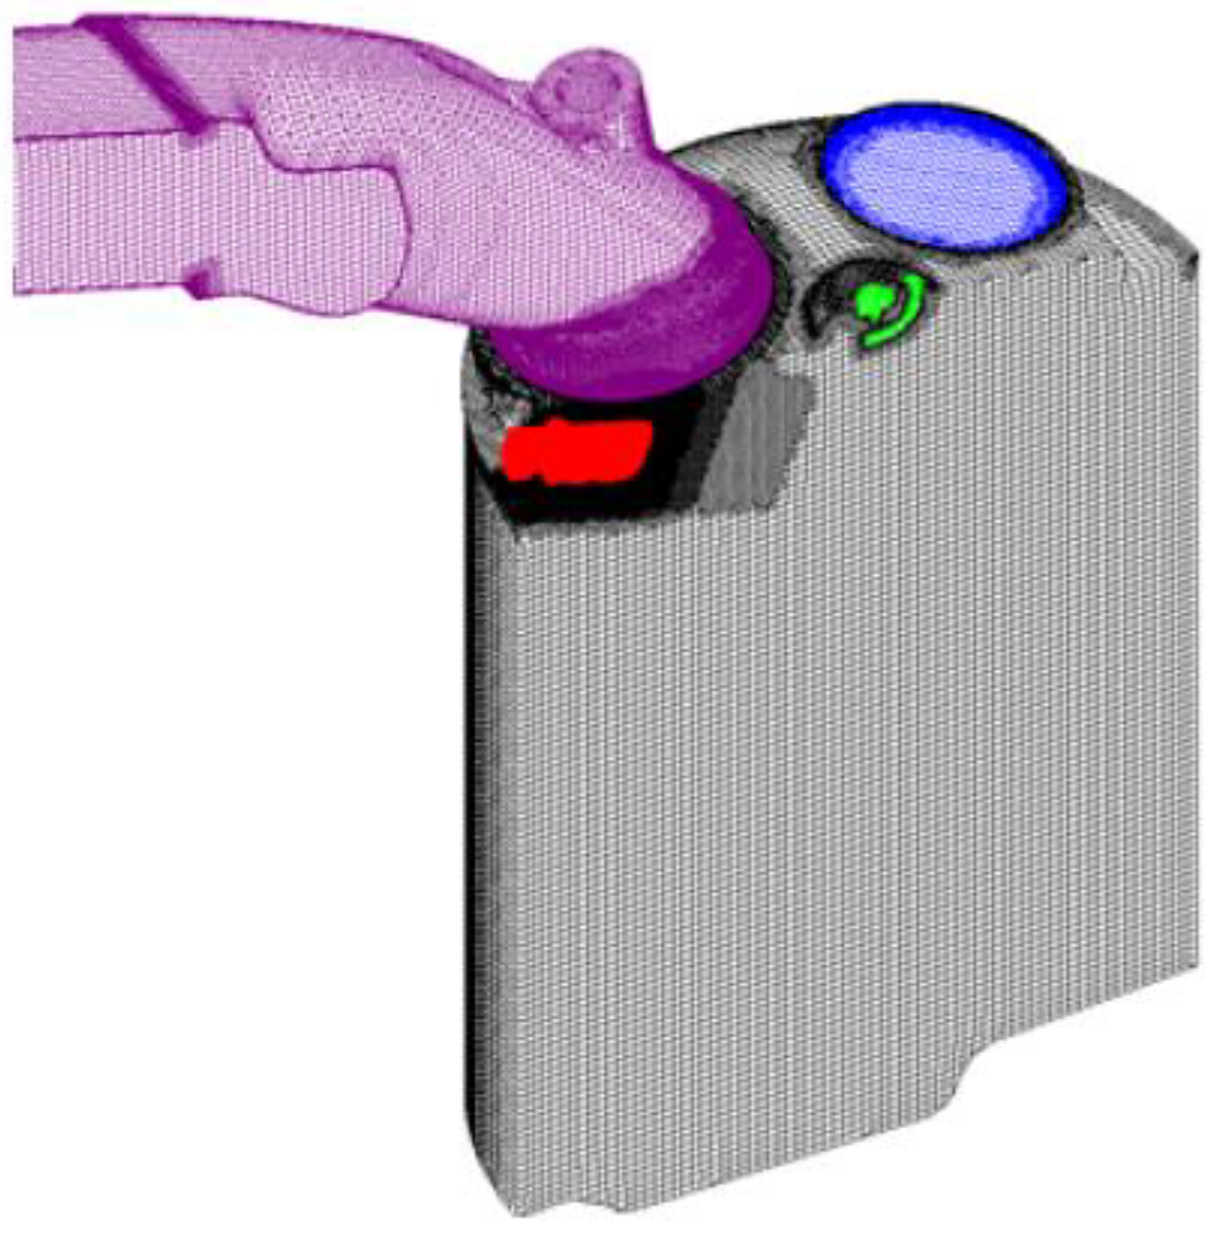
5.1. CFD Model

A complementary CFD activity was also carried out in the Gason project, in order to gain additional information about the jet evolution and fuel mixing, which are not accessible from the experimental activity. As an example, the mixing evolution outside the laser plane can be assessed through CFD results, as well as the flow details in the chamber zones hidden by the metal parts, specifically when the piston position is around TDC.
The most challenging feature related to the CFD simulation of direct gas injection in IC engine chambers is the wide range of length and time scales involved in the process. In fact, the typical supersonic flow evolution and the underexpanded flow structures within the fuel jet, whose dimension is of the order of magnitude of needle lift (between 0.1 and 1 mm), are at least two orders of magnitude smaller than the typical in-cylinder flow structures (around 50–100 mm in size, at the integral scale level). The CFD model was developed by Politecnico di Torino within AVL FIRE v.2014, within the framework of the cooperation set by the research project.
A complete description of the CFD model, along with a comprehensive review of the modeling approaches found in the literature, was reported in [23,30]. The main model features are discussed hereafter. According to the experience from previous studies [31,32,33], a minimum of 10 cells were used in the injector throat region in order to guarantee an accurate flow resolution. This was also coupled to an adequate cell refinement in the jet-wise direction in order to correctly capture the sudden changes in pressure and density in the same region. A grid independence study was purposely carried out to further verify the correctness of such choices. In order to resolve turbulence, a RANS approach coupled to the k-ζ-f eddy-viscosity model was selected [34]. As a matter of fact, despite the popularity gained by LES approaches in recent years, their application to underexpanded flow modeling is usually restricted to simple geometry cases, which is not the case of the present application. The conservation equations are discretized by using a high-resolution spatial scheme based on the MINMOD flux limiter [35]. The velocity-pressure coupling is treated through the implementation of the compressible variant of the widely used SIMPLE algorithm [36]. A view of the discretized CFD domain is provided by Figure 6, with reference to a crank angle during the injection event. As can be seen, most of the combustion chamber is discretized by using hexahedral cells and a trimming approach, whereas the injector mesh is purposely developed via a block-structured axial-symmetric mesh (red-colored part in the figure).

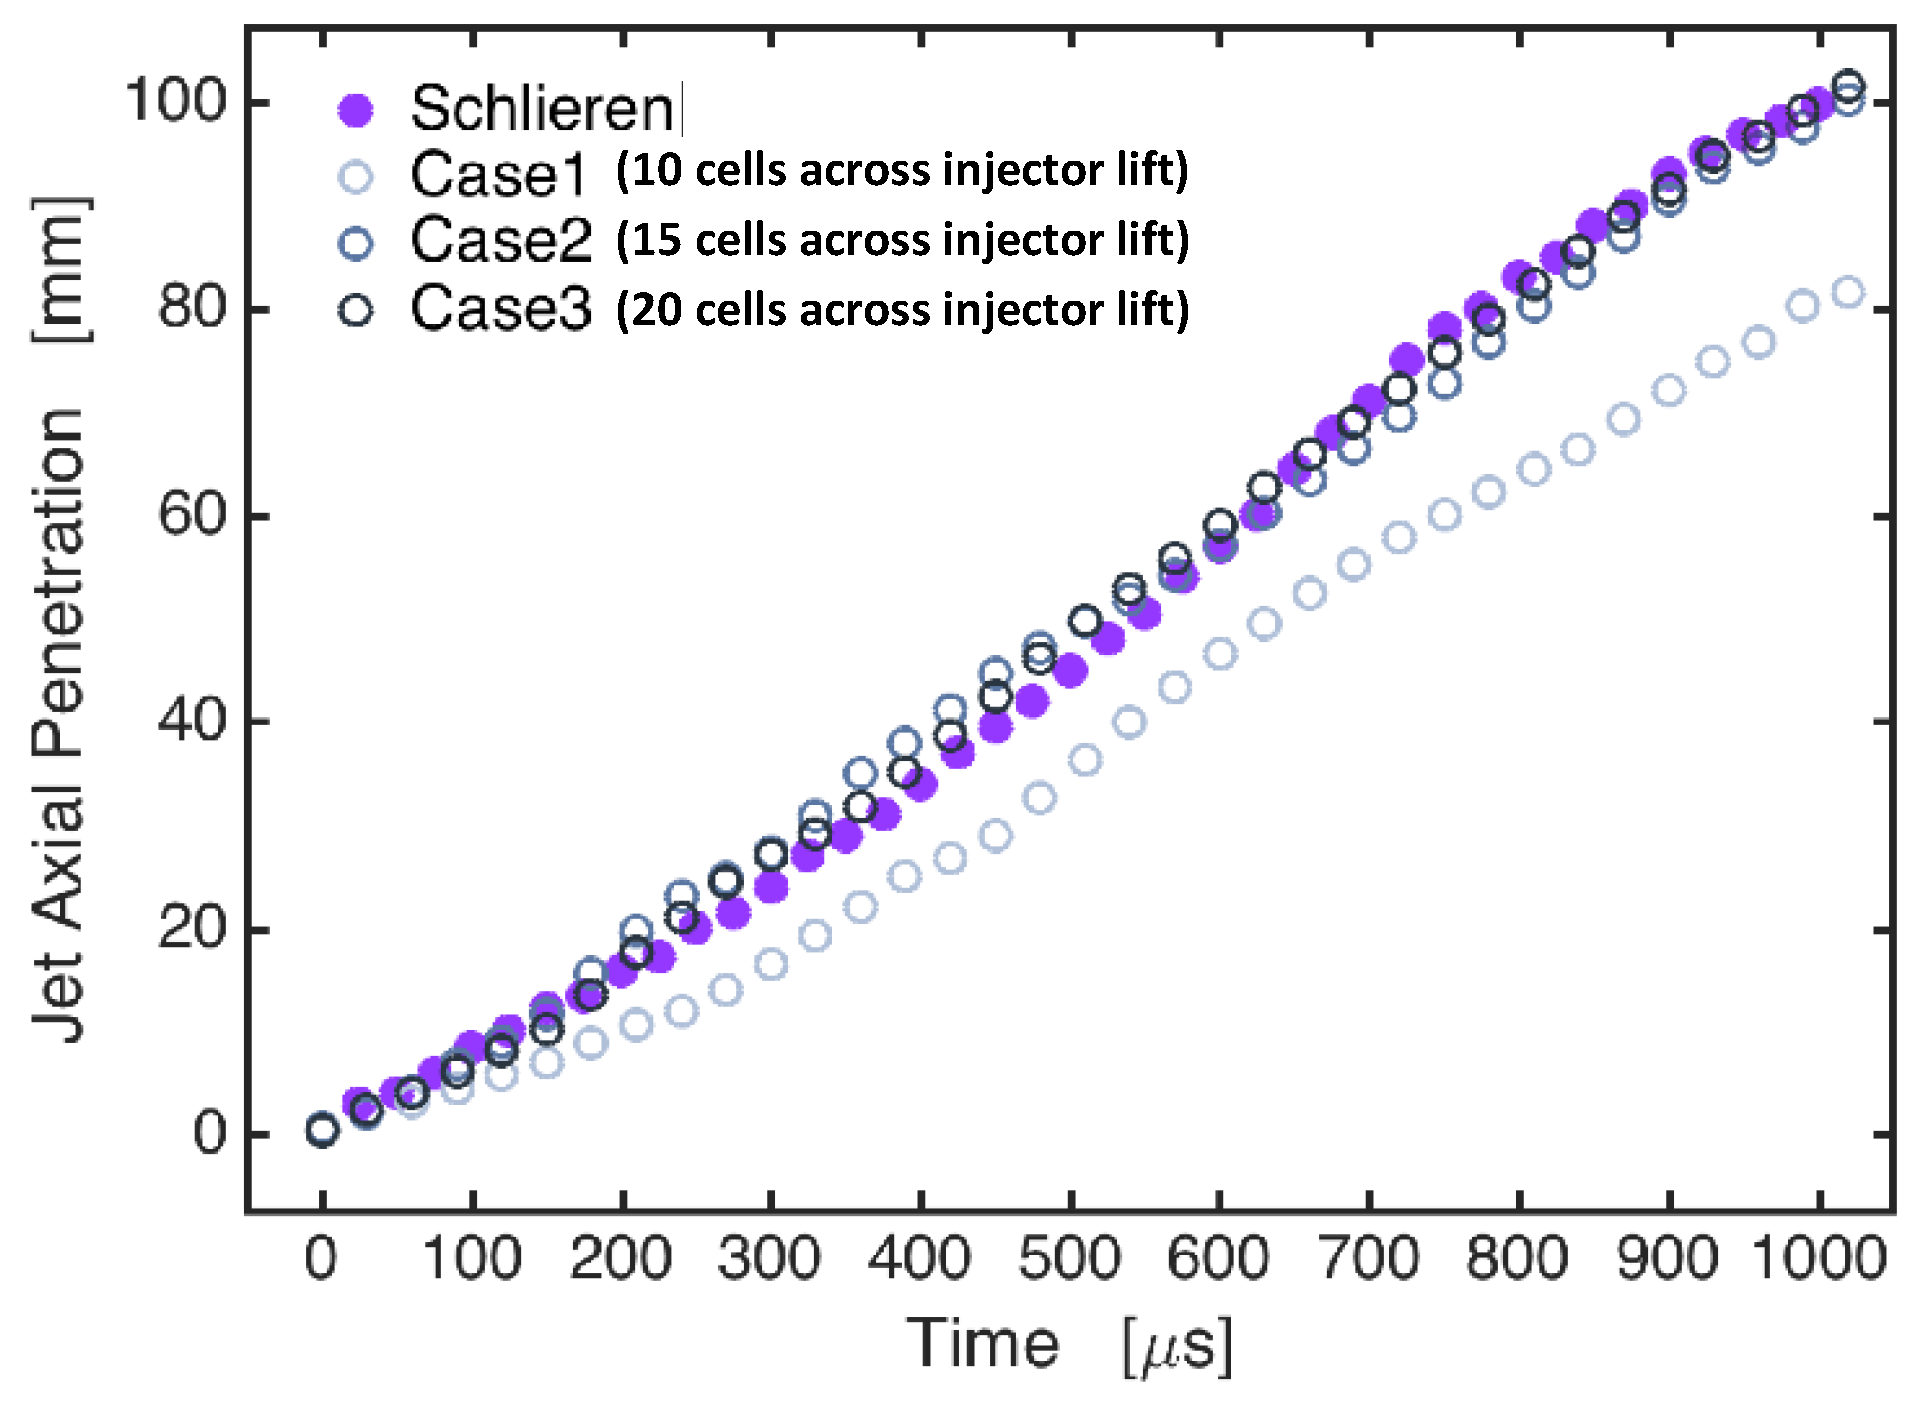
5.2. Injector Model Validation

A first set of validation tests were performed by exploiting a dedicated experimental activity performed by BorgWarner within the Gason project, the focus being the injection characterization in a constant-volume bomb through the Schlieren optical technique [37,38]. An extensive description of the experimental setup and of experimental results can be found in [30].
A first comparison was carried out with reference to the jet penetration. The latter was measured as the maximum distance in the axial direction between the injector tip and the jet boundary. The jet boundaries were identified as the minimum contrast contour which was distinguishable in the experimental images, and as contour of density 5% below the ambient air. It is worth stressing that, since the tests were performed using helium as injected gas, its apparent difference in molecular weight with air makes the identifying criterion provide very close results when a threshold of 1% or 2% is adopted, the difference in penetration being within 1–2 mm. The results are provided in Figure 7, with reference to three simulation cases featuring 10, 15, and 20 cells across the radial opening of the injector annular passage.
The penetration length was underestimated in case 1, which indicates that resolving the flow in the nozzle throat by using only 10 cells might be inadequate. Instead, both refined grids of cases 2 and 3 predict the jet penetration in quite close agreement with experiments. Furthermore, the slight difference between the two cases hints at the very limited grid dependence of the results of case 2. It was therefore concluded that 15 cells across the flow passage represents the grid requirement from the jet penetration point of view.
A further comparison was made, which was focused on a more detailed analysis of the jet spatial structure. Specifically, the experimental signal represents a contrast given by:
I I 0 I 0 = S · K · 0 h ρ z d y
where I is the measured pixel intensity from the test section in the presence of the jet; I0 is the pixel intensity from the same section, but with uniform density; K the Gladstone–Dale constant; S the Schlieren system sensitivity; z the injector-axis direction; and y a direction normal to the injector axis. The right-hand side of Equation (2) is connected to an integral of a fluid-dynamic variable, which is available in the numerical solution, so it can be evaluated numerically. The results of the contrast-based comparison are reported in Figure 8.
The figure reports the comparison between the experimental Schlieren contrast (left-hand side of Equation (2)) and the corresponding numerically evaluated quantity, with reference to the three investigated meshes and to two time instants, t = 0 being the start of injection. At 400 µs (Figure 8a), the jet predicted by the meshes in case 2 and 3 already collapsed towards the injector axis, which did not happen for case 1, finally leading to the underprediction of the jet penetration. At 975 µs, the complete jet structure is visible as the injector reaches a nearly steady-state behavior at its maximum lift. An irregular shape is visible in the post-processed numerical results due to some limitations in the interpolating functions used for the integral evaluation. Furthermore, the detailed surface corrugation at small scales, caused by the turbulence structure at the Kolmogorov scale level, are intrinsically not captured by the RANS simulations. It can also be inferred that the jet collapse onto the axis was completed also for case 1. From the point of view of jet penetration, as already evidenced by Figure 7, case 1 apparently underestimates the jet penetration, whereas the predictions from case 2 and 3 are both accurate. On the other hand, the radial jet spreading is overestimated for case 1 and slightly underestimated for case 2 and 3. In conclusion, the influence of spatial resolution of the numerical grid across the flow passage is mainly given by the predicted instant when the jet collapses towards the axis. A less dissipative (more refined) mesh is more likely to resolve the flow field details and unsteadiness, which are important and intrinsic features of the hollow cone jet flow, finally leading to more realistic predictions.

5.3. ‘Engine 1’ Model Validation

A first validation of the results from the engine model is provided in Figure 9, with reference to a case at 2000 rpm, bmep = 4 bar, end of injection EOI = 100° crank angle (CA) before TDC, for which the experimental acquisitions were mainly post-processed through the statistical technique.
As pointed out in Section 4.1., the statistical technique does not allow a quantitative comparison of the local fuel concentration; however, it is quite apparent that the model captures quite well the immediate occurrence of the Coandă effect, which persists for the entire duration of the injection. In this time interval, a one-to-one correlation exists from the jet penetration, which can be estimated from both the CFD and the statistical images. For a few crank angle positions it was also possible to acquire the additional images required for the semi-quantitative method to be applied, leading to the post-processed pictures in the third row of the figure. The good accuracy in capturing the Coandă effect is confirmed. Finally, at −40° CA, an almost homogeneous mixture is visible in the experimental results, where the left half of the chamber volume shows a higher fuel concentration. Again, the CFD results are sufficiently in line with the experimental evidence.
A further validation case on a low-speed, full load operating condition is shown in [23], and is not reported here for the sake of conciseness. In summary, the results shown substantiate the accuracy of the CFD model, which can thus be exploited to gain additional information with respect to the optical-access engine readings.

6. Results

As already mentioned above, the present paper is complementary to the previous paper [23] from the authors, where an extensive overview of the fuel injection and mixing was carried out. This paper aims at consolidating and integrating the information provided by the former one, by focusing the attention on the injection strategy influence on the combustion process. Specific attention is devoted to the analysis of the partial load points: 2000 rpm, 4 bar; 2000 rpm, 8 bar; and 4000 rpm, 5 bar. As a final application of the CFD model, a new engine layout solution, featuring a different injection position and targeting (‘Engine 2’), is analyzed and compared with the current one (‘Engine 1’).

6.1. ‘Engine 1’ Results at Partial Load

As a matter of fact, from an engine operation point of view, the partial load working points are commonly optimized by targeting the minimum fuel consumption, which leads to the implementation of early IVC strategies [39]. The latter inevitably have a detrimental impact on mixing capability and turbulence level. To investigate this, with reference to the point at 2000 rpm and 4 bar of load, three injection timings were compared (namely, EOI = 335°, 250° and 100° CA before TDC). The injection events are represented in Figure 10, along with the actuated valve lift profiles. The results obtained from the transparent single-cylinder engine are reported in Figure 11. The EOI = −335° case is reported in Figure 9 for the purpose of model validation.
As a result of the different injection timing, relative to the intake phase, different mechanisms of interaction between fuel jet and intake air flow are generated. In the case of early injection (EOI = −335° CA, first row in Figure 11), the injection process was already completed before the first experimental picture was taken, as the accessible space is insufficient for the laser sheet to induce a fluorescence response with sufficient signal-to-noise ratio. Given that the valve lift is limited, the intake flow is correspondingly weak [11,39], and consequently the overall flow field is dominated by the reverse tumble, which is generated by the piston shape. In the intermediate injection timing case (EOI = −250° CA, second row in Figure 11), the injection event starts around the IVC. The intake air inhibits the appearance of the Coandă effect, and consequently the jet develops in the direction of the injector axis, at least in the first phase of the injection. With reference to the late timing case (EOI = −100° CA, third row in Figure 11), the PLIF images clearly shows the immediate establishment of the Coandă effect, which generates a clockwise rotating, jet-guided, recirculation pattern (see also Figure 9). On the other hand, due to the much-reduced time available for mixing, the last image in both Figure 9 and Figure 11 reveal a residual stratification in the mixture. Once the CFD model was validated, further insight into the mixing process in the engine was provided by purposely post-processing its results, and by correlating them to those coming from combustion analysis in the multi-cylinder engine.
Two lumped indices can be derived from the CFD flow field, such as, the CoV of the local, relative, air-to-fuel ratio (CoVλ) over the in-cylinder mass, and the flammable fuel fraction (Ff). The latter is defined according to:
F f = mass   of   fuel   included   in   the   flammable   mixture total   mass   of   fuel
In Equation (3) the mixture flammability was evaluated by referring to the lambda range from 0.7 to 1.7 [40].
Figure 12 reports the comparison of the most significant indicators, which can be derived from CFD results. More specifically, the Ff, CoVλ and the turbulent kinetic energy (TKE) are considered.
The figure shows that, as EOI is retarded, the turbulence level is increased to a great extent, thus positively impacting on the combustion process. On the other hand, the slight decrease in Ff and the corresponding increase in CoVλ indicate that the reduced time between the end of injection and the start of combustion might determine a combustion efficiency detriment. At the considered working point, the EOI of 100° CA before TDC represents a good compromise, as the residual inhomogeneity is not prejudicial for the engine performance and can be further reduced during the first part of the combustion process. The last statement is confirmed by the performance and emission results from the MCE, as can be inferred from Figure 13.
Figure 13 shows the trend of the combustion duration and of total hydrocarbons (THCs) emissions against the EOI timing. Three working points are actually reported in the figure, which shows that the qualitative influence of injection timing is similar. The low-speed, low-load points are the most critical from the point of view of this trade-off. In fact, on one hand, a low-load condition implies an advanced IVC timing, which reduces the turbulence level during the compression stroke. On the other hand, the low engine speed further impacts on the absolute turbulent fluctuation, u’, for a given turbulence intensity. With reference to the working point at 2000 rpm, 4 bar (red lines in the figure), by reducing the EOI timing (that is, by retarding the injection) the average combustion speed increases, as a combined effect of the increase in the turbulence level and to a nearly constant mixture homogeneity (Figure 12). This condition lasts until EOI of about 100° CA bTDC, although an increase in THC of about 20% is observed when the EOI advance is reduced from 200° to 100° CA. A further reduction in EOI timing leads to a sudden change in THC, which indicates a reduced mixture homogeneity, as well as the probable occurrence of a few misfire events. The spatial variation in the local lambda have also a negative impact on the local burning speed, which determines an increase in the overall combustion duration. At 2000 rpm, 8 bar (blue curves in Figure 13), the overall influence of the EOI timing is less apparent than in the previous case. This is due to the combined effect of a less advanced IVC timing, which reduces the turbulence dissipation effect, as well as to the increased in-cylinder temperature, which leads to a higher laminar burning velocity. However, a change in the MFB5-90 trend is visible, which suggests that EOI = 100° CA bTDC may be a reasonable limit also for this working point. With reference to the 4000 rpm, 5 bar working point (green curves), the higher engine speed increases the angular duration of the combustion for a given combustion time, and the benefits from turbulence thus generate a steeper slope of the curve against EOI. However, the increased angular duration intrinsically reduces the combustion efficiency. Moreover, the very high THC emissions, which correspond to combustion duration values above 40°, testify the apparent detriment in the combustion behavior accompanied by the appearance of a few misfiring events.
The results above evidenced the optimal trade-off between turbulence and mixing homogeneity of the late injection timing. This is basically due to two factors: The first is the apparent intensification of the tumble number during the injection period (see Figure 9). The second is the limited penalty in terms of mixing homogeneity (Figure 12), which is evidence of the very good mixing mechanism of the late injection case. In this regard, the intermediate injection timing features a much less favorable behavior. On one hand, some departure from the homogeneous condition can be inferred from the increase in the mixture CoV and the decrease in Ff, which are accompanied by a relatively small increase in turbulence.
For the reason mentioned above, a modification in the injection position and targeting was studied in order to assess for a possible better trade-off between homogenization and turbulence level at the start of combustion.

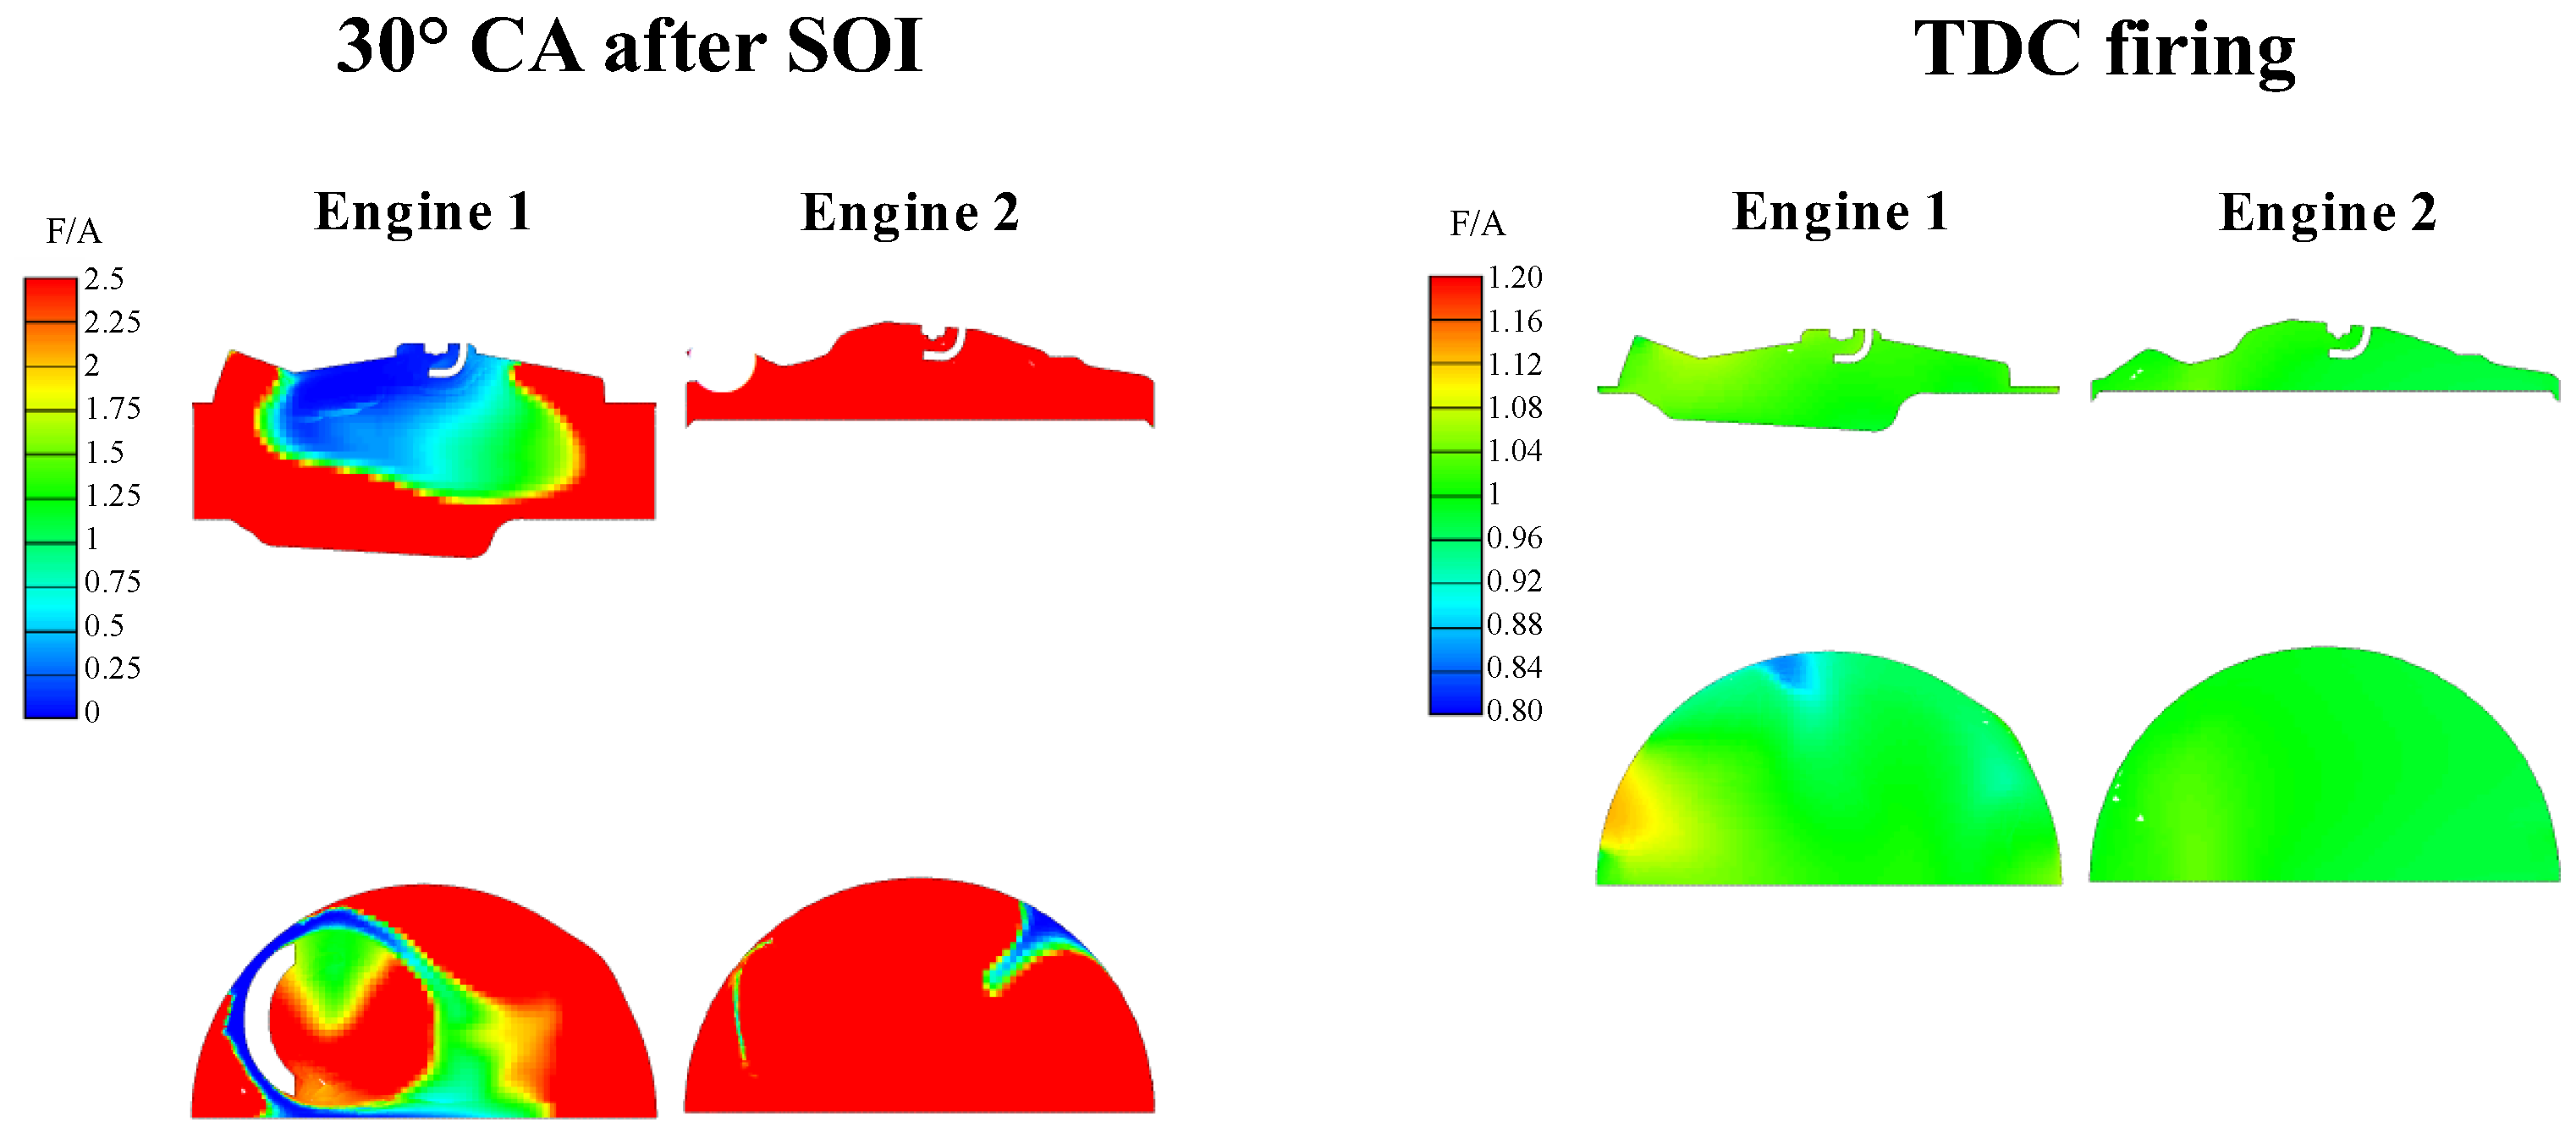
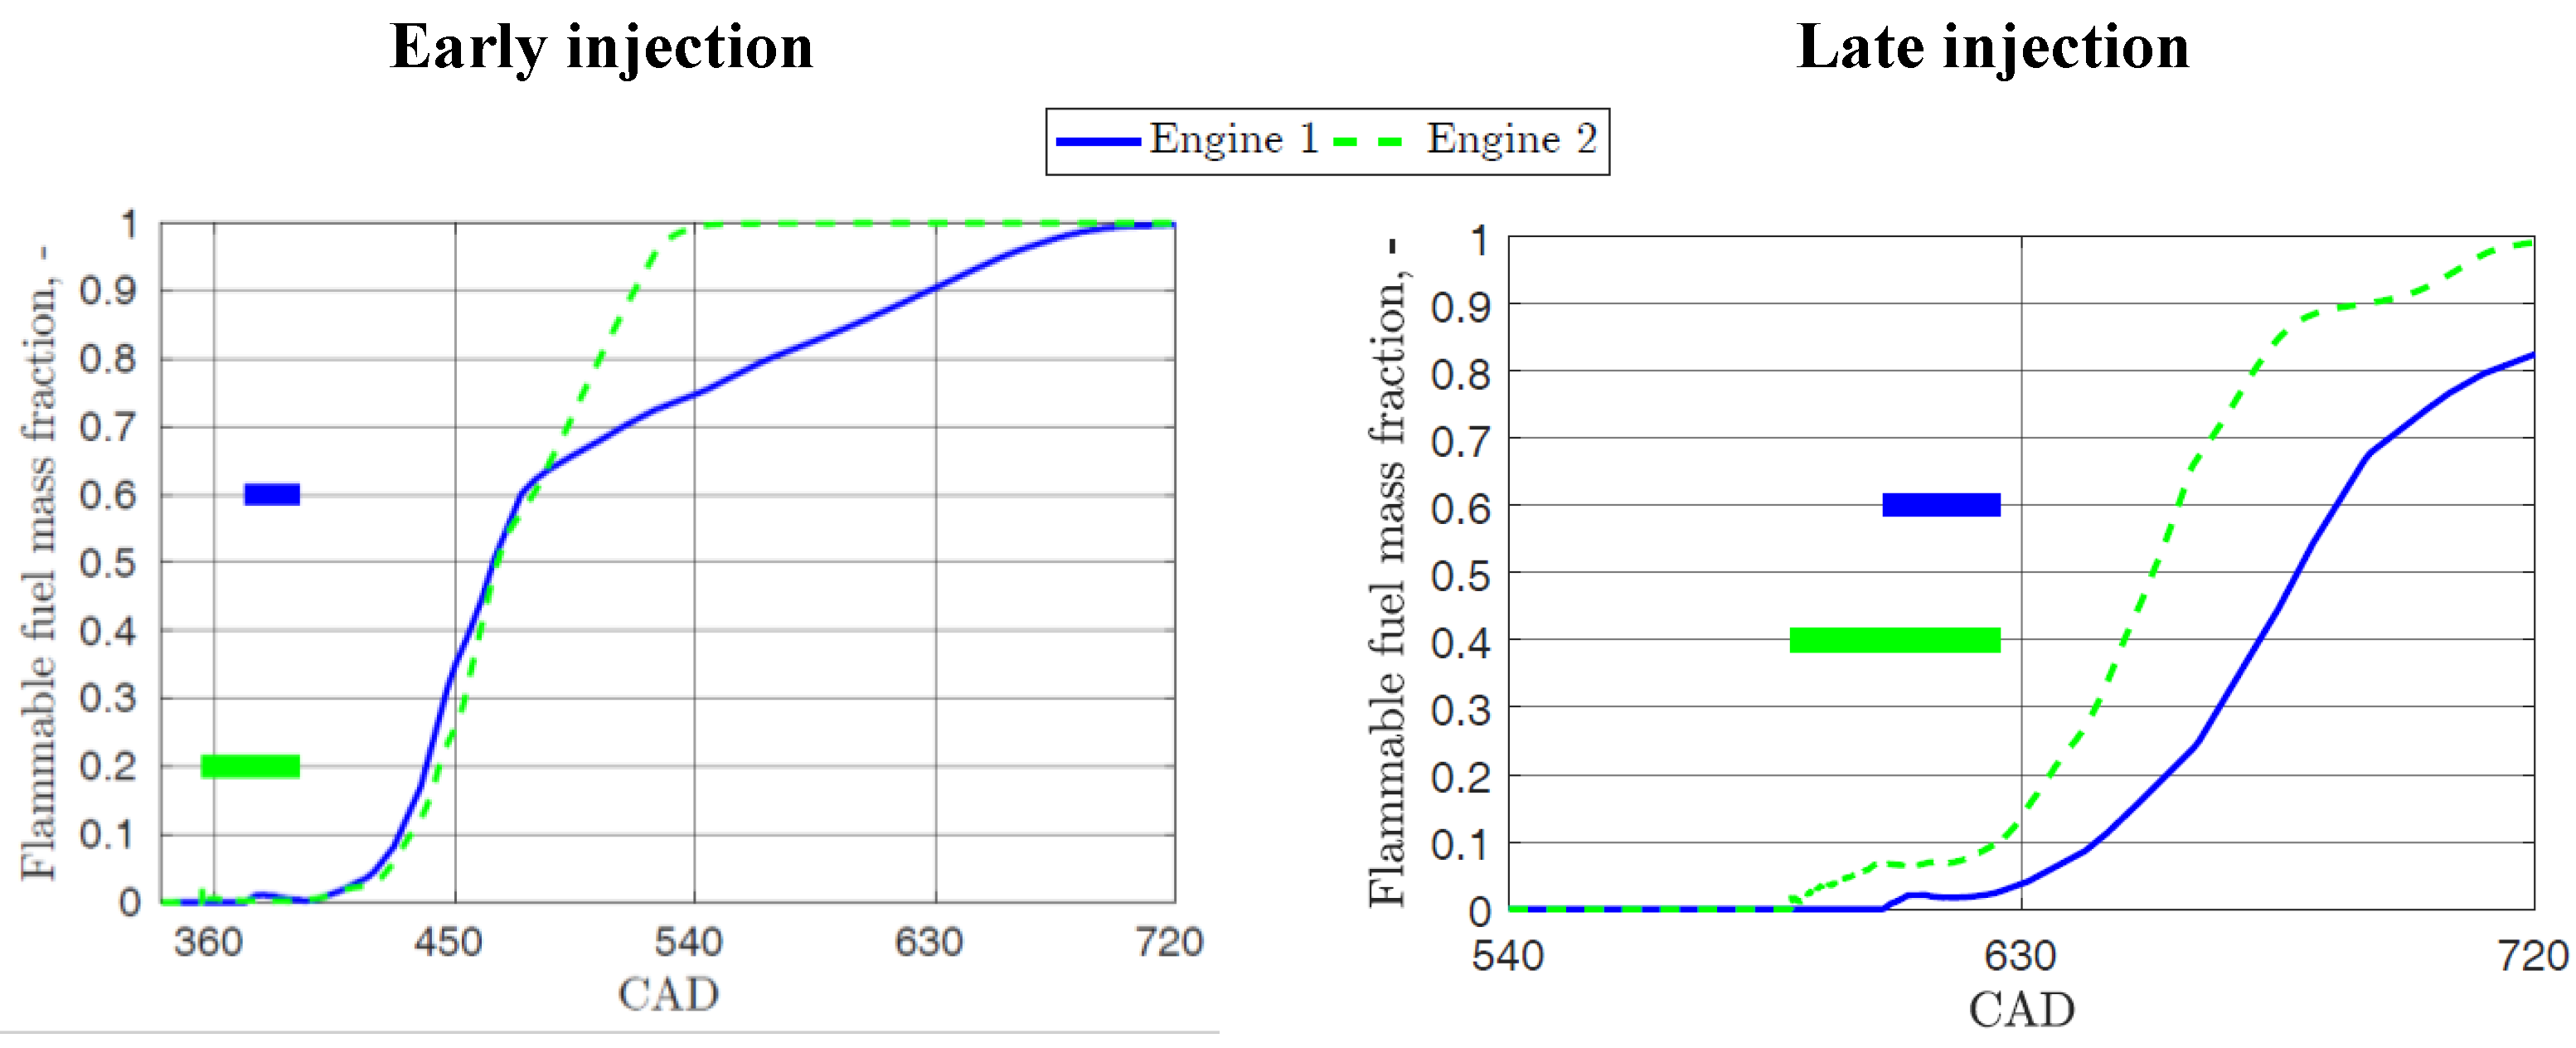
6.2. ‘Engine 2’ CFD Results vs. ‘Engine 1’

The CFD model, developed and validated in the first part of the project, was used in order to compare the two proposed engine design variants from the mixture formation point of view. As described in Section 3, ‘Engine 2’ features a change in both the intake port design and injector orientation, both of these changes affect the tumble generation and production. Due to the dissipation of the tumble, which normally occurs within the compression stroke, the named effects on the tumble determine a corresponding change in the turbulence intensity at the beginning of the combustion phase. The results are presented hereafter with specific reference to the 2000 rpm, 4 bar working point with ‘early’ and ‘late’ injection timings. The results in terms of tumble number and TKE evolution are reported in Figure 14 and Figure 15.
In the ‘early injection’ case (Figure 14), the piston interferes with the jet in both cases, and does not impact significantly on the overall tumble number, also due to the limited duration of the injection phase. The difference in the tumble number is essentially to be ascribed to the change in the intake port geometry, and in particular to the presence of a mask on the intake side [11]. The increased tumble intensity has an appreciable in the TKE level at firing TDC (+97% in this specific working point). In the ‘late injection’ strategy (Figure 15), the superior intake port characteristics in terms of tumble and turbulence are confirmed until the injection process starts. Subsequently, the different injection targeting generates an overall change in the recirculation pattern, which destroys the intake-generated structures in both cases. Due to the extremely intense turbulence generated by the jet, the impact of the engine layout on the TKE at firing TDC are lower than in the previous case (+69%).
Figure 16 and Figure 17 report the contours of equivalence ratio (relative F/A ratio) and provide a further insight into the comparison.
With reference to the ‘early’ injection case, the contours of equivalence ratio do not allow to recognize a proper jet-generated structure due to the obstruction exerted by the piston surface. The right half of the picture shows the contours at firing TDC by using a magnified color scale. Although the entire mixture resulted to be flammable in both the engine geometries (see Figure 12 for ‘Engine 1’), two small regions with a slight departure of lambda from unity are visible in the ‘Engine 1’ case, whereas the ‘Engine 2’ case denotes a nearly perfect homogenization. As it is shown by Figure 17, the jet development mechanism in the late injection case are completely different, in fact, the ‘Engine 2’ variant does not generate any Coandă effect, as was expected. Consequently, the jet can develop along the injector axis, finally resulting in an overall anti-clockwise recirculation pattern. Similarly to Figure 16, the contours in the right half of Figure 17 show a higher level of homogeneity of the mixture generated in the ‘Engine 2’ case.
The comparison between the Ff time histories are shown in Figure 18 with reference to both the ‘early’ and the ‘late’ injection cases. It is worth pointing out that the λ limits to be used in Equation (3) were restricted to the (0.8, 1.2) range, in order to emphasize any minor deviation from homogeneity. It is quite apparent that the ‘Engine 2’ layout is more effective in generating a homogeneous mixture, in both the ‘early’ and ‘late’ injection strategies. This is determined by the higher in-cylinder tumble intensity, with specific reference to the SOI instant. In the first case, both strategies allow the unity value to be reached, thanks to the quite long time available for mixing. However, the ‘mixing speed’ of the ‘Engine 1’ case shows an abrupt reduction after the IVC timing due to the much lower tumble number with respect to ‘Engine 2’ (Figure 14).

7. Conclusions

The present paper presented an extensive analysis of the mixture formation process and performance evaluation in a high-performance monofuel NG engine. The analysis of the mixture formation process comprised an experimental activity on an optical access version of the test engine, as well as a CFD investigation, which allowed additional insight into the process to be given. A semi-quantitative post-processing technique was developed, which allowed the CFD model to be adequately assess for mesh independence and general accuracy. The experimental and simulation data of the mixture formation process was closely correlated with the full engine performance and emission data from the test rig, with specific reference to the trade-off between combustion duration, mixture homogeneity, and THC emissions.
With reference to the EOI timing effect on the mixture formation process in ‘Engine 1’, at partial load, a retarded EOI increases the turbulence intensity at spark timing, while the mixture homogeneity remains sufficiently good until around 100 deg before TDC. The overall trade-off is penalized by the low tumble intensity, which is detected by the CFD model at the start of injection. The subsequent comparison between the mixing process from a modified engine layout allowed to point out the overall better trade-off for ‘Engine 2’, mainly thanks to the stronger tumble motion and its more effective interaction with the gaseous jet. In the case of ‘early’ injection, the tumble-oriented geometry mainly affects the mixing speed and greatly enhances the mixture homogeneity. In the ‘late’ injection case, the jet-induced tumble is opposite to that of the in-cylinder charge, which leads to a very fast destruction of the high-scale structures and a beneficial increase in the turbulent intensity at combustion start.

Author Contributions

Conceptualization, D.M. and M.B.; methodology, D.M., M.B., J.X., A.F. and R.H.; software, J.X.; validation, D.M., M.B., J.X., A.F. and R.H.; investigation, D.M., M.B., J.X., A.F. and R.H.; resources, J.X., A.F. and R.H.; data curation, D.M., M.B., J.X., A.F. and R.H.; writing—original draft preparation, D.M. and M.B.; writing—review and editing, D.M. and M.B.; supervision, D.M. and M.B.; project administration, D.M., M.B., J.X., A.F. and R.H. All authors have read and agreed to the published version of the manuscript.

Funding

This research was funded by the EC under the GasOn Collaborative project within the H2020 program, grant agreement number 652816.

Data Availability Statement

Data is unavailable due to confidentiality restrictions.

Acknowledgments

The authors would like to thank the AVL Advanced Simulation Technologies (ASTs) team for the technical support on AVL FIRE, as well as the team at BorgWarner Luxembourg for the delivery of fuel injection equipment and experimental Schlieren acquisition data regarding gas injection in a constant volume bomb.

Conflicts of Interest

The authors declare no conflict of interest.

References

  1. Taylor, P. Energy Technology Perspectives 2020; International Energy Agency: Paris, France, 2020. [Google Scholar]
  2. Jahirul, M.I.; Masjuki, H.H.; Saidur, R.; Kalam, M.A.; Jayed, M.H.; Wazed, M.A. Comparative engine performance and emission analysis of CNG and gasoline in a retrofitted car engine. Appl. Therm. Eng. 2010, 30, 2219–2226. [Google Scholar] [CrossRef]
  3. Kato, K.; Igarashi, K.; Masuda, M.; Otsubo, K.; Yasuda, A.; Takeda, K.; Sato, T. Development of Engine for Natural Gas Vehicle. SAE Trans. 1999, 939–947. [Google Scholar] [CrossRef]
  4. Mello, P.; Pelliza, G.; Cataluña, R.; da Silva, R. Evaluation of the maximum horsepower of vehicles converted for use with natural gas fuel. Fuel 2006, 85, 2180–2186. [Google Scholar] [CrossRef]
  5. Cho, H.M.; He, B.-Q. Spark ignition natural gas engines—A review. Energy Convers Manag. 2007, 48, 608–618. [Google Scholar] [CrossRef]
  6. Adlercreutz, L.; Cronhjort, A.; Andersen, J.; Ogink, R. Optimizing the Natural Gas Engine for CO2 Reduction; No. 2016-01-0875; SAE Technical Paper; SAE International: Warrendale, PA, USA, 2016. [Google Scholar] [CrossRef]
  7. Wang, Y.; Ge, P.; Liu, T.; Gong, C.; Dong, D. Quantitative Analysis of the Influence Saliency of VVA and EGR on the Fuel Economy and Mixture Combustion Characteristics of a Turbocharged Spark Ignition Engine. ACS Omega 2021, 6, 31017–31025. [Google Scholar] [CrossRef] [PubMed]
  8. Evans, R.L. Extending the Lean Limit of Natural-Gas Engines. J. Eng. Gas Turbines Power 2009, 131, 032803. [Google Scholar] [CrossRef]
  9. Zhang, Z.; Zhang, H.; Wang, T.; Jia, M. Effects of tumble combined with EGR (exhaust gas recirculation) on the combustion and emissions in a spark ignition engine at part loads. Energy 2014, 65, 18–24. [Google Scholar] [CrossRef]
  10. Fu, J.; Zhu, G.; Zhou, F.; Liu, J.; Xia, Y.; Wang, S. Experimental investigation on the influences of exhaust gas recirculation coupling with intake tumble on gasoline engine economy and emission performance. Energy Convers. Manag. 2016, 127, 424–436. [Google Scholar] [CrossRef]
  11. Baratta, M.; Misul, D.; Viglione, L.; Xu, J. Combustion chamber design for a high-performance natural gas engine: CFD modeling and experimental investigation. Energy Convers. Manag. 2019, 192, 221–231. [Google Scholar] [CrossRef]
  12. Douailler, B.; Ravet, F.; Delpech, V.; Soleri, D.; Reveille, B.; Kumar, R. Direct Injection of CNG on High Compression Ratio Spark Ignition Engine: Numerical and Experimental Investigation. In Proceedings of the SAE 2011 World Congress & Exhibition, Guanajuato, Mexico, 19–23 June 2011; pp. 1–13. [Google Scholar]
  13. Boretti, A.; Lappas, P.; Zhang, B.; Mazlan, S.K. CNG Fueling Strategies for Commercial Vehicles Engines-A Literature Review; SAE Technical Paper; SAE International: Warrendale, PA, USA, 2013. [Google Scholar] [CrossRef]
  14. Zeng, K.; Huang, Z.; Liu, B.; Liu, L.; Jiang, D.; Ren, Y.; Wang, J. Combustion characteristics of a direct-injection natural gas engine under various fuel injection timings. Appl. Therm. Eng. 2006, 26, 806–813. [Google Scholar] [CrossRef]
  15. Sevik, J.; Pamminger, M.; Wallner, T.; Scarcelli, R.; Reese, R.; Iqbal, A.; Boyer, B.; Wooldridge, S.; Hall, C.; Miers, S. Performance, Efficiency and Emissions Assessment of Natural Gas Direct Injection compared to Gasoline and Natural Gas Port-Fuel Injection in an Automotive Engine. SAE Int. J. Engines 2016, 9, 1130–1142. [Google Scholar] [CrossRef]
  16. Kaiadi, M.; Tunestål, P.; Johansson, B. How Hythane with 25% Hydrogen can Affect the Combustion in a 6-Cylinder Natural-gas Engine. SAE Int. J. Fuels Lubr. 2010, 3, 47–59. [Google Scholar] [CrossRef]
  17. Makaryan, I.A.; Sedov, I.V.; Salgansky, E.A.; Arutyunov, A.V.; Arutyunov, V.S. A Comprehensive Review on the Prospects of Using Hydrogen–Methane Blends: Challenges and Opportunities. Energies 2022, 15, 2265. [Google Scholar] [CrossRef]
  18. Gharehghani, A.; Hosseini, R.; Mirsalim, M.; Yusaf, T.F. A computational study of operating range extension in a natural gas SI engine with the use of hydrogen. Int. J. Hydrogen Energy 2015, 40, 5966–5975. [Google Scholar] [CrossRef]
  19. Alvarez, C.E.C.; Couto, G.E.; Roso, V.R.; Thiriet, A.B.; Valle, R.M. A review of prechamber ignition systems as lean combustion technology for SI engines. Appl. Therm. Eng. 2018, 128, 107–120. [Google Scholar] [CrossRef]
  20. Exxon, M. The Outlook for Energy: A View to 2040. 2016. Available online: https://climatepositions.com/wp-content/uploads/2015/01/2015-Outlook-for-Energy_print-resolution.pdf (accessed on 16 January 2023).
  21. Available online: https://www.ngva.eu/medias/ngva-europe-has-published-2020-gas-vehicle-statistics-and-europe-has-reached-a-new-gas-refuelling-infrastructure-milestone (accessed on 1 February 2023).
  22. Yip, H.L.; Srna, A.; Yuen, A.C.Y.; Kook, S.; Taylor, R.A.; Yeoh, G.H.; Medwell, P.R.; Chan, Q.N. A Review of Hydrogen Direct Injection for Internal Combustion Engines: Towards Carbon-Free Combustion. Appl. Sci. 2019, 9, 4842. [Google Scholar] [CrossRef] [Green Version]
  23. Baratta, M.; Misul, D.; Xu, J.; Fuerhapter, A.; Heindl, R.; Peletto, C.; Preuhs, J.; Salemi, P. Development of a High Performance Natural Gas Engine with Direct Gas Injection and Variable Valve Actuation. SAE Int. J. Engines 2017, 10, 2535–2551. [Google Scholar] [CrossRef] [Green Version]
  24. Available online: http://gason.eu/ (accessed on 16 January 2023).
  25. Schulz, C.; Sick, V. Tracer-LIF diagnostics: Quantitative measurement of fuel concentration, temperature and fuel/air ratio in practical combustion systems. Prog. Energy Combust. Sci. 2005, 31, 75–121. [Google Scholar] [CrossRef]
  26. Friedrich, W.; Grzeszik, R.; Lauschke, P.; Zelenov, V.; Wensing, M. The Impact of a Combustion Chamber Optimization on the Mixture Formation and Combustion in a CNG-DI Engine in Stratified Operation; No. 2017-01-0779; SAE Technical Paper; SAE International: Warrendale, PA, USA, 2017. [Google Scholar] [CrossRef]
  27. Engel, S.R.; Koch, P.; Braeuer, A.; Leipertz, A. Simultaneous laser-induced fluorescence and Raman imaging inside a hydrogen engine. Appl. Opt. 2009, 48, 6643–6650. [Google Scholar] [CrossRef] [PubMed]
  28. Mederer, T.; Wensing, M.; Leipertz, A. Investigation of the Interaction of Charge Motion and Residual Gas Concentration in an Optically Accessible SI Engine; SAE Technical Paper 2013-01-0558; SAE International: Warrendale, PA, USA, 2013. [Google Scholar] [CrossRef]
  29. McGee, J.; Alger, T.; Blobaum, E.; Wooldridge, S. Evaluation of a Direct-Injected Stratified Charge Combustion System Using Tracer PLIF; No. 2004-01-0548; SAE Technical Paper; SAE International: Warrendale, PA, USA, 2004. [Google Scholar] [CrossRef]
  30. Xu, J. Numerical and Experimental Analysis of Fuel Injection and Mixture Formation in High-Performance Natural Gas Engines-Methodologies and Applications. Ph.D. Thesis, Politecnico di Torino, Torino, Italy, 2019. [Google Scholar]
  31. Baratta, M.; Catania, A.E.; Pesce, F.C. Multidimensional Modeling of Natural Gas Jet and Mixture Formation in Direct Injection Spark Ignition Engines—Development and Validation of a Virtual Injector Model. J. Fluids Eng. 2011, 133, 041304. [Google Scholar] [CrossRef]
  32. Baratta, M.; Rapetto, N. Fluid-dynamic and numerical aspects in the simulation of direct CNG injection in spark-ignition engines. Comput. Fluids 2014, 103, 215–233. [Google Scholar] [CrossRef]
  33. Goel, P.; Baratta, M.; Misul, D.; Christou, P.; Ravet, F. Mixture formation and combustion behaviour analysis in a di ng engine with centrally mounted injector under different injection timings. Int. J. Mech. Control 2020, 21, 167–178. [Google Scholar]
  34. Laurence, D.R.; Uribe, J.C.; Utyuzhnikov, S.V. A robust formulation of the v2−f model. Flow Turbul. Combust. 2005, 73, 169–185. [Google Scholar] [CrossRef] [Green Version]
  35. Roe, P.L. Characteristic-based schemes for the Euler equations. Annu. Rev. Fluid Mech. 1986, 18, 337–365. [Google Scholar] [CrossRef]
  36. Demirdžić, I.; Lilek, Ž.; Perić, M. A collocated finite volume method for predicting flows at all speeds. Int. J. Numer. Methods Fluids 1993, 16, 1029–1050. [Google Scholar] [CrossRef]
  37. Goldstein, R.J.; Kuehn, T.H. Optical systems for flow measurement: Shadowgraph, schlieren, and interferometric techniques. In Fluid Mechanics Measurements, 2nd ed.; Taylor & Francis: London, UK, 1996; pp. 451–508. ISBN 9781560323068. [Google Scholar]
  38. Schöpf, W.; Patterson, J.C.; Brooker, A.M.H. Evaluation of the shadowgraph method for the convective flow in a side-heated cavity. Exp. Fluids 1996, 21, 331–340. [Google Scholar] [CrossRef]
  39. Bozza, F.; De Bellis, V.; Gimelli, A.; Muccillo, M. Strategies for Improving Fuel Consumption at Part-Load in a Downsized Turbocharged SI Engine: A Comparative Study. SAE Int. J. Engines 2014, 7, 60–71. [Google Scholar] [CrossRef] [Green Version]
  40. Baratta, M.; D’Ambrosio, S.; Misul, D.A.; Spessa, E. Effects of H2 Addition to Compressed Natural Gas Blends on Cycle-to-Cycle and Cylinder-to-Cylinder Combustion Variation in a Spark-Ignition Engine. J. Eng. Gas Turbines Power 2014, 136, 051502. [Google Scholar] [CrossRef]
Figure 1. MCE engine geometry: section through the valves (left), view from bottom (right), for the considered setup variants.
Energies 16 03004 g001
Figure 2. SCE with glass liner (a); piston with glass surface (b).
Energies 16 03004 g002
Figure 3. Laser beam and fluorescence signal routing for double-sided PLIF measurements.
Energies 16 03004 g003
Figure 4. Statistical post-processing of images.
Energies 16 03004 g004
Figure 5. Semi-quantitative post-processing of images.
Energies 16 03004 g005
Figure 6. Discretized fluid domain during injection event (‘Engine 1’ geometry).
Energies 16 03004 g006
Figure 7. Axial jet penetration time-history, measured from experimental and numerical results (t = 0 µs indicates the start of injection).
Energies 16 03004 g007
Figure 8. Comparison between Schlieren contrast and numerical results: t = 400 μs (a); t = 975 μs (b).
Energies 16 03004 g008
Figure 9. Engine numerical model validation for 2000 rpm, bmep = 4 bar, EOI = 100° CA bTDC.
Energies 16 03004 g009
Figure 10. Valve lift profiles and injection timings: 2000 rpm; bmep = 4 bar.
Energies 16 03004 g010
Figure 11. PLIF images for three different EOI timings: 2000 rpm; bmep = 4 bar.
Energies 16 03004 g011
Figure 12. Effect of the injection timing on mixture- and turbulence-related quantities at spark timing: 2000 rpm, 4 bar.
Energies 16 03004 g012
Figure 13. Effect of the injection timing on combustion duration and THC emissions, at the indicated operating conditions.
Energies 16 03004 g013
Figure 14. Tumble number and TKE evolution from ‘Engine 1’ and ‘Engine 2’ variants: 2000 rpm, 4 bar, early injection timing.
Energies 16 03004 g014
Figure 15. Tumble number and TKE evolution from ‘Engine 1’ and ‘Engine 2’ variants: 2000 rpm, 4 bar, late injection timing.
Energies 16 03004 g015
Figure 16. Relative F/A contours from ‘Engine 1’ and ‘Engine 2’ variants: 2000 rpm, 4 bar, early injection timing.
Energies 16 03004 g016
Figure 17. Relative F/A contours from ‘Engine 1’ and ‘Engine 2’ variants: 2000 rpm, 4 bar, late injection timing.
Energies 16 03004 g017
Figure 18. Flammable fuel mass fraction referred to the lambda range between 0.8 and 1.2: 2000 rpm, 4 bar.
Energies 16 03004 g018
Table 1. Test engine specifications.
ItemUnitEngine 1Engine 2
Boremm7270
Strokemm8487
CR-13
Maximum peak firing pressurebar115 (normal operation)
150 (knocking operation)
Valves per cylinder-4
Rated torque speedrpm1500
Rated power speedrpm5000
Valve actuation-Hydraulic VVA (intake)
Mechanical (exhaust)
Injection system-CNG DI
Geometry-Outward-opening poppet valve
Orientation-FlatSteep
Rail pressurebar6–16
Table 2. PLIF setup main features.
ItemDescription
Laser typekrypton fluoride (KrF)
Laser wavelength248 nm
Light arrangementdouble-sided
Tracertri-methylamine (TMA), 4000 ppm
Fluorescence frequency300 nm
CameraIntensified charge-coupled device (ICCD)
LensesUV-compatible Micro Nikkor
Disclaimer/Publisher’s Note: The statements, opinions and data contained in all publications are solely those of the individual author(s) and contributor(s) and not of MDPI and/or the editor(s). MDPI and/or the editor(s) disclaim responsibility for any injury to people or property resulting from any ideas, methods, instructions or products referred to in the content.

