Article

Lifetime Limitations in Multi-Service Battery Energy Storage Systems

by
Mathilda Ohrelius
1,*,
Magnus Berg
2,3,
Rakel Wreland Lindström
1 and
Göran Lindbergh
1
1
Applied Electrochemistry, Department of Chemical Engineering, KTH Royal Institute of Technology, SE-100 44 Stockholm, Sweden
2
Vattenfall AB, SE-162 87 Stockholm, Sweden
3
Process Technology, Department of Chemical Engineering, KTH Royal Institute of Technology, SE-100 44 Stockholm, Sweden
*
Author to whom correspondence should be addressed.
Energies 2023, 16(7), 3003; https://doi.org/10.3390/en16073003
Submission received: 20 February 2023 / Revised: 20 March 2023 / Accepted: 23 March 2023 / Published: 25 March 2023
(This article belongs to the Section D2: Electrochem: Batteries, Fuel Cells, Capacitors)

Abstract

:
A reliable power grid system based on renewable energy sources is a crucial step to restrict the climate crisis. Stationary battery energy storage systems (BESS) offer a great potential to repel power fluctuations in the grid at different timescales. However, for a reliable operation and cost estimation, the degradation in the batteries needs to be understood. We present an accelerated battery degradation study, on single as well as multi-service applications, of NCM532/Gr lithium-ion battery cells. Frequency regulation (FR) was the least harmful for the battery, with an expected lifetime of 12 years, while peak shaving (PS) resulted in an expected lifetime of 8 years. The combined cycle (FRPS) accelerated the capacity loss, and degradation of the positive electrode was induced from the start of cycling, causing power limitations after only 870 equivalent full cycles (EFC). Tracking the 1C-rate discharge capacity was proven to be a good indication of the accelerated cell polarization, and it can serve as a useful method to evaluate the internal battery state of health (SOH).

1. Introduction

The power grid system plays a crucial role in the electrified society. A reliable power grid, delivering electricity in the right quantity at the right time, is the backbone of the green transition. As non-renewable energy sources are being phased out, the share of photovoltaic (PV)- and wind-power is increasing rapidly. In the European Union, 295 GW of variable renewable energy sources were installed in 2021 [1], and these capacities are predicted to more than double by 2030 [2]. Introducing more renewable energy sources to the power grid comes with challenges, as these energy sources are more intermittent and less predictable than the traditional suppliers. Keeping the frequency stable is critical for a reliable power grid system, and its ability to handle the residual load at all times defines its flexibility. With less predictable electricity generation, a greater amount of flexible power needs to be available. Large-scale battery energy storage systems (BESS) can balance the grid, providing both charge and discharge power. In 2030 a large part of the installed flexible power is predicted to come from batteries, especially when it comes to rapid, under 4 h power delivery [2]. Lithium-ion batteries offer a viable solution to efficiently store and use electric energy in both mobile and stationary applications.
The flexible power needed to support the grid can be categorized into different service cycles, depending on the time span and power. The U.S. Department of Energy categorizes these services into bulk energy services (electric energy time-shift/arbitrage), ancillary services (voltage support, ramping support for renewables, black start, frequency regulation), transmission infrastructure services (transmission upgrade deferral, congestion relief), distribution infrastructure services and customer energy management services (power quality, power reliability), to mention some [3]. These services can also, in some cases, be stacked together to increase the utilization of the energy storage and the flexibility in the power system. Figure 1 shows how a BESS can balance through shifting energy between both high production and high consumption periods, but also how it can smooth shorter variations and noise.
BESS with lithium-ion batteries can provide all these services, but the reliability and profitability are crucial aspects to be addressed before a widespread implementation. Reliable frequency regulation (FR) service and the allowed access to the ancillary market was demonstrated by Koller et al. and Borsche et al. [4,5] using grid-connected BESS. With a faster ramp-up time than any conventional energy storage system, BESS was proven to be an excellent solution. In less dynamic cycles, such as peak shaving (PS) applications, the profitability of BESS over traditional peaking resources depends on many parameters. The effect of the energy demand pattern for BESS profitability was investigated by Denholm et al. [6]. Additional potential was observed with more renewable generation, as BESS can work as an energy sink during low value PV generation, thereby enabling greater PV deployment.
To optimize BESS profitability, a significant amount of research is now focused on operation and planning strategies, including capex, service life, and usability. Münderlein et al. [7] showed that an increased profit can be achieved by the use of different degrees of freedom during operation, such as a frequency dead band, allowing a larger deviation from the set frequency. A cycle counting algorithm was applied to include battery degradation effects. Gatta et al. [8] investigated BESS for FR service in different operation modes, with varying C-rates and droop values (voltage drop as a new load is connected to the power network). They concluded a trade-off between lifetime and overall efficiency of the system, as can be expected with a low droop, leading to a more intense battery cycling. Rahman et al. [9] developed bottom-up technoeconomic models comparing different battery chemistries and BESS applications. The battery capital cost, lifetime (related to the depth of discharge), and round-trip efficiency were the most sensitive parameters for the total investment cost and the levelized cost of storage. Highlighting the importance of accurate battery lifetime estimations and high BESS utilization. Kucevic et al. [10] focused on developing standard BESS profiles to better compare performance and efficiency. By simulating FR and PS applications over a year, they obtained 4% and 7% capacity loss, respectively. For future work, the need for a more detailed study on battery degradation was highlighted.
Lithium-ion battery degradation is a complex chain of mechanisms, where the main degradation phenomena are the loss of active material in the positive electrode (LAMPE) and the negative electrode (LAMNE), as well as the loss of cyclable lithium (LLI). While the degradation in vehicle applications have been studied extensively [11,12,13], only a few studies have focused on identifying the degradation phenomena related to stationary applications. Crawford et al. [14] compared LiNi0.8Co0.15Al0.05O2 (NCA) and LiFePO4 (LFP)-based batteries subjected to a combination of stationary services and with or without the addition of an electric vehicle drive cycle. They presented different rates of increased cell resistance, especially for NCA when including the EV drive cycle, and identified LLI as the main degradation phenomenon. An extensive work was performed by Dubarry et al. [15,16], analyzing power profiles for BESS and identifying stress factors for accelerated battery degradation by analyzing the data obtained from three years of real usage as a 1 MW/250 kWh BESS was employed for FR and wind power smoothing. The data was categorized in terms of C-rate, pulse duration, state-of-charge (SOC) swing, SOC ramp-rate, and module temperature. In a subsequent study, they tested the stress factors on LTO/NCA pouch cells and quantified the resulting capacity fade. A more thorough analysis of the degradation modes was performed by Baure and Dubarry [17], cycling the cells under different use regimes and temperatures. The most degrading regime was cycling between 50–85% SOC, where LAMPE dominated. From comparing 5% SOC swings with 75% SOC swings in the medium SOC region, it was revealed that after 450 days of cycling, the capacity loss was similar; however the internal degradation mechanism varied, with almost double the amount of LAMPE.
As different degradation modes are revealed in previous research, depending on the application, the need to understand the couplings to specific service cycles is evident. With power grid planning and operation strategies at the early implementation stage, this knowledge would also be highly valuable. The internal degradation might not directly affect the available capacity of the cell, but it will have an impact on the power and capacity over time. Thoroughly tracking the degradation under different conditions is therefore necessary for accurate lifetime estimations. This will be of particular importance in more demanding applications, such as for combined services.
In this work, lithium-ion battery degradation, in single as well as multi-service applications, is studied. Duty cycles adopted from real-use case FR data and PS cycling are applied. For comparison, some cells are also calendar-aged at 50% and 78% SOC. The cycles are chosen, as their characteristics can be applied to several other services, including dynamic and full charge/discharge profiles. The degradation analysis involves different techniques, such as the capacity evolution and the electrochemical impedance spectroscopy (EIS), as well as changes in the electrodes revealed by differential voltage analysis (DVA). A thorough investigation of different degradation mechanisms is performed and coupled to specific characteristics of the duty cycle profiles. Understanding the consequences of combining service cycles, as well as potential performance limitations, will be crucial for multi-service applications. An easily implemented method to track dominating internal degradation modes is also investigated. The results will contribute to more accurate lifetime estimations and help improve the full utilization of batteries in stationary energy storage applications.

2. Materials and Methods

Cylindrical 18,650 cells with 2.6 Ah capacity from Samsung (ICR18650-26H) were purchased specifically for this experimental study. A nickel-rich cathode chemistry was chosen, as these cells are the most commonly employed in BESS today. A safe operating voltage of 2.75–4.2 V and a maximum current of 5.2 A were specified by the manufacturer.

2.1. Initial Characterization

We performed a beginning of life (BOL) characterization, including capacity measurements and EIS. The capacities were measured at rates of 1C (2.6 A) and C/20 (0.13 A), defined from the nominal capacity. A 1C-rate corresponds to the current needed to discharge the battery in 1 h, C/20 in 20 h, and so on. EIS was performed at 50% SOC, with a current perturbation of 260 mA and a frequency range of 50 mHz–3000 Hz, using a Gamry PCI/750 Potentiostat/Galvanostat and a four-point connection cell holder. The battery SOC was defined from the C/20 discharge curve via coulomb counting.
We conducted a cell opening to further characterize the single electrode materials. This was performed in an argon-filled glove box to avoid moisture and oxygen reacting with the cell materials (<1 ppm O2, <1 ppm H2O, LC Technology Solutions). Scanning electron microscopy (SEM) and energy-dispersive X-ray spectroscopy (EDX) images of the electrode materials were captured, and the chemical composition of the electrodes could be determined from EDX. The positive electrode active material was shown to consist of Li(Ni0.5Co0.2Mn0.3)O2 (NCM523), and the negative electrode was based on graphite.
For electrochemical analysis the harvested materials were reassembled in a three-electrode setup (EL-CELL, ECC-PAT-core) with a lithium reference electrode. The active material from one side of the electrodes was first removed by adding droplets of N-methyl-2-pyrrolidone (NMP) and then scraping. With the current collector exposed on one side, circular electrodes were then punched. The electrodes, 100 µL electrolyte (1 M LiPF6 in 1:1 EC:DEC vol., BASF Selectilyte® LP40), and the reference electrode were then reassembled in the three-electrode setup.

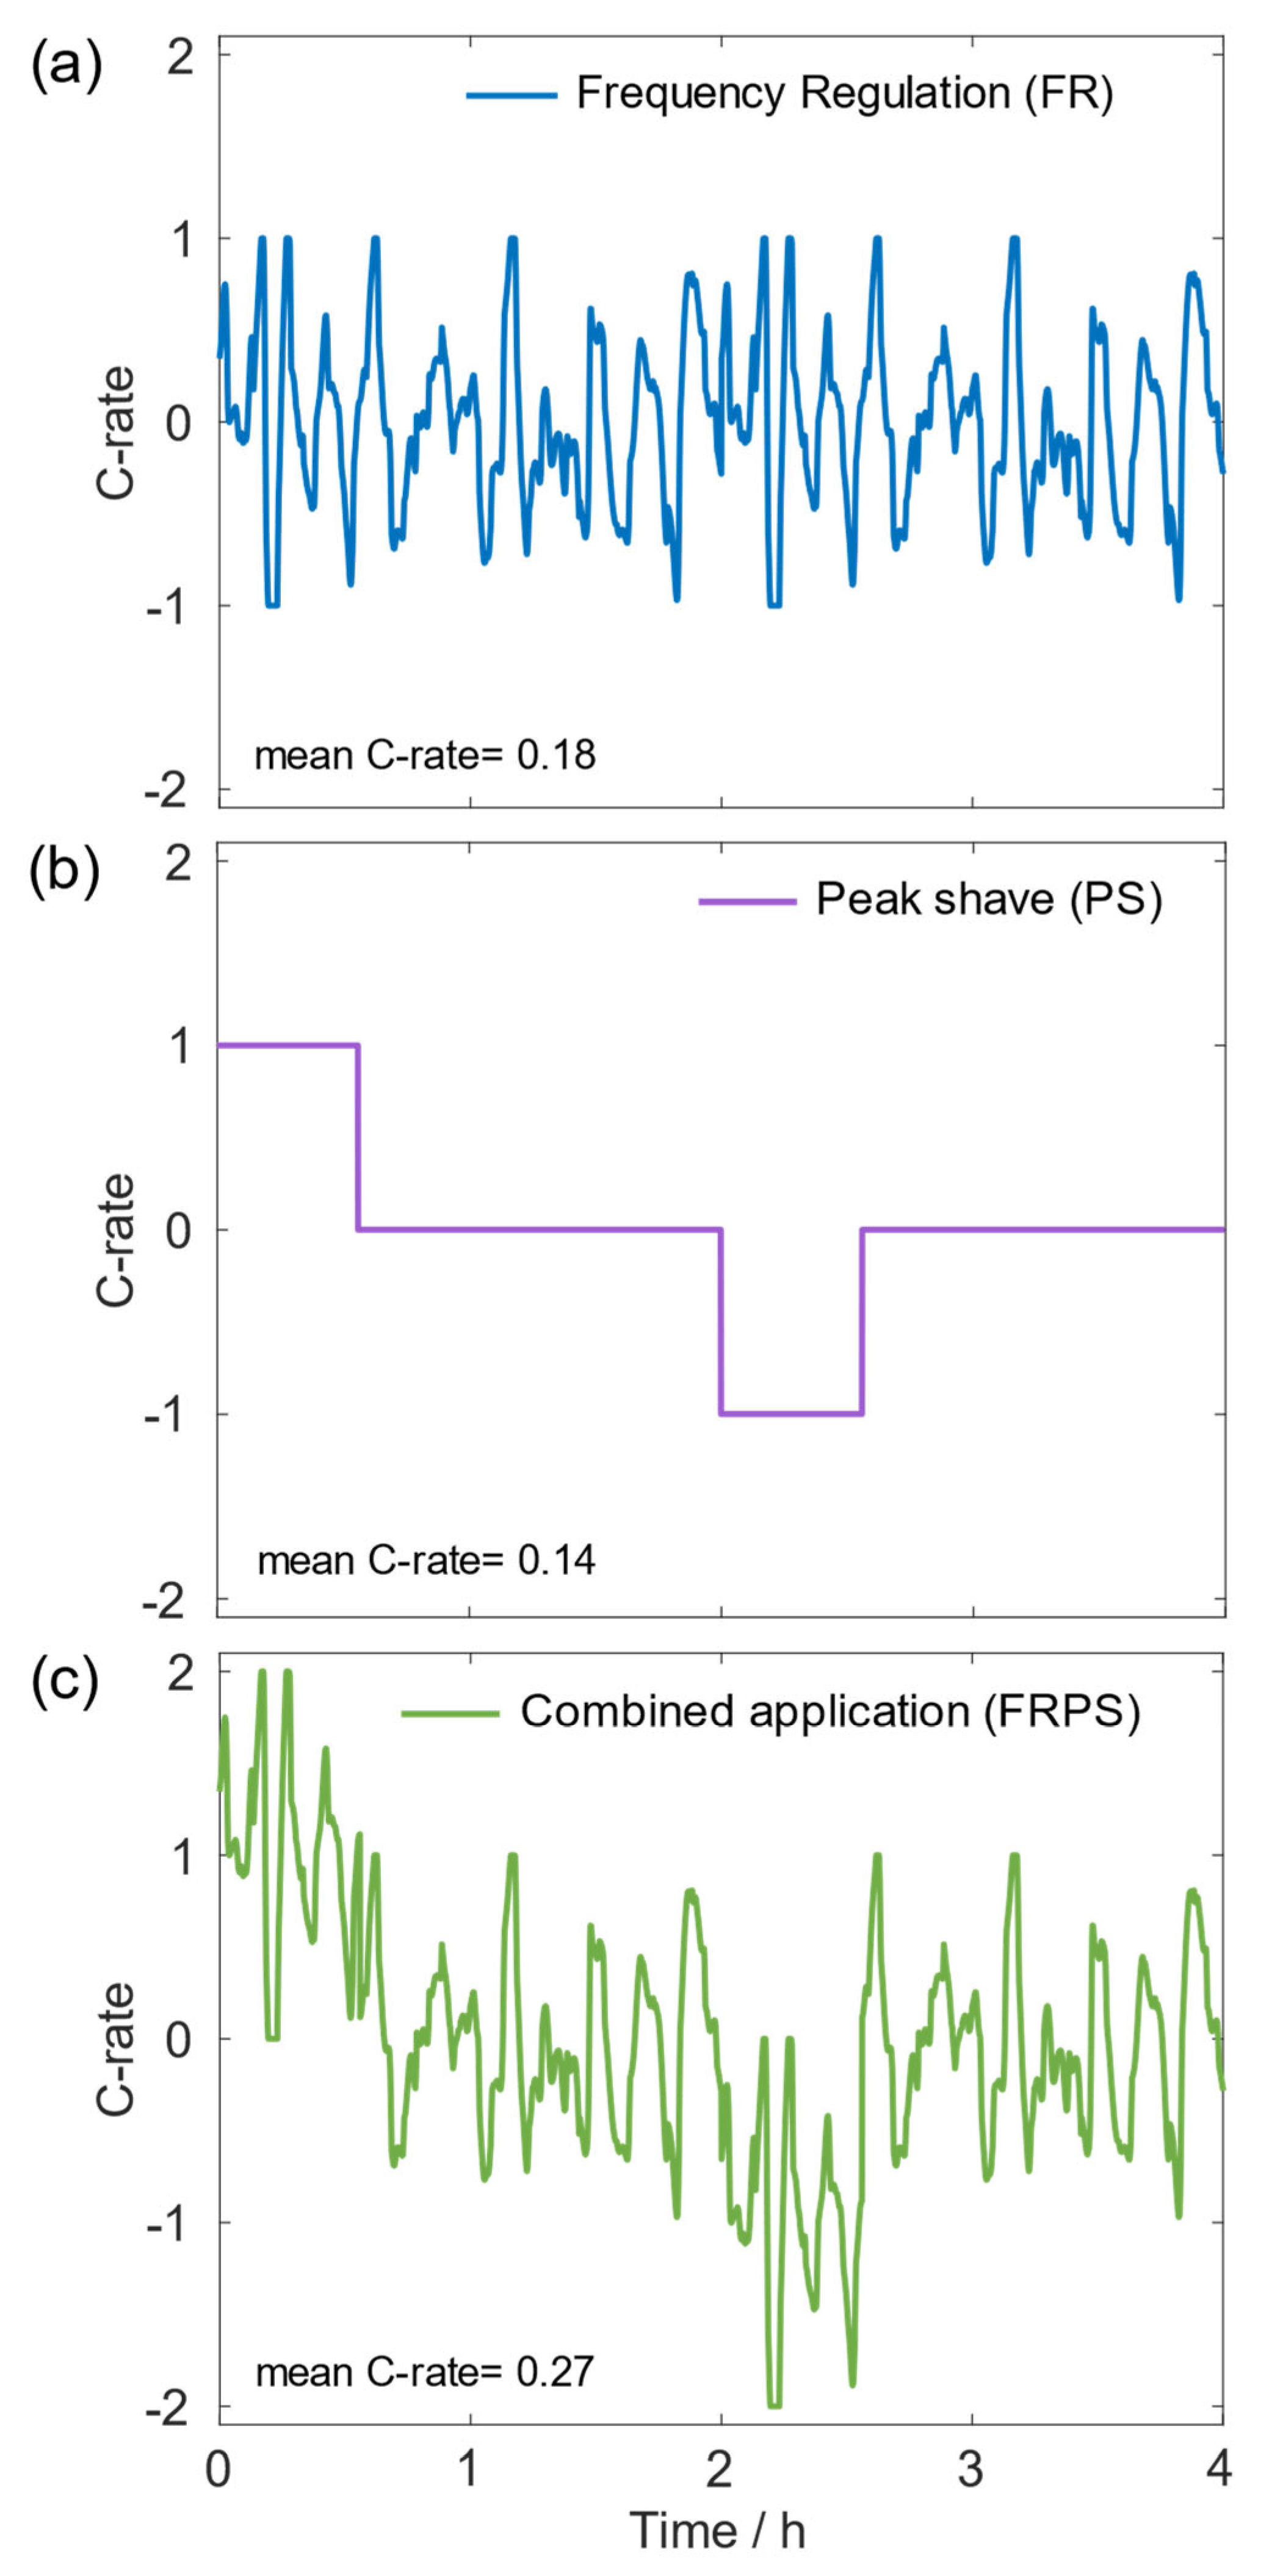
2.2. Cycling Procedure

The degradation protocol consisted of three different dynamic cycles (FR, PS, and the two combined, referred to as FRPS), as shown in Figure 2, and two calendar aging tests (50% SOC and 78% SOC). The tests were performed with an 8-channel ARBIN LBT-5V-60A battery tester (FR- and FRPS-cycles) and a NEWARE BTS-4000 (all remaining). The cells were kept in a climate chamber (Friocell 111 Comfort MMM Lab) at 40 °C to accelerate the degradation, without introducing additional degradation phenomena. To confirm this, a reference calendar aging tests at 50% SOC was also performed in a climate chamber at 25 °C. Duplicate cells were investigated for each condition, resulting in a total of 14 cells.
The FR-cycle was taken from data published by Sandia National Laboratories in their report “Protocol for Uniformly Measuring and Expressing the Performance of Energy Storage Systems” [18]. The data is representative of a 2 h FR service, with a normalized power signal. The cells were cycled galvanostatically, and the power signal for the FR-cycle was therefore scaled by the nominal 1C current. The current profiles were set symmetrical. Additionally, a 4 h PS-cycle was designed with a 1C current and SOC window of 22% SOC–78% SOC. The third cycle is the sum of the FR and PS currents, resulting in a cycle with a maximum current of 2C and a SOC window of 16% SOC–84% SOC. After 20 h, a low current was applied to reset initial SOC and correct for possible drift.
Testing was paused every two weeks to perform a reference performance test (RPT). The RPT was performed at 25 °C, and the protocol used is explained in Table 1.
Finally, a post-mortem analysis was performed at end of test (EOT). The aged cells were completely discharged and opened in an argon-filled glove box. Visual inspection and SEM were subsequently performed on the electrodes.
Data correction due to calibration. A calibration performed for the NEWARE battery tester after 12 weeks of cycling created an offset for some of the measured results. As the current had been slightly overestimated/underestimated on some channels, a scaling value of +/−3% was applied to the raw data before calibration. The values for each channel were determined by matching DVA data measured just before and after the calibration. This scaling factor had to be applied to 6 of the 12 channels. The channels that were calibrated with an increase in current subsequently experienced a drop in the measured 1C battery capacity. This capacity drop due to an increased cell current was corrected for by a scaling factor of −1%, which was applied to 3 of the channels. The value was obtained from the cells subjected to calendar aging by assuming 0% degradation in that period.

3. Results

The results of this work are presented through five independent techniques for the analysis of the battery degradation. The performance losses are first studied through capacity and cell polarization. To further investigate the sources of degradation, two different electrochemical techniques are applied: EIS and DVA. Finally, SEM pictures of the harvested electrodes are studied. We close this section by estimating the battery lifetime under normal operation conditions, following a discussion on the effect of combining cycles and the BESS operation strategy.

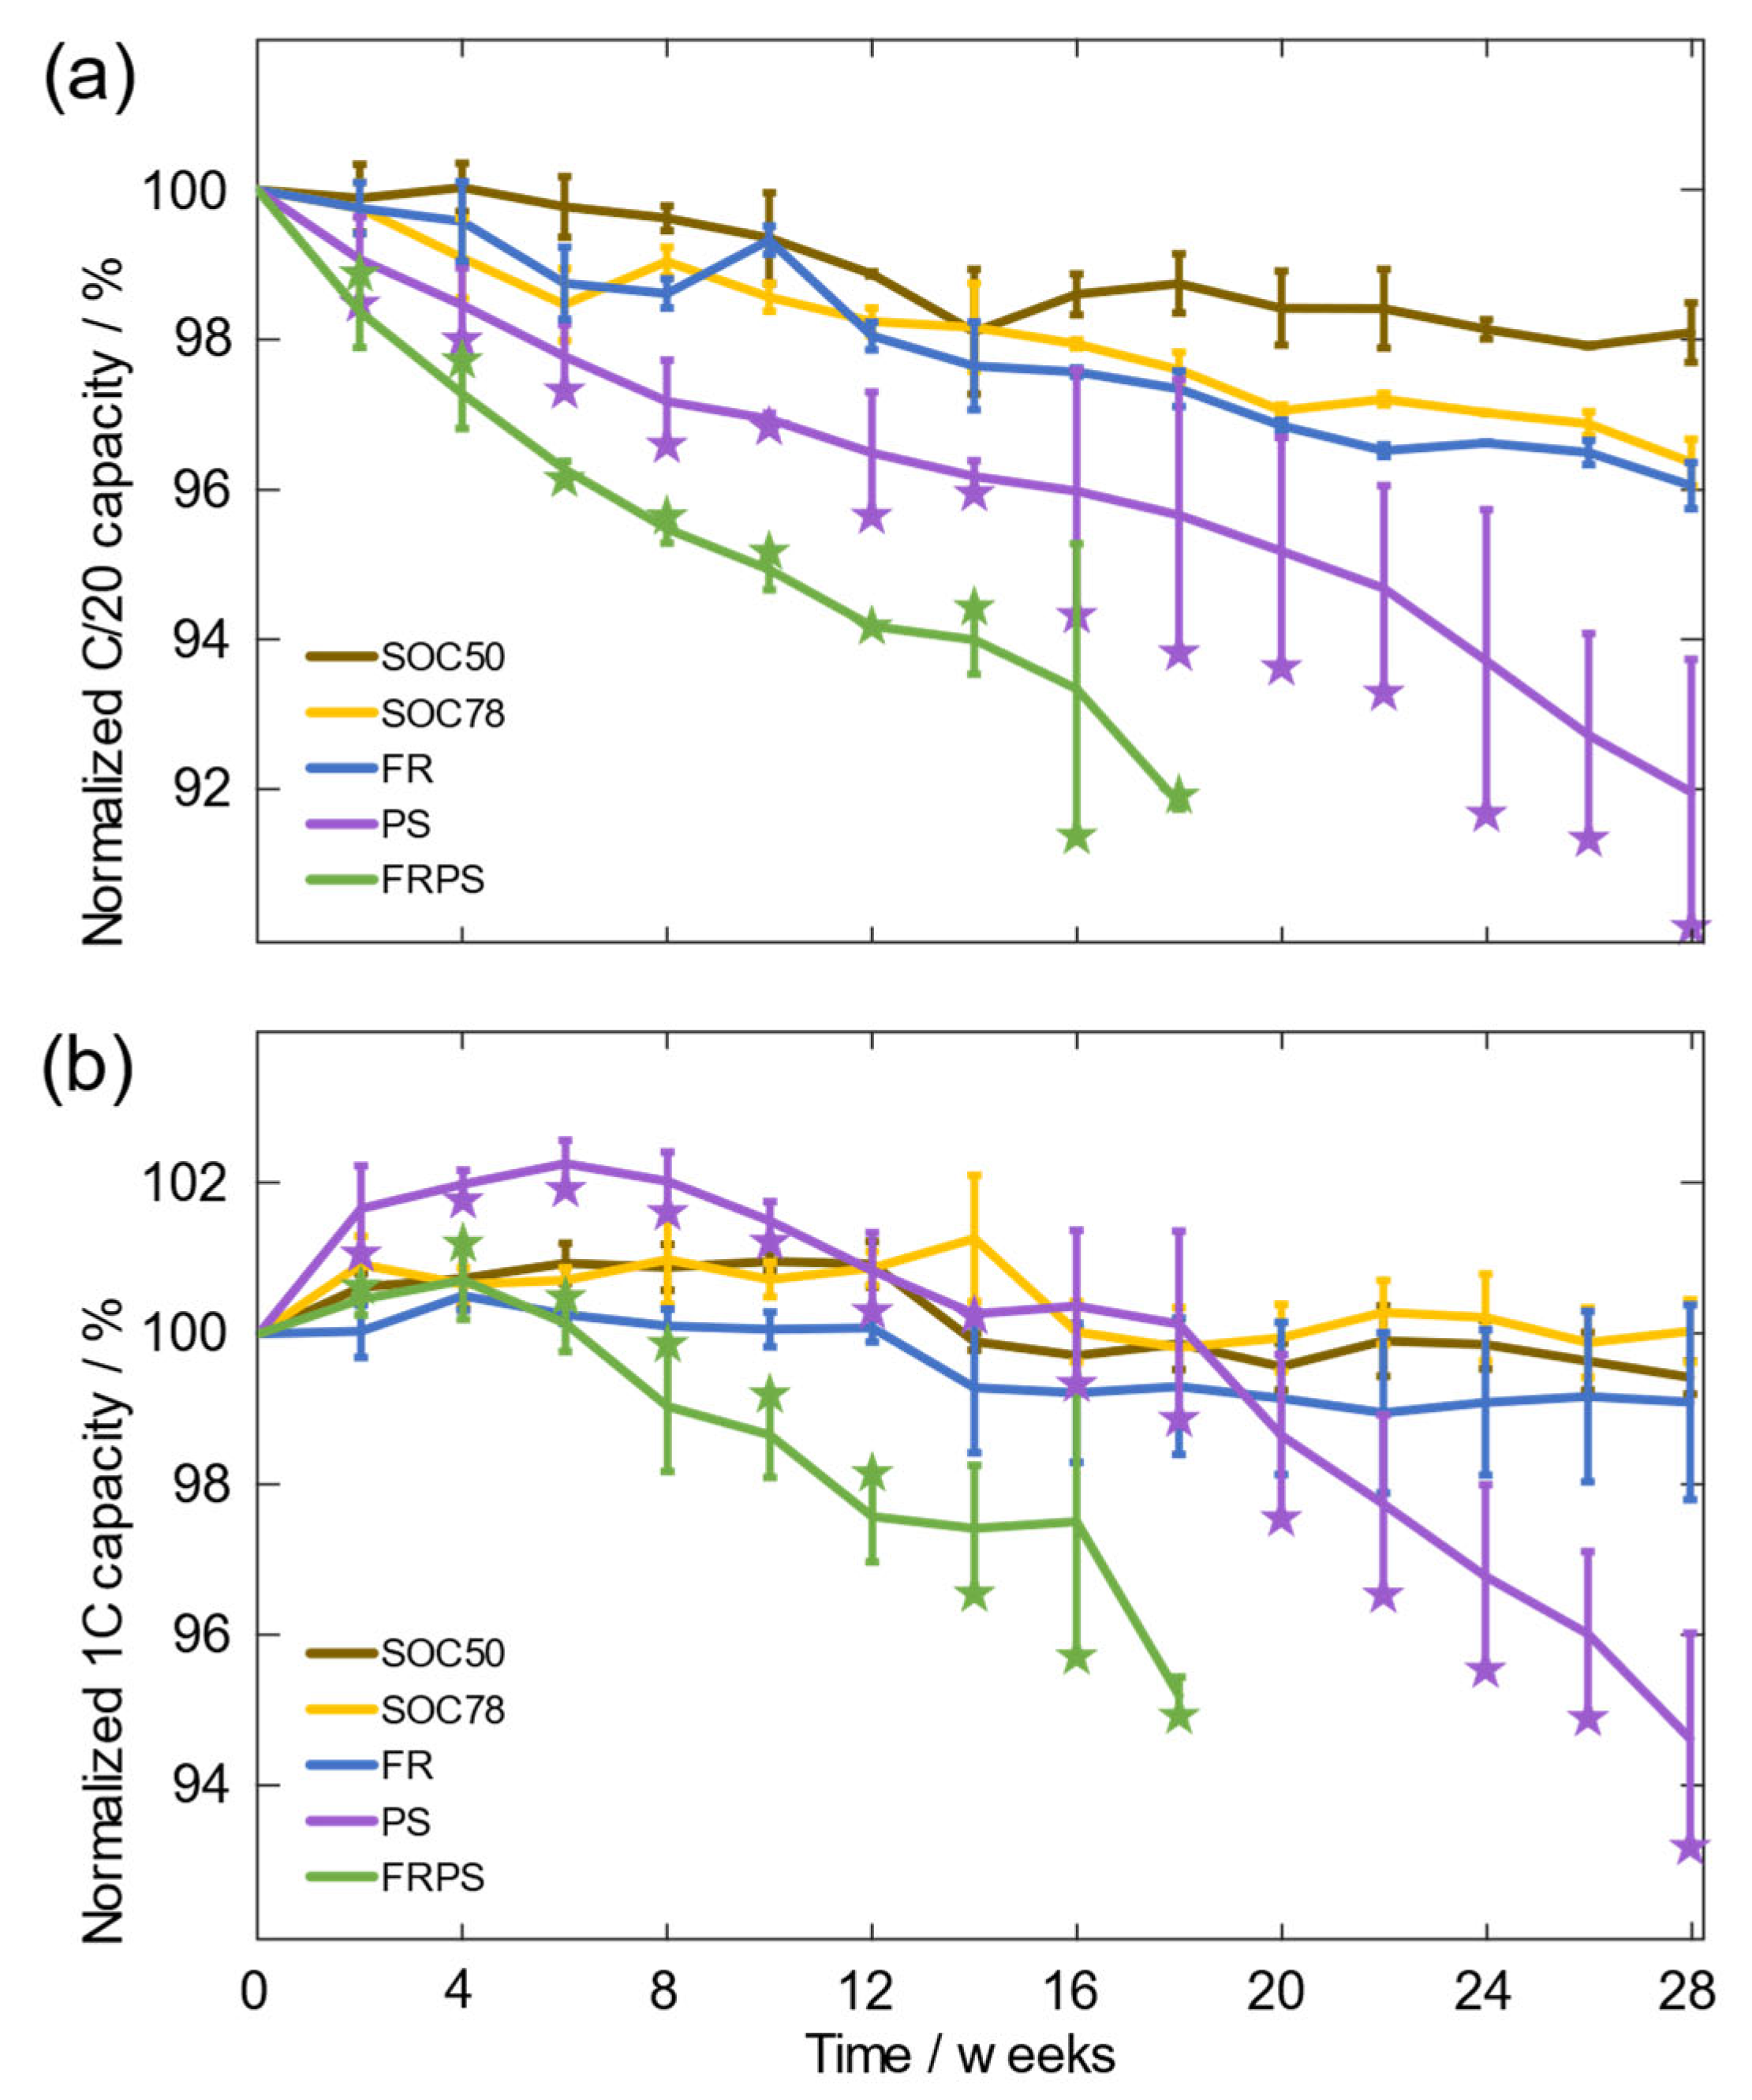
3.1. Performance Losses

The capacity evolution of the cells over time varied with the service cycle, as can be seen in Figure 3a. As expected, the FR-cycle was the least degrading cycle in terms of capacity loss. However, with a higher average current than the PS-cycle, the SOC window of the FR-cycle is very narrow and kept close around 50% SOC. Moreover, the loss is larger than that of the calendar aged cells at 50% SOC. The SOC window for the PS-cycle is 22–78% SOC initially, and the capacity loss is 8% after 705 equivalent full cycles (EFC), defined as a full charge of the battery (2.6 Ah) and one full discharge.
The capacity measured at a 1C discharge rate, defined by the nominal capacity, is shown in Figure 3b. Here, more of the polarization is captured due to the higher current. A drastic decrease in capacity can be seen for the FRPS cells, and after 18 weeks of cycling, the PS cells show a similar trend. The initial increase in capacity for the PS cells is a bit unexpected, and was measured for both duplicates. It is believed to stem from a protective coating layer on the electrode surface and will be discussed more fully in the next section. The initial capacities of the cells are shown in Table 2.
The large increase in polarization from the FRPS application resulted in a widening of the voltage window, as can be seen in Figure 4. After 870 EFC, the voltage limits of the batteries were reached, and the cycling had to stop, although a 92% capacity was still remaining. This result is highly relevant for BESS operation and planning. During operation, the conditions in which accelerated degradation occurs should be limited to avoid power limitations. With more polarization losses, the power efficiency of the battery will decrease. The drastic voltage decrease at low SOC is most likely due to the steeper open circuit potential gradient in those regions, an effect of the electrode thermodynamics. The FRPS cells had an initial power efficiency of 94% and at end of test, the efficiency was 89%, calculated from the performed service cycles. A similar decrease was measured for the PS-cycled cells at end of test. This indicates that the more power-demanding FRPS cycle does not introduces any major additional degradation, but the cycle itself is more challenging for the battery to perform. From a BESS planning perspective, the remaining capacity of the cells could potentially be used in a less demanding application, such as FR.

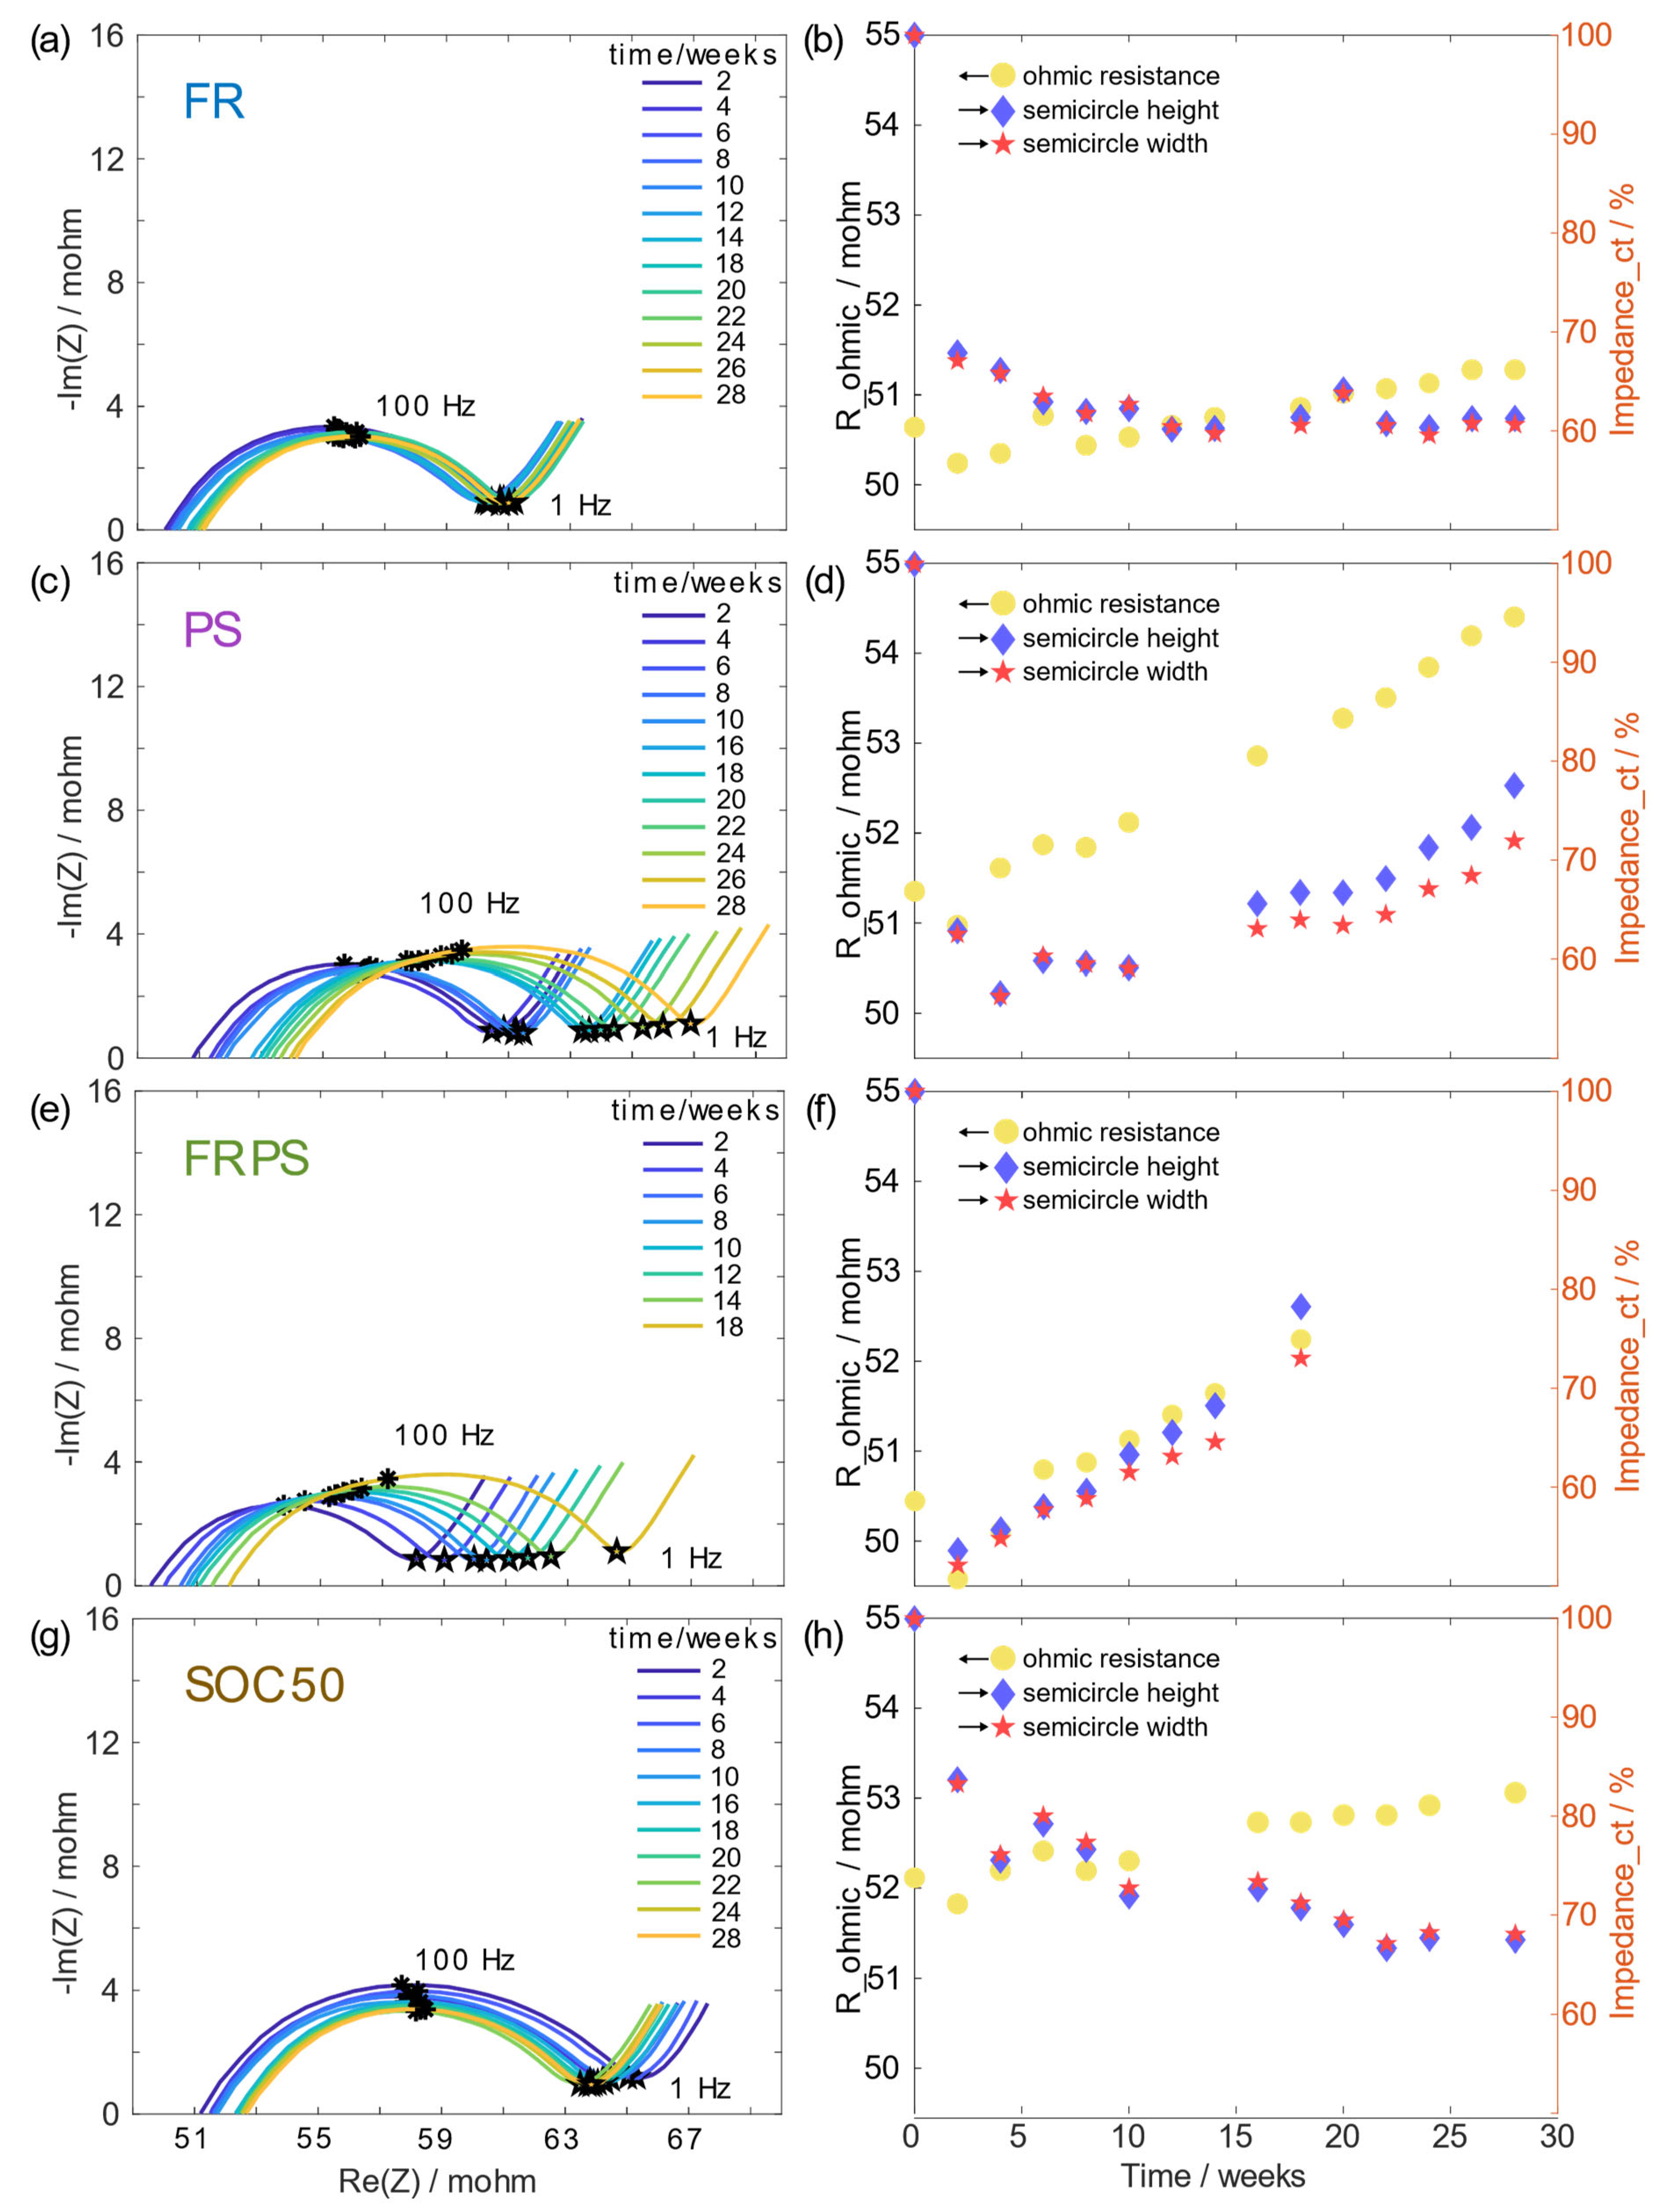
3.2. Electrochemical Impedance Spectroscopy

To better understand the power limitations of the cells, EIS can be applied to characterize the material properties [20,21] and analyze the degradation phenomena in lithium-ion batteries [22,23,24]. It is a versatile technique, applying a sinusoidal current or potential signal with varying frequencies. In a so-called Nyquist plot, the imaginary and real part of the impedance is plotted for every frequency. As a result, the different reactions taking place in the battery can be separated from their specific timescales, as well as from the respective resistance.
The FR-cycle caused very few changes to the cell impedance, as seen in Figure 5a,b. A slightly increasing ohmic resistance (the high frequency intercept) is measured during the 28 weeks of testing. The local minimum of the -Im(Z(w)) at low frequency, followed by the “diffusion tail”, shows no increase, and the rate of lithium diffusion in the active material is therefore assumed unchanged [23,25]. The semicircle represents the charge transfer reaction at the surface of the electrodes, where the width represents the charge transfer resistance and the height shows the double layer capacitance [23,25]. The FR cells show no increase in the semicircle size, a similar behavior as observed for the 50% SOC calendar-aged cells, Figure 5g,h.
From BOL to the first RPT (after two weeks), all cells experienced a large drop in charge transfer impedance, Figure 5b,d,f,h. This is believed to arise from a coating layer on the electrodes preventing calendar aging, as the cells have remained in storage. Aluminum, probably in the form of aluminum oxide, was identified by EDX at the surface of the positive electrode as well, confirming this theory. Presumably, this protecting layer was partly dissolved as the cells were subjected to cycling. The calendar-aged cells show a continuous decrease in charge transfer resistance, indicating that the protective layer has not been completely dissolved.
Clear trends of degradation and increased impedance can be seen in Figure 5c,e, for the FRPS- and PS-cycled cells. The ohmic resistance and the size of the semicircle increases. With a growing semicircle, the impedance of the charge transfer reaction increases, as well as the total cell polarization. Full cell impedance includes the charge transfer reaction on both electrodes, as well as on the possible surface layers. Separating the contributions is sometimes possible with additional measurements in half-cell configurations, but in this work, we compare the size of the total semicircle instead. The width is measured as the distance from the high frequency intercept to the low frequency local-Im(Z(w)) minimum, and the height as the maximum value of the-Im(Z(w)). The evolution of the width and height of the semicircle is further shown in Figure 5d,f. While for the FRPS-cells the semicircle starts to grow continuously from the second RPT, the PS-cycled cells exhibit a stable semicircle during the first weeks of cycling, and thereafter, the subsequent increase occurs at a lower rate. At the end of test, the FRPS cells have delivered 870 EFC and the PS cells 705 EFC. Nickel-rich electrodes are known to lose capacity at high potentials due to transition metal dissolution and particle cracking. This can result in an increase in both the width and height of the semicircle [23,26,27,28]. An increased thickness of the solid electrolyte interphase layer (SEI) is also known to increase the charge transfer resistance, mainly at these frequencies [22,23].
The cells also experience a rather constant increase in the ohmic resistance. This is known to increase with time as the electrolyte decomposes, and it will shift the semicircle to the right [24]. Degradation phenomena, such as cracks in the active material particles, exposing fresh surface to the electrolyte, as well as transition metal dissolution, can accelerate these reactions. Finally, the low frequency “diffusion tail” shows a higher impedance with time for the FRPS- and PS-cycled cells, indicating a decreased rate of lithium diffusion in the active material.

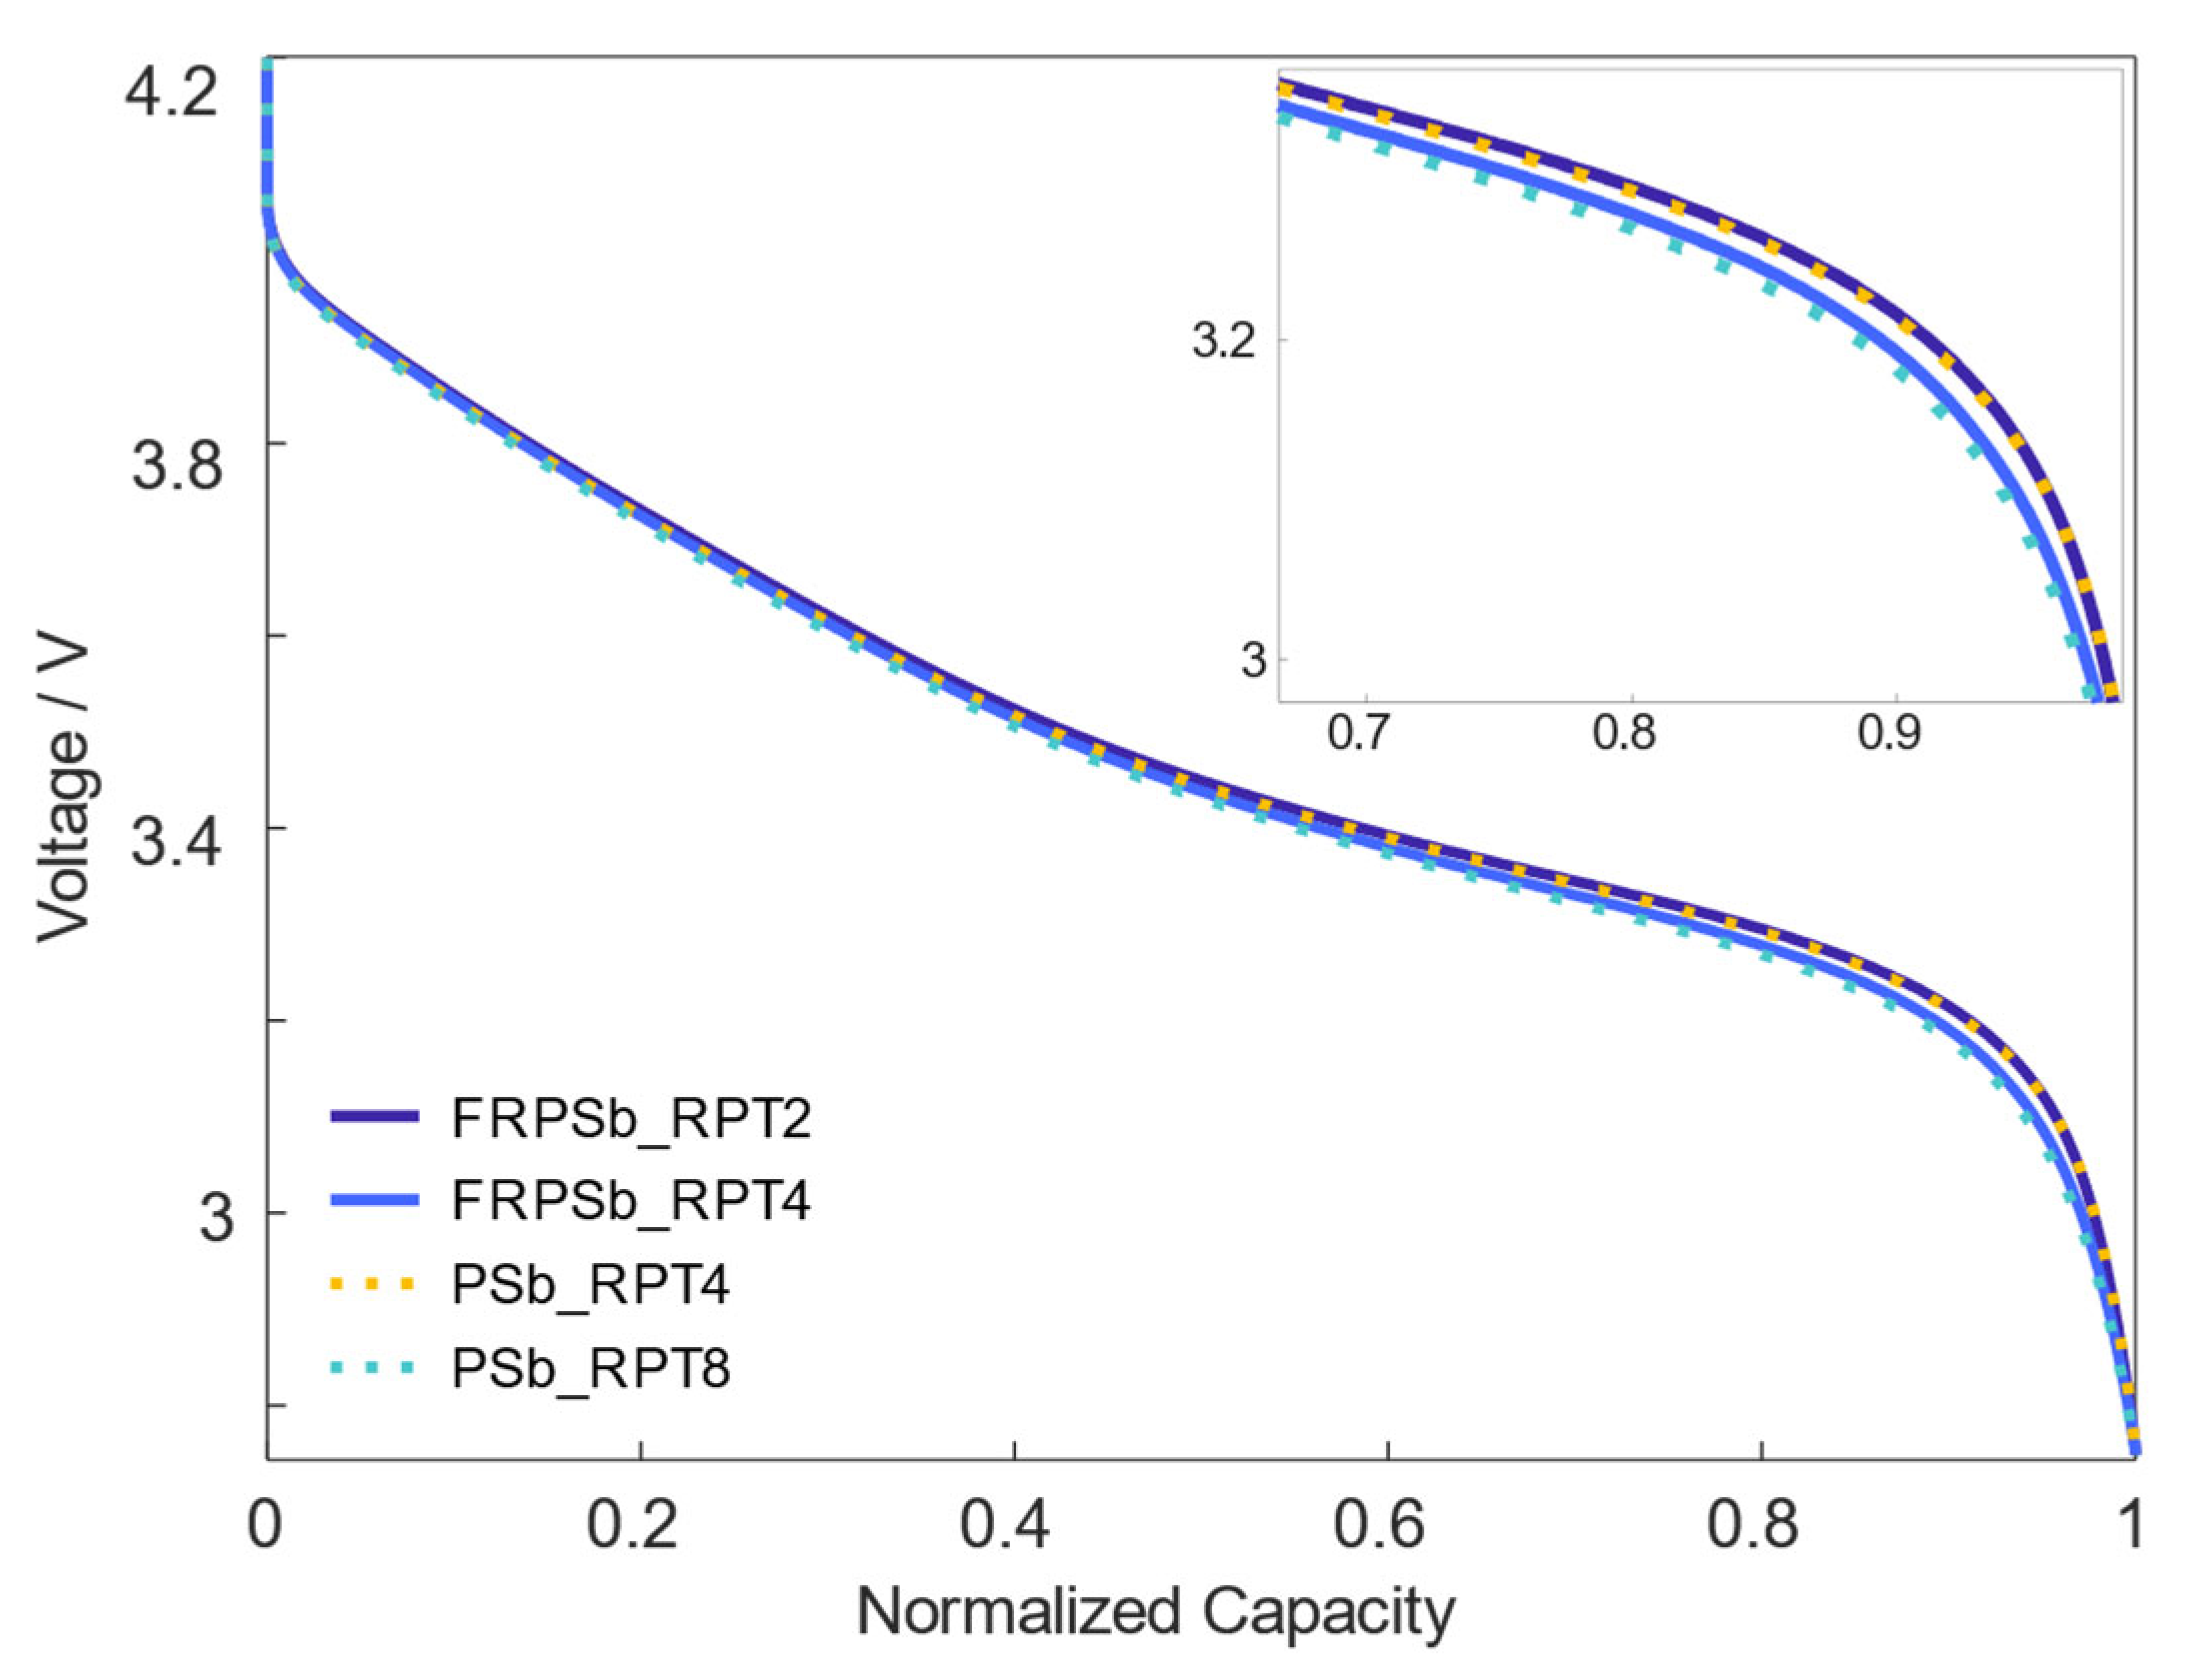
3.3. Differential Voltage Analysis

To study changes in the positive and negative electrodes, DVA was applied, i.e., the derivative (dV/dQ) of a low current discharge with respect to capacity. A smoothing approach, as suggested by Li et al. [29] and Smith et al. [30], in which a pre-processing of the raw data by smoothing with a moving average over a 0.55% SOC span, followed by a Gaussian filter with a 3.0% SOC span, was applied to obtain distinguishable peaks. For DVA analysis, dV/dQ data is plotted against Q and highlights single phase regions that can be separated for each electrode. DVA has been demonstrated as a valuable tool for analyzing the internal sources of battery degradation, as well as the electrode balancing [31,32,33,34].
The DVA measured in a three-electrode setup with a lithium-reference is shown in Figure 6a. The contributions from the positive and negative electrodes add linearly to the full cell data accordingly
( d V d Q ) c e l l = ( d V d Q ) c a t h o d e ( d V d Q ) a n o d e
The results from the three-electrode setup correspond well with the 18,650-cell measurements, as all features remain similar in shape and position, Figure 6b–d. The features from the positive electrode are harder to distinguish compared to the clear peaks from the negative electrode. From Figure 6a, it can be concluded that the area right after the steep slope at the beginning of discharge, as well as right before the steep slope at end of discharge, is controlled by the positive electrode gradient. If LAMPE occurs, the total width of the positive electrode DVA plot will decrease.
The DVA of the cycle-aged cells with time can be seen in Figure 6b–d, where the total cell capacity loss is visible as a decrease in the total width of the plotted graph. Different profile changes highlight differences in the internal degradation. Most interesting is the change of the slope height at the beginning of discharge, in combination with the increased height of the final drop at end of discharge, as seen in Figure 6c,d. These two profile changes combined are the result of LAMPE. The PS-cycled cells (Figure 6c) do not immediately experience LAMPE, as is the case for FRPS, but after 10 weeks, the same trend appears in the DVA. This indicates an initial capacity loss due to LLI, and a combination of LLI and LAMPE after some cycling. The LAMPE also occurs at a lower rate than for FRPS. Interestingly, the timing in the DVA with LAMPE for the PS-cycled cells coincides with both the increased charge transfer resistance of the cells (Figure 5d), as well as with the decrease in 1C capacity, as seen in Figure 3b.
No indication of LAM can be seen from FR (Figure 6b), and this can therefore be excluded as a source of capacity loss. The shift of the peaks to a higher SOC results from a change in the electrode balancing [31]. As cyclable lithium is lost, probably due to SEI layer growth, the positive electrode will be driven to a higher potential during charging. Small changes in the electrode alignment will usually not have an effect on the battery capacity, since the batteries are manufactured with some margins.
When tracking the distance between the two graphite peaks (at a discharged capacity of 1.15 and 2.25 Ah) in Figure 6d, a decrease in capacity was observed. This is a commonly applied method to track LAMNE, but was shown to be misleading, in our case. The theory regarding losing active material assumes that it is uniformly lost. Hence, all peaks related to that electrode would move closer together [31]. In Figure 6d, although the distance between the two graphite peaks appears to decrease, the distance to the slope at the end of discharge (also limited by the negative electrode) does not. The cell is therefore not losing active material in the negative electrode. Rather, the change in the peak position is believed to be due to inhomogeneous degradation in the cell and a smearing out of the peaks. Inhomogeneous degradation of a cell will make the peaks in the DVA curve less sharp, as the different contributions from parts of the electrodes will smear out the full cell data. This has been experimentally proven by Sieg et al. [34]. Expanding the analysis in a future study would be needed to investigate this phenomenon further.

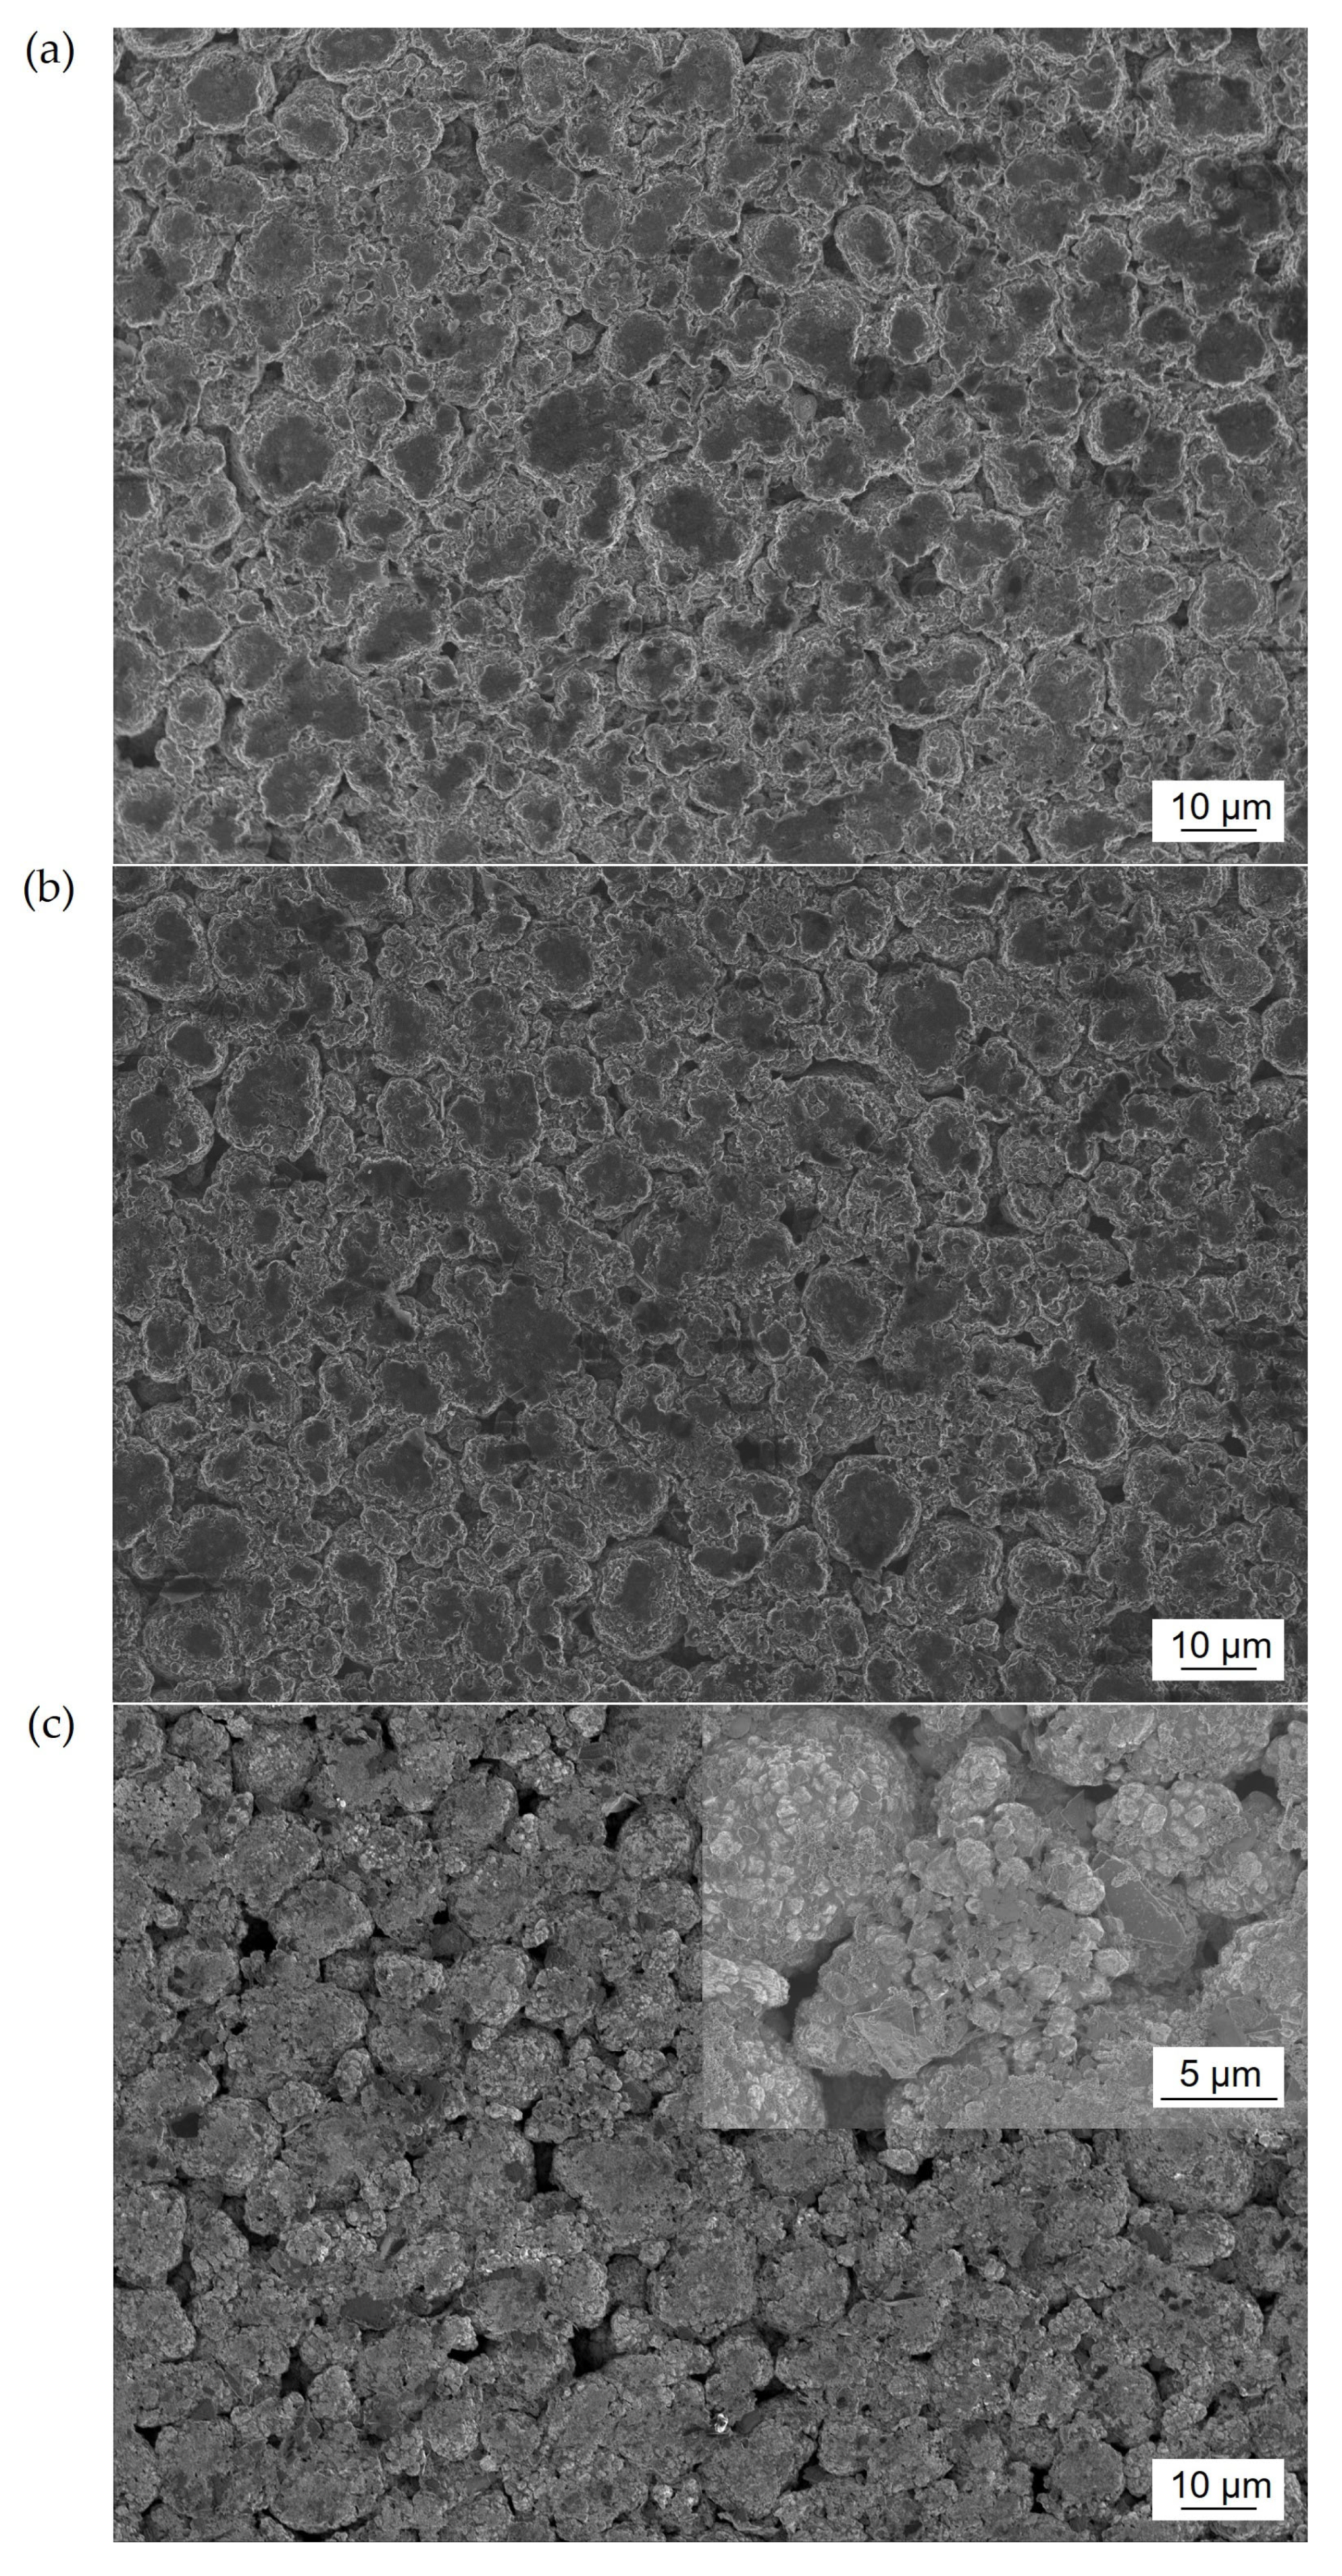
3.4. Scanning Electron Microscopy

Finally, a post-mortem analysis was performed and SEM pictures taken of the harvested electrode sheets. By comparing the positive electrode surface morphology of FRPS and PS with BOL, an increased particle porosity, as well as particle cracks, were visible over the whole surface after FRPS, Figure 7c. No clear morphology changes are visible for the PS-cycled cells, Figure 7b. The FR-cycled cells showed very little capacity loss at EOT and were therefore not included in the SEM analysis. Cracks in the secondary particles could explain the impedance increase in the batteries, as well as the LAMPE for the FRPS-cycled cells. While a larger active surface area for the intercalation reaction is beneficial, active material isolation and loss of contact will result in decreasing power and capacity performance.

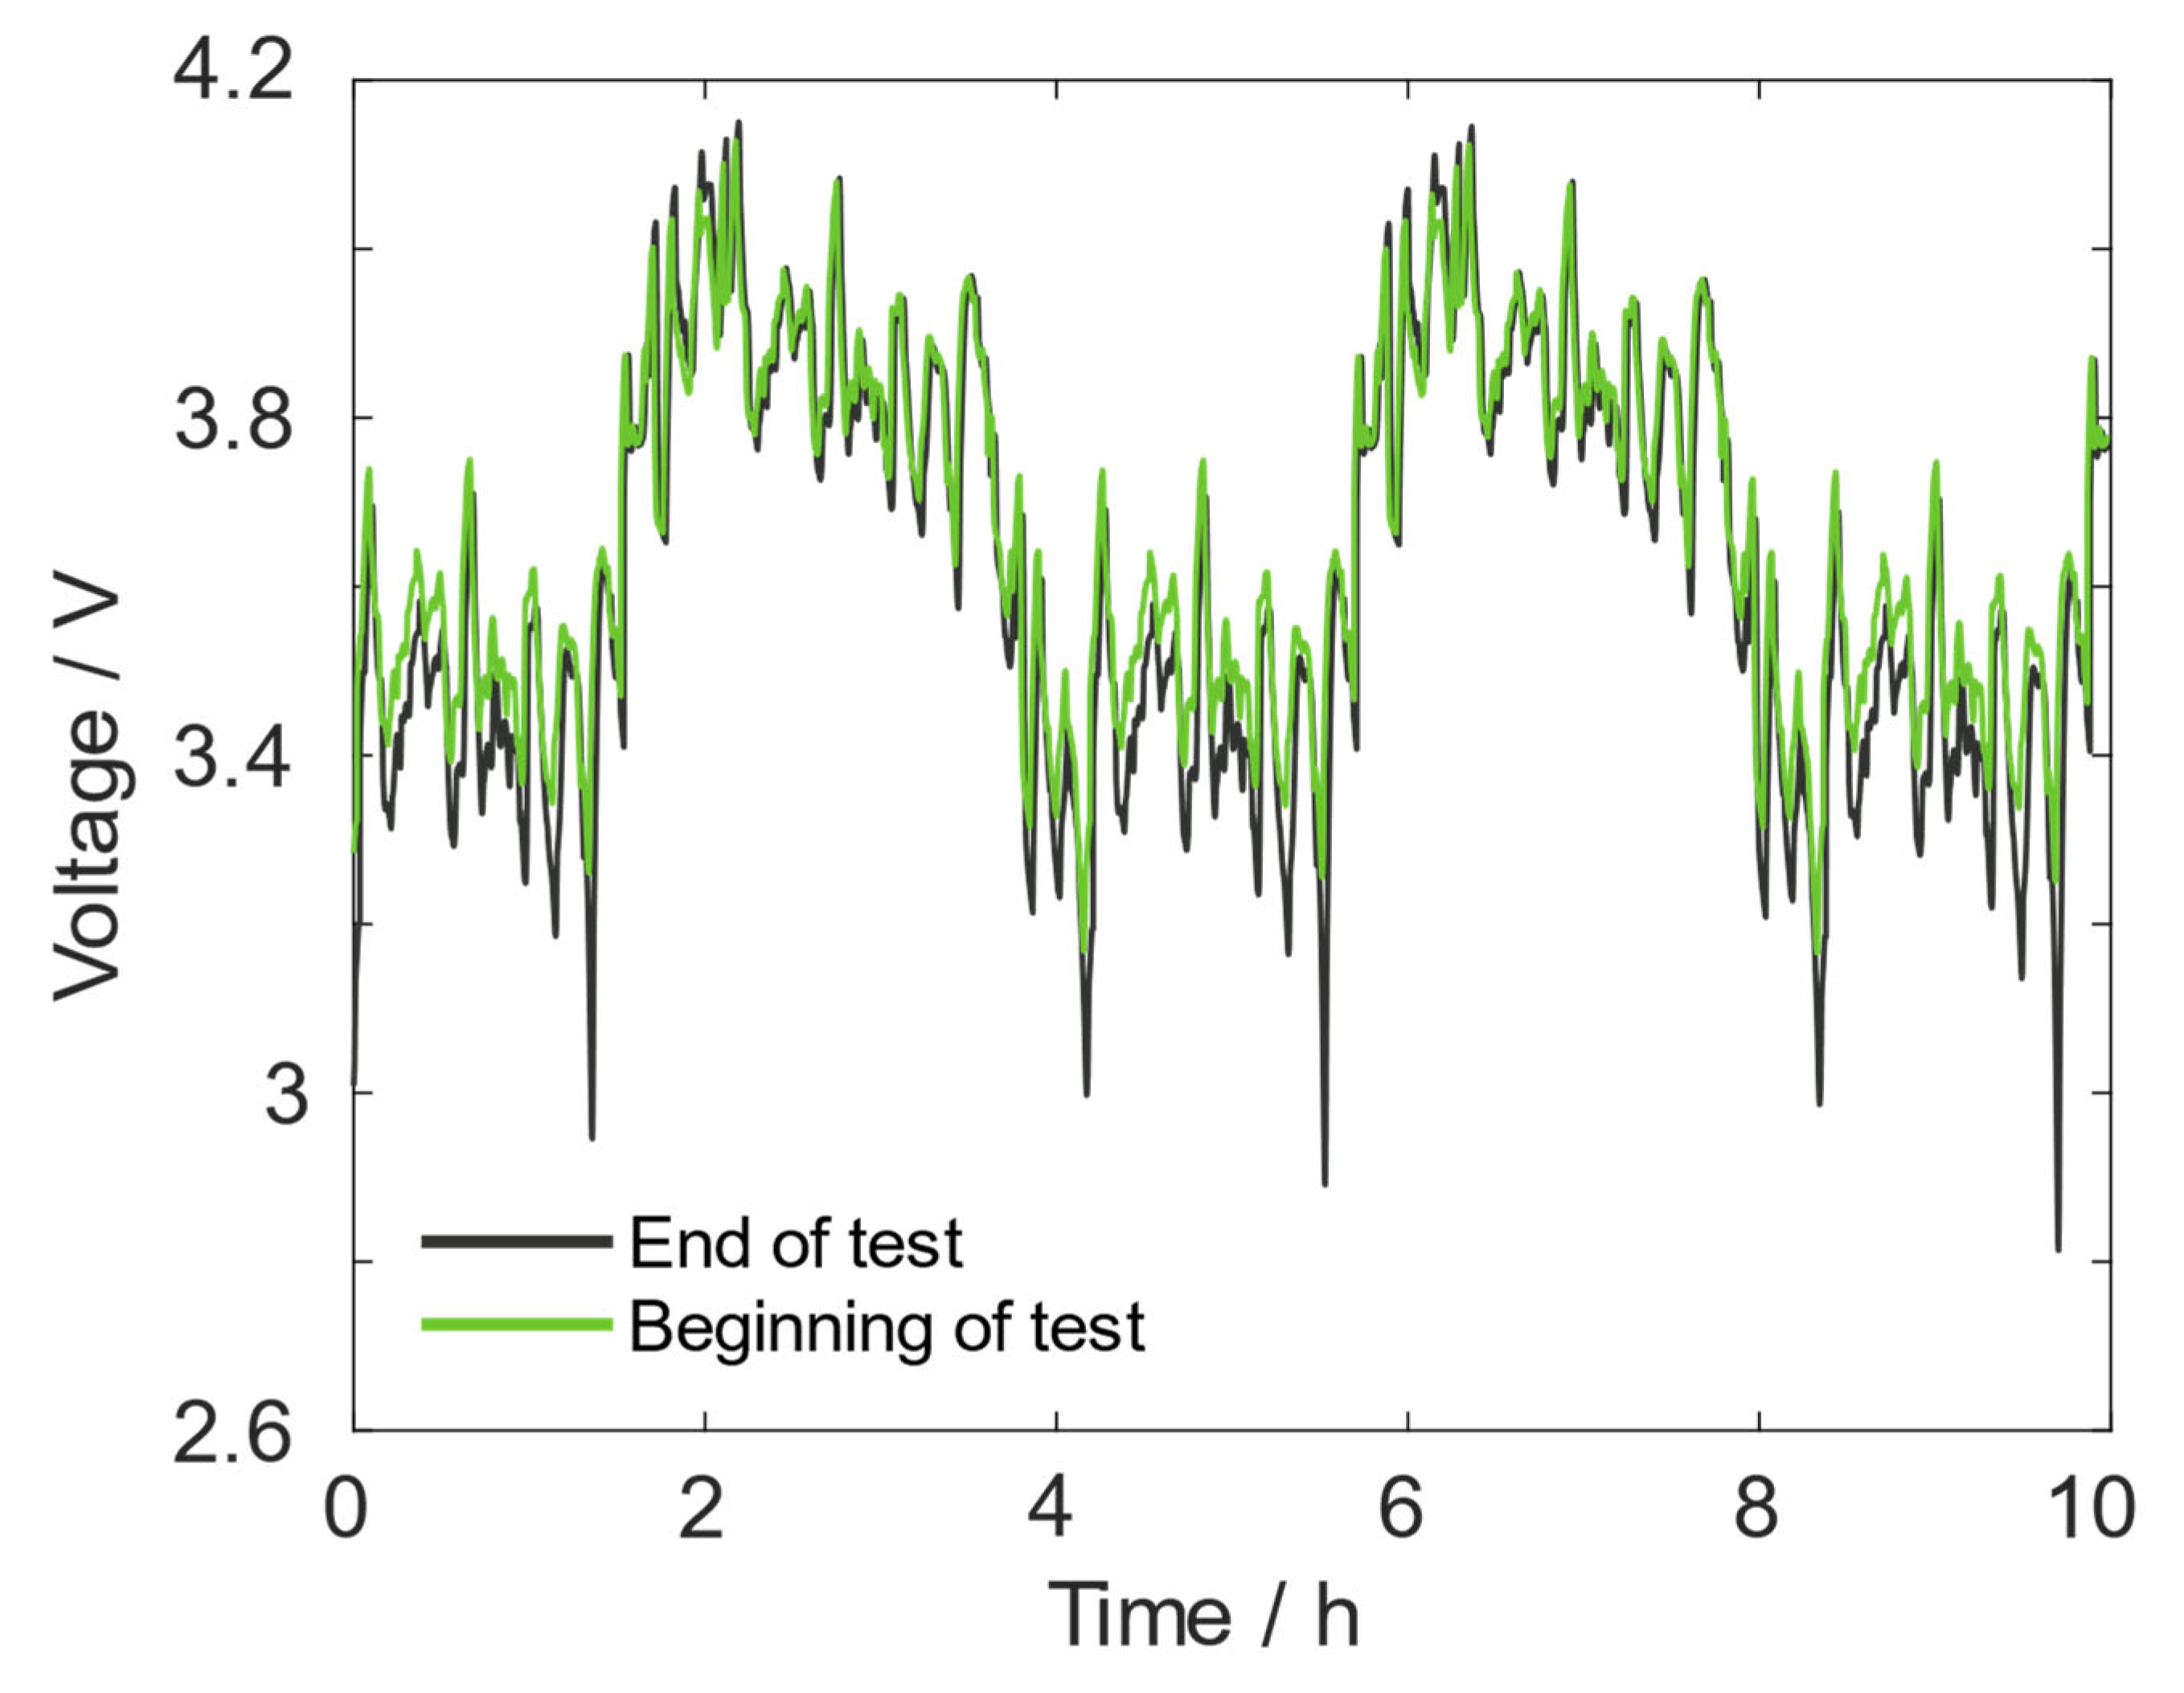
3.5. Effect of Accelerated Testing

Parameters used to accelerate the degradation of the cells included increased charge throughput and ambient temperatures. The PS cycle simulated full discharge 6 times a day, where in a real case, this might occur one time a day down to a few times a year. In some situations, the timing of the peak events is easier to estimate, as they will occur regularly. In those cases, the battery should be kept at a medium to low SOC to decrease the calendar aging rate. For a realistic PS lifetime estimation, we assume 1 peak per day and a battery SOC of 78% for the rest of time, so the BESS is also prepared for unexpected events. The capacity evolution at 78% SOC was fitted to a t0.75 dependent function (1.0002 − 0.0028 × t0.75), as previously shown by Schmalsteig et al. [35]. Calendar aging at 78% SOC at 40 °C has been shown to increase the capacity loss with a factor of 2 compared to room temperature [36]. This relationship was also seen between the cells in our study stored at 50% SOC at 40 °C and the reference stored at 25 °C.
The effect of the increased temperature on cycle-aging can be evaluated by comparing similar cycling conditions in different temperatures. Kebede et al. cycled NCM-cells with a 60% depth of discharge (DOD) and a 50% mid-SOC at 25 °C as well as 45 °C. After 700 EFC, the capacity loss at room temperature was 52% of the loss at high temperatures. A similar temperature acceleration was measured by Kandler et al. [37] by cycling cells with 80% DOD, between 4.1 V/3.4 V, at 23 °C and 45 °C. After 28 weeks, the capacity loss at low temperatures was 53% of the loss at high temperatures. Temperatures up to 45 °C were measured on the surface of our cells during cycling, and we therefore consider this a suitable comparison.
Assuming a linear cycle-capacity loss evolution, an extrapolation of the combined cycle- and calendar-aging results can be performed. While this is a simplification of the very complex battery degradation, it has shown to be valid until around 80% capacity [38]. With the increased ambient temperature accelerating the capacity loss with a factor of 2, a lifetime of 8 years can be expected at 25 °C for the realistic PS-cycle.
For the FR application, 920 EFC were performed during the 28 weeks of testing, and 4% capacity was lost. During the same time, the cells at 50% SOC lost 2% capacity. In a real FR application, around 260 EFC/year is expected [39]. This leads to a pure cycle-aging rate of 0.28% capacity loss per year at 25 °C, assuming an accelerated degradation of a factor of 2 in 40 °C. The capacity evolution at 50% SOC at 25 °C was fitted to a t0.75 dependent function (1.0041 − 0.0013 × t0.75), and by extrapolating the combined results, a lifetime of 12 years can be expected.

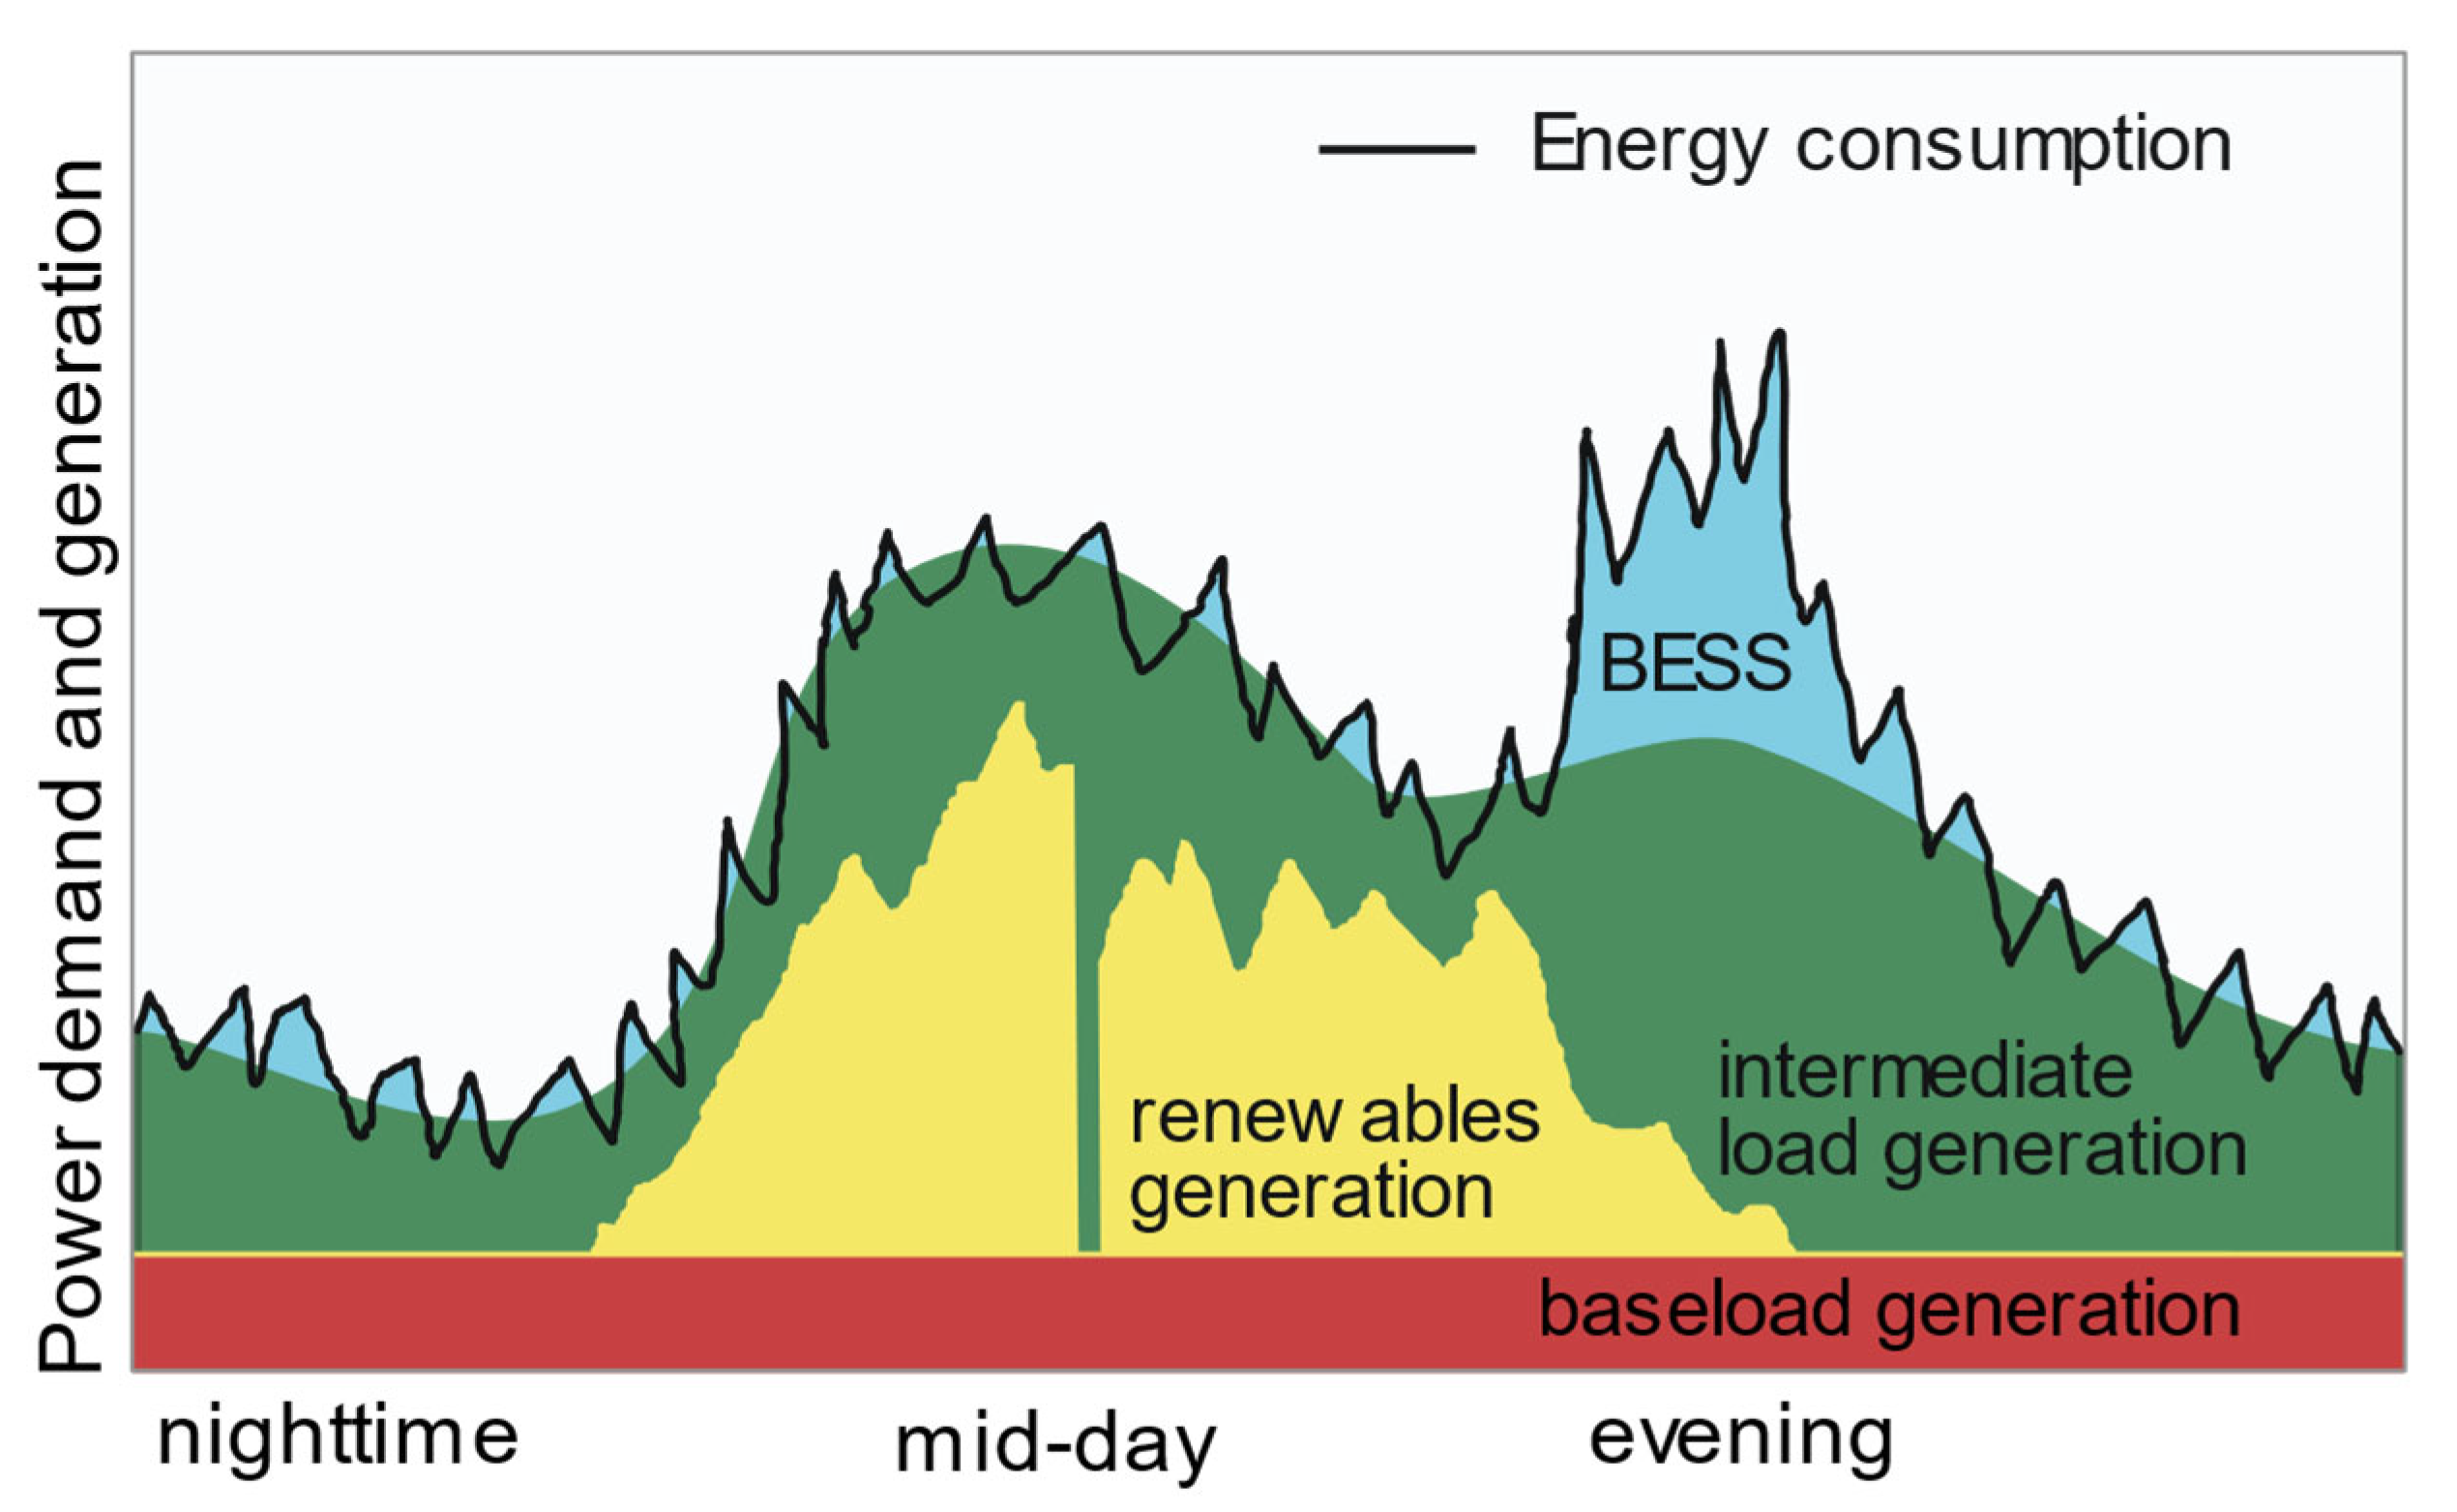
3.6. Multi-Service Application and Operation Strategies

Combining power grid service cycles to be performed simultaneous by a BESS can increase the grid support, but the battery degradation and lifetime might be affected. Our results highlight the need to consider battery power limitations due to degradation, as well as the capacity. From a PS cycle, operating in a wide SOC window, accelerated polarization was observed after 18 weeks of cycling. When combined with the rather harmless FR cycle, these degradation phenomena were already initiated from the start of the cycling. With 92% capacity left, the FRPS cycling had to stop due to battery power limitations. The results are of great importance when it comes to planning and operating BESS, as this accelerated degradation should be avoided, but also since there are less power demanding services where the BESS could still be useful.
At EOT the FRPS-cycled cells had delivered 23% more energy compared to the single PS service, but the lifetime was shortened with 36% (until 92% capacity). Impedance measurements reveal a similar resistance increase in the FRPS and PS cells, but the more demanding FRPS profile could no longer be performed. The electrochemical analysis indicated a degradation of the positive electrode to be one reason for the increased cell polarization. A higher rate of LAMPE was observed for FRPS, as well as cracks at the electrode surface. Cracks in the positive electrode active material particles have been seen before for high SOC pulsing [40,41]. Apart from the high SOC pulsing, the increased current in the combined cycle is an important parameter that will influence the internal degradation of the battery. Whether the increased current or the high SOC accelerates the degradation the most is a topic for future work. Increasing the size of the BESS, narrowing the operating SOC window, might mitigate the accelerated polarization increase and prolong the lifetime. The suitability of the cells to continuously be used in a less demanding application, such as FR, is another topic for future study.
It was also noted that the induced accelerated internal degradation coincided with the decrease in 1C discharge capacity, both for PS and FRPS. The increased polarization, separated from the capacity loss, is illustrated in Figure 8, where the two cells FRPSb and PSb are compared at different states of health (SOH). The cells experienced a similar C/20 capacity loss at RPT 4, FRPSb at 95.7% capacity, and PSb 96.6% respectively, but FRPSb shows more polarization at the end of the 1C discharge. When looking at the 1C capacity evolution (Figure 3b, b cells marked with a star), after 8 weeks, the FRPSb cell has started to lose capacity from BOL, while PSb has not. After 16 weeks (RPT8), the PSb cell has also started to lose 1C capacity, and the 1C discharge curve matches the FRPSb_RPT4 very well, Figure 8. It is also observed that the FRPSb_RPT2 matches well with the PSb_RPT4, both before any 1C capacity loss. The source of the increased polarization might stem from a charge transfer impedance increase, as also observed in the EIS, Figure 5d. The addition of a 1 h discharge step to evaluate battery SOH could therefore serve as a highly valuable step in the BESS operation strategy. If applied continuously during check-ups, it can help to avoid accelerated degradation and to find the most suitable application at current SOH.

4. Conclusions

The lifetime of lithium-ion batteries in stationary energy storage applications were investigated through accelerated aging tests. Specifically, the case of a multi-service application, where the battery performed both frequency regulation (FR) and peak shaving (PS) simultaneously was analyzed. A large polarization increase forced the combined cycle (FRPS) to stop, with a remaining capacity of 92%.
A thorough electrochemical analysis was performed to track the internal sources of degradation. While the FR cycle only induced LLI and a small increase in ohmic resistance, the FRPS cycle resulted in a large impedance increase and induced LAMPE from the start of cycling. Cracks in the secondary particles and increased electrode porosity were also visible at EOT. While an impedance increase and LAMPE were also found for the PS-cycled cells, it was at a lower rate and occurred at a later stage. By measuring the 1C discharge capacity, the acceleration of the internal degradation could be identified.
We believe that our findings can be a great contribution to the overall understanding of battery degradation in stationary applications. At the current stage, where a significant amount of research regarding BESS is focusing on smart grid planning and operation strategies, we also want to highlight the value of including a battery SOH control step. As shown here, this could be a single 1C discharge, capturing accelerated polarization behavior, to further optimize BESS lifetime and utilization.

Author Contributions

Conceptualization, M.O., M.B., R.W.L. and G.L.; methodology, M.O., R.W.L. and G.L.; software, M.O.; validation, M.O.; formal analysis, M.O., R.W.L. and G.L.; investigation, M.O.; resources, M.O., R.W.L. and G.L.; data curation, M.O.; writing—original draft preparation, M.O.; writing—review and editing, M.O., M.B., R.W.L. and G.L.; visualization, M.O.; supervision, R.W.L. and G.L.; project administration, G.L.; funding acquisition, G.L. All authors have read and agreed to the published version of the manuscript.

Funding

This work was funded by the Swedish Energy Agency through SweGRIDS (project number FPS16) and the Swedish governmental initiative StandUp for Energy.

Institutional Review Board Statement

Not applicable.

Informed Consent Statement

Not applicable.

Acknowledgments

Alexander J. Smith is acknowledged for his help in performing SEM.

Conflicts of Interest

The authors declare no conflict of interest.

References

  1. IEA. Renewable Energy Market Update—May 2022; IEA: Paris, France, 2022; Available online:https://www.iea.org/reports/renewable-energy-market-update-may-2022 (accessed on 13 October 2022).
  2. Andrey, C.; Barberi, P.; Lacombe, L.; van Nuffel, L.; Gérard, F.; Dedecca, J.G.; Rademaekers, K.; Idrissi, Y.E.; Crenes, M. Study on Energy Storage—Contribution to the Security of the Electricity Supply in Europe; European Commission: Brussels, Belgium, 2020. [Google Scholar]
  3. Akhil, A.A.; Huff, G.; Currier, A.B.; Kaun, B.C.; Rastler, D.M.; Chen, S.B.; Cotter, A.L.; Bradshaw, D.T.; Gauntlett, W.D. DOE/EPRI Electricity Storage Handbook in Collaboration with NRECA; Sandia National Laboratories: Albuquerque, NM, USA, 2015. [Google Scholar]
  4. Borsche, S.T.; Ulbig, A.; Andersson, G. In Impact of Frequency Control Reserve Provision by Storage Systems on Power System Operation. In Proceedings of the 19th World Congress The International Federation of Automatic Control, Cape Town, South Africa, 24–29 August 2014. [Google Scholar]
  5. Koller, M.; Borsche, T.; Ulbig, A.; Andersson, G. Review of grid applications with the Zurich 1MW battery energy storage system. Electr. Power Syst. Res. 2015, 120, 128–135. [Google Scholar] [CrossRef]
  6. Denholm, P.; Nunemaker, J.; Gagnon, P.; Cole, W. The Potential for Battery Energy Storage to Provide Peaking Capacity in the United States; NREL/TP-6A20-74184; National Renewable Energy Laboratory: Golden, CO, USA, 2019. [Google Scholar]
  7. Münderlein, J.; Steinhoff, M.; Zurmühlen, S.; Sauer, D.U. Analysis and evaluation of operations strategies based on a large scale 5 MW and 5 MWh battery storage system. J. Energy Storage 2019, 24, 100778. [Google Scholar] [CrossRef]
  8. Gatta, F.; Geri, A.; Lamedica, R.; Lauria, S.; Maccioni, M.; Palone, F.; Rebolini, M.; Ruvio, A. Application of a LiFePO4 Battery Energy Storage System to Primary Frequency Control: Simulations and Experimental Results. Energies 2016, 9, 887. [Google Scholar] [CrossRef] [Green Version]
  9. Rahman, M.M.; Oni, A.O.; Gemechu, E.; Kumar, A. The development of techno-economic models for the assessment of utility-scale electro-chemical battery storage systems. Appl. Energy 2021, 283, 116343. [Google Scholar] [CrossRef]
  10. Kucevic, D.; Tepe, B.; Englberger, S.; Parlikar, A.; Mühlbauer, M.; Bohlen, O.; Jossen, A.; Hesse, H. Standard battery energy storage system profiles: Analysis of various applications for stationary energy storage systems using a holistic simulation framework. J. Energy Storage 2020, 28, 101077. [Google Scholar] [CrossRef]
  11. Dubarry, M.; Baure, G. Synthetic vs. Real Driving Cycles: A Comparison of Electric Vehicle Battery Degradation. Batteries 2019, 5, 42. [Google Scholar]
  12. Keil, P.; Jossen, A. Impact of Dynamic Driving Loads and Regenerative Braking on the Aging of Lithium-Ion Batteries in Electric Vehicles. J. Electrochem. Soc. 2017, 164, A3081–A3092. [Google Scholar] [CrossRef]
  13. Cho, I.-H.; Lee, P.-Y.; Kim, J.-H. Analysis of the Effect of the Variable Charging Current Control Method on Cycle Life of Li-ion Batteries. Energies 2019, 12, 3023. [Google Scholar] [CrossRef] [Green Version]
  14. Crawford, A.J.; Huang, Q.; Kintner-Meyer, M.C.W.; Zhang, J.-G.; Reed, D.M.; Sprenkle, V.L.; Viswanathan, V.V.; Choi, D. Lifecycle comparison of selected Li-ion battery chemistries under grid and electric vehicle duty cycle combinations. J. Power Sources 2018, 380, 185–193. [Google Scholar] [CrossRef]
  15. Dubarry, M.; Devie, A.; Stein, K.; Tun, M.; Matsuura, M.; Rocheleau, R. Battery Energy Storage System battery durability and reliability under electric utility grid operations: Analysis of 3 years of real usage. J. Power Sources 2017, 338, 65–73. [Google Scholar] [CrossRef]
  16. Dubarry, M.; Devie, A. Battery durability and reliability under electric utility grid operations: Representative usage aging and calendar aging. J. Energy Storage 2018, 18, 185–195. [Google Scholar] [CrossRef]
  17. Baure, G.; Dubarry, M. Battery durability and reliability under electric utility grid operations: 20-year forecast under different grid applications. J. Energy Storage 2020, 29, 101391. [Google Scholar] [CrossRef]
  18. Ferreira, S.R.; Rose, D.M.; Schoenwald, D.A. Protocol for Uniformly Measuring and Expressing the Performance of Energy Storage Systems; Sandia National Laboratories: Albuquerque, NM, USA, 2013. [Google Scholar]
  19. Streb, M.; Ohrelius, M.; Klett, M.; Lindbergh, G. Improving Li-ion battery parameter estimation by global optimal experiment design. J. Energy Storage 2022, 56, 105948. [Google Scholar] [CrossRef]
  20. Bai, Y.; Wang, X.; Zhang, X.; Shu, H.; Yang, X.; Hu, B.; Wei, Q.; Wu, H.; Song, Y. The kinetics of Li-ion deintercalation in the Li-rich layered Li1.12[Ni0.5Co0.2Mn0.3]0.89O2 studied by electrochemical impedance spectroscopy and galvanostatic intermittent titration technique. Electrochim. Acta 2013, 109, 355–364. [Google Scholar] [CrossRef]
  21. Yang, S.; Wang, X.; Yang, X.; Bai, Y.; Liu, Z.; Shu, H.; Wei, Q. Determination of the chemical diffusion coefficient of lithium ions in spherical Li[Ni0.5Mn0.3Co0.2]O2. Electrochim. Acta 2012, 66, 88–93. [Google Scholar] [CrossRef]
  22. Jung, S.-K.; Gwon, H.; Hong, J.; Park, K.-Y.; Seo, D.-H.; Kim, H.; Hyun, J.; Yang, W.; Kang, K. Understanding the Degradation Mechanisms of LiNi0.5Co0.2Mn0.3O2 Cathode Material in Lithium Ion Batteries. Adv. Energy Mater. 2014, 4, 1300787. [Google Scholar] [CrossRef]
  23. Waag, W.; Käbitz, S.; Sauer, D.U. Experimental investigation of the lithium-ion battery impedance characteristic at various conditions and aging states and its influence on the application. Appl. Energy 2013, 102, 885–897. [Google Scholar] [CrossRef]
  24. Tröltzsch, U.; Kanoun, O.; Tränkler, H.-R. Characterizing aging effects of lithium ion batteries by impedance spectroscopy. Electrochim. Acta 2006, 51, 1664–1672. [Google Scholar] [CrossRef]
  25. Barai, A.; Uddin, K.; Widanage, W.D.; McGordon, A.; Jennings, P. A study of the influence of measurement timescale on internal resistance characterisation methodologies for lithium-ion cells. Sci. Rep. 2018, 8, 21. [Google Scholar] [CrossRef] [Green Version]
  26. Stiaszny, B.; Ziegler, J.C.; Krauß, E.E.; Schmidt, J.P.; Ivers-Tiffée, E. Electrochemical characterization and post-mortem analysis of aged LiMn2O4–Li(Ni0.5Mn0.3Co0.2)O2/graphite lithium ion batteries. Part I: Cycle aging. J. Power Sources 2014, 251, 439–450. [Google Scholar] [CrossRef]
  27. Kong, J.-Z.; Ren, C.; Tai, G.-A.; Zhang, X.; Li, A.-D.; Wu, D.; Li, H.; Zhou, F. Ultrathin ZnO coating for improved electrochemical performance of LiNi0.5Co0.2Mn0.3O2 cathode material. J. Power Sources 2014, 266, 433–439. [Google Scholar] [CrossRef]
  28. Klett, M.; Gilbert, J.A.; Trask, S.E.; Polzin, B.J.; Jansen, A.N.; Dees, D.W.; Abraham, D.P. Electrode Behavior RE-Visited: Monitoring Potential Windows, Capacity Loss, and Impedance Changes in Li1.03(Ni0.5Co0.2Mn0.3)0.97O2/Silicon-Graphite Full Cells. J. Electrochem. Soc. 2016, 163, A875–A887. [Google Scholar] [CrossRef]
  29. Li, Y.; Abdel-Monem, M.; Gopalakrishnan, R.; Berecibar, M.; Nanini-Maury, E.; Omar, N.; van den Bossche, P.; Van Mierlo, J. A quick on-line state of health estimation method for Li-ion battery with incremental capacity curves processed by Gaussian filter. J. Power Sources 2018, 373, 40–53. [Google Scholar] [CrossRef]
  30. Smith, A.J.; Svens, P.; Varini, M.; Lindbergh, G.; Lindström, R.W. Expanded In Situ Aging Indicators for Lithium-Ion Batteries with a Blended NMC-LMO Electrode Cycled at Sub-Ambient Temperature. J. Electrochem. Soc. 2021, 168, 110530. [Google Scholar] [CrossRef]
  31. Bloom, I.; Jansen, A.N.; Abraham, D.P.; Knuth, J.; Jones, S.A.; Battaglia, V.S.; Henriksen, G.L. Differential voltage analyses of high-power, lithium-ion cells. J. Power Sources 2005, 139, 295–303. [Google Scholar] [CrossRef]
  32. Bloom, I.; Walker, L.K.; Basco, J.K.; Abraham, D.P.; Christophersen, J.P.; Ho, C.D. Differential voltage analyses of high-power lithium-ion cells. 4. Cells containing NMC. J. Power Sources 2010, 195, 877–882. [Google Scholar] [CrossRef]
  33. Gao, Y.; Jiang, J.; Zhang, C.; Zhang, W.; Jiang, Y. Aging mechanisms under different state-of-charge ranges and the multi-indicators system of state-of-health for lithium-ion battery with Li(NiMnCo)O2 cathode. J. Power Sources 2018, 400, 641–651. [Google Scholar] [CrossRef]
  34. Sieg, J.; Storch, M.; Fath, J.; Nuhic, A.; Bandlow, J.; Spier, B.; Sauer, D.U. Local degradation and differential voltage analysis of aged lithium-ion pouch cells. J. Energy Storage 2020, 30, 101582. [Google Scholar] [CrossRef]
  35. Schmalstieg, J.; Käbitz, S.; Ecker, M.; Sauer, D.U. A holistic aging model for Li(NiMnCo)O2 based 18650 lithium-ion batteries. J. Power Sources 2014, 257, 325–334. [Google Scholar] [CrossRef]
  36. Keil, P.; Schuster, S.F.; Wilhelm, J.; Travi, J.; Hauser, A.; Karl, R.C.; Jossen, A. Calendar Aging of Lithium-Ion Batteries. J. Electrochem. Soc. 2016, 163, A1872–A1880. [Google Scholar] [CrossRef]
  37. Smith, K.; Saxon, A.; Keyser, M.; Lundstrom, B.; Cao, Z.; Roc, A. Life Prediction Model for Grid-Connected Li-ion Battery Energy Storage System. In Proceedings of the 2017 American Control Conference, Seattle, WA, USA, 24–26 May 2017. [Google Scholar]
  38. Baumhöfer, T.; Brühl, M.; Rothgang, S.; Sauer, D.U. Production caused variation in capacity aging trend and correlation to initial cell performance. J. Power Sources 2014, 247, 332–338. [Google Scholar] [CrossRef]
  39. Swierczynski, M.; Stroe, D.I.; Laerke, R.; Stan, A.I.; Kjaer, P.C.; Teodorescu, R.; Kaer, S.K. Field Experience from Li-Ion BESS Delivering Primary Frequency Regulation in the Danish Energy Market. ECS Trans. 2014, 61, 1–14. [Google Scholar] [CrossRef]
  40. Zhang, Y.; Zhao, C.; Guo, Z. Simulation of crack behavior of secondary particles in Li-ion battery electrodes during lithiation/de-lithiation cycles. Int. J. Mech. Sci. 2019, 155, 178–186. [Google Scholar] [CrossRef]
  41. Benavente-Araoz, F.; Varini, M.; Lundblad, A.; Cabrera, S.; Lindbergh, G. Effect of Partial Cycling of NCA/Graphite Cylindrical Cells in Different SOC Intervals. J. Electrochem. Soc. 2020, 167, 40529. [Google Scholar] [CrossRef]
Figure 1. Example of a power grid load profile with a battery energy storage system.
Energies 16 03003 g001
Figure 2. The three investigated duty cycles (a) FR 44–56% SOC-range, (b) PS 22–78% SOC-range, (c) FRPS 16–84% SOC-range.
Energies 16 03003 g002
Figure 3. Capacity evolution of the cycle- and calendar-aged cells. An averaged value of the duplicate cells is shown as a line. The FRPSb and PSb cells are marked with a star to show their individual performance. The capacity is measured with (a) a C/20-rate current, and (b) a higher 1C-rate current.
Energies 16 03003 g003
Figure 4. Battery voltage response to the FRPS cycle at BOL and after 870 equivalent full cycles.
Energies 16 03003 g004
Figure 5. Impedance spectra of the cycle-aged cells and the 50% SOC calendar-aged cells. The evolution of the ohmic resistance and charge transfer impedance is highlighted to the right of the Nyquist plots. This data is the average value of duplicate cells. FR (a,b), PS (c,d), FRPS (e,f), SOC50 (g,h).
Energies 16 03003 g005
Figure 6. DVA from a three-electrode setup with a lithium reference electrode (a) and evolution of the cycle-aged 18,650 cells (b) FR, (c) PS, (d) FRPS.
Energies 16 03003 g006
Figure 7. SEM pictures of the top surface of harvested positive electrode sheets. (a) BOL, (b) PS, (c) FRPS.
Energies 16 03003 g007
Figure 8. 1C discharge curves for the FRPSb cell and PSb cell with normalized capacity.
Energies 16 03003 g008
Table 1. Steps performed in the reference performance test.
Step Number and MeasurementSettings
1.Rest for temperature regulation2 h, 25 °C
2.CCCV2.6 A charge to 4.2 V, 4.2 V hold until current < 0.13 A
3.1C capacity measurement−2.6 A
4.CCCV2.6 A charge to 4.2 V, 4.2 V hold until current < 0.13 A
5.C/20 capacity measurement(Current defined from the capacity measured in step 3)
6.Parameterization cycleResults from the parameterization cycle are presented in a different study [19]. *
7.CCCV to 50% SOC, rest min 4 h(SOC defined from the discharge data in step 5)
8.EIS260 mA perturbation, 50 mHz–3000 Hz
9.Rest for temperature regulation2 h, 40 °C
* The total test time for the cycle was 9 h, and the cycle followed the battery specification limits. The discharge throughput for the test was 0.49 Ah, and the charge throughput was 2.89 Ah.
Table 2. Initial cell capacity.
CellC/20 Capacity/Ah1C Capacity/Ah
SOC50a2.652.44
SOC50b2.612.45
SOC78a2.622.45
SOC78b2.652.42
FRa2.652.44
FRb2.632.47
PSa2.622.43
PSb2.612.42
FRPSa2.612.39
FRPSb2.642.43
Disclaimer/Publisher’s Note: The statements, opinions and data contained in all publications are solely those of the individual author(s) and contributor(s) and not of MDPI and/or the editor(s). MDPI and/or the editor(s) disclaim responsibility for any injury to people or property resulting from any ideas, methods, instructions or products referred to in the content.

