
Diesel Spray Liquid Length Imaging at High Pressure

1
Department of Mechanical Engineering, School of Engineering, University of Birmingham, Dubai International Academic City, Dubai P.O. Box 341799, United Arab Emirates
2
Department of Mechanical and Aerospace Engineering, College of Engineering, Design and Physical Sciences, Brunel University London, Uxbridge UB8 3PH, UK
3
College of Engineering, Alasala University, Dammam 32324, Saudi Arabia
*
Author to whom correspondence should be addressed.
Energies 2023, 16(6), 2874; https://doi.org/10.3390/en16062874
Submission received: 13 February 2023
/
Revised: 9 March 2023
/
Accepted: 16 March 2023
/
Published: 20 March 2023
(This article belongs to the Special Issue Internal Combustion Engine Performance 2022)
Abstract
:Engine efficiency and emissions depend on the fuel atomization and dispersion. The fuel atomization and dispersion depend heavily on the ambient pressure and temperature. In this work, to study Diesel sprays in engine conditions, an electrically heated, constant-volume, pressurized vessel was designed and manufactured. The controlling electronics and software were developed and tested to ensure safe and precise operation. A commercial Bosch six-hole automotive Diesel injector was used. The spray spatial and temporal development were studied. In the literature, spray liquid length and cone angle are extensively used to quantify fuel dispersion. In this work, these parameters were quantified using a high-speed shadowgraph technique. Models were derived to describe the temporal evolution of the liquid core. Such models can be used to predict the Diesel spray behaviour and the engine performance.
1. Introduction
Current automotive powertrain technology is moving towards the electrification of the fleet [1]. However, electrification of the vehicle fleet has many challenges. Moreover, electrification of heavy-duty vehicles and existing vehicles is almost impossible. Currently, in the US, there are approximately 13 million Diesel engines in all vehicle types. Emissions from these engines are responsible for the premature death of 21,000 people. The most dangerous emission from a Diesel engine is particulate matter (PM), which is solely responsible for the death of 15,000 people annually and is highly carcinogenic [2,3]. Exhaust gas aftertreatment and waste heat recovery systems can reduce the vehicle emissions [4] but not eliminate them.
In a typical modern Diesel engine, fuel is injected directly into the cylinder. It is known that the better the fuel evaporation and dispersion with air, the lower the particulate emissions [1]. For sprays with many plumes, measurements [5] and simulations [6] have shown that the plumes create a low-pressure region in the centreline of the spray, which deteriorates fuel dispersion. In extreme cases, particularly with long injection duration, the low pressure in the centreline of the spray may even lead to the complete collapse of the spray in a single entity [7]. Increased number of plumes in a spray enhances the low-pressure region [8].
The Diesel fuel spray penetration and cone angle are relevant parameters in fuel dispersion. The spray structure, primarily influenced by the injection pressure and duration, affects the evaporation of the fuel and the mixing of the vapour with the surrounding gases [9,10].
However, evaporation and mixing phenomena in a spray are also heavily dependent on the pressure and temperature of the surroundings. Therefore, it is important to study these phenomena at values typically found near the injection timing of a Diesel engine. A variety of optical techniques have been employed in the literature to visualize and understand the spray structure and formation [2,5,6,7,8,9,10,11,12].
Back-illumination techniques take advantage of the difference in the transmittance between the ambient air and injected fuel. The liquid phase of the spray is, therefore, visualised using back-illumination [2]. A shadowgraph technique was used by Tsujimura et al. [13] to study hydrogen sprays, Hwang et al. [14] to study DME (dimethyl ether) sprays, Helin et al. [15] to study LPG (liquefied petroleum gas) sprays and Verhoeven et al. [16] to study n-dodecane sprays.
In the literature, several researchers applied optical techniques to visualize Diesel sprays. Baert et al. [17] studied the Diesel spray from eight-hole injectors, Bae et al. [18] from a ten-hole injector and Kunkulagunta et al. [19] from a five-hole injector. There is limited work published on the six-hole injector, which is the most widely used in small automotive Diesel engines. This work combines back-illumination with high-speed cinematography to provide quantitative results on the temporal development and evaporation of the spray of a six-hole Diesel injector.
Additionally, Diesel sprays visualized in optical engines are restricted by the moving piston and valves. For this work, a pressurised vessel was designed and manufactured and was electronically operated and controlled so as to create engine-like conditions. In this way, optical access is better than in optical Diesel engines or endoscope measurements in full metal engines.
2. Experimental Setup and Image Processing
2.1. Optically Accessible Vessel
A constant-volume vessel (Figure 1) was designed and manufactured to allow the study of Diesel sprays in a high-temperature and -pressure nitrogen environment. The gas conditions up to a maximum pressure of 40 bar and 500 K are achieved using a high-pressure regulator and four electrical cartridge heaters of 500 W each. The vessel is made of stainless steel 316L and has three quartz windows of 125 mm diameter and 83 mm thickness. A magnetically coupled stirrer is used to mix the gases in the vessel, thereby avoiding breaching the pressure vessel by a shaft. Bronkhorst mass flow controllers (MFC) control the amount of nitrogen entering the vessel. A detailed description of the vessel design and characterization can be found in [2].
2.2. Fuel Injection Equipment
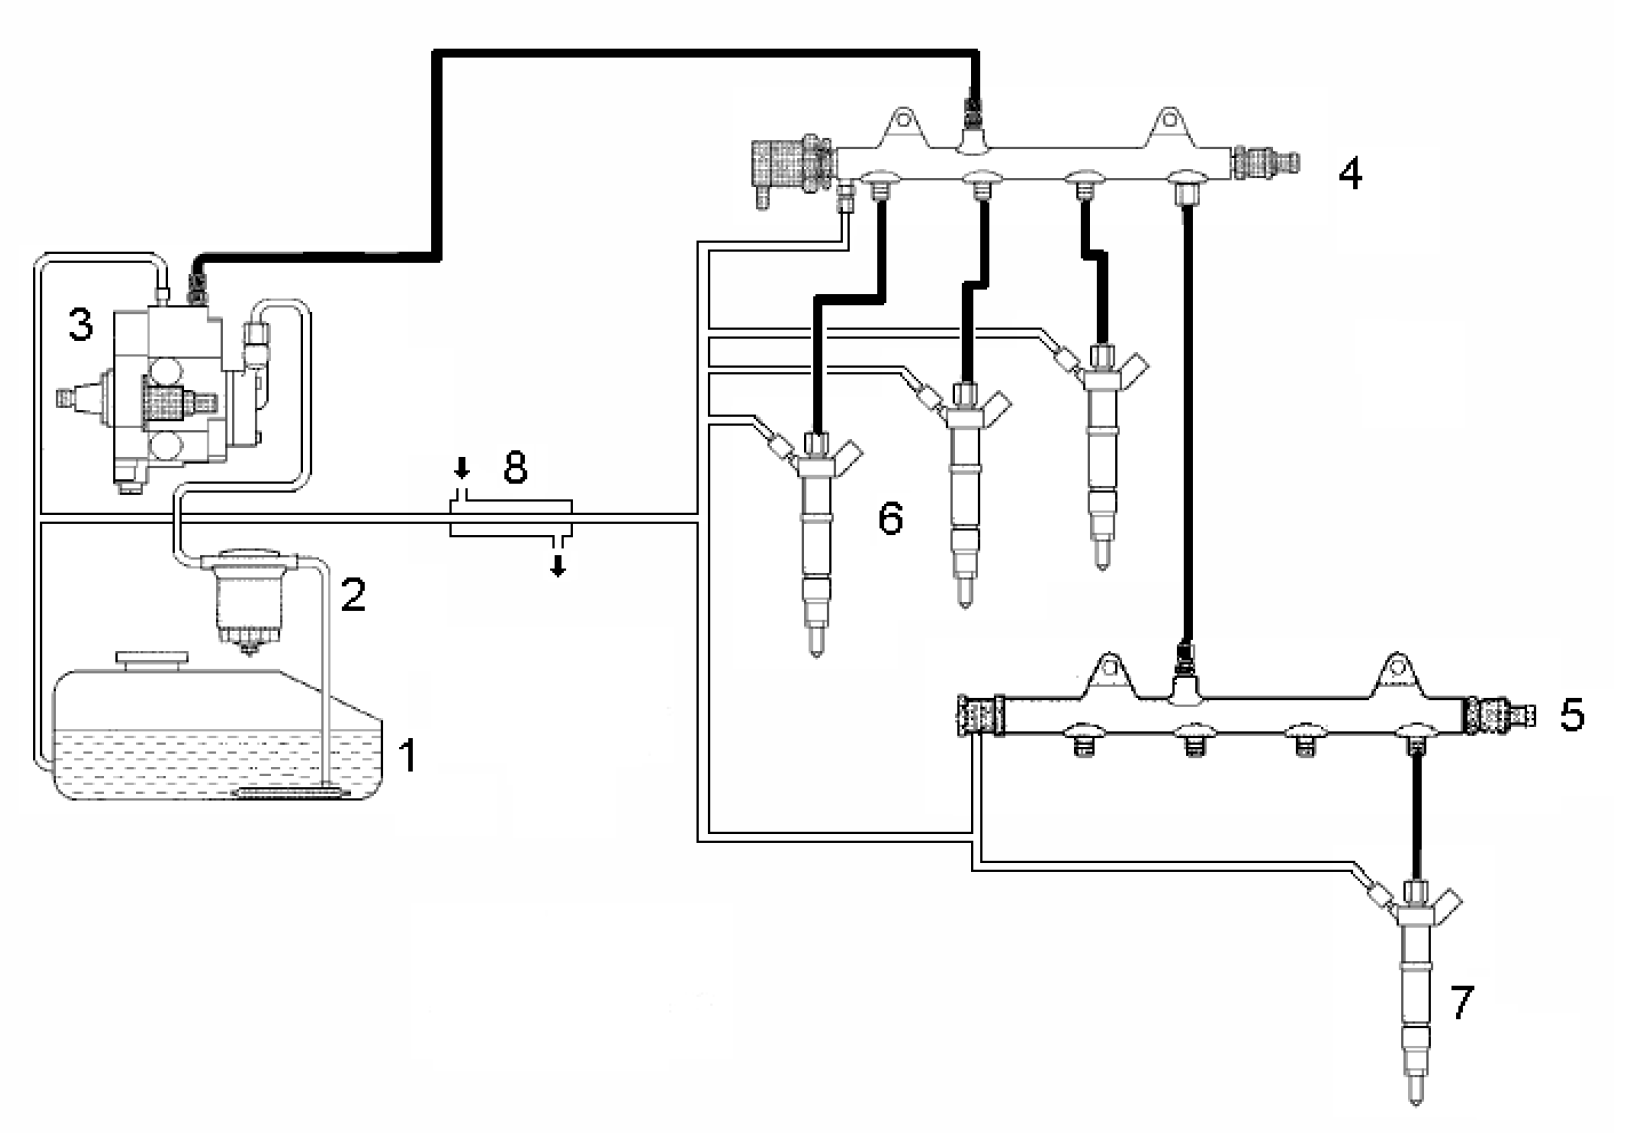
A Hartridge 1100 test stand drove an automotive Bosch CP3 pump, the flow rate of which is controlled by a valve upstream of the pump, as opposed to downstream in previous pump generations [20]. To be able to control the pressure in the associated common rail (which is factory-equipped with a pressure relief valve only), an additional dummy common rail (with a pressure-regulating valve downstream of the pump) was attached. As a safety measure, should the valves fail (thus deliver full flow), we retained the injectors on the dummy rail with their integral spill paths (Figure 2).
The injected fuel quantity is known to affect the spray characteristics and temporal development. In the literature, displacement sensors have been used to measure the injector needle movement, and the injected quantity has been calculated using Bernoulli’s approach [16]. However, this approach considers the fuel to be incompressible and that no cavitation appears in the nozzle. Both of these assumptions are incorrect at the pressures typically found in a common rail. An alternative more complicated approach that has been applied requires the use of a force sensor, on which the spray impinges [21]. However, this technique requires the perfect perpendicular alignment of the force sensor to the spray centreline, as the smallest misalignment causes a large error.
In this work, the injected fuel quantity from the injector shown in Figure 3 was measured using a simple collecting and weighting technique, over an average of 1000 injections. A high-precision lab scale was used to weigh the collecting canister before and after the injections. The drawback of this technique is that despite the fact that the injector was enclosed in the canister, some vapour fuel did escape. However, the escaped fuel vapour represents a small quantity in comparison to the injected and collected fuel. A simple way to estimate the mass escaped is to use the equation of state, knowing the fuel vapour pressure at ambient temperature and the canister vapour volume. The measured value of 46.5 mg per injection is in agreement with similar research and represents a typical value of a 1 ms injection duration found in typical commercial Diesel vehicles [20]. A detailed description of the fuel injection equipment and its characterization can be found in [2].
2.3. Electronic Control
The vessel, pump and injection operation were controlled in LabView, and all operations were monitored and controlled in real time using a National Instruments cRIO FPGA, which thereby provided a standardized operating procedure to the control risks and hazards associated with the operation of the pressure vessel.
Timing uncertainties are of the order of 5 ns, which is negligible in the injection timescale (0.3 ms). The pressure drop in the common rail during injection is compensated for by the FPGA controller. Additionally, the volume of the first and second common rail and the connecting lines is several times larger than the injected quantity, so the pressure drop in the common rail during injection can be considered negligible. A detailed description of the control hardware and software and its characterization can be found in [2].
2.4. Optics
As the spray injection lasts for a very short time, of the order of 1 ms, to obtain good temporal resolution of the injection, a high-speed camera must be used. In this work, a high-speed camera (LaVision HighSpeedStar 6) was used to capture images of the spray. The acquisition speed was set to 15,000 frames per second. However, as there is a trade-off between temporal and spatial resolution, the resolution was set to 512 by 512 pixels, which was considered sufficient to capture clear images of the sprays using a f = 150 mm lens, where f is the focal length. The spatial resolution was 0.14 mm per pixel.
The camera was triggered by the cRIO, and acquisition paused at the end of every spray, allowing for the vessel’s nitrogen atmosphere to be purged and reheated. When the 16 GB camera memory was full, the images were copied to the computer’s hard drive and the process continued.
The spray was back-illuminated using a standard 12 V 45 W automotive light bulb, and a paper diffuser was used to even out luminosity. The homogeneity of the light source after the diffuser was optically checked in the captured images as shown in Figure 4a. A typical image acquired with full resolution is presented in Figure 4b. Some consecutive instantaneous sample raw images appear in Figure 5, and the time interval between them is 1/15,000 s. A detailed description of the optical diagnostic and testing can be found in [2].
3. Results and Discussion
Figure 5 shows a typical raw image of a Diesel spray at atmospheric pressure and temperature as acquired using the optical set-up. The injector is mounted on the top and a temperature RTD probe is visible on the far left running from the top of the vessel to the centre. The two large circle structures at the periphery of the images are the front and back windows of the vessel. The camera is focused on the plane in the middle of the vessel, running by the injector tip. On the right of the frame, a second injector tip is visible, which was not used in this work. On the right of the injector on the top plate, a small tubular structure appears, which is a glowplug used for the ignition of the gases in the vessel to build up the temperature in the vessel. The scope of this paper is the study of non-evaporating sprays, so all results presented are in room temperature.
On the image of the spray in Figure 5, four plumes appear but the injector has six holes. The two plumes appearing in the middle are hiding two more plumes in the background. The plumes on the far left and the far right of the spray are single plumes along the line of sight. A detailed schematic of the injector orientation and the resulting spray plume orientations is given in [22].
Figure 5 presents the temporal evolution of three Diesel spray events at different ambient pressures. The three columns of frames, from left to right, represent ambient pressure of 3, 6 and 9 bar, respectively. The order of the images from top to bottom represents the temporal evolution of the spray events. The time interval between the frames is 1/15,000 s as the acquisition rate was 15,000 fps.
The spray exits the nozzle hole at 0.17 ms ± 5 ns after the electronic signal for the start of injection. This time delay between the signal and the actual hydraulic start of injection is the hydraulic delay. To remove the effect of the injector hydraulic delay from the presented data, all results are presented in time after the start of the hydraulic injection (aSOI).
The centreline of every spray is more optically dense than the periphery. This is due to more liquid fuel mass in the centreline of the spray. Additionally, the centre of the spray has experienced less primary and secondary atomization, less air entrainment, less mixing with the surrounding air and less evaporation. The combined resulting effects of these phenomena are captured in the photos as spray regions of less optical density compared to the centreline of the spray. The spray tip and the spray sides are lighter blue in colour. The sides of the spray, along the centreline, experience air entrainment, mixing and evaporation, while the tip of the spray experiences primary atomization and evaporation.
Structures are visible on the spray tip and sides. On the spray tip, these structures are the outcome of local micrometre- and nanometre-level uneven distributions of tip velocity and liquid fuel concentration. The structures on the spray tip move linearly along the spray axis. At the spray sides, the structures are the outcome of local enhanced air entrainment. The side structures follow the curling air entrainment motion and form small vortices on the sides of the spray. Both the tip and side structures form early on in the spray injection and formation and remain until the end of the spray.
3.1. Image Correction and Processing
The images were processed using a combination of DaVis software and purpose-programmed codes in C++ and MATLAB. A LaVision calibration target was used to match pixels to length on the focal plane and dewarp the edges of the image. Prior to measurements, a dark image was shot and was then subtracted from the acquired images.
The captured images of the spray represent the projection of the spray on the camera plane, as shown in Figure 6. In order to acquire useful information on the actual spray geometry, the spray characteristics measured on the images have to be corrected for the inclination of the spray to the camera CCD plane. For the two middle plumes of the spray, it can be easily shown that
where is the projection tip penetration of the spray, the actual tip penetration and θ the angle between the spray plane and the CCD surface.
To acquire the projection tip penetration, the images were rotated, and the tip penetration length was measured along the centreline of the spray, using a threshold of 40 counts to differentiate between vapour fuel and nitrogen environment. Then, Equation (1) was used.
Similarly, the projection of the spray centreline on the CCD can be correlated to the actual
The cone angle can be calculated by measuring the spray width at a distance of 50 mm from the injector tip. A similar technique has been used by other researchers in the past [2,23]. He at al. proposed that the spray cone angle is measured at half the spray tip penetration length [24]. This was due to the higher spray fluctuation and evaporation observed in their work.
Figure 7 presents a typical intensity profile, along the axis of the spray plume. The beginning of the axis of the plume is the nozzle hole and the axis extends up to the vessel wall. The presence of liquid blocks the light, so the captured image records no light or zero counts where liquid is present. This can be seen on the left side of the plot. In this sample intensity profile taken at 3 bar ambient pressure and 0.27 ms aSOI, there are zero intensity counts for about the first 65 pixels. Then, the intensity starts increasing rapidly. A threshold of 80 counts was chosen to signify the end of the liquid length.
The spray macroscopic liquid structure is quite repetitive, so five spray injection events were enough to provide statistical conversion of the measured liquid length and the cone angle. The data acquired from the plume temporal evolution of the five spray events were ensemble averaged to provide the figures presented in the next section.
3.2. Spray Penetration
Similar to the past work of Yeom et al. [9], Reitz et al. [10] and Sphicas [2], this work also observed a decrease in the spray liquid length with increasing ambient pressure. Figure 8a presents the plume tip penetration as a function of time at various ambient pressures. The data from this work are marked with circles, crosses and dots for ambient pressure of 3, 6 and 9 bar, respectively. On the same graph, data from IFP are presented in squares and X marks. These data were acquired at 1bar ambient pressure and 387 K for 800 and 1500 bar injection pressure, respectively, Verhoeven et al. [16].
At the start of the hydraulic injection, the spray has the maximum velocity. With the lapsing of time aSOI, the spray transfers its momentum to the ambient environment. Several mechanisms have been suggested for this phenomenon. Evaporation is certainly a way of transferring momentum from the liquid to the vapor and then to the ambient environment. However, the measurements presented here were performed in non-evaporating conditions. The breakup of the spray into droplets and of droplets into smaller droplets, known as primary and secondary atomization, is another mechanism of transferring momentum from the spray to the ambient gas.
Both primary and secondary atomization have been studied extensively, but further understanding of these phenomena on smaller scales is paramount. However, for the practical purposes of engine dimensioning and valve timing, macroscopic spray characteristics can provide sufficient approximation. With this aim, Figure 8b presents the data acquired in this work, with the regression of a natural logarithmic function. The considered function describing the liquid length , as a function of time t aSOI, is of the form , where a and b are constants. A similar spray behaviour was observed by Yue et al. [25] and by Ma et al. [26]. It was also observed that less volatile fuels, such as Diesel, lead to higher spray tip penetration compared to more volatile fuels such as pentanol [26].
3.3. Curve Fitting
A non-linear least squares method was applied. The basis of this method is to approximate the model by a line and to refine the parameters by successive iterations. In matrix format, the nonlinear model is described by the formula
Where is the vector of responses, in this case, the liquid length. The curve model is , which is a function of and , in this case, the time and the model coefficients, respectively. The true error between the data and the model is noted as .
The method starts with an initial estimate for each coefficient. The fitted curve for the current set of coefficients is produced by calculating the Jacobian matrix of , which is defined as a matrix of partial derivatives taken with respect to the coefficients. The coefficients are adjusted within a trust region, which has no more than 10% change from the last value of the coefficients. The improvement of the fit is determined. The steps above are iterated until a tolerance of 10−6 is met or up to 600 iterations.
Table 1 shows the model coefficients for the different ambient pressures tested in this work. With increasing ambient pressure, the value of coefficient a is reduced. By derivation of the logarithmic model, the spray tip velocity is proportional to coefficient a.
3.4. Spray Tip Velocity
In Figure 8b, for any time aSOI and the value of the spray liquid length penetration for different values of ambient pressure, it is easily observed that increased ambient pressure leads to decreased spray penetration. For example, at 100 ms aSOI, the spray tip penetration is 16, 15.55 and 12.04 mm for 3, 6 and 9 bar ambient pressure, respectively. It is evident that increased ambient pressure decreases the spray tip penetration with decreasing rate.
As a result, with increased ambient pressure, the spray tip velocity is reduced. The mechanism in place can be attributed to increased momentum exchange from the spray to the ambient environment with increased ambient pressure. A similar observation was reached in Table 1, where increased ambient pressure leads to a reduced value of coefficient a. For example, at 3, 6 and 9 bar ambient pressure, the value of coefficient a is 26.4, 25.53 and 21.98, respectively. The velocity follows the inverse function of time, as expected from derivation of the natural logarithm equation . Figure 9 presents the spray tip velocity as a function of time.
3.5. Spray Cone Angle
Another macroscopic observation of improved momentum transfer is the cone angle of the plume. Figure 10 shows the measured cone angle of the plumes with time aSOI. The cone angle is relatively constant as a function of time, indicating that the injection duration is not affecting the value of the cone angle. This makes the cone angle of the plume a direct measure of the momentum exchange. The value of the cone angle, at the ambient pressures tested in this work, is proportional to the ambient pressure. For example, at 3 bar ambient pressure, the spray cone angle is between 35 and 37 degrees. At 6 bar, it is approximately 40 to 42 degrees and at 9 bar, around 50 degrees. Increased ambient pressure increases the cone angle of the plume. This indicates that the denser ambient environment makes the plume spread radially and increases the momentum transfer to the ambient environment.
In Figure 10, for reduced ambient pressure, data points are reported at earlier times aSOI. This happens because the plume tip requires time aSOI to reach the 50 mm downstream line, where the cone angle was measured. For higher ambient pressure, the plume tip requires more time to reach the 50 mm line. For example, at 3, 6 and 9 bar, the first reading at 50 mm occurs at approximately 2.1, 2.4 and 2.6 ms aSOI.
4. Conclusions
Fuel dispersion is of vital importance for reducing emissions in any combustion system. In this work, the dispersion of an automotive Diesel spray was investigated at high pressure, in a purpose-built optically accessible pressure vessel, using high-speed shadowgraphy.
The spray photographs showed reduced optical density on the spray tip, attributed to primary atomization. Reduced optical density was also observed at the spray sides, attributed to ambient air entrainment, mixing and evaporation. Structures on the spray tip and sides were observed to remain until the end of the spray. Spray characteristics such as tip penetration and cone angle provide a good description of the fuel dispersion in a Diesel engine. The spray tip penetration and cone angle depend on the ambient pressure and temperature.
Spray tip penetration was observed to decrease and cone angle to increase with increasing ambient pressure. Both the mechanisms above indicate enhanced momentum transfer from the spray to the ambient environment. A natural logarithm model was proposed for the temporal evolution of the spray tip penetration. A non-linear least squares method was used to calculate the model parameters based on the acquired data. The temporal evolution of the spray cone angle was relatively constant, but was proportional to the ambient pressure.
Author Contributions
Methodology, P.S.; Software, P.S.; Investigation, A.P.; Resources, A.P.; Writing—original draft, P.S.; Writing—review & editing, P.S.; Supervision, A.P.; Project administration, A.P. All authors have read and agreed to the published version of the manuscript.
Funding
This research received no external funding.
Data Availability Statement
Data available upon request at panos.sphicas@gmail.com.
Conflicts of Interest
The authors declare no conflict of interest.
References
- Bin Ahmad, M.S.; Pesyridis, A.; Sphicas, P.; Mahmoudzadeh Andwari, A.; Gharehghani, A.; Vaglieco, B.M. Electric vehicle modelling for future technology and market penetration analysis. Front. Mech. Eng. 2022, 8, 896547. [Google Scholar] [CrossRef]
- Sphicas, P. High Pressure and High Temperature Measurements on Diesel Sprays. Ph.D. Thesis, Imperial College London, London, UK, 2013. Available online: https://hdl.handle.net/10044/1/18063 (accessed on 12 February 2023).
- EPA. Integrated Science Assessment for Particulate Matter; EPA/600/R-08/139F; EPA: Philadelphia, PA, USA, 2009. [Google Scholar]
- Soldado, J.C.; Pesyridis, A.; Sphicas, P.; Nikolakopoulos, P.; Markides, C.N.; and Deligant, M. Axial Turbo-Expander Design for Organic Rankine Cycle Waste-Heat Recovery with Comparative Heavy-Duty Diesel Engine Drive-Cycle Performance Assessment. Front. Mech. Eng. 2021, 7, 676566. [Google Scholar] [CrossRef]
- Sphicas, P.; Pickett, L.M.; Skeen, S.A.; Frank, J.H. Inter-plume aerodynamics for gasoline spray collapse. Int. J. Engine Res. 2018, 19, 1048–1067. [Google Scholar] [CrossRef]
- Sphicas, P.; Pickett, L.M.; Skeen, S.; Frank, J.; Lucchini, T.; Sinoir, D.; D’Errico, G.; Saha, K.; Som, S. A Comparison of Experimental and Modeled Velocity in Gasoline Direct-Injection Sprays with Plume Interaction and Collapse. SAE Int. J. Fuels Lubr. 2017, 10, 184–201. [Google Scholar] [CrossRef]
- Sphicas, P.; Pickett, L.M.; Skeen, S.A.; Frank, J.H.; Parrish, S. Interplume Velocity and Extinction Imaging Measurements to Understand Spray Collapse when Varying Injection Duration or Number of Injections. At. Sprays 2018, 28, 837–856. [Google Scholar] [CrossRef]
- Sphicas, P. Investigation of the Effect of Plume Number on Spray Collapse. In Proceedings of the ASME 2019 Internal Combustion Engine Division Fall Technical Conference, Chicago, IL, USA, 20–23 October 2019. [Google Scholar] [CrossRef]
- Yeom, J.K.; Kang, B.M.; Lee, M.J.; Chung, S.S.; Ha, J.Y.; Fujimoto, H. A study on the mixture formation process of evaporating diesel spray by offset incidence laser beam. KSME Int. J. 2002, 16, 1702–1709. [Google Scholar] [CrossRef]
- Reitz, R.; Bracco, F. On the Dependence of Spray Angle and Other Spray Parameters on Nozzle Design and Operating Conditions; SAE Technical Paper 790494; SAE: Warrendale, PA, USA, 1979. [Google Scholar] [CrossRef]
- Bruneaux, G. Liquid and vapor spray structure in high-pressure common rail diesel injection. At. Sprays 2001, 11, 533–556. [Google Scholar] [CrossRef]
- Naber, J.D.; Siebers, D. Effects of Gas Density and Vaporization on Penetration and Dispersion of Diesel Sprays. SAE Tech. Pap. 1996, 960034. [Google Scholar] [CrossRef] [Green Version]
- Tsujimura, T.; Mikami, S.; Achiha, N.; Tokunaga, Y.; Senda, J.; Fujimoto, H. A study of direct injection diesel engine fueled with hydrogen. SAE Trans. 2003, 112, 390–405. [Google Scholar]
- Hwang, J.S.; Ha, J.S.; No, S.Y. Spray Charactreistics of Dme In Conditions of Common Rail Injection System(II). Int. J. Automot. Technol. 2003, 4, 119–124. [Google Scholar]
- Helin, X.; Yusheng, Z.; Huiya, Z. Experimental and Numerical Study of the Characteristics of Liquid Phase LPG and Diesel Fuel Sprays; SAE Technical Paper 2006-32-0076; SAE: Warrendale, PA, USA, 2006. [Google Scholar]
- Verhoeven, D.; Vanhemelryck, J.; Baritaud, T. Macroscopic and Ignition Characteristics of High-Pressure Sprays of Single-Component Fuels; SAE Technical Paper 981069; SAE: Warrendale, PA, USA, 1998. [Google Scholar] [CrossRef]
- Klein-Douwel, R.J.H.; Frijters, P.J.M.; Somers, L.M.T.; de Boer, W.A.; Baert, R.S.G. Macroscopic diesel fuel spray shadowgraphy using high speed digital imaging in a high pressure cell. Fuel 2007, 86, 1994–2007. [Google Scholar] [CrossRef]
- Bae, C.; Kang, J. Diesel Spray Development of VCO Nozzles for High Pressure Direct Injection; SAE Technical Paper 2000-01-1254; SAE: Warrendale, PA, USA, 2000. [Google Scholar]
- Kunkulagunta, K. Video imaging and analysis of common rail sprays in an optical engine using shadowgraphy technique. SAE Trans. 2000, 109, 1528–1537. [Google Scholar]
- Robert Bosch GmbH. Diesel-Engine Management; John Wiley & Sons Inc.: Hoboken, NJ, USA, 2005. [Google Scholar]
- Payri, R.; Salvador, F.J.; Gimeno, J.; de la Morena, J. Macroscopic Behavior of Diesel Sprays in the Near-Nozzle Field. SAE Int. J. Engines 2009, 1, 528–536. [Google Scholar] [CrossRef]
- Frank, H.; Pickett, L.M.; Bisson, S.E.; Patterson, B.D.; Ruggles, A.J.; Skeen, S.A.; Manin, J.; Huang, E.; Cicone, D.; Sphicas, P. Sandia Report, SAND2015-8758, 2015. Available online: https://prod-ng.sandia.gov/techlibnoauth (accessed on 12 February 2023).
- Delacourt, E.; Desmet, B.; Besson, B. Characterisation of very high pressure diesel sprays using digital imaging techniques. Fuel 2005, 84, 859–867. [Google Scholar] [CrossRef]
- He, J.; Chen, H.; Chen, Y.; Su, X.; Zhang, P.; Xu, H.; Zhou, C. Optical study on the spray and combustion of diesel cyclopentanol blend fuels on a constant volume chamber. Fuel 2022, 315, 123171. [Google Scholar] [CrossRef]
- Yue, Z.; Reitz, R.D. Application of an equilibrium-phase spray model to multicomponent gasoline direct injection. Energy Fuels 2019, 33, 3565–3575. [Google Scholar] [CrossRef] [Green Version]
- Ma, Y.; Huang, S.; Huang, R.; Zhang, Y.; Xu, S. Spray and evaporation characteristics of N-pentanol–diesel blends in a constant volume chamber. Energy Convers. Manag. 2016, 130, 240–251. [Google Scholar] [CrossRef]
Figure 1.
Schematic of constant-volume vessel.

Figure 2.
Experimental setup of Diesel injecting system. (1) Fuel tank, (2) lift pump and filter, (3) Bosch CP3, (4) rail with pressure control valve, (5) tested modern rail with pressure relief valve, (6) injectors for overspilling fuel in case of valve failure, (7) tested injector, (8) fuel cooler.

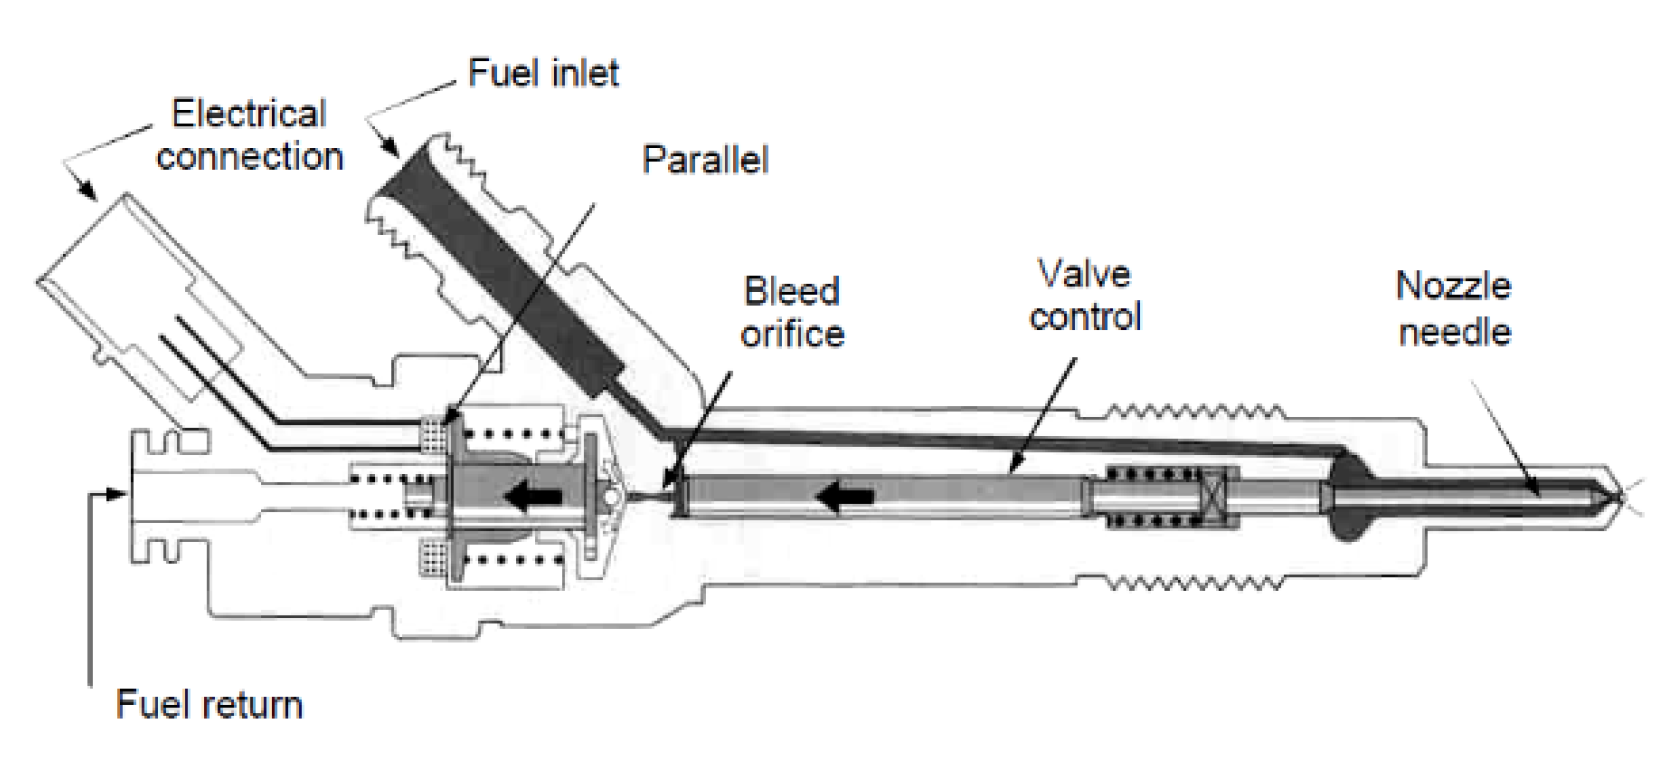
Figure 3.
Bosch common rail fuel injector, Bosch (2005).

Figure 4.
(a) Schematic of optical setup used in this work to back-illuminate the Diesel spray; (b) typical photo of a Diesel spray in the vessel.
Figure 4.
(a) Schematic of optical setup used in this work to back-illuminate the Diesel spray; (b) typical photo of a Diesel spray in the vessel.

Figure 5.
Typical consecutive photos of spray in the vessel at 3, 6 and 9 bar ambient pressure and room temperature. The time interval between the frames is 1/15,000 s. Time starts at the start of the hydraulic injection (aSOI), when the spray exits the nozzle hole.
Figure 5.
Typical consecutive photos of spray in the vessel at 3, 6 and 9 bar ambient pressure and room temperature. The time interval between the frames is 1/15,000 s. Time starts at the start of the hydraulic injection (aSOI), when the spray exits the nozzle hole.

Figure 6.
Representation of spray, with marked tip penetration length and angles of spray centreline.
Figure 6.
Representation of spray, with marked tip penetration length and angles of spray centreline.

Figure 7.
Collected light intensity profile along spray plume line, starting from the nozzle hole extending to the vessel wall.
Figure 7.
Collected light intensity profile along spray plume line, starting from the nozzle hole extending to the vessel wall.

Figure 8.
Spray tip penetration: (a) as a function of time, at 3, 6 and 9 bar ambient pressure, compared to data from [16]; (b) as a function of time, at 3, 6 and 9 bar ambient pressure and natural logarithmic model fit.
Figure 8.
Spray tip penetration: (a) as a function of time, at 3, 6 and 9 bar ambient pressure, compared to data from [16]; (b) as a function of time, at 3, 6 and 9 bar ambient pressure and natural logarithmic model fit.

Figure 9.
Spray tip penetration velocity.

Figure 10.
Cone angle as a function of time aSOI, at 3, 6 and 9 bar ambient pressure.


Table 1.
Model coefficients.
| Coefficients | a | b | R2 |
|---|---|---|---|
| 3 bar | 26.4 | 76.8 | 0.9456 |
| 6 bar | 25.53 | 74.33 | 0.9625 |
| 9 bar | 21.98 | 62.65 | 0.9922 |
Disclaimer/Publisher’s Note: The statements, opinions and data contained in all publications are solely those of the individual author(s) and contributor(s) and not of MDPI and/or the editor(s). MDPI and/or the editor(s) disclaim responsibility for any injury to people or property resulting from any ideas, methods, instructions or products referred to in the content. |
© 2023 by the authors. Licensee MDPI, Basel, Switzerland. This article is an open access article distributed under the terms and conditions of the Creative Commons Attribution (CC BY) license (https://creativecommons.org/licenses/by/4.0/).
Share and Cite
MDPI and ACS Style
Sphicas, P.; Pesyridis, A. Diesel Spray Liquid Length Imaging at High Pressure. Energies 2023, 16, 2874. https://doi.org/10.3390/en16062874
AMA Style
Sphicas P, Pesyridis A. Diesel Spray Liquid Length Imaging at High Pressure. Energies. 2023; 16(6):2874. https://doi.org/10.3390/en16062874
Chicago/Turabian StyleSphicas, Panos, and Apostolos Pesyridis. 2023. "Diesel Spray Liquid Length Imaging at High Pressure" Energies 16, no. 6: 2874. https://doi.org/10.3390/en16062874
Note that from the first issue of 2016, this journal uses article numbers instead of page numbers. See further details here.