Article

The Potential of Ethanol/Methanol Blends as Renewable Fuels for DI SI Engines

Institute of Science and Technology for Sustainable Energy and Mobility (STEMS)—CNR, Via G. Marconi 4, 80125 Naples, Italy
*
Author to whom correspondence should be addressed.
Energies 2023, 16(6), 2791; https://doi.org/10.3390/en16062791
Submission received: 20 February 2023 / Revised: 8 March 2023 / Accepted: 16 March 2023 / Published: 17 March 2023
(This article belongs to the Collection Women in Fuel)

Abstract

:
Electrification is considered an optimal long-term solution for the decarbonization of the transport sector. However, in the medium period, propulsion systems will continue to dominate urban mobility, thus requiring the shift from fossil fuels toward low carbon fuels. In this regard, the request from the EU to achieve carbon neutrality by 2050 is encouraging the use of innovative fuels and powertrains. Alcohols such as ethanol and methanol are particularly suitable for spark ignition engines. This paper investigates the effect of ethanol/methanol blends on the performance and emissions of a turbocharged direct injection spark ignition engine running on the worldwide harmonized light vehicles test cycle. Three blends were considered, consisting of 10% v/v ethanol (E10), 25% v/v ethanol (E25) and 5% v/v ethanol with 15% v/v methanol (E5M15). Gaseous and particle emissions were measured at the exhaust. The main novelty of the study regards the investigation of the behavior of alcohol blends, especially those based on methanol, in transient conditions. It was found that CO, THC and NOx emissions decrease with the increase in alcohol content in the blend, with different contributions in the different phases of the cycle. Particle emissions decrease for E10 and even more so for E25. When methanol is added to the blend, particle emissions increase with respect to E25 and they are characterized by a larger diameter.

1. Introduction

In the attempt to reduce the use of the fossil fuels, and thus CO2 as well as other pollutant emissions, the transport sector is undergoing a transition from internal combustion engines (ICEs) to electric powertrain systems. However, these solutions are still characterized by drawbacks that hinder their diffusion, such as the high charging time, the lack of recharge infrastructure and the high costs of the vehicles [1]. Moreover, there is an ongoing debate among scholars on whether and how electric vehicles are indeed convenient in terms of greenhouse emissions with respect to ICEs vehicles [2]. However, it is still presumed that ICE vehicles will be the protagonist of the urban transport sector in the coming years [3].
In this scenario, it is crucial to continue research studies on ICEs to enable them to handle the challenges related to energy security and environmental pollution. These goals can be achieved through technological improvements [4], more efficient aftertreatment systems [5] and new combustion strategies [6]. The use of low climate-impact fuels, such as alcohols, ammonia, hydrogen, and e-fuels, also represents an effective way to make the ICEs strategic in urban mobility.
Alcohols have a long history as fuels for spark ignition (SI) engines and they continue to attract interest as automotive energy vectors because of their attractive properties and renewable nature [7]. The most common alcohols used in automobiles are ethanol and methanol [8]. They are characterized by a higher octane number (ON) than gasoline, thus resulting in a better anti-knocking performance and a higher heat of vaporization (HOV) that helps the cooling of intake charge with a consequent improvement in volumetric efficiency. Moreover, the oxygen content in their molecules promotes a more efficient, and thus a cleaner, combustion. On the other hand, they have a lower energy content than gasoline with a penalty in terms of fuel economy [9].
The main advantage of alcohol fuels is that they can be produced in a renewable way. Ethanol can be obtained from alcoholic fermentation of animal and/or agricultural waste [10]. Methanol can be produced from biomass or from fossil fuels. In the past it was generally obtained from wood. However, it can be made from any carbon stock through thermochemical processes. A technique of methanol synthesis has recently been developed consisting of the combination of carbon dioxide (CO2) with the hydrogen obtained from water electrolysis through renewable energy sources [11]. This process allows methanol to be obtained through low- and zero net carbon processes using CO2 that can be extracted from the atmosphere. Therefore, there is a direct effect on the mitigation of global warming due to the increasing presence of greenhouse gases. This gives a good chance to methanol to establish itself in the fuel landscape for automotive applications.
Another advantage of both ethanol and methanol is that they do not require a high investment for their transportation, distribution and storage since they can use the same infrastructure existing for petroleum fuels [12]. Moreover, when alcohols are mixed with gasoline at low blend percentage, they can be used in the existing engine technology, thus reducing the issues of corrosiveness and low lubricity that are typical when they are used as pure fuels [13].
Several research studies addressed the topic of engine out emissions and performance of SI engines fueled with alcohol blends. Studies on the use of oxygenated fuels highlighted that alcohols represent a viable alternative for SI engines thanks to their properties that closely resemble conventional gasoline [14,15]. In [16], focus was given to the effect of their properties, such as the larger oxygen content, on the particle emissions. Among the different biofuels, methanol was proposed as the most favorable fuel for replacing conventional fossil fuels [17].
Turner et al. [18] carried out investigations in different research engines with blends of gasoline, ethanol and methanol. They agreed that challenges exist in blending alcohols with gasoline, such as material compatibility. However, they believed that such issues are not insurmountable, thus allowing the gradual introduction of alcohols as transportation fuels.
Zhang et al. [19] investigated the effect of different ratios of methanol–gasoline blends on a passenger vehicle equipped with gasoline direct injection (GDI) turbocharged engine. They observed that because of the tremendous technological improvement of ICE, more comprehensive research on the application of methanol in modern gasoline engines is required.
Moreover, to the best of the author’s knowledge, the behavior in transient conditions inside the different phases of the worldwide harmonized light vehicles test cycle (WLTC), especially for the blends with methanol, was not deeply investigated. Therefore, in the perspective of a larger application of alcohol blends, a deepen awareness on their impact on engine performance and pollutants is essential.
This work is framed in this context analyzing the effect of both methanol and ethanol blends on the engine performance and exhaust emissions of a high-performance turbocharged GDI engine. Experiments were carried out over the WLTC. Gaseous emissions were measured at raw exhaust while particles were characterized in terms of number and size at diluted exhaust.

2. Materials and Methods

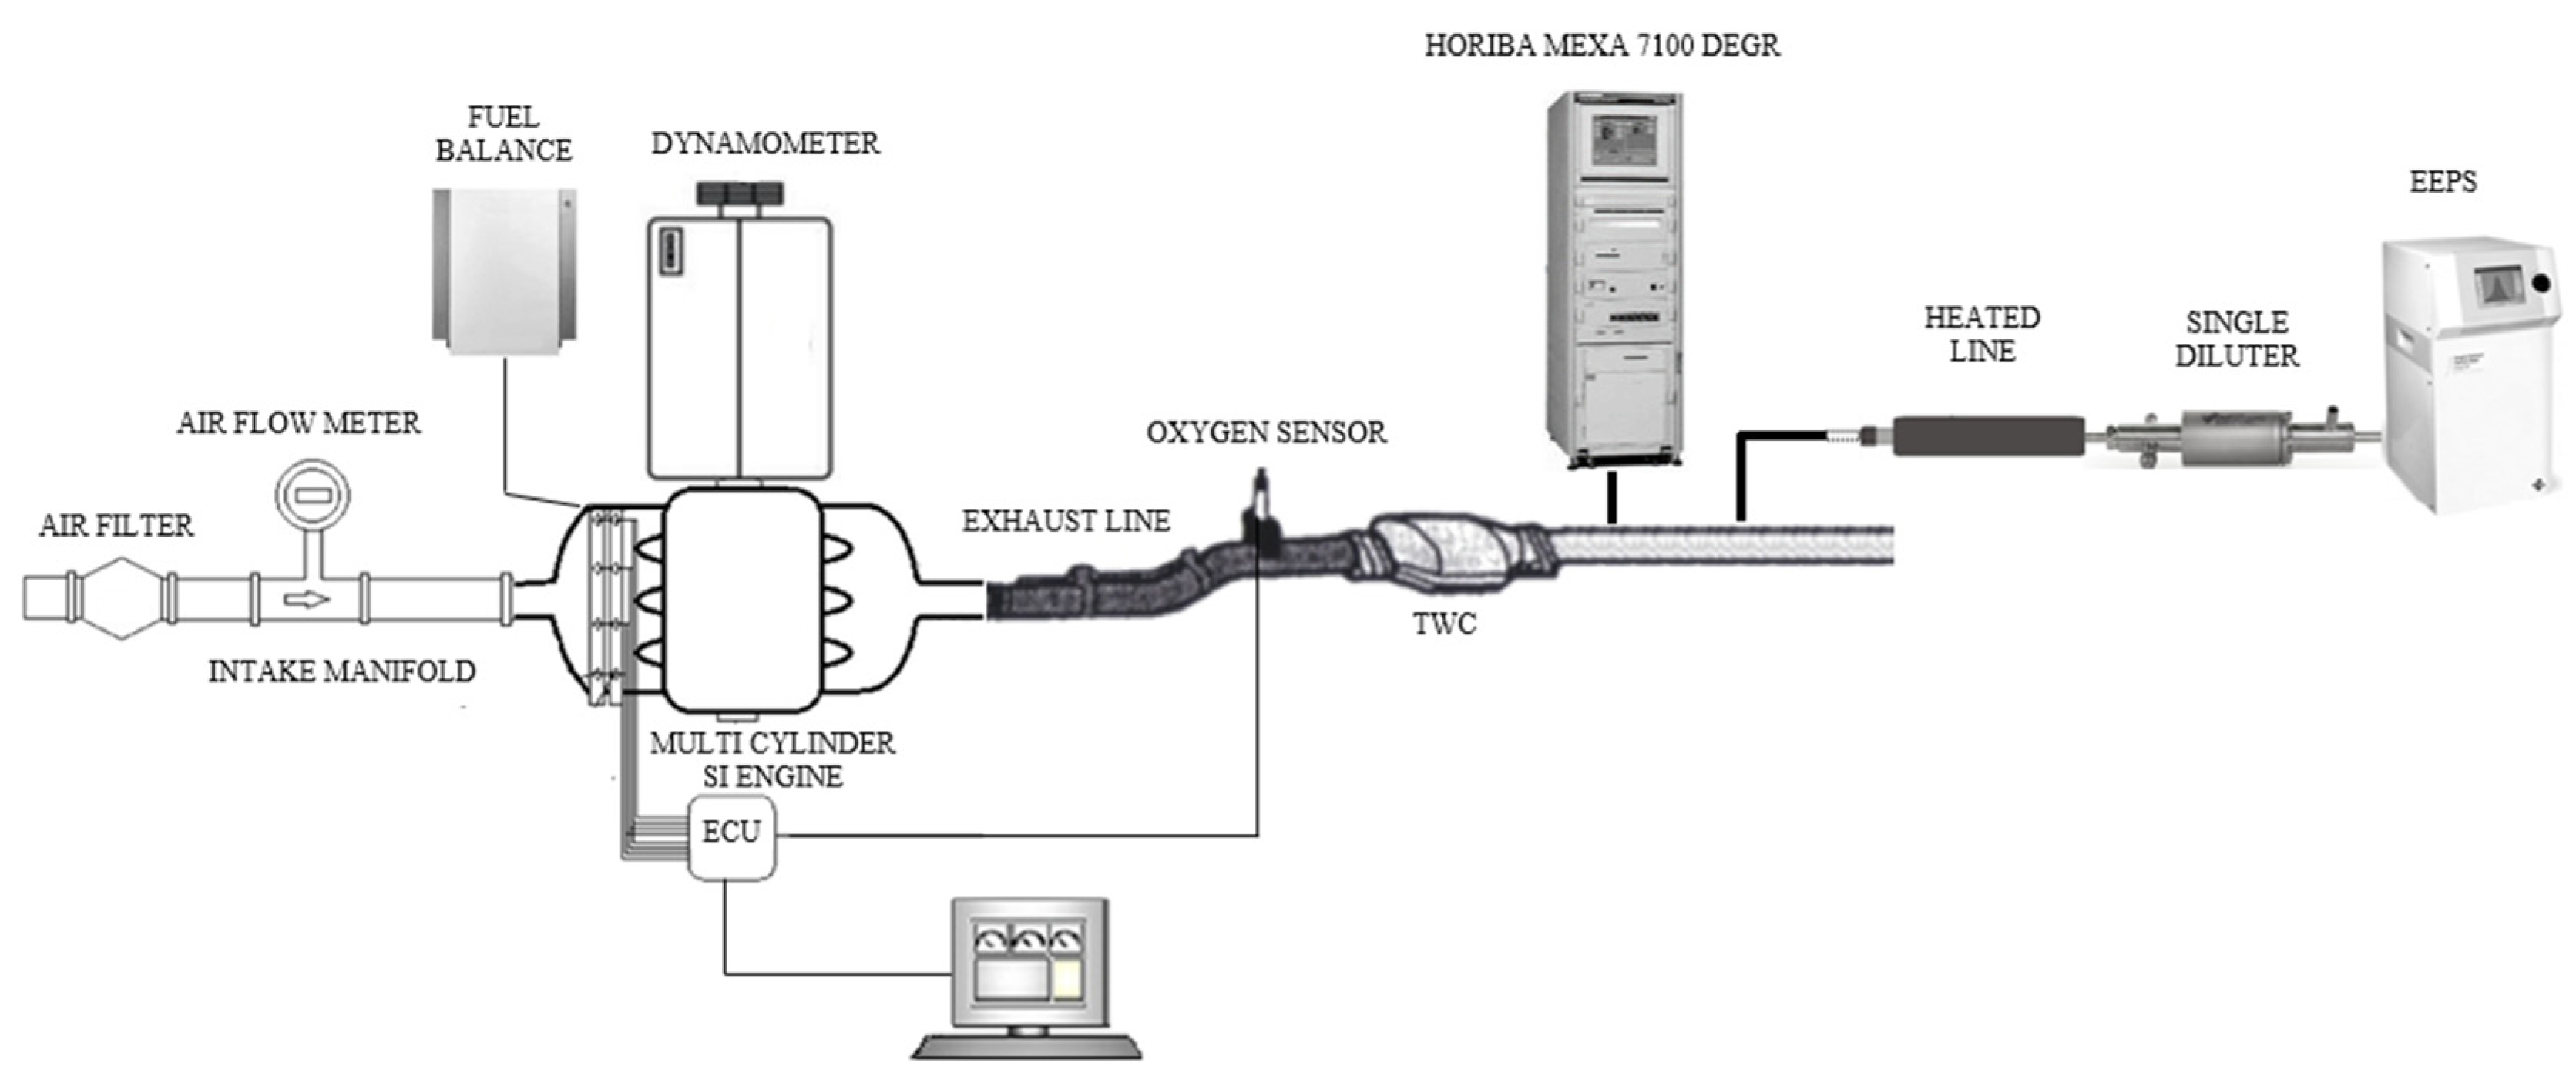
2.1. Experimental Apparatus

2.1.1. Test Engine

Experiments were carried out on a turbocharged 1.8 L GDI engine, whose main technical characteristics are listed in Table 1. It was equipped with a three-way catalyst (TWC). The engine was installed on an asynchronous dynamometer allowing to operate the engine in transient conditions.
The engine was instrumented with k-type thermocouples to monitor the oil and coolant temperatures and the temperature of the intake air and exhaust gas.
Fuel consumption was gravimetrically measured by an AVL 733S fuel meter at an acquisition frequency of 10 Hz and with an accuracy of 0.12%.
A Bosch LSU 4.9 lambda sensor was used to measure the air–fuel ratio and feed back to the electronic control unit (ECU) as a closed-loop.
An ETAS ES590 connected to the ECU through a K-line cable allowed the monitoring and modification of the engine parameters by means of INCA software.
The ECU PC controller was connected with the engine monitoring PC through an ASAM interface and by means of an ASAP3 protocol. All analogical and digital signals from the sensors and from the ECU were acquired at 10 Hz frequency through proper software developed with LabView.
A schematic of the experimental apparatus is shown in Figure 1.

2.1.2. Emission Measurement Instruments

Sampling probes were installed in the exhaust pipe downstream of the TWC and connected to the emission measurement instruments, as shown in Figure 1.
Gaseous emissions were measured through Horiba MEXA 7100 DEGR analyzers (Table 2). Carbon dioxide (CO2) and carbon monoxide (CO) were measured by non-dispersive infrared (NDIR) analyzers. Total hydrocarbons (THC) and nitrogen oxides (NOx) were detected through a flame ionization detector (FID) and the chemiluminescence method, respectively. At the start of each test campaign, the analyzers were calibrated and checked routinely during the measurements.
The characterization of particle emissions in terms of number and size was carried out by the Engine Exhaust Particle Spectrometer (EEPS) 3090 from TSI (Table 3). The particle spectrometer allows particles in the size range 5.6–560 nm to be measured with high accuracy at 10 Hz frequency. The measurement principle is based on the electrical mobility diameter technique.
The exhaust gas sample sent to EEPS was taken by a 1.5 m long line heated at 150 °C to avoid water condensation. Before entering the EEPS, the sample was diluted through a Dekati single diluter characterized by a dilution ratio of 1:9 using dilution air at 150 °C. This system allows the elimination of unwanted condensation and nucleation effects, thus making the particle size distribution (PSD) measurement stable and repeatable.

2.2. Methodology

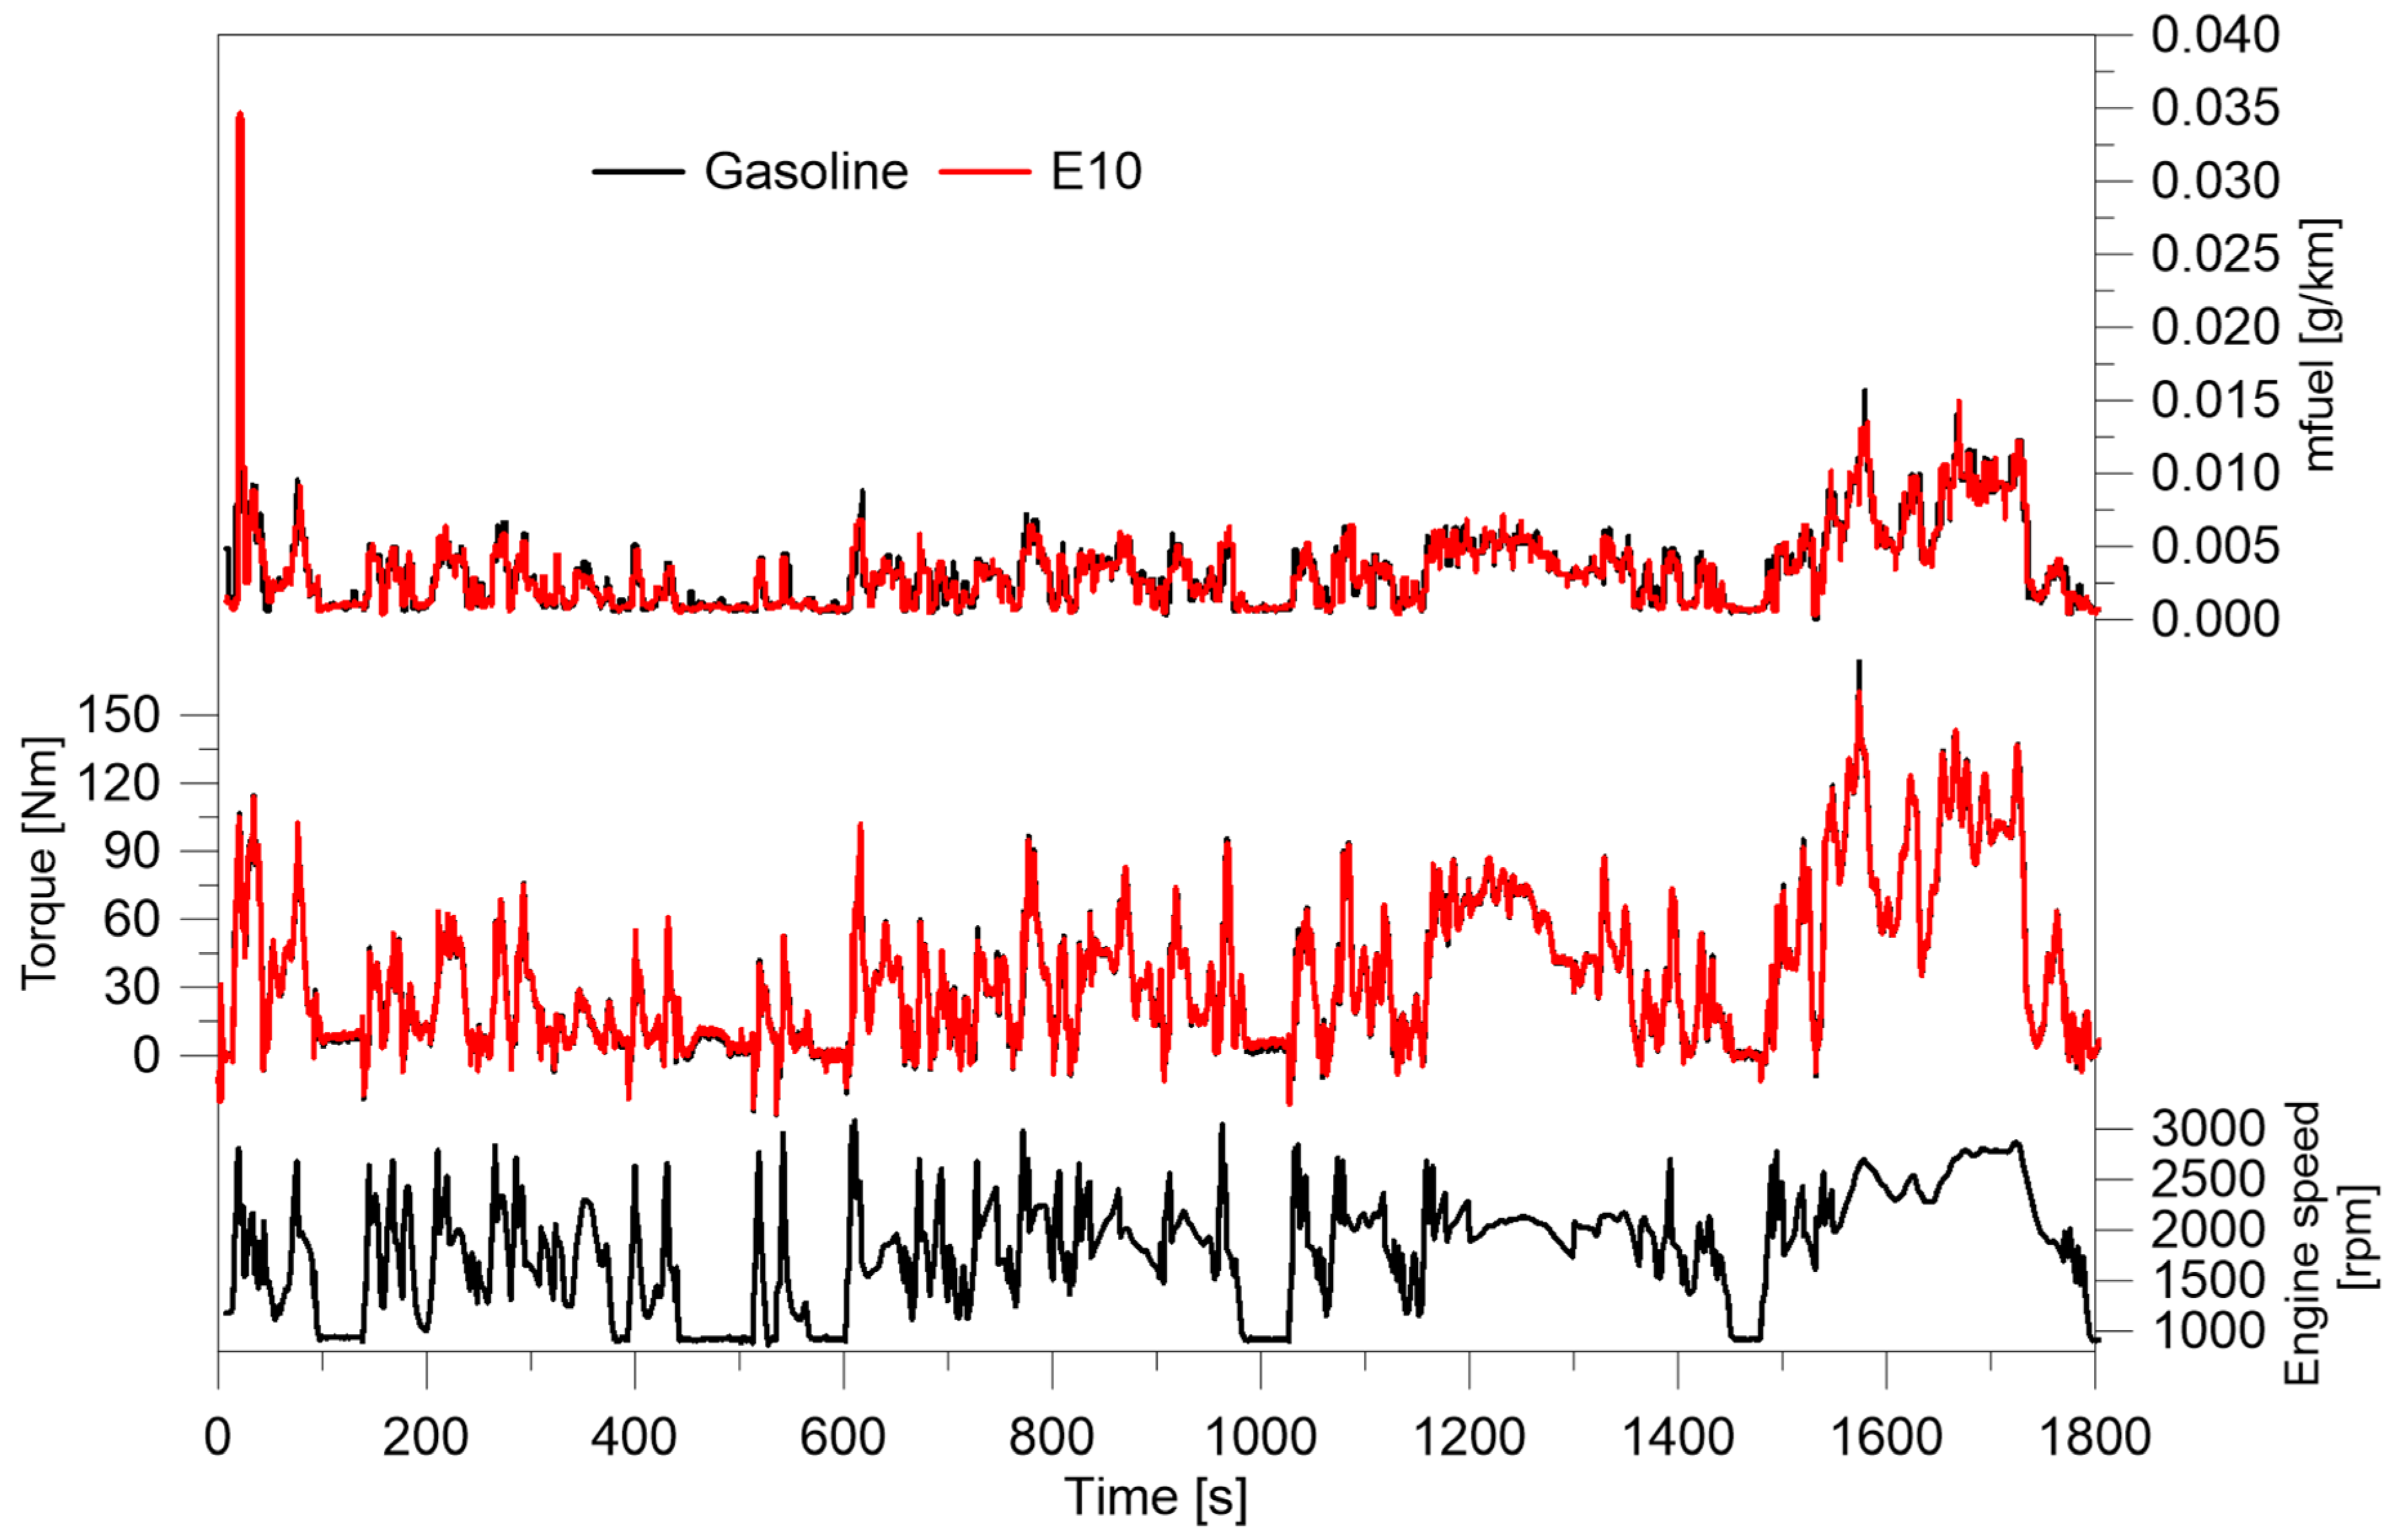
2.2.1. WLTC Reproduction

The engine was operated on the engine test bench (ETB) according to the WLTC.
For this purpose, a specific procedure was developed, as schematically shown in Figure 2. The WLTC was reproduced on the roller test bench (RTB) by using a vehicle equipped with the same engine with the aim of collecting the engine speed and the request load. These data were used to reproduce the WLTC on the ETB by setting the pedal position with a feedback on the request load to reach the same values read on the RTB. During the WLTC realized at the ETB with gasoline, assumed as a reference fuel, the brake torque was recorded and then used to reproduce the WLTC at the ETB with the reference fuel by adjusting the pedal position with a closed loop control on the actual brake.
This procedure allowed to reproduce the WLTC at the ETB with the same engine speed and power output regardless of the fuel used.
This WLTC procedure being performed on the engine rather than on the vehicle certainly differs from that prescribed by emission regulation. However, this method allows to reproduce the WLTC in conditions very close to those of a WLTC performed on the RTB and with a high degree of reproducibility.
At the beginning of each test, the oil and coolant temperatures were at 23 °C. One test per day was performed and each fuel was tested three times.

2.2.2. Tested Fuels

Tests were carried out with three different ethanol/methanol blends. Table 4 shows the main physical-chemical properties of the pure fuels used to prepare the blends. Ethanol and methanol have attractive properties as fuels for SI engines, including a higher ON and oxygen content and a lower carbon-to-hydrogen ratio than gasoline fuel. On the other hand, both alcohols have a lower low heating value (LHV) with respect to gasoline [9].
Commercial gasoline available at fuel pump was used as the reference fuel. The alcohol blends were obtained by splash blending ethanol and/or methanol with gasoline at different volume proportions. A blend of 10% v/v of ethanol with 90% v/v of gasoline, E10, was chosen as the representative blend for distribution in the European market, satisfying the requirements specified by the European standard EN 228 for unleaded petrol [20]. A blend prepared with 25% v/v of ethanol and 75% v/v of gasoline, E25, was chosen because of the interest shown by the European Commission towards this ethanol blend percentage [21]. A blend consisting of 80% v/v gasoline, 15% v/v methanol and 5% v/v ethanol, E5M15, was also tested. The volume percentages of E5M15 were chosen to have a methanol blend with a similar LHV to E25, i.e., 38 MJ/kg.

3. Results

Figure 3 shows the temporal evolution of the instantaneous fuel consumption, engine torque and speed over the WLTC for gasoline and E10. The engine torque follows the same patterns for the tested fuels. As described in the previous section, the procedure to realize the WLTC at the engine test bench was developed so that the torque output was fixed, regardless of the fuel used. On the other hand, to reach the same torque output, the instantaneous fuel consumption changed depending on the fuel properties. However, it is possible to identify similar characteristics during the cycle among the fuels. A high fuel consumption, in fact, is observed in the first minutes of the cycle, where fuel enrichment is required to face the low temperature of the cold start. A peak of 0.015 g/km was measured for gasoline, while higher value, up to 0.03 g/km, was detected for E10. Due to the higher HOV of the ethanol blend, a larger amount of fuel was in fact injected to overcome the cold engine start. A large fuel consumption was also measured in the extra-high phase of the cycle where more fuel is required to realize the strong accelerations. Similar values, up to 0.016 g/km, were measured for both fuels. In this case, thanks to the higher temperature reached in the combustion chamber, the effect of ethanol blend properties is less evident.
To obtain a better analysis of the impact of the fuel, the consumption variation for the alcohol blends with respect to gasoline fuel was calculated at each phase of the cycle and is shown in Figure 4. It can be observed that there are no significant differences between the consumption of gasoline and E10 (all are within 2%). E25, and even more so E5M15, show a higher fuel consumption than gasoline fuel because of the lower LHV. A peculiar behavior is observed in the low phase where the fuel consumption of E5M15 is higher than that of gasoline fuel but slightly lower than that of E25. A possible reason is that the ECU performs a correction when the methanol blend is used to avoid a strong reduction in temperature caused by the higher HOV of methanol, especially in the first minutes of the cycle when the temperature is already low.
Gaseous emissions were measured for all the tested fuels throughout the WLTC. Their temporal evolution and the contribution calculated for each phase of the cycle are depicted in Figure 5, Figure 6, Figure 7 and Figure 8.
Figure 5 reports the CO2 emissions. It is known from literature [22] that CO2 emissions depend on the fuel consumption and the combustion efficiency. As shown in Figure 4, the amount of fuel undergoes a slight reduction from low to medium phase and a following increase in the high and extra-high phases. The same trend of CO2 emissions is observed for all the fuels. Regarding the fuel effect, the CO2 emissions increase with the ethanol content in the blend. The oxygen content in the alcohol fuel, in fact, guarantees a “premixed oxygen effect” [23], thus allowing a more complete combustion. A strong reduction is observed for the ternary blend, although it is characterized by higher fuel consumption. This result can be ascribed to the lower C-content of E5M15. Moreover, an important role is played by the stronger charge cooling effect of the methanol blend that leads to a worst fuel evaporation and combustion efficiency compared to gasoline and ethanol blends.
Figure 6, Figure 7 and Figure 8 depict CO, THC and NOx emissions, respectively, for all the conditions investigated. Higher emission values are detected in the low phase. During the cold start, the temperature required to activate the chemical reactions in the TWC is not yet achieved and it does not work efficiently [24]. This result is more evident for the CO and HC emissions, since the low in-cylinder temperature, typical of this phase, worsens the combustion efficiency, thus enhancing the CO and THC formation. In the rest of the cycle, instead, after the light-off temperature is reached, the TWC allows for an efficient conversion of the pollutants, as evidenced by the low emission concentration. Concerning the fuel effect, CO and THC exhibit a similar trend, since both are a product of incomplete combustion. Their common behavior is a reduction of both CO and THC for the ethanol blends compared to gasoline, owing to the leaning effect due to the oxygen that improves the combustion efficiency. This trend is also supported by the higher CO2 emissions for E25 (Figure 5). For E5M15, THC and CO emissions measured over the entire cycle are lower than E25. However, different behaviors are observed among the various phases of the cycle. Lower CO and THC emissions are measured for the ternary blend in the first part of the cycle due to the lower amount of fuel injected (Figure 4). On the other hand, in the extra-high phase, CO and THC are higher compared to E25. The higher HOV of methanol leads to a stronger cooling effect. Although the higher temperature is typical of the last phase of the cycle, a larger quenching effect can occur with respect to E25, causing an increase in THC emissions. At the same time, the freezing of CO to CO2 conversion reactions can occur.
Figure 8 illustrates the NOx emissions detected for the tested fuels. It is well known that the NOx formation reactions depend on the oxygen availability and the combustion temperature. In this case, it is not possible to observe a common trend in the proportion of NOx emitted among the different phases of the cycle. This is ascribable to the different role of the cooling effect and the oxygen content for each of the fuels. Regarding the binary blends, the total NOx emitted during the WLTC decreases for E10 and even more so for E25 with respect to gasoline fuel because of the stronger cooling effect as a result of the higher HOV. In the low phase, the lower NOx emissions compared to gasoline are due to the higher HOV of ethanol that contributes to a further reduction in the temperature in the first minutes of the cycle, since more heat is required to vaporize the fuel. On the contrary, in the last phase of the cycle, characterized by a higher temperature, the larger oxygen presence plays a dominant role, resulting in a higher NOx formation. For E5M15, the charge cooling has a major effect during the entire cycle, thus resulting in lower NOx values at each phase.
The effect of alcohol blends on the particle emissions was also analyzed. Figure 9 depicts the PSDs averaged over each phase of the cycle for gasoline, E10 [25], E25 and E5M15, and the minimum concentration limits for each diameter (MIN). Particles have diameters ranging between 10 and 300 nm and the shape of the PSDs varies with the fuels and the specific phase of the cycle.
The low phase is characterized by the highest particle emissions for all the fuels. This trend can be ascribed to the low temperature at the engine start that causes non-uniform fuel vaporization and, hence, the presence of fuel rich zones where particle formation is promoted. Regarding the PSD, it possible to observe that gasoline fuel exhibits a nucleation mode at 25 nm and a higher accumulation mode at 67 nm. The concentration is reduced and the particles move towards smaller diameters when adding ethanol to the blend. This result can be explained considering the properties of ethanol/gasoline blends having a higher hydrogen/carbon ratio and less hydrocarbon chains that are indicated as precursors of soot formation [26]. Moreover, the presence of oxygen in the ethanol molecule diminishes the concentration of intermediate species representative of soot precursors, and supports the oxidation of any formed soot molecule [27].
In detail, E10 exhibits two distinguishable modes at 10 nm and 69 nm. On the other hand, E25 has a pronounced peak typical of the nucleation mode at 10 nm and a slight hump due to accumulation particles with a less pronounced peak at 53 nm. The effect of the ethanol/methanol blend on the particle emissions with respect to gasoline fuel is similar to the binary ethanol blends thanks to the low sooting tendency of methanol. However, the particles are larger than those emitted by ethanol blends. The PSD for E5M15, in fact, is characterized by a small nucleation mode at 10 nm and a dominant accumulation peak at 53 nm higher than that of E10. When methanol is added, the mechanism of particle formation is deteriorated compared to the ethanol blends. The higher HOV of methanol, in fact, slows the fuel vaporization, increasing the formation of fuel rich regions where particles are formed.
Considering the medium and high phases, the particle emissions are reduced for each fuel thanks to the increase in temperature that enhances the fuel evaporation, thus promoting a more homogeneous charge formation. The PSD shape is similar for all tested fuels, with a clearly distinguishable nucleation mode peaked at 10 nm and a less definite accumulation mode with a peak around 50 nm. The effect of the fuel on the particle emissions follows the same trend observed in the low phase. For the binary blends, the particle concentration is lower than for gasoline, and it decreases with the ethanol content. In contrast, for the ternary blend, it increases with respect to E10, but remains lower compared to gasoline.
In the extra-high phase, the ethanol blends show the same behavior of the previous phases. On the contrary, the ethanol/methanol blend shows a higher accumulation mode than E10 with a maximum value comparable to gasoline even if the E5M15 distribution is narrower than the base fuel. As also observed by Leach et al. [27], it is possible that the reduced time for fuel evaporation at the high engine speed, characteristic of the last phase of the cycle, alongside the local cooling due to the methanol evaporation lead to a poor mixture formation, resulting in high particle emissions.
Figure 10 depicts the total particle number emitted throughout the cycle with particles classed as those with a size larger than 23 nm, representative of accumulation particles, and those smaller than 23 nm, whose measurement has been the subject of several research studies because of their regulation from the next emission standard [28,29,30,31]. Gasoline fuel emits a total of 1.3 × 10⁷ #/cm3 particles, of which 78% are larger than 23 nm and the remaining 22% are sub-23 nm particles. As ethanol is added to the base fuel, the particle number decrease to 7.9 × 10⁶ #/cm3 and 2.5 × 10⁶ #/cm3 for E10 and E25, respectively. Moreover, the fraction of particles with a diameter lower than 23 nm is more considerable than gasoline fuel, reaching 28% with E10 and up to 55% with E25. As mentioned previously, ethanol has a lower propensity to form soot. Moreover, its presence affects the soot aggregate structure that becomes smaller and simpler and thus more prone to oxidization [32]. For E5M15, the total particle number remains lower than gasoline fuel, 5.8 × 10⁶ #/cm3, even though it has a higher value with respect to E25 that is characterized by the same energy content as the ternary blend. By analyzing the particle dimensional range, it can be observed that the major contribution by the particles larger than 23 nm. As described above, when methanol is added to the blend, the cooling effect of the charge due to the higher HOV has a dominant role over the higher level of oxygen in the fuel, thus leading to incomplete mixture evaporation and, hence, poor mixture preparation.
To obtain a type of goodness index among the tested fuels, the emissions and fuel consumption values over the WLTC were normalized and compared to the gasoline data, as shown in Figure 11. It is clear that alcohol blends have a benefic effect on the gaseous emissions compared to gasoline fuel. Both the binary ethanol blends and the ternary ethanol/methanol blend, in fact, allow the reduction in CO, THC and NOx emissions, as evidenced by the negative percentage values. On the contrary, alcohol blends, especially E25 and E5M15, require larger fuel consumption, even if they consist of part of a renewable source. Regarding the particle emissions, E25 produces more sub-23 nm particles. This is a critical issue considering that the next European limits will regulate particles with a size range down to 10 nm [33]. The ethanol/methanol blend, instead, emits a lower particle number, both smaller and larger than 23 nm, with respect to gasoline fuel. Compared to E25, instead, the ternary blend is characterized by less sub-23 nm particles but a slightly higher number of larger size particles. It can be argued that an appropriate optimization of engine parameters allows the ethanol/methanol blends to further benefit in terms of pollutant emissions and consumption.

4. Conclusions

This study analyzes the effect of ethanol/methanol blends on the performance and emissions of a 1.8 L, turbocharged GDI engine. The experiments were conducted on an engine test bench that allows the WLTC to be reproduced. Three different blends were tested: a blend consisting of 10% v/v ethanol that is commonly found in fuel pumps, a blend consisting of 25% v/v of ethanol and a blend made of 5% v/v ethanol with 15% v/v methanol that is characterized by a similar energy content to the previous one. Both gaseous and particle emissions were measured downstream of the TWC. It was found that the influence of the alcohol blends on fuel consumption and emissions depends on the competitive effect between the fuel properties and the engine operating condition in the different phases of the cycle. The main conclusions can be summarized as follows:
-
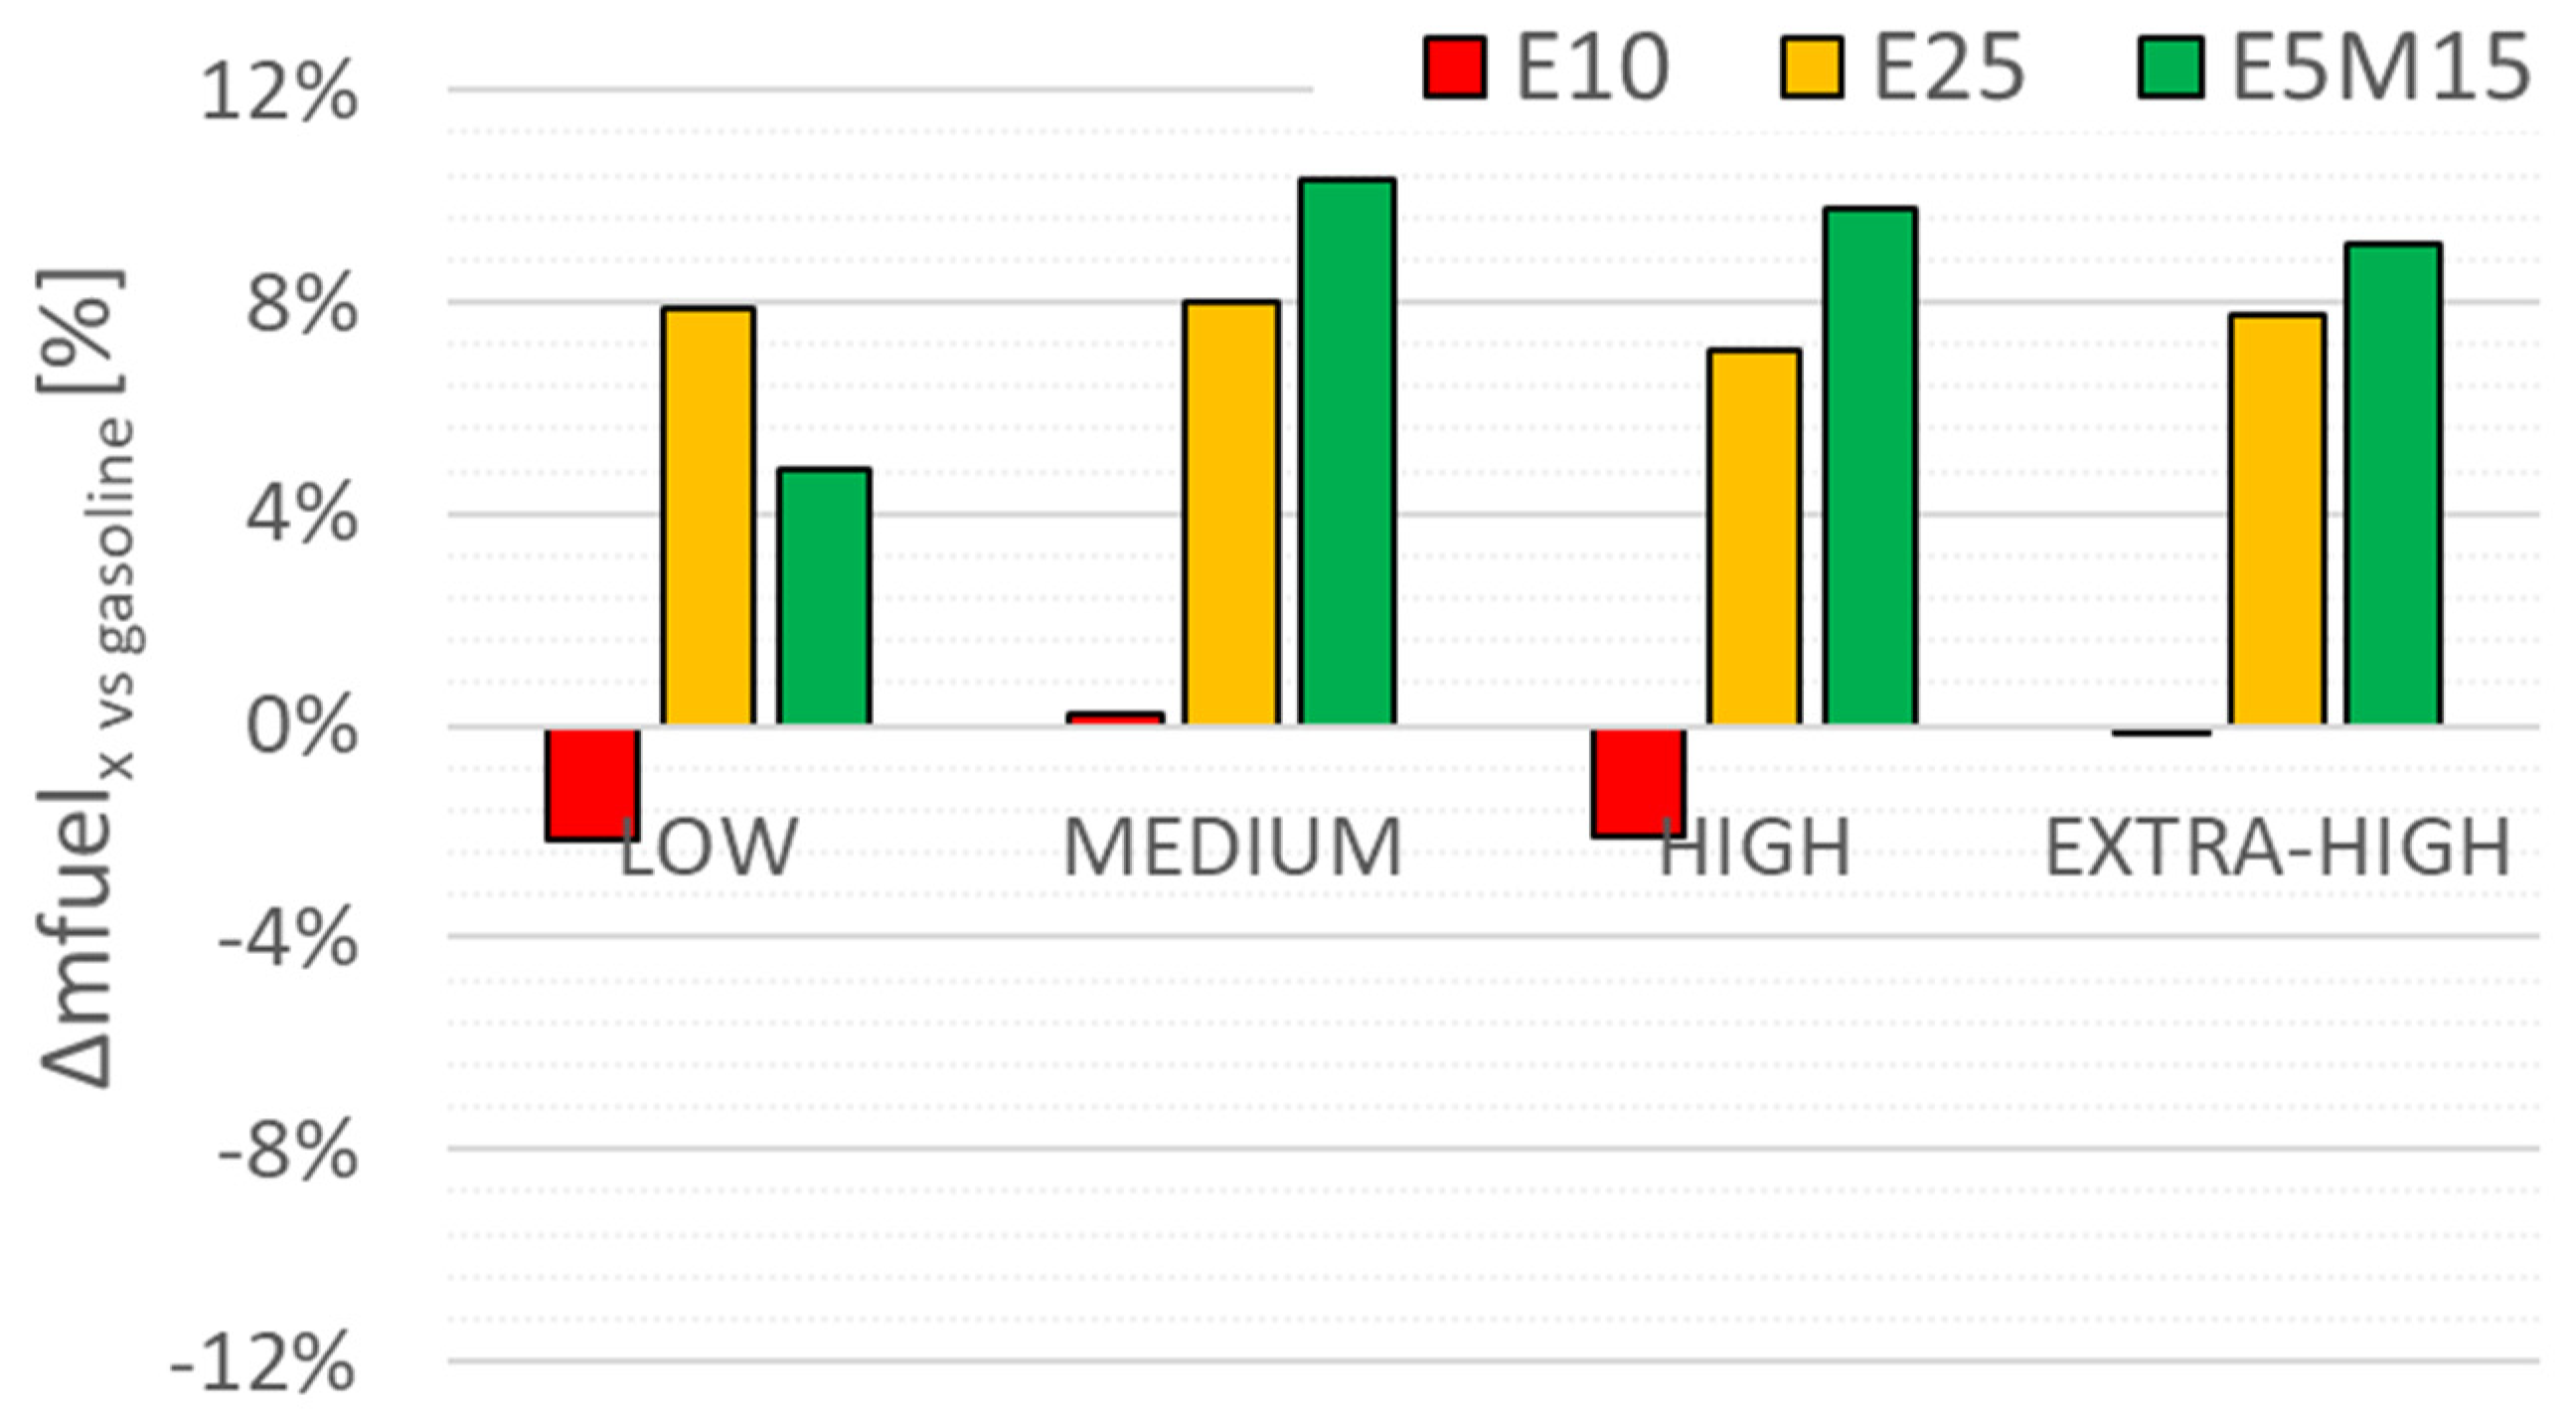
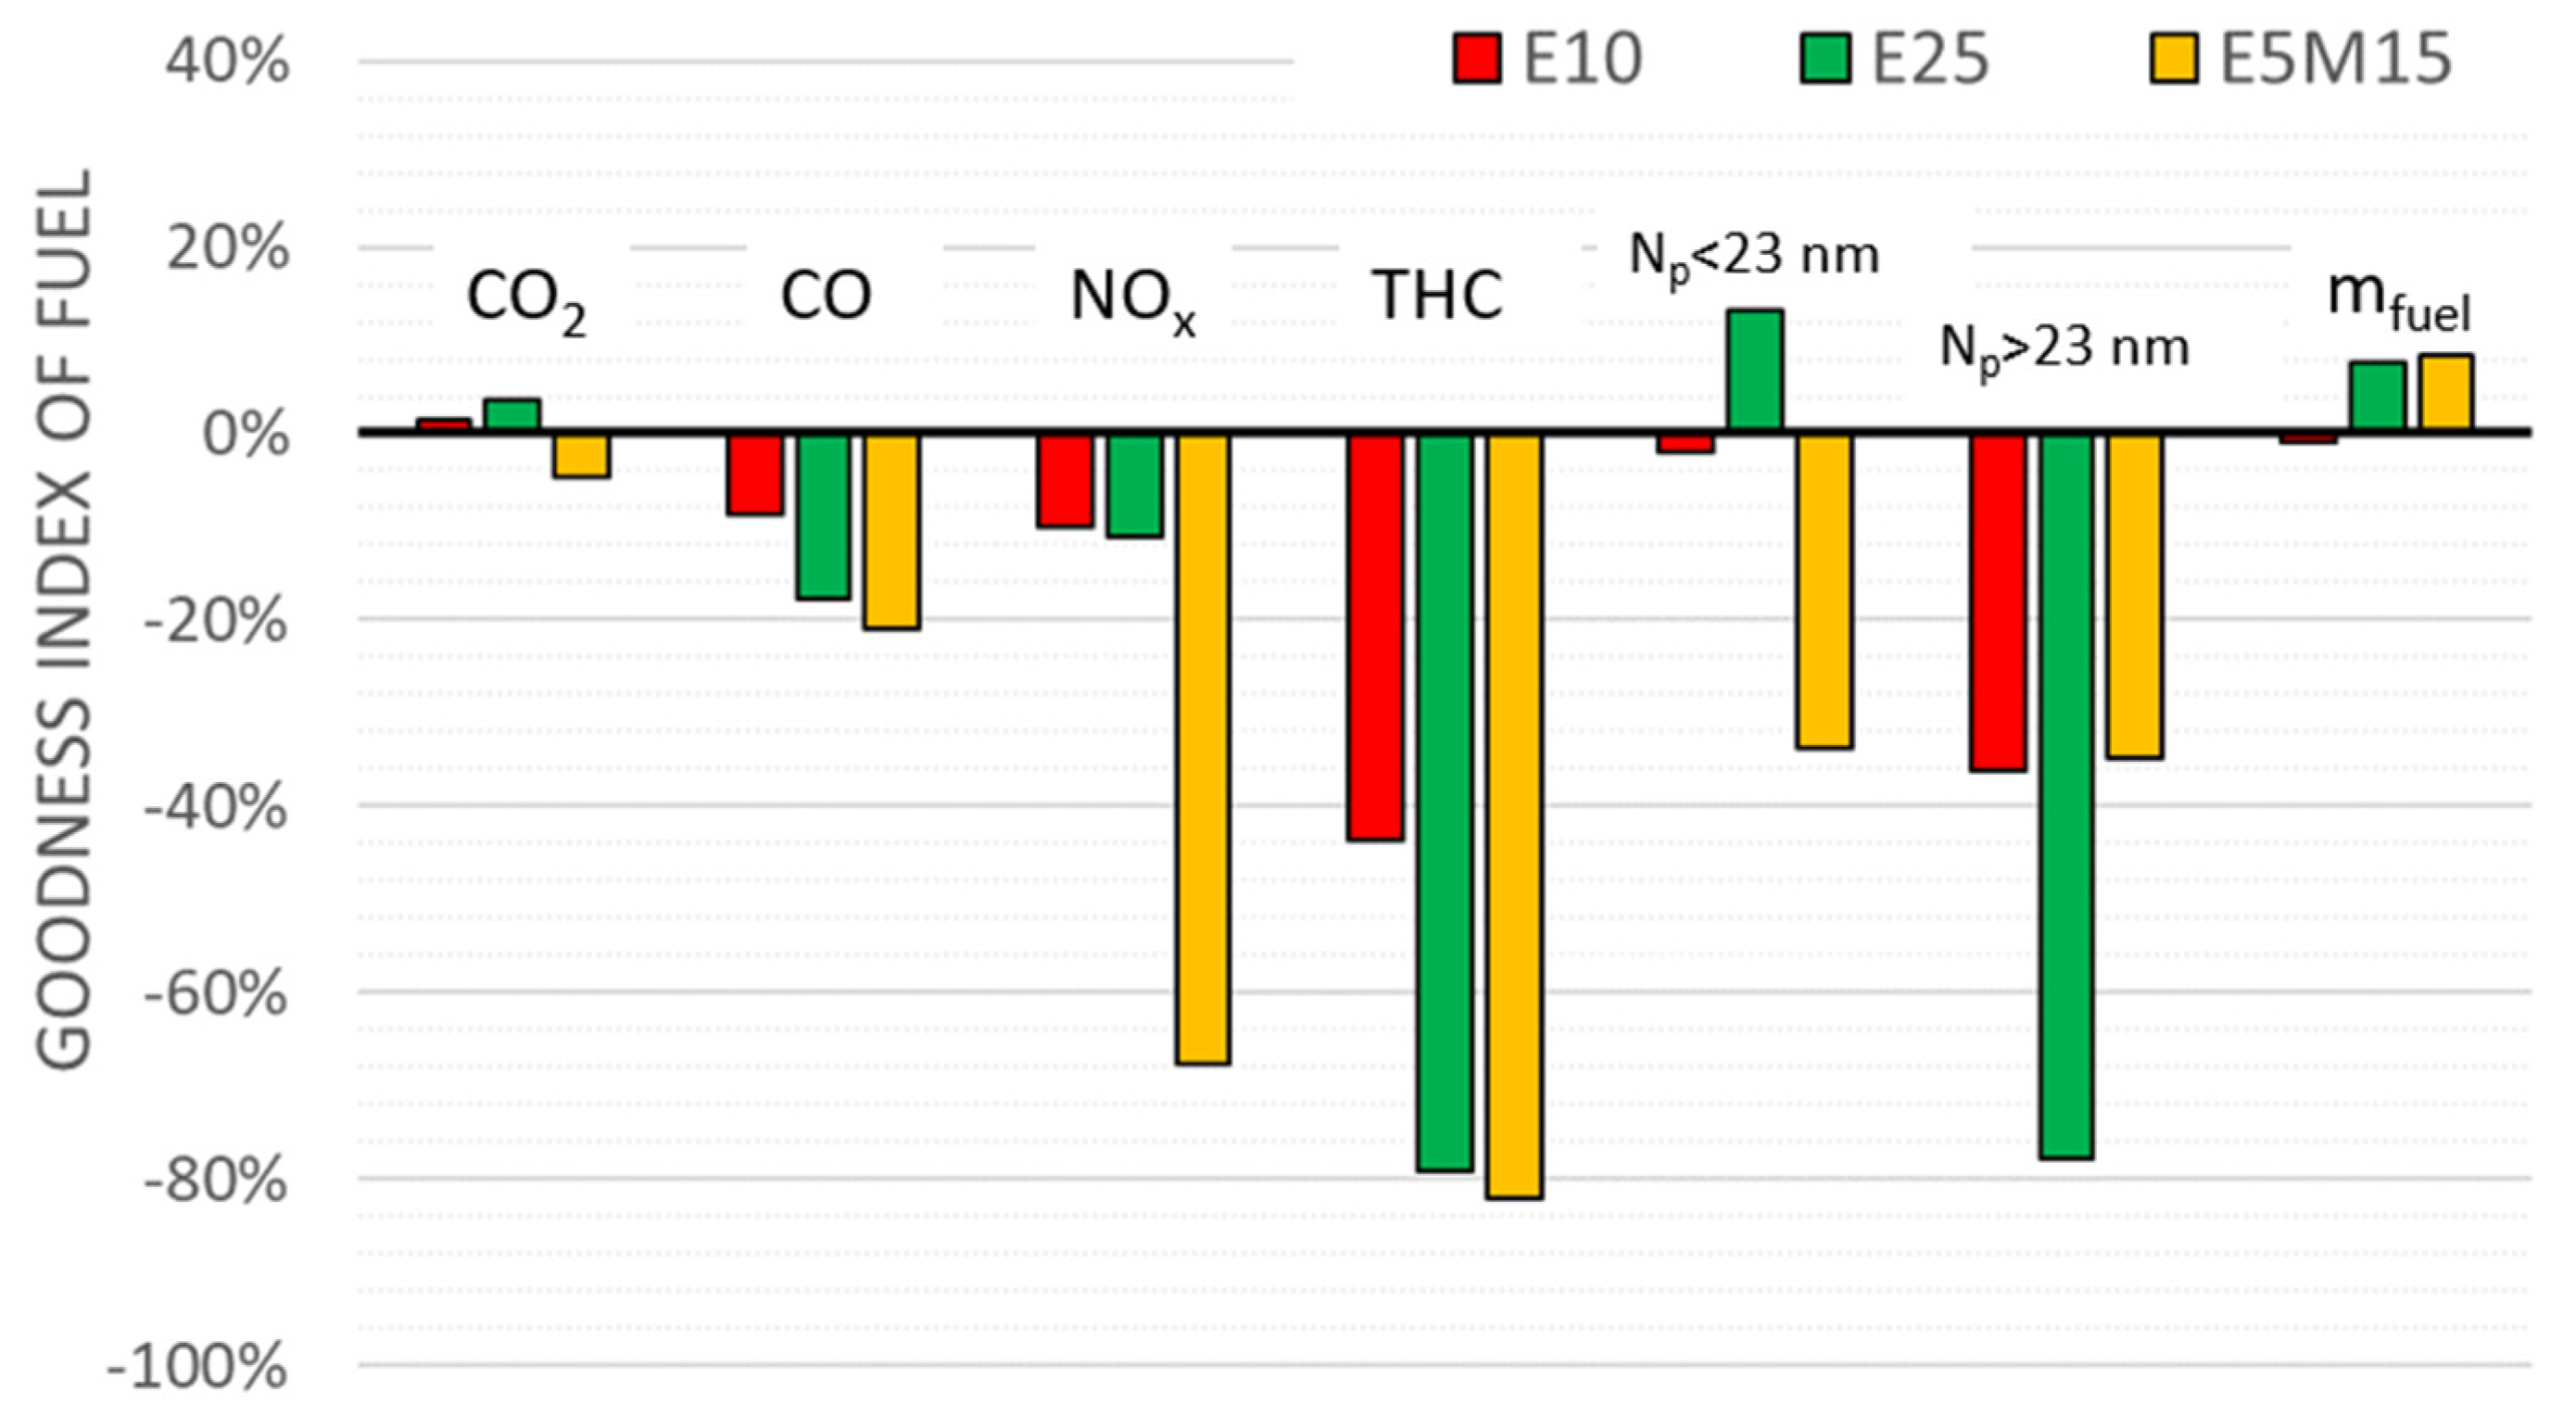
A large fuel consumption is measured for ethanol blends and an even larger fuel consumption is measured following the addition of methanol to the fuel, except in the first part of the cycle, where E5M15 shows a lower consumption than E25.
-
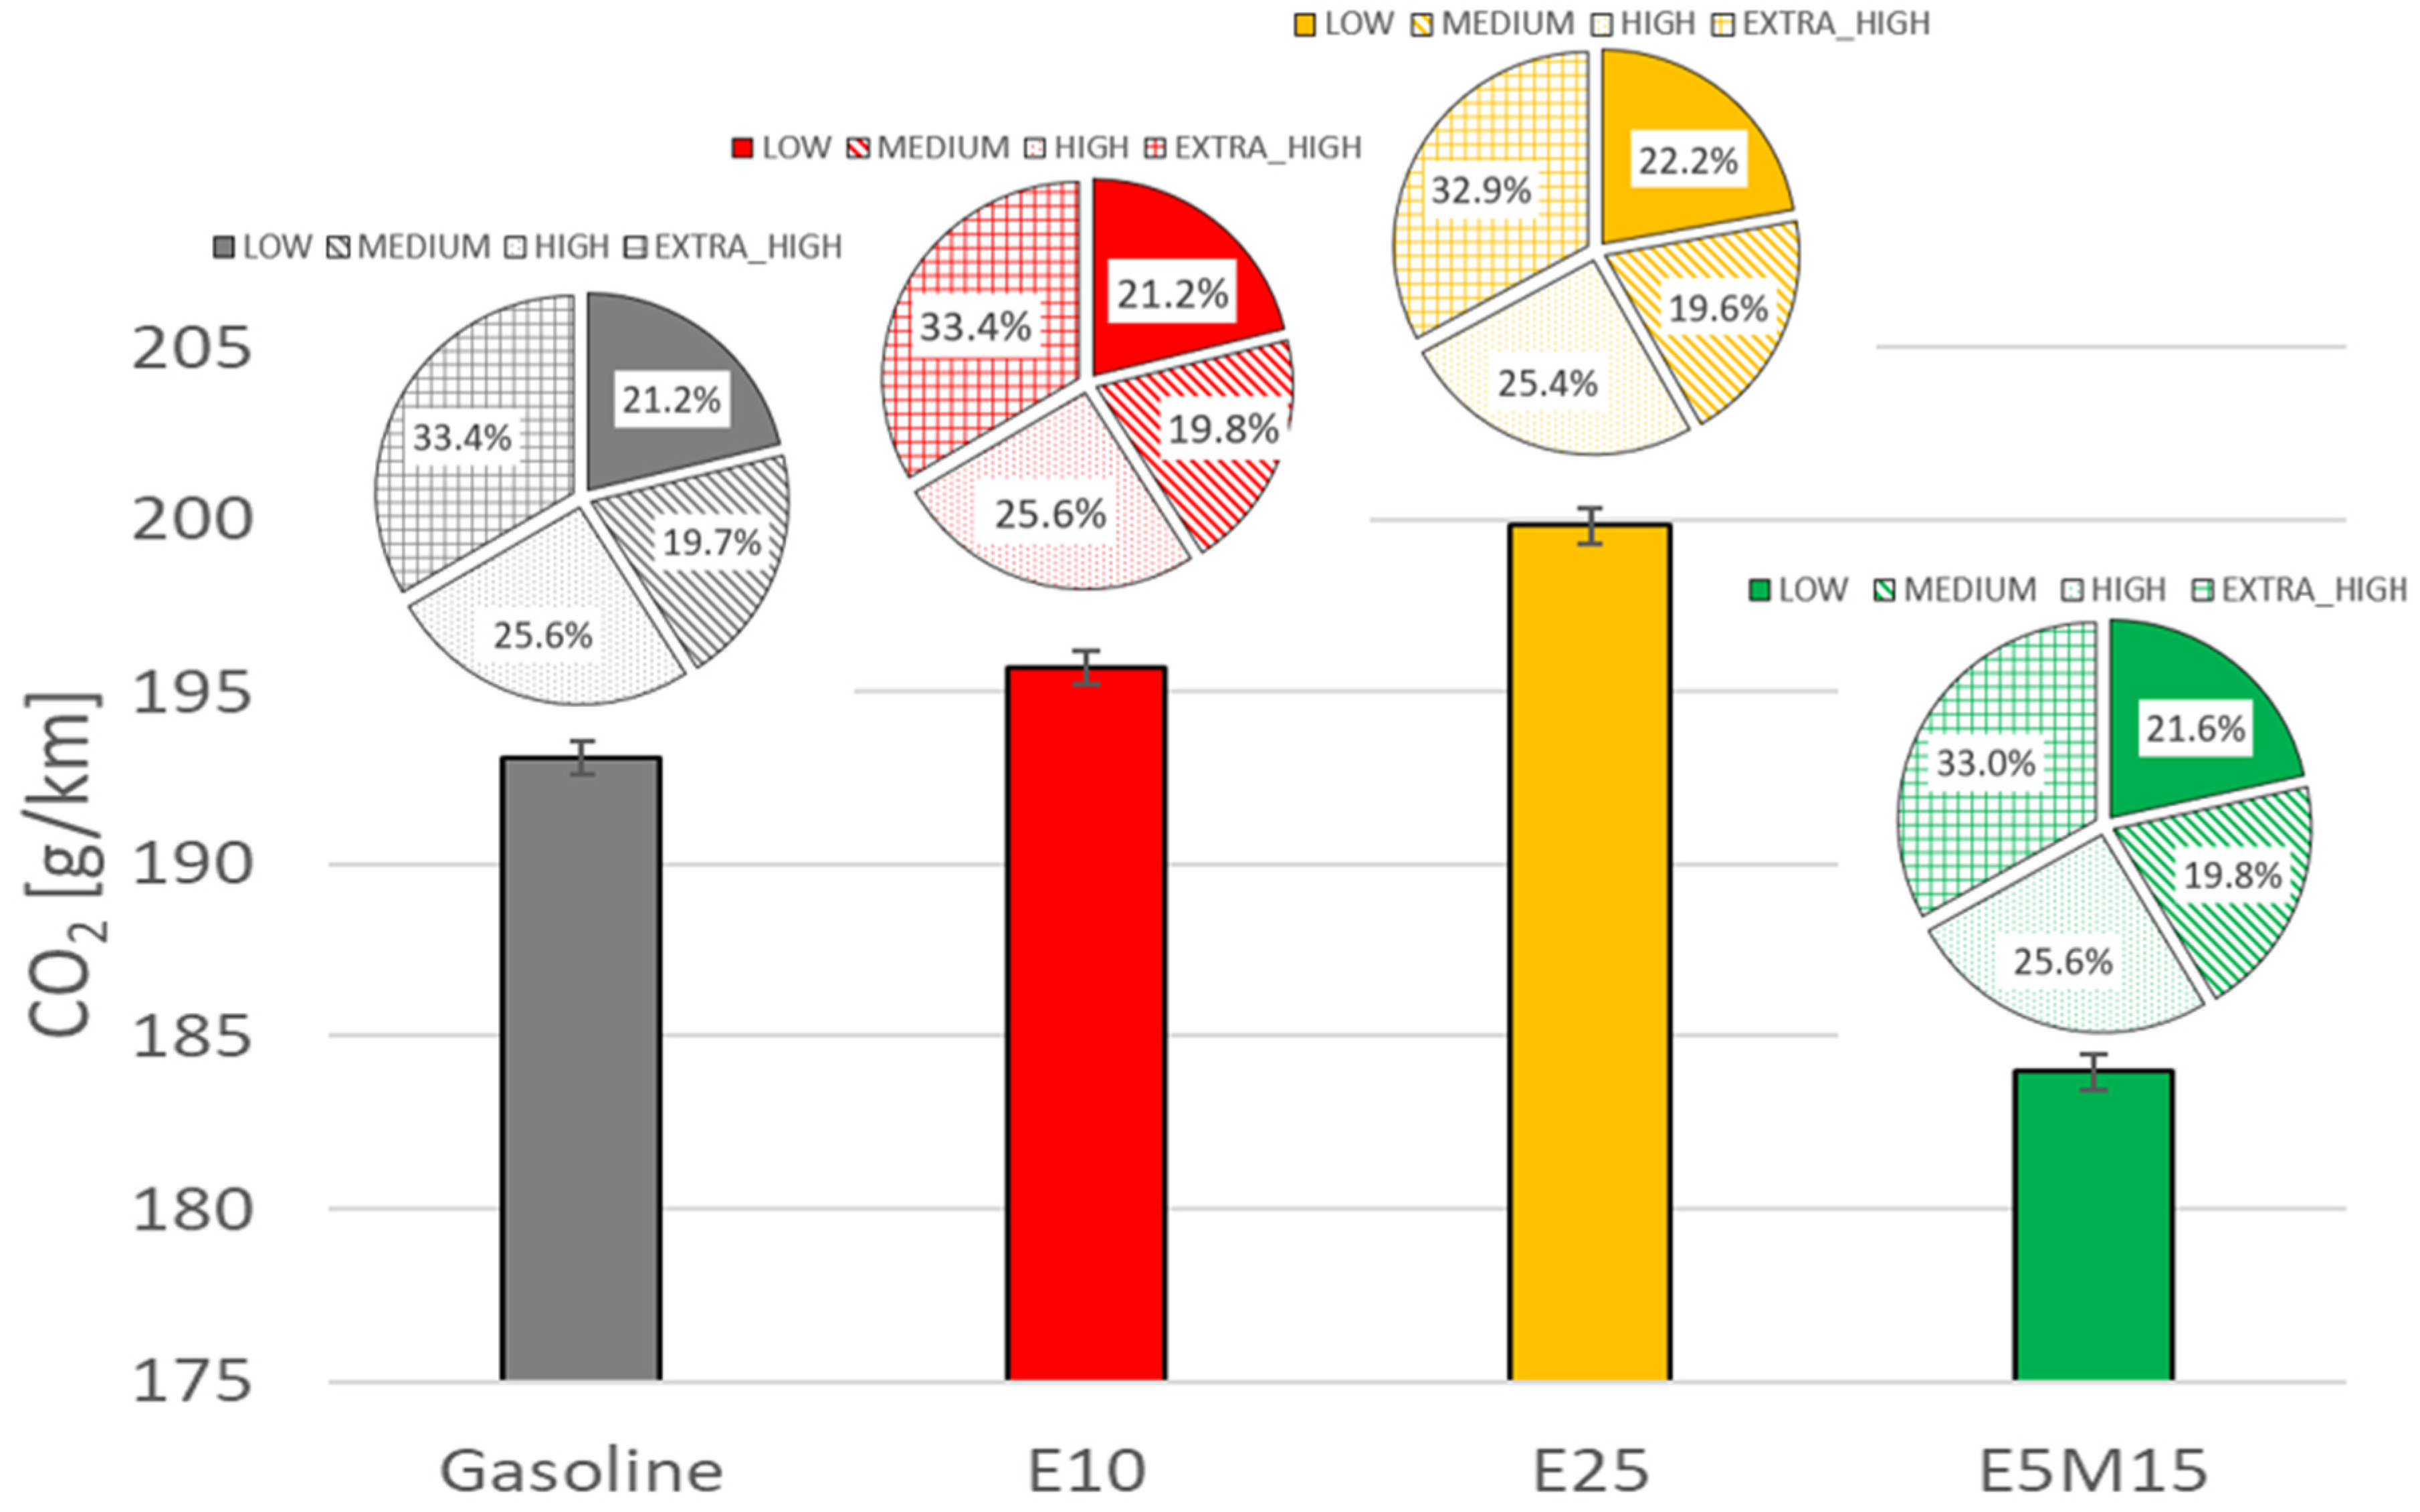
CO2 emissions increase for E10 and E25, while they decrease for the ternary blend due to the negative impact of methanol on combustion efficiency.
-
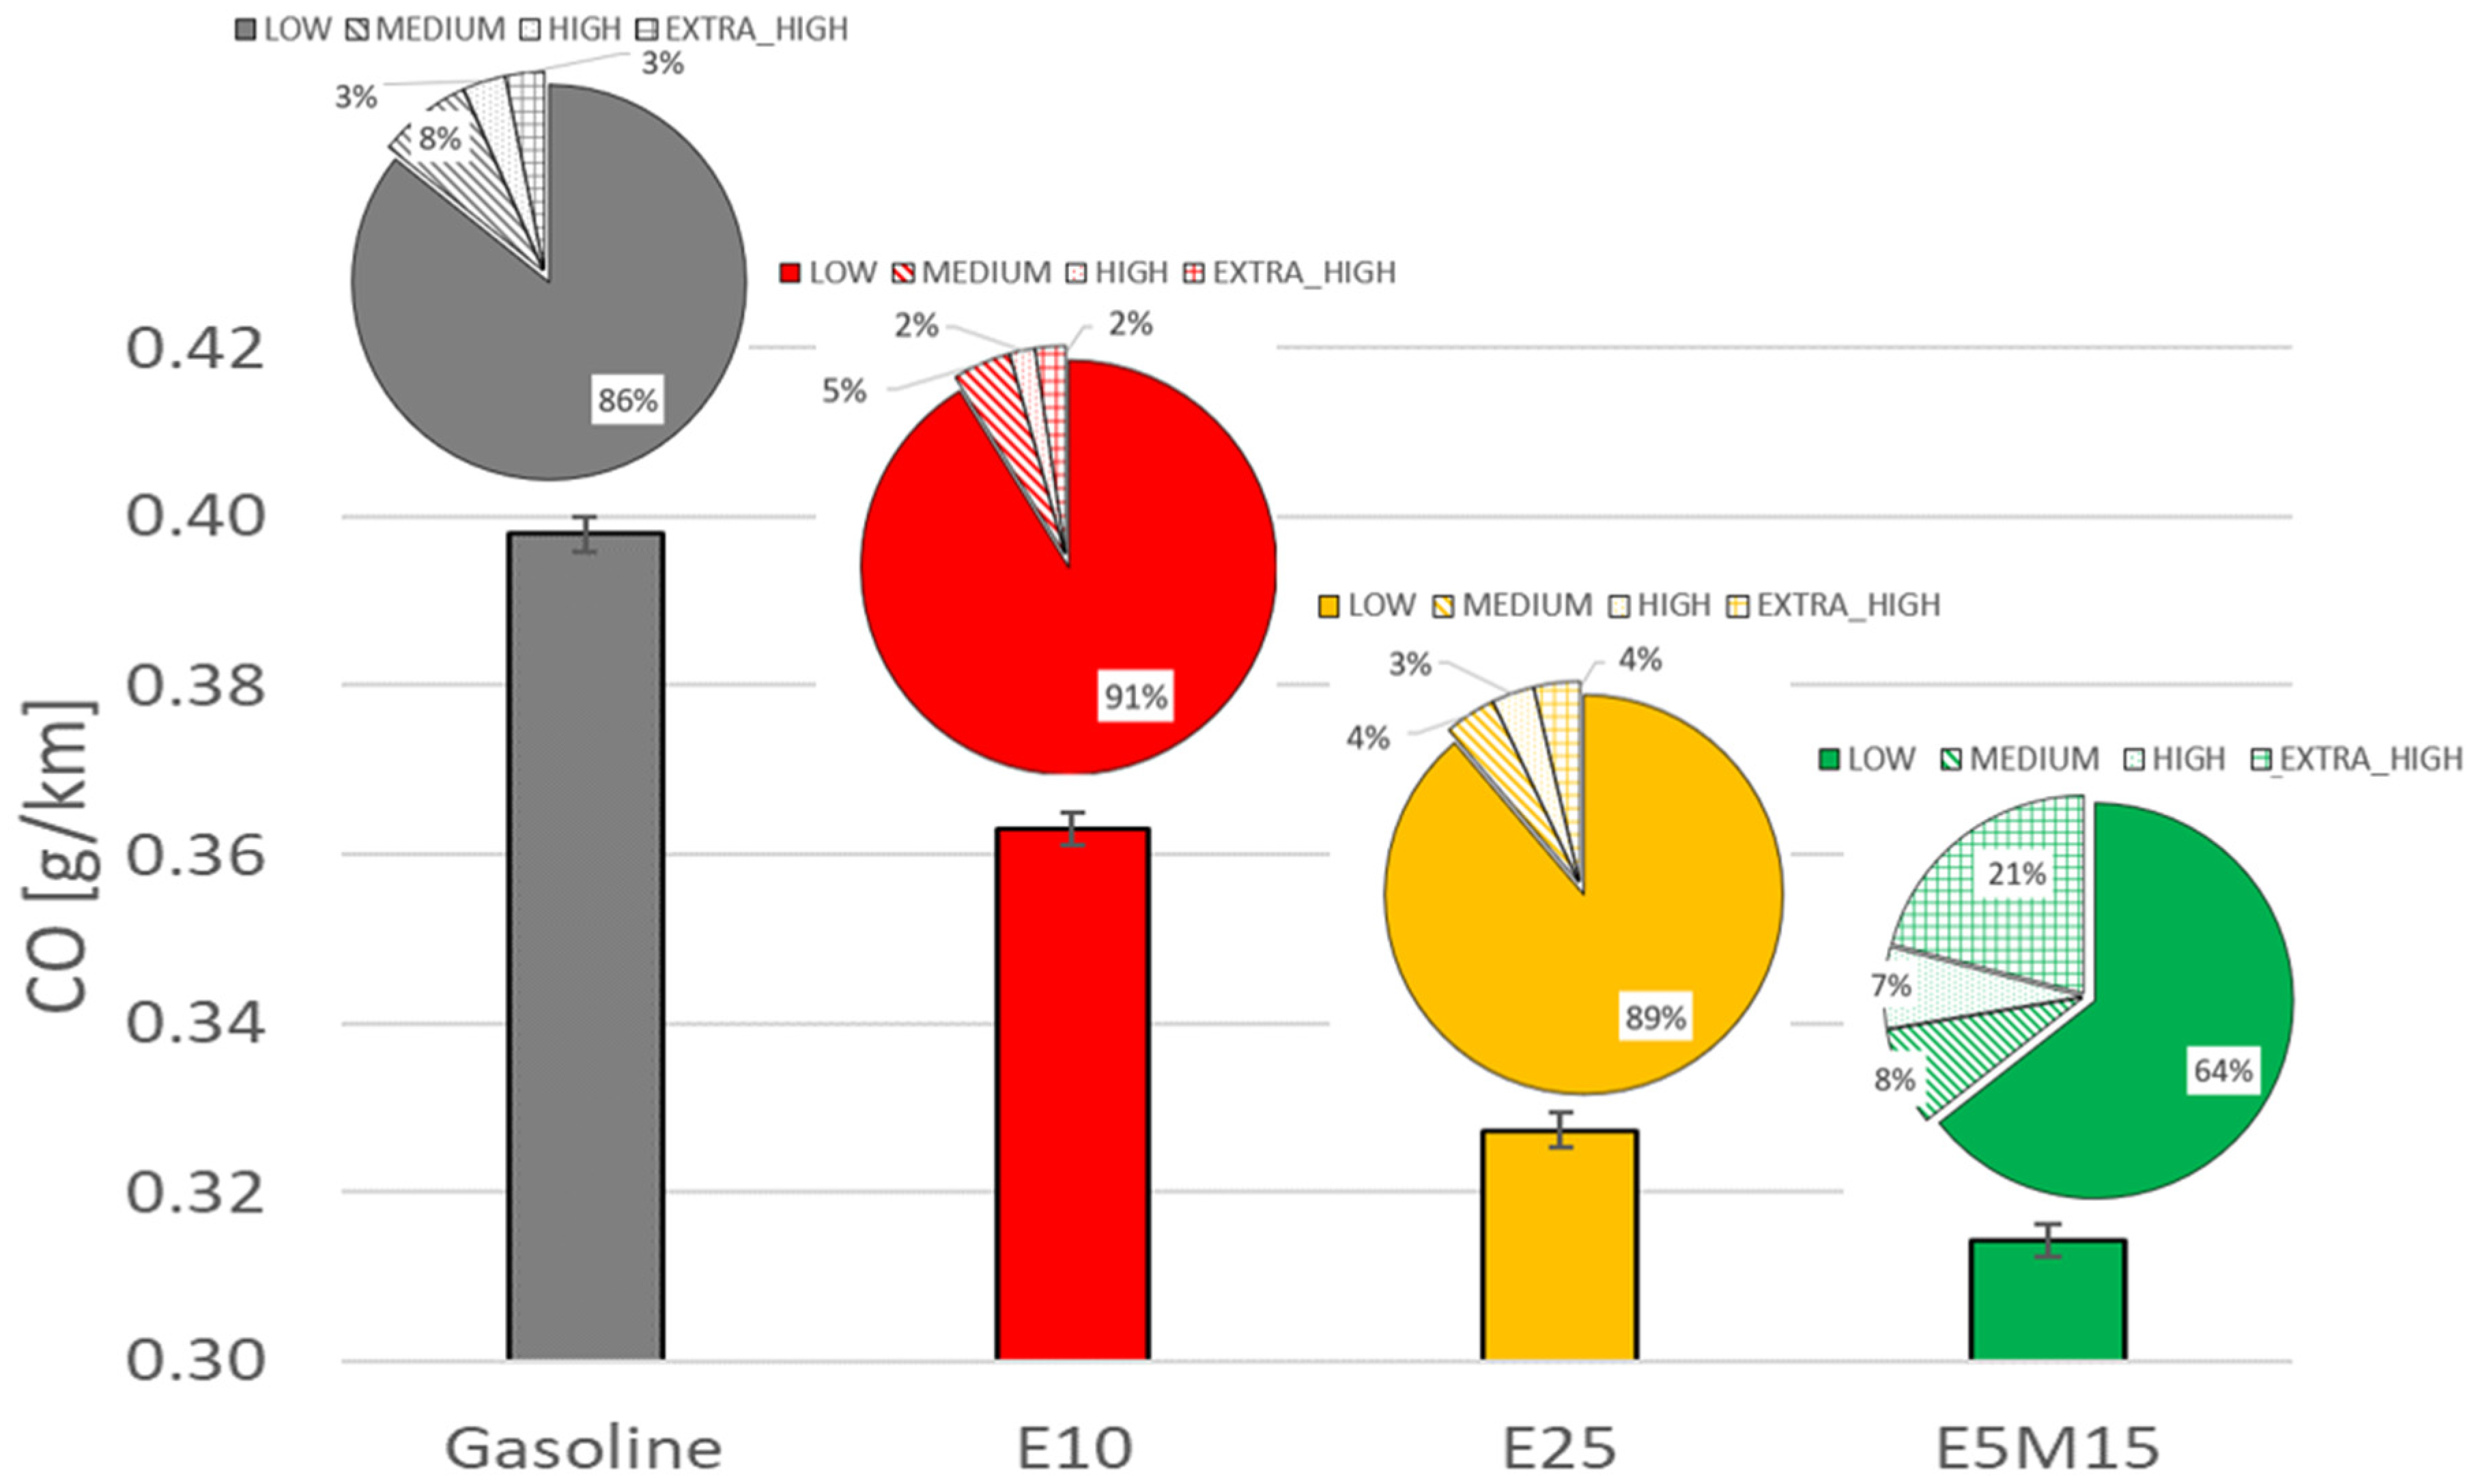
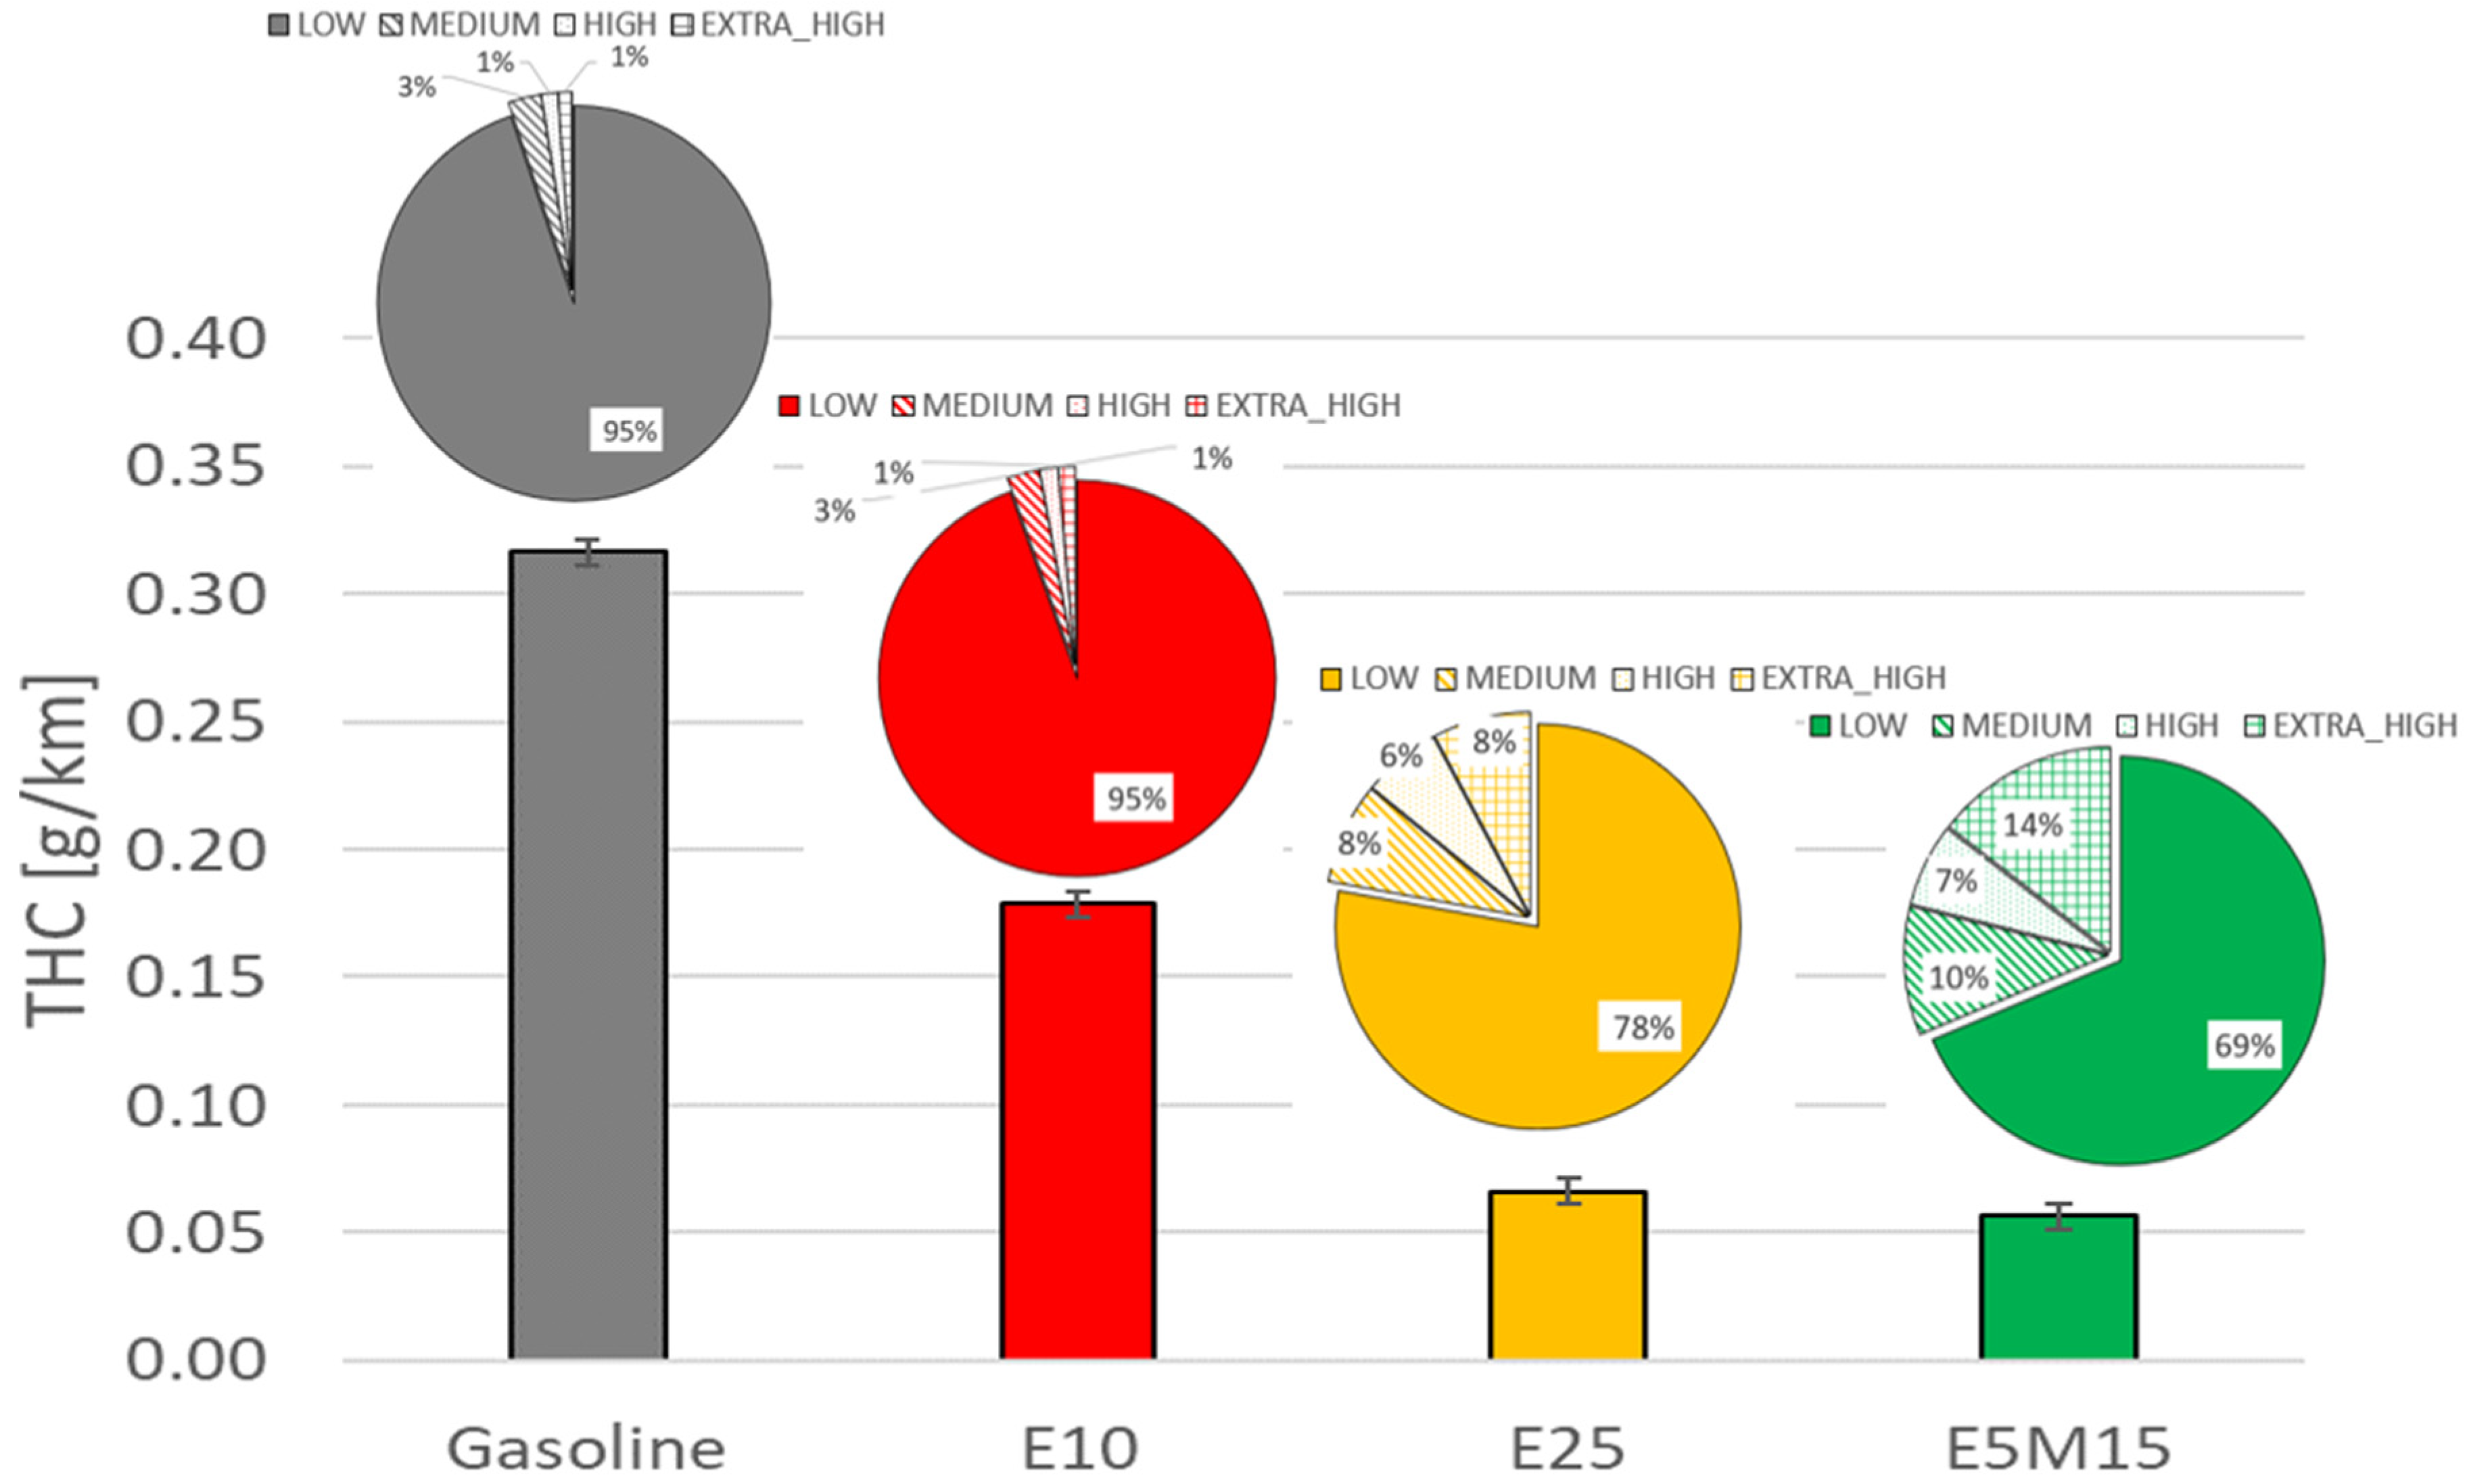
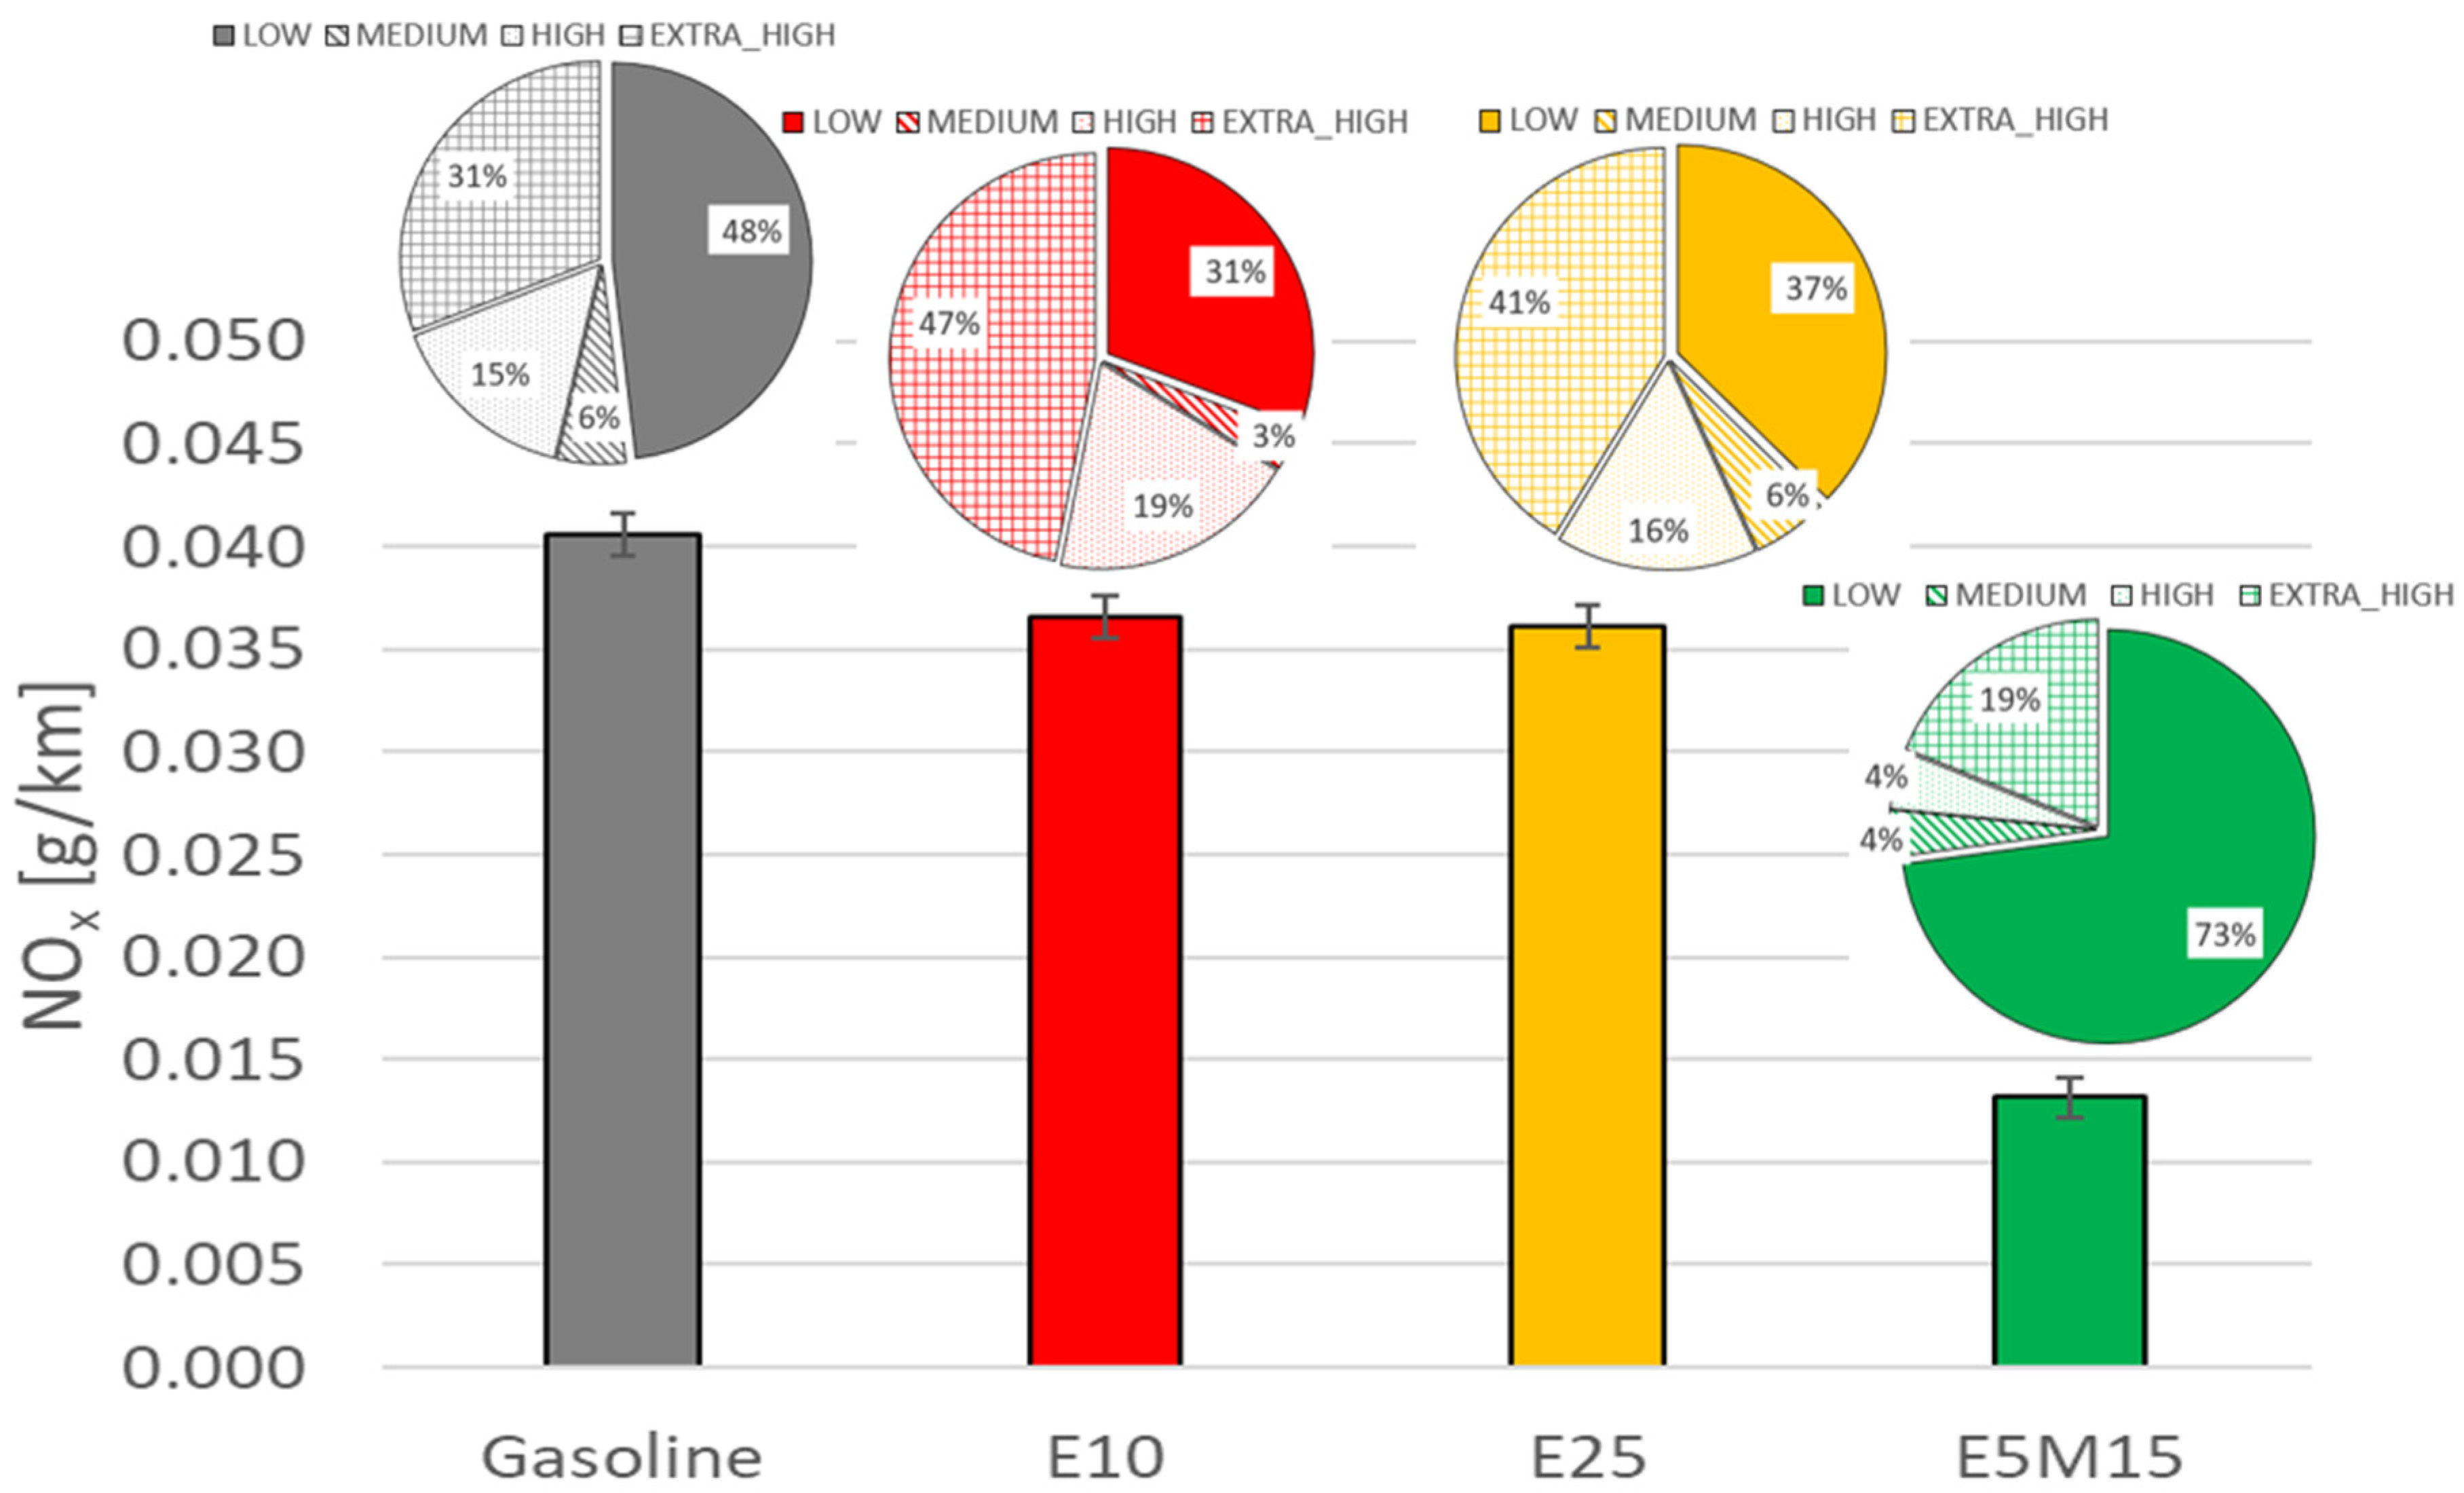
CO, THC and NOx emissions show a linear decrease for E10, E25 and E5M15, even if their weight changes depending on the specific phase of the cycle.
-
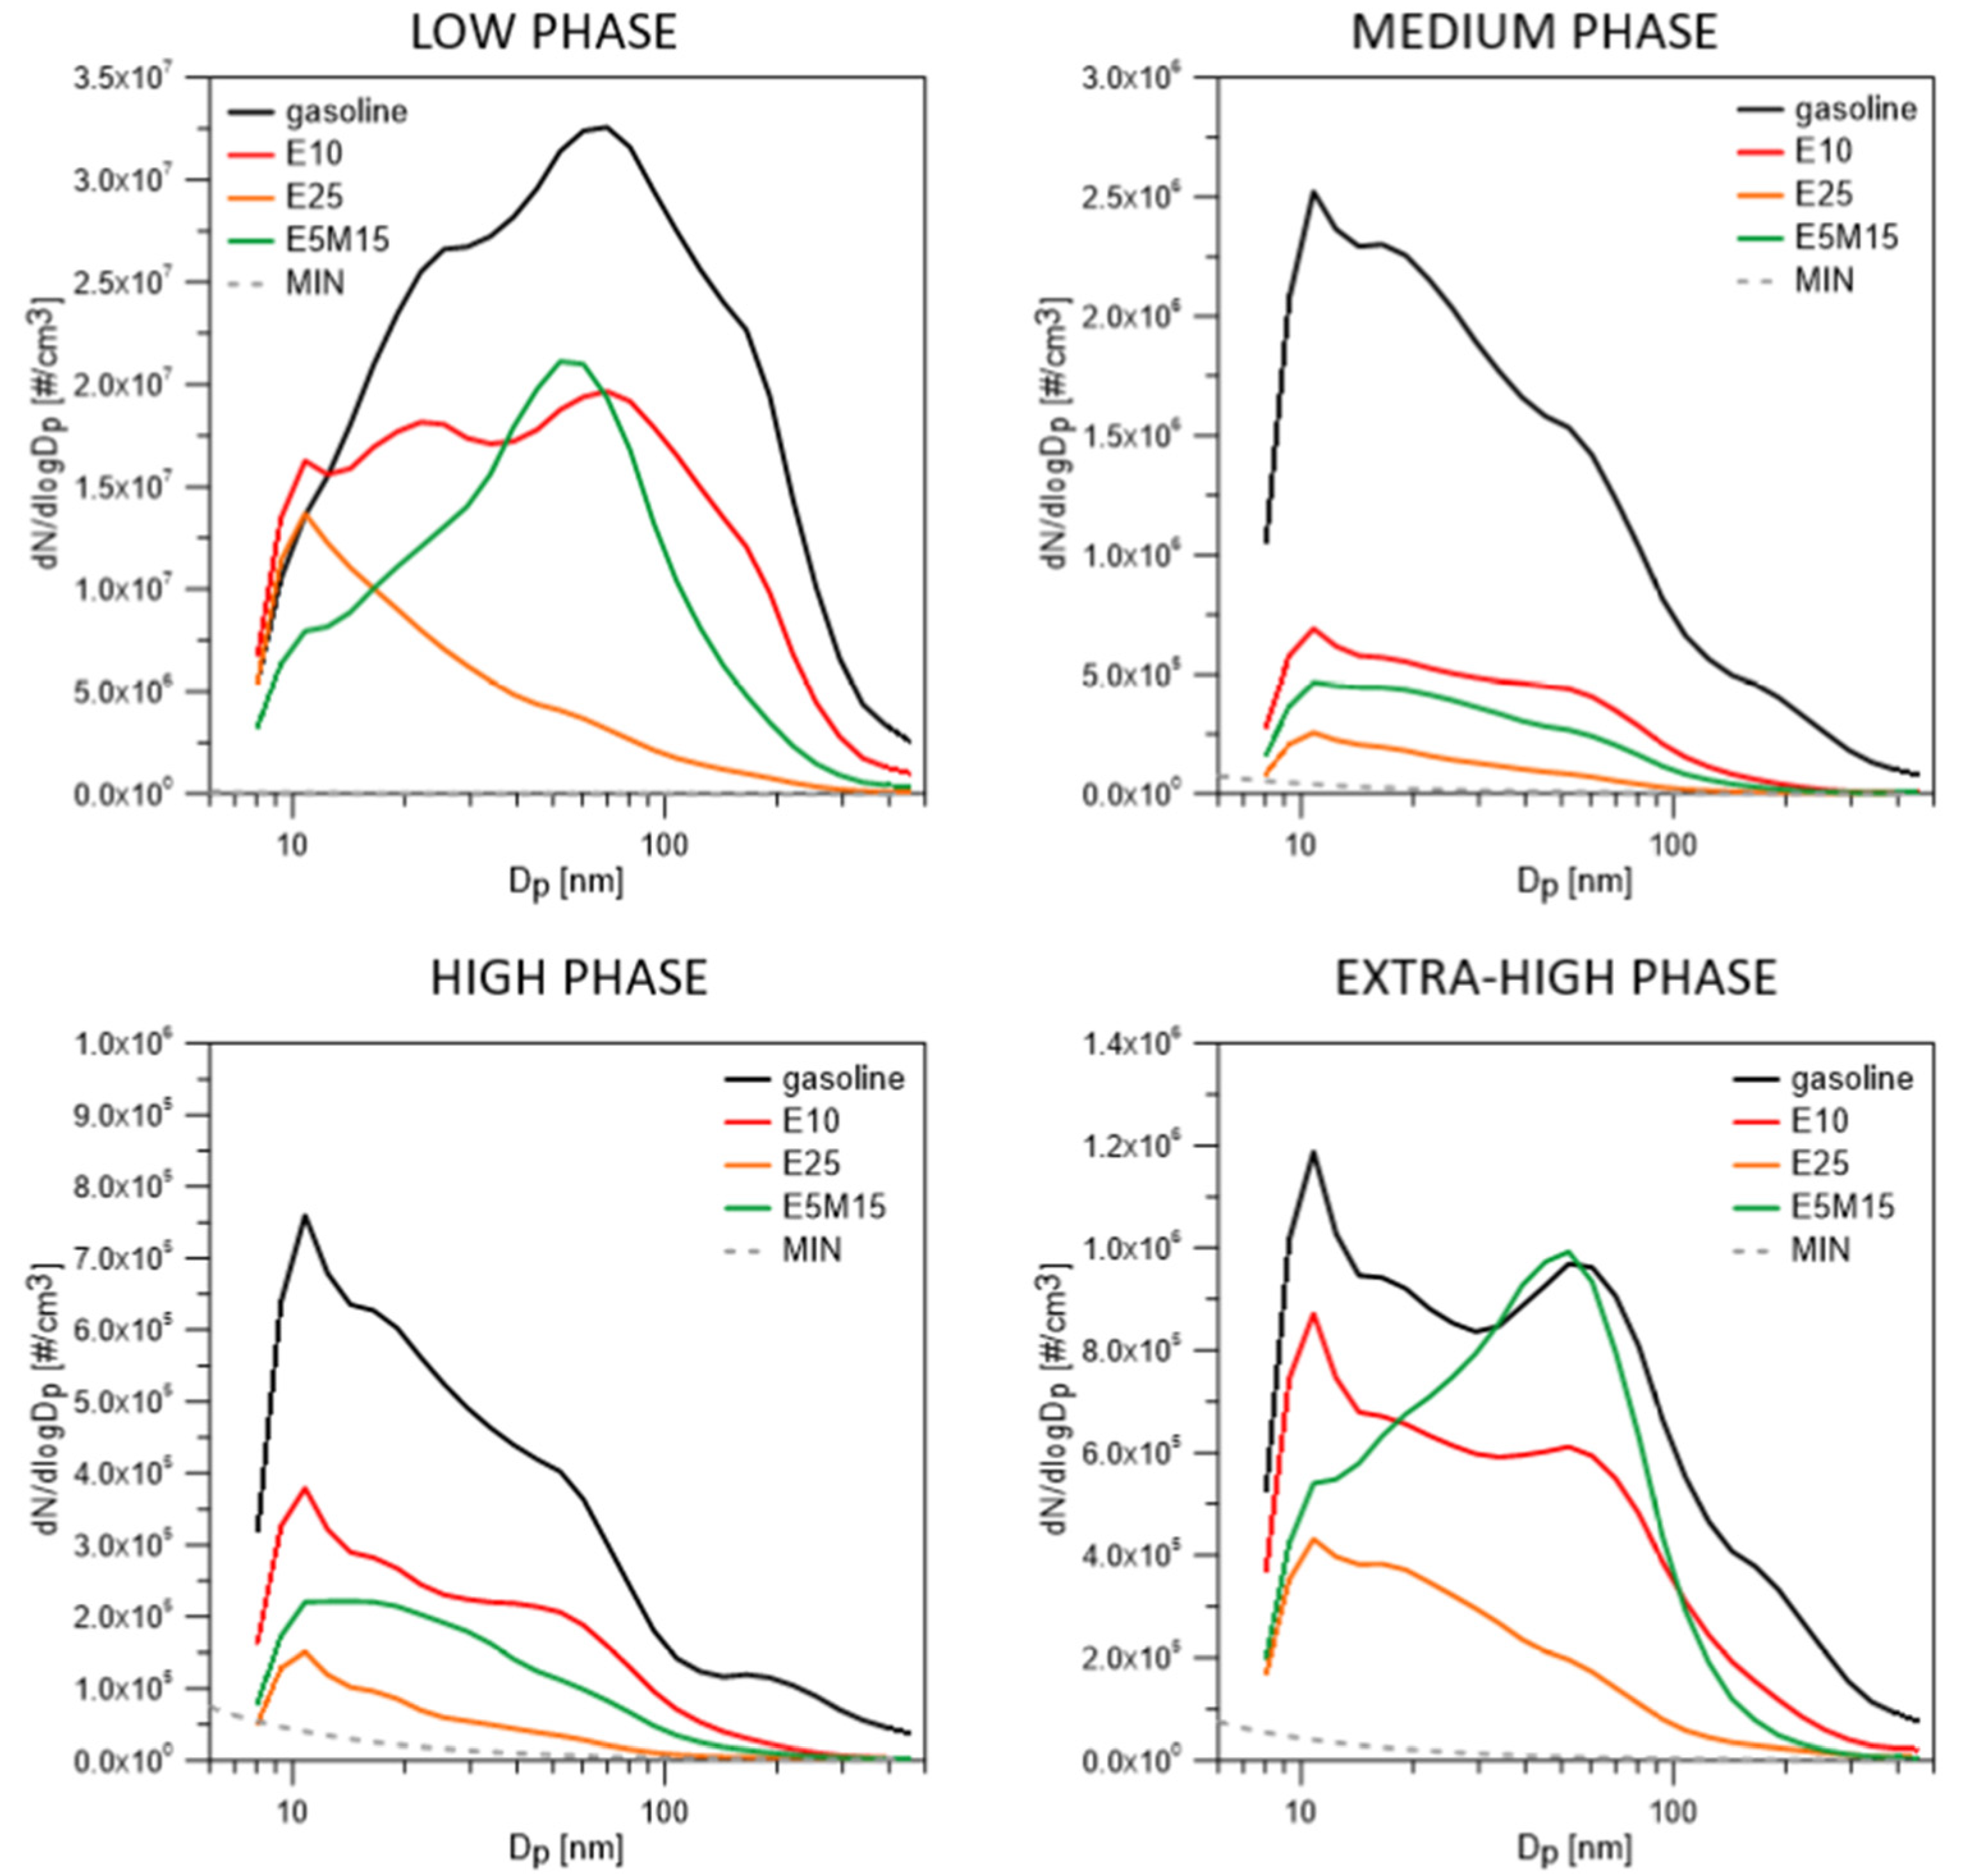
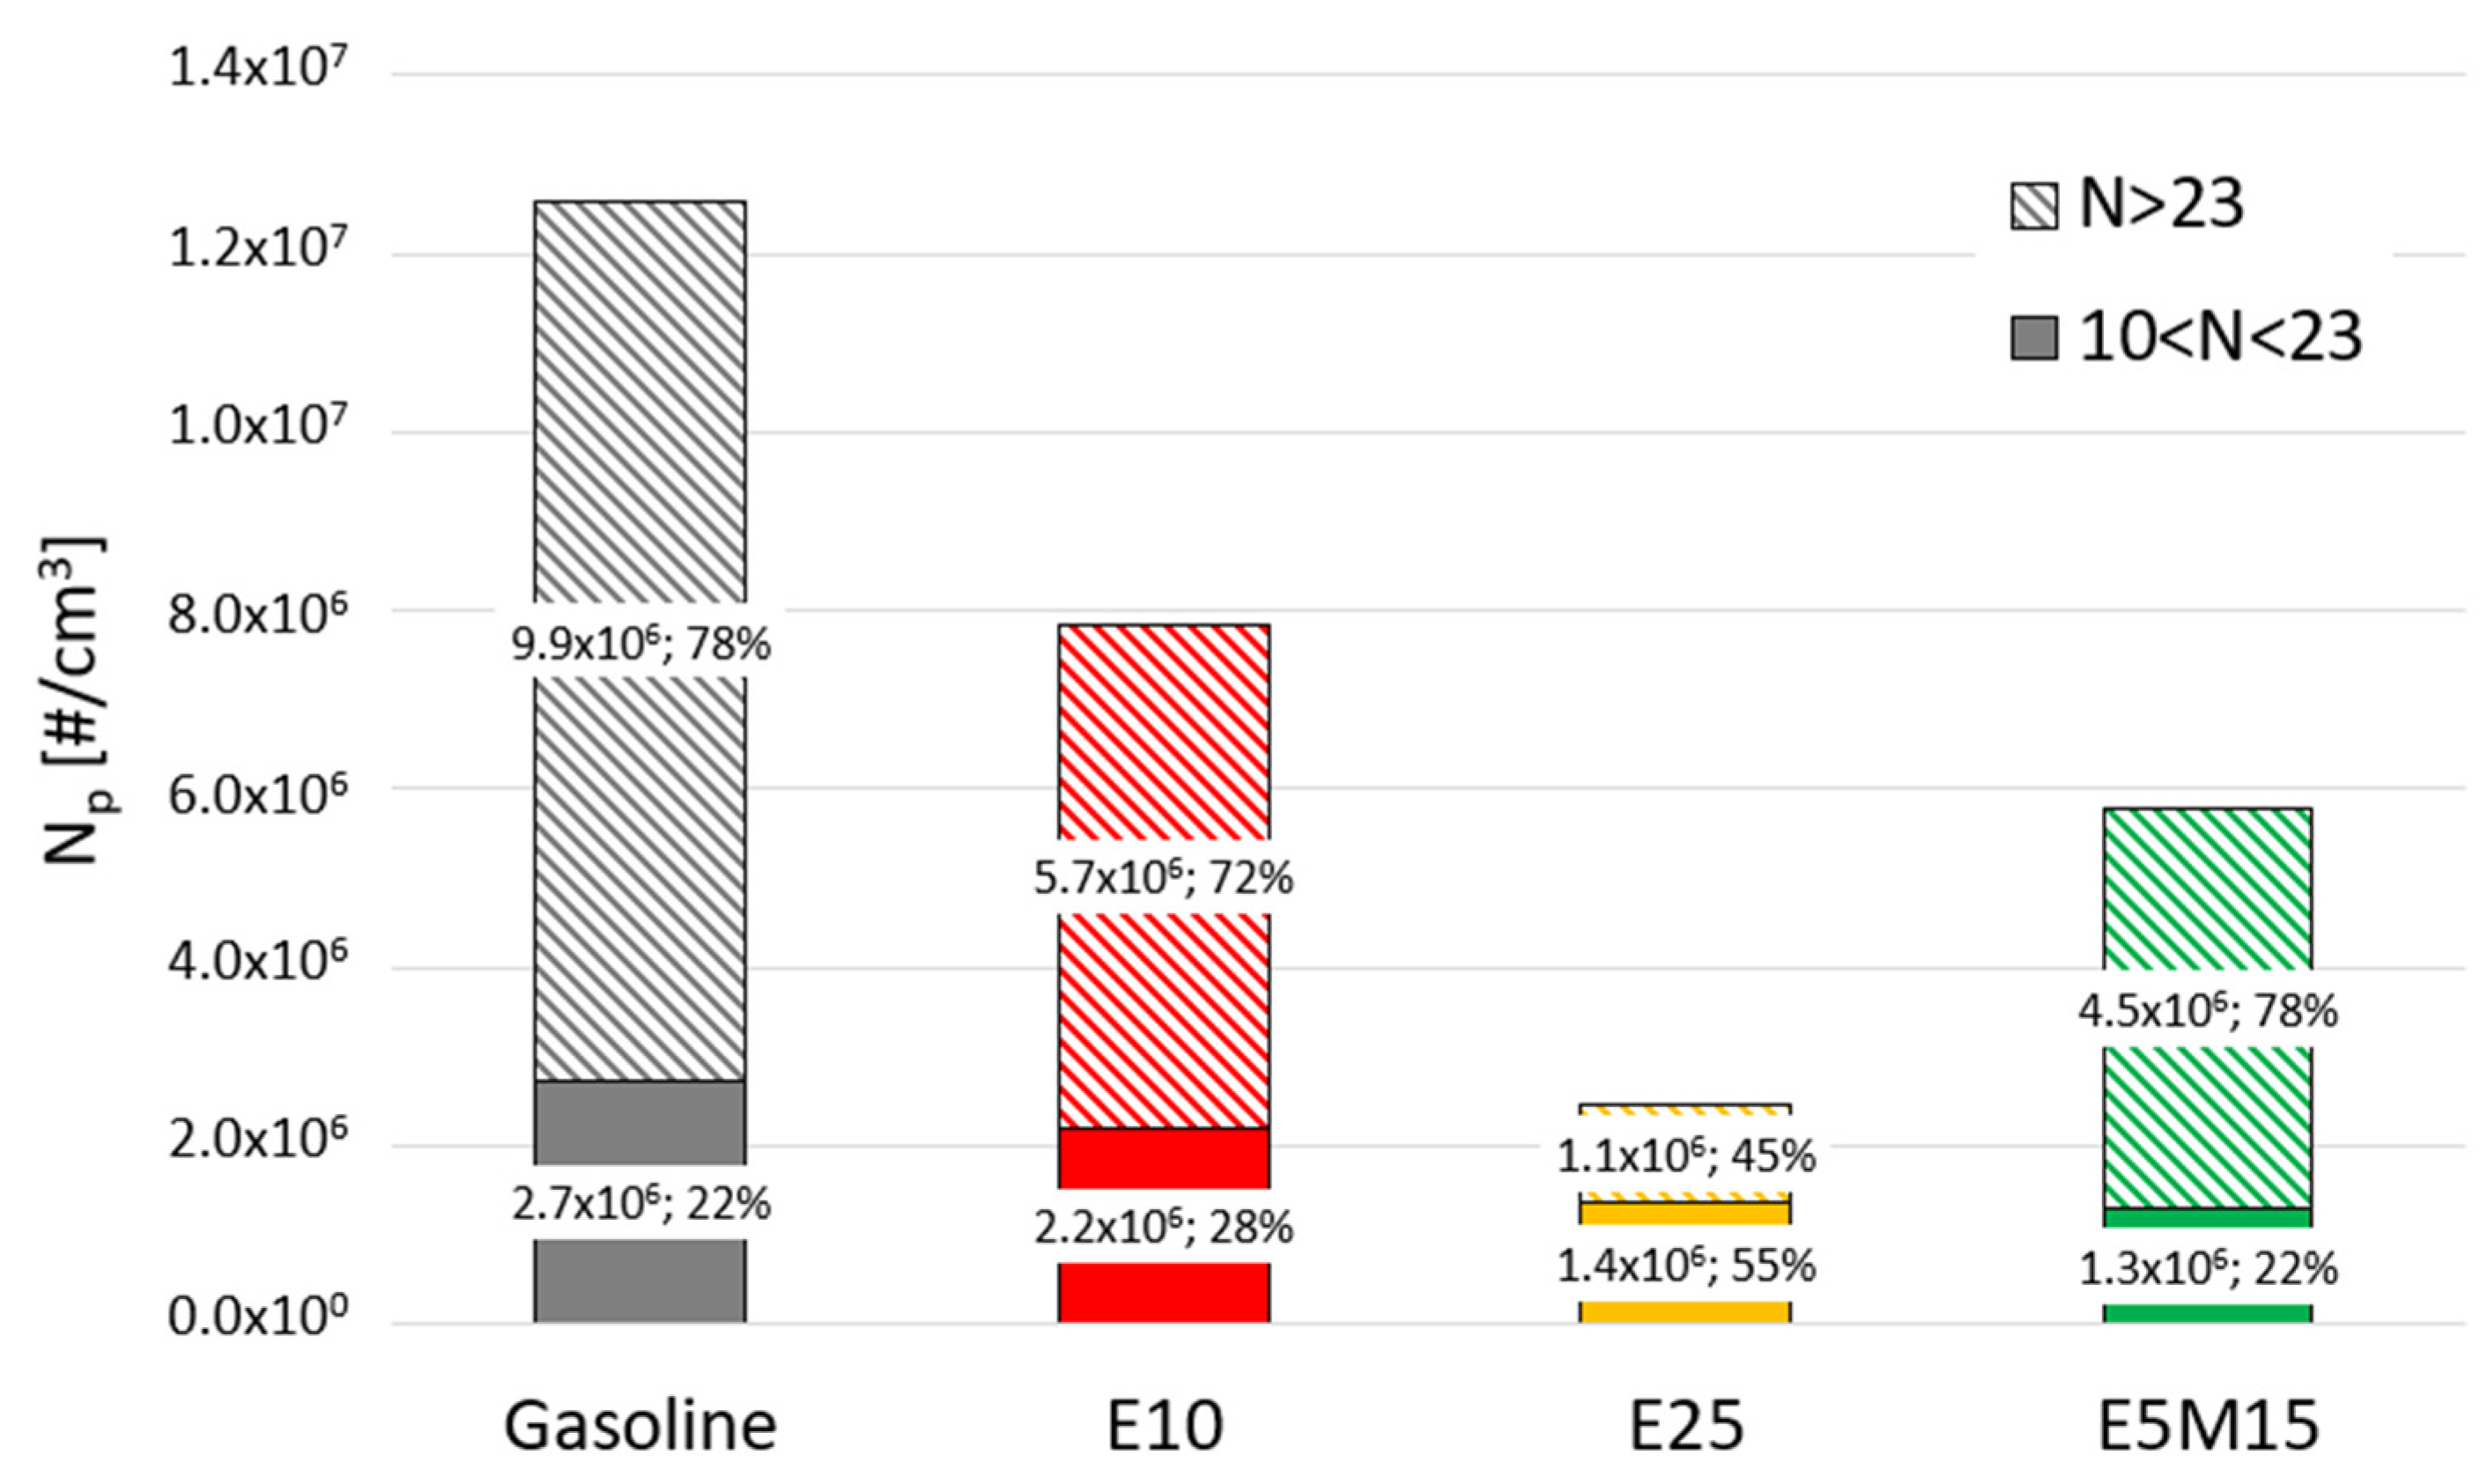
For E10 and E25, a reduction in particle emissions is observed that exhibits a consistent fraction of sub-23 nm particles. The addition of methanol leads to a particle number increase with respect to E25, with the distribution shifted towards a larger diameter.
The results of this study have highlighted that alcohol blends represent a valid solution for SI engine fueling owing to the reduced emissions at the cost of a slight increase in the fuel consumption. However, a proper adaptive control of engine parameters based on the different fuel properties can help to fully exploit the potentiality of ethanol/methanol blends.

Author Contributions

F.C.: Methodology, Investigation. S.D.I.: Methodology, Investigation, Writing—original draft, Visualization. A.M.: Methodology, Investigation, Writing—original draft, Visualization. P.S.: Methodology, Investigation. B.M.V.: Supervision, Project administration. All authors have read and agreed to the published version of the manuscript.

Funding

This research received no external funding.

Data Availability Statement

Data will be made available upon request.

Acknowledgments

The authors thank Carlo Rossi and Bruno Sgammato for the engine assessment and for support with experiments.

Conflicts of Interest

The authors declare no conflict of interest.

Abbreviations

AFRstStoichiometric air/fuel ratio
COCarbon monoxide
CO2Carbon dioxide
ECUElectronic control unit
EEPSEngine exhaust particle spectrometer
ETBEngine test bench
E10Blend of 10% v/v of ethanol with 90% v/v of gasoline
E25Blend of 25% v/v of ethanol with 75% v/v of gasoline
E5M15Blend of 5% v/v of ethanol and 15% v/v methanol with 75% v/v of gasoline
FIDFlame ionization detector
GDIGasoline direct injection
HOVHeat of vaporization
ICEInternal combustion engine
λExcess air ratio
LHVLow heating value
NDIRNon-dispersive infrared
NOxNitrogen oxides
ONOctane number
PSDParticle size distribution
RTBRoller test bench
SISpark ignition
THCTotal hydrocarbons
TWCThree-way catalyst
WLTCWorldwide harmonized light vehicles test cycle

References

  1. Kalghatgi, G. Is it really the end of internal combustion engines and petroleum in transport? Appl. Energy 2018, 225, 965–974. [Google Scholar] [CrossRef]
  2. Serrano, J.R.; Novella, R.; Piqueras, P. Why the development of internal combustion engines is still necessary to fight against global climate change from the perspective of transportation. Appl. Sci. 2019, 9, 4597. [Google Scholar] [CrossRef] [Green Version]
  3. Reitz, R.D.; Ogawa, H.; Payri, R.; Fansler, T.; Kokjohn, S.; Moriyoshi, Y.; Agarwal, A.K.; Arcoumanis, D.; Assanis, D.; Bae, C.; et al. IJER editorial: The future of the internal combustion engine. Int. J. Engine Res. 2020, 21, 3–10. [Google Scholar] [CrossRef] [Green Version]
  4. Ricardo, M.B.; Apostolos, P.; Yang, M.Y. Overview of boosting options for future downsized engines. Sci. China Technol. Sci. 2011, 54, 318–331. [Google Scholar] [CrossRef]
  5. Tripathi, G.; Dhar, A.; Sadiki, A. Recent Advancements in After-Treatment Technology for Internal Combustion Engines—An Overview. In Advances in Internal Combustion Engine Research; Energy, Environment, and Sustainability Series; Srivastava, D., Agarwal, A., Datta, A., Maurya, R., Eds.; Springer: Singapore, 2018; pp. 159–179. [Google Scholar]
  6. Krishnamoorthi, M.; Malayalamurthi, R.; He, Z.; Kandasamy, S. A review on low temperature combustion engines: Performance, combustion and emission characteristics. Renew. Sustain. Energy Rev. 2019, 116, 109404. [Google Scholar] [CrossRef]
  7. Awad, O.I.; Mamat, R.; Ali, O.M.; Sidik, N.A.C.; Yusaf, T.; Kadirgama, K.; Kettner, M. Alcohol and ether as alternative fuels in spark ignition engine: A review. Renew. Sustain. Energy Rev. 2018, 82, 2586–2605. [Google Scholar] [CrossRef]
  8. Chen, Y.; Ma, J.; Han, B.; Zhang, P.; Hua, H.; Chen, H.; Su, X. Emissions of automobiles fueled with alternative fuels based on engine technology: A review. J. Traffic Transp. Eng. 2018, 5, 318–334. [Google Scholar] [CrossRef]
  9. Kumar, T.S.; Ashok, B. Critical review on combustion phenomena of low carbon alcohols in SI engine with its challenges and future directions. Renew. Sustain. Energy Rev. 2021, 152, 111702. [Google Scholar] [CrossRef]
  10. Elfasakhany, A. State of art of using biofuels in spark ignition engines. Energies 2021, 14, 779. [Google Scholar] [CrossRef]
  11. Verhelst, S.; Turner, J.W.; Sileghem, L.; Vancoillie, J. Methanol as a fuel for internal combustion engines. Prog. Energy Combust. Sci. 2019, 70, 43–88. [Google Scholar] [CrossRef] [Green Version]
  12. Puricelli, S.; Casadei, S.; Bellin, T.; Cernuschi, S.; Faedo, D.; Lonati, G.; Rossi, T.; Grosso, M. The effects of innovative blends of petrol with renewable fuels on the exhaust emissions of a GDI Euro 6d-TEMP car. Fuel 2021, 294, 120483. [Google Scholar] [CrossRef]
  13. Elfasakhany, A. Investigations on the effects of ethanol–methanol–gasoline blends in a spark-ignition engine: Performance and emissions analysis. Eng. Sci. Technol. Int. J. 2015, 18, 713–719. [Google Scholar] [CrossRef] [Green Version]
  14. Sudhakar, K.; Yusaf, T. Sustainable Biofuels from First Three Alcohol Families: A Critical Review. Energies 2023, 16, 648. [Google Scholar] [CrossRef]
  15. Larsson, T.; Mahendar, S.K.; Christiansen-Erlandsson, A.; Olofsson, U. The effect of pure oxygenated biofuels on efficiency and emissions in a gasoline optimised disi engine. Energies 2021, 14, 3908. [Google Scholar] [CrossRef]
  16. Larsson, T.; Olofsson, U.; Erlandsson, A.C. Undiluted measurement of the particle size distribution of different oxygenated biofuels in a gasoline-optimised disi engine. Atmosphere 2021, 12, 1493. [Google Scholar] [CrossRef]
  17. Zhen, X.; Wang, Y. An overview of methanol as an internal combustion engine fuel. Renew. Sustain. Energy Rev. 2015, 52, 477–493. [Google Scholar] [CrossRef]
  18. Turner, J.W.G.; Lewis, A.G.J.; Akehurst, S.; Brace, C.J.; Verhelst, S.; Vancoillie, J.; Sileghem, L.; Leach, F.; Edwards, P.P. Alcohol fuels for spark-ignition engines: Performance, efficiency and emission effects at mid to high blend rates for binary mixtures and pure components. Energies 2020, 13, 6390. [Google Scholar] [CrossRef]
  19. Zhang, Z.; Wen, M.; Cui, Y.; Ming, Z.; Wang, T.; Zhang, C.; Dank, J. Effects of methanol application on carbon emissions and pol- lutant emissions using a passenger vehicle. Processes 2022, 10, 525. [Google Scholar] [CrossRef]
  20. CEN. EN 228:2012+A1:2017 Automotive Fuels—Unleaded Petrol—Requirements and Test Methods 2017. Available online: https://standards.iteh.ai/catalog/standards/cen/81cde377-aac3-4a49-9bde-bb71e02c4585/en-228-2012a1-2017 (accessed on 15 March 2023).
  21. Report from the Commission to the European Parliament and the Council in accordance with Article 9 of Directive 98/70/EC Relating to the Quality of Petrol and Diesel Fuels. 2017. Available online: https://data.consilium.europa.eu/doc/document/ST-10104-2017-INIT/en/pdf (accessed on 15 March 2023).
  22. Heywood, J.B. Internal Combustion Engine Fundamentals; McGraw-Hill: New York, NY, USA, 1988; Volume 26. [Google Scholar]
  23. Zhao, H.; Ge, Y.; Hao, C.; Han, X.; Fu, M.; Yu, L.; Shah, A.N. Carbonyl compound emissions from passenger cars fueled with methanol/gasoline blends. Sci. Total Environ. 2010, 408, 3607–3613. [Google Scholar] [CrossRef]
  24. Karavalakis, G.; Short, D.; Vu, D.; Russell, R.; Asa-Awuku, A.; Durbin, T. A Complete Assessment of the Emissions Performance of Ethanol Blends and Iso-Butanol Blends from a Fleet of Nine PFI and GDI Vehicles. SAE Int. J. Fuels Lubr. 2015, 8, 374–395. [Google Scholar] [CrossRef] [Green Version]
  25. Catapano, F.; Di Iorio, S.; Magno, A.; Vaglieco, B.M. Sub-23 nm Particle Measurement and Assessment of Their Volatile Fraction at Exhaust of a Four Cylinder GDI Engine Fueled with E10 and E85 Under Transient Conditions. SAE Technical Paper 2021-24-0087. In Proceedings of the 15th International Conference on Engines & Vehicles, Napoli, Italy, 12–16 September 2021; 2021; Volume 1. [Google Scholar] [CrossRef]
  26. Luo, Y.; Zhu, L.; Fang, J.; Zhuang, Z.; Guan, C.; Xia, C.; Xie, X.; Huang, Z. Size distribution, chemical composition and oxidation reactivity of particulate matter from gasoline direct injection (GDI) engine fueled with ethanol-gasoline fuel. Appl. Therm. Eng. 2015, 89, 647–655. [Google Scholar] [CrossRef]
  27. Leach, F.C.P.; Stone, R.; Richardson, D.; Turner, J.W.G.; Lewis, A.; Akehurst, S.; Remmert, S.; Campbell, S.; Cracknell, R. The effect of oxygenate fuels on PN emissions from a highly boosted GDI engine. Fuel 2018, 225, 277–286. [Google Scholar] [CrossRef]
  28. Giechaskiel, B.; Melas, A.; Martini, G.; Dilara, P.; Ntziachristos, L. Revisiting Total Particle Number Measurements for Vehicle Exhaust Regulations. Atmosphere 2022, 13, 155. [Google Scholar] [CrossRef]
  29. Di Iorio, S.; Catapano, F.; Magno, A.; Sementa, P.; Vaglieco, B.M. Investigation on sub-23 nm particles and their volatile organic fraction (VOF) in PFI/DI spark ignition engine fueled with gasoline, ethanol and a 30% v/v ethanol blend. J. Aerosol Sci. 2021, 153, 105723. [Google Scholar] [CrossRef]
  30. Catapano, F.; Di Iorio, S.; Magno, A.; Sementa, P.; Vaglieco, B.M. Measurement of Sub-23 nm Particles Emitted from PFI / DI SI Engine Fueled with Oxygenated Fuels: A Comparison between Conventional and Novel Methodologies. Energies 2022, 15, 2021. [Google Scholar] [CrossRef]
  31. Catapano, F.; Di Iorio, S.; Magno, A.; Vaglieco, B.M. Effect of fuel quality on combustion evolution and particle emissions from PFI and GDI engines fueled with gasoline, ethanol and blend, with focus on 10–23 nm particles. Energy 2022, 239, 122198. [Google Scholar] [CrossRef]
  32. Gao, Y.; Kim, D.; Zhang, Y.L.; Kook, S.; Xu, M. Influence of ethanol blending ratios on in-flame soot particle structures in an optical spark-ignition direct-injection engine. Fuel 2019, 248, 16–26. [Google Scholar] [CrossRef]
  33. Samaras, Z.; Rieker, M.; Papaioannou, E.; van Dorp, W.F.; Kousoulidou, M.; Ntziachristos, L.; Andersson, J.; Bergmann, A.; Hausberger, S.; Keskinen, J.; et al. Perspectives for regulating 10 nm particle number emissions based on novel measurement methodologies. J. Aerosol Sci. 2022, 162, 105957. [Google Scholar] [CrossRef]
Figure 1. Schematic of the experimental apparatus.
Energies 16 02791 g001
Figure 2. Schematic of the reproduction of the WLTC at the ETB.
Energies 16 02791 g002
Figure 3. Instantaneous fuel consumption, torque and engine speed over the WLTC for gasoline and E10.
Energies 16 02791 g003
Figure 4. Fuel consumption variation for E10, E25 and E5M15 with respect to gasoline at each phase of the cycle.
Energies 16 02791 g004
Figure 5. CO2 emissions measured at each phase of the cycle for gasoline, E10, E25 and E5M15.
Energies 16 02791 g005
Figure 6. CO emissions measured at each phase of the cycle for gasoline, E10, E25 and E5M15.
Energies 16 02791 g006
Figure 7. THC emissions measured at each phase of the cycle for gasoline, E10, E25 and E5M15.
Energies 16 02791 g007
Figure 8. NOx emissions measured at each phase of the cycle for gasoline, E10, E25 and E5M15.
Energies 16 02791 g008
Figure 9. Mean PSDFs at low, medium, high and extra-high phases of the WLTC for gasoline, E10, E25 and E5M15.
Energies 16 02791 g009
Figure 10. Total particle number emitted from gasoline, E10, E25 and E5M15.
Energies 16 02791 g010
Figure 11. Goodness index based on fuel consumption and emissions for gasoline, E10, E25 and E5M15.
Energies 16 02791 g011
Table 1. Engine specifications.
EngineSpark Ignition
Number of Cylinders4
Bore [mm]83
Stroke [mm]80.5
Displacement [cm³]1742
Compression Ratio9.5:1
Max. Power [kW]177 @ 6000 rpm
Max. Torque [Nm]350 @ 2200
Fuel InjectorWall guided
IntakeTurbo charged
Table 2. Horiba MEXA 7100 DEGR specifications.
PollutantMeasurement TechniqueRangeRepeatability
CONon-Dispersive Infraredmin. 0–5000 ppm;
max 0–12% vol
<0.5% FS
CO2Non-Dispersive Infrared0–20% vol<0.5% FS
THCFlame Ionization Detectormin. 0–500 ppmC;
max 0–50,000 ppmC
<0.5% FS
NO/NOxChemiluminescencemin 0–500 ppm
max 0–10,000 ppm
<0.5% FS
Table 3. EEPS specifications.
Particle Size SpectrometerEEPS
Particle Size Range5.6 to 560 nm
Particle Size Resolution16 channels per decade (32 total)
Electrometer Channels22
Charger Mode of OperationUnipolar diffusion charger
Inlet Cyclone 50% Cutpoint1 µm
Time Resolution10 size distributions/sec
Inlet Aerosol Temperature10 to 52 °C
Table 4. Fuel properties.
PropertiesGasolineEthanolMethanol
Chemical formulaC4–C12C2H5OHCH3OH
C [% mass]85.952.238.0
H [% mass]13.413.112.1
O [% mass]0.634.750.0
Density at 15 °C [kg/l]0.7460.7900.796
Boiling point [°C]27–2257864
LHV [MJ/l]42.9426.720.1
AFRst14.596.4
ON95.0108.6108.6
Disclaimer/Publisher’s Note: The statements, opinions and data contained in all publications are solely those of the individual author(s) and contributor(s) and not of MDPI and/or the editor(s). MDPI and/or the editor(s) disclaim responsibility for any injury to people or property resulting from any ideas, methods, instructions or products referred to in the content.

