Article

Economic Controls Co-Design of Hybrid Microgrids with Tidal/PV Generation and Lithium-Ion/Flow Battery Storage

by
Jonathan Cohen
1,
Michael B. Kane
2,*,
Alexia Marriott
3,
Franklin Ollivierre III
3 and
Krissy Govertsen
3
1
Department of Electrical and Computer Engineering, Northeastern University, Boston, MA 02115, USA
2
Department of Civil and Environmental Engineering, Northeastern University, Boston, MA 02115, USA
3
Department of Human Genetics, Emory University, Atlanta, GA 30322, USA
*
Author to whom correspondence should be addressed.
Energies 2023, 16(6), 2761; https://doi.org/10.3390/en16062761
Submission received: 30 January 2023 / Revised: 21 February 2023 / Accepted: 25 February 2023 / Published: 16 March 2023

Abstract

:
Due to the uncontrollable generators, islanded microgrids powered only by renewable energy require costly energy storage systems. Energy storage needs are amplified when load and generation are misaligned on hourly, monthly, or seasonal timescales. Diversification of both loads and generation can smooth out such mismatches. However, the ideal type of battery to smooth out remaining generation deficits will depend on the duration(s) that energy is stored. This study presents a controls co-design approach to design an islanded microgrid, showing the benefit of hybridizing tidal and solar generation and hybridizing lithium-ion and flow battery energy storage. The optimization of the microgrid’s levelized cost of energy is initially studied in grid-search slices to understand convexity and smoothness. Then, a particle swarm optimization is proposed and used to study the sensitivity of the hybrid system configuration to variations in component costs. The study highlights the benefits of controls co-design, the need to model premature battery failure, and the importance of using battery cost models that are applicable across orders of magnitude variations in energy storage durations. The results indicate that such a hybrid microgrid would currently produce energy at five times the cost of diesel generation, but flow battery innovations could bring this closer to only twice the cost while using 100% renewable energy.

1. Introduction

Due to their variability and unpredictable nature, many difficulties arise when integrating renewable energy sources (RES) into the grid. Periods of peak production and consumption rarely align, making energy storage systems (ESS) necessary to balance differences between supply and demand [1,2] and to ensure the energy supply remains stable and reliable [3,4].
An ideal ESS has a long lifespan to minimize the cost of replacement, a high-power density to handle rapid power fluctuations, and a high energy density to smooth out variations in generation and load. However, a single energy storage technology is unlikely to meet all these requirements economically. This presents an opportunity for hybrid ESSs that utilize the best characteristics of different ESS chemistries [5].
Different batteries have different benefits. Vanadium redox flow batteries (VRFBs) have relatively low costs per energy stored, can easily be scaled up, do not undergo increased degradation due to deep discharge, and have a broader state of charge range than lithium-ion batteries (LIBs) [6,7]. As a large scale energy storage system, VRFBs can contribute to the transition towards a new sustainable energy paradigm [8]. Estimations also show that VRFBs may be cheaper to produce than LIBs for long-term energy storage applications. However, this advantage is currently offset by their low production volume [9]. LIBs, which have a high power density, are also a promising energy storage option that is currently being produced at scale for grid and electric vehicle applications [10,11]. However, high cycling rates, overcharge, and deep discharge each increase aging in LIBs [12,13]. Flow batteries are primarily used for long-term energy storage, while LIBs are used to deliver energy and quickly respond to demand. Hybridization can decrease operational stress and increase battery lifetime, thus reducing the levelized cost of energy (LCOE) delivered [14,15].
Increasing the diversity of generation sources could increase the likelihood energy is produced when needed, reducing the need for battery capacity and cycling [16]. Solar photovoltaic (PV) arrays are highly modular and easily scalable [4]. However, electricity production using solar PV arrays fluctuates with changing weather conditions that are difficult to predict [17]. By contrast, tidal power, which uses energy from the ebb and flow of the tides to generate electricity, is as predictable as the moon’s cycles and orders of magnitude less affected by local weather. However, the scaling of tidal systems can be significantly constrained by local hydrology.
Microgrids are electrical grids capable of producing and distributing power throughout a localized area. When islanded, they can do so without external control or energy [18]. Microgrids improve service quality and enable RES grid integration by lowering transmission losses and the time needed to fix outages [19]. These characteristics are especially valuable to island communities traditionally relying on diesel power generation. Due to the high costs of importing fossil fuels, islands can handle the considerable expenses associated with renewables, energy storage, and first-generation microgrids [20].
While much of the existing literature on hybrid generation and hybrid storage in microgrids covers the joint optimization of wind and solar, a relatively small number covers tidal energy or the use of VRFBs in hybrid ESSs. In one study, a coupling calculation model is constructed and a configuration optimized design method is proposed in [21] to explore VRFB batteries in a microgrid containing RESs. In another study, a proportional-integral derivative (PID) controller is used to capture the maximum energy from hybrid renewable energy sources including wind, photovoltaic, and tidal [22]. However, only a few studies account for use-based reductions in battery lifetime, resulting in overestimating battery revenues [23]. In [3], performance models for a PV-wind system with LIB storage are developed based on data representative of a location in Denmark. In [24], a multi-objective salp swarm algorithm is used to optimize a hybrid stand-alone microgrid system with photovoltaics, wind turbines, batteries, and diesel generators to meet the load energy demand of a remote area in an off-grid community in Djelfa, Algeria. In [25], particle swarm optimization (PSO) is used to minimize the energy cost of a wind/tidal/PV hybrid energy system. In [26], a novel expert fuzzy system-grey wolf optimization method is used to minimize operating costs and CO2 emissions and maximize the efficiency of a microgrid consisting of a PV system, wind turbine, tidal turbine, and diesel generator using only LIB in the ESS. In [16], an integrated energy system with combined heat and power generation, PV, and battery energy storage is optimized while considering battery lifetime loss by using a simple total power throughput degradation model. In [5], a hybrid wind/PV and battery/supercapacitor microgrid system is optimized to minimize costs and greenhouse gas emissions and improve reliability without accounting for abnormal battery degradation. In [27], the proprietary HOMER software is used to optimize a PV/wind hybrid power generation system. In [28], an operational planning strategy is defined for an islanded microgrid containing tidal, PV, and fuel cell generators with only thermal storage (i.e., storing heat from the fuel cells). In [29], a short-term scheduling algorithm is presented for a tidal-powered microgrid with LIB storage with a lifetime modeled as a nonlinear function of depth of discharge.
This manuscript builds on this body of literature, tying together four main contributions: (1) This is the first paper of its kind to study the economic benefits of combining solar PV with tidal generation and LIB with VRFBs. (2) A filter-based control algorithm is proposed to determine the appropriate (dis)charge out/into each battery type. A controls co-design (CCD) approach is used to simultaneously optimize the control algorithms’ parameters and the physical RES and ESS sizes [30]. (3) Battery life is modeled using a maximum lifetime in years and cycle life. Furthermore, different cycle life models are used for LIB and flow batteries. (4) Lastly, the companion code released with this manuscript provides a flexible simulation environment for future research on hybrid microgrids.
The rest of this manuscript is organized into sections on Materials and Methods (Section 2), Results (Section 3), Discussion (Section 4), and Conclusion (Section 5). The Materials and Methods section presents the model architectures and parameters considered for the RES and ESS subsystems, the overall microgrid model, optimization methods used, and the proposed parametric studies of cost and performance. The Results section presents the LCOE of each simulation and the contribution of each subsystem to the LCOE, time series plots of the energy flows for key simulations, and the results of the parametric studies. The Discussion section draws insights from the parametric study results to discuss the opportunities for such hybrid microgrids under various cost scenarios. Finally, the Conclusion summarizes the manuscript and presents challenges that should be addressed in the future to help realize such islanded hybrid microgrids.

2. Materials and Methods

This manuscript considers a study of the microgrid system shown in Figure 1 providing electricity to a large island community using hybrid RES from tidal and solar power and a hybrid ESS with LIB and VRFB modules. A microgrid battery controller is designed to allocate excess generation to charge the batteries and meet any deficit by discharging the batteries in a way that best leverages each battery type’s unique physics and economics. This work is entirely simulation-based, developed with object-oriented programming in MATLAB [31]. Each simulation is 1-year long and considers each discrete hour in the year. The model contains demand, RES, ESS, and control subsystem models, each with energy balance, economic, and component degradation models.

2.1. Renewable Generator Models

The total power generated by the RES system ( P R E S ) is calculated by the sum of both the solar PV ( P S o l a r ) and tidal ( P T i d a l ) systems as outlined below in Equation (1).
P R E S ( t ) = P S o l a r ( t ) + P T i d a l ( t )

2.1.1. Solar PV

The nominal hourly energy generation of a 1 kW DC rated solar PV system ( P S o l a r ° ( t ) ) was modeled using the National Renewable Energy Laboratory’s PVWatts Calculator [32] for the ZIP code 02807 (i.e., New Shoreham, RI, USA on Block Island) with the default 14.08% system losses, 96% inverter efficiency, standard modules (i.e., ~15% nominal efficiency) in a fixed open rack at 20° tilt and 180° azimuth, resulting in a 15.9% capacity factor. The solar PV system design parameter is the rated power ( [ P ] S o l a r ) which scales the 1 kW system to the full PV system output power ( P s o l a r ( t ) ) . The installed cost ( [ C ] S o l a r ) per rated power is assumed to be USD 1060/kW in the baseline scenario with a system lifetime of 30 years ( T m a x , S o l a r ) [33]. The total system cost of solar PV generation ( C S o l a r ) is the product of the installed cost and the rated power.
P S o l a r ( t ) = [ P ] S o l a r P S o l a r ° ( t )
C S o l a r = [ C ] S o l a r [ P ] S o l a r

2.1.2. Tidal

The tidal energy system’s hourly energy generation is assumed to be proportional to the tidal flows with the rated power output produced at peak flow. The total power generated from the tidal RES ( P T i d a l ( t ) ) is a product of the rated power of tidal ( [ P ] T i d a l ) and the power generated from a 1 kW rated tidal system ( P ° T i d a l ( t ) ) which is calculated as the product of daily variations ( P D a i l y ( t ) ) , monthly variations ( P M o n t h l y ( t ) ) , and the generator’s rated power.
P T i d a l ( t ) = [ P ] T i d a l P ° T i d a l ( t )
P ° T i d a l ( t ) = P D a i l y ( t ) P M o n t h l y ( t )
A lunar day is the amount of time required for a specific location on Earth to rotate from a point beneath the moon back to this original spot. The moon revolves around the Earth in the same direction as the Earth’s rotation on its axis, so due to Earth’s additional time to reach the same location beneath the moon, lunar days are 50 min longer than solar days. In addition, every lunar day, two high tides and two low tides occur [34]. This approximately daily tidal flow is modeled using a 6.2 h wavelength sine wave with a minimum of zero and a maximum of 1.0, shown below in Equation (6), where t is the hour of the year.
P D a i l y ( t ) = sin ( t 6.2 2 π ) + 1 2
When the Earth, sun, and moon line up, the lunar and solar tides reinforce each other during full and new moons. As a result, unusually small tides, known as neap tides, occur when the solar and lunar tides act against each other, while unusually large tides, known as spring tides, occur when solar and lunar tides reinforce each other. These high and low tides occur approximately every two weeks [35]. This approximately monthly tidal flow ( P M o n t h l y ) is modeled using a 360 h wavelength sine wave show in Equation (7).
P M o n t h l y ( t ) = sin ( t 360 2 π ) + 1 2
The total system cost of tidal generation ( C T i d a l ) is calculated as the product of the installed cost per rated power ( [ C ] T i d a l ) and the tidal generators rated power ( [ P ] T i d a l ) . The design parameter for the tidal RES is the generator’s rated power. The installed cost per rated power is assumed to be USD 4300/kW in the baseline scenario with a system lifetime of 20 years ( T m a x , T i d a l ) [36].
C T i d a l = [ C ] T i d a l [ P ] T i d a l
The total capital cost of RES generation ( C R E S ) is the sum of the cost of solar ( C S o l a r ) and tidal ( C T i d a l ) systems.
C R E S = C S o l a r + C T i d a l

2.2. Battery Models

Two types of batteries are considered: conventional LIBs and VRFBs. The total cost of the ESS ( C E S S ) is the summation of the total cost the LIB ( C L I B ) and VRFB ( C V R F B ) systems. Generally, the battery model is founded on an energy balance rule (i.e., stocks and flows) at each hour of the year. In an hour where the island’s electric demand is greater than the supply from the RES, the deficit must come from the combined ESS, and when supply is greater than demand, the excess is stored in the combined ESS. Each battery has a maximum lifetime in years and a maximum number of charge/discharge cycles, where a ‘cycle’ is defined differently for the different battery types. Based on the supply–demand deficit/surplus at each hour, the battery controller (described in Section 2.3.1) allocates energy to discharge or charge each battery.
The cost of each battery is specified as the sum of the cost per energy storage capacity in USD/kWh (e.g., energy capacity capital cost and construction and commissioning) and the cost per rated power in USD/kW (e.g., power conversion system and balance of plant) [37]. Both types of batteries are assumed to have a round-trip efficiency of nearly 100%.
C E S S = C L I B + C V R F B

2.2.1. Lithium-Ion Battery (LIB)

Due to their relatively high energy capacity costs and relatively low rated power costs, LIBs are best suited for short, high-power applications. In this model, the total module cost of the LIB ( C L I B ) is calculated by Equation (11) as a function of the LIB’s rated energy storage capacity [ E ] L I B and (dis)charge power rating [ P ] L I B . The LIB ESS baseline energy capacity cost ( [ C ] E n e r g y L I B ) is USD 285/kWh (i.e., USD 189/kWh for the capital cost of the energy capacity of the battery itself plus USD 96/kWh construction and commissioning cost), and the rated power cost ( [ C ] P o w e r L I B ) is USD 306/kW (i.e., USD 211/kW for the power conversion system plus USD 95/kW for the balance of plant). These costs are based on their 2025 estimate for utility-scale operations with an energy-over-power ratio of 4.0 [33]. Due to the LIB packs’ modularity, the total energy capacity costs are assumed to scale linearly (i.e., at a fixed USD/kWh). At the scales considered (e.g., MWhs of storage), the module-level rated-power costs are assumed to be independent and negligible with respect to module-level energy capacity costs [38].
C L I B = [ C ] E n e r g y L I B [ E ] L I B + [ C ] P o w e r L I B [ P ] L I B
The LIBs have a maximum lifetime of 10 years, a cycle life ( [ K ] L I B ) of 3500 cycles [37], and are replaced when the first of these limits is reached ( T m a x , L I B ) . A simple discharge-based model is used to estimate cycle life depletion. For example, a single cycle of a LIB with a 1 kWh capacity is used if fully charged then fully drained, or twice repeatedly (partially) charged and then 0.5 kWh of energy discharged, or four times repeated (partially) charged and 0.25 kWh of energy discharged. The number of discharge cycles per year ( K L I B ) is defined as total annual energy storage capacity based on the assumption in [37].
T m a x , L I B = min ( { 10   y e a r s , [ K ] L I B K L I B } )
K L I B = t 8760 max ( { 0 , P L I B ( t ) } ) Δ t [ E ] L I B

2.2.2. Vanadium Redox Flow Battery (VRFB)

Due to their relatively low energy-capacity costs and relatively high-rated power costs, VRFBs are well-suited for long-term storage. VRFBs have two significant cost drivers at the module level: the aqueous electrolytes and the membrane and electrodes. When combined, these costs scale inverse-exponentially with respect to the energy over power (E/P) ratio according to Equation (13). This equation was fit to the data for VRFB capital cost in [39] and reproduced in Figure 2. At very large E/P (i.e., large durations of storage/discharge), the cost is governed by the electrolyte costs, while at small E/P (i.e., large power output), the cost is controlled by the membrane and electrode costs.
The VRFB module capital costs are only part of the total VRFB ESS costs. Additional costs, including construction and commissioning, USD 650/kWh; power conversion system, USD 211/kW; and balance of plant, USD 95/kW, are considered [37]. The cost estimates in [37] assume E/P = 4.0; at this size, they estimate an energy-capacity capital cost of USD 393/kWh, while the more general model from [39] provides an estimate of USD 278/kWh. The sensitivity of this cost parameter will be studied later in this manuscript. Therefore, the total cost of the VRFB system ( C V R F B ) is shown in Equation (13) below, as a function of the rated (dis)charge power of the VRFB system ( [ P ] V R F B ) and the rated energy storage capacity of the VRFB system ( [ E ] V R F B ) .
C V R F B = ( 7.004 10 4 ) e ( [ P ] VRFB 0.004021 [ E ] V R F B ) ( 6.9837 10 4 )
The VRFBs have a maximum lifetime of 15 years, a cycle life ( [ K ] V R F B ) of 10,000 cycles [37], and are replaced when the first of these limits is reached. A cycle is depleted each time the battery switches from charge to discharge mode due to the assumed degradation of the membrane. The higher cost of rated power output and the desire to limit discharge or charge mode switching makes VRFBs best-suited for long-duration energy storage. The realized lifespan of VRFB ( T m a x , V R F B ) is the lesser of the maximum lifespan or when the battery reaches the total used cycle lives, whichever is achieved first as shown in Equation (14). The number of VRFB cycles used per year is defined by the number of times the discharge power changes sign ( K V R F B ) based on assumptions in [37].
T m a x , V R F B = min ( { 15   y e a r s , [ K ] V R F B K V R F B } )
K V R F B = t 8760 sign ( P V R F B ( t ) ) Δ t sign ( P V R F B ( t Δ t ) )

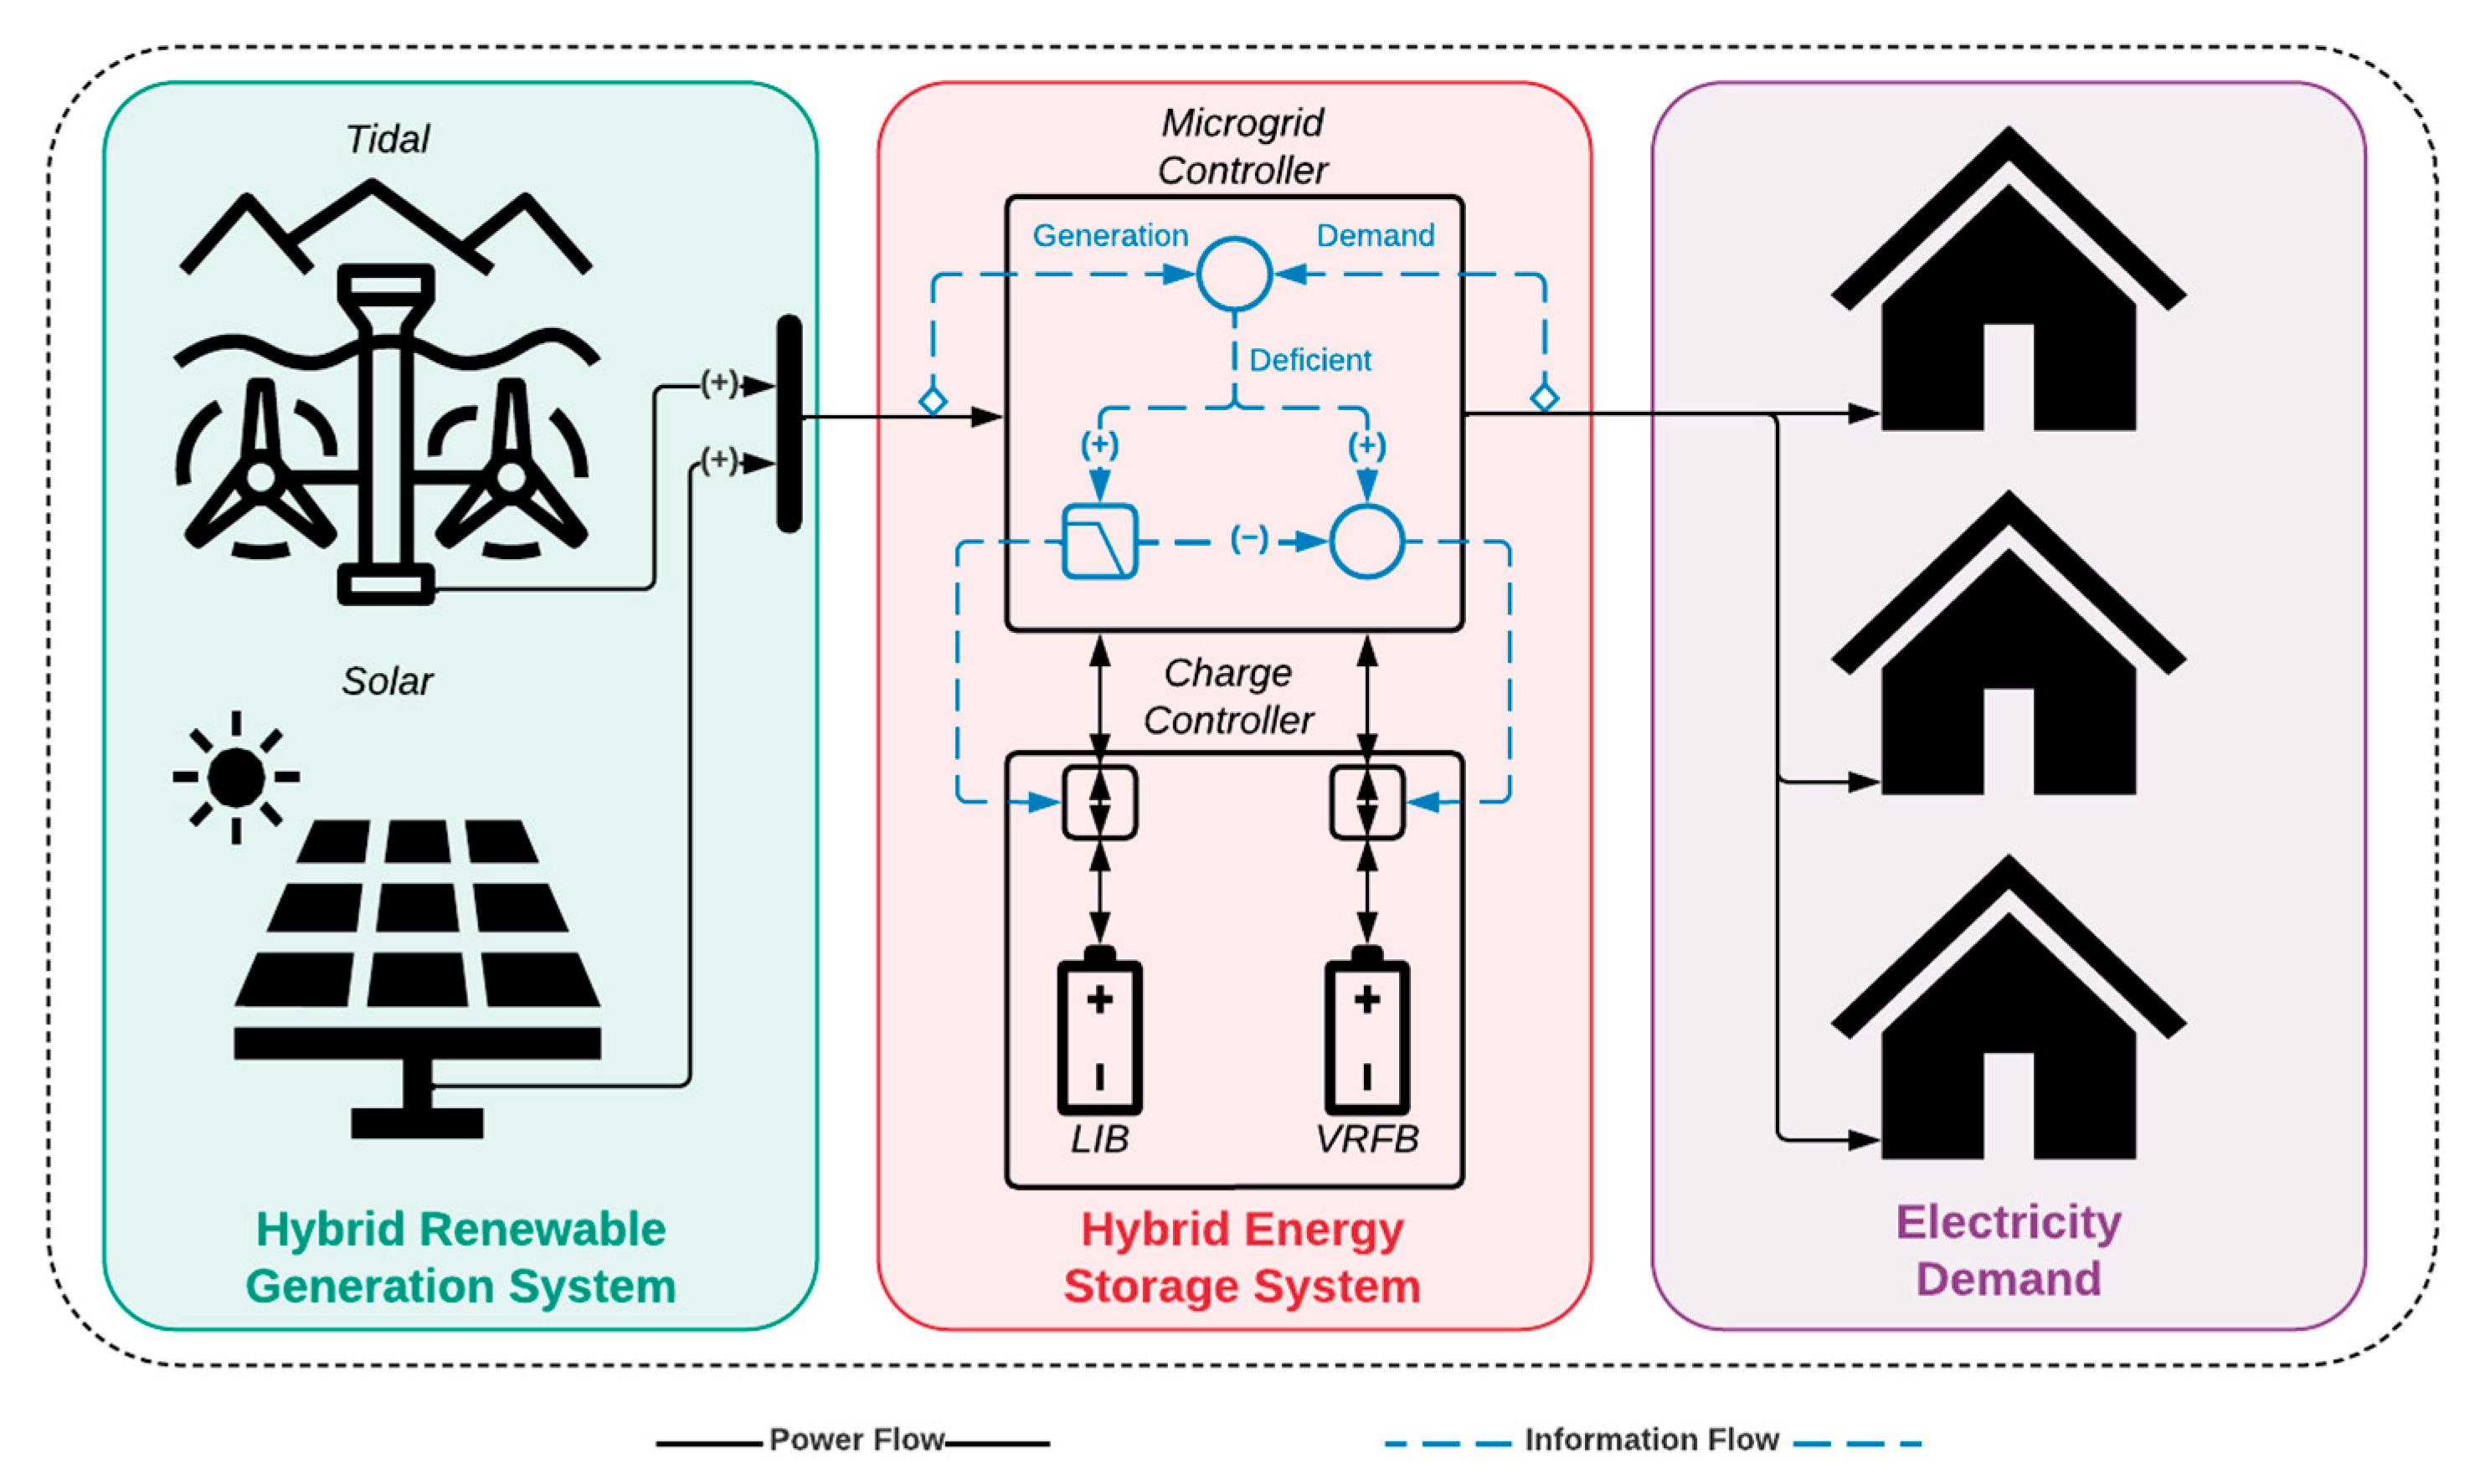
2.3. Microgrid Model

This study considers a microgrid that provides electricity to 429 households ( #   h o m e s ) [40] on Block Island. Due to the lack of a public load profile for this community, the load is assumed to follow the same shape as the hourly loads from January 1, 2019 to December 31, 2020 on the wholesale electric grid at the nearest load zone, i.e., ISO New England load zone 4005.Z.RHODEISLAND. The total island demand P D e m a n d ( t ) is calculated by the product of the hourly load profile ( P ° D e m a n d ( t ) ) and the power demand scalar of load profile that yields estimated annual consumption of all homes on the island ( [ P ] D e m a n d ). The annual power demand scalar is calculated to be 4.57 GWh/Wh as shown in Equation (17) below as a function of the summation of hourly load profile ( P ° D e m a n d ( t ) ) , the number of households on the island ( #   h o m e s ) , and the US average annual household electric energy consumption ( E h o m e ) of 10.65 MWh [41].
P D e m a n d ( t ) = [ P ] D e m a n d P ° D e m a n d ( t )
[ P ] D e m a n d = ( #   H o m e s ) ( E H o m e ) t 8700 P ° D e m a n d ( t ) Δ t

2.3.1. Microgrid Controller

The microgrid controller must ensure that the electricity demand is met at each hour of the year. The demand is assumed to be uncontrollable, and while renewable generators can curtail energy, they cannot produce more than is available from the sun and tides at that hour. This leaves the microgrid controller responsible for splitting the charging (discharge) power surplus (deficit, respectively) between the demand and generation at each hour. An expensive backup generator is only available as a measure of last resort. The system should be designed such that this backup generation is not needed. Therefore, the total net discharge from the ESS ( P E S S ( t ) ) is calculated as the summation of discharge power of the VFRB ( P V R F B ( t ) ) and LIB ( P L I B ( t ) ) batteries.
P E S S ( t ) = P V R F B ( t ) + P L I B ( t )
Considering the long-duration benefits of VRFBs and the high-power benefits of LIBs, the battery power-flow controller implements a low-pass filter [5] on the power deficit ( P D e f i c i t ) between demand and generation at each hour t , allocating the high-frequency component P L I B to the LIBs and the low-frequency component P V R F B to the VRFBs as shown in Equation (19). Following this sign convention, P D e f i c i t is negative when RES power generation ( P R E S ) is less than demand, and P L I B and P V R F B are positive when the battery is discharging. The filter is implemented as a discrete-time (with one-hour time steps, Δ t ) causal moving-average filter, where the span of the moving-average K c o n t r o l (in hours) is a design variable.
P V R F B ( t ) = 1 K C o n t r o l k = 1 K C o n t r o l P D e f i c i t ( t k Δ t 1 )
P L I B ( t ) = P D e f i c i t ( t ) P V R F B ( t )
P D e f i c i t ( t ) = P R E S ( t ) P D e m a n d ( t )

2.4. Design Objective

When designing the microgrid, the objective is to reduce the levelized cost of energy (LCOE) delivered by the microgrid. Since RES and ESS’s operational costs are orders of magnitude less than those of traditional generation, only capital costs are considered in this analysis. To simplify the analysis and to avoid the calculation of salvage values, future costs are not discounted. Therefore, the LCOE is calculated according to Equation (22) as the sum of capital cost C n of each component n divided by each component’s realized lifespan T m a x n in years (e.g., if batteries are heavily cycled, they may need replacement before the maximum lifespan) divided by the total energy delivered per year ( E d e m a n d = 4.57 GWh) resulting in an LCOE in units of USD/MWh delivered, where the number of components ( N = 4 ) is as follows: (1) Solar, (2) Tidal, (3) LIB, (4) VRFB. To facilitate analysis and understanding of each microgrid component’s impact, the LCOE is decomposed into the contributing LCOE of each component by dividing that component’s capital cost by its realized lifetime divided by the total energy E D e m a n d ) delivered by the microgrid.
L C O E = n N ( C n   /   T m a x n ) E D e m a n d
E D e m a n d = t 8760 P D e m a n d ( t )

2.5. Design Problem

The three independent variables in the design problem from the aforementioned equations are the rated power of the tidal generator, [ P ] T i d a l ; the rated power of the solar PV system, [ P ] S o l a r ; and the span of the moving average filter in the power-flow controller, K C o n t r o l . This leads to the following optimization problem. The lower limits of each of these variables are zero. While there may not be true upper limits on these variables, if a constrained optimization approach is used, the upper limits should be set high enough that they are not reached.
min P T i d a l P S o l a r K C o n t r o l L C O E
Once [ P T i d a l ] , [ P S o l a r ] , and [ K C o n t r o l ] are selected, an annual simulation of the system can be run to generate P L I B ( t ) and P V R F B (t). The rated dis(charge) power of the LIB system ( [ P ] L I B ) is the maximum power from the LIB ( P L I B ( t ) ) as calculated in Equation (25).
[ P ] L I B = max t ( | P L I B ( t ) | )
[ P ] V R F B = m a x t ( | P V R F B ( t ) | )
The total energy storage capacity ( [ E ] L I B ) of the LIB is the maximum hourly profile of energy ( E L I B ( t ) ) stored in the LIB offset to ensure energy stored is always positive. Similarly, the rated energy storage capacity of the VRFB system ( [ E ] V R F B ) is calculated from the energy hourly profile of energy stored in the VRFB ( E V R F B ) offset to ensure the energy stored is always positive.
E L I B ( t ) = t 8760 P L I B ( t ) Δ t + m i n τ [ 0 ,   8759 ] ( 𝓉 τ P L I B ( 𝓉 ) Δ t )
[ E ] L I B = max t ( E L I B ( t ) )
E V R F B ( t ) = t 8760 P V R F B ( t ) + m i n 𝓉 [ 0 , 8759 ] τ 𝓉 P V R F B ( τ ) Δ t
[ E ] V R F B = m a x t ( E V R F B ( t ) )
From these data, the cycles and realized lifetime of the batteries can be calculated according to Equations (12), (14), and (15), as well as the capital cost of the RES and ESS according to Equations (11) and (13).

2.6. Solution Approach

2.6.1. Grid Search

An exhaustive grid search of any two independent variables shown as a 2-axis contour map of the LCOE can provide insights into the optimization problem’s convexity, smoothness, and general shape. Four ‘slices’ of this three-dimensional optimization problem are selected for the grid search: (1) vary the tidal and PV RES rated powers using only the LIB; (2) vary the tidal and PV RES rated power using only the flow battery; (3) vary the rated power of the tidal RES and battery controller filter span, without the PV RES; and (4) vary the rated power of the PV RES and battery controller filter span, without the tidal RES.
Due to the large range of these variables under consideration (e.g., the solar-rated power may vary from zero to 5 MW), a log spacing is used to define the grid. The lowest LCOE on the grid is then selected as a starting point for an interior-point-constrained local optimization [42] to further improve the lowest point’s accuracy, which may lie between grid lines.

2.6.2. Particle Swarm Optimization (PSO)

An exhaustive search of the full three-dimensional space would be computationally intractable. Instead, a Particle Swarm Optimization (PSO) method [43] is used to identify the system configuration ( [ P ] t i d a l , [ P ] s o l a r , K c o n r o l ) with the lowest LCOE. A two-stage optimization approach is utilized, wherein the optimal point returned by the PSO initialized a secondary interior-point-constrained local optimization to refine the optimal configuration estimation further. As with the grid search, the independent variables are projected onto a logarithmic space. The swarm size is the primary meta-parameter of the optimization and should be selected as large as possible until computational tractability limits are reached, or negligible improvements are realized.

2.6.3. Sensitivity Analysis

The system costs established above are estimates based on the latest literature. However, RES and ESS’s costs have been decreasing exponentially recently, and new technology developments and business practices can yield significant changes in market prices. A sensitivity analysis will provide insight into how such price fluctuations affect fundamental system architecture. Specifically, the study separately considers four separate cost variations: (1) the energy storage capacity costs of the LIB module; (2) the dielectric, membrane, and electrode costs of the VRFB module; (3) the cost per rated power of the solar PV; and (4) the cost per rated power of the tidal generator. The power conversion and balance of system costs are not varied in the sensitivity analysis as they are not expected to fluctuate as greatly.
The cost varies from 1/10th to double the baseline cost in 20 equally spaced steps in the 4 sensitivity analyses. At each step change in component cost, a PSO is conducted to determine the system configuration ( [ P ] t i d a l , [ P ] s o l a r , K c o n r o l ) with the lowest LCOE. Plotting the components LCOEs in a stacked area chart will then show continuous and step changes and optimal system configuration as component costs change

2.7. Assumptions and Limitations

This work assumes that variable costs of the RES and ESS are negligible. The power is generated only by RES (simulation results show that the diesel generator does not contribute to the demand). Additionally, operations and maintenance (O&M) costs are neglected since they are often significantly less than capital costs over the lifetime. In applying these methods in practice, future work would be needed to study site specific O&M costs to ensure these assumptions hold.

3. Results

A simulation environment was developed in MATLAB for this work [44] and is available as Supplementary Materials. The code includes wrappers for the grid search, PSO, and sensitivity analysis. Using an object-oriented program approach yielded a software environment where microgrid components can be easily swapped out, added, and modified parameters. First, the grid search results are shown to provide an understanding of the optimization surface. The PSO algorithm is then tuned, yielding an efficient swarm size that is highly likely to identify global optimums in the search domain. A system is then designed with the PSO using the baseline parameters established above, producing insights into the key contributors of the LCOE and the time-domain response of the microgrid. Finally, the sensitivity of LCOE and optimal system configuration with respect to variations in component costs is presented.

3.1. Grid Search Results

The four grid searches are shown below in Figure 3, which demonstrates the value of the hybrid microgrid, both hybrid RES and hybrid ESS. This is apparent in the lowest LCOE value always balancing between solar- and tidal-rated power and a battery controller that utilizes both LIB and VRFB ESSs. The whitespace in the figure represents LCOEs greater than an enormous USD 100/kWh and, therefore, not relevant to show their surface profile. The optimal point (shown as a red dot) is at the base of this steep cliff in all four cases. Inside the boundary (down and to the left, primarily white space) is a microgrid that fails to generate all its own energy and/or the generators and batteries fail to deliver power, resulting in an expensive backup generation. Outside the boundary (to the right and/or up), the costs increase steadily as the system becomes oversized, curtailing energy and/or having unused battery capacity. The battery filter span for a system with only solar RES is 13.7 h and 64 h for a tidal generator.

3.2. Selecting the PSO Swarm Size

The PSO algorithm’s default swarm size is the minimum of 100 or 10 times the number of independent variables (i.e., 3) leading to a default swarm of 100. Rerunning the PSO with swarm sizes of 100, 266, 708, 1884, and 5012 led to less than a 0.1% variation in the solutions. Furthermore, running on the PSO algorithm with parallelization on Northeastern University high-performance computing cluster with 65 nodes and 64 GB of RAM, the computation time was reduced to ~40 s when a swarm of 200 was used. As such, a swarm of 200 was used for all the results shown in this manuscript.

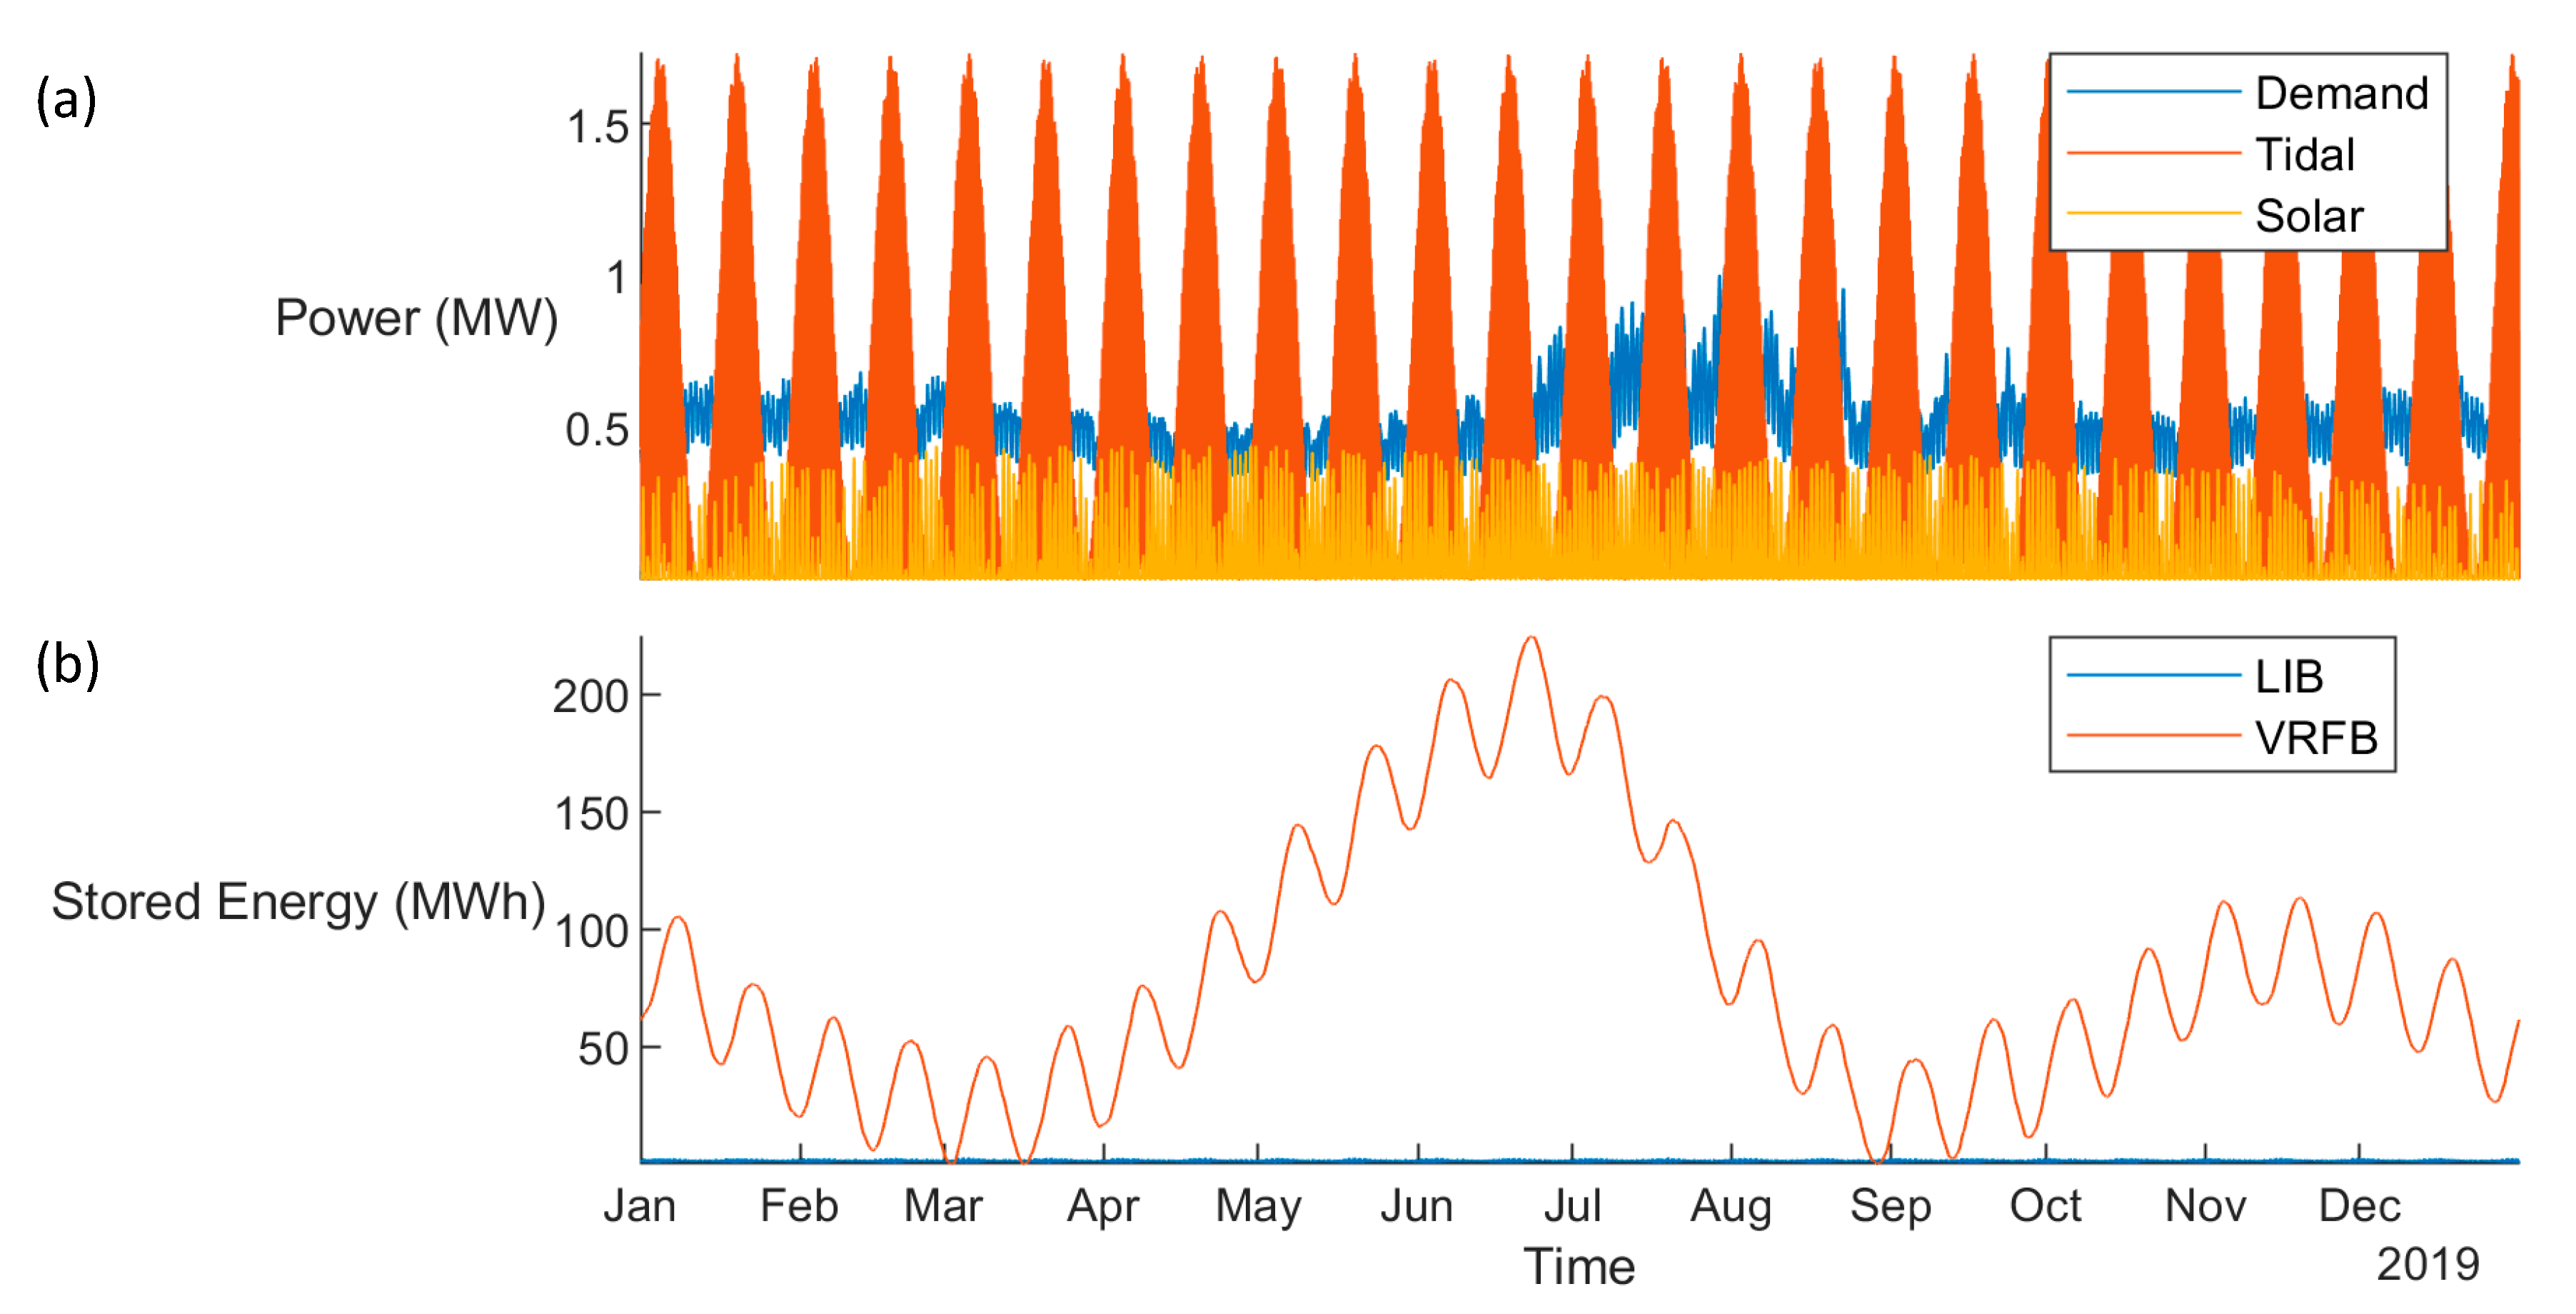
3.3. Baseline Hybrid Microgrid

Using the baseline costs and parameters established above, the PSO algorithm reduced the LCOE to USD 1186/MWh by selecting a 1.7 MW rated-power tidal RES, a 0.5 MW rated-power solar RES, and a battery controller moving average filter with a 15 h span. The total cost is USD 83 M. The microgrid served the full demand for energy of 5 GWh with the combined RES generating a peak power of 85 kW. The 1.7 MW tidal RES cost USD 7.5 M (at USD 4.3/MW) and produced 3.8 GWh/year, thus a 25% capacity factor. The 0.5 MW solar RES cost USD 0.6 M (at USD 1.1/MW) and produced 0.7 GWh/year, thus a 16% capacity factor. The resulting LIB ESS has an energy storage capacity of 3 MWh (USD 0.7 M at USD 285/kWh) and a rated power of 1.0 MW (USD 0.3 M at USD 306/kW), thus an E/P ratio of 2.6 h. The cycling reduced the realized lifespan from a maximum of 10 years to 7.9 years. The resulting VRFB ESS has an energy storage capacity of 225 MWh (USD 73.1 M at USD 325/kWh) and a rated power of 0.8 MW (USD 0.4 M at USD 503/kW), thus an E/P ratio of 296 h. The cycling was not enough to reduce the lifespan of the VRFB below the maximum of 15 years. The energy storage costs of the VRFB are the primary contributor to the USD 1186/MWh LCOE as shown in Figure 4.
Figure 5 shows the demand, generation, and energy stored at each hour of the simulated year. In Figure 5a, the monthly variations in the tidal power generation are seen, significantly exceeding the demand at times. Further, the daily fluctuations in solar generation are generally less than the demand. The curtailments (i.e., excess RES generation not used by the demand or ESS) and its negative, the amount of power required from ancillary sources (e.g., diesel generation), is strictly and significantly less than 1.0 mW. Figure 5b shows that the energy stored by the VRFB is two orders of magnitude higher than that stored in the LIB. Yet, the figure hides the significant power (i.e., 1 MW peak) provided by the LIB.

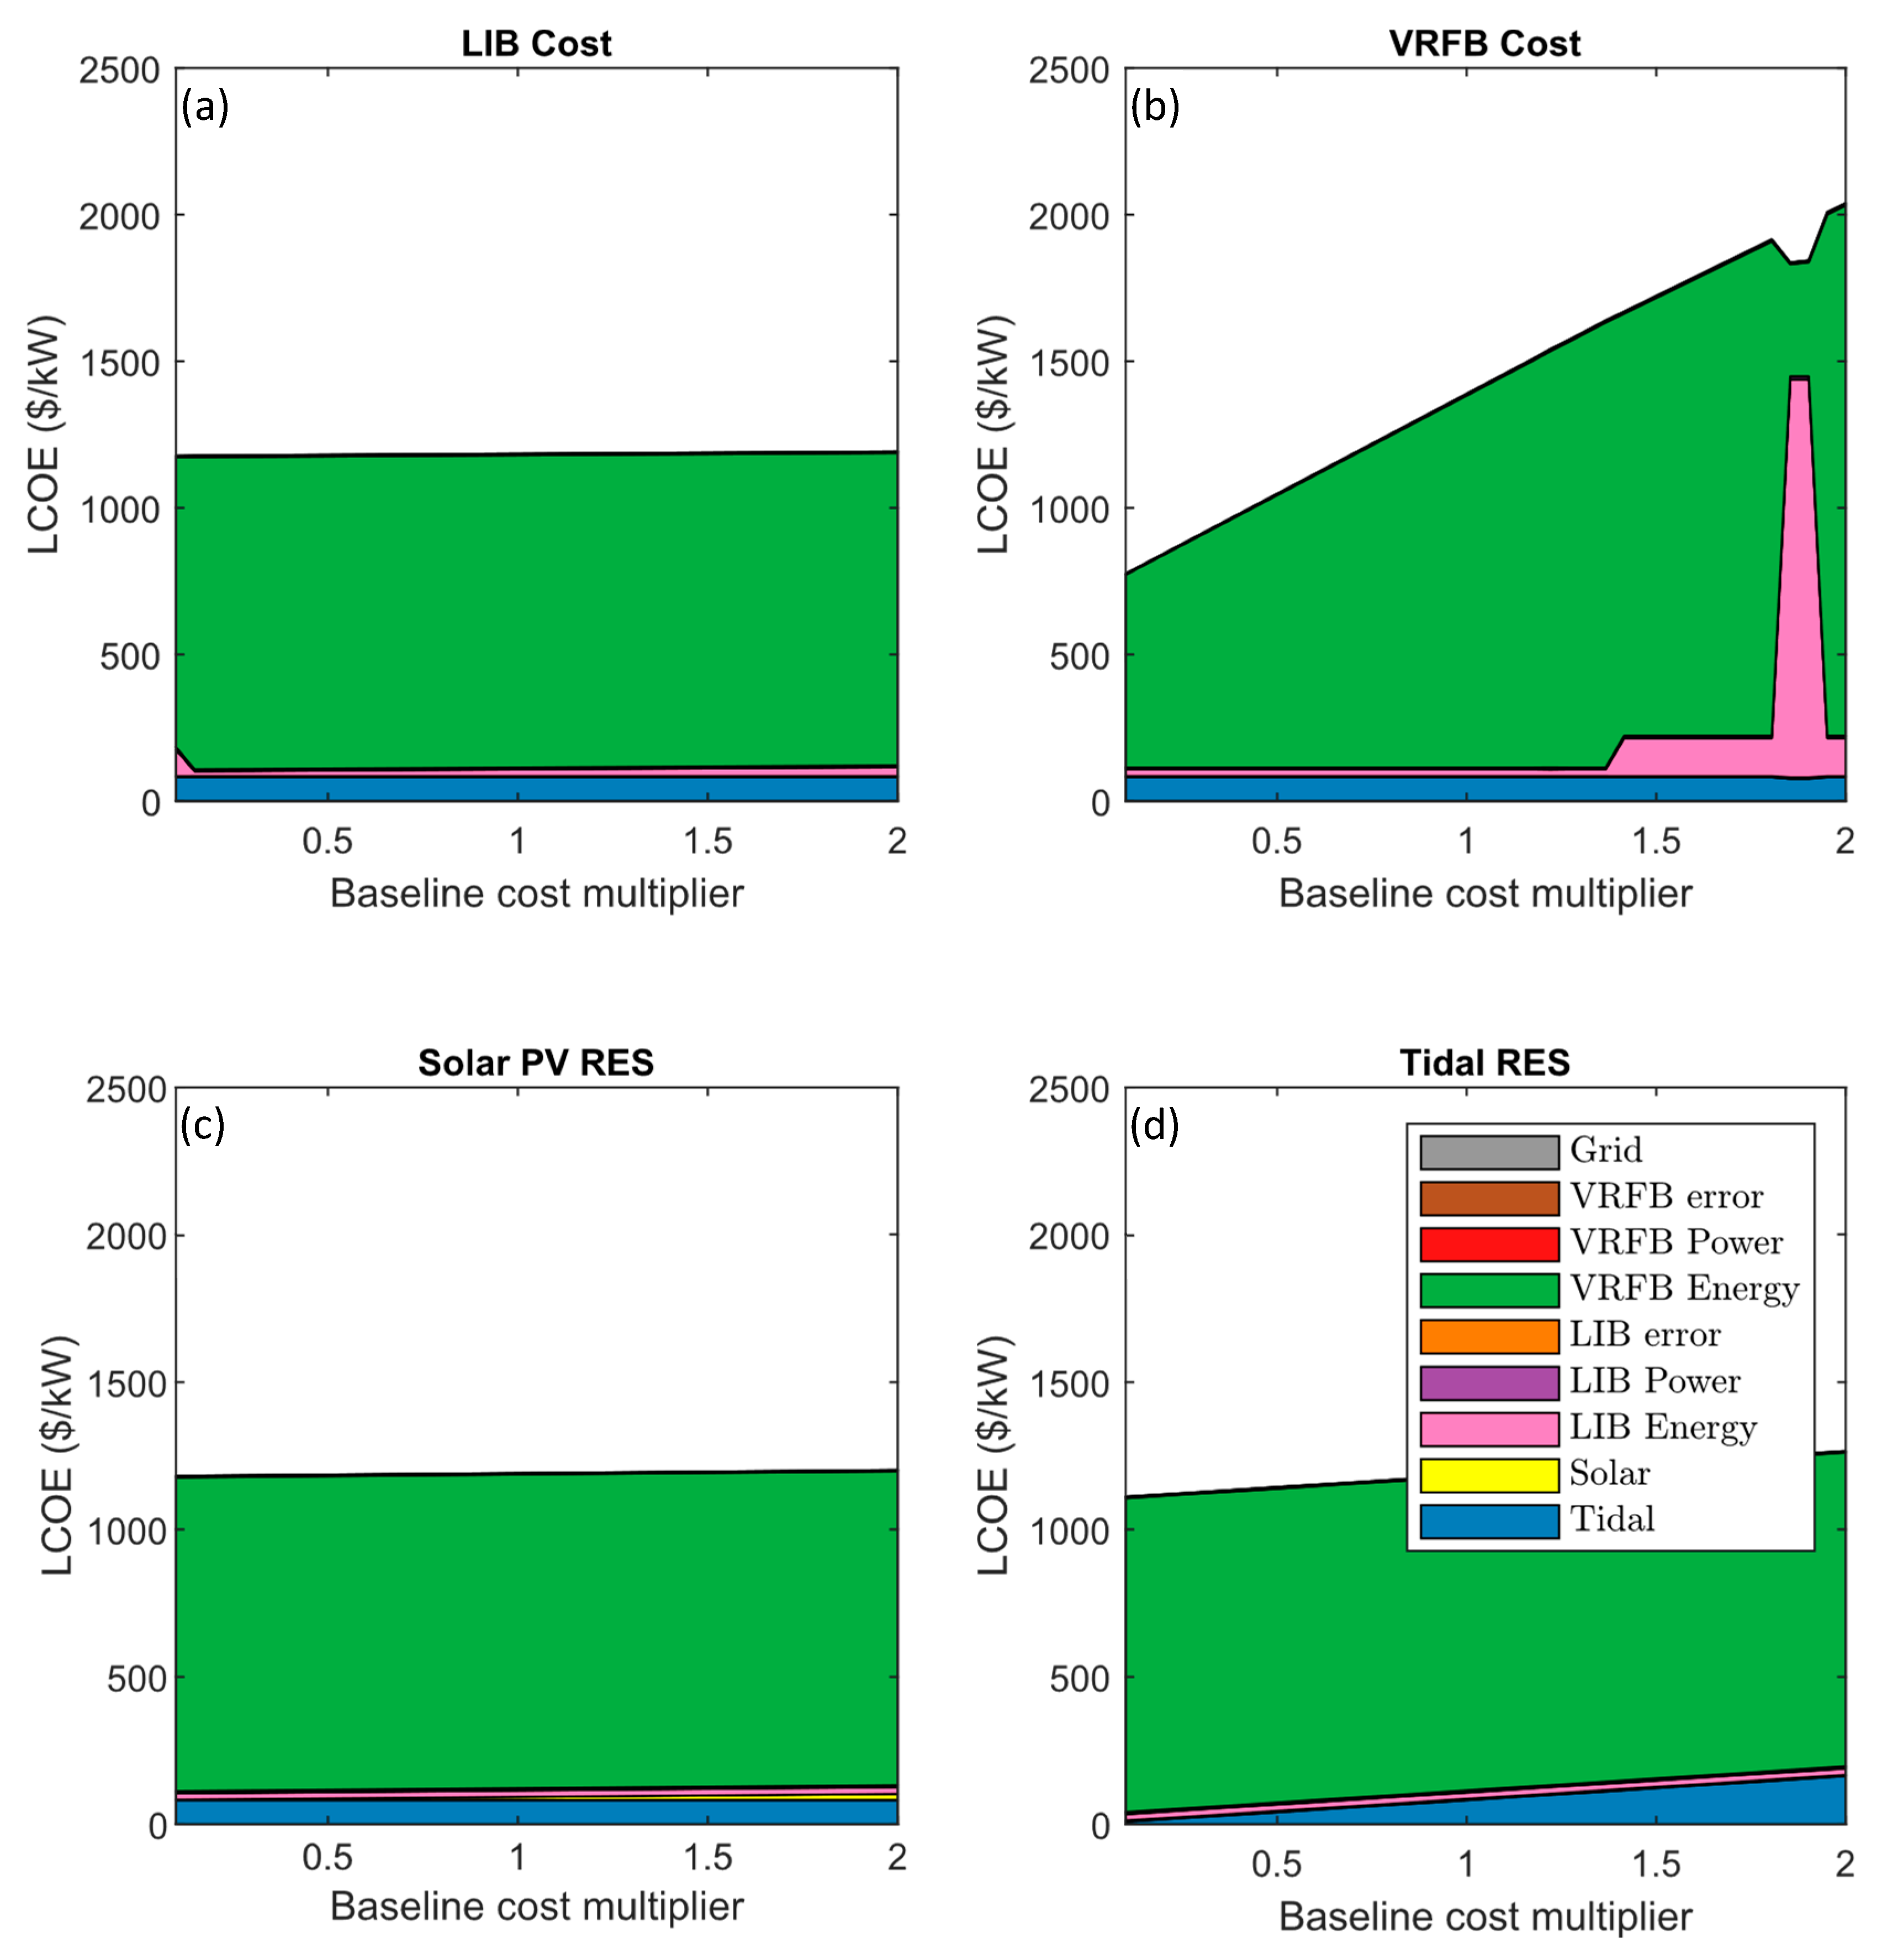
3.4. Cost Sensitivity Study

Figure 6 shows the sensitivity of optimal system configuration to variations in the cost of system components. In Figure 6, very low LIB costs lead to significantly greater LIB energy storage. When the baseline cost is multiplied by 1.8, a significant increase in LCOE is observed due to a large increase in the energy storage requirements. In general, the VRFB is the most significant component of the LCOE; thus, the linear varying left side of Figure 6b is expected: the total LCOE would increase significantly as the VRFB costs are increased. As the VRFB costs are increased ~1.5×, a step change in the use of LIB is observed to replace the VRFB storage, and at a 2× increase in VRFB, the LIB becomes the most significant source of energy storage. The solar cost is varied in Figure 6c; however, due to the relatively small contribution of the solar system to the total LCOE, even the significant variations in solar costs lead to only linearly increasing system costs with no substantive changes in the configuration. The tidal cost increases also lead to linearly increasing LCOE in Figure 6d without significant configuration changes. However, since the tidal generators provide most of the system’s energy, the tidal energy cost increases lead to a more significant increase in total LCOE.

4. Discussion

The LCOE of the optimized system under baseline assumptions was USD 1191/MWh. This is significantly higher than typical wholesale electricity prices in the US of USD 20–50/MWh [45], typical retail prices in the US of USD 105/MWh [46], and the LCOE of diesel reciprocating engines of USD 187–319/MWh [47]. Most of this high LCOE is due to the high cost of long-duration energy storage, even when using lower cost VRFBs. If the capital cost of VRFB modules can be reduced an order of magnitude through technological, economic, and business practice learning curves, the hybrid microgrid LCOE could be reduced to a more competitive USD 772/MWh. Unlike grid-tied electricity and diesel generators, the proposed hybrid microgrid is 100% renewable.
The utilization of both types of batteries highlights microgrids’ value with hybrid ESSs and the importance of the microgrid’s battery controller. When only a solar RES is considered, as shown in Figure 3, the optimized battery controller had a moving average filter span of 13 h, while when only considering tidal RES, the optimized span was 65 h. As such, the solar microgrid utilizes the LIB to smooth out hourly variations in solar energy, and the VRFBs are used to provide energy during the dark nighttime hours and longer duration (e.g., seasonal) energy needs. On the other hand, the tidal microgrid uses the LIB to smooth out the daily tide variations and reserves the VRFB for the monthly tidal variations and seasonal load variations. Especially for microgrids with significant tidal generation, the microgrid battery control algorithm should be tuned simultaneously to optimize the tidal-rated power since leveraging the wrong battery could significantly increase system costs and LCOE.
This study introduced two innovations missing in many previous studies of hybrid microgrids: battery lifecycle modeling and VRFB nonlinear cost modeling. Both innovations outlined in this study produced meaningful results. The LIB and VRFB had maximum lifetimes of 10 and 15 years, respectively. However, excessive cycling drove premature replacement of the LIB in the baseline scenario, where it needed to be replaced in just 7.9 years. This study demonstrates that lifecycle modeling can extend the lifespan of batteries hybrid microgrids. Most battery cost models cited in the microgrid literature are specified only for a given E/P ratio, often around 4 h [37]. This would likely be sufficient for LIBs since the E/P was 2.6 h in the baseline scenario, and LIB storage capacity is easily scaled. However, according to Figure 2, a VRFB with an E/P of 4.0 h would have a module cost around USD 274/kWh, while the E/P of 296 h used in the baseline has a module cost of USD 206/kWh. This is because the lower rated power results in smaller electrodes and membranes. Therefore, by considering nonlinear cost modeling for VRFBs, this study demonstrates the battery cost can be reduced in hybrid microgrids.
The most economical system configurations were identified using the PSO global optimization algorithm. When implementing optimizations, it is helpful to understand the convexity and general smoothness of the optimization hypersurface. The grid search in Figure 3 shows that the optimization appears generally convex at least from 2D slices shown of the 3D optimization hypersurface. In practice, a more computationally efficient gradient descent algorithm may be more desirable than the computationally costly PSO algorithm. However, this assumes that the initial point for the gradient descent algorithm is feasible and yields an acceptable LCOE and does not consider the possibility of not strictly convex portions of the surface. Furthermore, the cost sensitivity shows that the cost and system configuration is nonconvex and nonlinear with respect to component costs.

5. Conclusions

Microgrids using hybrid tidal and solar RES and hybrid LIB and VRFB ESS can provide economical energy to remote communities, provided the cost of VRFBs is significantly reduced as the technology and market mature. However, when studying and designing such systems, it is important to consider the realized life cycles of batteries due to excessive cycling; nonlinear relationships between cost, rated power, and energy storage capacity for VRFBs; and the simultaneous design of the physical system and controller parameters. This study contributes to this field by applying a simple life-cycle model for LIB and VRFBs, a VRFB cost model that accounts for the relationship between battery energy capacity and rated power, and implements controls co-design (CCD). To realize the promises of hybrid microgrids, future research should validate the approach with higher temporal fidelity; study the reliability and robustness of the design to temporal variations in RES generation and load, consider the time-value of money in the LCOE calculation, and implement demand response to minimize the need for energy storage.

Supplementary Materials

The source code used to generate all the results in the manuscript are available online at https://github.com/NEU-ABLE-LAB/tidal_grid_open (accessed on 20 February 2023).

Author Contributions

Conceptualization, M.B.K.; methodology, M.B.K. and J.C.; software, A.M., M.B.K., J.C., F.O.III and K.G.; validation, M.B.K.; formal analysis, M.B.K.; investigation, A.M., M.B.K., J.C. and F.O.III; resources, A.M., M.B.K., F.O.III and K.G.; data curation, A.M., M.B.K., J.C. and F.O.III; writing—original draft preparation, A.M. and M.B.K.; writing—review and editing, M.B.K. and K.G.; visualization, A.M., M.B.K., J.C., F.O.III and K.G.; supervision, M.B.K. and K.G.; project administration, M.B.K.; funding acquisition, M.B.K. All authors have read and agreed to the published version of the manuscript.

Funding

This research received no external funding.

Data Availability Statement

Publicly available datasets were analyzed in this study. This data can be found here: https://github.com/NEU-ABLE-LAB/tidal_grid_open (accessed on 20 February 2023).

Acknowledgments

The authors A.M., J.C. and F.O.III would like to thank and acknowledge the support provided by the Northeastern University (NU) Young Scholars Program (YSP) run by the NU Center for STEM Education and directed by Claire Duggan. The author M.K. would like to thank Joshua Gallaway, assistant professor of chemical engineering at Northeastern University, for many enlightening conversations on modeling battery costs and lifecycles. This work was completed in part using the Discovery cluster, supported by Northeastern University’s Research Computing team.

Conflicts of Interest

The authors declare no conflict of interest.

Nomenclature

VariableDefinitionUnits
C E S S Capital cost of ESSUSD
C R E S Capital cost of generation from RESUSD
C L I B Capital cost of LIBUSD
C n Total capital cost of microgridUSD
C S o l a r Capital cost of solar generatorsUSD
C T i d a l Capital cost of tidal generatorsUSD
C V R F B Capital cost of VFBBUSD
[ C ] E , L I B Capital cost of LIB per rated energy storage capacityUSD/Wh
[ C ] P , L I B Capital cost of LIB per rated (dis)charge powerUSD/W
[ C ] S o l a r Capital cost of solar generation per rated powerUSD/W
[ C ] T i d a l Capital cost of tidal generation per rated powerUSD/W
E H o m e Average annual energy consumption of a US homeWh
E L I B   ( t ) Hourly profile of energy stored in LIBWh
E V R F B   ( t ) Hourly profile of energy stored in VRFBWh
E L I B Rated energy storage capacity of LIBWh
[ E ] V R F B Rated energy storage capacity of VRFBWh
K C o n t r o l Span of moving average filterhours
K L I B LIB discharge cycles consumed per yearcycles/year
K V R F B VRFB discharge cycles consumed per yearcycles/year
[ K ] L I B Rated LIB life-cyclescycles
[ K ] V R F B Rated VRFB life-cyclescycles
LCOELevelized cost of energyUSD/Wh
P E S S   ( t ) Hourly profile of discharge power from ESSW
P D a i l y   ( t ) Hourly profile of tidal power generationW
P D e f i c i t   ( t ) Hourly profile of power demand not met by RESW
P D e m a n d   ( t ) Hourly profile of power demand from homesW
P R E S   ( t ) Hourly profile of power generation from RESSW
P L I B   ( t ) Hourly profile of discharge power of LIBW
P S o l a r   ( t ) Hourly profile of solar power generationW
P T i d a l   ( t ) Hourly profile of tidal power generationW
P V R F B   ( t ) Hourly profile of discharge power of VRFB W
[ P ] D e m a n d Scaling factor of power demandW/W
[ P ] L I B Rated discharge power of LIBW
[ P ] S o l a r Rated power of solar generatorW
[ P ] T i d a l Rated power of tidal generatorW
[ P ] V R F B Rated discharge power of VRFBW
P ° D e m a n d   ( t ) Reference hourly load profile W/W
P ° S o l a r   ( t ) Reference site-specific power generation from SolarW/W
P ° T i d a l   ( t ) Reference site-specific power generation from TidalW/W
Δ t Simulation timestephour
T m a x Realized life-span of component years
AcronymDefinition
CCDControls Co-Design
ESSEnergy Storage System
LCOELevelized Cost of Energy
LIBLithium-Ion Batteries
PSOParticle Swarm Optimization
PVPhoto Voltaic
RESRenewable Energy Sources
VRFBVanadium Redox Flow Batteries

References

  1. Zhou, Z.; Benbouzid, M.E.H.; Charpentier, J.F.; Scuiller, F. Hybrid Diesel/MCT/Battery Electricity Power Supply System for Power Management in Small Islanded Sites: Case Study for the Ouessant French Island. In Smart Energy Grid Design for Island Countries: Challenges and Opportunities; Islam, F.M.R., Mamun, K.A., Amanullah, M.T.O., Eds.; Springer International Publishing: Cham, Switzerland, 2017; pp. 415–445. ISBN 978-3-319-50197-0. [Google Scholar]
  2. Hu, X.; Zou, C.; Zhang, C.; Li, Y. Technological Developments in Batteries: A Survey of Principal Roles, Types, and Management Needs—IEEE Journals & Magazine. Available online: https://ieeexplore.ieee.org/document/8011541 (accessed on 21 October 2020).
  3. Stroe, D.-I.; Zaharof, A.; Iov, F. Power and Energy Management with Battery Storage for a Hybrid Residential PV-Wind System—A Case Study for Denmark. Energy Procedia 2018, 155, 464–477. [Google Scholar] [CrossRef]
  4. Kumar, G.V.B.; Sarojini, R.K.; Palanisamy, K.; Padmanaban, S.; Holm-Nielsen, J.B. Large Scale Renewable Energy Integration: Issues and Solutions. Energies 2019, 12, 1996. [Google Scholar] [CrossRef] [Green Version]
  5. Akram, U.; Khalid, M.; Shafiq, S. An Innovative Hybrid Wind-Solar and Battery-Supercapacitor Microgrid System—Development and Optimization. IEEE Access 2017, 5, 25897–25912. [Google Scholar] [CrossRef]
  6. Uhrig, M.; Koenig, S.; Suriyah, M.R.; Leibfried, T. Lithium-Based vs. Vanadium Redox Flow Batteries—A Comparison for Home Storage Systems. Energy Procedia 2016, 99, 35–43. [Google Scholar] [CrossRef] [Green Version]
  7. Skyllas-Kazacos, M.; Kazacos, G.; Poon, G.; Verseema, H. Recent advances with UNSW vanadium-based redox flow batteries. Int. J. Energy Res. 2010, 34, 182–189. [Google Scholar] [CrossRef]
  8. Puleston, T.; Clemente, A.; Costa-Castelló, R.; Serra, M. Modelling and Estimation of Vanadium Redox Flow Batteries: A Review. Batteries 2022, 8, 121. [Google Scholar] [CrossRef]
  9. Ha, S.; Gallagher, K.G. Estimating the System Price of Redox Flow Batteries for Grid Storage. J. Power Source 2015, 296, 122–132. [Google Scholar] [CrossRef] [Green Version]
  10. Ahmadi, L.; Fowler, M.; Young, S.B.; Fraser, R.A.; Gaffney, B.; Walker, S.B. Energy Efficiency of Li-Ion Battery Packs Re-Used in Stationary Power Applications. Sustain. Energy Technol. Assess. 2014, 8, 9–17. [Google Scholar] [CrossRef]
  11. Astaneh, M.; Roshandel, R.; Dufo-López, R.; Bernal-Agustín, J.L. A Novel Framework for Optimization of Size and Control Strategy of Lithium-Ion Battery Based off-Grid Renewable Energy Systems. Energy Convers. Manag. 2018, 175, 99–111. [Google Scholar] [CrossRef]
  12. Purvins, A. Sumner Optimal Management of Stationary Lithium-Ion Battery System in Electricity Distribution Grids. J. Power Source 2013, 242, 742–755. [Google Scholar] [CrossRef]
  13. Vetter, J.; Novák, P.; Wagner, M.R.; Veit, C.; Möller, K.-C.; Besenhard, J.O.; Winter, M.; Wohlfahrt-Mehrens, M.; Vogler, C.; Hammouche, A. Ageing Mechanisms in Lithium-Ion Batteries. J. Power Source 2005, 147, 269–281. [Google Scholar] [CrossRef]
  14. Hemmati, R.; Saboori, H. Emergence of Hybrid Energy Storage Systems in Renewable Energy and Transport Applications—A Review. Renew. Sustain. Energy Rev. 2016, 65, 11–23. [Google Scholar] [CrossRef]
  15. Jing, W. Dynamic Modelling, Analysis and Design of Smart Hybrid Energy Storage System for off-Grid Photovoltaic Power Systems. Ph.D. Thesis, Swinburne University of Technology, Melbourne, Australia, 2019; p. 209. [Google Scholar]
  16. Wang, Y.; Yu, H.; Yong, M.; Huang, Y.; Zhang, F.; Wang, X. Optimal Scheduling of Integrated Energy Systems with Combined Heat and Power Generation, Photovoltaic and Energy Storage Considering Battery Lifetime Loss. Energies 2018, 11, 1676. [Google Scholar] [CrossRef] [Green Version]
  17. Singh, G.K. Solar Power Generation by PV (Photovoltaic) Technology: A Review. Energy 2013, 53, 1–13. [Google Scholar] [CrossRef]
  18. Hittinger, E.; Wiley, T.; Kluza, J.; Whitacre, J. Evaluating the Value of Batteries in Microgrid Electricity Systems Using an Improved Energy Systems Model. Energy Convers. Manag. 2015, 89, 458–472. [Google Scholar] [CrossRef] [Green Version]
  19. Kuznetsova, E.; Ruiz, C.; Li, Y.-F.; Zio, E. Analysis of Robust Optimization for Decentralized Microgrid Energy Management under Uncertainty. Int. J. Electr. Power Energy Syst. 2015, 64, 815–832. [Google Scholar] [CrossRef]
  20. Lau, K.Y.; Tan, C.W.; Yatim, A. Photovoltaic Systems for Malaysian Islands: Effects of Interest Rates, Diesel Prices and Load Sizes. Energy 2015, 83, 204–216. [Google Scholar] [CrossRef]
  21. Ni, J.-W.; Li, M.-J.; Ma, T.; Wei, W.; Li, Z. The Configuration Optimized Design Method Based on Real-Time Efficiency for the Application of Vanadium Redox Flow Battery in Microgrid. Energy Convers. Manag. 2022, 267, 115899. [Google Scholar] [CrossRef]
  22. Soliman, M.S.; Belkhier, Y.; Ullah, N.; Achour, A.; Alharbi, Y.M.; Al Alahmadi, A.A.; Abeida, H.; Khraisat, Y.S.H. Supervisory Energy Management of a Hybrid Battery/PV/Tidal/Wind Sources Integrated in DC-Microgrid Energy Storage System. Energy Rep. 2021, 7, 7728–7740. [Google Scholar] [CrossRef]
  23. Jafari, M.; Botterud, A.; Sakti, A. Estimating Revenues from Offshore Wind-Storage Systems: The Importance of Advanced Battery Models. Appl. Energy 2020, 276, 115417. [Google Scholar] [CrossRef]
  24. Belboul, Z.; Toual, B.; Kouzou, A.; Mokrani, L.; Bensalem, A.; Kennel, R.; Abdelrahem, M. Multiobjective Optimization of a Hybrid PV/Wind/Battery/Diesel Generator System Integrated in Microgrid: A Case Study in Djelfa, Algeria. Energies 2022, 15, 3579. [Google Scholar] [CrossRef]
  25. Mohammed, O.H.; Amirat, Y.; Benbouzid, M. Particle Swarm Optimization of a Hybrid Wind/Tidal/PV/Battery Energy System. Application to a Remote Area in Bretagne, France. Energy Procedia 2019, 162, 87–96. [Google Scholar] [CrossRef]
  26. El-Bidairi, K.S.; Duc Nguyen, H.; Jayasinghe, S.D.G.; Mahmoud, T.S.; Penesis, I. A Hybrid Energy Management and Battery Size Optimization for Standalone Microgrids: A Case Study for Flinders Island, Australia. Energy Convers. Manag. 2018, 175, 192–212. [Google Scholar] [CrossRef]
  27. Bekele, G. Boneya Design of a Photovoltaic-Wind Hybrid Power Generation System for Ethiopian Remote Area. Energy Procedia 2012, 14, 1760–1765. [Google Scholar] [CrossRef] [Green Version]
  28. Obara, S.; Kawai, M.; Kawae, O.; Morizane, Y. Operational Planning of an Independent Microgrid Containing Tidal Power Generators, SOFCs, and Photovoltaics. Appl. Energy 2013, 102, 1343–1357. [Google Scholar] [CrossRef]
  29. Javidsharifi, M.; Niknam, T.; Aghaei, J.; Mokryani, G. Multi-Objective Short-Term Scheduling of a Renewable-Based Microgrid in the Presence of Tidal Resources and Storage Devices. Appl. Energy 2018, 216, 367–381. [Google Scholar] [CrossRef] [Green Version]
  30. Garcia-Sanz, M. Control Co-Design: An Engineering Game Changer. Adv. Control Appl. 2019, 1, e18. [Google Scholar] [CrossRef] [Green Version]
  31. The MathWorks, Inc., MATLAB (2020a), Natick, MA, USA. Available online: https://www.mathworks.com/products/new_products/release2020a.html (accessed on 15 March 2023).
  32. PVWatts Calculator. Available online: https://pvwatts.nrel.gov/pvwatts.php (accessed on 20 November 2020).
  33. Useful Life|Energy Analysis|NREL. Available online: https://www.nrel.gov/analysis/tech-footprint.html (accessed on 25 January 2021).
  34. Frequency of Tides—The Lunar Day—Tides and Water Levels: NOAA’s National Ocean Service Education. Available online: https://oceanservice.noaa.gov/education/tutorial_tides/tides05_lunarday.html (accessed on 20 November 2020).
  35. What Causes Tides?|NOAA SciJinks—All About Weather. Available online: https://scijinks.gov/tides/ (accessed on 20 November 2020).
  36. Vazquez, A.; Iglesias, G. Capital Costs in Tidal Stream Energy Projects—A Spatial Approach. Energy 2016, 107, 215–226. [Google Scholar] [CrossRef] [Green Version]
  37. Mongird, K.; Viswanathan, V.V.; Balducci, P.J.; Alam, M.J.E.; Fotedar, V.; Koritarov, V.S.; Hadjerioua, B. Energy Storage Technology and Cost Characterization Report; U.S. Department of Energy: Washington, DC, USA, 2019; PNNL-28866.
  38. Milshtein, J.D. Cost-Targeted Design of Redox Flow Batteries for Grid Storage. 2017; p. 20. Available online: https://arpa-e.energy.gov/sites/default/files/Panel%202%20-%20Milshtein.pdf (accessed on 20 February 2023).
  39. Brushett, F.R.; Aziz, M.J.; Rodby, K.E. On Lifetime and Cost of Redox-Active Organics for Aqueous Flow Batteries. ACS Energy Lett. 2020, 5, 879–884. [Google Scholar] [CrossRef] [Green Version]
  40. Block Island Population & Demographics, Median Income—Point2. Available online: https://www.point2homes.com/US/Neighborhood/RI/New-Shoreham/Block-Island-Demographics.html (accessed on 5 November 2020).
  41. Frequently Asked Questions (FAQs)—U.S. Energy Information Administration (EIA). Available online: https://www.eia.gov/tools/faqs/faq.php (accessed on 23 November 2020).
  42. Byrd, R.H.; Hribar, M.E.; Nocedal, J. An Interior Point Algorithm for Large-Scale Nonlinear Programming. SIAM J. Optim. 1999, 9, 877–900. [Google Scholar] [CrossRef]
  43. The MathWorks, Inc., Particle Swarm Optimization Algorithm—MATLAB & Simulink. Available online: https://www.mathworks.com/help/gads/particle-swarm-optimization-algorithm.html (accessed on 25 January 2021).
  44. Kane, M.B.; Cohen, J.; Govertsen, K. Tidal Microgirds for Small Islands. 2021. GitHub. Available online: https://github.com/NEU-ABLE-LAB/tidal_grid_open (accessed on 20 February 2023).
  45. Wholesale U.S. Electricity Prices Were Generally Lower and Less Volatile in 2020 Than 2019—Today in Energy—U.S. Energy Information Administration (EIA). Available online: https://www.eia.gov/todayinenergy/detail.php?id=46396 (accessed on 16 January 2021).
  46. EIA State Electricity Profiles. Available online: https://www.eia.gov/electricity/state/ (accessed on 16 January 2021).
  47. Ray, D. Lazard’s Levelized Cost of Energy Analysis—Version 11.0; LAZARD: Hamilton, Bermuda, 2017; p. 22. [Google Scholar]
Figure 1. Schematic overview of the hybrid microgrid using solar and tidal RES; LIB and VRFB ESS; with battery (dis)charging managed by the microgrid controller to meet the island’s electricity demands. Solid black lines indicate power flow, while dashed blue lines indicate information flow.
Energies 16 02761 g001
Figure 2. Graph of inverse-exponential relationship between VRFB module capital costs with respect to the energy over power ratio (E/P). The energy storage costs of VRFBs are less the fixed cost of LIBs (USD 285/kWh) when the E/P ratio is greater than 3.4 h.
Energies 16 02761 g002
Figure 3. Grid search results plotted as LCOE contours. The red dot shows the lowest LCOE on the surface. Higher LCOEs are shown as yellow, and lower LCOE costs are shown as blue. All points on the grid with an LCOE greater than USD 100/kWh are white. Subplots (a,b) show the impact of solar RES rated power and tidal RES rated power on the LCOE of a system with only an LIB ESS and VRFB ESS, respectively. Subplots (c,d) show the impact on LCOE of the span of the battery controller moving average filter and the rated power of the solar and tidal RES, respectively.
Energies 16 02761 g003
Figure 4. A pie chart demonstrating the breakdown of each microgrid component’s contribution to the total system LCOE. The energy storage cost of the VRFB is the primary contributor to the LCOE. Note: Grid, VRFB error, and LIB error energy storage costs are all USD 0/MWh.
Energies 16 02761 g004
Figure 5. The simulated solar and tidal power generation and the power demand are shown in subplot (a). The energy stored in the LIB and VRFB for each hour of the year for the optimal baseline-cost microgrid with tidal and solar RES are shown in (b).
Energies 16 02761 g005
Figure 6. Results of the cost parametric study where each component cost varies from 1/10th the baseline to 2 times the baseline. Subplot (a) shows the LIB energy capacity cost variation. Subplot (b) shows the VRFB module cost variation coming primarily from the cost of the electrolyte, membrane, and electrodes. Subplot (c) shows the Solar PV RES rated power cost variation. Subplot (d) shows the Tidal RES rated power cost variation. Note: Nearly all of the LCOE is a result of the VRFB Energy, Tidal, and LIB Energy system components. Other system components are included in these calculations but account for smaller LCOE that is not visible in the graphs.
Energies 16 02761 g006
Disclaimer/Publisher’s Note: The statements, opinions and data contained in all publications are solely those of the individual author(s) and contributor(s) and not of MDPI and/or the editor(s). MDPI and/or the editor(s) disclaim responsibility for any injury to people or property resulting from any ideas, methods, instructions or products referred to in the content.

