Article

Electrochemical Insight into the Use of Microbial Fuel Cells for Bioelectricity Generation and Wastewater Treatment

1
Department of Chemical Engineering, University of Engineering and Technology Lahore (New Campus), Lahore 39021, Pakistan
2
Department of Electrical Engineering, University of Engineering and Technology Lahore (New Campus), Lahore 39021, Pakistan
3
Department of Physics, University of Engineering and Technology Lahore, Lahore 54890, Pakistan
4
Institute of Metallurgy and Materials Engineering, University of Punjab, Lahore 54590, Pakistan
5
Department of Mechanical Engineering, University of Engineering and Technology Lahore, Lahore 54890, Pakistan
6
Department of Mechanical Engineering, University of Engineering and Technology Lahore (RCET Campus), Gujranwala 52250, Pakistan
7
Department of Applied Mechanical Engineering, College of Applied Engineering, Muzahimiyah Branch, King Saud University, P.O. Box 800, Riyadh 11421, Saudi Arabia
8
Sargent Centre for Process Systems Engineering, Department of Chemical Engineering, University College London, Torrington Place, London WC1E 7JE, UK
9
Faculty of Science and Technology, Jan Dlugosz University in Czestochowa, Armii Krajowej 13/15, 42-200 Czestochowa, Poland
*
Author to whom correspondence should be addressed.
Energies 2023, 16(6), 2760; https://doi.org/10.3390/en16062760
Submission received: 18 February 2023 / Revised: 9 March 2023 / Accepted: 14 March 2023 / Published: 16 March 2023
(This article belongs to the Special Issue Recent Advancements in Microbial Fuel Cells)

Abstract

:
Microbial fuel cell (MFC) technology is anticipated to be a practical alternative to the activated sludge technique for treating domestic and industrial effluents. The relevant literature mainly focuses on developing the systems and materials for maximum power output, whereas understanding the fundamental electrochemical characteristics is inadequate. This experimental study uses a double-chamber MFC having graphite electrodes and an anion-exchange membrane to investigate the electrochemical process limitations and the potential of bioelectricity generation and dairy effluent treatment. The results revealed an 81% reduction in the chemical oxygen demand (COD) in 10 days of cell operation, with an initial COD loading of 4520 mg/L. The third day recorded the highest open circuit voltage of 396 mV, and the maximum power density of 36.39 mW/m2 was achieved at a current density of 0.30 A/m2. The electrochemical impedance spectroscopy analysis disclosed that the activation polarization of the aerated cathode was the primary factor causing the cell’s resistance, followed by the ohmic and anodic activation overpotentials.

1. Introduction

Wastewater is an undesired byproduct of human development, and it contains varying levels of organic and inorganic matter that can cause serious health, economic, and environmental loss if left untreated. Currently deployed industrial wastewater treatment practices, including activated sludge process, membrane-based technology, and the advanced oxidation process, primarily rely on removing organic and inorganic matters to meet the wastewater discharge standards. The World Bank estimates that water-related illnesses account for roughly 21% of communicable diseases in India. The microbial populations found in wastewater treatment plants typically includes bacteria, viruses, protozoa, and helminths [1]. As a result of increased urbanisation and industrialization, large volumes of wastewater are being produced and continuously being used for irrigation.
Furthermore, over the past few decades, wastewater has been converted into valuable resources compared to the previous literal consideration of waste [2]. The authors discussed technologies that could reclaim water of high enough quality to serve as a potable supply. Gude et al. also underlined the possibility of using wastewater to recover potable quality water [3]. Wastewater can also be used in adsorption, cooling, and desalination systems [4,5]. Seawater is currently the most significant source of water utilised in the desalination process. This is followed by the treatment of brine derived from deep stratum, river, and wastewater sources [6].
The organic content contained in the wastewater can be converted into energy, chemicals, and biofuels by adopting an appropriate conversion technology. Microbial fuel cells (MFCs) are a electrochemical system that converts chemical energy stored in organic matter directly into electrical energy using microorganisms [7]. These systems are based on the concept of exoelectrogenic bacteria capable of transferring electrons from their cell membranes to extracellular electron acceptors, such as electrodes in MFCs. Hence, in contrast to conventional wastewater treatment technologies, simultaneous power generation and wastewater treatment can be achieved by MFCs, which is also a unique feature of the technology. Additionally, improved conversion efficiency, low sludge formation, and low operating costs make MFCs superior to conventional wastewater treatment methods [8].
MFCs employ microorganisms as catalysts to convert organic matter into electricity under anaerobic conditions. MFCs can treat a broad range of wastewater substrates, ranging from simple substrates such as glucose to more complex effluents from various manufacturing industries such as the chemical, petroleum, pharmaceutical, and paper recycling industries [9]. When an MFC is integrated with traditional wastewater treatment processes, a synergy between the systems can be established, resulting in efficient treatment and improved resource recovery [10]. Even though the MFC system is seen as a potentially useful technology for the treatment of wastewater in a sustainable manner, there are still a number of technical and economic hurdles that need to be cleared before it can be commercialised [11]. High-performance MFC systems should ensure critical characteristics of the membrane electrode assembly (MEA). For instance, the electrodes should have high catalytic activity for redox reactions, corrosion resistivity, mechanical strength, electronic conductivity, and a low cost [12]. The anode, in particular, requires biocompatibility and a strong affinity for biofilm development.
Similarly, the ion-exchange medium should offer minimum resistance to the internal transport of ionic species. Over the past decade, technology has significantly improved in scaling up the systems and reducing costs. Although the technology is considered close to commercialization, MFC electrode electrochemistry still lacks clear understanding due to the complexity of the underlying physical, chemical, electrical, and biological processes.
The two primary materials frequently investigated for developing MFC electrodes are those with carbonaceous bases and those with metallic bases [13]. Carbon cloth, graphite fiber brush, carbon foam, carbon nanotubes, and graphene are among the carbonaceous-based electrode materials reported to display high performance. Other carbonaceous-based electrode materials reported to exhibit high performance include graphene [14,15]. Designing robust MEA materials and high-performing MFC systems requires a comprehensive understanding of the bioelectrochemistry and transport processes. In addition, the internal resistance that determines the overall cell performance comprises the ohmic resistance due to limited electronic and ionic conductivity of the MEA, activation resistance arising from the redox reaction kinetics, and diffusional resistance due to mass transport between the electrolytic solution and the electroactive sites. Quantitatively evaluating and overcoming these resistances might help in designing better MFC systems.
Several electrochemical methods including current interruption, the power density peak, the Tafel slope, and electrochemical impedance spectroscopy (EIS) are developed and used to study the effect of electrode materials, operating conditions, and cell configurations on the performance of various types of the electrochemical systems [16]. The EIS is particularly interesting here as it is a non-intrusive technique and has been demonstrated as a powerful tool to diagnose highly heterogeneous and complex systems, including fuel cells [17,18]. Through careful deconvolution of the MFC impedance spectra, it is possible to quantify the biofilm growth and limitations associated with the charge transfer, mass transfer, and double layer [19]. During the EIS method, a small sinusoidal signal moves the MFC system away from the equilibrium condition. The method then analyses how the system reacts to the perturbation while it is in a steady state. When impedance spectra are fitted with an equivalent circuit, electrical parameters including resistance and capacitance, related to various chemical and physical processes, are obtained [20].
This study is therefore undertaken to investigate the chemical and electrochemical behaviour of the MFC system using dairy effluent as the wastewater source. The dairy effluent is primarily selected in this study because of its biodegradability, ease of resource recovery, and limited knowledge of electrochemical treatment. Furthermore, if dairy effluent is left untreated, it can negatively affect the environment and human health. Some of these effects include: (1) physical, chemical, and biological contamination of the water bodies, (2) soil contamination, (3) air pollution due to the release of volatile organic compounds (VOCs), and (4) human health risk through exposure to biological contamination. This study aims to quantify the electrochemical characteristics of the MFC system, such as internal resistance, capacitance, and impedance, to understand the system’s limitations and identify potential improvements. The study also aims to evaluate the performance of the MFC system in treating dairy effluent and to assess its potential for scalability and commercialization. The MFC system used in this study has a dual-chamber assembly with activated carbon-based electrodes and an anion exchange membrane (AEM). The AEM is chosen based on its superior performance over the cation exchange membrane [21]. The natural microbes in the wastewater were grown in a controlled environment to treat the sample electrochemically. The physical and electro(-chemical) parameters were recorded for 10 days during cell operation. The study is significant as it provides valuable insights into using MFCs for treating dairy effluent and its potential for resource recovery.

2. Materials and Methods

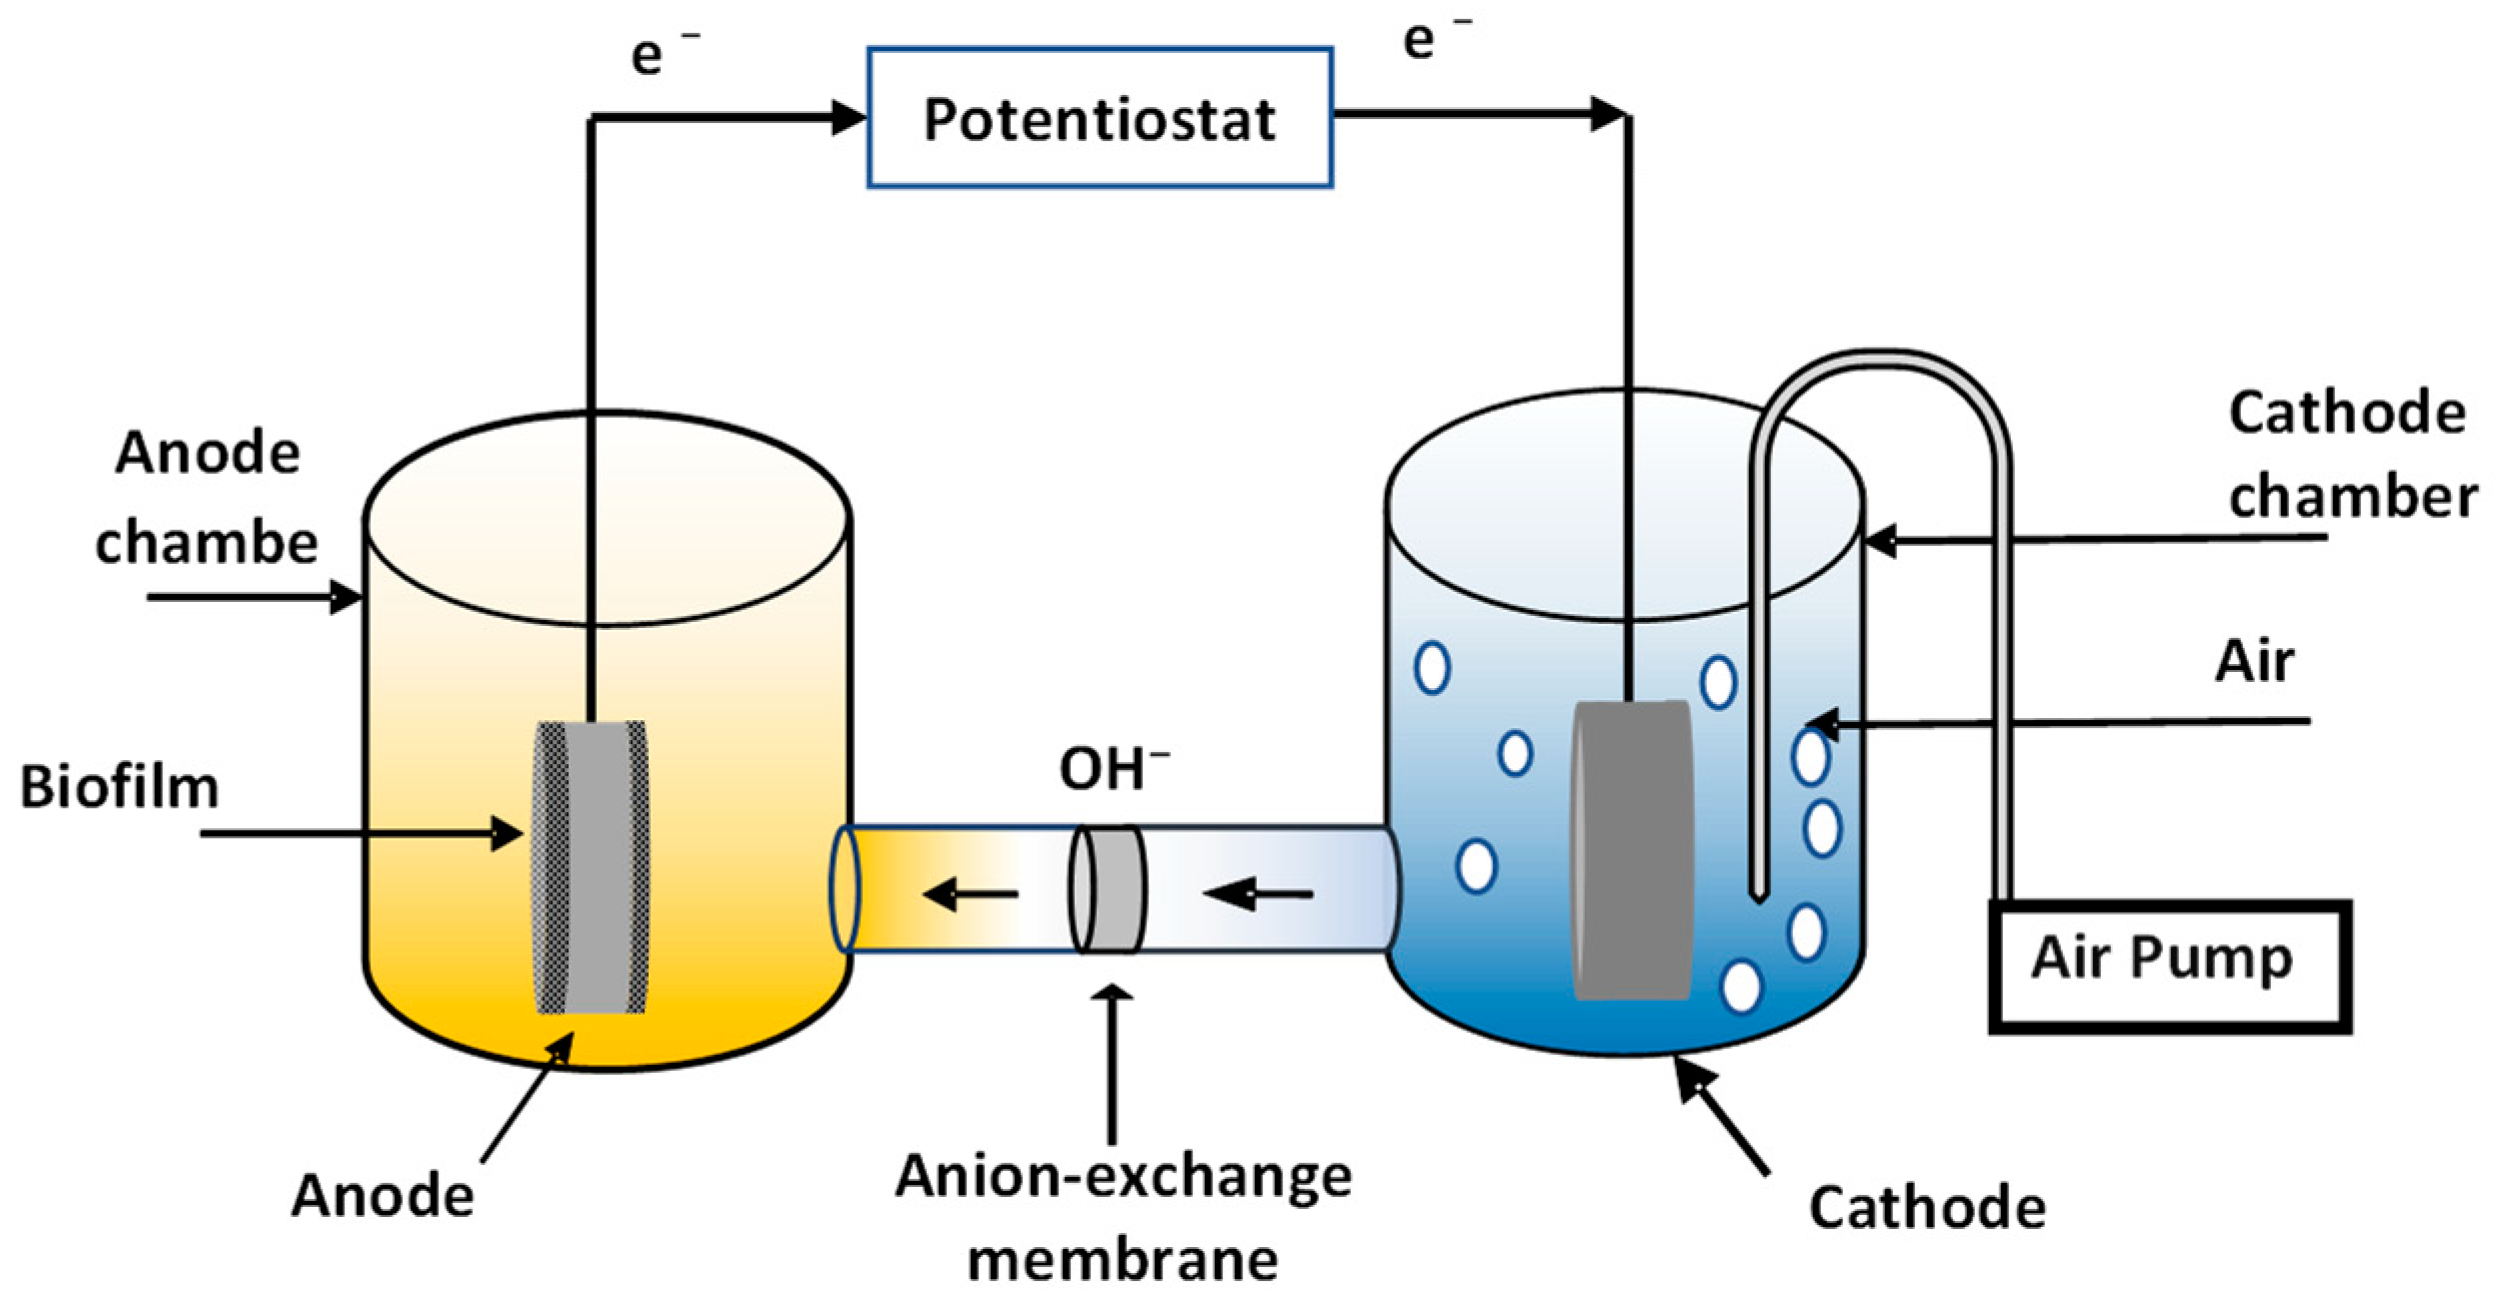
2.1. MFC Setup and Operation

A dual-chamber MFC was constructed using two containers having 0.3 L capacity each, as shown in Figure 1. The experiment involved two activated carbon electrodes, an anode with a surface area of 12 cm2, and a cathode with 15 cm2, which were externally connected to a potentiostat using copper wires.
Activated carbon was chosen for its low cost and affinity to microbes, ideal for use in wastewater treatment. In order to keep the anaerobic environment intact, the anodic chamber was sealed, while the cathode’s larger surface area favored the oxygen reduction reaction (ORR). A carbon paste was made with graphite (45 g), activated carbon (25 g), and paraffin oil (30), used as a binder. In order to eliminate any contaminants from the electrodes, an ethanol solution was used for cleaning. The anode was placed in the anolyte, and the cathode was placed in the catholyte, both of them separated by an anion-exchange membrane (AMI-7001, U.S. international).
A total of 250 mL of anolyte was prepared by mixing 10 g of cow dung and sugar in 1 L of distilled water, resulting in the COD loading of 4520 mgL−1. The cathode chamber was filled with 250 mL of phosphate buffer saline solution to increase the conductivity. Phosphate buffer is commonly used in biological and biochemical experiments to maintain a stable pH in a solution. Stable pH in the MFC is essential for microbial activity. Phosphate buffer increases the conductivity of a solution by providing ions that can carry an electrical charge, such as potassium (K+), sodium (Na+), and phosphate (PO43−). Increasing the concentration of ions in a solution increases its conductivity, which is essential to lower the ohmic resistance in the electrochemical systems. As described previously [22], the buffer solution was prepared by mixing 1.44 g Na2HPO4, 8.0 g NaCl, 0.2 g KCL, and 0.24 g KH2PO4 in distilled water. One liter anolyte solution was thus prepared.
HCl was added to the buffer solution to maintain a pH of 7.4. Fish pump was used to Aerate the cathode chamber. In order to prevent bubbles from coming into direct contact with the electrode, air was supplied close to the wall of the cathode chamber. The direct contact of the bubble with the electrode can create a barrier between the organic content and the biofilm. It can disrupt and dislodge the biofilm, thus reducing the cell’s performance. At room temperature and for a duration of 10 days, the batch mode of the MFC cycle was performed.

2.2. Chemical and Electrochemical Analysis

The wastewater treatment experiments were performed in a batch mode under ambient conditions (25 ± 3 °C). The pH and chemical oxygen demand (COD) are essential parameters in wastewater analysis because they provide information about the acidity/alkalinity of the wastewater and the amount of organic pollutants present, respectively. As described previously, pH affects the activity of microorganisms, which is crucial for the breakdown of organic matter and current generation. Conversely, COD measures the amount of oxygen required to oxidize the organic matter. Therefore the rate of change in COD value reflects the facilitated microbial activity. The pH of the substrate was measured with a pH meter from the Hanna instrument. A 2 mL anolyte sample was extracted and assessed using high-range COD vials (HI-937540) to determine the COD. A wastewater solution of 0.2 mL was added to the COD vial and subjected to the COD test tube heater at 150 °C for 120 min. The COD was measured using a COD photometer from the Hanna instrument that works on the principle of colorimetry. This method follows a redox reaction to convert the organic matter into a colored solution. The COD removal efficiency was determined as follows:
COD   Removal   Efficiency = C O D f C O D i C O D i × 100
where CODi is the initial COD value of wastewater and CODf is the COD value recorded over time.
The Gamry potentiostat (Interface 1000) was used for electrochemical characterization over a period of 10 days. A two-electrode assembly was utilized for EIS measurements, where the cathode acted as counter and reference electrode. The EIS study involved applying a sinusoidal potential with a magnitude of 10 mV within a frequency range of 100 kHz to 0.05 Hz. The Nyquist and Bode graphs were recorded to study the dynamic response of the cell. The current–voltage curve was recorded in a current range of 0 to 0.002 A and at a scan rate of 0.005 As−1. A sufficient time of at least 30 min was allowed for the system to restore equilibrium between consecutive measurements. The Gamry Echem Analyst was used to fit the EIS spectra to an electrical equivalent circuit.

3. Results

3.1. Chemical Analysis

During the 10-day operation of the cell, the chemical properties of the anolyte solution, such as COD and pH, were monitored. The initial COD value was 4520 mg L−1, which decreased to 850 mg L−1 after 10 days due to microbial utilization, resulting in a removal percentage of 81%. This removal efficiency is comparable to that of MFCs operated with domestic and sewage wastewater [23,24]. The anolyte pH decreased from 7.62 to 5.8 suggesting a shift towards acidic behavior, which is expected due to the electrochemical oxidation process. This phenomenon is common in bioelectrochemical systems where the acidic environment is generated in the anolyte during the oxidation of organic matter.

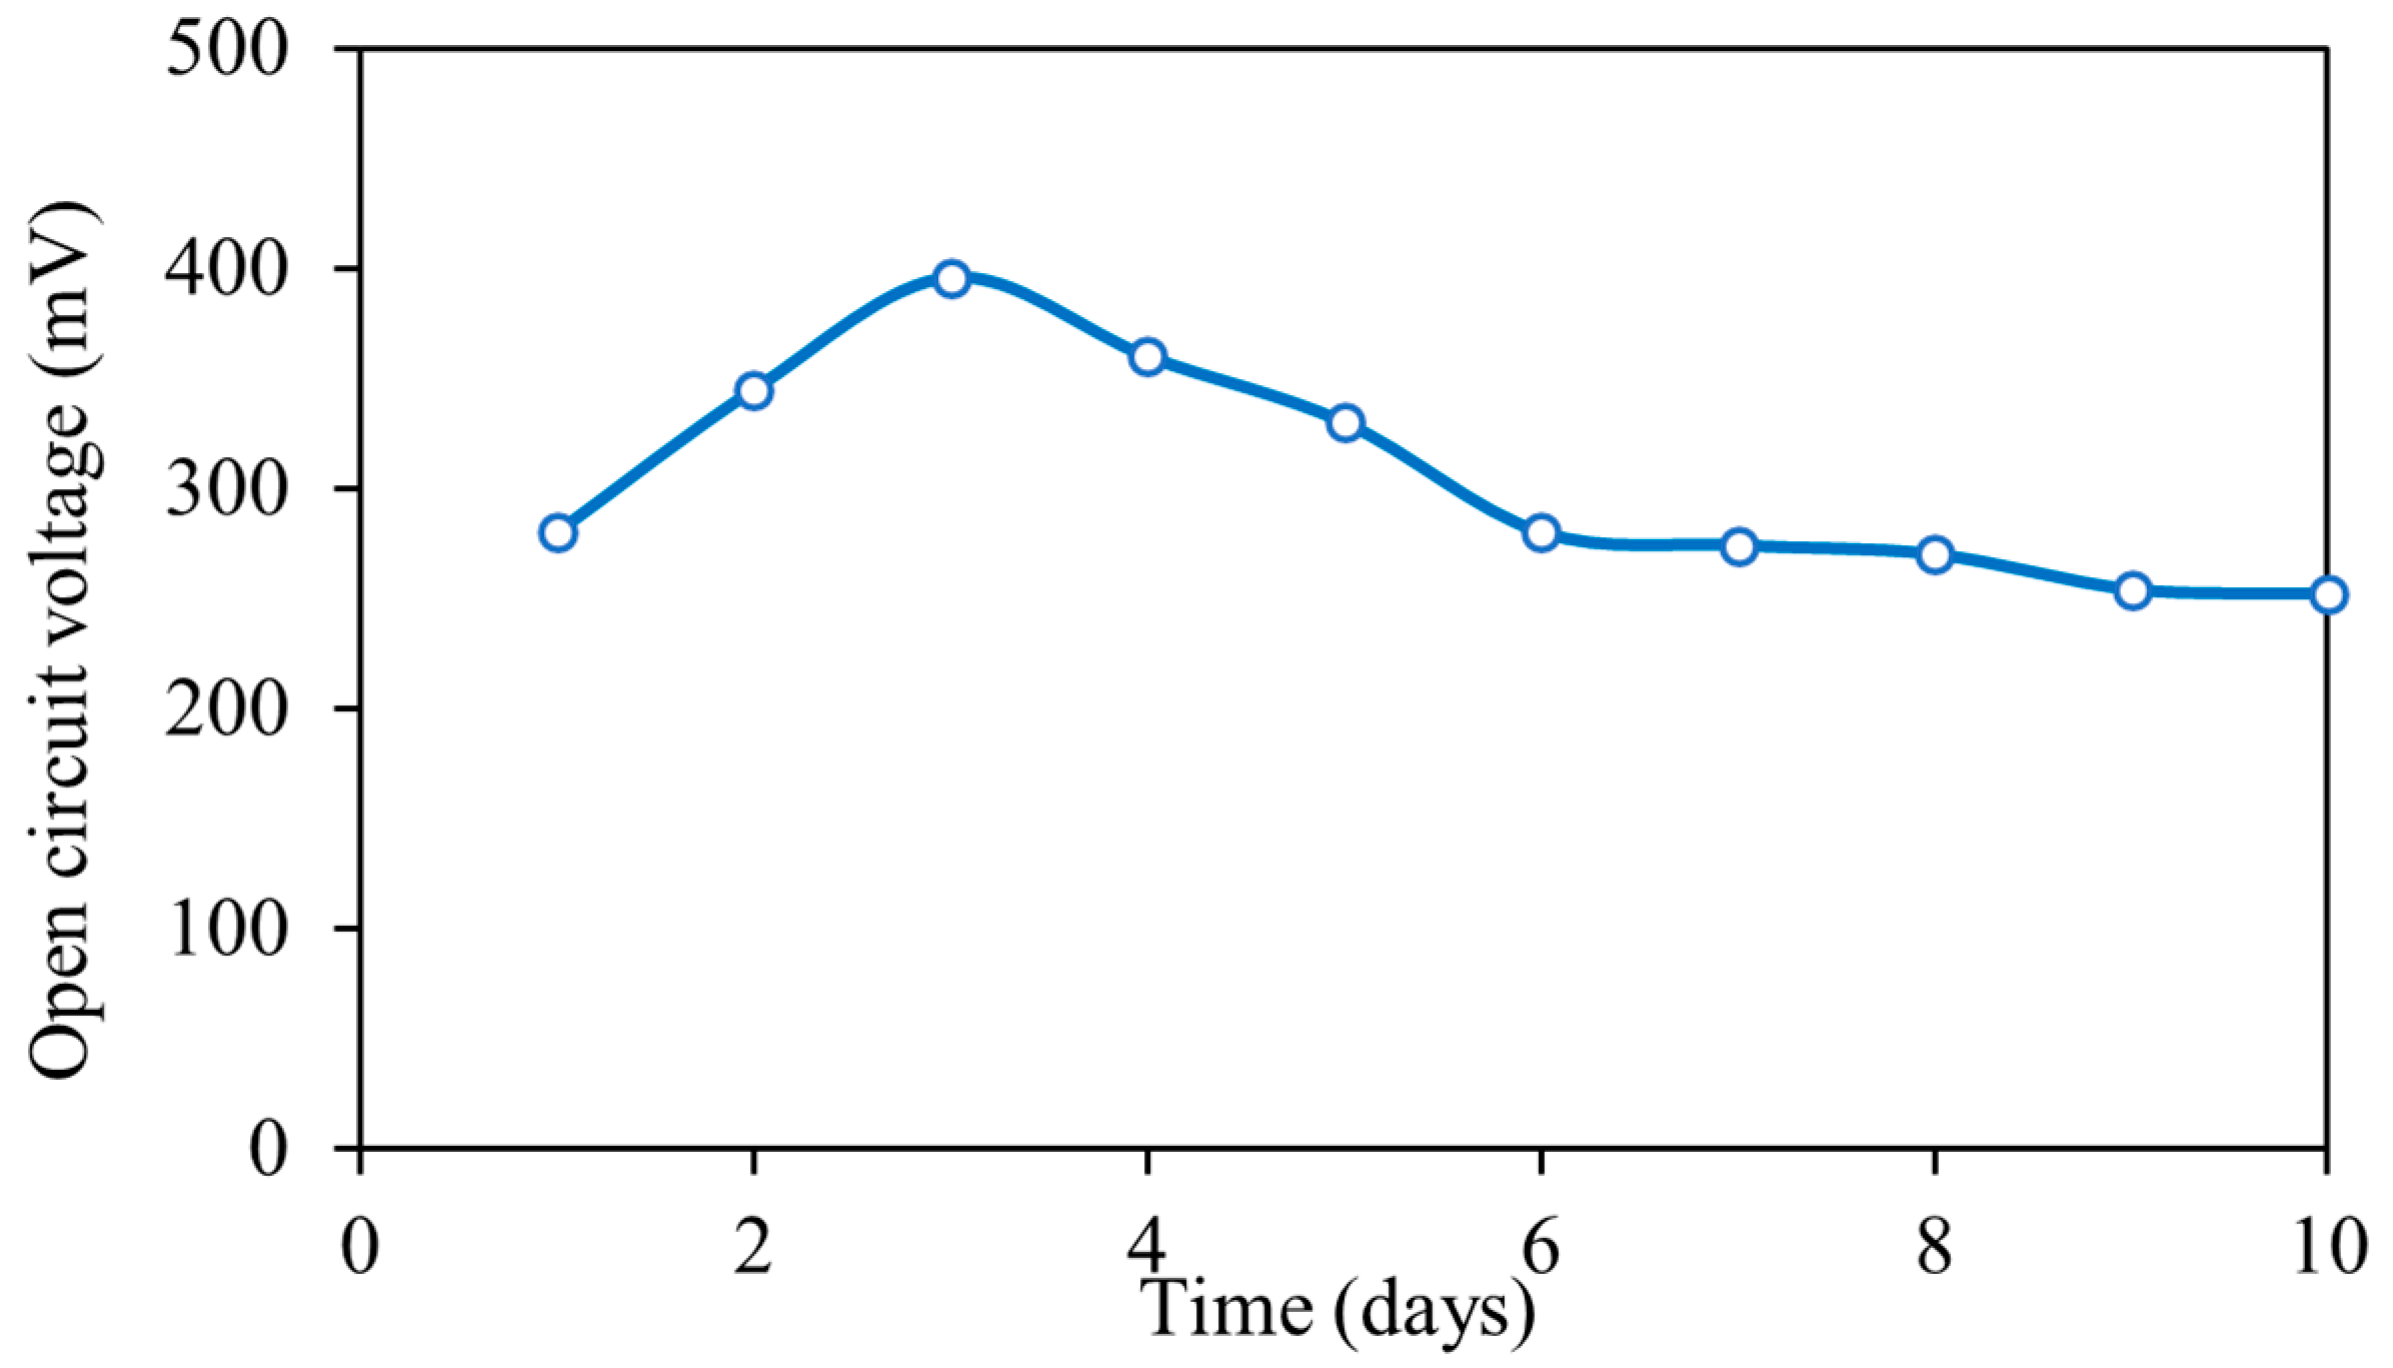
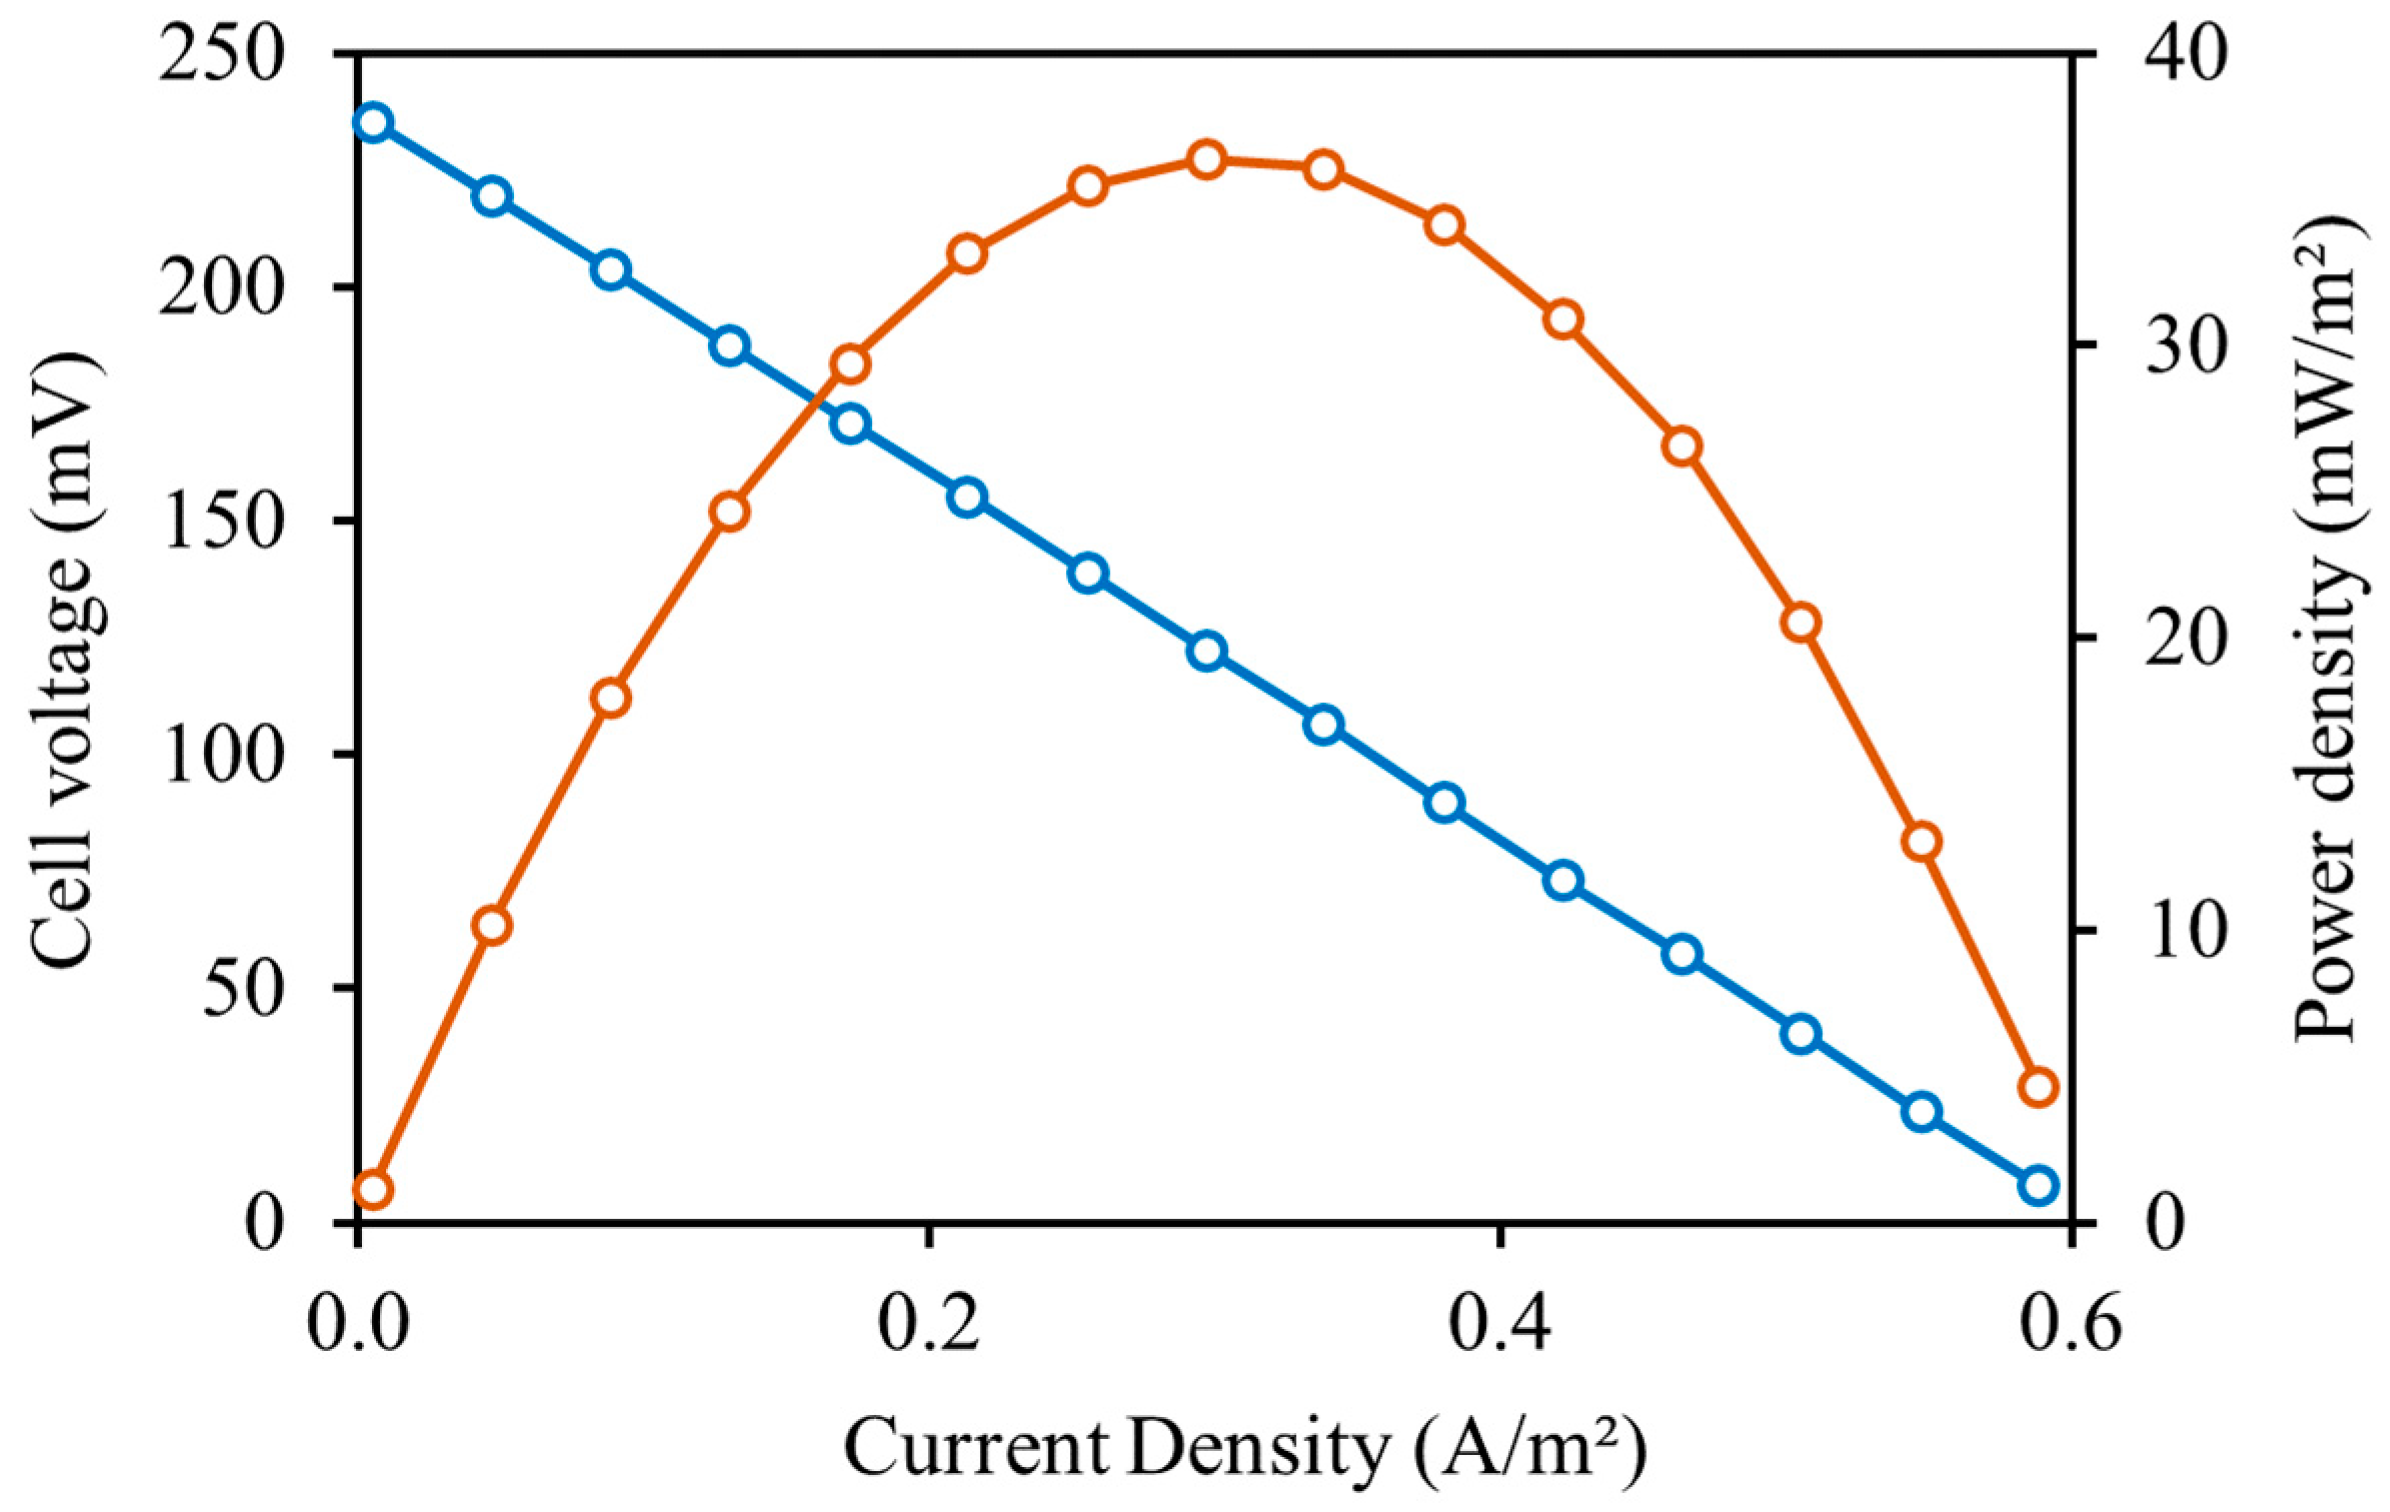
3.2. Open Circuit Voltage and Polarization Study

The open circuit voltage (OCV) recorded for 10 days is given in Figure 2. At first, the OCV increased from 280 mV all the way up to a peak value of 396 mV on the third day, and began to decrease gradually after that. The growth of biofilm on the anode surface can be credited with the initial increase in OCV. However, the decline in OCV after the third day could be due to the consumption of organic matter under anaerobic conditions and/or reactant species’ potential crossover. These findings are consistent with previous research conducted by Sathishkumar et al. [25], who reported a similar initial rise in OCV until the 5th day. The peak OCV is comparable to values that have been reported in the past. This implies the metabolism of organic materials by microbes as well as biofilm formation on the anode. When compared to day 1, the OCV decreased by less than 10% on day 10.
Figure 3 indicates the cell performance against the current density recorded on day 3 after biofilm development. The cell voltage decreases monotonically with an increase in load, a classical scenario kinetic limitation, which is not observed in this case, confirming the prevalence role of the ohmic loss observed during fuel cell operation. A sharp decrease in the cell voltage at low current density is attributed to multiple factors, including ion-exchange membranes, electrodes, electrolyte solution, and bacterial metabolism [26]. The ohmic resistance determined from the polarization resistance is 325.3 Ω. In addition, the highest power density was determined to be 36.39 mW/m2 when the current density was 0.30 A/m2. Power density in the range of mW/m2 to several W/m2 has been reported in the MFC literature with varying MEA materials, MFC designs, substrates, and operating a rapid increase in the capacitance represented by the constant phase element (CPE1). This finding can be explained by biofilm formation on the anode’s surface, which reduces the activation barrier and speeds up the kinetics of the bioelectrochemical reactions. The biofilm develops a large surface area of the conductive layer that grows surface charge, increasing the double-layer capacitance. The MFC literature reports this trend frequently [27]. The performance of selected literature-based MFC systems having dual chamber assembly, carbon-based electrodes, and complex wastewater substrates is shown in Table 1. The OCV values achieved in the studies range from 0.12 V to 0.7 V, indicating that there is still room for improvement in the MFC performance. The COD removal efficiency achieved in the studies ranges from 71% to 94%, demonstrating the potential of MFCs for pollutant removal. The peak power densities in the studies range from 6.73 mW/m2 to 124 mW/m2, with the highest values achieved using brewery wastewater and carbon fiber paper electrodes. The OCV and peak power density observed in the present study are consistent with the values found in the literature; however, an improvement is required for the commercial application of the MFC technology.

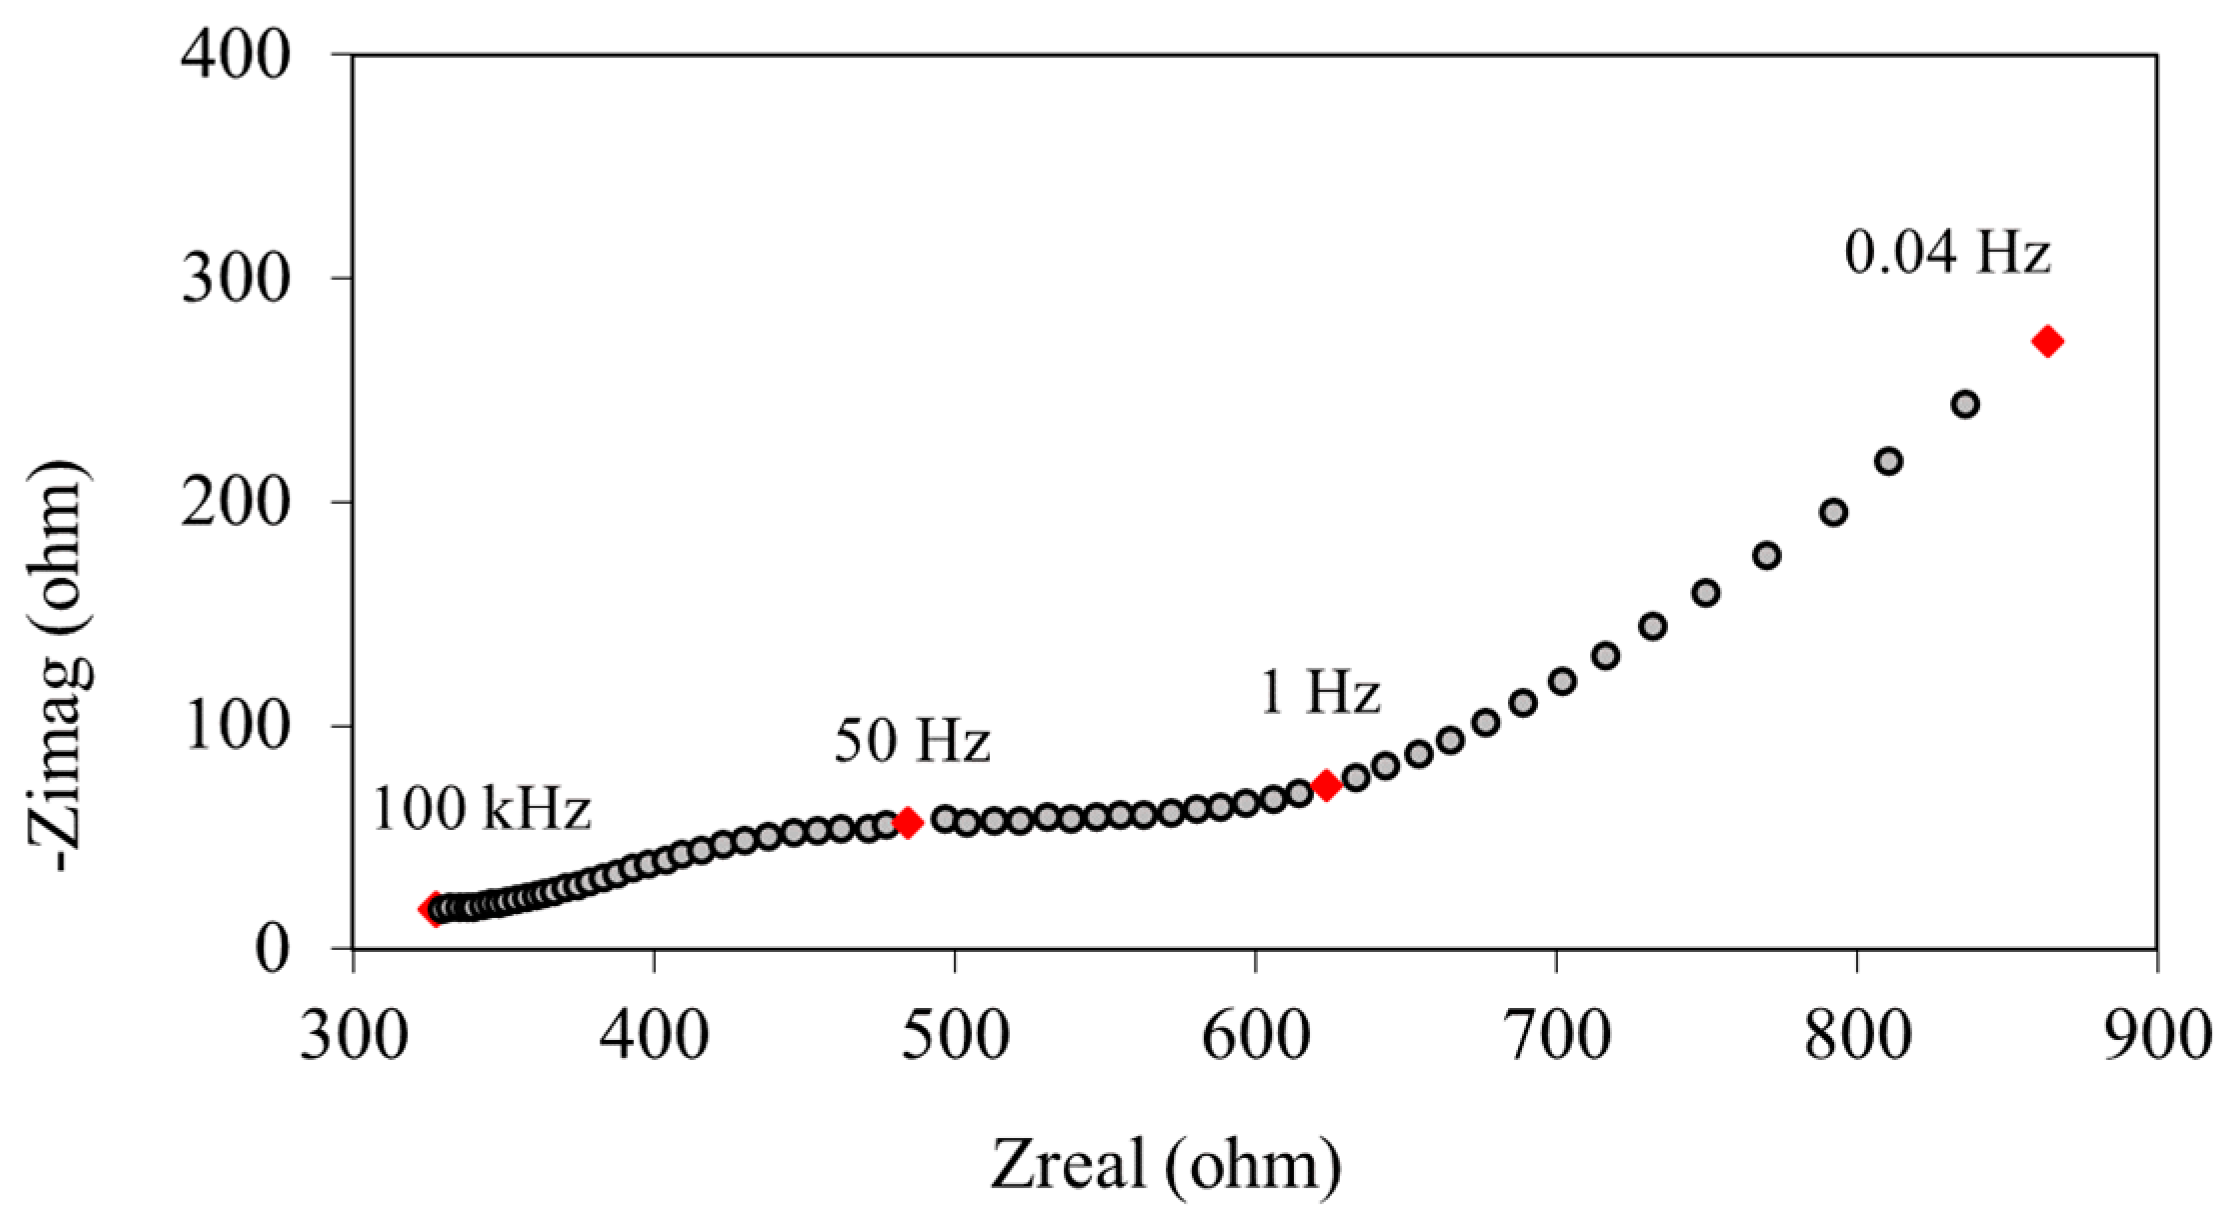
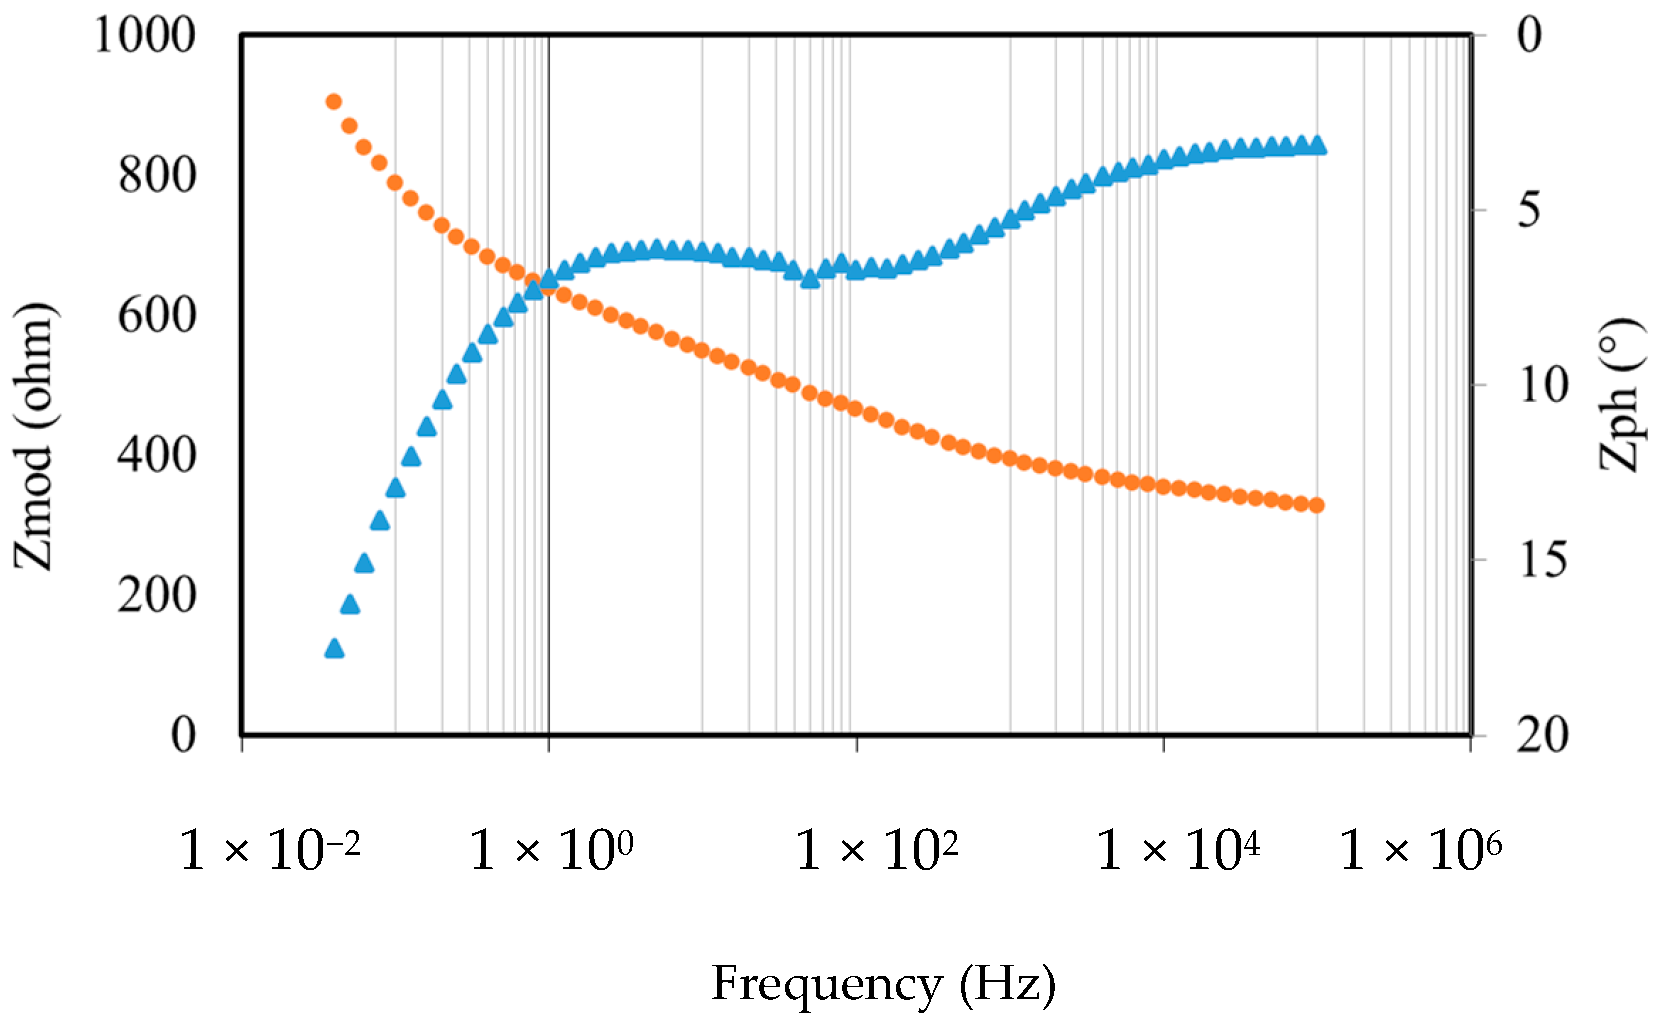
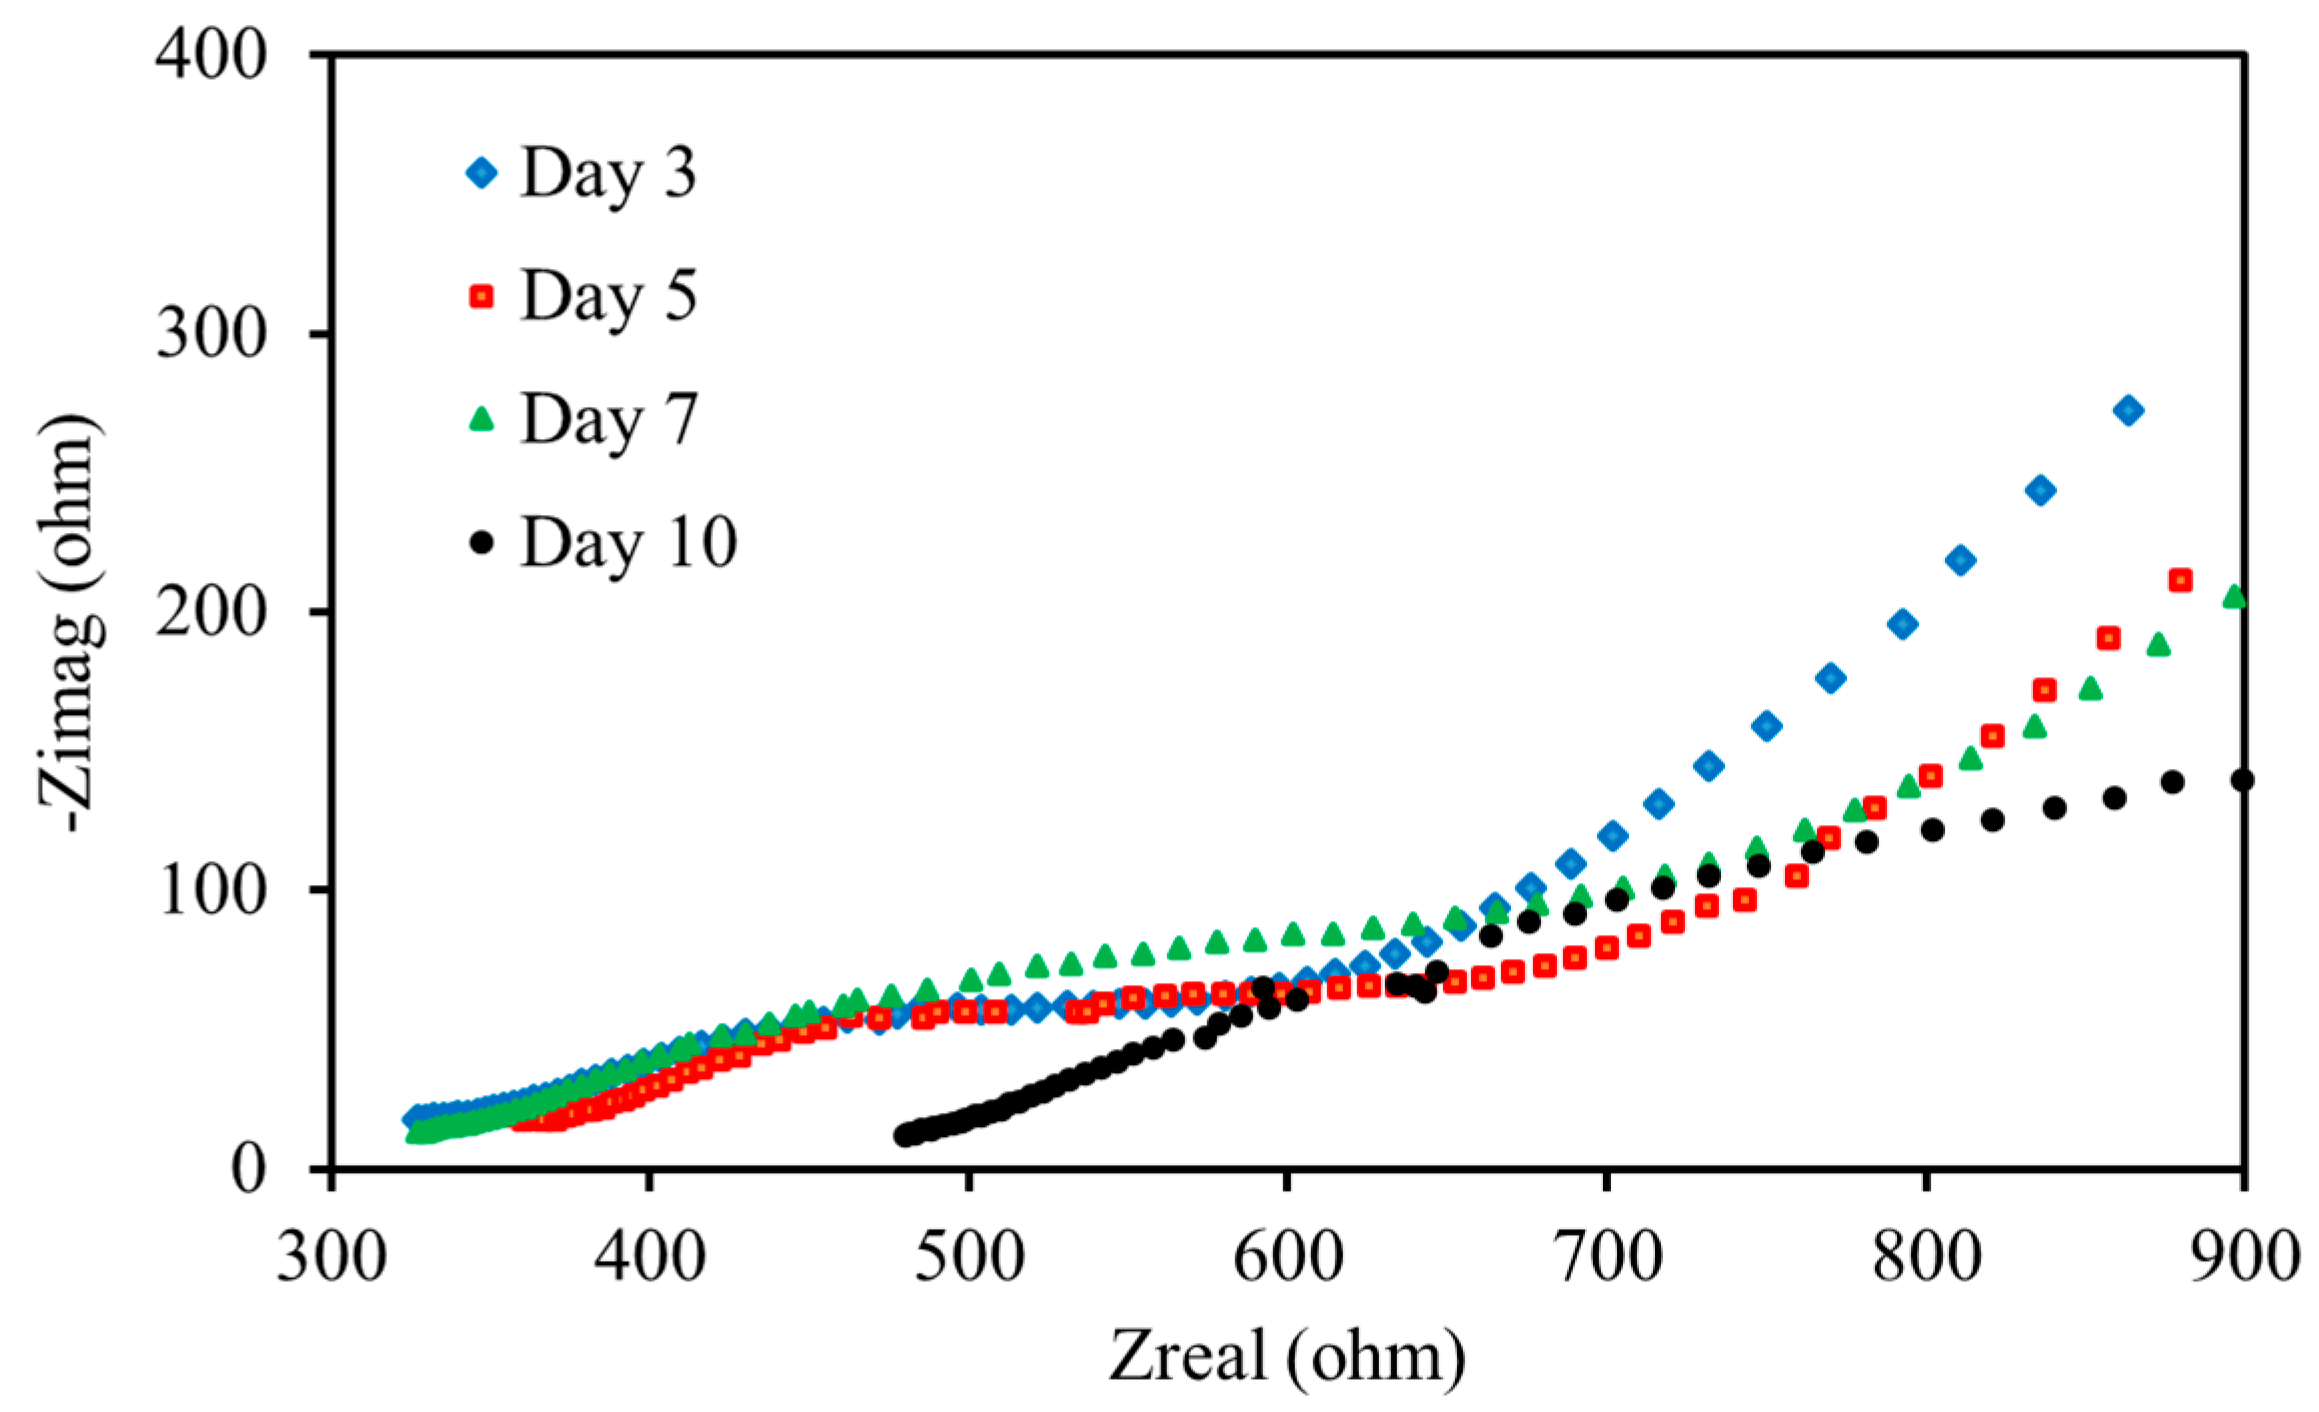
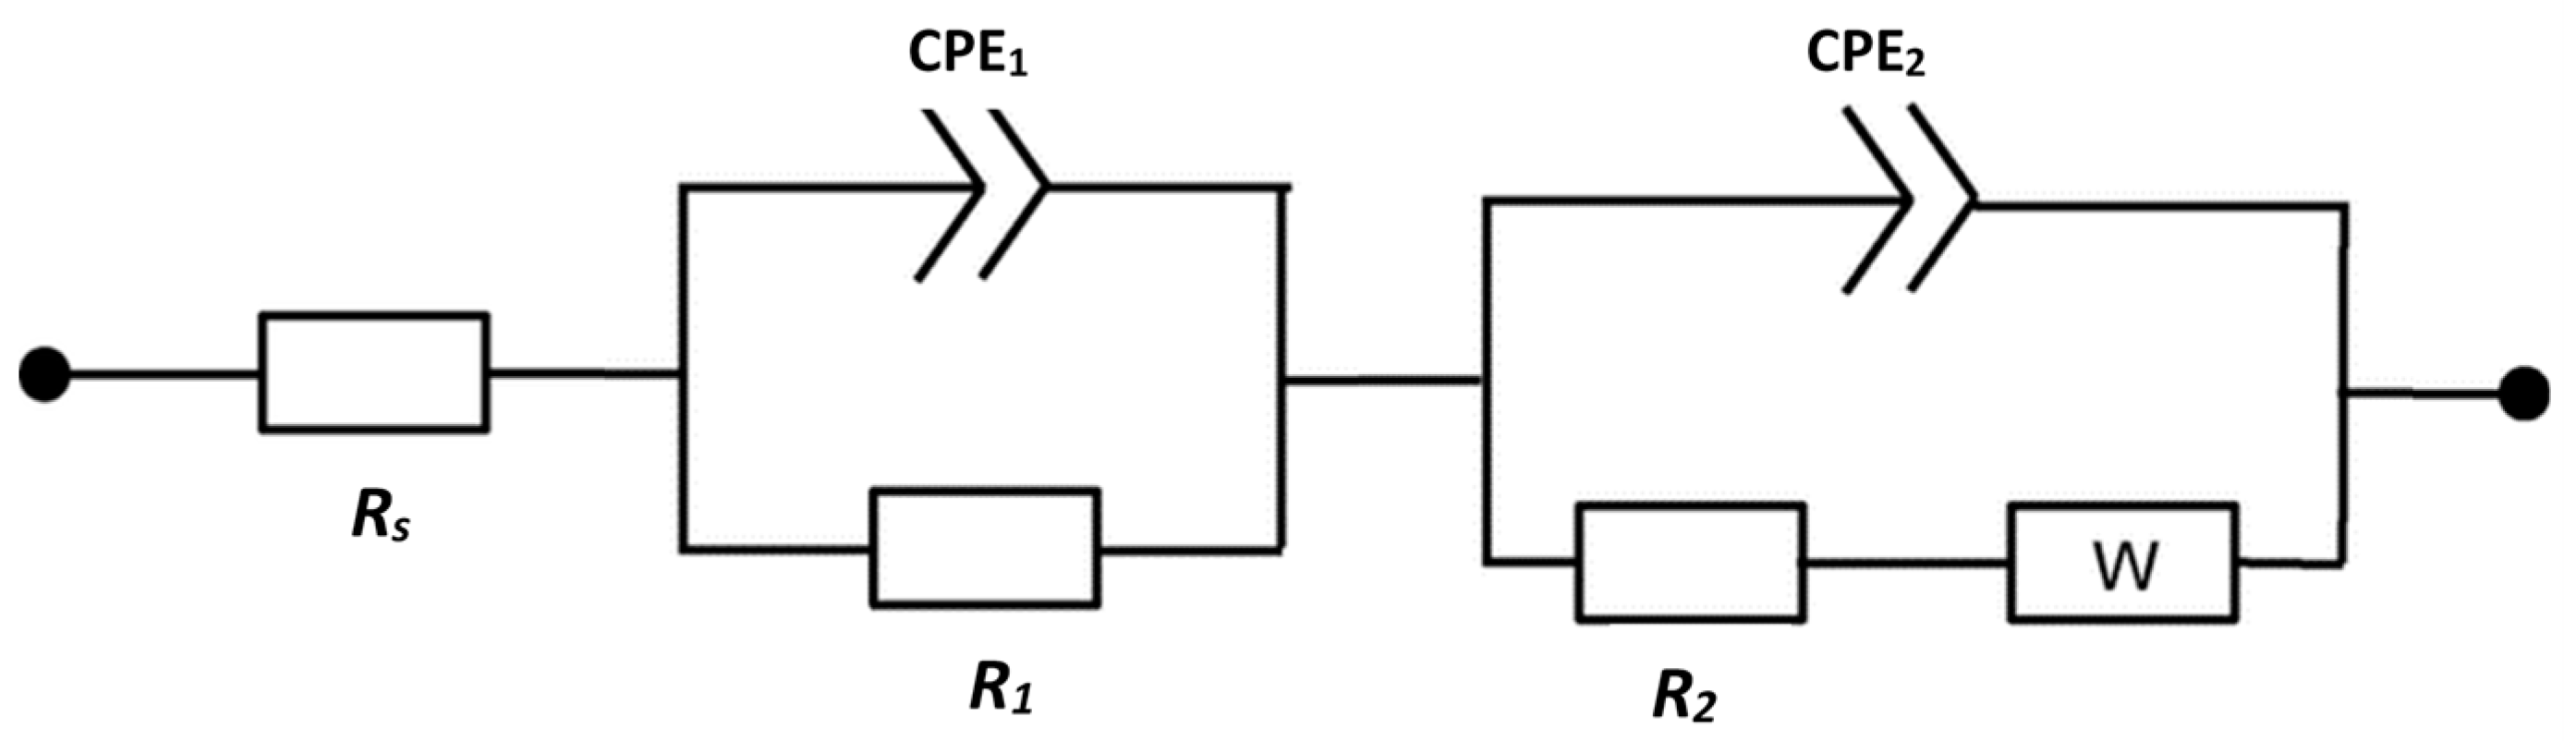
3.3. Electrochemical Impedance Spectroscopy (EIS)

To examine the electrodes’ dynamic response, impedance spectroscopy was carried out. Figure 4 displays the Nyquist plot on day 3, while Figure 5 shows the corresponding Bode plot. Three different time constants can be observed from both plots. The first arc is observed at a higher frequency, ranging from 100 kHz to 50 Hz. The second arc is located at intermediate frequency, ranging from 50 Hz to 1 Hz, while the third arc appears at a low frequency, ranging from 1 Hz to 0.04 Hz. The total cell impedance comprises several constituent processes that can be characterized by the relaxation time and primarily includes bioelectrochemical reactions, mass and charge transport inside the cell configuration, and the double layer developed at the interfaces. The arcs observed at high and intermediate frequencies are believed to stem from the electrode processes, with the anodic and cathodic charge transfer processes being responsible for each, respectively. Meanwhile, the low-frequency arc, which occurs at an angle of approximately 45° on the complex plane, suggests mass transport limitation and can be attributed to the diffusional process [18,20].
The impedance response of the cell as recorded on days 3, 5, 7, and 10 of operation is compared in Figure 6. The figure shows that the ohmic resistance increases over time. A suitable equivalent electrical circuit with resistive and capacitive components was fitted to spectra to measure specific processes’ contribution to the total resistance. The equivalent circuit model (Rs (R1CPE1) (R2CPE2W)), also shown in Figure 7, was used for fitting, and the fitted parameters are given in Table 2. The circuit is similar to the one proposed by Littfinski et al. [16]. In the electrical circuit, the whole internal ohmic resistance that results from the membrane and electrolyte solution is denoted by the symbol Rs. R1 is the charge transfer resistance of the anode, and R2 is the charge transfer resistance of the cathode. The constant phase elements (CPE1 and CPE2) are used here instead of pure capacitors because of the bioelectrodes’ porous nature and the system’s distributed capacitive response. These elements are connected to the double-layer capacitances that are generated at the bio-anode/anolyte and cathode/catholyte interfaces. The Warburg element provides mass transport limitation resulting from ionic diffusion (W). Using the Echem Analyst to fit the impedance spectra to the circuit model can quantify these critical parameters affecting MFC performance.
It can be viewed from Table 2 that anodic polarization resistance (R1) decreased during 10 days of cell operation by over 34% from 139.2 Ω to 91.5 Ω. The decrease in anodic polarization resistance observed in the experiment can be attributed to the biofilm development at anode surface, which facilitates the electrochemical reactions and improves the performance of the MFC. Ramasamy et al. [34] found that the anodic polarization resistance dropped by 40% (at 0.27 A/m2), and the power density rose by 120% from day one to day five. Borole et al. [35] also reported a significant decrease of 75% (at 2.63 A/m2) in the anodic polarization resistance after 70 days of operation. Similarly, Sindhuja et al. [19] reported a reduction of approximately 40% in the anodic polarization resistance and capacitance during the first nine days of cell operation. We observed a drop of around 34% in the anodic polarization resistance in just 10 days.
Additionally, the anolyte pH decreased from 7.62 to 5.8 over the same period. It is known that biofilm acidification (pH < 7) can inhibit microbial activity and inhibits the rate of bioelectrochemical reactions [36,37]. However, this phenomenon is not observed in this work, most likely due to the developing microbial film.
Over time, the cathode capacitance gradually increases, which may be due to the buildup of protons on the cathode surface. Table 2 shows the Warburg element (W), which is inversely related to the diffusion coefficients. The coefficient value increases over time, indicating increased resistance to diffusion. This is commonly observed in aerated cathode due to oxygen diffusion in the catholyte [18]. Therefore, the difficulty of oxygen solubilization and later diffusion to cathode surface is probably related to the cathode diffusional resistance found in our study.
For the 10 days of cell operation, a consistent resistive contribution order is observed with R2 > Rs > R1. The maximum contribution to the overall cell resistance is from the cathodic polarization resistance, followed by the ohmic and anodic polarization resistance. This dominance of cathodic polarization resistance has been observed and reported in previous studies [19,36,38]. Although the dominance of ohmic resistance is reported as well [34,39,40], this is not the case for anodic polarization resistance in practical MFC systems. The fact that the value of ohmic resistance obtained in this study is comparable to values that have been reported in the past demonstrates that the electrochemical system has reasonable conductivity.

4. Conclusions

The current investigation focuses on the remediation of wastewater from dairy farms while simultaneously generating power with microbial fuel cell technology. As well as physical and chemical characterization, the dual-chamber MFC operation was analyzed in detail regarding electrochemical characteristics to understand the process limiting factors. The MFC produced the maximum open-circuit voltage of 396 mV and power density of 36.39 mW/m2 corresponding to 0.30 A/m2. As a result of cell operation for 10 days, the chemical oxygen demand was reduced by 81%, along with a considerable change in the anolyte pH value. The key limiting factors, including electrolyte ohmic overpotential, activation overpotential, and concentration overpotential, were studied using electrochemical impedance spectroscopy. The cathodic polarization was found to cause the highest value in the overall cell overpotential, suggesting that an intelligent selection and design of the cathode is the key to the development of MFC technology.
While this study has demonstrated promising results regarding integrating microbial fuel cell technology in the treatment of dairy farm wastewater, future studies should consider designing better cathode materials and improving the cathode design, cell operation, and characterization for an extended time using field samples, economic evaluation, and scalability of the MFC systems. Further, the MFC design and operation can be optimized by methods such as fuzzy-logic-based approach [41,42,43], which is one of the most popular approaches to artificial intelligence.

Author Contributions

Conceptualization, A.N.T. and M.I.; methodology, A.N.T. and M.A.H.; software, A.N.T. and S.R.; validation, A.N.T., M.U. and T.N.C.; formal analysis, A.N.T., I.F., Y.F., W.M.A. and J.K.; investigation, S.R., A.N.T. and I.F.; resources, M.U., T.N.C. and Y.F.; data curation, A.N.T. and I.F.; writing—original draft preparation, A.N.T. and M.I.; writing—review and editing, M.A.H., M.U., Y.F., J.K. and W.M.A.; visualization, A.N.T. and T.N.C.; supervision, A.N.T.; project administration, A.N.T.; funding acquisition, A.N.T., Y.F., J.K. and W.M.A. All authors have read and agreed to the published version of the manuscript.

Funding

Authors are thankful to the Researchers Supporting Project number (RSPD2023R698), King Saud University, Riyadh, Saudi Arabia, for funding this research work. Higher education Commission (HEC) Pakistan for funding this work through National Research Program for Universities (NRPU # 9594). The authors declare no conflict of interest. The authors state that there are no competing interests involved.

Data Availability Statement

Not applicable.

Acknowledgments

Authors would like to acknowledge the CERAD and Samina Akbar for experimentation facilities.

Conflicts of Interest

The authors declare no conflict of interest.

References

  1. Rajasulochana, P.; Preethy, V. Comparison on Efficiency of Various Techniques in Treatment of Waste and Sewage Water—A Comprehensive Review. Resour. Technol. 2016, 2, 175–184. [Google Scholar] [CrossRef] [Green Version]
  2. Kehrein, P.; Van Loosdrecht, M.; Osseweijer, P.; Garfí, M.; Dewulf, J.; Posada, J. A Critical Review of Resource Recovery from Municipal Wastewater Treatment Plants-Market Supply Potentials, Technologies and Bottlenecks. Environ. Sci. Water Res. Technol. 2020, 6, 877–910. [Google Scholar] [CrossRef] [Green Version]
  3. Gude, V.G.; Nirmalakhandan, N.; Deng, S. Sustainable low temperature desalination: A case for renewable energy. J. Renew. Sustain. Energy 2011, 3, 043108. [Google Scholar] [CrossRef]
  4. Sztekler, K.; Kalawa, W.; Nowak, W.; Mika, L.; Gradziel, S.; Krzywanski, J.; Radomska, E. Experimental Study of Three-Bed Adsorption Chiller with Desalination Function. Energies 2020, 13, 5827. [Google Scholar] [CrossRef]
  5. Sztekler, K.; Kalawa, W.; Nowak, W.; Mika, Ł.; Krzywański, J.; Grabowska, K.; Sosnowski, M.; Al-Harbi, A.A. Performance Evaluation of a Single-Stage Two-Bed Adsorption Chiller With Desalination Function. J. Energy Resour. Technol. 2021, 143, 082101. [Google Scholar] [CrossRef]
  6. Qiu, B.; Gorgojo, P.; Fan, X. Adsorption desalination: Advances in porous adsorbents. Chin. J. Chem. Eng. 2022, 42, 151–169. [Google Scholar] [CrossRef]
  7. Slate, A.J.; Whitehead, K.A.; Brownson, D.A.; Banks, C.E. Microbial fuel cells: An overview of current technology. Renew. Sustain. Energy Rev. 2019, 101, 60–81. [Google Scholar] [CrossRef]
  8. Choudhury, P.; Uday, U.S.P.; Mahata, N.; Nath Tiwari, O.; Narayan Ray, R.; Kanti Bandyopadhyay, T.; Bhunia, B. Performance Improvement of Microbial Fuel Cells for Waste Water Treatment along with Value Addition: A Review on Past Achievements and Recent Perspectives. Renew. Sustain. Energy Rev. 2017, 79, 372–389. [Google Scholar] [CrossRef]
  9. Javed, M.M.; Nisar, M.A.; Ahmad, M.U.; Yasmeen, N.; Zahoor, S. Microbial Fuel Cells as an Alternative Energy Source: Current Status. Biotechnol. Genet. Eng. Rev. 2018, 34, 216–242. [Google Scholar] [CrossRef] [PubMed]
  10. Do, M.H.; Ngo, H.H.; Guo, W.S.; Liu, Y.; Chang, S.W.; Nguyen, D.D.; Nghiem, L.D.; Ni, B.J. Challenges in the Application of Microbial Fuel Cells to Wastewater Treatment and Energy Production: A Mini Review. Sci. Total Environ. 2018, 639, 910–920. [Google Scholar] [CrossRef] [PubMed]
  11. Kumar, R.; Singh, L.; Zularisam, A.W.; Hai, F.I. Microbial Fuel Cell Is Emerging as a Versatile Technology: A Review on Its Possible Applications, Challenges and Strategies to Improve the Performances. Int. J. Energy Res. 2018, 42, 369–394. [Google Scholar] [CrossRef] [Green Version]
  12. Sharif, H.M.A.; Farooq, M.; Hussain, I.; Ali, M.; Mujtaba, M.A.; Sultan, M.; Yang, B. Recent Innovations for Scaling up Microbial Fuel Cell Systems: Significance of Physicochemical Factors for Electrodes and Membranes Materials. J. Taiwan Inst. Chem. Eng. 2021, 129, 207–226. [Google Scholar] [CrossRef]
  13. Santoro, C.; Arbizzani, C.; Erable, B.; Ieropoulos, I. Microbial Fuel Cells: From Fundamentals to Applications. A Review. J. Power Sources 2017, 356, 225–244. [Google Scholar] [CrossRef]
  14. Li, S.; Cheng, C.; Thomas, A. Carbon-Based Microbial-Fuel-Cell Electrodes: From Conductive Supports to Active Catalysts. Adv. Mater. 2017, 29, 1602547. [Google Scholar] [CrossRef]
  15. Call, T.P.; Carey, T.; Bombelli, P.; Lea-Smith, D.J.; Hooper, P.; Howe, C.J.; Torrisi, F. Platinum-Free, Graphene Based Anodes and Air Cathodes for Single Chamber Microbial Fuel Cells. J. Mater. Chem. A 2017, 5, 23872–23886. [Google Scholar] [CrossRef] [Green Version]
  16. Littfinski, T.; Nettmann, E.; Gehring, T.; Krimmler, S.; Heinrichmeier, J.; Murnleitner, E.; Lübken, M.; Pant, D.; Wichern, M. A Comparative Study of Different Electrochemical Methods to Determine Cell Internal Parameters of Microbial Fuel Cells. J. Power Sources 2021, 494, 229707. [Google Scholar] [CrossRef]
  17. Tabish, A.N.; Patel, H.C.; Aravind, P.V. Electrochemical Oxidation of Syngas on Nickel and Ceria Anodes. Electrochim. Acta 2017, 228, 575–585. [Google Scholar] [CrossRef]
  18. Sekar, N.; Ramasamy, R.P. Electrochemical Impedance Spectroscopy for Microbial Fuel Cell Characterization. J. Microb. Biochem. Technol. 2013, 5, 215–219. [Google Scholar] [CrossRef] [Green Version]
  19. Sindhuja, M.; Sudha, V.; Harinipriya, S. Insights on the Resistance, Capacitance and Bioelectricity Generation of Microbial Fuel Cells by Electrochemical Impedance Studies. Int. J. Hydrogen Energy 2019, 44, 5428–5436. [Google Scholar] [CrossRef]
  20. Sindhuja, M.; Kumar, N.S.; Sudha, V.; Harinipriya, S. Equivalent Circuit Modeling of Microbial Fuel Cells Using Impedance Spectroscopy. J. Energy Storage 2016, 7, 136–146. [Google Scholar] [CrossRef]
  21. López Zavala, M.Á.; Torres Delenne, P.R.; González Peña, O.I. Improvement of Wastewater Treatment Performance and Power Generation in Microbial Fuel Cells by Enhancing Hydrolysis and Acidogenesis, and by Reducing Internal Losses. Energies 2018, 11, 2309. [Google Scholar] [CrossRef] [Green Version]
  22. Zhang, G.D.; Zhao, Q.L.; Jiao, Y.; Zhang, J.N.; Jiang, J.Q.; Ren, N.; Kim, B.H. Improved Performance of Microbial Fuel Cell Using Combination Biocathode of Graphite Fiber Brush and Graphite Granules. J. Power Sources 2011, 196, 6036–6041. [Google Scholar] [CrossRef]
  23. Logan, B.; Liu, H.; Oh, S.-E.; Min, B. Electricity From Domestic Wastewater Can Be Harvested in Microbial Fuel Cells. Proc. Water Environ. Fed. 2012, 2004, 581–585. [Google Scholar] [CrossRef]
  24. Ghangrekar, M.M.; Shinde, V.B. Simultaneous Sewage Treatment and Electricity Generation in Membrane-Less Microbial Fuel Cell. Water Sci. Technol. 2008, 58, 37–43. [Google Scholar] [CrossRef] [PubMed]
  25. Sathishkumar, K.; Narenkumar, J.; Selvi, A.; Murugan, K.; Babujanarthanam, R.; Rajasekar, A. Treatment of Soak Liquor and Bioelectricity Generation in Dual Chamber Microbial Fuel Cell. Environ. Sci. Pollut. Res. 2018, 25, 11424–11430. [Google Scholar] [CrossRef] [PubMed]
  26. Faria, A.; Gonçalves, L.; Peixoto, J.M.; Peixoto, L.; Brito, A.G.; Martins, G. Resources Recovery in the Dairy Industry: Bioelectricity Production Using a Continuous Microbial Fuel Cell. J. Clean. Prod. 2017, 140, 971–976. [Google Scholar] [CrossRef] [Green Version]
  27. Pandey, P.; Shinde, V.N.; Deopurkar, R.L.; Kale, S.P.; Patil, S.A.; Pant, D. Recent Advances in the Use of Different Substrates in Microbial Fuel Cells toward Wastewater Treatment and Simultaneous Energy Recovery. Appl. Energy 2016, 168, 706–723. [Google Scholar] [CrossRef]
  28. Huang, J.; Yang, P.; Guo, Y.; Zhang, K. Electricity Generation during Wastewater Treatment: An Approach Using an AFB-MFC for Alcohol Distillery Wastewater. Desalination 2011, 276, 373–378. [Google Scholar] [CrossRef]
  29. Tremouli, A.; Antonopoulou, G.; Bebelis, S.; Lyberatos, G. Operation and Characterization of a Microbial Fuel Cell Fed with Pretreated Cheese Whey at Different Organic Loads. Bioresour. Technol. 2013, 131, 380–389. [Google Scholar] [CrossRef]
  30. Sakdaronnarong, C.K.; Thanosawan, S.; Chaithong, S.; Sinbuathong, N.; Jeraputra, C. Electricity Production from Ethanol Stillage in Two-Compartment MFC. Fuel 2013, 107, 382–386. [Google Scholar] [CrossRef]
  31. Ma, D.; Jiang, Z.H.; Lay, C.H.; Zhou, D. Electricity Generation from Swine Wastewater in Microbial Fuel Cell: Hydraulic Reaction Time Effect. Int. J. Hydrogen Energy 2016, 41, 21820–21826. [Google Scholar] [CrossRef]
  32. Fangzhou, D.; Zhenglong, L.; Shaoqiang, Y.; Beizhen, X.; Hong, L. Electricity Generation Directly Using Human Feces Wastewater for Life Support System. Acta Astronaut. 2011, 68, 1537–1547. [Google Scholar] [CrossRef]
  33. Cercado-Quezada, B.; Delia, M.L.; Bergel, A. Testing Various Food-Industry Wastes for Electricity Production in Microbial Fuel Cell. Bioresour. Technol. 2010, 101, 2748–2754. [Google Scholar] [CrossRef] [Green Version]
  34. Ramasamy, R.P.; Ren, Z.; Mench, M.M.; Regan, J.M. Impact of Initial Biofilm Growth on the Anode Impedance of Microbial Fuel Cells. Biotechnol. Bioeng. 2008, 101, 101–108. [Google Scholar] [CrossRef]
  35. Borole, A.P.; Aaron, D.; Hamilton, C.Y.; Tsouris, C. Understanding Long-Term Changes in Microbial Fuel Cell Performance Using Electrochemical Impedance Spectroscopy. Environ. Sci. Technol. 2010, 44, 2740–2745. [Google Scholar] [CrossRef]
  36. He, Z.; Huang, Y.; Manohar, A.K.; Mansfeld, F. Effect of Electrolyte P.H. on the Rate of the Anodic and Cathodic Reactions in an Air-Cathode Microbial Fuel Cell. Bioelectrochemistry 2008, 74, 78–82. [Google Scholar] [CrossRef]
  37. Jung, S.; Mench, M.M.; Regan, J.M. Impedance Characteristics and Polarization Behavior of a Microbial Fuel Cell in Response to Short-Term Changes in Medium P.H. Environ. Sci. Technol. 2011, 45, 9069–9074. [Google Scholar] [CrossRef]
  38. Lepage, G.; Albernaz, F.O.; Perrier, G.; Merlin, G. Characterization of a Microbial Fuel Cell with Reticulated Carbon Foam Electrodes. Bioresour. Technol. 2012, 124, 199–207. [Google Scholar] [CrossRef] [PubMed]
  39. Liang, P.; Huang, X.; Fan, M.Z.; Cao, X.X.; Wang, C. Composition and Distribution of Internal Resistance in Three Types of Microbial Fuel Cells. Appl. Microbiol. Biotechnol. 2007, 77, 551–558. [Google Scholar] [CrossRef]
  40. You, S.; Zhao, Q.; Zhang, J.; Jiang, J.; Wan, C.; Du, M.; Zhao, S. A Graphite-Granule Membrane-Less Tubular Air-Cathode Microbial Fuel Cell for Power Generation under Continuously Operational Conditions. J. Power Sources 2007, 173, 172–177. [Google Scholar] [CrossRef]
  41. Krzywanski, J. Heat transfer performance in a superheater of an industrial CFBC using fuzzy logic-based methods. Entropy 2019, 21, 919. [Google Scholar] [CrossRef] [Green Version]
  42. Krzywanski, J.; Grabowska, K.; Sosnowski, M.; Żyłka, A.; Sztekler, K.; Kalawa, W.; Wojcik, T.; Nowak, W. Modeling of a re-heat two-stage adsorption chiller by AI approach. In MATEC Web of Conferences; EDP Sciences: Les Ulis, France, 2018; Volume 240, p. 05014. [Google Scholar] [CrossRef]
  43. Krzywanski, J.; Urbaniak, D.; Otwinowski, H.; Wylecial, T.; Sosnowski, M. Fluidized bed jet milling process optimized for mass and particle size with a fuzzy logic approach. Materials 2020, 13, 3303. [Google Scholar] [CrossRef] [PubMed]
Figure 1. Schematic representation of dual chamber MFC.
Energies 16 02760 g001
Figure 2. Open circuit voltage recorded for 10 days of cell operation.
Energies 16 02760 g002
Figure 3. Polarization and power curves of the microbial fuel cell.
Energies 16 02760 g003
Figure 4. Nyquist plot of MFC at OCV and recorded on day 3.
Energies 16 02760 g004
Figure 5. Bode plot of MFC recorded on day 3.
Energies 16 02760 g005
Figure 6. Impedance spectra of the MFC measured at different times.
Energies 16 02760 g006
Figure 7. Equivalent circuit model used for the spectra fitting.
Energies 16 02760 g007
Table 1. Comparison of the performance of selected MFC systems having dual chamber assembly, carbon-based electrodes, and complex wastewater substrates.
SubstrateAnodeCathodeOCV Max
(v)
COD Removal Efficiency
(%)
Peak Power Density
(mWm−2)
Refs.
Sewage wastewater
(0.4 g COD/L)
Graphite rodGraphite rod0.1882.76.73[24]
Brewery wastewater
(28.4 g COD/L)
Carbon fiber paperCarbon fiber paper0.6188.4124[28]
Cheese whey
(6.7 g COD/L)
Carbon paperCarbon clothNA9446[29]
Ethanol stillage
(37.8 g COD/L)
Graphite rodCarbon clothNA81.593[30]
Swine wastewater
(3.3 g COD/L)
Carbon clothCarbon cloth0.128313[31]
Human feces wastewater
(0.6 g COD/L)
Carbon paperPt-coated carbon paper0.557170.8[32]
Yogurt wastewater
(8.16 g COD/L)
Graphite feltPt mesh0.7NA53.8[33]
Dairy effluent
(4.5 g COD/L)
Activate carbonActivated carbon0.3968236.4This study
Table 2. Values of equivalent circuit parameters.
Time
(Day)
Rs
(Ω)
R1
(Ω)
R2
(Ω)
CPE
(Q1) × 106
CPE
(Q2) × 104
W
(S·s1/2) × 103
3199.2139.2281.05.143.035.39
5216.4149.7327.86.113.537.15
7237.8106.9414.549.95.627.77
10404.291.5784.9108.17.1410.0
Disclaimer/Publisher’s Note: The statements, opinions and data contained in all publications are solely those of the individual author(s) and contributor(s) and not of MDPI and/or the editor(s). MDPI and/or the editor(s) disclaim responsibility for any injury to people or property resulting from any ideas, methods, instructions or products referred to in the content.

