Article

Long-Term Outdoor Testing of Perovskite Mini-Modules: Effects of FACl Additives

1
FOSS Research Centre for Sustainable Energy, Department of Electrical and Computer Engineering, University of Cyprus, 75 Kallipoleos St., Nicosia 1678, Cyprus
2
Imec, Imo-Imomec, Thin Film PV Technology–Partner in Solliance, Thor Park 8320, 3600 Genk, Belgium
3
EnergyVille, Imo-Imomec, Thor Park 8320, 3600 Genk, Belgium
4
Department of Industrial Engineering, Imo-Imomec, Hasselt University, Martelarenlaan 42, 3500 Hasselt, Belgium
5
Department of Physics, Kuwait University, Safat 13060, Kuwait
6
Fraunhofer IKTS, Fraunhofer Institute for Ceramic Technologies and Systems, Äußere Nürnberger Str. 62, 91301 Forchheim, Germany
7
Max-Planck-Institut für die Physik des Lichts, 91058 Erlangen, Germany
8
Center for Energy, AIT Austrian Institute of Technology, Giefinggasse 2, 1210 Vienna, Austria
*
Author to whom correspondence should be addressed.
Energies 2023, 16(6), 2608; https://doi.org/10.3390/en16062608
Submission received: 30 January 2023 / Revised: 1 March 2023 / Accepted: 7 March 2023 / Published: 9 March 2023

Abstract

:
The outdoor performance monitoring of perovskite modules over 16 weeks is reported. Two different types of active perovskite layers were studied: one type contained formamidinium chloride (FACl) halide additives and the other contained no additives with the main purpose to investigate performance trends during the outdoor exposure of those type of devices. Long-term side-by-side outdoor testing of devices with and without halide additives was not implemented in the past and merits investigation in order to determine the impact of additives on perovskite performance and stability. Although the two types of modules displayed similar initial outdoor performance characteristics, their outdoor performance evolution differed. Different degradation rates between the modules with and without additives were obtained just after field installation. In particular, the modules with additives exhibited higher performance degradation under open-circuit loading conditions between current-voltage (IV) scans. Long-term monitoring of both modules recorded a reduction of the efficiency over the course of the day with subsequent recovery overnight and in many cases during the day. The relative values of performance degradation and overnight recovery were calculated over the timespan of outdoor testing and indicated dominant normalized diurnal performance degradation in one type of modules (without FACl additives) in the range between 15–20% and in the other type of modules (with additives) 5–10%. The dominant normalized performance recovery values found were 25–30% and 5–10%, respectively. Finally, dark lock-in thermography (DLIT) and Raman studies were performed on the exposed devices and revealed differences in hotspot evolution and vibrational modes between the different types of module.

1. Introduction

Perovskite solar cells (PSCs) have demonstrated outstanding performance in recent years, achieving power conversion efficiencies (PCE) as high as 25.5% with theoretical efficiencies calculated up to 31% [1]. Despite their exceptional optoelectronic properties, perovskites are sensitive to environmental conditions, such as UV light exposure [2], high temperature [3], oxygen [4] and humidity [5]. However, the biggest concern that impedes the application of PSCs and poses tremendous challenges for their commercialization is their long-term stability under operation [6]. Previous studies have shown the impact of perovskite composition [7] as well as the choice of hole-transport layer on device stability [8]. Previous reports also investigated the performance of perovskite devices at different operating conditions [9] or under simulated ambient conditions [10].
Volatile additives such as formamidinium chloride (FACl) and methylammonium chloride (MACl) have been widely used to achieve high-efficiency perovskites because they could potentially optimize the perovskite crystal formation dynamics [11,12]. Recent studies report the role of A-cation halide additives on the perovskite film stoichiometry and its correlation to the device performance and operational stability [13]. Furthermore, perovskite films modified with FACl exhibited longer lifetimes in time-resolved photoluminescence and smaller recombination with impedance spectroscopy [14]. Previous reports demonstrated the synergistic effects of both anions and cations in additives for highly efficient and stable perovskite cells [15]. In this paper, the outdoor performance monitoring of two types of perovskite mini-modules based on different technologies is reported. Additive engineering was used in some of the modules for the express purpose of studying its impact on device outdoor performance stability. Therefore, this work aims to demonstrate differences in performance (and other major electrical characteristics) between structures with and without halide additives attributed to their composition. Progress has been made on the outdoor characterization of perovskite modules in the outdoor environment [16,17]. Although previous studies have shown the potential of perovskite devices to work under real operating conditions, there is still a lack of quantitatively precise information about the long-term performance of perovskites under outdoor conditions. Furthermore, long-term outdoor testing of perovskite mini-modules (with and without halide additives) is absent from the literature at the moment. As a result, systematic investigations of perovskite performance and measurements under real outdoor conditions are deemed necessary.

2. Materials and Methods

2.1. Fabrication Procedure

Methylammonium (MA)-free perovskite CsFaPbIBr was utilized in this study mainly due to its better stability. MA is known to be more mobile and, hence, susceptible to ion migration; thus, causing instabilities. Furthermore, it is known to degrade at high temperatures. The modules studied are arranged in p-i-n architecture, as depicted in Figure 1, with an active area of 4 cm2 divided into 7 cells of about 2.86 mm width each. A picosecond (ps) UV laser was used to pattern the commercially available ITO (Colorado Concept) coated on glass (P1 scribe). The hole transport layer (HTL) and perovskite layer were processed from solution by spin coating. PTAA (poly(triaryl amine)) was employed as HTL. In all, 2 mg/mL solution of PTAA was prepared in Toluene. The PTAA solution was spin-coated on ITO at 5500 rpm for 30 s. After this, spin-coated PTAA films were annealed at 100 °C for 10 min. The perovskite type A has a Cs0.18FA0.82PbI2.82Br0.18 composition, while type B has a similar perovskite composition, though with +5% excess of FACl. The electron transport layer (ETL) was deposited by thermal evaporation. A combination of LiF/C60/BCP was chosen as ETL. Fullerene (C60) has been well known as ETL, while the LiF improved the perovskite/C60 interface and BCP improved the energy level alignment between C60 and metal electrode. The thicknesses of LiF, C60 and BCP are 0.8 nm, 40 nm and 5 nm, respectively. Again, a picosecond UV laser was used for the P2 scribe, opening the layer stack down to the ITO layer. The top ITO is deposited by in-house sputtering. Moreover, the P3 scribing to isolate the top ITO electrode was carried out by picosecond UV laser. The total width of the loss area from P1 scribe to P3 scribe is typically in the order of 400–600 μm.
The lamination of the samples was achieved by sandwiching the minimodules between two (2 mm × 10 cm × 10 cm) glass plates. A polyolefin-based encapsulant and a butyl-edge sealant were used to glue the whole assembly and provided sufficient isolation from the environment.
The PCE of the perovskite mini-modules exhibits improvement after the introduction of FACl additives in the active perovskite layer. This can be seen in the Table S1 (Supplementary Material) where the majority of the samples with additives present improved efficiencies compared to the majority of their counterparts that lack additives. However, distinct statistical differences of the PCE of the modules with and without additives demonstrating the superiority of the PCE of the samples with additives cannot be clearly obtained in the data probably due to the low number of samples provided.

2.2. Outdoor Apparatus

Six (6) perovskite modules comprising two different types of composition, i.e., type A (without additives) and type B (with FACl additives), were monitored over the period from 12 January until the 13 May 2021 (16 weeks). They were mounted outdoors in a fixed-plane array and current-voltage (IV) measurements were collected every ten minutes. The purpose of studying several modules of the same structure is to have a more statistically-significant data set from samples of the same type. Between IV scans, the modules were left at open-circuit voltage (Voc). Between IV scans, generally we can choose either open-circuit (Voc load by removing the load from the devices, maximum power point conditions by applying the maximum power voltage between IV scans (MPP conditions) or short-circuit current (Isc) conditions where the voltage between IV scans is set to 0 V. Previous papers studied the impact of load in perovskite device degradation and demonstrated that MPP tracking resulted in the least degradation of the devices over time [9]. At our outdoor apparatus, only the choice of open-circuit between IV scans was available during the period January–May 2021 and for this reason, Voc loading between IV scans was applied.
A dummy module was located alongside the 6 modules under study for the collection of module temperatures. Both forward (<0 V to >Voc) and reverse (>Voc to <0 V) voltage sweeps were applied on the devices for the IV collection. A forward-first voltage sweep strategy has been used in all instances. Initially, during the forward voltage sweep, the voltage sweep moves first from 0 V towards Voc value and at each voltage step, the current is collected by the source measurement unit. After the collection of the IV curve in the forward sweep, the collection of another IV curve in a reverse sweep is implemented by just applying voltage in the range between Voc and 0 V (starting from Voc towards 0 V). With this procedure, the collection of two IV curves is implemented (one in the forward sweep and one in the reverse sweep). The voltage sweep rate was chosen to be 1 V/s. Alongside the IV traces from the devices, environmental sensors were used to collect solar irradiance in the plane of array, ambient and device temperature, wind velocity and humidity/precipitation levels. The electrical measurements were acquired by a single current-voltage source-meter multiplexed to take sequential measurements from the testing devices. LabVIEW software was designed to record the IV-traces every ten minutes at high global normal irradiance (GNI) conditions (GNI > 400 W/m2).

2.3. Indoor Apparatus

Thermographic and Raman spectroscopic techniques are well-established characterization techniques applied to perovskite-based devices. Past papers demonstrate the use of thermographic, microscopic and luminescence-based techniques to identify layer inhomogeneities and the cause of perovskite losses [18]. Raman spectroscopy allows a comprehensive study of the vibrational modes of molecules incorporated into photovoltaic perovskite materials. Changes in vibrational modes of chemical bonds in the Raman spectrum give evidence of changes in molecular compositions within the device and may indicate root causes of degradation.
The dark lock-in thermography (DLIT) technique was applied to the modules before and after outdoor exposure using a PV-LIT inspection system from Infratec (Dresden, Germany). An infrared camera was used for the detection of hotspots in modules. During the measurement, perovskite devices were excited by a Keithley source-meter at current levels close to their short-circuit current values. For the Raman measurements, a LabRam HR800 spectrometer from Horiba Scientific (Kyoto, Japan) was used in a backscattering geometry under ambient conditions at room temperature. Raman spectra were acquired at distinct positions using a 50× objective (NA 0.55, Leica, Wetzlar, Germany), a laser excitation wavelength of 532 nm, a probing micro-beam diameter of ≈1.5 μm and a laser power in the range 0.86 μW–4.3 mW.

3. Results and Discussion

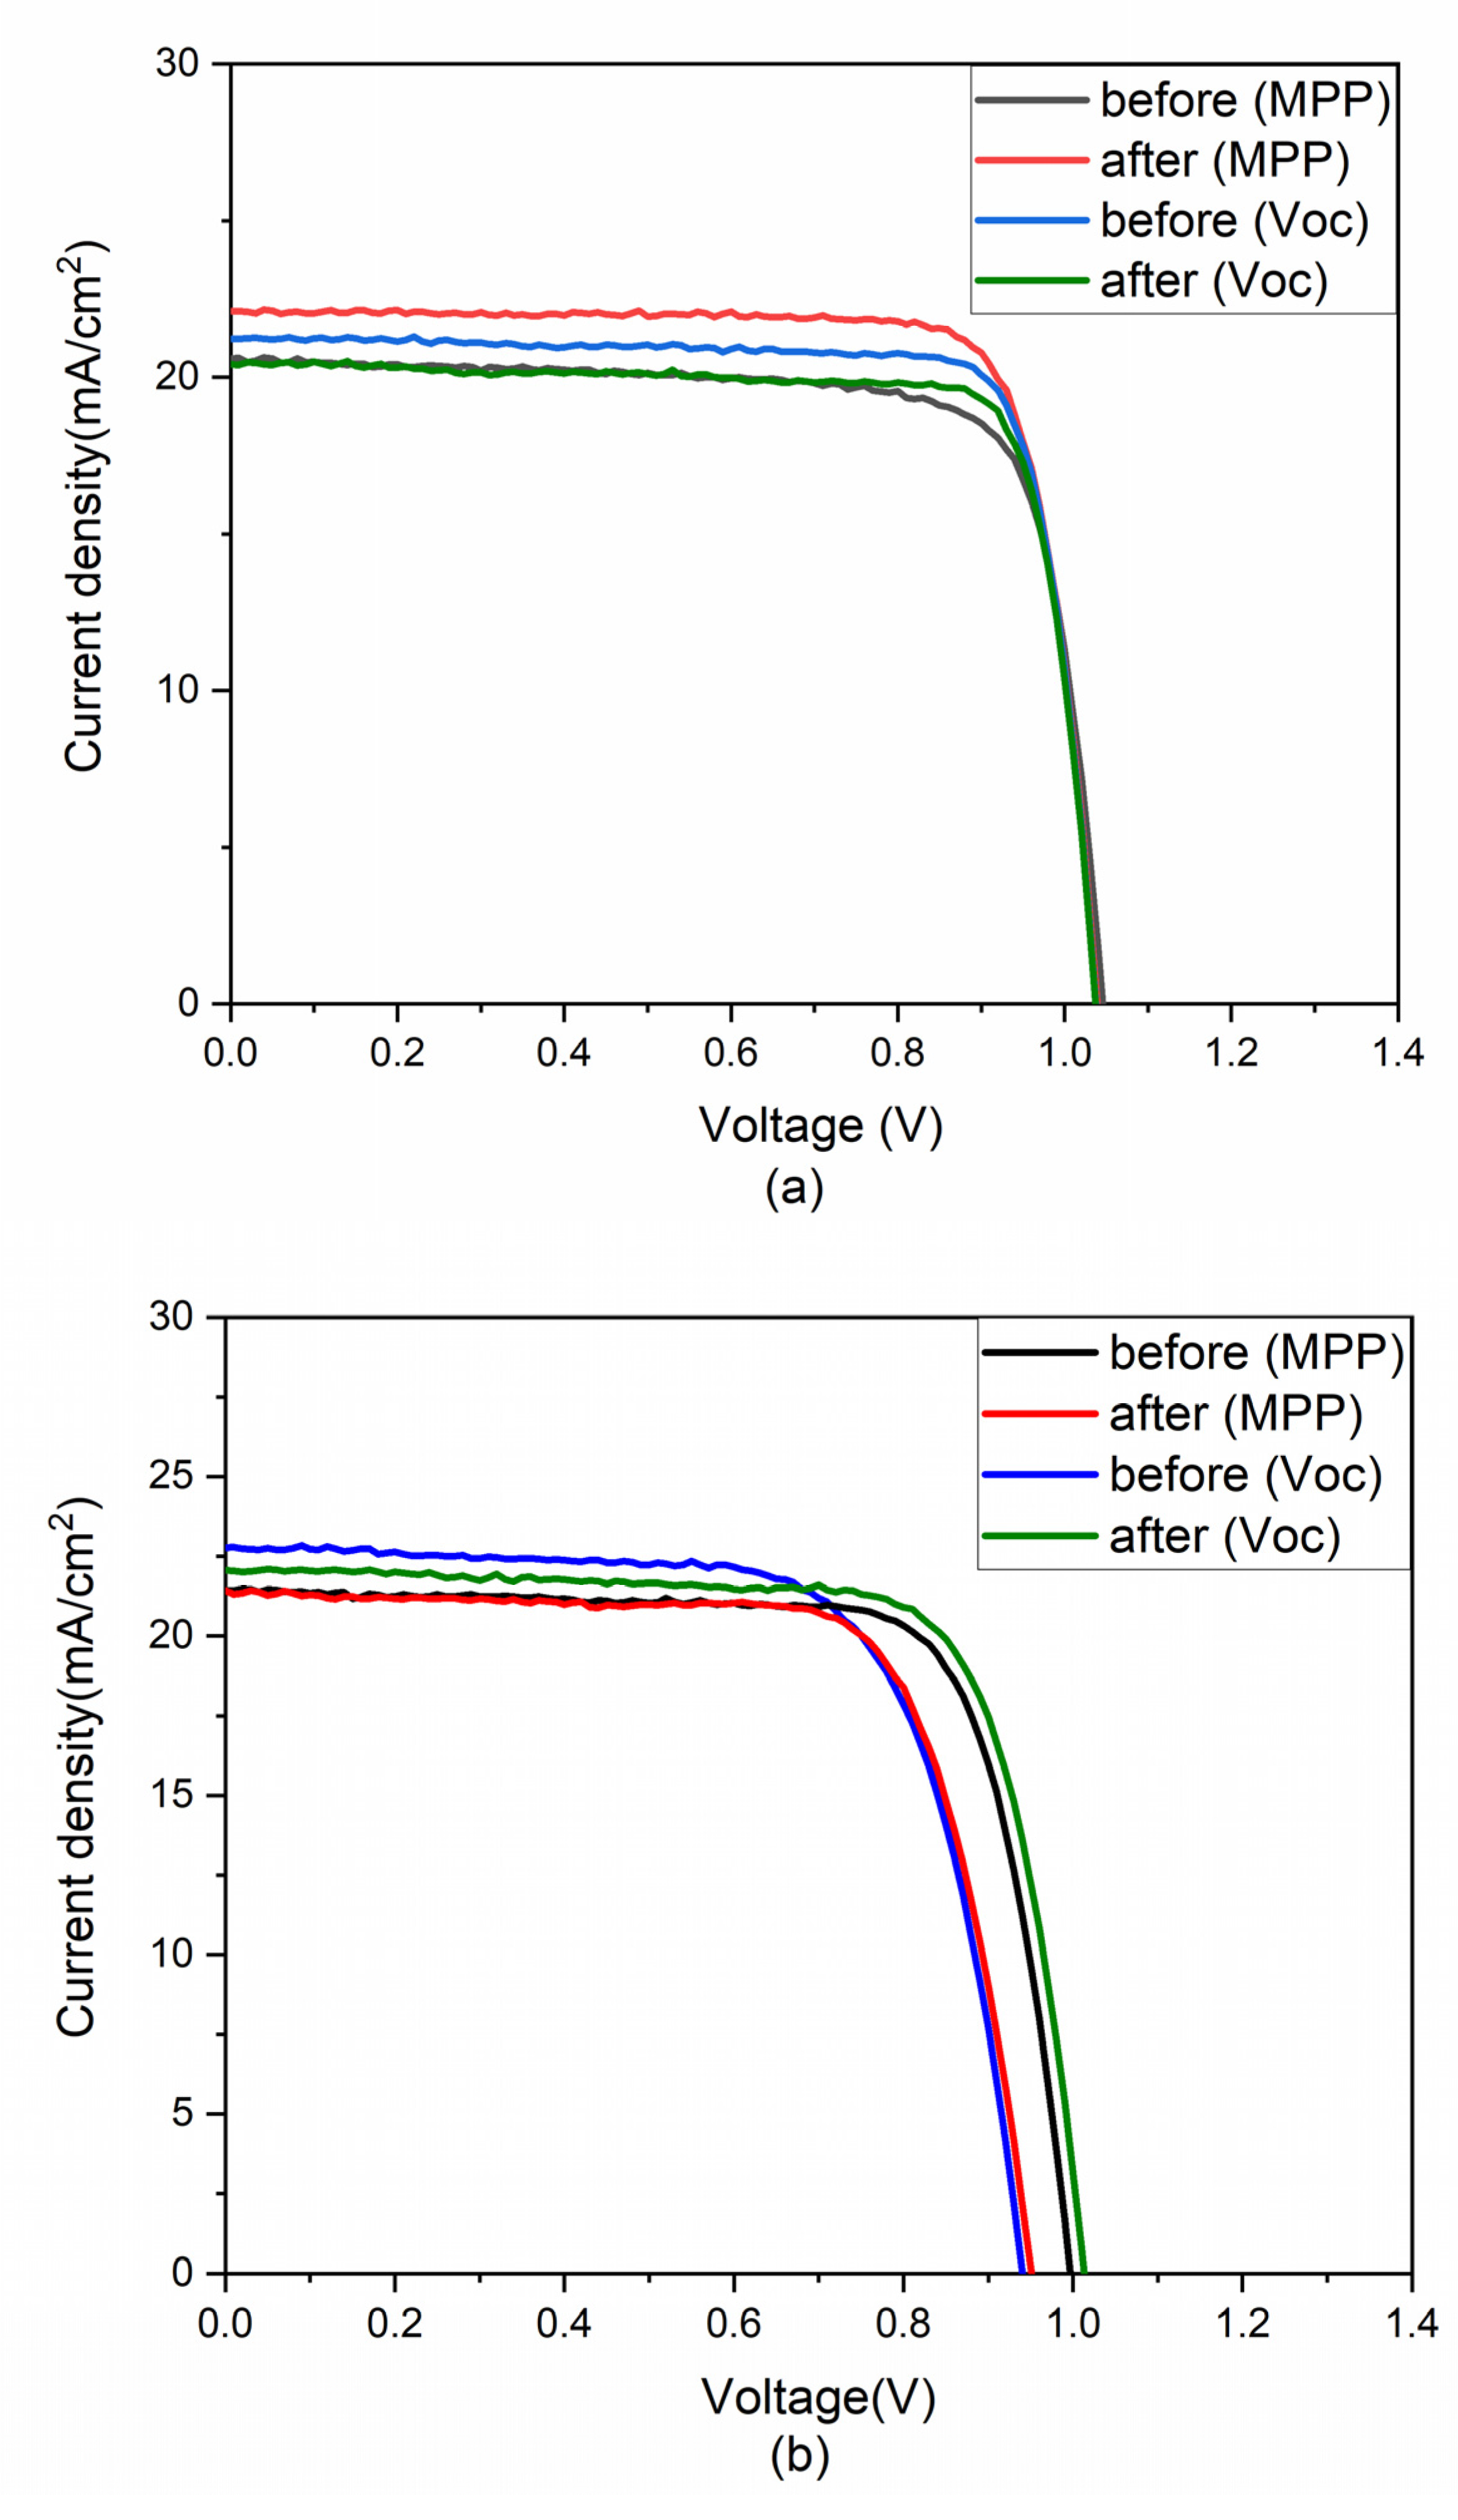
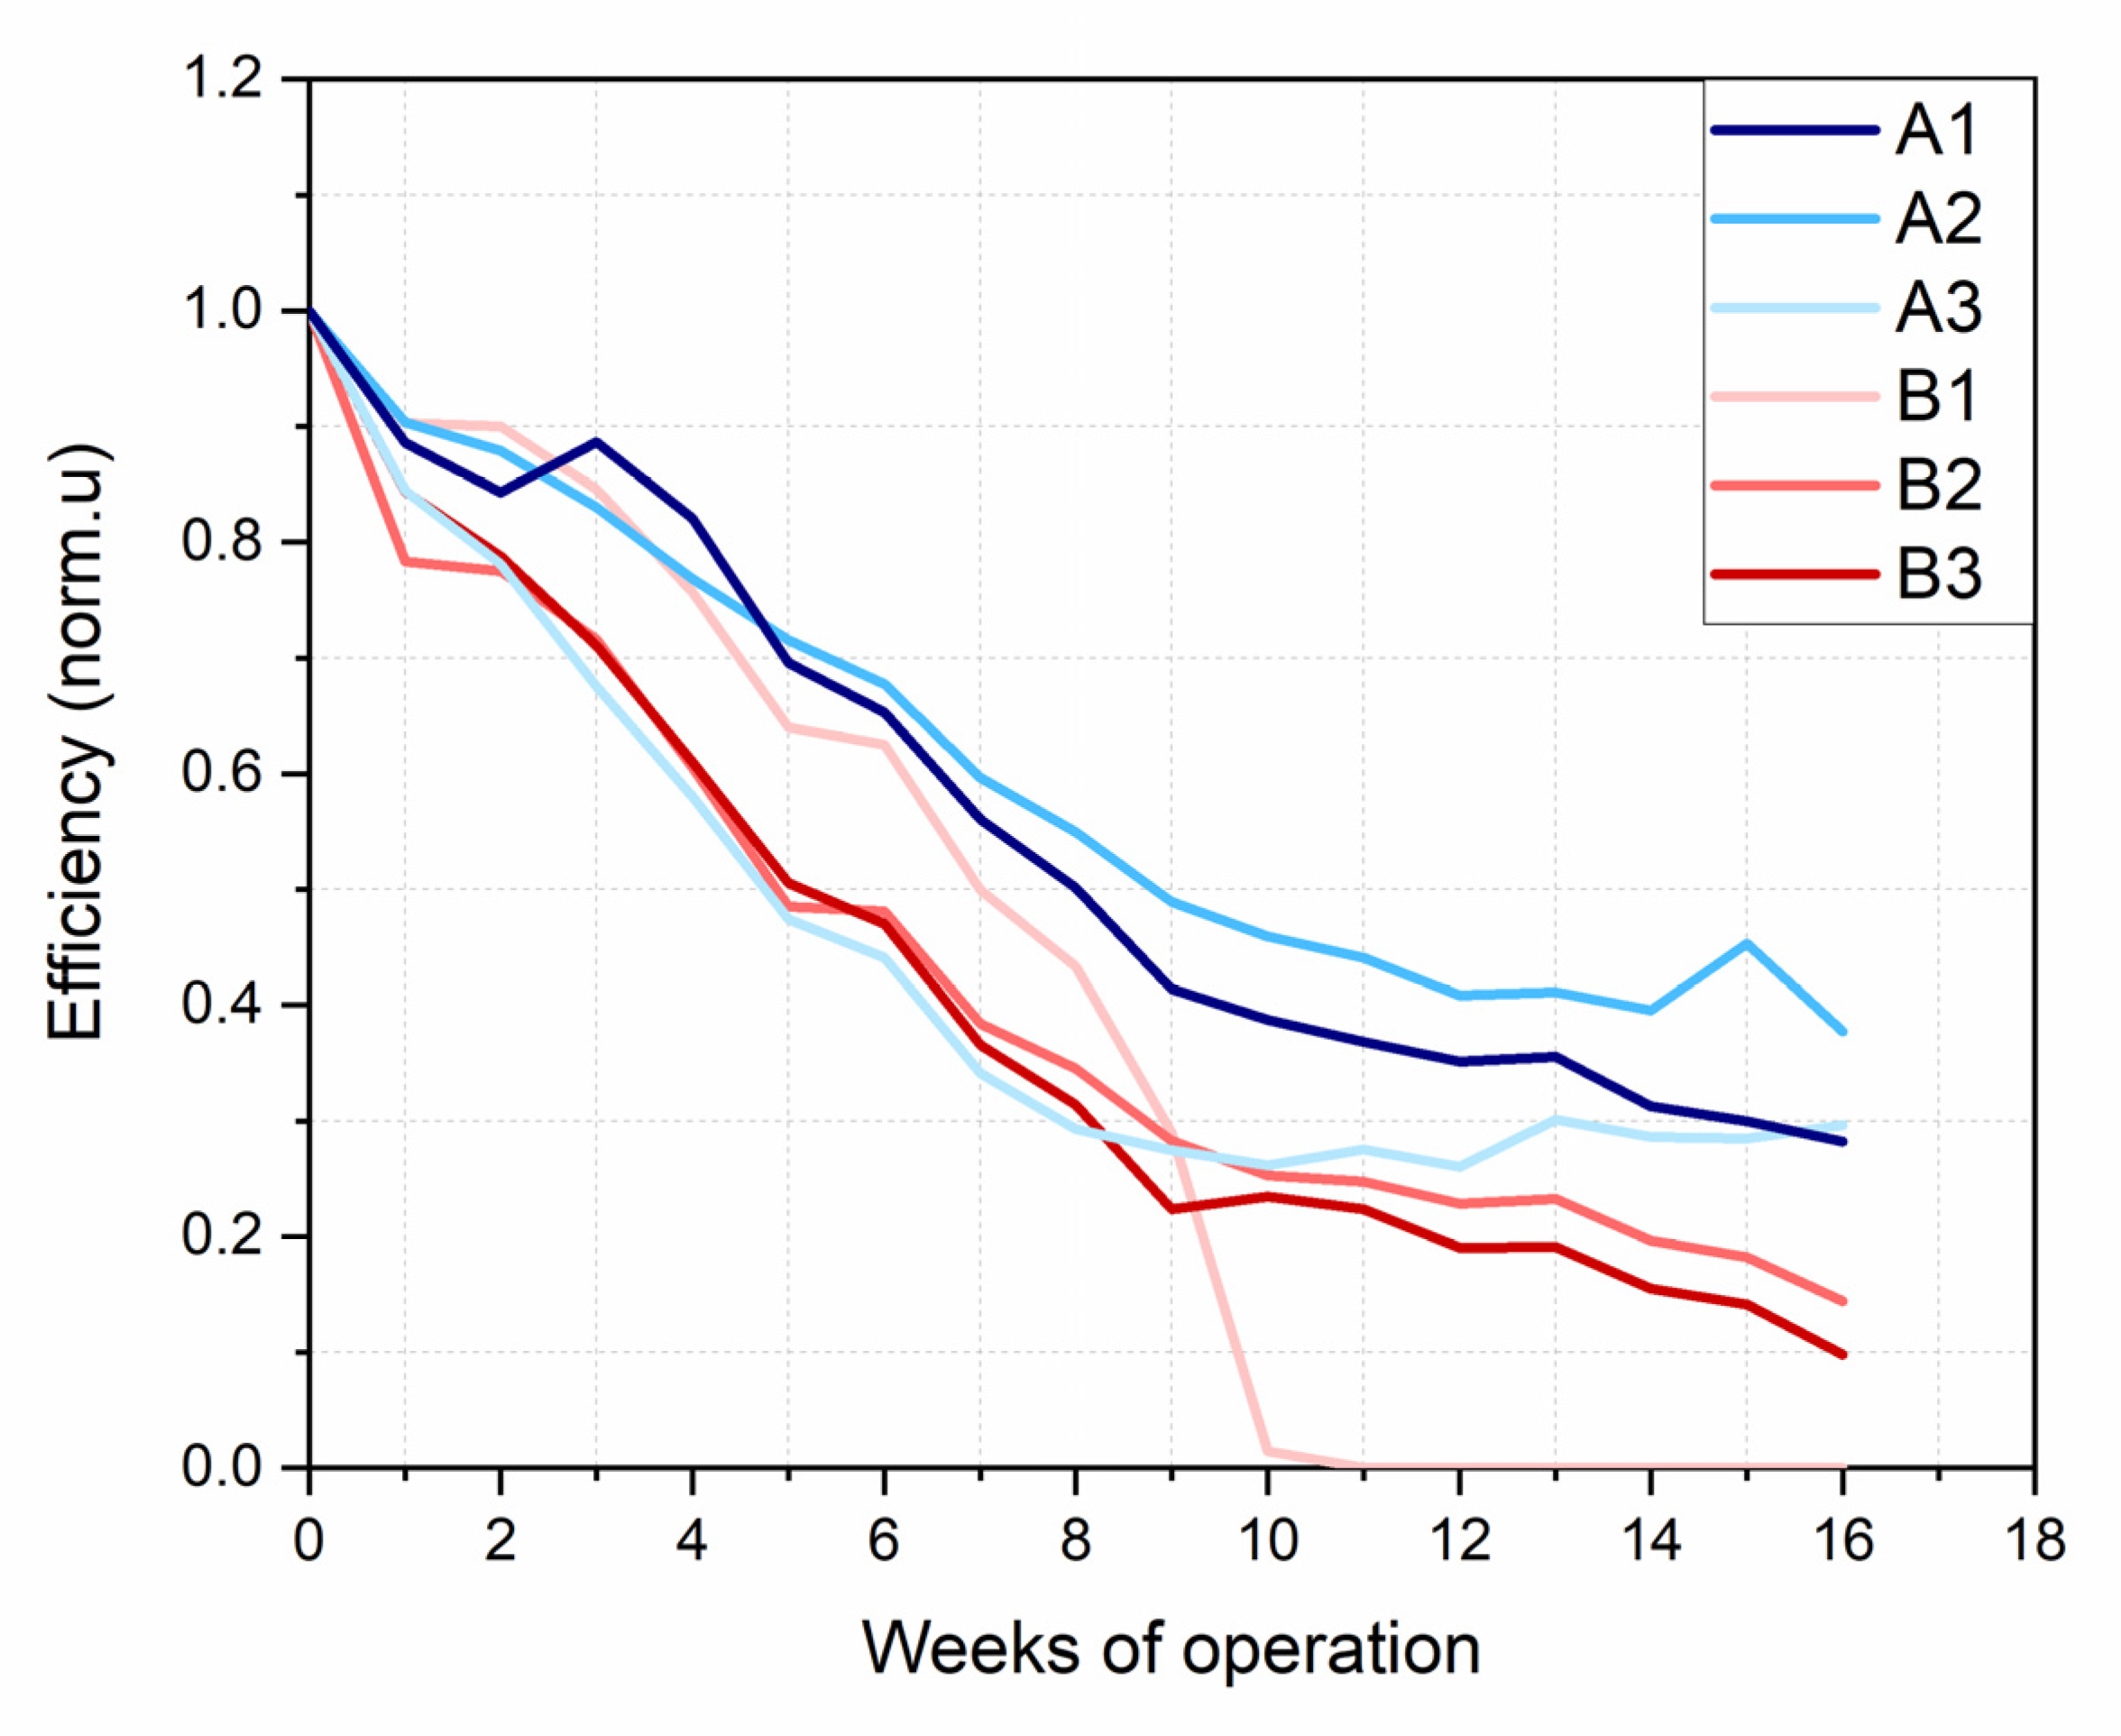
3.1. Performance Degradation

During the whole period of outdoor exposure, no visible degradation due to humidity ingress inside the encapsulant material was observed in the modules. Over that time, the significant rainfall that occured at the test location seems not to have negatively impacted the samples encapsulation-wise. Therefore, excellent encapsulation and sealing can be considered for the samples under test. Commonly reported mechanisms of irreversible chemical perovskite degradation accompanied by PbI2 formation and change of the sample color to yellow [19] are not visible in our samples indicating that photochemical decomposition was not the predominant mechanism of the observed sample degradation. Pictures of the samples after outdoor testing that support the above can be found in the Supplementary Material (Figure S1).
The maximum irradiance during the testing period was 1290 W/m2, while the total irradiation dose applied on the modules over the 120 days of exposure reached up to 580 kWh/m2. The maximum ambient temperature measured was 37.5 °C, while the maximum module temperature was 54 °C. The minimum and maximum relative humidity collected were 11% and 100%, respectively. The instrument used for the collection of the global normal irradiance was a first-class pyranometer Hukseflux SR 11 with uncertainty ±2%. The operating temperature range of the sensor is between −40 °C and 80 °C, while spectral range is between 285–3000 nm. The sensor for measuring the ambient temperature is a Rotronic HC2S3 with uncertainty ±0.1 °C at 23 °C. The module temperature was measured with a PT 1000 resistance thermometer located at the back of the module under test. PT 1000 measures at the temperature range from −50 °C to 500 °C. The humidity was measured with a Rotronic HC2S3 probe with uncertainty ±0.8 RH% at 23 °C. The environmental data for irradiance, temperature and relative humidity are summarized in Figure 2.
Efficiencies in both indoor and outdoor testing were calculated by the ratio of the output to the input power. The input power was calculated by taking into consideration the active area of the cells or modules (in m2) multiplied with the irradiance applied on them (in W/m2). The efficiency at each instance during outdoor testing was calculated based on the irradiance value present at the time of measurement. The weekly average PCE over the 16 weeks of outdoor exposure from all the 6 modules under test are depicted in Figure 3. Preliminary outdoor results from the modules under test have been presented elsewhere [20]. The data of Figure 3 were extracted from the reverse voltage sweeps. In Figure 3, devices labelled as A1, A2 and A3 are type-A modules, while modules B1, B2 and B3 present are type-B modules. As can be observed in Figure 3, one of the type-B modules underwent complete degradation prior to the 10th week of operation (module B1). An initial decrease of the performance is recorded for almost all modules under study. During the first 2 weeks of the outdoor tests, most of the perovskite modules could be classified clearly according to their type in terms of efficiency, since they seemed to stabilize at the same respective efficiency values. However, after some weeks of outdoor exposure, modules of the same type developed different efficiency values. Module A3 presents interesting and different behavior compared to the other modules since a small increase in performance is obtained after the 11th week of operation, which is correlated with an enhancement of its short-circuit current. Over the entire period of exposure, type-A modules presented higher PCE values than those of of type B. This is attributed to the fact that the initial PCE values of type-B modules outdoors are much lower than those of module A. This was not an expected result since similar efficiencies of type-A and type-B modules were measured indoors prior to outdoor installation (see Table S1, Supplementary Material).
For a better understanding of the performance degradation of the modules during the first days of outdoor exposure, the PCE loss was calculated for each module over that period. The results are reported in Figure 4. As shown in the graph, the efficiency loss from all type-B modules is significant (above 25%) during the first 6 days of exposure. On the other hand, only one type-A module (module A3) presents an efficiency loss in that period. The remaining type-A modules present efficiency gains. The efficiency reduction in modules with additives is believed to be attributed to the open-circuit voltage loading between IV scans during outdoor exposure. PCE evolution was studied indoors in the cells without (type A) and with additives (type B) in the presence of both open-circuit and maximum power point (MPP) loading to investigate the impact of the load in samples with and without FACl additives in the perovskite active region. Current-voltage (IV) curves from the cells were collected under a class AAA solar simulator before and after keeping them at open-circuit and MPP loading conditions for some minutes (see Figure 5). Those measurements were implemented at standard testing conditions (STC): 25 °C, AM1.5, 1000 W/m2. A reduction in performance in type-B modules (Figure 5a) was only obtained at open circuit loading in agreement with the outdoor conditions. In both indoor and outdoor tests, the efficiency reduction under open circuit conditions is correlated to current reduction. At MPP loading conditions, no performance reduction was detected, supporting the possibility that open-circuit loading conditions might be the main reason for the significant performance degradation in the cells with FACl additives in the perovskite active layer during the first days of outdoor testing. One important observation in Figure 5a is the absence of open-circuit change in both loading conditions studied. Unchanged open-circuit voltage during stability testing give evidence of unchanged non-radiative recombination rate. The unchanged non-radiative recombination rate might suggest that the defect amount might have stayed unchanged. Due to this, the current density changes in Figure 5a should not be related to the change in the non-radiative carrier recombination rate. The current density changes in Figure 5a under certain voltages often take minutes to stabilize [13], which coincides with the ion-migration timespan [21]. In addition, previous reports proved the A-cation halide additives in the perovskite films did increase the ionic species amount [22]. Thus, the current density change is likely related to ionic movement, which possibly affected the carrier extraction efficiency.
Current-voltage curves taken before and after open-circuit and MPP exposure under a class AAA solar simulator indoors were collected from cells without additives as well (Figure 5b). The results of Figure 5b demonstrate a performance enhancement of the cell after some time at open-circuit loading conditions in agreement with the majority of the type-A module performance data from the first days of exposure where an efficiency gain is obtained (Figure 4). In Figure 5b, the performance enhancement at open-circuit loading conditions is mainly correlated with an open-circuit voltage increase. The enhanced open-circuit voltage under light soaking can be caused by the reduced trap density passivated by the photogenerated electrons [23]. More defects might be present in this type of structure and, thus, trap density might be higher. Another possible mechanism that can explain the open-circuit voltage increase is the reduction of the gradient of the majority-carriers quasi fermi level induced by mobile ion redistribution [24]. The current density changes at open-circuit loading conditions in Figure 5b might be related to ionic movement. The decreased open-circuit voltage after light soaking at MPP loading conditions (Figure 5b) indicates the increase of the non-radiative recombination rate, thus suggesting that the number of traps might have increased at MPP. However, the exact mechanisms remained elusive and need further investigation in the future.
To further study the outdoor degradation of the modules, the normalized weekly average performance of the modules was calculated over the 16 weeks of outdoor exposure. The mean value of efficiency the first week of exposure was set as the initial value for the efficiency. The results are depicted in Figure 6. Having a closer look at the efficiency behavior of the modules, the testing period can be classified into two periods: the initial ‘burn-in’ period, which lasts up to 1 week after the modules’ installation; and the period after the first week of operation. During the initial burn-in period, the majority of type-B modules degrade more than the majority of type-A modules due to the effect of open-circuit loading described above, while after the second week of operation, the degradation rate is the same for the two types of modules under test.
To identify the root cause of efficiency degradation of the modules, all the other electrical parameters of the modules were collected and studied over the testing period. The normalized open-circuit values plotted in Figure 7a demonstrate a higher reduction for all modules of type B compared to the respective values obtained for type-A modules. Overall, the open-circuit voltage of all the modules under test is decreasing apart from module A1, which exhibits a slight increase in its open-circuit voltage. This was an unexpected result since module A presents the highest PCE degradation among the type A modules at the end of the outdoor testing. The origin of the open-circuit enhancement in module A1 is believed to be mainly related to the small voltage temperature coefficient of the module. The voltage temperature coefficient value of module A1 is much lower compared to the respective values obtained in the other modules of the same type (module A2, module A3) over the timespan of the outdoor testing. The voltage temperature coefficients for the type-A modules can be found in Table S2 (Supplementary Material).
Short-circuit current values exhibit a reduction (Figure 7b) in agreement with the PCE degradation recorded. Higher current reduction is detected in type-B modules rather than type A. The mean current degradation in type A modules is 52% over the 16-week-period, indicating that the major cause of performance degradation of the modules can be attributed to current reduction. The fastest short-circuit current reduction was obtained in the first week of outdoor exposure in most modules. After that time, the current reduction become slower. These results indicate that a ‘faster’ degradation mechanism occurs in devices just after the exposure to light and temperature levels outdoors and this is replaced by a ‘slower’ degradation mechanism after some time of exposure. This trend was obtained in performance measurements presented in Figure 6 and indicates that the current trend determines the efficiency behavior of the modules. Irradiation and temperature rise during the day are hypothesized to result in ion generation and migration and defect formation, which act as recombination centers and reduce the performance of the devices [25]. Furthermore, electric field-induced ionic defect migration was found to be another degradation mechanism in previous reports over several cycles resembling day/night phases and can be present in the devices under test [21].
In addition, changes in fill factor (FF) over the testing period were investigated. The normalized fill factor degradation over the entire testing period is shown in Figure 7c. Large fluctuations exist in the FF of all the modules under test and a clear trend cannot be obtained.

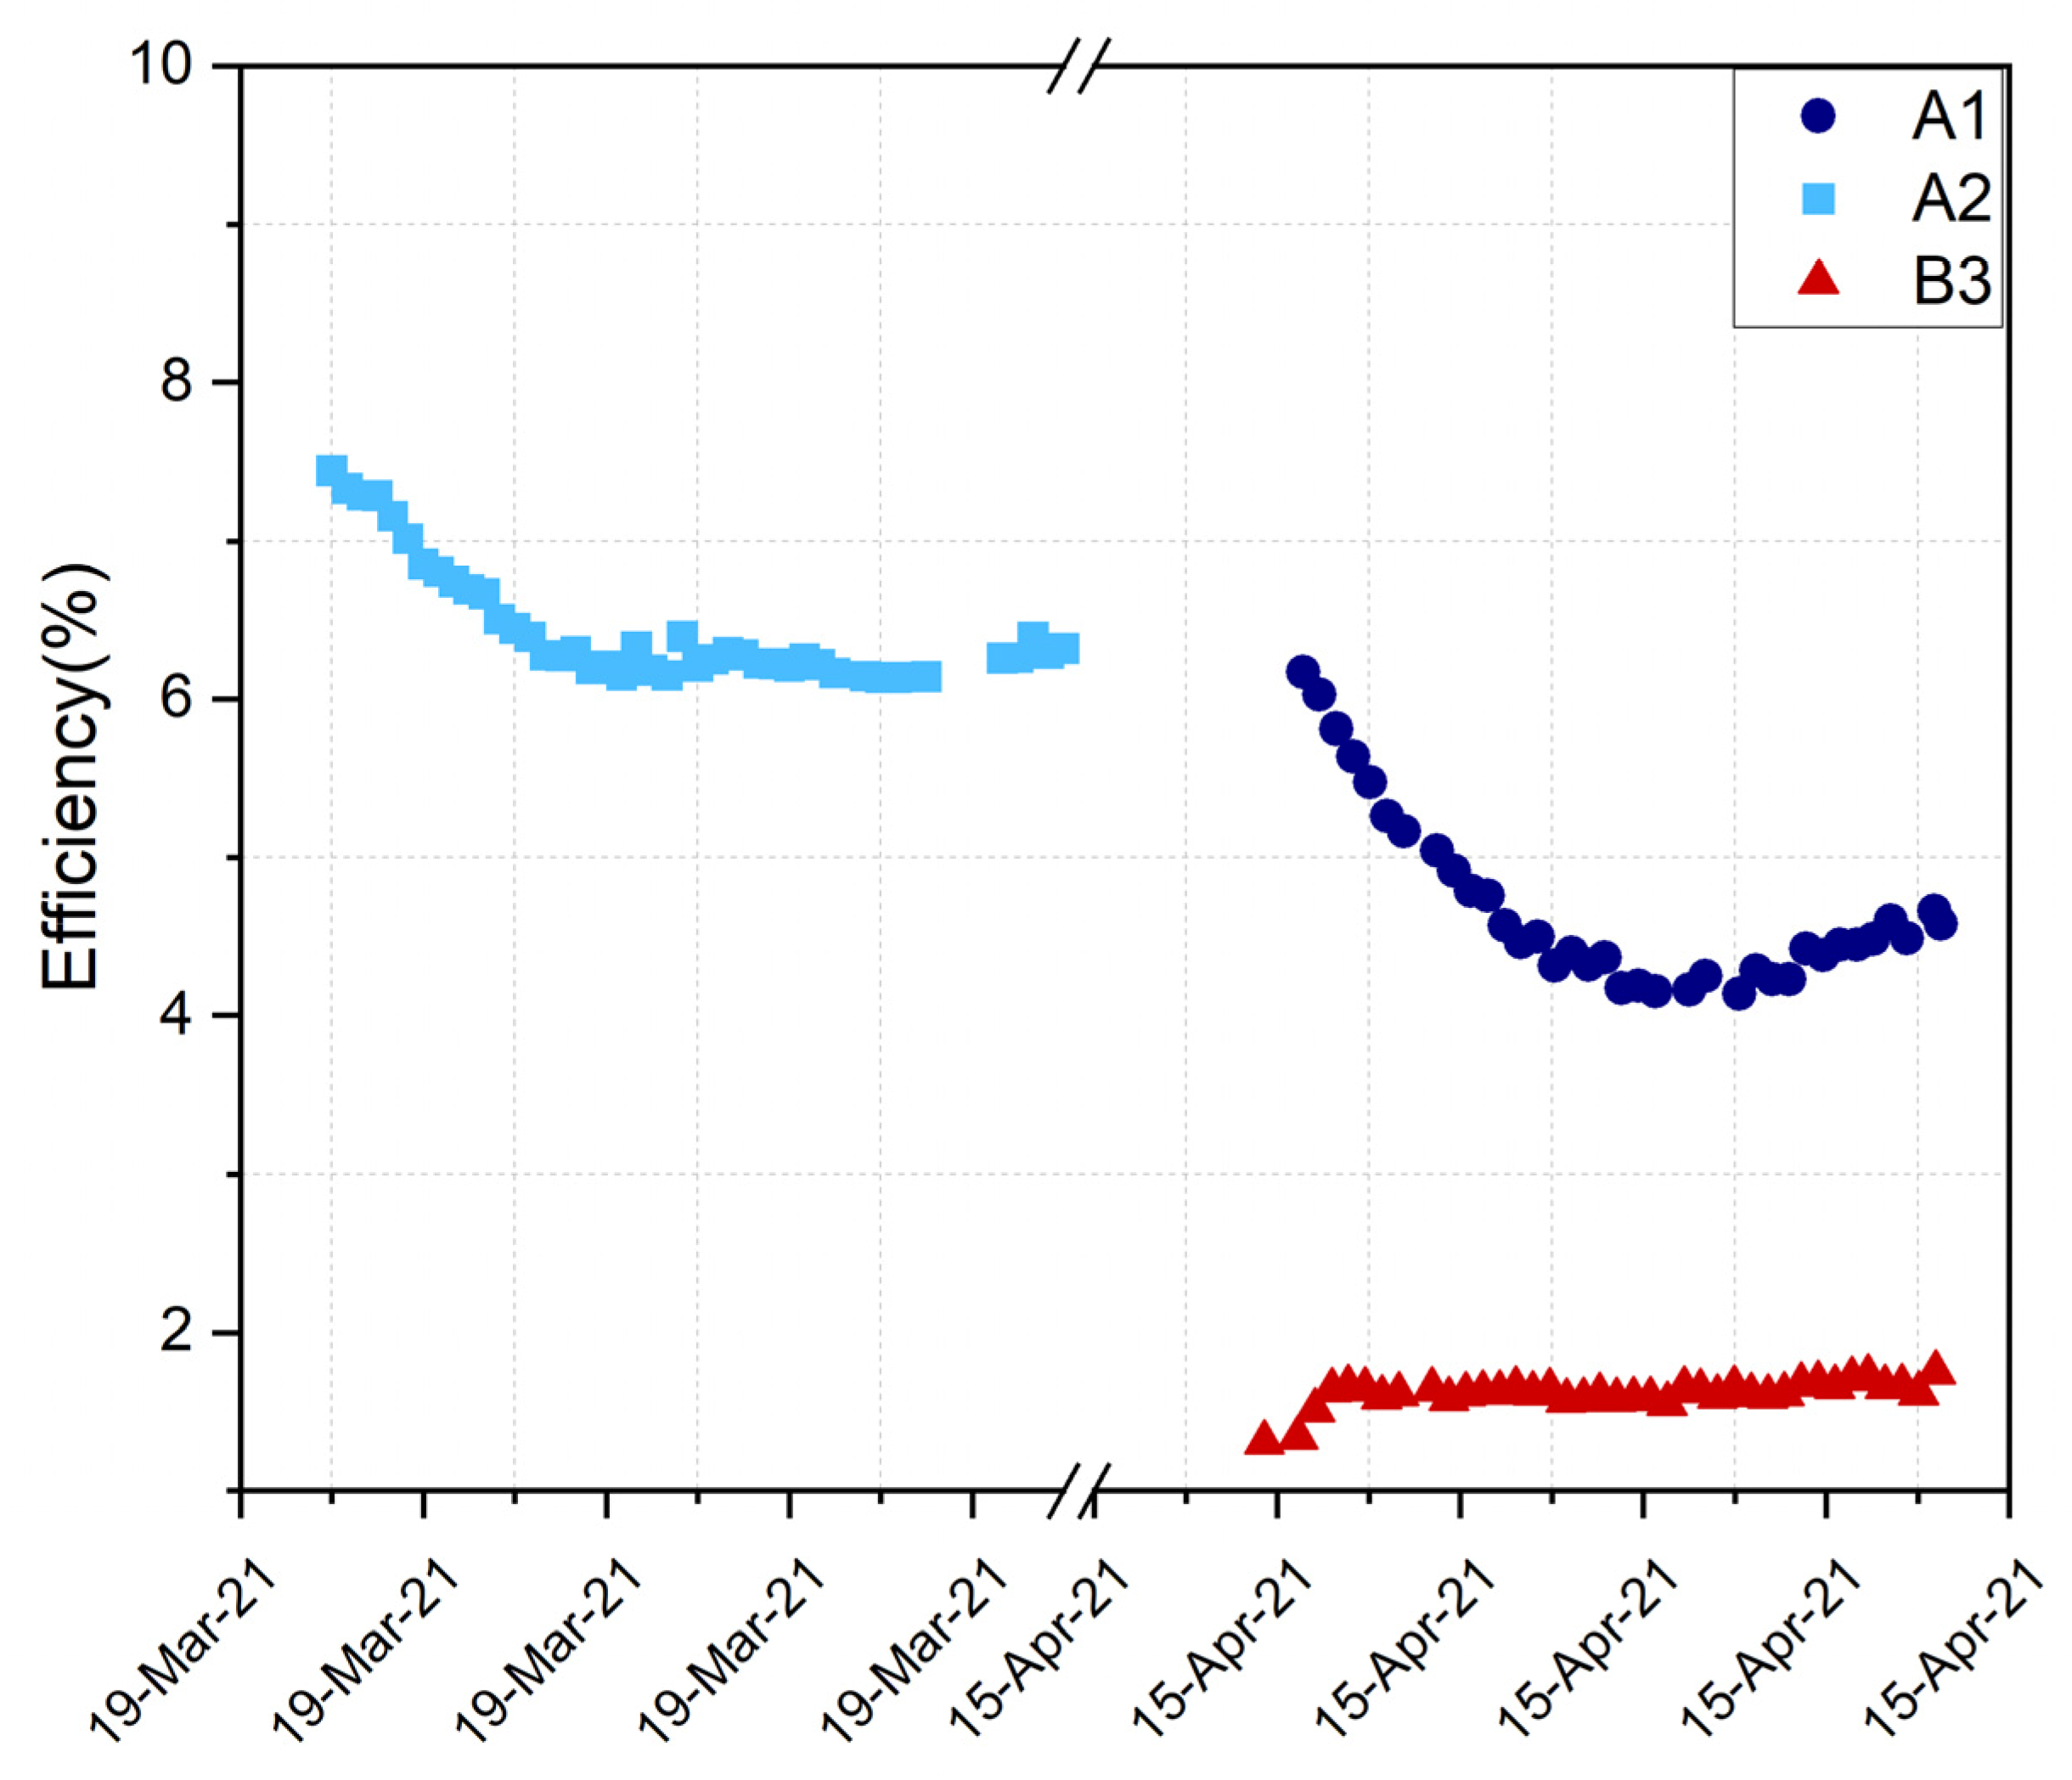
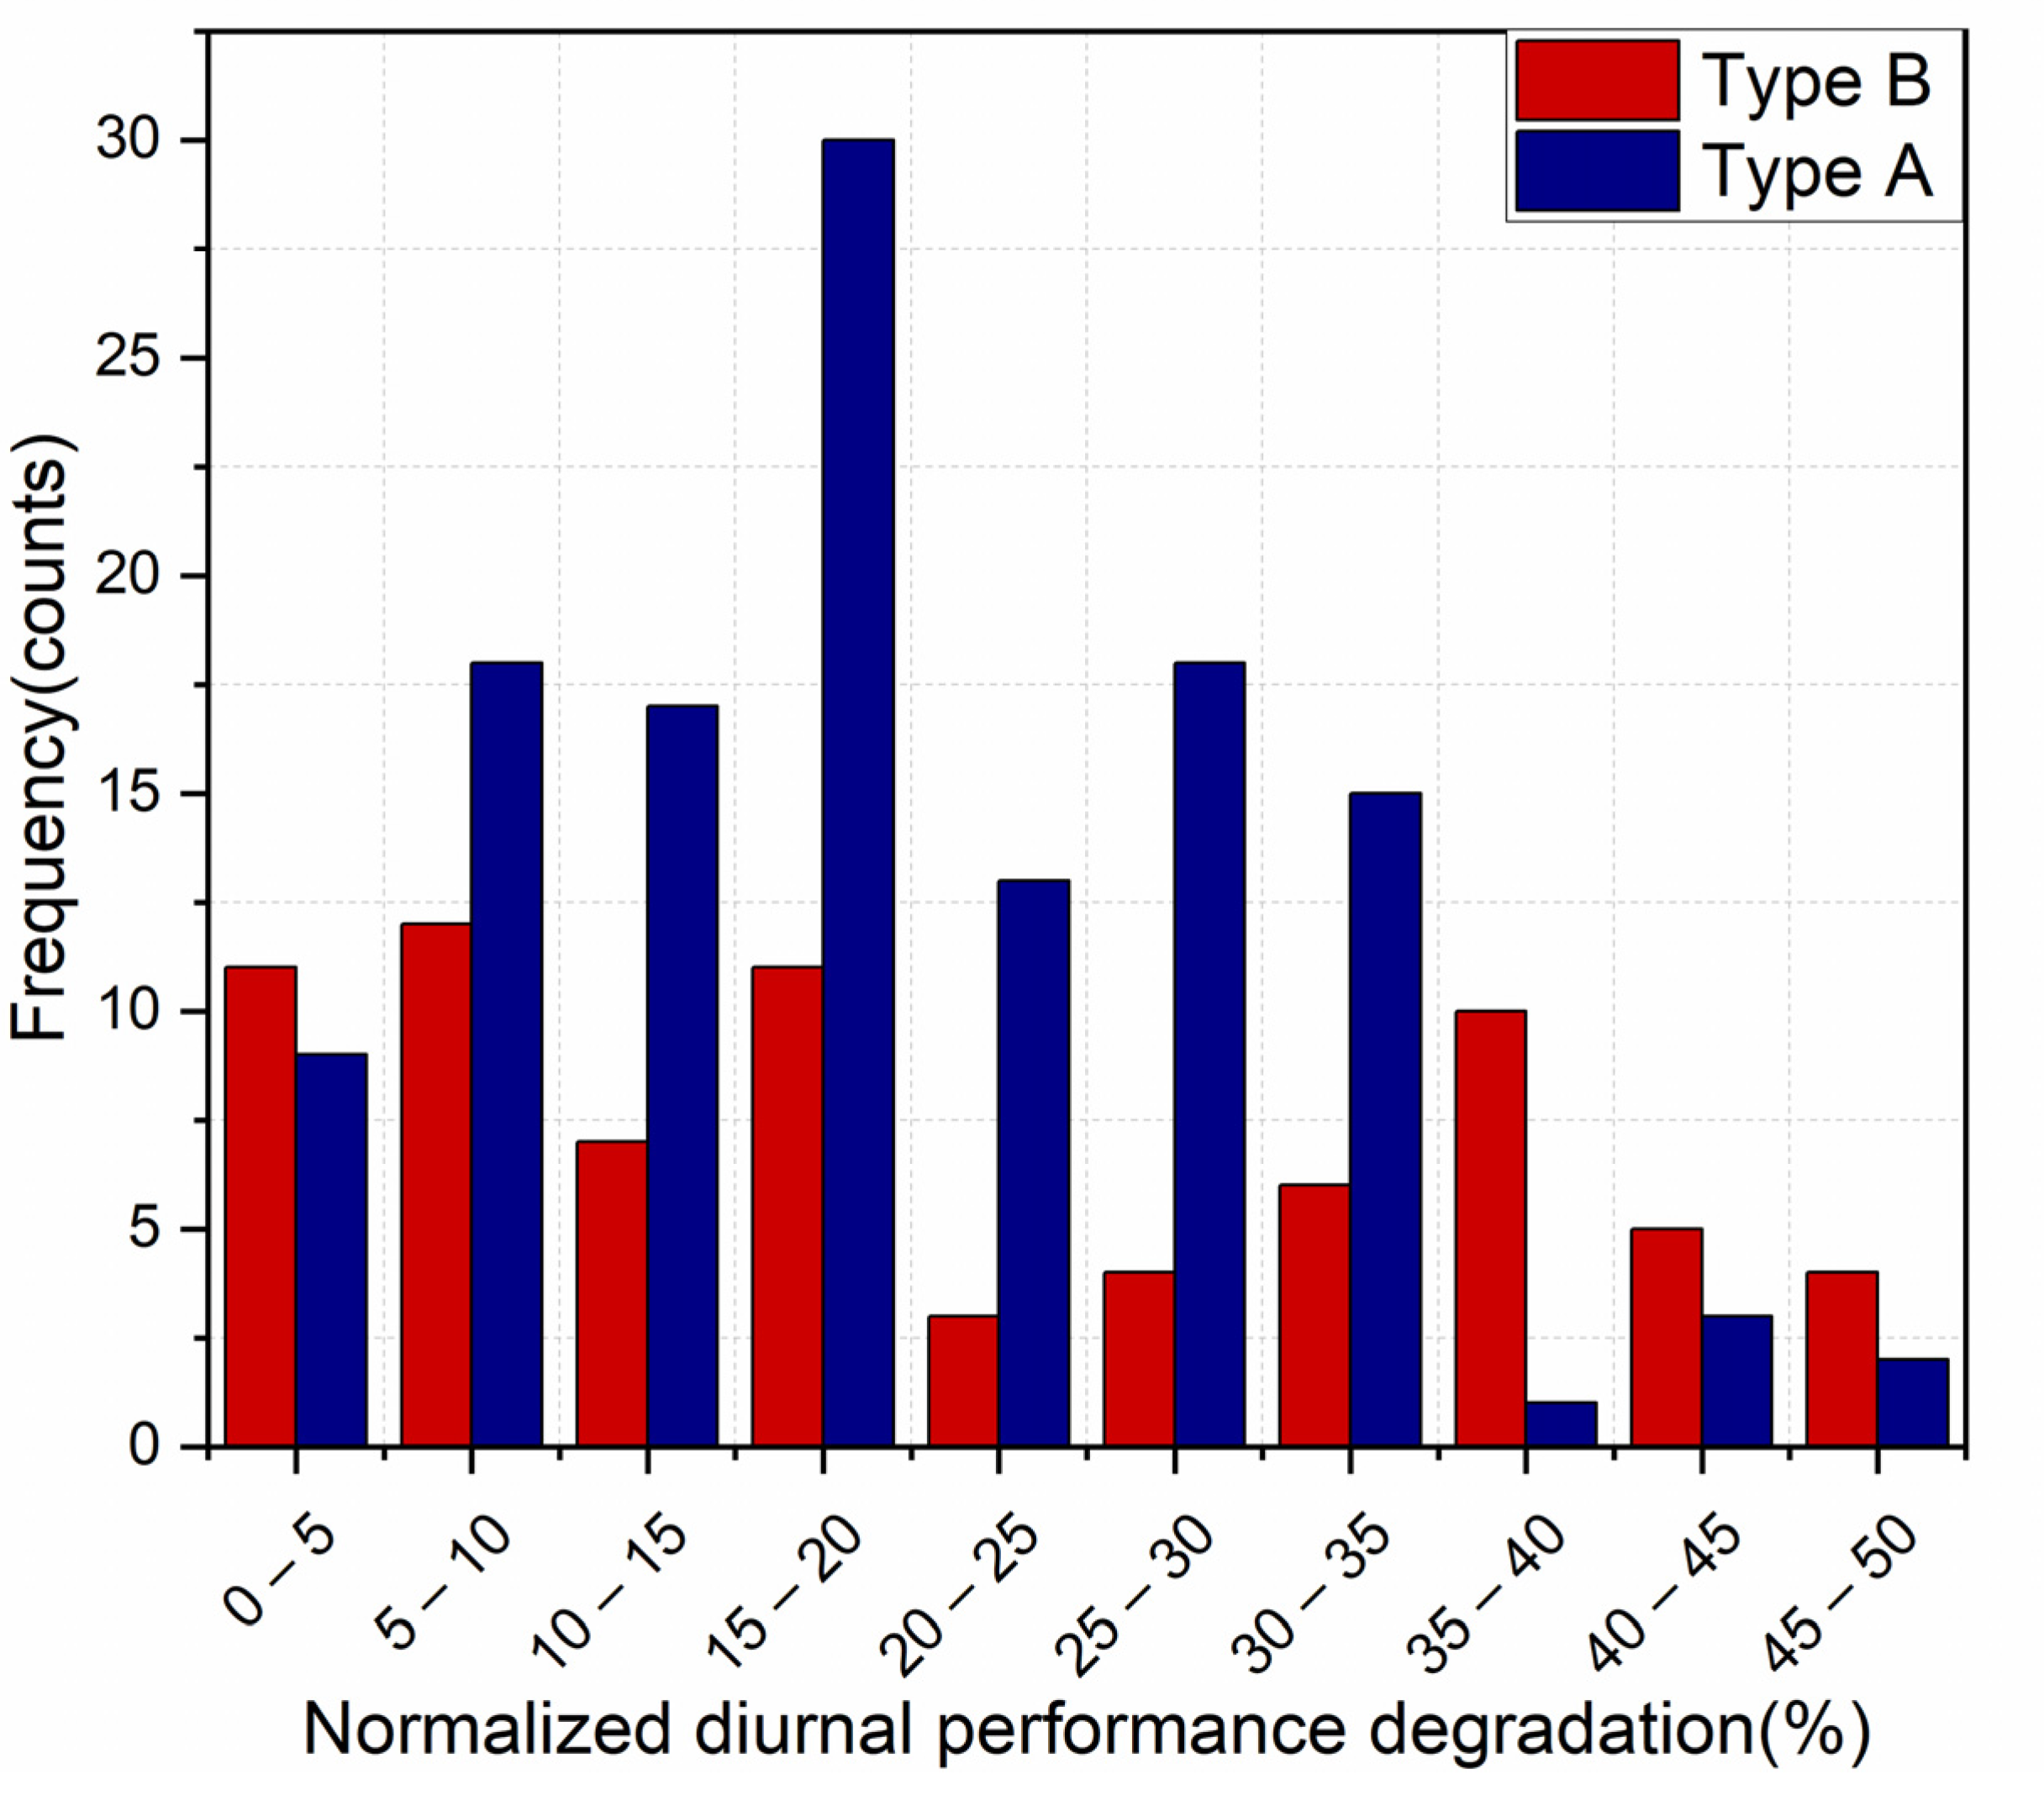
3.2. Diurnal Performance

The efficiency behavior of the modules under test changes over the day. A discrepancy in their behavior is exhibited depending on whether the data were collected in the morning or afternoon. The modules in most cases perform better in the morning hours than in the afternoon on the days under examination. Figure 8 shows an example of the daily efficiency drop of two modules during the 3rd week of operation. Reversible performance degradation is observed on consecutive days due to performance recovery overnight. Moreover, there are many instances where the diurnal performance initially drops and then increases again over the course of a day. Furthermore, in some cases the efficiency presented a slight increase during the latter half of the day. Examples of the three different trends of diurnal performance in modules are plotted in Figure 9. The efficiency reduction during the day is mainly driven by current reduction developed during the day (particularly in type-A modules). The relative current drop is most likely related to irradiance intensity since during the first hours following exposure, there is a rapid relative current reduction (see Figure S2 Supplementary Material). The current and, thus, performance recovery after initial reduction was found in all the modules, independent of the type and after the first hours of operation (usually after midday) in most of the days of outdoor exposure. Irradiance is believed to be the main cause for the diurnal changes in relative current generation. One other important observation is that the initial (i.e., morning) efficiency in days after cloudy evenings presents higher recovery. In the case of cloudy days, mobile ions in the devices may have more time to redistribute within the device under test, causing performance recovery at low light bias conditions and overnight; thus, with light application the next day, the perovskites present higher starting performance values.
Diurnal performance degradation of all the modules under test was calculated for all days in the field to investigate the dominant value for each type of module. To achieve this, the efficiency values at the beginning and end of the day at the same irradiance levels were considered. Even an amount of recovery occurs over the course of the day, thus lessening the diurnal performance degradation; this was the best approach we could follow. The values were normalized to the initial efficiency value to have comparable results. Diurnal performance degradation was detected mainly in the range 0–50% in both types of modules. The normalized diurnal performance degradation was separated into bins of 5% and the frequency of occurrence at each bin was calculated for each module (see Figure 10). In type-A modules, most daily values of diurnal performance degradation are around 15–20% of the initial efficiency value in the morning. In the same manner, type-B modules exhibit a diurnal performance degradation most frequently around 5–10%. Module B1 was discarded from the analysis since it went out of operation prior to the 10th week of exposure as mentioned previously.
The absolute diurnal performance degradation was taken into consideration for the same analysis as well (see Figure S3 Supplementary Material). In this case, the efficiency values at the beginning and at the end of the day at the same irradiance levels were considered. The absolute performance degradation was separated into bins of 0.5%. Type-A modules present more instances of diurnal performance degradation in the bin 0.5–1%, while type-B modules present more instances of diurnal degradation in the bin 0–0.5%.

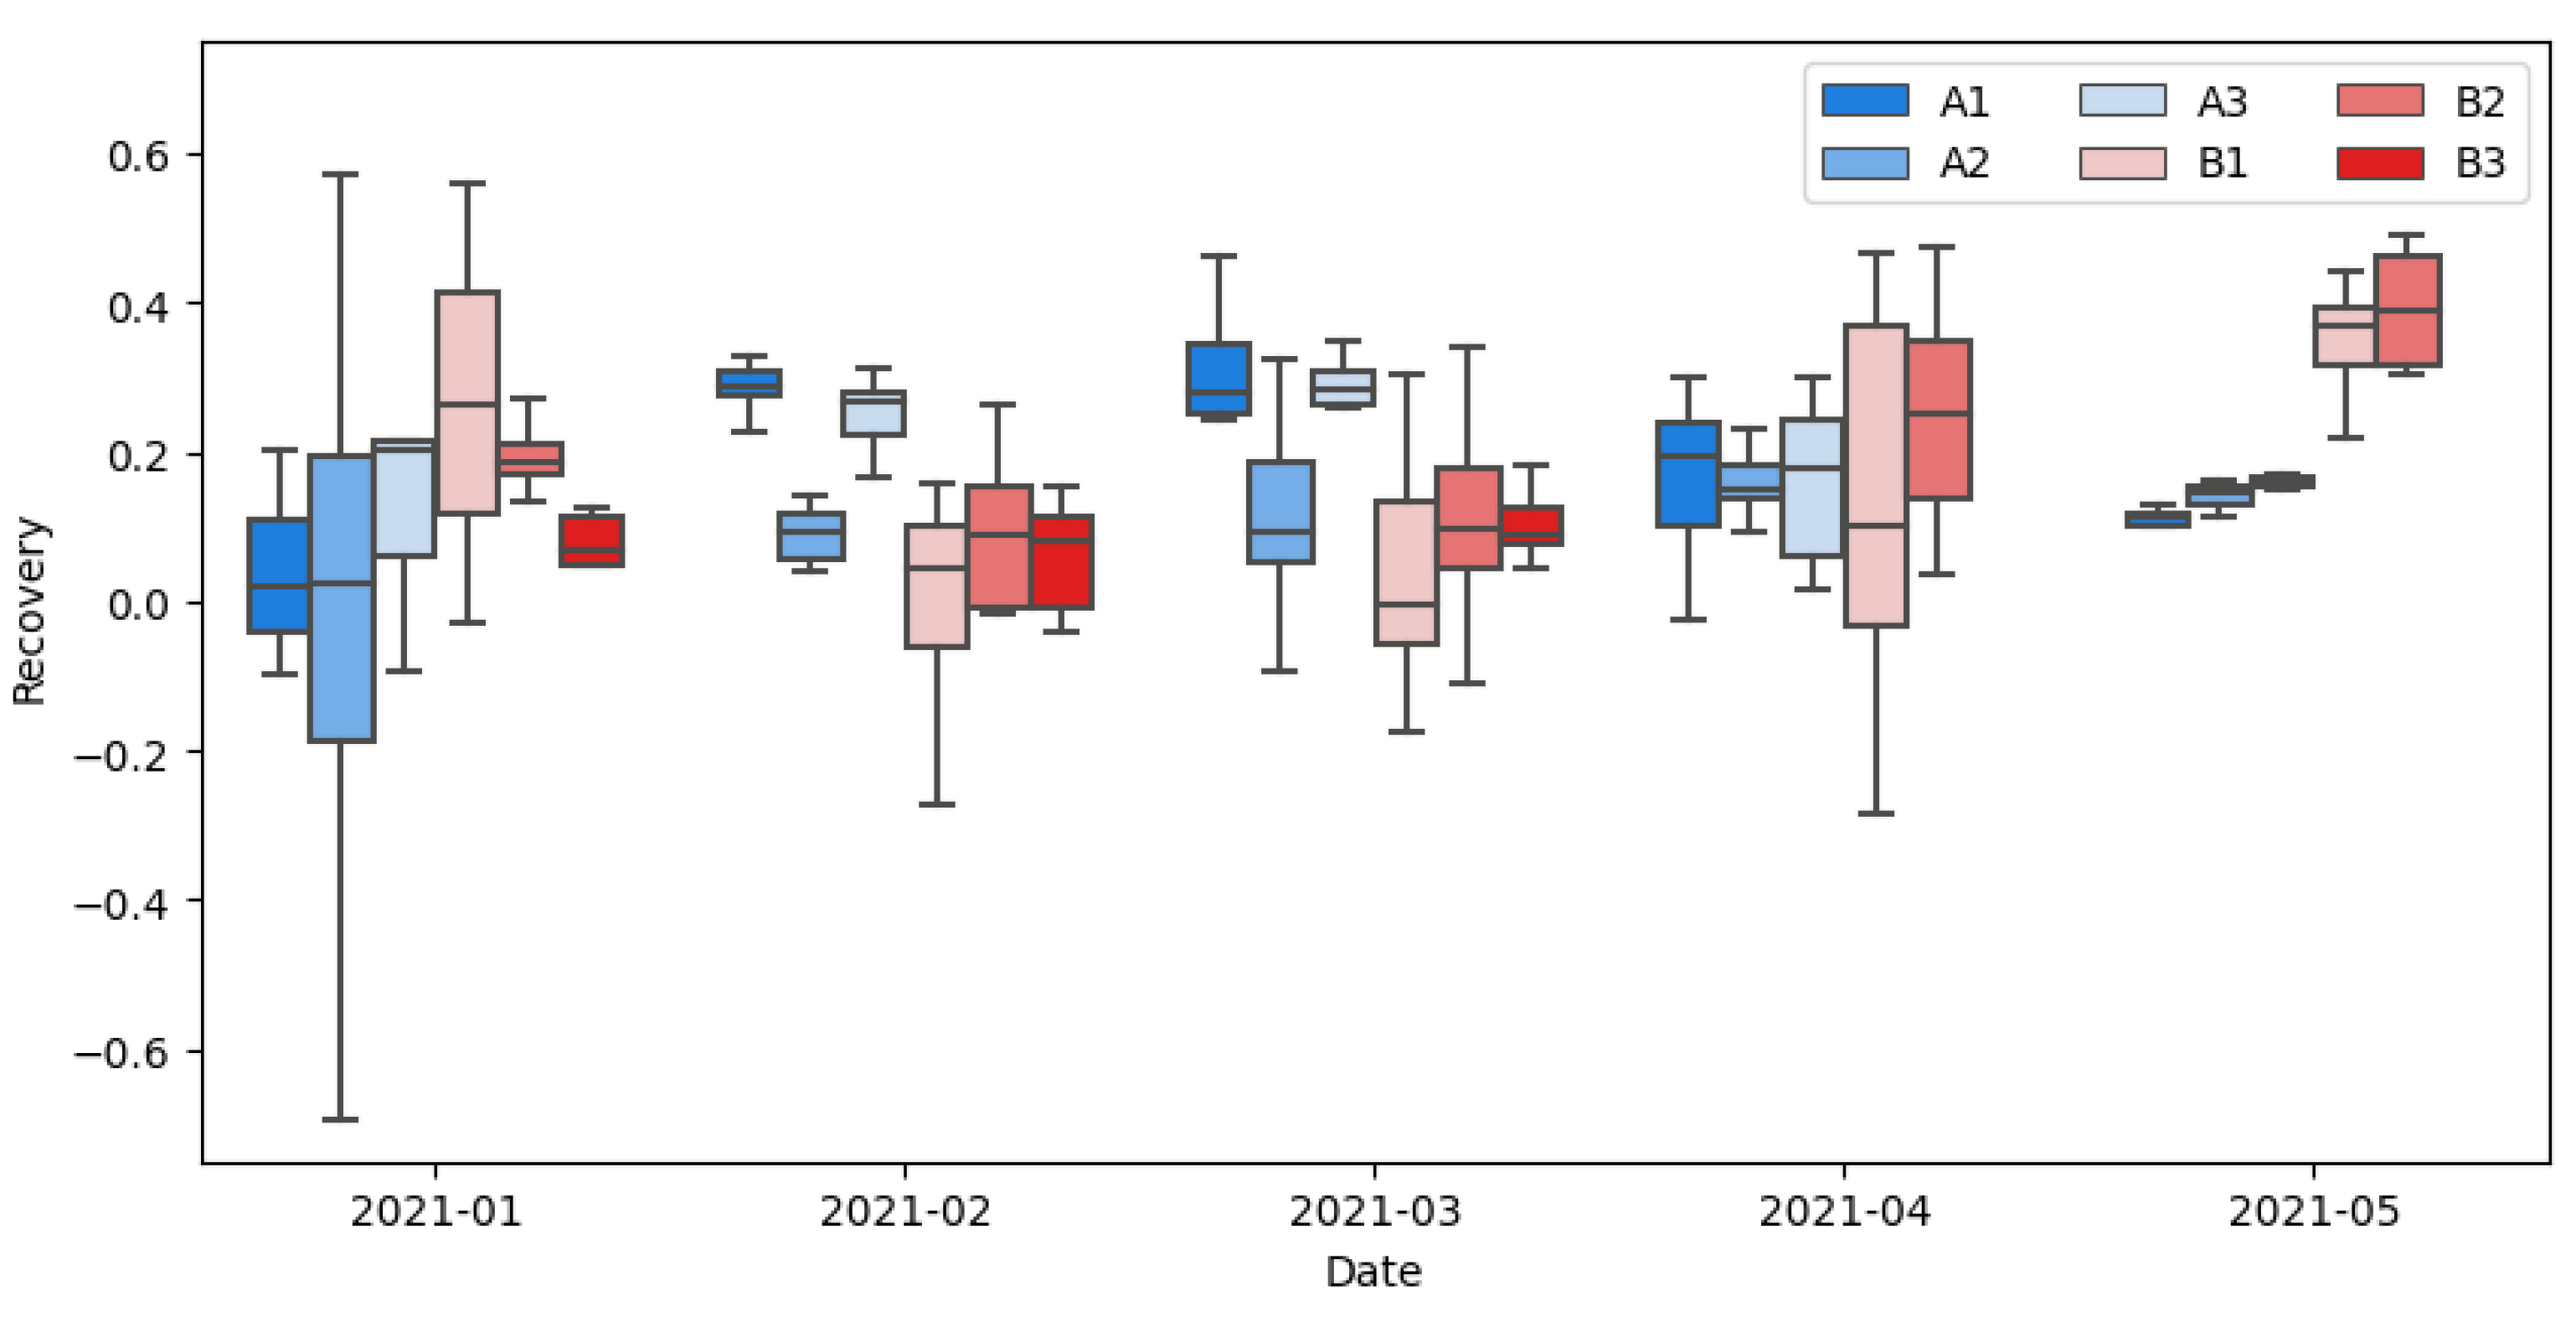
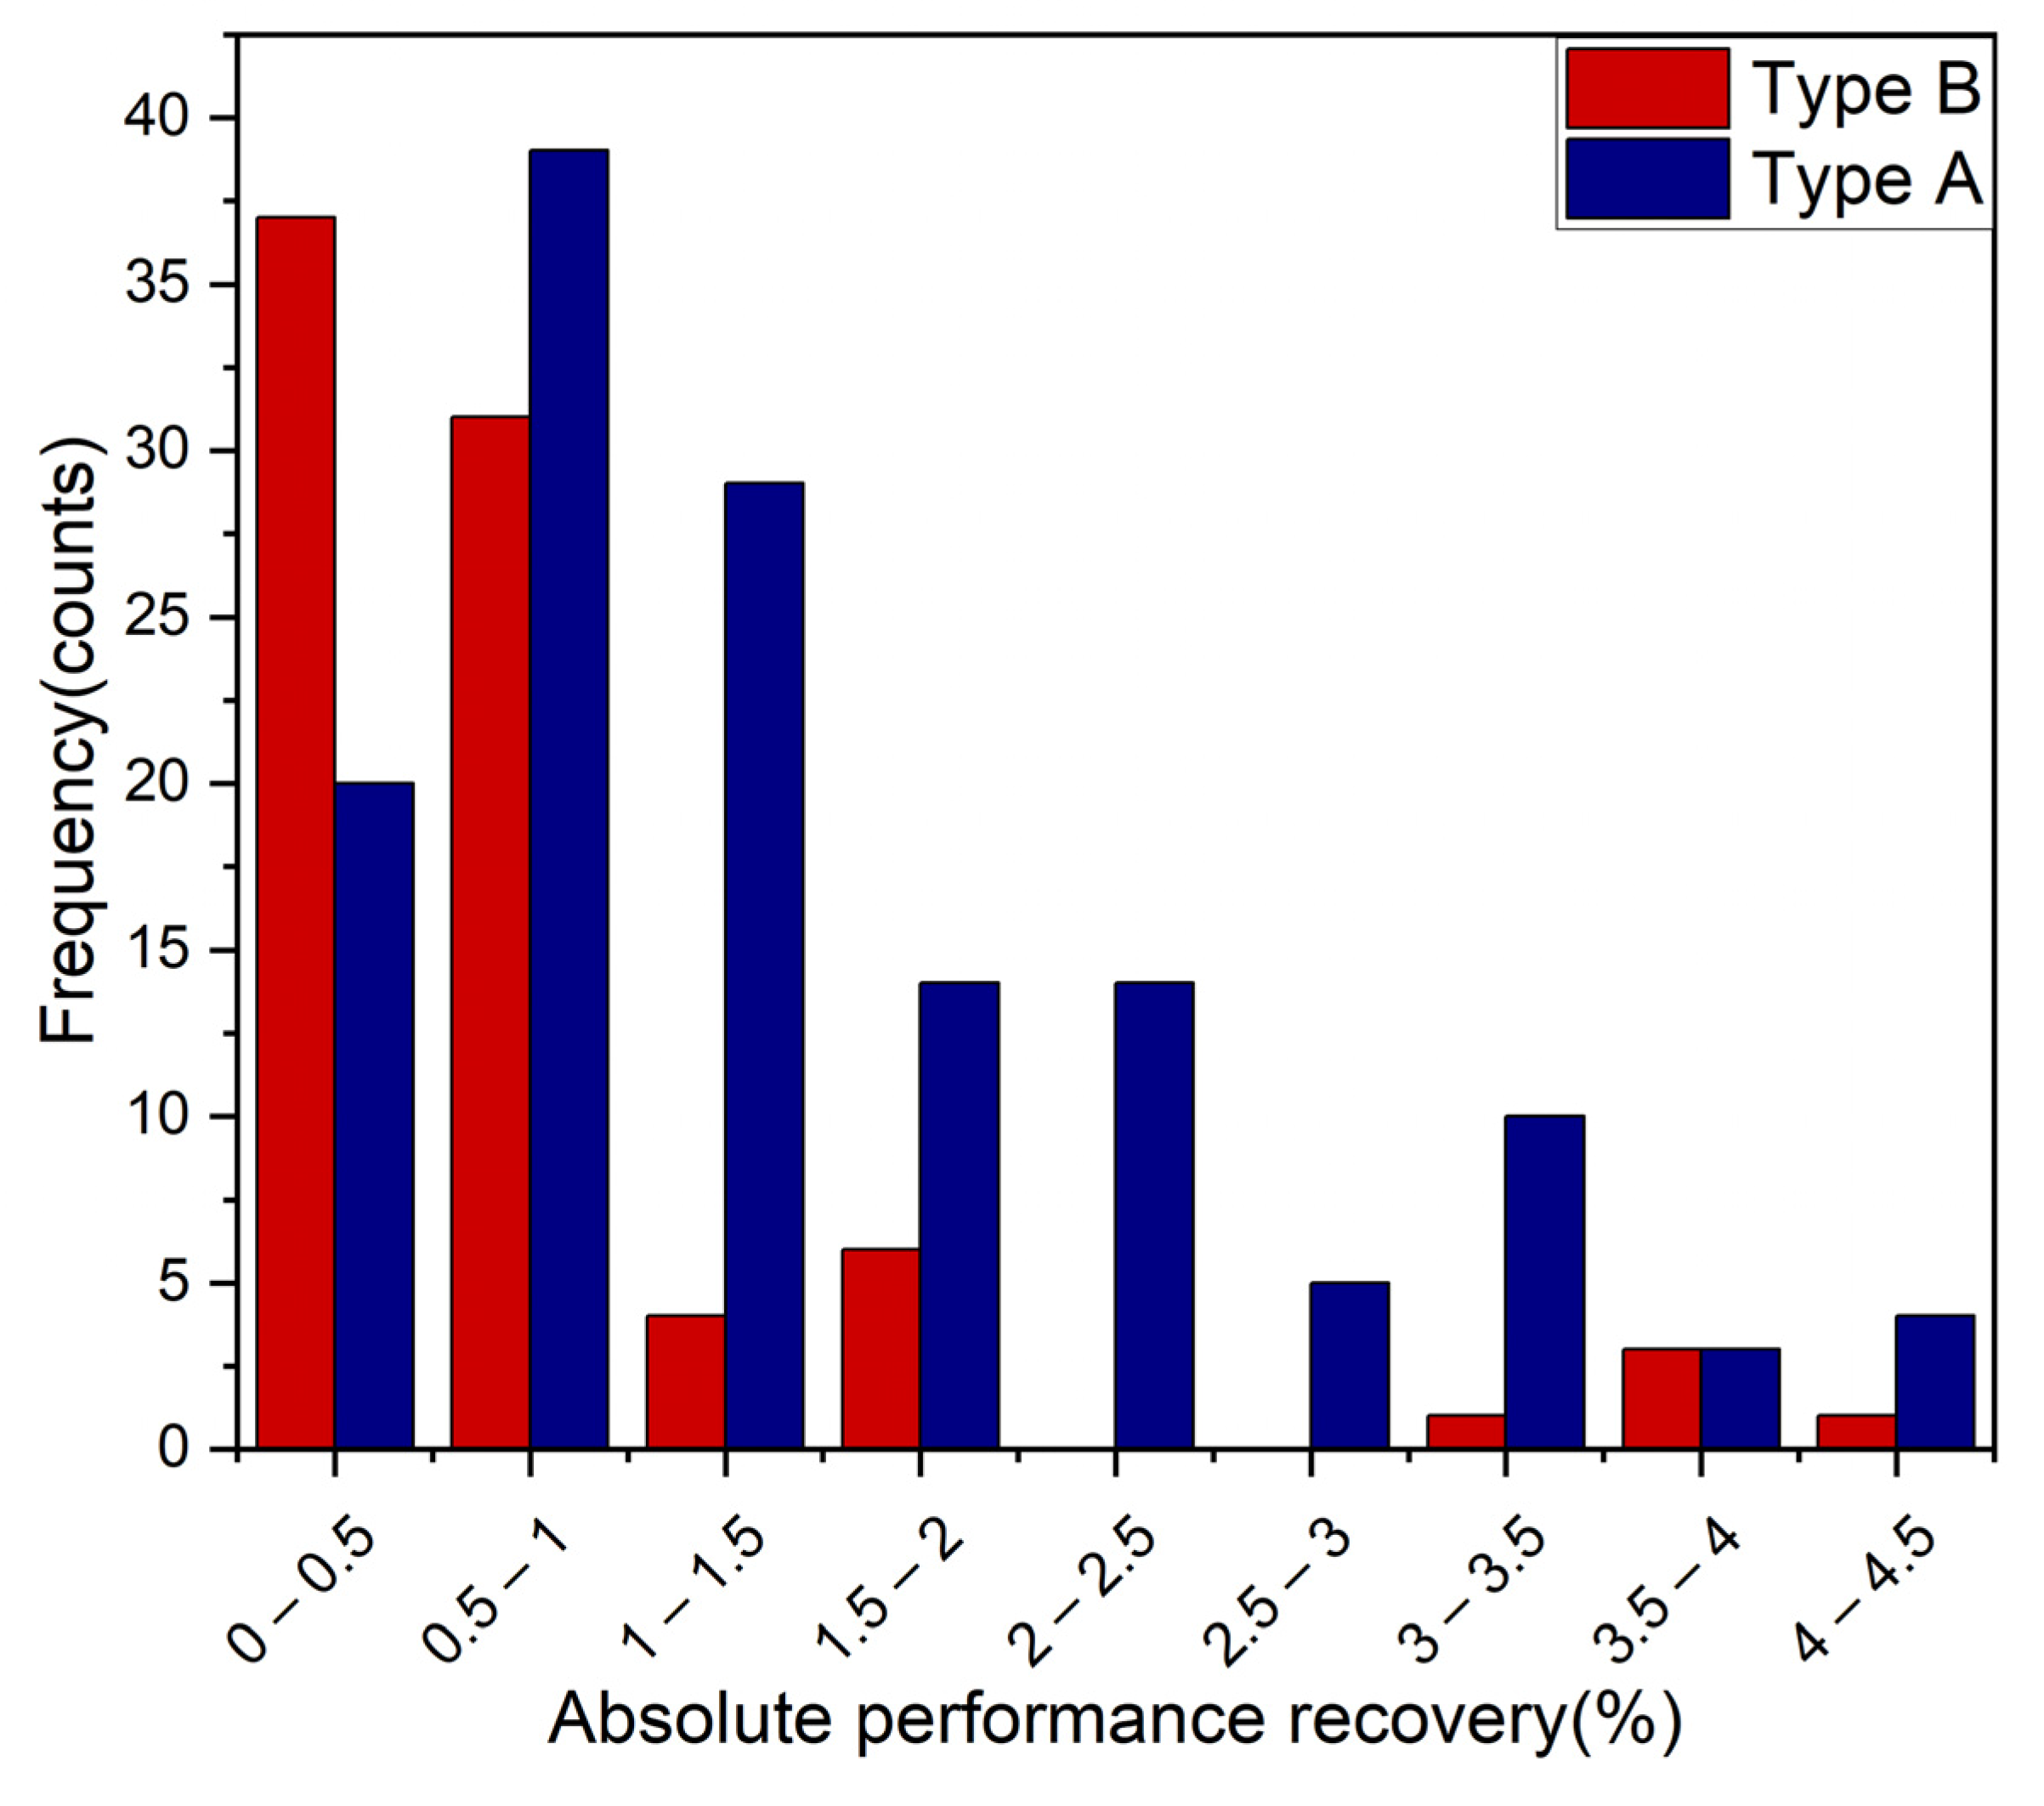
3.3. Performance Recovery Overnight

To find trends in recovery between the different types of module, the recovery of the modules was calculated over the entire period between January and May (Figure 11). Recovery processes mechanisms overnight might be related to defect healing, as well as to ion relaxation and ion redistribution on the devices [25,26]. The calculation considered the final efficiency values of the previous day and the initial efficiency values of the next day at the same irradiance levels. The resulting efficiency recovery values were normalized for comparative purposes. The data were filtered to exclude cloudy days from the analysis and this has been plotted in Figure 11. According to this figure, most instances of overnight performance recovery lie in the range from 0 up to 30%. Some instances of normalized performance recovery above 50% are obtained mainly during the first month of testing. Less dispersion and variation in recovery values are obtained in the fifth month of operation (May 2021). The other periods are characterized with larger dispersion and variation in recovery values.
To find the trend of the performance recovery over efficiency, the normalized performance recovery was plotted over efficiency for all the modules under study. Large dispersion of the normalized performance recovery was obtained especially in the low efficiency regime and, therefore, no clear trend of the recovery can be extracted over efficiency (Figure S4 Supplementary Material).
According to Figure 11, almost all instances of recovery lie in the range between 0 and 50%. By plotting the frequency of occurrence for the different normalized efficiency recovery values (see Supplementary Material, Figure S5, it can be observed that for type-A modules, the performance recovery is around 25–30% over most of the outdoor testing period. In type-B modules, the dominant efficiency recovery values lie in the bin 5–10%.
Absolute performance recovery was also calculated for the two types of modules under test and plotted as a histogram as depicted in Figure 12. Type-A modules present more instances of performance recovery in the bin 0.5–1%, while type-B modules present more instances of recovery in the bin 0–0.5% in agreement with the absolute diurnal performance degradation data from both types of modules.

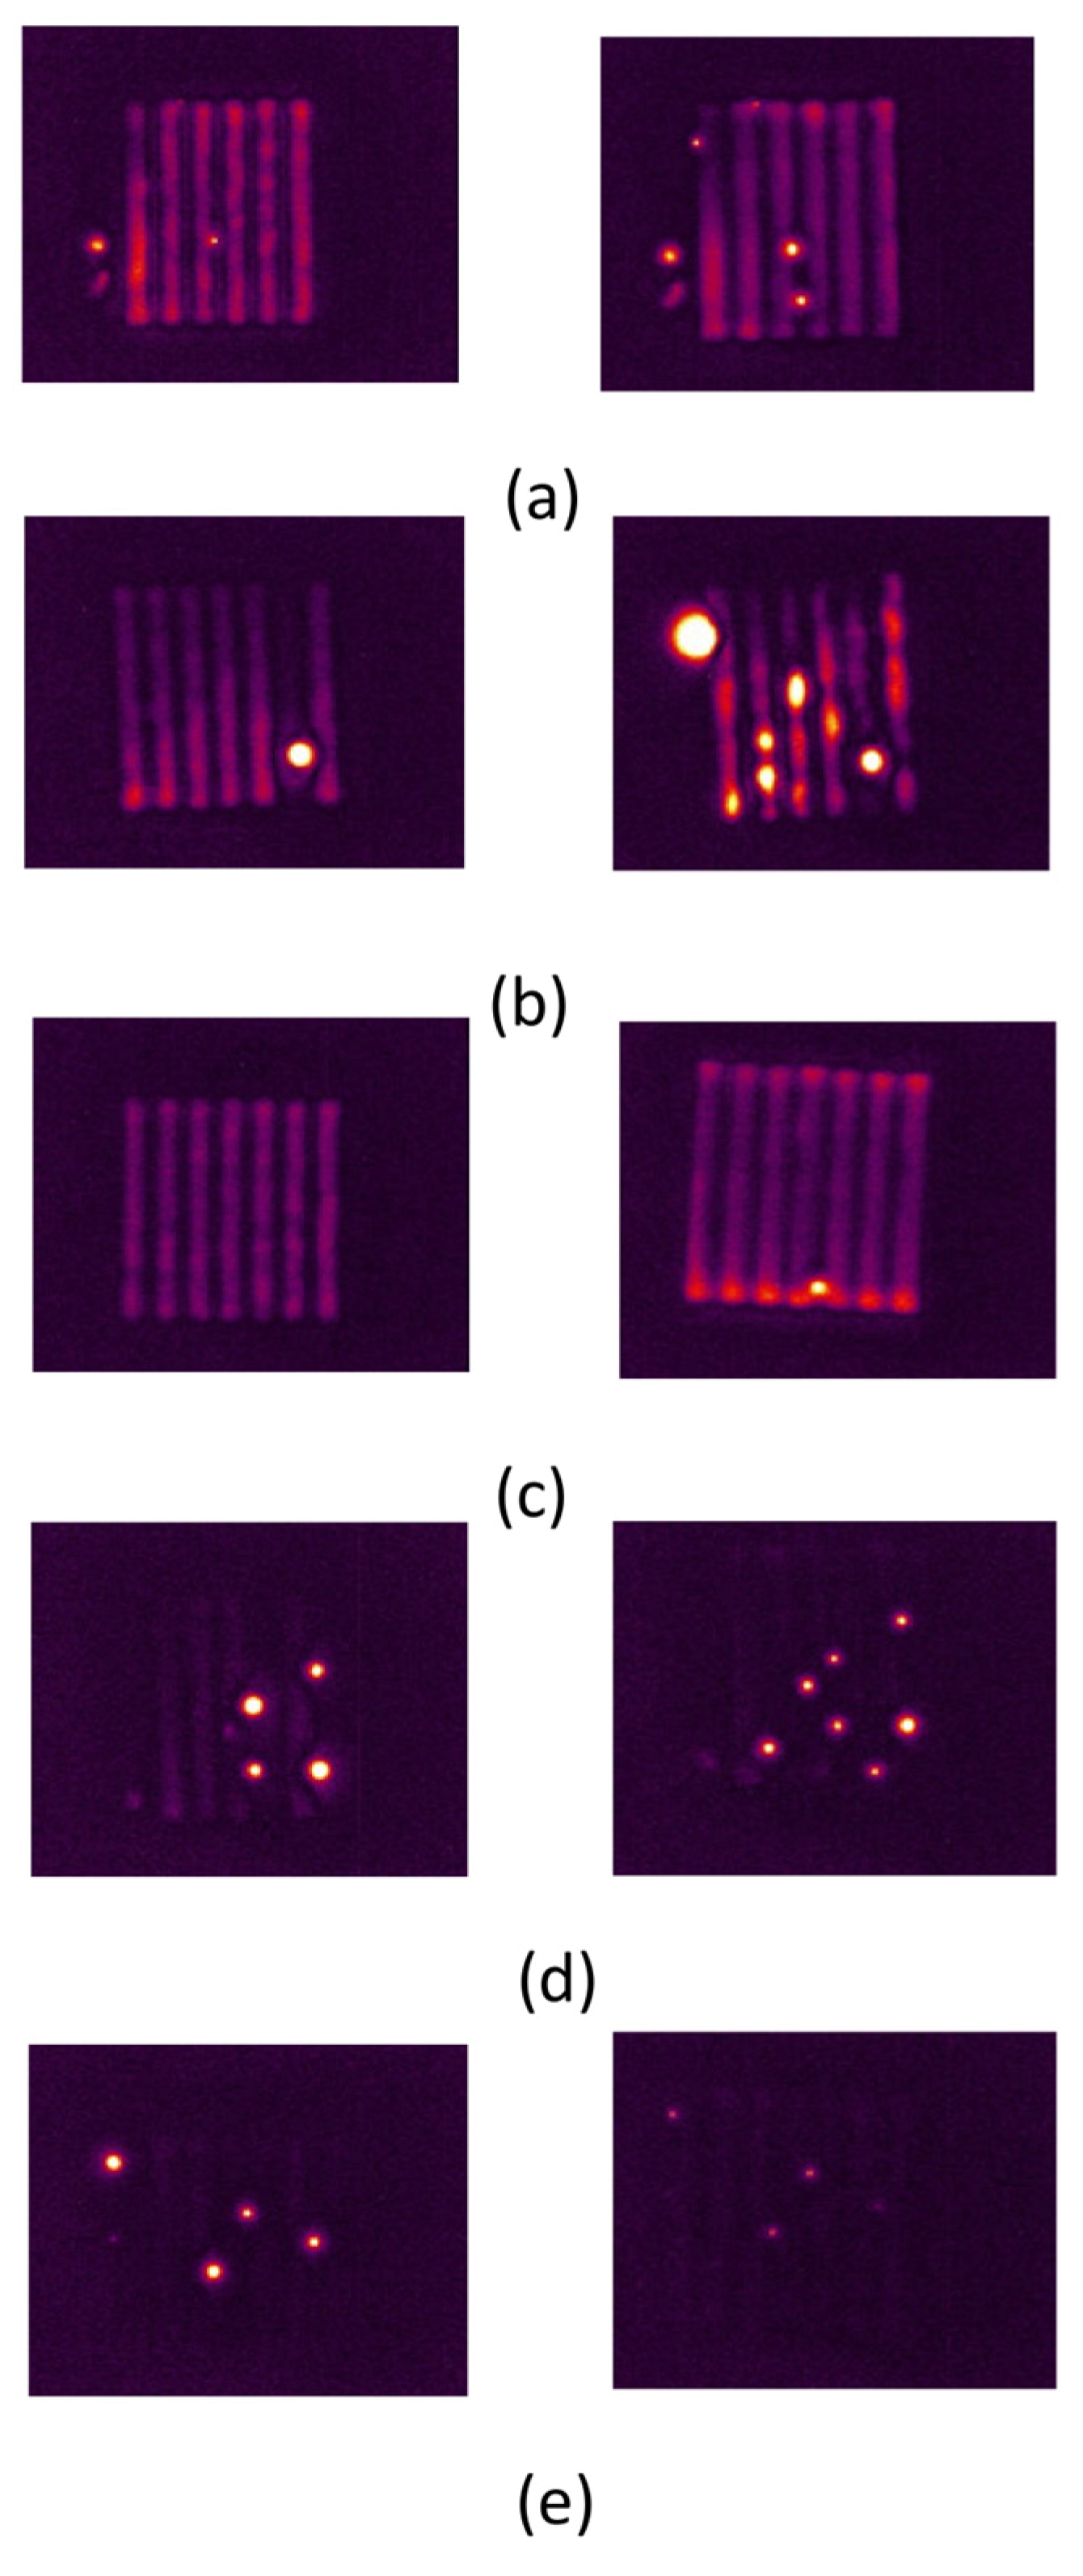
3.4. Dark Lock-in-Thermography (DLIT) Measurements

Fault-diagnosis techniques were applied to the samples to provide more information regarding the defect evolution over the layers composing the modules. With this aim, DLIT measurements were performed on all the modules under test before and after outdoor exposure at the same voltage and current levels to have comparable measurements. Module B1 (a type-B module) was severely degraded and DLIT measurements could not be performed on this sample. In all the modules under study, hotspots were obtained in the interconnection area of the cells as well as inside the cell active area. In all the modules of type A, the number of hotspots increased after outdoor exposure. This behavior was not observed in all the type-B modules under test. Furthermore, the thermal intensity of hotspots obtained in type-A modules was found to increase after their exposure outdoors (see Table S3 Supplementary Material). On the contrary, the rise of the thermal intensity within the hotspot area was not found in type-B modules. Instead, in type-B modules, a reduction of hotspot average thermal intensity was obtained in all hotspots of the modules present before outdoor testing. Therefore, the exposure of type-B modules to the field seems to reverse the hotspot evolution. This observation might be attributed to the presence of additives within the perovskite active layer, which improves the crystallinity of the cell; thus, hindering the formation of morphological defects that can cause hotspot evolution in a device. DLIT images from modules before and after outdoor testing are represented in Figure 13.

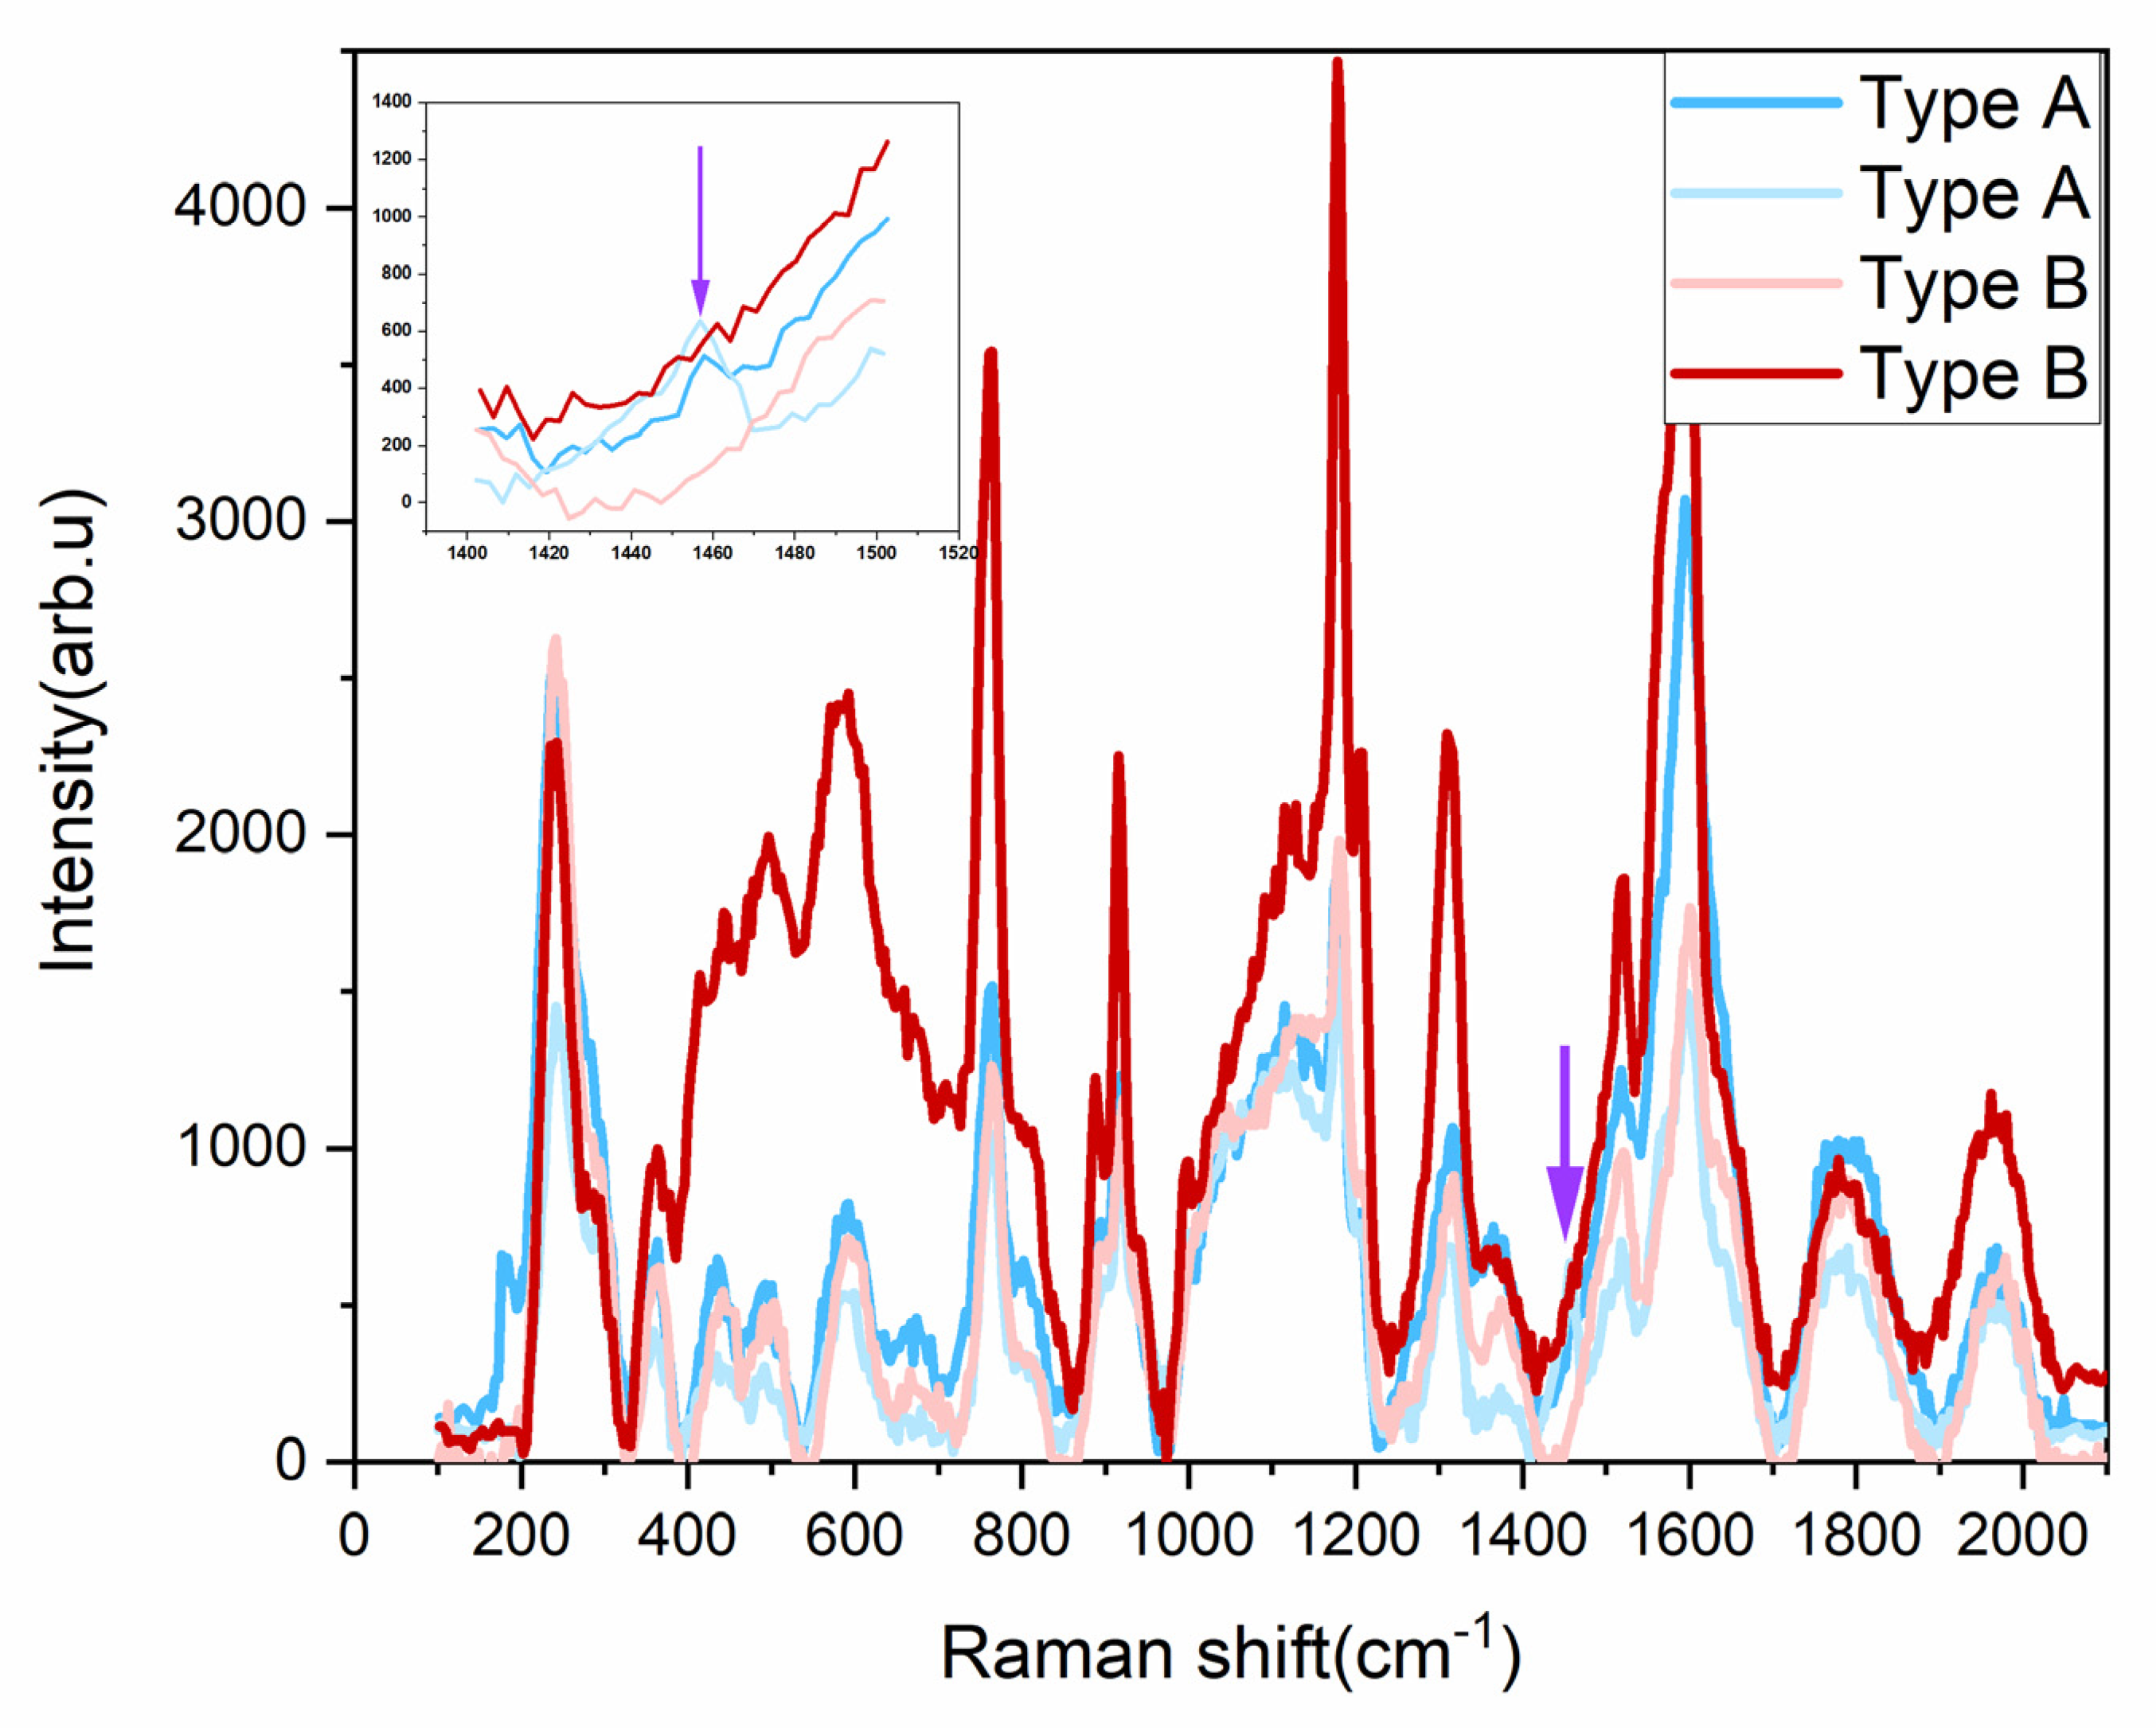
3.5. Raman Spectroscopy

To find the root cause of differences in degradation between both types of modules, Raman spectroscopy was applied on the modules after the end of outdoor testing to detect differences in their chemical properties. To have better statistical data, multiple-spots Raman spectra were collected. Raman spectra for both types of modules under test were similar and the only difference detected in their spectrum is the peak at around 1455 cm−1 (Figure 14). This peak was obtained in all the type-A modules, whereas it was absent in all the type-B devices under test.
The peak at 1455 cm–1 is assigned to the Ag pentagonal pitch mode of the fullerene C60 electron transport layer (ETL). Absence of this peak in type-B modules indicates molecular changes and degradation in the ETL material. Photo-dimerization of the fullerene molecule C60 is one of the degradation pathways in perovskite solar cells, which was proven to be a key mechanism that leads to short-circuit current reduction [27].

4. Conclusions

An outdoor assessment of perovskite modules with and without performance-enhancing additives was undertaken using several mini-modules to detect statistical differences in their outdoor performances. The beneficial effect of the additives was not detected over the outdoor testing of samples since mini-modules with additives in the active perovskite layer presented higher performance degradation over the same environmental conditions than their counterparts without additives in the perovskite layer. The higher current and consequently, higher efficiency degradation, are believed to be mainly attributed to open-circuit loading applied between IV scans and were observed clearly over the first days of outdoor exposure. A detailed investigation of the diurnal efficiency demonstrated an efficiency reduction for all the modules under study in the first hours of irradiance exposure, which in many cases was followed by efficiency regeneration over the course of the day. Higher efficiency values were recorded in the morning and lower in the afternoon. The main efficiency losses over the day are related to current reduction.
Higher occurrences of normalized diurnal performance degradation in the range between 15–20% were detected in type-A modules, while in type-B modules, diurnal performance degradation in the range 5–10% dominates. Efficiency recovery was obtained in all the modules under test overnight, indicating the meta-stability of trap states developing in the perovskites. More instances of normalized performance recovery lie in the range 25–30% for type-A modules and 5–10% for type-B modules.
Finally, DLIT measurements revealed different behaviors for the two types of modules: plain modules presented hotspot evolution and temperature increase within hotspots, while perovskites with FACl additives presented hotspot intensity reduction after outdoor exposure. Raman spectroscopy revealed the degradation of ETL material in modules with additives after field testing. The absence of one Raman peak in all the modules with additives is correlated with ETL vibrational modes and provides evidence of the significant degradation of this layer in the test modules with additives, which lead to their rapid degradation.

Supplementary Materials

The following supporting information can be downloaded at: https://www.mdpi.com/article/10.3390/en16062608/s1, Table S1: Efficiencies from all modules under study prior outdoor exposure. Figure S1: Pictures of the tested samples just after outdoor testing. Degradation due to humidity ingress is not obtained in the samples. Table S2: Open-circuit voltage coefficient for each week of outdoor exposure and for all type-A modules. Figure S2: (a) Relative short-circuit current over time for the 27 February 2021 and (b) short-circuit current against irradiance on the same day. Results correspond to Module A1; Figure S3: Frequency of occurrence for the absolute diurnal performance degradation in the range 0–4.5%; Figure S4: Normalized performance recovery against efficiency for all modules under study; Figure S5: Frequency of occurrence for the normalized performance recovery in the range 0–50%. Normalized performance recovery values were separated into bins of 5%; Table S3: Temperature of the two main hotspots within modules before and after outdoor exposure.

Author Contributions

Formal analysis, V.P., M.N., A.A., A.H., W.S. and T.F.; funding acquisition, M.H.; investigation, V.P., A.A., A.H., W.S., T.F. and R.E.; methodology, V.P. and M.H.; resources, A.A., A.H. and T.F.; software, M.N.; supervision, M.H. and G.E.G.; validation, M.N.; visualization, A.A., W.S., S.C. and R.E.; writing—original draft, V.P.; writing—review and editing, M.H. and M.N. All authors have read and agreed to the published version of the manuscript.

Funding

This work was funded through the European Regional Development Fund and the Republic of Cyprus in the framework of the project “Degradation Lab” with grant number INFRASTRUCTURES/1216/0043.

Data Availability Statement

Data are available upon request.

Conflicts of Interest

The authors declare no conflict of interest.

References

  1. Aranda, C.A.; Caliò, L.; Salado, M. Toward commercialization of stable devices: An overview on encapsulation of hybrid organic-inorganic perovskite solar cells. Crystals 2021, 11, 519. [Google Scholar] [CrossRef]
  2. Lee, S.W.; Kim, S.; Bae, S.; Cho, K.; Chung, T.; Mundt, L.E.; Lee, S.; Park, S.; Park, H.; Schubert, M.C.; et al. Degradation and Recovery of Perovskite Solar Cells. Sci. Rep. 2016, 6, 38150. [Google Scholar] [CrossRef] [Green Version]
  3. Zhang, H.; Qiao, X.; Shen, Y.; Wang, M. Effect of temperature on the efficiency of organometallic perovskite solar cells. J. Energy Chem. 2015, 24, 729–735. [Google Scholar] [CrossRef]
  4. Senocrate, A.; Acartürk, T.; Kim, G.Y.; Merkle, R.; Starke, U.; Grätzel, M.; Maier, J. Interaction of oxygen with halide perovskites. J. Mater. Chem. A 2018, 6, 10847–10855. [Google Scholar] [CrossRef] [Green Version]
  5. Mishra, A.K.; Shukla, R.K. Effect of humidity in the perovskite solar cell. Mater. Today Proc. 2019, 29, 836–838. [Google Scholar] [CrossRef]
  6. Xiang, W.; Liu, S.; Tress, W. A review on the stability of inorganic metal halide perovskites: Challenges and opportunities for stable solar cells. Energy Environ. Sci. 2021, 14, 2090–2113. [Google Scholar] [CrossRef]
  7. Deng, Y.; Xu, S.; Chen, S.; Xiao, X.; Zhao, J.; Huang, J. Defect compensation in formamidinium–caesium perovskites for highly efficient solar mini-modules with improved photostabilityitle. Nat. Energy 2021, 6, 633–641. [Google Scholar] [CrossRef]
  8. Khadka, D.B.; Shirai, Y.; Yanagida, M.; Miyano, K. Insights into Accelerated Degradation of Perovskite Solar Cells under Continuous Illumination Driven by Thermal Stress and Interfacial Junction. ACS Appl. Energy Mater. 2021, 4, 11121–11132. [Google Scholar] [CrossRef]
  9. Domanski, K.; Alharbi, E.A.; Hagfeldt, A. Systematic investigation of the impact of operation conditions on the degradation behaviour of perovskite solar cells. Nat. Energy 2018, 3, 61–67. [Google Scholar] [CrossRef]
  10. Tress, W.; Domanski, K.; Carlsen, B. Performance of perovskite solar cells under simulated temperature-illumination real-world operating conditions. Nat. Energy 2019, 4, 568–574. [Google Scholar] [CrossRef]
  11. Abdi-Jalebi, M.; Dar, M.I.; Sadhanala, A.; Senanayak, S.P.; Franckevičius, M.; Arora, N.; Hu, Y.; Nazeeruddin, M.K.; Zakeeruddin, S.M.; Grätzel, M.; et al. Impact of monovalent cation halide additives on the structural and optoelectronic properties of CH3NH3PbI3 perovskite. Adv. Energy Mater. 2016, 6, 1502472. [Google Scholar] [CrossRef] [Green Version]
  12. Kosmatos, K.O.; Theofylaktos, L.; Giannakaki, E.; Deligiannis, D.; Stergiopoulos, T. Μethylammonium Chloride: A Key Additive for Highly Efficient, Stable, and Up-Scalable Perovskite Solar Cells. Energy Environ. Mater. 2019, 2, 79–92. [Google Scholar] [CrossRef] [Green Version]
  13. Song, W.; Zhang, X.; Lammar, S.; Qiu, W.; Kuang, Y.; Ruttens, B.; D’Haen, J.; Vaesen, I.; Conard, T.; Abdulraheem, Y.; et al. Critical Role of Perovskite Film Stoichiometry in Determining Solar Cell Operational Stability: A Study on the Effects of Volatile A—Cation Additives. ACS Appl. Mater. Interfaces 2022, 14, 27922–27931. [Google Scholar] [CrossRef] [PubMed]
  14. Tavakoli, M.M.; Yadav, P.; Prochowicz, D.; Sponseller, M.; Osherov, A.; Bulović, V.; Kong, J. Controllable Perovskite Crystallization via Antisolvent Technique Using Chloride Additives for Highly Efficient Planar Perovskite Solar Cells. Adv. Energy Mater. 2019, 9, 1803587. [Google Scholar] [CrossRef]
  15. Zhang, H.; Hou, M.; Xia, Y.; Wei, Q.; Wang, Z.; Cheng, Y.; Chen, Y.; Huang, W. Synergistic effect of anions and cations in additives for highly efficient and stable perovskite solar cells. J. Mater. Chem. A 2018, 6, 9264–9270. [Google Scholar] [CrossRef]
  16. Velilla, E.; Ramirez, D.; Uribe, J.I.; Montoya, J.F.; Jaramillo, F. Outdoor performance of perovskite solar technology: Silicon comparison and competitive advantages at different irradiances. Sol. Energy Mater. Sol. Cells 2019, 191, 15–20. [Google Scholar] [CrossRef]
  17. Jošt, M.; Lipovšek, B.; Glažar, B.; Al-Ashouri, A.; Brecl, K.; Matič, G.; Magomedov, A.; Getautis, V.; Topič, M.; Albrecht, S. Perovskite Solar Cells go Outdoors: Field Testing and Temperature Effects on Energy Yield. Adv. Energy Mater. 2020, 10, 2000454. [Google Scholar] [CrossRef]
  18. Rakocevic, L.; Mundt, L.E.; Gehlhaar, R.; Merckx, T.; Aernouts, T.; Schubert, M.C.; Glunz, S.W.; Poortmans, J. Loss Analysis in Perovskite Photovoltaic Modules. Sol. RRL 2019, 3, 1900338. [Google Scholar] [CrossRef]
  19. Misra, R.K.; Ciammaruchi, L.; Aharon, S.; Mogilyansky, D.; Etgar, L. Effect of Halide Composition on the Photochemical Stability of Perovskite Photovoltaic Materials. ChemSusChem 2016, 9, 2572–2577. [Google Scholar] [CrossRef] [Green Version]
  20. Paraskeva, V.; Norton, M.; Hadjipanayi, M.; Hadipour, A.; Aguirre, A.; Ebner, R.; Georghiou, E.G. Outdoor monitoring and assessment of perovskite mini-modules. In Proceedings of the 38th European Photovoltaic Solar Energy Conference (EU PVSEC), Online, 6–10 September 2021; pp. 441–444. [Google Scholar]
  21. Domanski, K.; Roose, B.; Matsui, T.; Saliba, M.; Turren-Cruz, S.H.; Correa-Baena, J.P.; Carmona, C.R.; Richardson, G.; Foster, J.M.; De Angelis, F.; et al. Migration of cations induces reversible performance losses over day/night cycling in perovskite solar cells. Energy Environ. Sci. 2017, 10, 604–613. [Google Scholar] [CrossRef] [Green Version]
  22. Lammar, S.; Escalante, R.; Riquelme, A.J.; Jenatsch, S.; Ruhstaller, B.; Oskam, G.; Aernouts, T.; Anta, J.A. Impact of non-stoichiometry on ion migration and photovoltaic performance of formamidinium-based perovskite solar cells. J. Mater. Chem. A 2020, 10, 18782–18791. [Google Scholar] [CrossRef]
  23. Cai, B.; Yang, X.; Yu, Z.; Liang, Y.; Shan, Y.; Hagfeldt, A.; Sun, L. Unveiling the light soaking effects of the CsPbI3 perovskite solar cells. J. Power Sources 2020, 472, 228506. [Google Scholar] [CrossRef]
  24. Herterich, J.; Unmüssig, M.; Loukeris, G.; Kohlstädt, M.; Würfel, U. Ion Movement Explains Huge Voc Increase despite Almost Unchanged Internal Quasi-Fermi-Level Splitting in Planar Perovskite Solar Cells. Energy Technol. 2021, 9, 2001104. [Google Scholar] [CrossRef]
  25. Nie, W.; Blancon, J.C.; Neukirch, A.J.; Appavoo, K.; Tsai, H.; Chhowalla, M.; Alam, M.A.; Sfeir, M.Y.; Katan, C.; Even, J.; et al. Light-activated photocurrent degradation and self-healing in perovskite solar cells. Nat. Commun. 2016, 7, 11574. [Google Scholar] [CrossRef] [Green Version]
  26. Tress, W.; Yavari, M.; Domanski, K.; Yadav, P.; Niesen, B. Interpretation and evolution of open-circuit voltage, recombination, ideality factor and subgap defect states during reversible light-soaking and irreversible degradation of perovskite solar cells. Energy Environ. Sci. 2018, 11, 151–165. [Google Scholar] [CrossRef]
  27. Mateker, W.R.; McGehee, M.D. Progress in Understanding Degradation Mechanisms and Improving Stability in Organic Photovoltaics. Adv. Mater. 2017, 29, 1603940. [Google Scholar] [CrossRef]
Figure 1. Semitransparent p-i-n module design from imec. P1: disconnect the bottom ITO electrode; P2: open the stack for interconnection; P3: disconnect the top ITO electrode.
Energies 16 02608 g001
Figure 2. (a) Accumulated irradiation exposure of the modules over the testing period; (b) mean weekly ambient and module temperature between 12 January and 13 May; and (c) relative humidity levels against ambient temperature at the testing site over the same period.
Energies 16 02608 g002
Figure 3. Weekly average performance of perovskite mini-modules of type A (A1, A2, A3) and B (B1, B2, B3) the first 16 weeks of outdoor exposure. Efficiency at reverse sweeps is reported in the graph.
Energies 16 02608 g003
Figure 4. Power conversion efficiency loss of all modules under test the first 6 days of outdoor exposure.
Energies 16 02608 g004
Figure 5. Current-voltage curves in (a) cells with additives (type B modules) and (b) without additives (type A modules) before and after MPP and open-circuit loading for several minutes.
Energies 16 02608 g005
Figure 6. Weekly average performance (normalized values) of perovskites mini-modules of type A (A1, A2, A3) and B (B1, B2, B3) the first 16 weeks of outdoor exposure. Efficiency at reverse sweeps is reported on the graph.
Energies 16 02608 g006
Figure 7. Normalized (a) open-circuit voltage, (b) short-circuit current and (c) fill-factor degradation of perovskites mini-modules of type A (A1, A2, A3) and B (B1, B2, B3) the first 16 weeks of outdoor exposure. Data obtained using reverse voltage sweeps are reported in the graphs.
Energies 16 02608 g007
Figure 8. Diurnal change of performance for two modules under test for four days in winter (7–10 February 2021). Higher efficiency values are obtained in the morning due to performance recovery overnight.
Energies 16 02608 g008
Figure 9. Different trends of diurnal efficiency obtained from the different modules. Module A2 presents an efficiency reduction, while module B3 presents an efficiency increase over the course of a day. Module A1 presents an initial efficiency reduction followed by increase after some time.
Energies 16 02608 g009
Figure 10. Frequency of occurrence for the normalized diurnal performance degradation in the range 0–50%. Normalized diurnal efficiency degradation values were separated into bins of 5%.
Energies 16 02608 g010
Figure 11. Performance recovery data of the modules the testing period between January–May 2021. Normalized values of the recovery are shown.
Energies 16 02608 g011
Figure 12. Frequency of occurrence for the absolute performance recovery in the range 0–4.5%. Absolute performance recovery values were separated into bins of 0.5%.
Energies 16 02608 g012
Figure 13. DLIT images of the modules (a) A1, (b) A2, (c) A3, (d) B2 and (e) B3 before (left) and after (right) outdoor testing.
Energies 16 02608 g013
Figure 14. Raman spectra of modules without (type A) and with additives (type B). Difference detected at 1455 cm–1 (indicated by the purple arrow).
Energies 16 02608 g014
Disclaimer/Publisher’s Note: The statements, opinions and data contained in all publications are solely those of the individual author(s) and contributor(s) and not of MDPI and/or the editor(s). MDPI and/or the editor(s) disclaim responsibility for any injury to people or property resulting from any ideas, methods, instructions or products referred to in the content.

