Review

A Literature Review on Methods and Metrics for the Analysis of Outdoor Air Displacement Conditions in the Urban Environment

Faculty of Engineering, Free University of Bozen-Bolzano, 39100 Bolzano, Italy
*
Author to whom correspondence should be addressed.
Energies 2023, 16(6), 2577; https://doi.org/10.3390/en16062577
Submission received: 30 December 2022 / Revised: 4 March 2023 / Accepted: 6 March 2023 / Published: 9 March 2023
(This article belongs to the Special Issue Applications of Building Energy Performance Simulation)

Abstract

:
The ongoing pandemic has driven the attention of both policy makers and professionals of the building sector towards the need for proper ventilation of the indoor environment. Despite accurate ventilation control only being available with mechanical ventilation systems, in several countries worldwide the renovation of indoor air relies mainly on natural solutions. In this context, in the design of new or renovated buildings, conventional natural ventilation rates are typically assumed to be in agreement with available technical standards, sometimes regardless of the actual external conditions. For instance, local wind speed and direction, as well as buoyancy-driven air displacements, are not considered, even if they can significantly affect the ventilation efficacy for the designed buildings. Moreover, the local outdoor temperature and the presence of pollutants are rarely accounted for, even though they can represent interesting inputs not only for naturally ventilated buildings but also for mechanical ventilation systems. In the framework described above, this review paper aims to provide an overview of the current state-of-the-art of the research regarding air displacement and conditions in the urban context, focusing on the main methods, parameters and metrics to consider in order to ensure a deeper and more accurate modelling of natural ventilation potential in the urban built environment. The analysis of the literature includes both experimental and numerical studies. As regards the latter ones, the features of the chosen urban areas—real or parametric ones—the adopted turbulence models and the indexes calculated as simulation outputs were analysed, with the purpose of defining a common framework to support future extensive numerical studies.

1. Introduction

The United Nations (UN) estimates that by 2030 urban areas will house 60% of people globally and one in every three people will live in cities with at least half a million inhabitants [1]. This will happen because of the migration of the people from rural to urban areas and the transformation of the former into the latter [1], characterized by public and private services that are of higher quality and are more easily accessible [2]. Given this context, it is necessary, on one hand, to understand the key trends of urbanization and, on the other hand, to implement strategies to make cities and human settlements more inclusive, safe, resilient, and sustainable [1,2].
The growth of cities is also responsible for the alteration of natural surroundings, with an impact on the local micro-climatic characteristics [
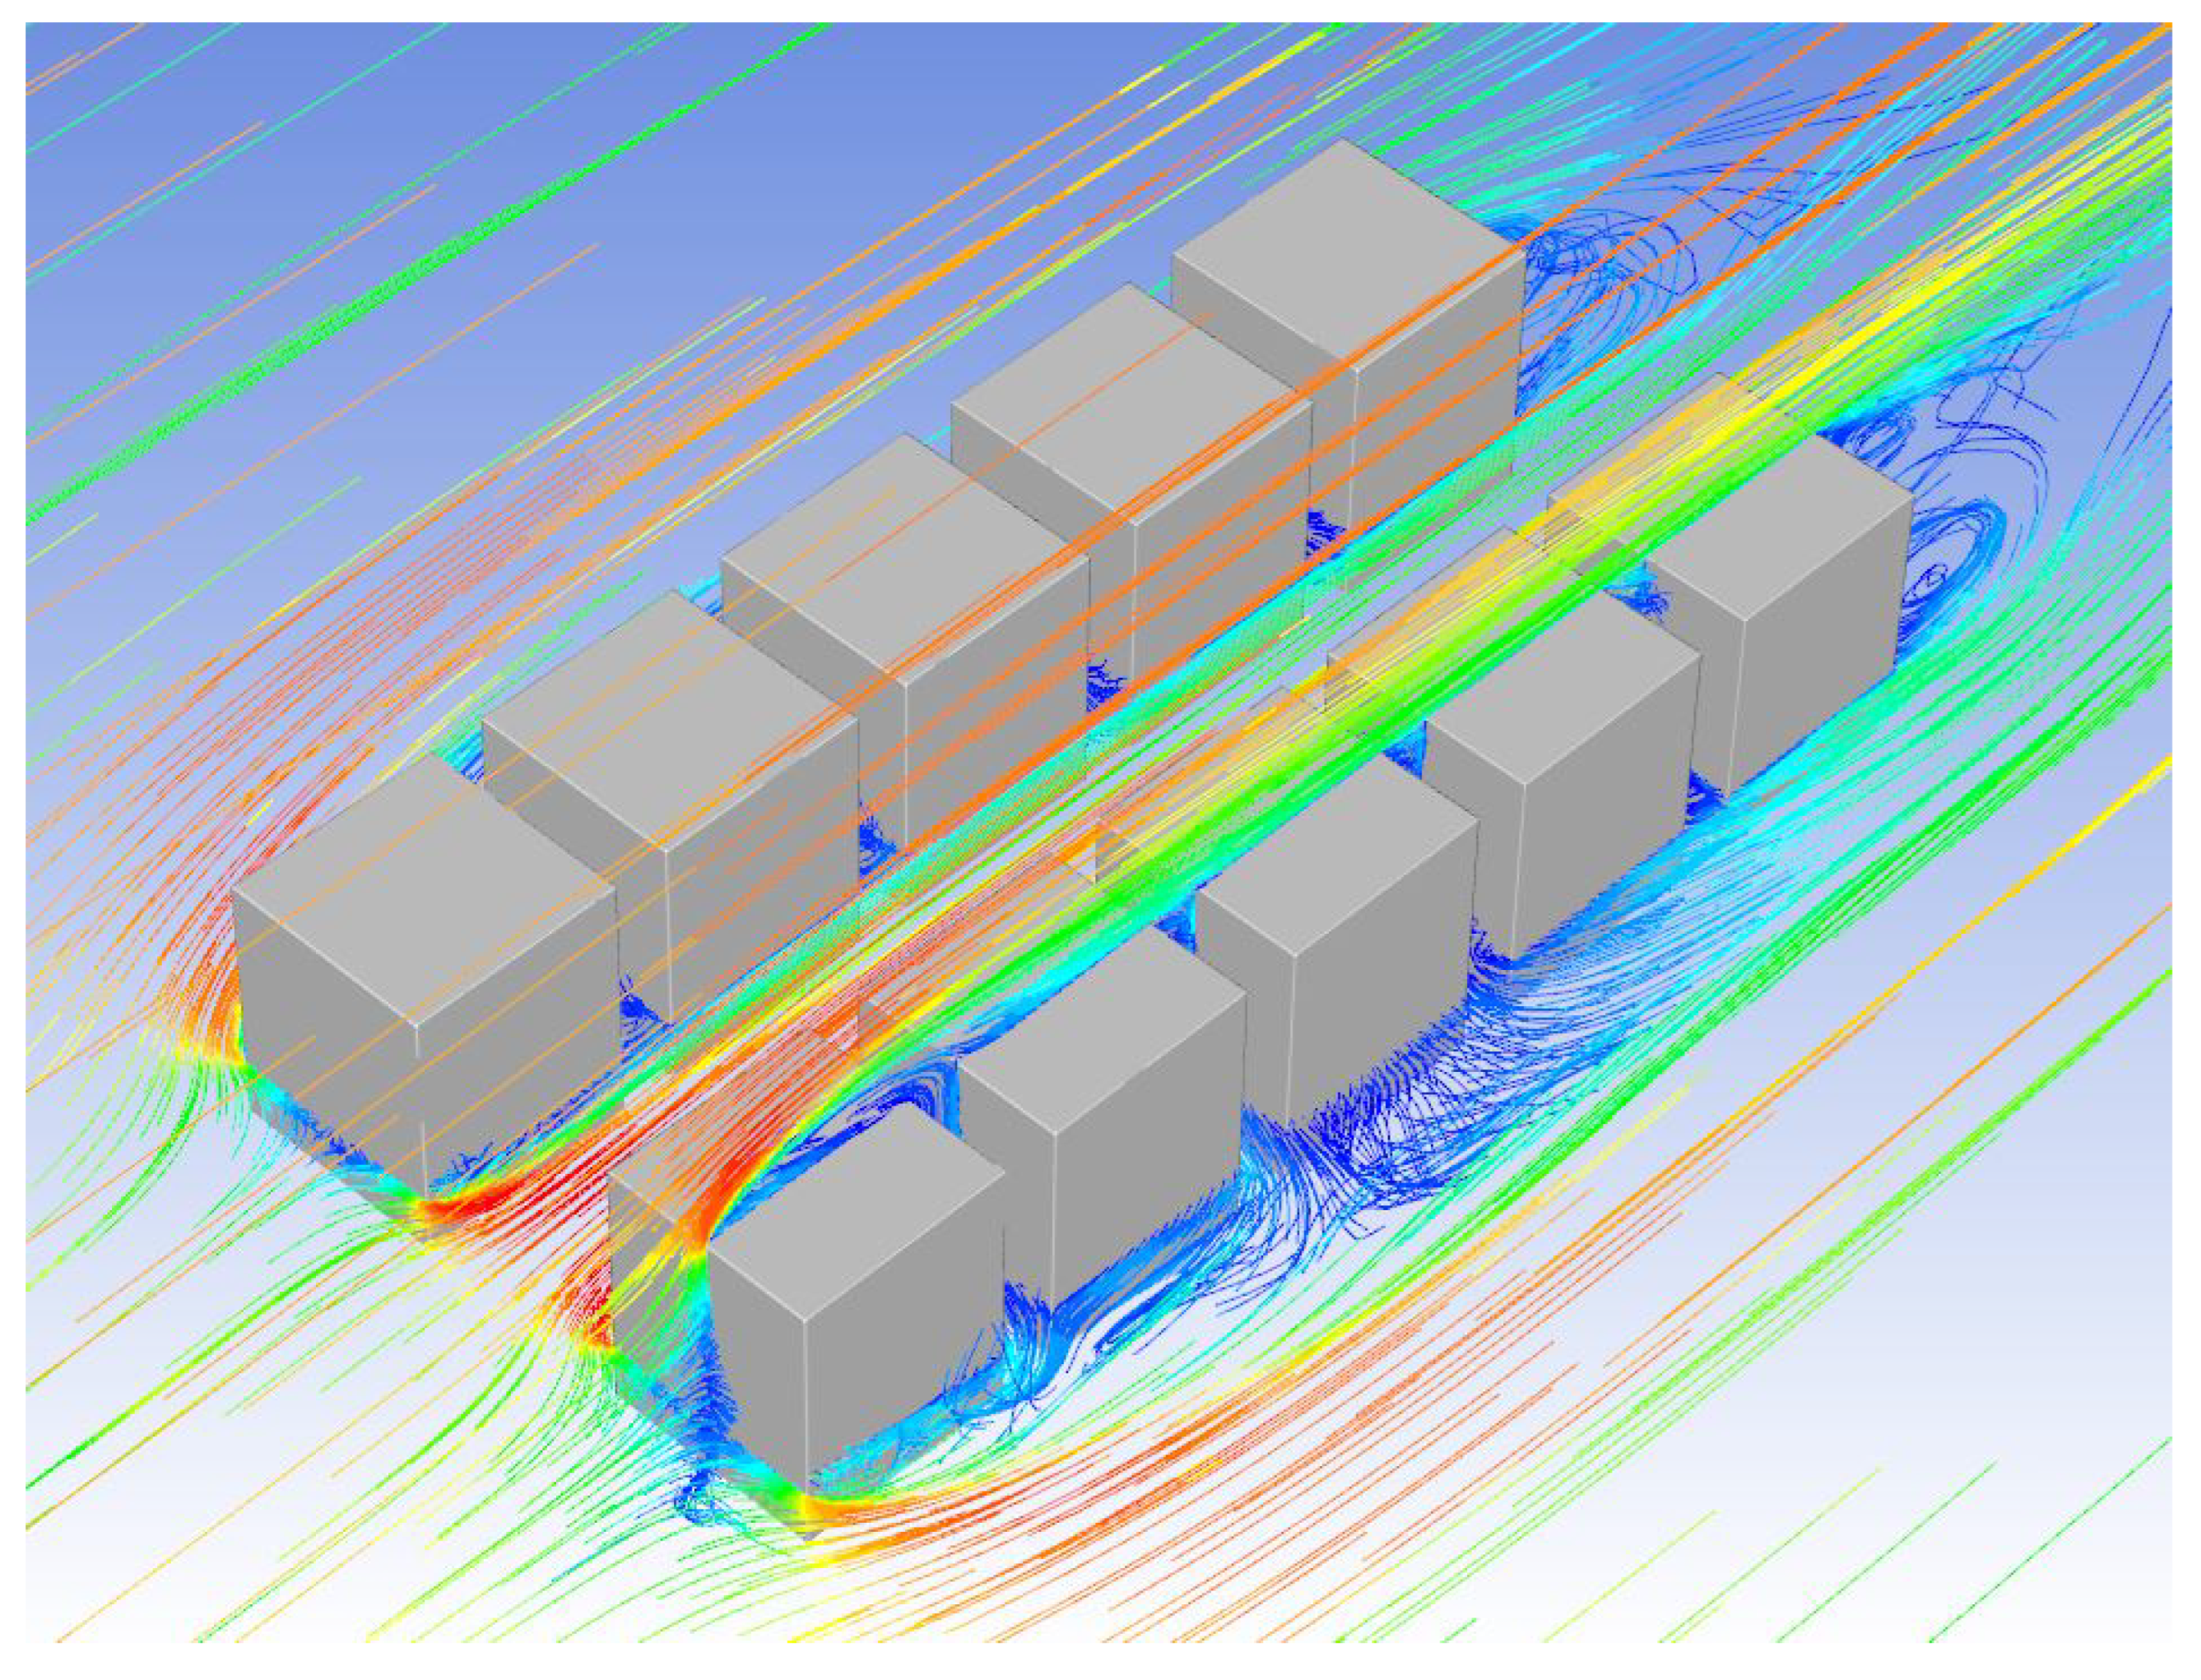
3]. Indeed, for instance, buildings can act as obstacles to the wind flow, channelling air into specific paths depending on the geometry, size and orientation of the urban layout. As an example, Figure 1 shows airflow streamlines around buildings acting as obstacles, causing the airflow to change its magnitude and direction. This diversion in the flow results in the occurrence of vortexes, recirculations and flow separation depending on the size and geometry of the buildings, which are responsible for sufficient air availability for ventilation purposes.
As pointed out by many studies in the literature, understanding the wind flow behaviour around buildings in cities, with both generic and real layouts and at different geometric scales, can be beneficial to characterize the actual performance of the building’s natural ventilation (NV) strategies, determining when they are a feasible solution for indoor air renovation [4,5]. For instance, some researches consider not only the more common wind driven-flows [6,7,8,9,10,11], occurring in the urban environment because of pressure differences generated by wind flow, or the buoyancy-driven ones [12,13,14,15,16,17], occurring as a result of air temperature and density differences in adjacent locations, but also the combined effects of both [18,19,20,21,22,23]. In the case of buildings, wind causes a positive pressure on the windward side and a negative pressure on the leeward side of buildings to have wind-driven flows, while in the case of buoyancy-driven flows, warm air goes up and cool air remains low, causing air displacement [15,24]. 
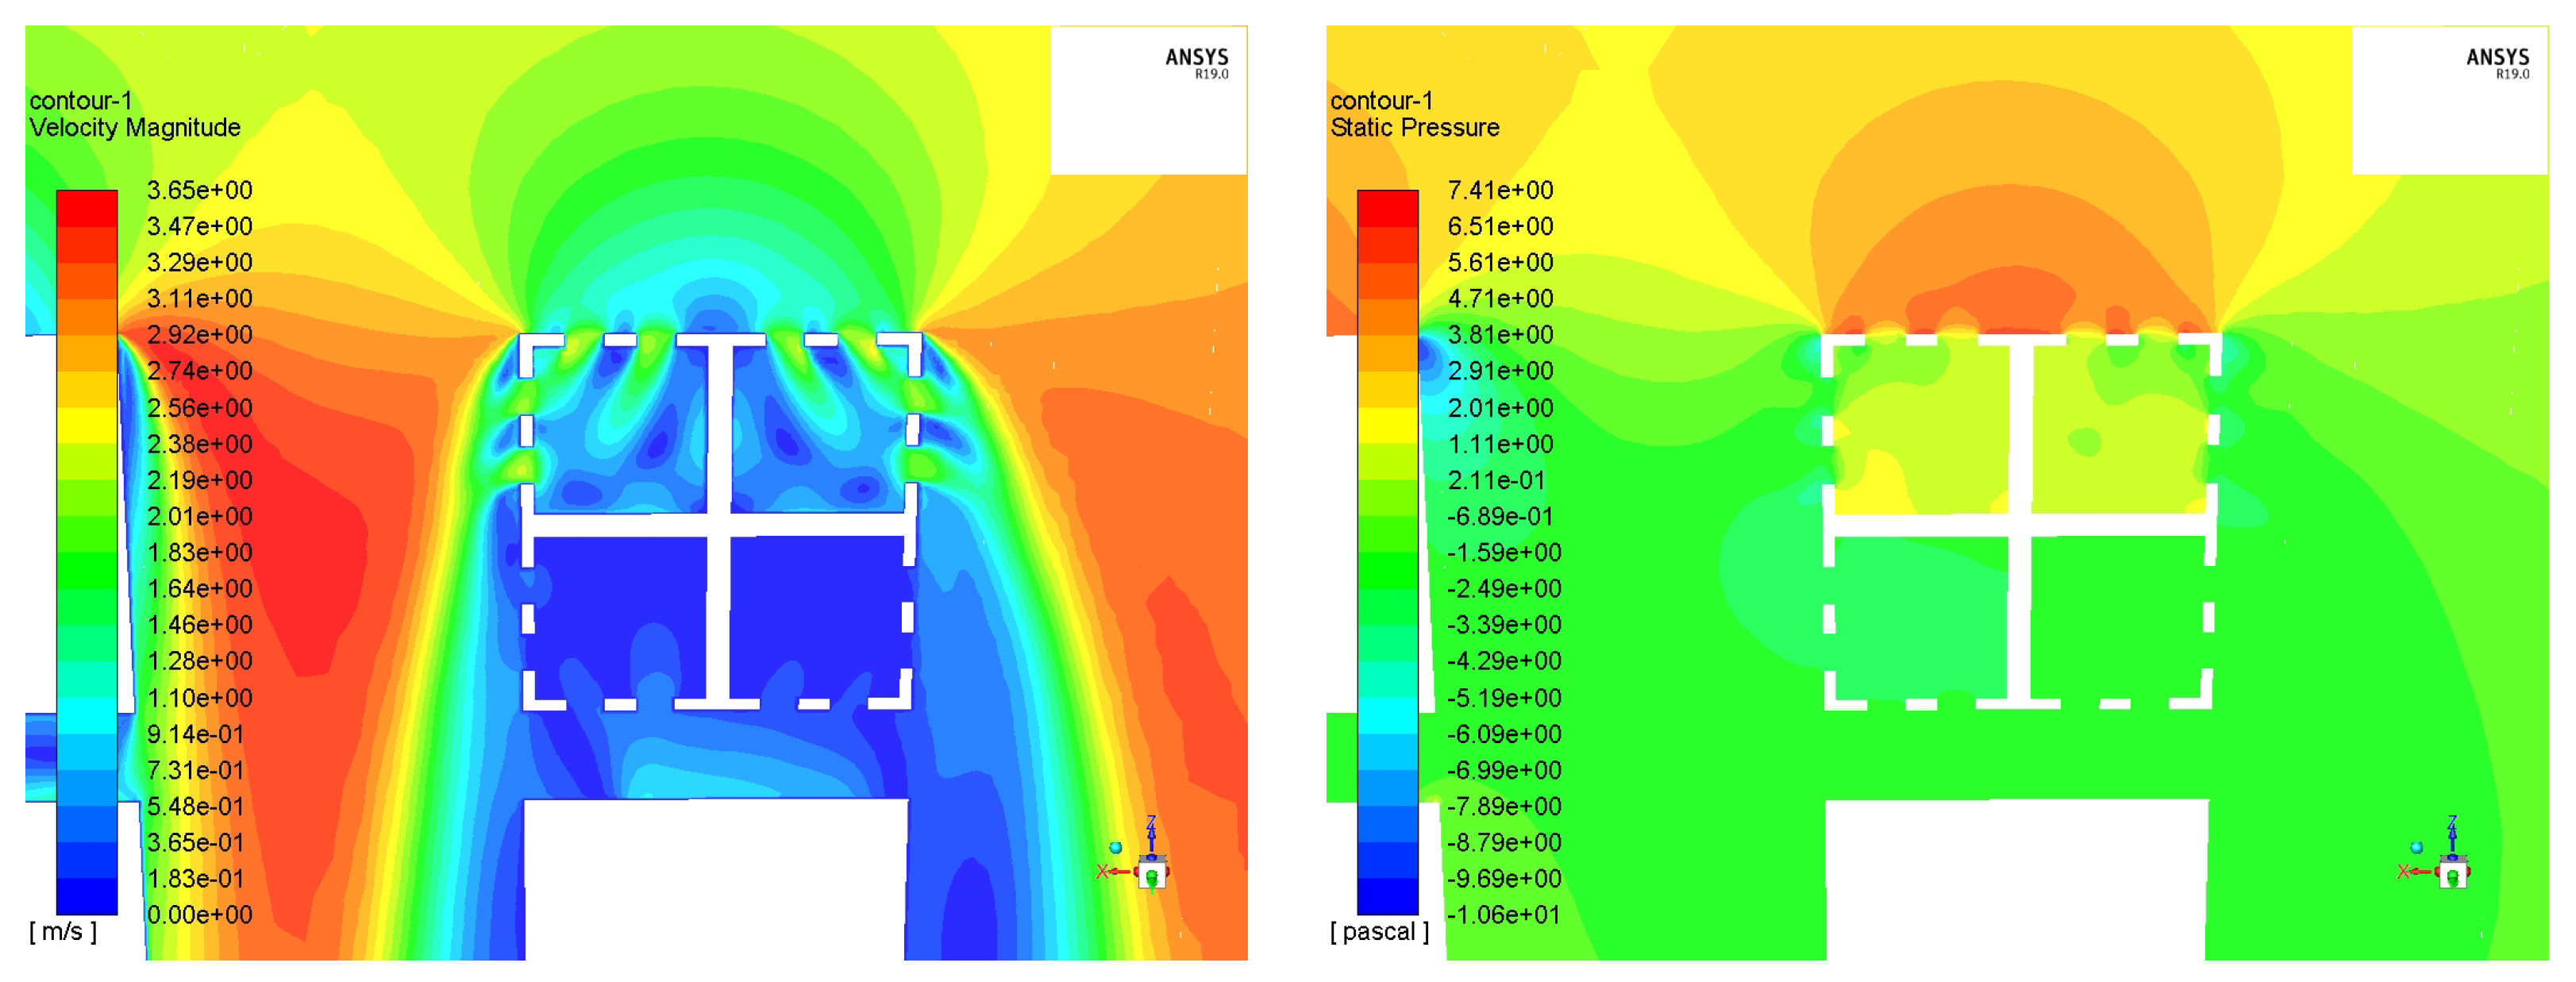
Figure 2 gives an example of wind-driven flows: the top side is the windward side, experiencing positive pressures, while the leeward side on the bottom registers negative pressures. The pressure gradient on different building sides can then ensure the natural ventilation of the indoor environments.
While understanding natural ventilation (NV) strategies, air displacement and wind flow behaviour, there are some parameters and metrics to take into consideration. These are related, in particular, to the building’s geometries, the surface properties of the building’s materials and the local microclimatic conditions. Some examples of parameters are building height, street aspect ratio, floor area ratio, wind velocity, mean air temperature, radiation and surface roughness. The scale of the analysis is particularly important for the assessment of the potential of natural ventilation in the urban context, with different aspects influencing the outcome of the analysis as reported by different contributions in the literature [25,26,27,28,29,30,31]. One of the most interesting cases is street canyons, whose study can help us to understand, for instance, the dispersion of pollutants around the buildings and how this can affect human health [3,4,12,13,14,15,16,18,21,22,23,31,32,33,34,35,36,37,38,39,40].
As mentioned before, these studies are often carried out experimentally or with CFD (computational fluid dynamics) simulations, as shown by Duan and Ngan [20], Chatzimichailidis et al. [32] and Lo and Ngan [38] in their studies on street canyon. As regards the experiments, they are either field measurements or performed in controlled environments. The field measurements prove to be useful to understand the climatic conditions of a given urban location, as demonstrated by Mosteiro-Romero, et al. [28], Chatzidimitriou and Yannas [31] and Zhao et al. [33]. On the contrary, wind tunnel tests are often used to validate the results obtained from either field measurements or with CFD simulations, as demonstrated by other authors, such as King et al. [6], Tan et al. [18], Zhao et al. [33], Yang et al. [34], Ricci et al. [41], Li et al. [42] and Izadyar et al. [43].
However, it is sometimes difficult to perform these experimental activities because of some constraints, such as a limited number of measurement points, limited availability of resources, size and time constraints, financial constraints, non-changeable or uncontrollable boundary conditions, etc. In these cases, many researchers have proposed performing studies at a reduced scale, by taking into consideration the similarity criteria. For instance, Zhao et al. [33], Yang et al. [34] and Chen et al. [35] performed reduced-scale experiments and CFD simulations of street canyons with natural ventilation.
In the framework described above, this review aims to provide an overview of the current state-of-the-art of the research regarding air displacement and conditions in the urban context, focusing on adopted experimental and numerical methods, as well as parameters, metrics and performance indicators, with the goal of identifying the main research trends and gaps to consider in order to ensure a deeper and more accurate modelling of natural ventilation potential in the urban built environment. The study was performed as a structured literature review, categorising the analysed papers according to some selected variables, such as year of publication, type of building/building layout, type of flow, type of CFD tools used, type of experiment and considered parameters. This allowed us to depict an objective overview of methods and metrics, facilitating the identification of the most common approaches as well as of the current gaps in the literature.

2. Methods: Collection and Classification of Relevant Papers

For the review purpose, a total of 89 studies were investigated. These studies were collected from the Scopus database by using some specific keywords related to urban ventilation, and with a publication year after 1990. The most important selected keywords are “urban ventilation”, “urban CFD”, “natural ventilation”, “street canyon” and “wind tunnel”. The oldest study considered in this review is from the year 1991 and the most recent study is from the year 2021. Specific attention was given to the most recent methodological trends, e.g., studies published later in 2021, which have been analysed in Section 6 “Recent developments in the review”. 
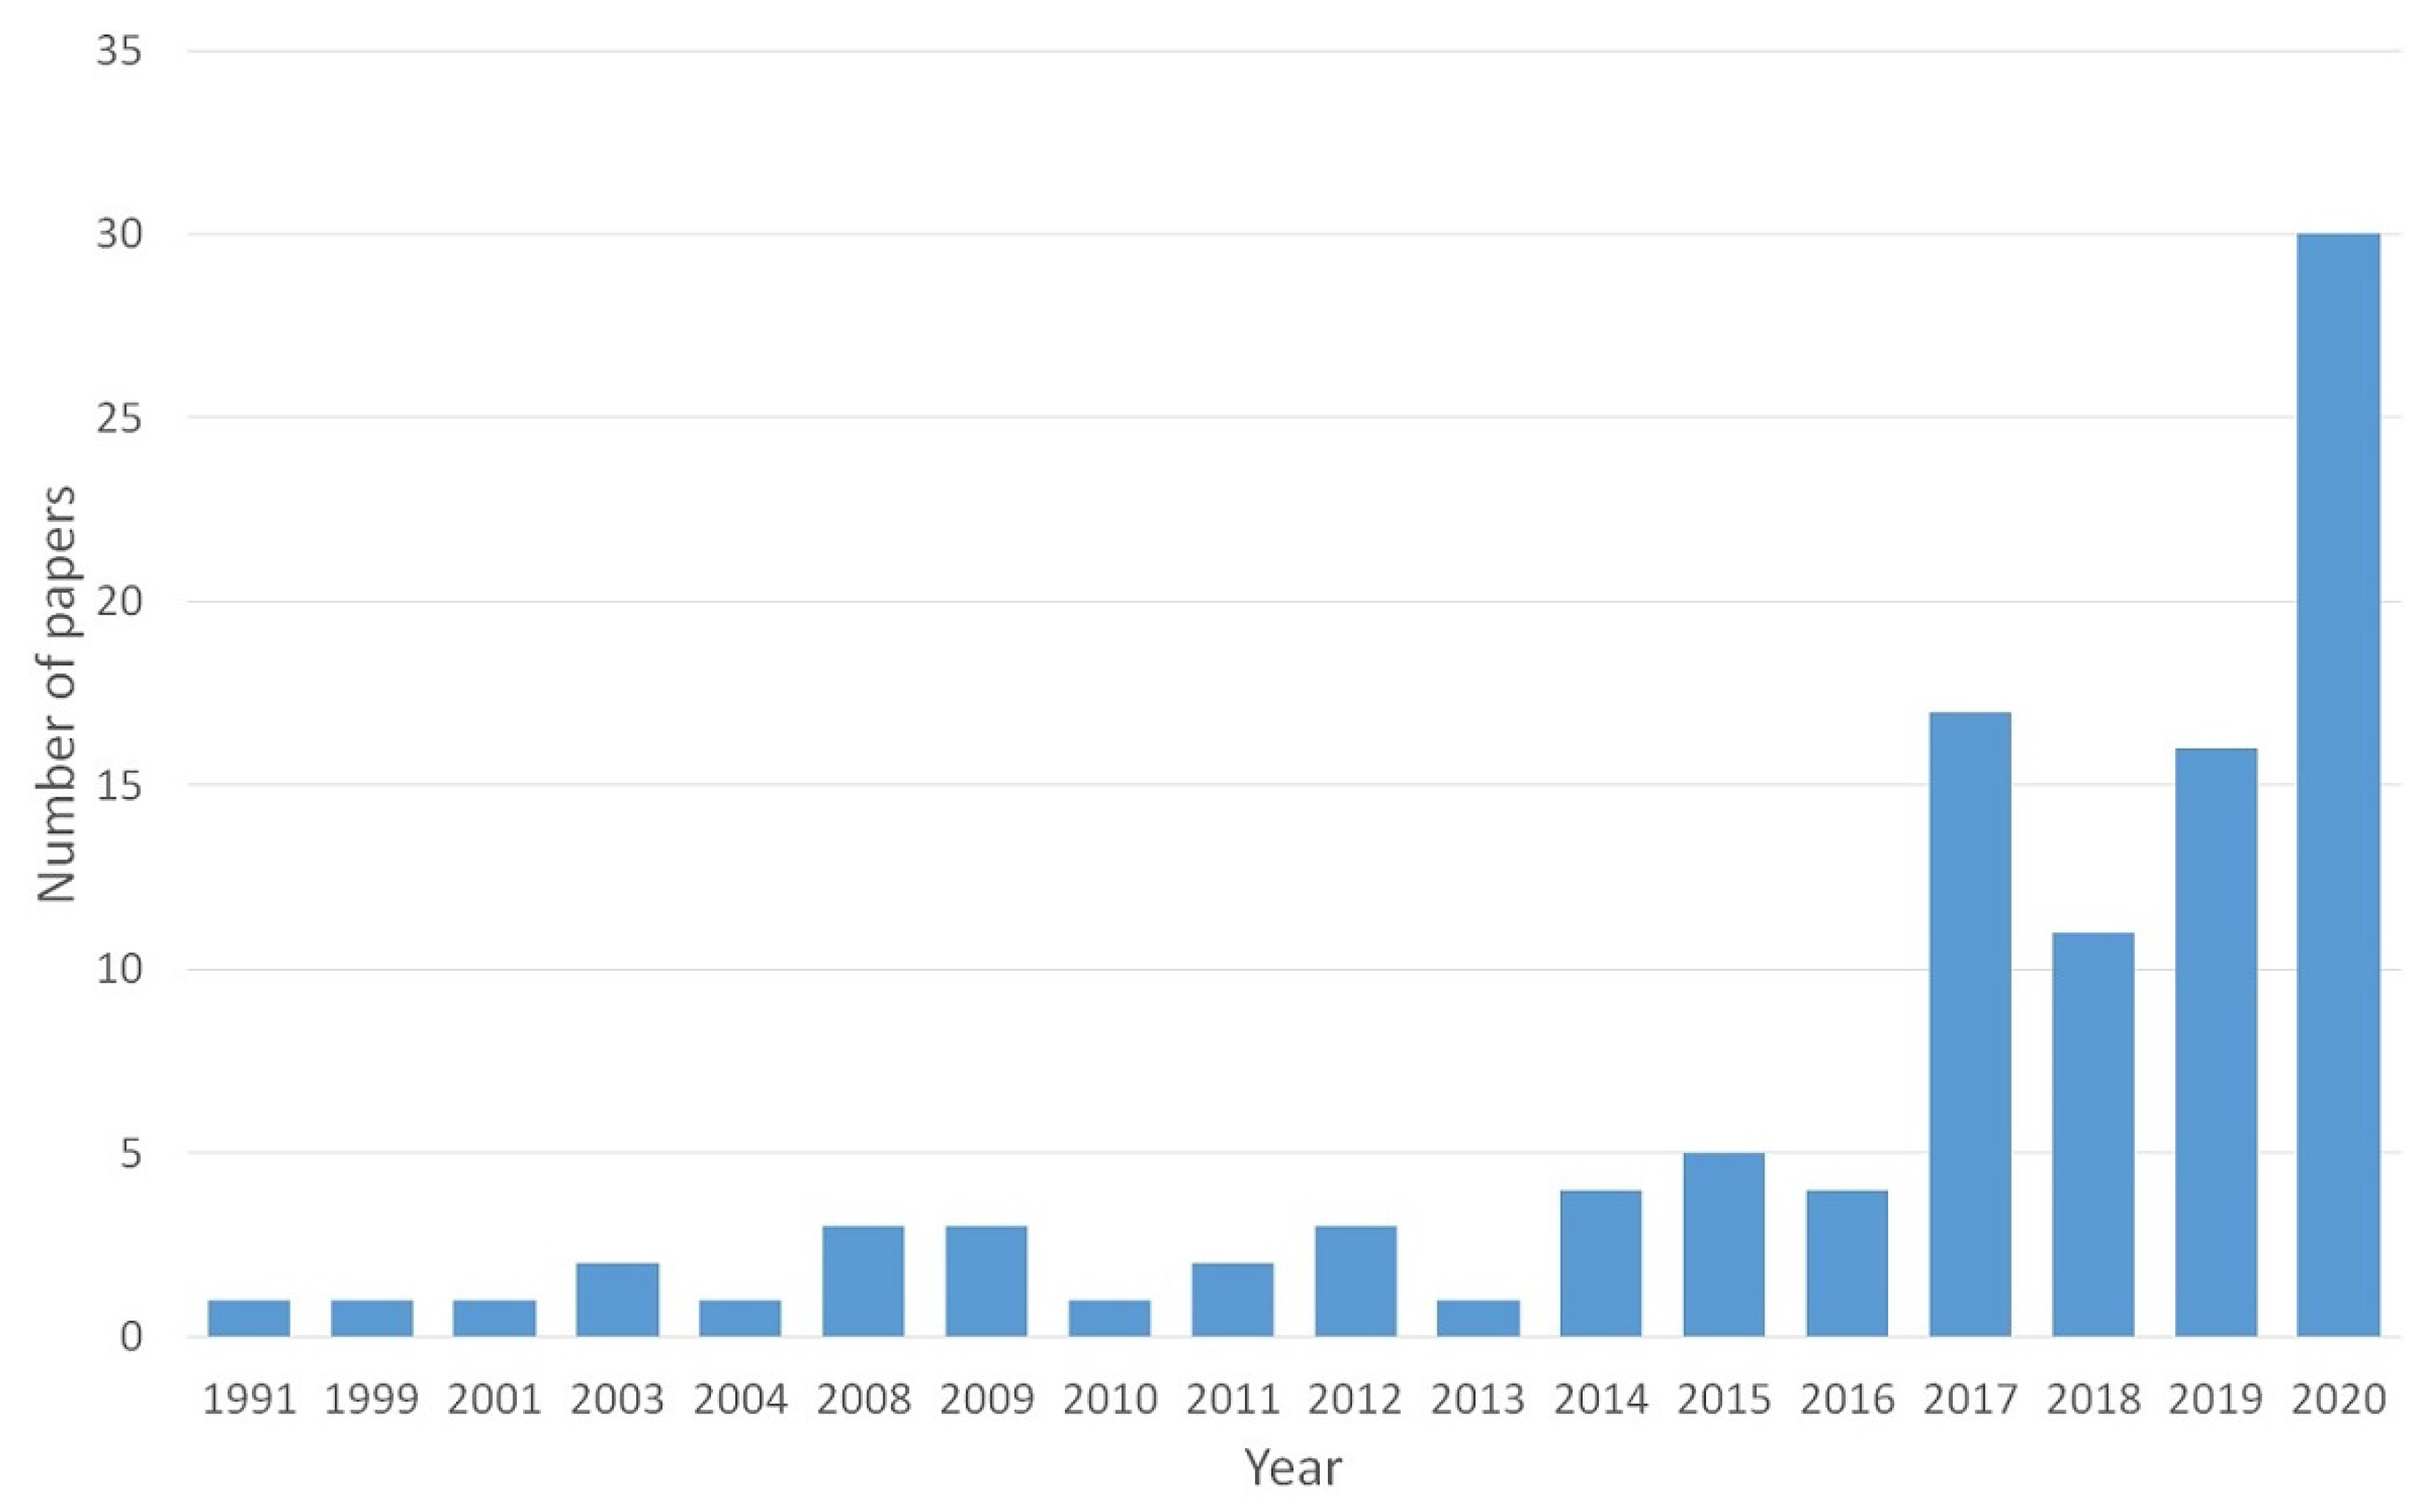
Figure 3 represents the yearly distributions of studies on natural ventilation (NV), which shows increased interest in this subject over time. A sudden increase in the number of studies can be seen in the graph looking at recent years. The explanation for this trend can be twofold. On one hand, with the increase in energy performance and requirements for buildings, the share of energy spent for ventilation purposes has increased, and so has its relative importance. On the other hand, the COVID-19 pandemic outbreak focused the attention of the scientific community on air quality, methods and solutions to limit the contagion risks, as shown by the large increase in contributions in the year 2020.
As mentioned before, selected studies were categorized depending on the journals in which they were published, year of publication, keywords, first author’s institute of affiliation, climate, type of urban area chosen (generic or real), type of wind flow, indoor or outdoor, methodology, adopted parameters/indexes and dimensionless numbers. The three latter categories, in particular, were discussed in detail in order to analyse the methods and approaches typically adopted according to the current state-of-the-art, as well as those metrics which should be considered to design new experiments or simulations.
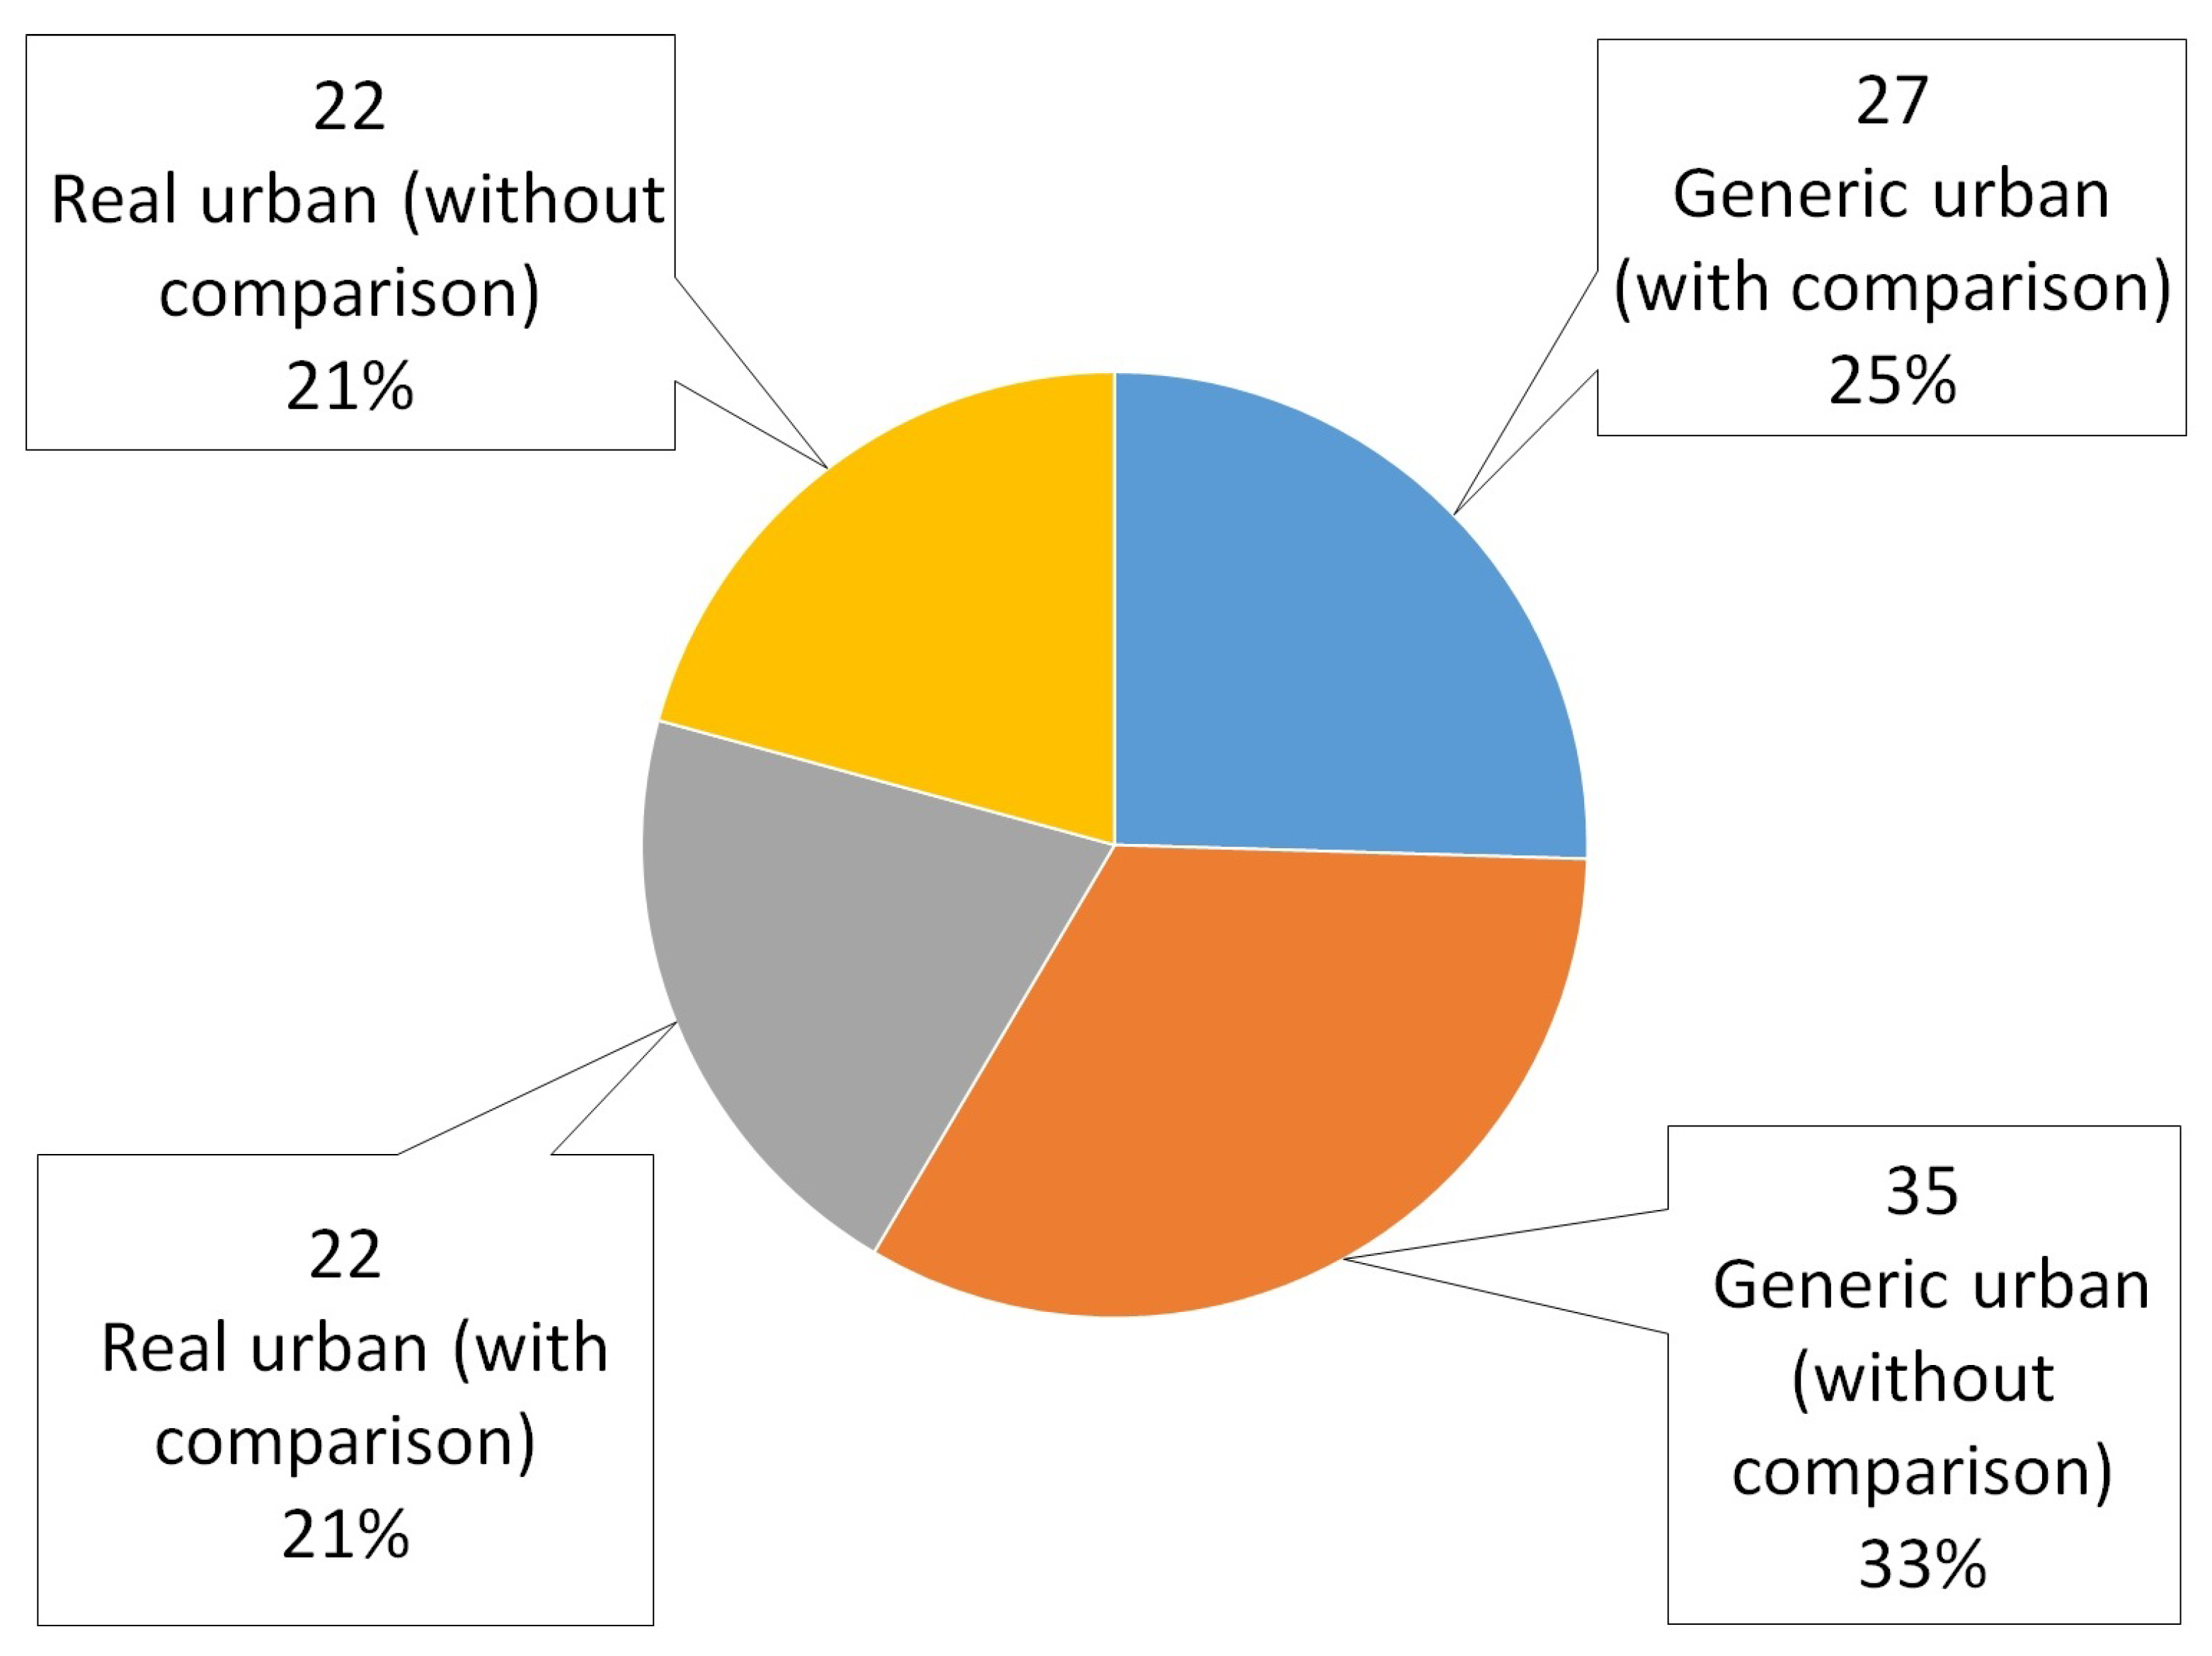
First, studies were grouped depending on the type of urban area that was chosen, i.e., distinguishing if an actual city or district or a fictive one was simulated. Furthermore, attention was paid to the presence of validation of numerical results by comparison with experimental data or analytical data. As it can be seen in Figure 4, most studies were carried out on fictitious urban layouts, and slightly more than the half of the dataset lacks any validation.
The following tables describe the studies taken into consideration for this review. These studies are arranged according to the first author’s name in alphabetical order. These tables are subdivided on the basis of the urban area (real or fictitious urban area) and whether comparisons with experimental or other numerical data were present. Other factors, such as on the building/city type, location taken into consideration, kind of experiments performed, type of simulation codes, turbulence models used, parameters and keywords, are also reported (Table 1, Table 2, Table 3, Table 4, Table 5, Table 6, Table 7, Table 8, Table 9 and Table 10).
Each study also reports some keywords, the use of which makes it possible to look for correlations among the different topics. A list of the most common keywords is reported below:
  • Age of air ( τ );
  • Air change rate per hour (ACH);
  • Air quality;
  • Ansys;
  • Anthropogenic heat;
  • Aspect ratio;
  • Building aerodynamics;
  • Building site coverage;
  • Buoyancy;
  • Climate;
  • Computational fluid dynamics;
  • Cross ventilation;
  • EnergyPlus;
  • ENVI-met;
  • Field measurement;
  • Floor area ratio (FAR);
  • Flow characteristics;
  • Froude number;
  • High-rise building;
  • Indoor air distribution (IAD);
  • Indoor air quality;
  • k ϵ Turbulence model;
  • Large-eddy simulation (LES);
  • Low-rise building;
  • Mean radiant temperature (MRT);
  • Microclimate;
  • Mixed-mode ventilation;
  • Natural ventilation;
  • Numerical simulation;
  • OpenFoam;
  • Outdoor airflow;
  • Outdoor temperature;
  • Outdoor ventilation;
  • Outdoor wind comfort;
  • Pedestrian wind comfort;
  • Pollutant dispersion;
  • Realizable k ϵ turbulence model;
  • Residential buildings;
  • Reynolds number;
  • Reynolds-averaged Navier–Stokes (RANS) equations;
  • Richardson number;
  • RNG k-epsilon turbulence model;
  • Roughness height;
  • Single sided ventilation;
  • Site measurement;
  • Street canyon;
  • Temperature;
  • Thermal comfort;
  • Thermal stratification;
  • Turbulence models;
  • Urban air pollution;
  • Urban airflow;
  • Urban areas;
  • Urban boundary layer;
  • Urban built environment;
  • Urban canopy;
  • Urban canopy layer;
  • Urban climate;
  • Urban heat island;
  • Urban meteorology;
  • Urban microclimate;
  • Urban morphology;
  • Urban ventilation;
  • Urban wind flow;
  • Wind driven natural ventilation;
  • Wind energy;
  • Wind environment;
  • Wind speed;
  • Wind tunnel.
The VOSviewer (https://www.vosviewer.com/, accessed on November 2022) was used to map the keywords to understand the connections of keywords with each other. VOSviewer is a software tool for constructing and visualizing bibliometric networks, which may for instance include journals, researchers or individual publications, and can be constructed based on citation, bibliographic coupling, co-citation or co-authorship relations. The extraction of data from the literature was performed by the following procedure (detailed description is mentioned in the reference [93,94,95]):
An occurrence matrix O is defined first with N columns and M rows, where N represents the number of investigated research articles and M the number of found items (in this case, “keywords”). Each entry of O, where the column, corresponding to a certain item, meets the row, corresponding to a certain article, is either of a value of one if at least one keyword of this article appears in the keywords set corresponding to the item, or zero otherwise. Matrix multiplication is performed between matrix OT and the original matrix O and the squared matrix C is obtained with the dimension M X M which denotes the respective co-occurrences of the keywords from all the investigated articles. Both rows and columns of matrix C refer to the items. The elements in the main diagonal of matrix C represent the total occurrence of each item, which is the number of research papers in which at least one of the keywords out of the keyword set assigned to the specific item is listed. Every other element of C represents the co-occurrence of the respective item pair, which is the number of research articles in which at least one keyword out of each of the two keyword sets assigned to the two items appears.

3. Overview of Types and Methods of the Selected Papers

As mentioned before, the studies were categorised as per the type of journal in which they were published, year of publication, keywords, first author’s institute countries, type of urban area used, whether the study was carried out at real or reduced scale, type of flow, type of study, i.e., whether a street canyon was included or not, methodology, parameters/indexes and dimensionless numbers. As specified previously, the variable “type of urban area used for the study” considers whether the urban area is generic or real and whether it is validated. Validation refers to comparison with experiments and/or with CFD simulation results. “Type of flow” considers whether the flow is wind-driven or buoyancy-driven or a combination of both. In total, 60.7% of the studies considered in this paper mainly deal with the wind-driven flow (54 out of 89 studies), 10 studies (11.2%) include a combination of both wind- and buoyancy-driven flow, and only 2 studies (2.2%) deal with buoyancy-driven flow, while the remaining 23 studies (25.8%) do not refer to a specific type of flow. Likewise, these studies focus only on outdoor environments, on indoor ones or a combination of both: 66 (74.6%) are outdoor studies, 6 (6.7%) indoor ones, 13 (14.6%) are combination of both and the remaining 4 studies (4.5%) are related to reviews.
Methodology deals with the type of activities (if experimental or numerical investigation), performed experiments, numerical simulations and applied governing equations. As regards the latter ones, they depend on the type of simulation tool used, the discretization method selected, governing parameters and boundary conditions chosen, etc. For the experimental part, field measurements, wind tunnel tests and other experimental activities are performed, and for numerical simulations, CFD software and other tools are used. As far as the experimental studies are concerned, 23 studies (63.9%) used wind tunnel tests while 13 studies (36.1%) performed other experimental activities. The most common CFD tools, instead, are ANSYS (21 studies, i.e., 75%) and OpenFoam (4 studies, i.e., 14.3%); EnviMet (3, i.e., 10.7% studies) is also used to run CFD simulations, and EnergyPlus to perform building energy simulations.
While performing experiments in controlled environments, the analysis of the scale of the experiment plays a crucial role in the representativeness of the findings. In most cases of street canyon and pedestrian-level natural ventilation studies experimentally replicated in wind tunnel setups, different reduced-scale models can be used [3,10,11,19,23,34,41,42,44,48,50,82,83]. Jian Hang et al. [23] and Xia Yang et al. [34] used 1:10 reduced scale; Aly Mousaad Aly et al. [44] and Xiaoping Liu et al. [48] a 1:100 reduced scale; and Qun Wang et al. [50] and Yaxing Du, Cheuk Ming Mak [82] chose 1:200.
Focusing on simulation methods, the most common governing equations used in the considered studies are either Reynolds-averaged Navier–Stokes (RANS) equations or large-eddy simulations (LES). The commonly used turbulence models for simulations are standard k ϵ model [27,50], Realizable k ϵ model [7,51], RNG k ϵ turbulence model [8,58], standard k ω (SKO) model [41], shear-stress transport (SST) k ω [6] and LES [18,46]. Ramponi et al. [4], Li et al. [13] and Li et al. [47] selected more than one turbulence model to verify their data or to compare the results with other turbulence models.
While working with the outdoor air displacement and street canyons, pollution-related factors are sometimes included. Pollutant concentration [5,58], pollutant exchange [16], type of pollutant, etc., are some of the examples found in 14 studies in the analysed group mentioning pollution-related factors.
There are some target parameters and dimensionless numbers which were found to be relevant to develop proper research about air displacement in urban environments, such as
  • Age of air ( τ ) [34];
  • Air change rates per hour (ACH) [16,34], purging flow rate (PFR) [34];
  • Air exchange rate (ACH), pollutant exchange rate (PCH) [40];
  • Aspect ratio (AR) [21,23];
  • Building and street canyon aspect ratio [22];
  • Cavity aspect ratio [21];
  • Characteristic roughness of the canyon walls, Prandtl no. (Pr), Schmidt no. (Sc) [21];
  • Floor area ratio (FAR) [84];
  • Froude number (Fr) [21,23];
  • Indoor air velocity (IAV), indoor air distribution (IAD) [43];
  • Mean radiant temperature (MRT) [80];
  • Mean wind velocity ratio (MVR) [82];
  • Outdoor air change (OACH), outdoor air change efficiency (OACE) [10];
  • Overall mean wind velocity ratio (OMVR) [59,82,83];
  • Personal intake fraction (PIF) [13,23];
  • Pollutant concentrations [5,16];
  • Pollutant exchange rate (PCH), retention time ( τ ) [16];
  • Pressure difference Pascal hours (PDPH) [92];
  • Residence and exposure time [38];
  • Reynolds number (Re) [5,21,23];
  • Richardson number (Ri) [15,23,40,48];
  • Street aspect ratio [3,34,35], building area (packing) density [3];
  • Universal Thermal Climate Index [30];
  • Urban canopy layer (UCL) [56].

4. Comparative Analysis of the Air Displacement Considering the Effects of Street Canyon and Natural Ventilation Potential

4.1. Type of Building/City Layout

While working on a study related to outdoor air displacement, it is necessary to define the location and/or structure that is going to be studied. A total 56 out of 89 (62.9%) studies considered in this paper focused on a street canyon and out of these 56 studies, 23 studies (41.1%) referred to real locations and the remaining 33 (58.9%) used fictitious buildings or urban layouts. Generic buildings or building layouts considered here are standard-shaped cubical or cuboidal buildings and standard arrays of buildings. As mentioned before, there are 23 studies which chose real locations for their research activity: 7 studies with Chinese cities (Nanjing [8], Wuhan [38], Hong Kong [30,42,82,83], Beijing, Shanghai, Guangzhou, Urumqi [92]); 7 studies with European cities (Bedford, UK [19], Copenhagen, Denmark [27], Budapest, Hungary [11], London, UK [41], Stockholm, Sweden [6], Thessaloniki, Greece [31], Livorno, Italy [7]); 4 studies with Singaporean locations [25,79,84,89]; 2 studies with Australian cities (Greater Sydney [26], Brisbane [43]); 1 study with South Korean locations (Seoul, Gyeonggi-do [78]); 1 study with a American locations (Miami, Houston, Los Angeles, New York, Chicago, Minneapolis [9]); and 1 study with a Tanzanian city (Dar es Salaam [80]). It can be noticed that the majority of the considered studies are carried out in large and highly populated cities, often in China and Singapore. Most of these cities are mainly from the subtropical climatic regions, hot and humid climatic regions according to the Köppen climatic classification.

4.2. Methodology

As specified earlier, out of 89 papers considered, 56 papers dealt with street canyon effects and natural ventilation potential. Out of these 56 studies, 13 (23.2%) just ran real-scale experiments while 26 of them (46.4%) only ran CFD simulations, 32 studies (57.1%) used wind tunnel testing and 11 out of them (19.6%) also included the experimental data from other sources. For example, Zheng et al. [53] conducted their study using the experimental data from Jiang et al. [96]. Similarly, Dai et al. [5], Park et al. [15] and Li et al. [47] obtained the experimental data from Dascalaki et al. [97], Addepalli and Pardyjak [98] and Blocken et al. [99], respectively.
To perform experiments in wind tunnels, attention has to be paid to the similarity criteria when deciding on the reduced-scale model. While doing that, the blockage ratio has to be less than 5%. For example, Hang et al. [23] and Yang et al. [34] used a 1:10 reduced-scale model of their simple cubic building and idealized 2D street canyons, while Wang et al. [50], Ai and Mak [54] and Du and Mak [82] used a 1:200 reduced-scale model. Some authors also performed other experiments rather than wind tunnel experiments and field measurements. For instance, Chen et al. [17] applied an experimental fine-bubble technique in a large water tank to model buoyancy-driven flows in buildings.
Ansys, OpenFoam and EnviMet are often used as CFD tools for the fluid flow simulation whereas EnergyPlus is considered for building energy simulations (BES), sometimes coupled together to also calculate building energy consumption. Sometimes, EnergyPlus can also be coupled with these tools to set some boundary conditions.
Other authors preferred customized codes or less popular tools. For instance, Hang et al. [3] developed the “Ventair” code using Fortran language for their CFD simulation, to study the flows through and within high-rise building arrays and their link to ventilation strategy. Aristodemou et al. [55] implemented the FLUIDITY tool, which allows remeshing of the considered domain based on a posteriori error estimates, whilst achieving certain targets for error. Ding and Lam [58] preferred to use scSTREAM to carry out their 3D steady-state incompressible flow simulations. Luo et al. [87] employed the WRF-UCM modelling framework to capture microclimate dynamics under extreme heat conditions; Nazarian [36] and Lo and Ngan [38] used PALM (parallelized LES model) to perform their simulations.
In 27 studies, comparisons have been carried out against experimental data or CFD results. Song et al. [19], Ricci et al. [41] and Balczó and Tomor [11] represented normalized horizontal velocity magnitude distributions in wind tunnel measurements and CFD simulations for different chosen heights. Likewise, Hii et al. [25], Chatzidimitriou and Yannas [31], Izadyar et al. [43], Gao and Lee [8], Wang at al. [78], Yahia et al. [80] and Wong et al. [79] conducted field measurements and made comparisons against CFD results. The remaining studies either performed experimental activities or CFD simulations [7,27,30,38,82,83,89].
While using these CFD tools, it is also necessary to set governing equations, turbulence models and boundary conditions for simulating the models. The turbulence models more frequently used are standard k ϵ turbulence model, renormalization group (RNG) k ϵ turbulence model, realizable k ϵ turbulence model, standard k ω turbulence model, and shear stress transport (SST) k ω turbulence model. The typical governing equations are the Reynolds-averaged Navier–Stokes (RANS) equations and the large-eddy simulation (LES) model, with RANS being less computationally demanding compared to LES, although less accurate. It was found that the selection of turbulence models was often decided upon the availability computational resources. The standard k ϵ turbulence model is preferred widely in the literature because of its simplicity and lower computational time [37,39]. The standard k ω model provides a satisfactory performance for swirling flows in the near-wall region but this model is prone to overpredicting the shear stresses of adverse pressure gradient boundary layers and it has issues with freestream conditions. This model, however, is extremely sensitive to inlet BCs as opposed to k ϵ models [41].
Li et al. [13], Javanroodi and Nik [27], Li et al. [37], Peng et al. [39] and Wang et al. [50] used a standard k ϵ turbulence model because of its lower computational resource requirement and simplicity. In total, 12 (out of 56) papers, i.e., 21.4%, employed the renormalization group (RNG) k ϵ turbulence model [8,15,16,22,23,34,40,43,48,58,59,78] and 4 (out of 56) papers, i.e., 7.1%, used the realizable k ϵ turbulence model [7,25,49,51]. These two turbulence models give some advantages over the standard k ϵ turbulence model in terms of results and sometimes they also overestimate the results. The RNG k ϵ and realizable k ϵ turbulence models are more accurate than the standard k ϵ at modelling the mean flow of complex structures, flows involving rotation, flow separation and recirculation. A total of 9 (out of 56) papers, i.e., 16.1%, considered large-eddy simulation (LES) [5,18,19,20,32,38,44,46,55]. Overall, 29 out of 56 studies, i.e., 51.8%, considered RANS equations to simulate their models, whereas 6 (out of 56) papers, i.e., 10.7%, preferred more than one turbulence model [4,6,13,33,41,47].

4.3. Parameters/Indexes/Dimensionless Numbers

It is necessary to specify some parameters, indexes or dimensionless numbers to reach the goal of the research activity. As shown from Table 1, Table 2, Table 3, Table 4, Table 5, Table 6, Table 7, Table 8, Table 9 and Table 10, the majority of studies considered more than one parameter, index and dimensionless number. These parameters are categorised based on the characteristics required for the research activity, such as geometrical properties, physical, flow-related and other properties. The key parameters considering these characteristics, while dealing with outdoor air displacement, are the following: street aspect ratio (AR) [3,15,21,22,34,35], building height [3,58,79], building floor area ratio (FAR) [65,66,84], street and urban pattern [72,79], urban density [58,72,85] and geometrical and physical properties. Age of air ( τ ) [8,66], air temperature (AT) [65], purging flow rate (PFR) [34,66], pollutant (concentration, exchange) [5,16,40], overall mean wind velocity ratio (OMVR) [59,82] are the air-flow-related properties, while the common dimensionless numbers are: Reynolds number (Re) [5,21,23], Richardson number (Ri) [15,23,40,48,71] and Froude number (Fr) [21,23].
For instance, Gao and Lee [8] analysed the mean age of air to understand the influence of surrounding buildings on the natural ventilation performance of residential dwellings in Hong Kong and found an increase in the mean age of indoor air by 0.6 to 1.5 times due to the presence of surrounding buildings.
Park et al. [15] investigated the flow characteristics around step-up street canyons with various building ARs and found that the in-canyon flows undergo two stages, i.e., development and mature stages, as the building-length ratio increases above 2. In the development stage, the position of the primary vortex changes, and the incoming flow closely follows both upstream and downstream building sidewalls, while in the mature stage, the primary vortex stabilizes, and the incoming flow no longer follows building sidewalls. Yang et al. [34] aimed to quantify the influence of AR and window size on indoor–outdoor ventilation in two-dimensional streets with single-sided naturally ventilated buildings, discussing air change rates per hour (ACH), age of air ( τ ) and purging flow rate (PFR). They found that shallower streets experience better indoor–outdoor ventilation, but in extremely deep canyons with AR = 5, two-counter-rotating vortices produce much smaller velocity at low-level regions, resulting in small air change rates. Peng et al. [65] and Peng et al. [66] discussed the correlation between the urban morphological characteristics and ventilation performance by keeping the floor area ratio (FAR) constant and changing building site coverage (BSC), using mean age of air and purging flow rate (PFR) as metrics. They found that, at FAR = 5, the ventilation performance is closely related to BSC. Javanroodi et al. [72] and Javanroodi and Nik [85] used urban density (UD), urban building form (UBF) and urban pattern (UP) as morphological parameters to investigate ventilation potential in a high-rise building surrounded by different urban configurations in Tehran.
Fellini et al. [21] and Hang et al. [23] used Reynolds number (Re) and Froude number (Fr) to evaluate the combined effects of street canyon geometry, wall roughness and wall heating on pollutant dispersion in street canyons. In order to do that, they performed CFD simulations and wind tunnel tests on their street canyon geometry. Cheng et al. [40] used Richardson number (Ri) to assess the relative contributions of the wind- and buoyancy-driven flow. They stated that the negative Ri corresponds to unstable stratification and more negative Ri represents a larger contribution from the buoyancy. Liu et al. [48] used Ri to study the effects of surface temperature rise induced by the solar radiation on near-wall flow and found that, if Ri < 0.1, the effects on small-scale models should not be ignored.
Du and Mak [82] and Du et al. [59] utilised mean wind velocity ratio and overall mean wind velocity ratio to understand the effects of building height and porosity on pedestrian-level wind velocity in high-density cities. They also found that using these parameters instead of actual wind velocity can be convenient in scaled models.
Some authors introduced new quantities or employed less common parameters and variables to discuss the urban air displacement and the natural ventilation potential. Lina Yang et al. [92] introduced the concept of pressure difference Pascal hours (PDPH), which is defined as the hourly sum of the positive differences between hourly effective pressure and required pressure. Ding and Lam [58] discussed the CIOI, which is a dimensionless index to assess indoor cross-ventilation potential while considering the outdoor wind environment.

4.4. Pollution Related Factors

As specified in the overview in Section 2, pollution is often considered in ventilation studies. Tan et al. [18] performed simulations to study the impact of source shape on pollutant dispersion in a street canyon under neutral and unstable thermal stratification, considering airborne particulate matter (PM) to quantify the pollutant concentration in the street canyon. Aristodemou et al. [55] carried out numerical tests (adaptive LES) to assess the effect of the location of a tall building on the surrounding area in terms of air flow turbulence and pollution dispersion. Ding and Lam [58] used velocity, pressure or pollutant concentration to calculate the CIOI index to assess indoor cross-ventilation potential. Song et al. [19] monitored carbon dioxide (CO2), carbon monoxide (CO) and nitrogen dioxide (NO2) to monitor the indoor and outdoor environment in the UK as a full-scale field measurement and performed the CFD simulation in FLUIDITY. CFD results obtained by Li et al. [13] suggested that the leeward personal intake fraction of CO is far higher in concentration than the windward wall in the shallow, regular, step-up and step-down street canyons, but lower than the windward side in the deep street canyon under different traffic tidal flow (TTF) conditions. Dai et al. [5] adopted the tracer gas technique, using carbon dioxide (CO2), to simulate the concentration decay and the gaseous pollutant dispersion. Li et al. [37] employed a combined numerical simulation of a species transport model and the tracer gas technique to simulate pollutant dispersion and summarized the effects of driving lanes and vehicle speeds on pollutant dispersion. They concluded that the pollutant distribution on the windward side is related to that on the leeward and the concentration of pollutant behind the vehicle decreases with increasing vehicle moving speed on the leeward side. Lo and Ngan [38] introduced the analysis of Lagrangian residence and exposure residence times to the characterization of urban pollutants and dispersion. Cheng et al. [16] evaluated the street canyon ventilation and pollutant removal performance using CFD and found that the turbulent components of air exchange rate and pollutant exchange rate are about an order of magnitude larger than their mean components. Peng et al. [39] indicated that the exchange of air current between the upside and bottom of street canyons gradually enhances with the enlargement of window opening percentage. It also gradually dilutes the pollutant concentration in the target street canyon, bypassing those pollutants into the adjacent regions. Liu et al. [48] mentioned that, in the case of high-rise buildings, the windward wall surface temperature rise brings more serious pollutant accumulation and near-wall concentrations increase with the rise in temperature when the pollutant is released from the bottom and middle of leeward wall surface. Hang et al. [23] stated that a single vortex pattern is more efficient in removing the pollutants at the street level for both high and low wind speeds and buoyancy-induced wall heating scenarios can sometimes raise or reduce pollutant exposure, depending on the aspect ratios, ambient wind speed and wall heating types. This can be observed from Figures 7 to 10 of the study performed by Hang et al. [23].

4.5. Keywords Analysis

As mentioned in Section 2, an overview of the relationships between the different studies can also be found with the help of keywords. Computational fluid dynamics is the keyword which is used more often, 31 times in the chosen 89 studies, followed by “street canyon” (13 times), “natural ventilation” (11 times), “wind tunnel experiment” (10 times), “pedestrian wind comfort” (7 times), “large eddy simulation” (5 times). Then, “high-rise building”, “numerical simulation”, “urban morphology” and “urban ventilation” are repeated in the papers four times, and “microclimate”, “turbulence models”, “urban heat island” and “urban microclimate” three times. Other keywords either have been used twice or just once.
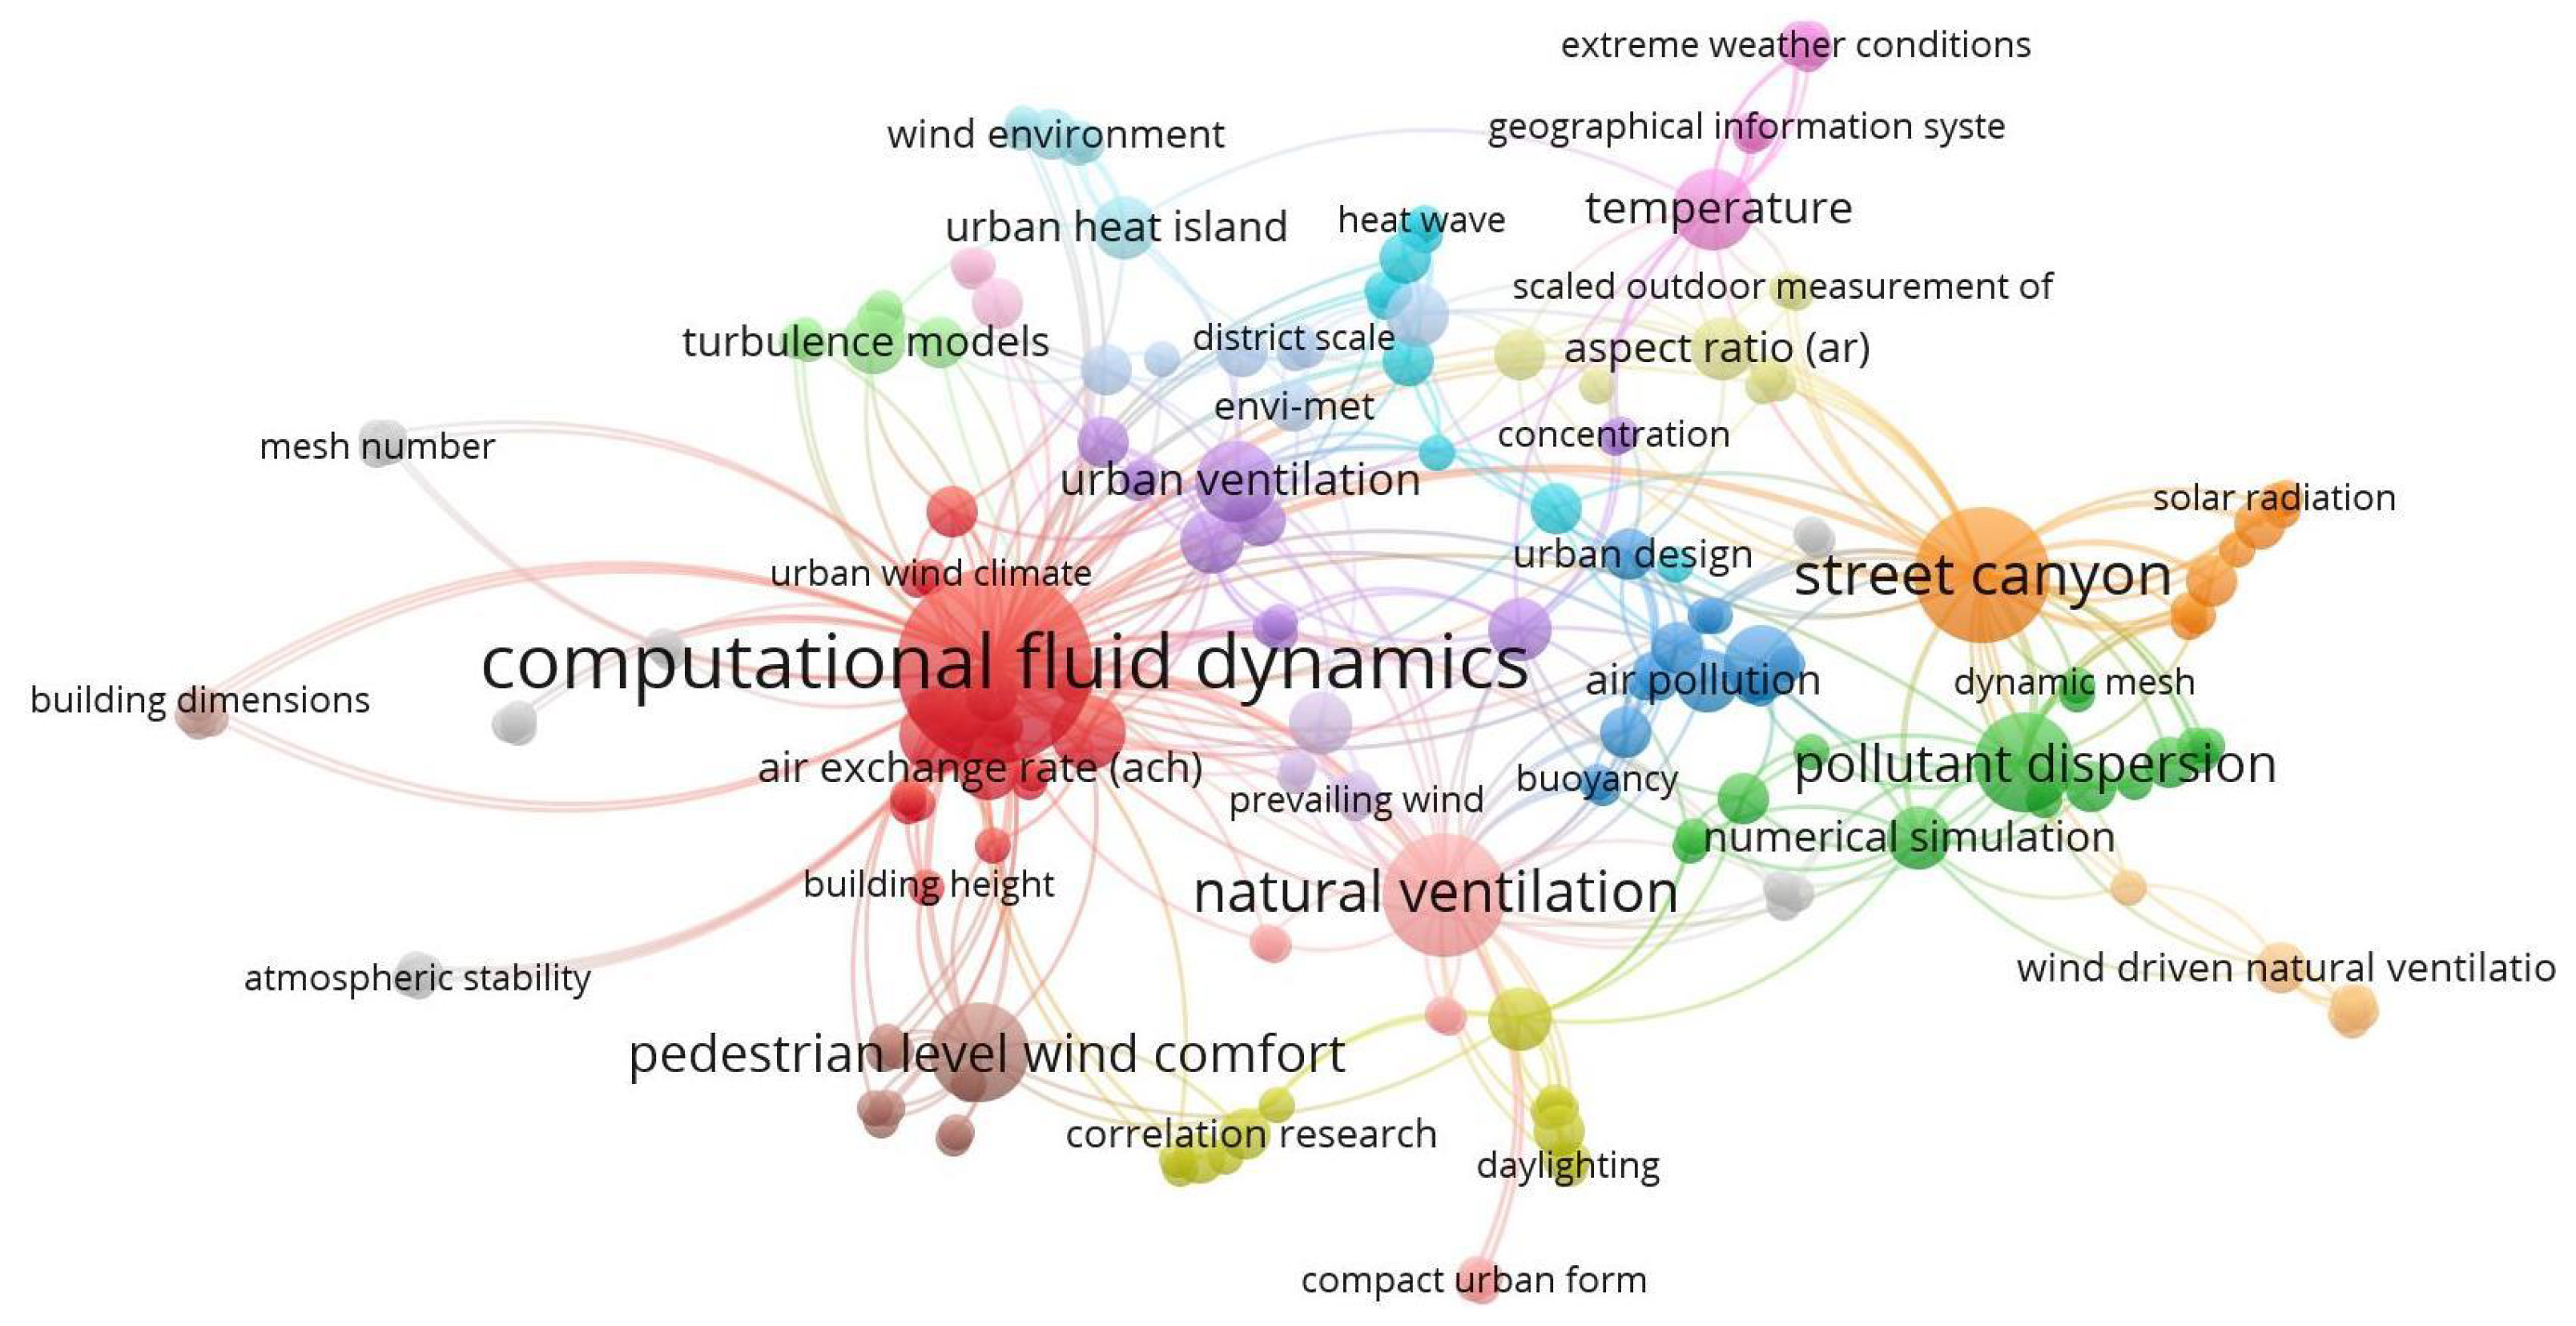
It can be seen from the map (Figure 5) that the keyword “computational fluid dynamics” cluster is connected to all the clusters. So, it is one of the important keywords related to outdoor air displacement considering street canyon and natural ventilation potential. The clusters of keywords, street canyon and natural ventilation, show their significance in this review as well. Then there are keywords which are connected to these three main keyword clusters. Those connected keywords are: “pedestrian level wind comfort”, “numerical simulation”, “turbulence models”, “pollutant dispersion”, “air pollution”, “aspect ratio”, “urban ventilation”, “air pollution”, etc. Finally, other keywords, for example, “building height”, “buoyancy”, “urban wind”, “age of air”, “building geometry”, etc., are loosely connected to those three main keywords (which are mainly related to street canyon and natural ventilation studies).

5. Discussion and Future Aspects

5.1. Studies with Validation

As shown in Figure 2, there are 22 (out of 89) studies which chose real urban areas in which no comparison was performed. 35 studies chose generic urban areas without any comparison with previous or experimental data. The remaining ones are either real urban areas with comparison (22 studies), or generic areas with comparison (27 studies). There are various possible reasons for the lack of comparisons. For the considered real urban areas, sometimes measurement data are not available or sufficient. Some studies deal mainly with the theoretical part of the topics [26,56,64,92] or just with numerical simulation due to the complexity, cost and time consumption required to execute experiments [7,27,32,37,81,87].
In the case of real urban areas with comparative or validation studies, some authors performed field measurements and compared those measurements with the CFD simulation results [8,31,74,77,78,79,80]. However, authors faced difficulties in performing experimental tests in controlled environments both at full scale or with reduced-scale models, considering that it is sometimes easier to carry out direct field measurements. Moreover, in the case of reduced-scale model experiments, it should be noted that similarity errors and the lack of some details in the model can affect the outcome. Some authors considered a specific single building/structure or small group of buildings/structures for their experimental studies and compared the results obtained from CFD tools [6,11,41,43,70]. In this case, it has been possible to perform such experiments using simple structured geometries, with lower influence on the similarity criteria, giving reasonable results. For example, Yang et al. [34] performed an experiment and a CFD simulation for their generic simple cubical building. They performed a wind tunnel experiment and a CFD simulation with the help of Ansys Fluent using the RNG k ϵ turbulence model and validated their results for different configurations.
Studies with generic urban areas with CFD comparisons usually deal with standard shapes of buildings and positioning layouts and arrays. These studies can be the ideal fit for the experimental and numerical CFD simulation studies. The standard building/structure shapes can either be cubical or cuboidal and a frequently used layout is either square array or rectangular array, depending on the goal of the study [3,10,22,34,45,46,50].
Relating to the studies included in this paper, there are very few considered study locations if the whole world is taken into consideration, and they typically are large cities. On the contrary, generic urban areas represent the ideal situations, the results of which can be used as a reference for future studies.

5.2. CFD Tools Used

There are many CFD tools available to perform the numerical simulations. Ansys, EnviMet and OpenFoam are those which have been utilised most often in the investigated studies. In particular, Ansys has been used more than other simulation tools, in 21 (out of 56) studies.
As there are different turbulence models available, one can check and select them as per necessity. The results obtained can be compared with each other to obtain the better outcome and then finalize it. Not all the turbulence models are suitable for all the required activities, and each one of them has its own limitations. The standard k ϵ turbulence model is commonly used because of its simplicity but the production of kinetic energy near the frontal corners of buildings might sometimes be overestimated and the turbulent kinetic energy in wake regions underestimated [41,69]. Recently, the RNG k ϵ turbulence model and the realizable k ϵ turbulence model are gaining popularity [69]. Other than these turbulence models, LES has also gained popularity because of its high result accuracy compared with measurements. However, huge computational requirement and higher time consumption can be the main limitations of the LES. Nevertheless, advancements in technologies in the future can lead to a greater use of LES due to its higher accuracy.

5.3. Experimental and Numerical Findings

Although the focus of this literature review is on experimental and numerical methods and parameters and indicators used for their design, it is also worth discussing the findings of some contributions selected to provide, as a whole, an overview of the potential outcomes obtainable with such methodologies and the accuracy of results.
The methodology proposed by He et al. [45] shows that making parametric tools and the CFD tool work in coordination can provide efficient iterative analysis and implement quantitative comparisons for studying the influences of buildings on winds, especially for wind environment studies of large amount of buildings and their modifications. They applied this methodology to study the relationships between winds and building variables for square form and scattered configurations. They found that a reduction in windward surface areas of buildings and an increase in intervals of building clusters can increase outdoor ventilation.
Gao and Lee [8] compared field measurements, performed in Hong Kong, China, and CFD simulation data, obtained using AIRPAK (ANSYS, 2008) with the RNG turbulence model. From CFD simulation, it can be seen that surrounding buildings can lower the wind power available in the vicinity of buildings by 2.5% to 86.8%, increasing the angular spread of prevailing winds (the average direction was shifted anti-clockwise by 5 to 32 ) and adversely affect natural ventilation in residential dwellings. After analysing the mean age of air, the authors suggested that, in actual urban environments, natural ventilation performance in dwellings can be enhanced by positioning two groups of window openings in opposite directions or perpendicular to each other.
Wang et al. [50] validated CFD simulations (with SKE model) with wind tunnel data to verify the exponential concentration decay occurring in urban canopy layer models. They concluded that a larger urban size attains smaller ACH. For square overall urban form, the parallel wind attains greater ACH than non-parallel wind, but experiences smaller ACH than the rectangular urban form under most wind directions. Open space increases ACH more effectively under oblique wind than parallel wind.
Hang et al. [3] studied experimentally and numerically wind flows from rural to urban areas through high-rise square building arrays, with the wind parallel to the main streets. As mentioned earlier, they used “Ventair” code using Fortran language, where 3D urban airflow field was modelled with the RANS SKE turbulence model. The horizontal profile of the normalised velocity along the street centreline was predicted generally well by the SKE turbulence model, however, turbulent kinetic energy near the windward street entry was not. Furthermore, numerical simulations predicted vertical profiles of velocity at centre points behind taller buildings relatively better than at centre points in front of them. The authors also observed that, by optimizing building heights and street widths, it is possible to optimize wind speed, enhancing ventilation in high-rise urban areas.
King et al. [6] measured façade pressures and ventilation rates in the Silsoe cube (a 6 × 6 × 6 m hollow metallic cube located in a rural location in Bedford, UK) under single-sided and cross-flow ventilation configurations, and compared them with CFD simulations conducted in OpenFoam and ANSYS Fluent. Simulation results suggested that vortex shedding from upwind buildings provide pulsating ventilation in the studied window configurations, which may attenuate the negative effects of upwind flow obstruction. The obtained results showed that the simulations compare well to the experimental data on the front face of the isolated cube, but discrepancies appear at reattachment points on the roof.
Balczó and Tomor [11] were able to predict velocity magnitudes with their CFD and experimental results, observing that simulated wind speed can increase up to 50% in connecting streets. Nevertheless, they found that the numerical turbulent kinetic energy was often not in good agreement with the experimental data.
Ricci et al. [41] performed CFD simulation and wind tunnel tests (1:300 reduced-scale model) on Quartiere La Venezia district in Livorno, Italy, for three reference wind directions (i.e., 240 , 270 and 300 ). They found that the CFD simulations using the SKO turbulence model showed the worst agreement with the obtained wind tunnel data, and the SKE and RKE turbulence models generally showed the best agreement with the wind tunnel data. The authors found deviations between simulated velocities and measured ones ranging from 20–30% to about 60–70% depending on the wind direction, observing that the impact of the selected turbulence models was larger than the impact of the imposed surface roughness height.
Padilla-Marcos et al. [10] performed wind tunnel experiments and CFD simulations to define a simplified procedure to identify air movement patterns in the immediate surroundings of a simplified building. A significant distortion effect of the airflow was found at a distance of five times the height of the building from its rear face (in a leeward position). The internal stresses generated before reaching the obstacle modified the upstream air particles’ motion pattern and created a “pressure bubble” facing the building. The authors found that air regions of low turbulent energy had a higher age of the air than the rest of the domain, reducing its quality.
The selected papers analysed above allowed us to underline some of the main features of ventilation studies in urban contexts. First, both numerical and experimental techniques (in particular, wind tunnel tests) can contribute to the optimization of urban layouts and buildings’ windows in order to enhance outdoor and indoor ventilation. CFD simulations can support significantly the assessment of the actual ventilation potential, for instance in high-rise building districts and in the optimization of ventilation in urban environments, especially if coupled with other numerical tools. However, numerical accuracy is not always the same or sufficient. This can be observed at both the single-building scale and at the larger, urban scale. Consequently, comparisons with empirical tests (in situ or in wind tunnels) can contribute to the discussion of the accuracy of state-of-the-art tools and help in selecting the best models (e.g., turbulence models).

5.4. Parameters/Indexes/Dimensionless Numbers

As defined before (Section 4.3), the used parameters are related to specific domain characteristics and properties. For example, age of air ( τ ), air flow rate (Q) and air velocity are characteristics of air flow. Likewise, convective heat transfer coefficient (CHTC) is the heat transfer property and the aspect ratio (AR), building area density, building site coverage (BSC), building height (H), floor aspect ratio (FAR) are geometrical properties. Dimensionless numbers are also necessary to understand the behaviour of the physical properties under variable conditions. For example, Reynolds number (Re) differentiates between laminar and turbulent flow and Froude number (Fr) signifies whether the flow has sub-critical or super-critical flow characteristics. Richardson number (Ri) is the dimensionless number that expresses the ratio of the buoyancy term to the flow shear term and in thermal convection problems and represents the relative importance of natural convection with respect to the forced convection. These dimensionless numbers are also useful to select the similarity criterion when the size of the methodological activity is scaled.
The parameters which were used to verify the studies are often related to air velocity, temperature and radiation measurements, or geometrical parameters. The dimensionless numbers help to reduce the long calculations and provide reasonable suggestions toward the goal of the study. For the case of air displacement, street canyon effects and natural ventilation potential, the geometrical parameters, air flow parameters, temperature parameters and their dimensionless numbers are of great importance and they can be dealt with to optimize the outcomes efficiently for indoor and outdoor ventilation.

6. Recent Developments in the Review

As already mentioned, this review consists of the studies from the year 1991 to 2020. Considering the recent developments, some of the studies from year 2021 have been included in this section. As it can be observed, publications in 2021 continued the analyses discussed in the previous sections, with similar methodologies and new contributions added to the literature in this field. As an example, Xu et al. [100] discussed the effects of roadside morphologies and moving vehicles on street canyon ventilation. They performed CFD simulation using ANSYS Fluent 2019R3 for their research. Likewise, Peng et al. [101] correlated the urban ventilation of a typical street and the impact of building form variation with the help of different parameters such as age of air and air delay, and mentioned some design strategies for residential streets. Zheng and Yang [102] compared the effects of RANS with LES to understand the effect of both the turbulence models on wind flow and pollutant dispersion in a street canyon with traffic flow. Papp et al. [103] analysed street-level pollutant emissions in long, parallel street canyons of constant and variable building height, using numerical models and wind tunnel experiments. Zhao et al. [104] studied the effect of different buoyancy conditions due to heated building and ground surfaces on flows in and around the two canyons using PIV measurements. Chen et al. [105] examined the effects of urban geometry on the thermal environment in 2D street canyons with the help of a scaled experimental study. Nosek et al. [106] investigated the effects of turbulent coherent structures to understand the driving mechanisms of street canyon ventilation. Cui et al. [107] studied the effects of building layouts and envelope features on wind flow and pollutant exposure in height-asymmetric street canyons.

7. Limitations

As this review is mainly focused on outdoor air displacement, effects of street canyon and natural ventilation potential, some other studies have been excluded, such as studies specifically focused on outdoor comfort for pedestrians. For the review of the experimental parts, more importance is given to wind tunnel experiments and field measurements as these are the possible ways to perform the experiments while focusing on air displacement and natural ventilation. Finally, studies in languages other than English have been omitted from this review.

8. Conclusions

Considering the migration of populations to urban areas and the transformation of rural areas into urban ones, there is a need to find solutions to make cities more and more sustainable, reducing their energy demand and improving environmental quality both indoors and outdoors. One of the aspects to consider is ventilation of the built environment, which can be exploited to ensure human comfort and reduce the impact of pollution and of other contaminants on human health. Natural ventilation, in particular, can be of interest because it does not require installation and operation costs and is, consequently, a sustainable solution. However, natural ventilation potential is not always the same, especially in the urban context. Consequently, research is needed to develop guiding tools for engineers, architects, urban planners and policy makers for the challenges of future cities. Examples are given by studies on outdoor air displacement surrounding buildings and in street canyons.
With the aim of analysing the recent trends in this field and providing an overview of the most common methods, metrics and parameters adopted, this work reviewed 89 papers, out of which 56 related to street canyon effects and natural ventilation potential, ranging from 1991 to 2021. A systematic approach was adopted, categorizing the selected papers based on type of building/city layout and location, methodology (either experimental and CFD simulations), parameters/indexes/dimensionless numbers and keywords.
Thanks to this analysis, it has been possible to observe the following:
  • Although the literature includes already significant studies on outdoor air displacement, especially in street canyons, more studies should be performed in order to obtain more general findings, considering the effects of geometry, size, orientation of the street canyons and the obstacles present on the street.
  • From a methodological point of view, comparisons among the findings of different studies or methods (e.g., experimental validation of CFD simulations) are not always present. This should be encouraged in future research, in order to not only confirm the validity of the results and ensure their generalization, but also to identify the best methodologies and approaches to replicate.
  • Fictitious urban areas are useful for parametric studies and they are an ideal fit for understanding the scenarios for ideal conditions. However, studies on real urban layouts are necessary to discuss the actual conditions and the potential of urban and natural ventilation. Up to now, the number of studies in real districts is still low and often focused on large developed cities. An expansion of this set of case studies could include also suburban and semi-rural environments, completing the overview of typical conditions. Furthermore, many studies in this review involve subtropical cities and their results are deeply affected by local microclimatic conditions. New studies in different climates could facilitate the creation of a comprehensive dataset of cases helping in the identification of common trends and solutions to apply.
  • As regards CFD simulations, attention is generally given to RANS equations. Many studies included k ϵ and k ω turbulence models for further development because of their lower computational cost and time consumption compared to the LES turbulence model, even if LES is more accurate. With the increase in the available computational resources and advancements in the technology in the future, LES could be used more extensively due to its higher accuracy and ability to capture more detailed and real behaviour of air flows.
  • Most of CFD simulations rely on commercial or open access tools such as ANSYS Fluent and OpenFOAM. However, some authors preferred to develop customized codes or adopt different numerical approaches, mostly based on finite differences and finite volumes.
  • Parameters/ indexes/dimensionless numbers are of significant importance for studies to proceed with the research activities. As mentioned in the previous sections, some of the parameters more frequently adopted in the reviewed studies are age of air ( τ ), street aspect ratio (AR), building floor area ratio (FAR), building height (H), air exchange rate (ACH), Reynolds number (Re), etc.
To conclude, this review of the literature on studies about air displacement in urban layouts and street canyons for the assessment of the ventilation potential has allowed for a description of the state-of-the-art of experimental and numerical methods, approaches and case studies often adopted in the last 30 years. For many reasons, and above all the increase in urbanisation, the analysis of urban ventilation and air displacement is receiving growing attention and importance. With the increase in computational resources, new potential for research in this field is expected to develop. CFD, in particular, on one hand will support the design of targeted and accurate experimental tests, both in situ and in controlled environments such as wind tunnels, and on the other hand will facilitate the analysis of more and more configurations of climate conditions and urban layouts. This, in turn, will give engineers, architects and urban planners a robust dataset of case studies to drive their design activity and improve the quality of the urban built environment. By keeping this in mind, considering the recent pandemic outbreak, it is necessary to carry out more studies related to air displacements and natural ventilation in urban and rural areas.

Funding

This research received no external funding.

Data Availability Statement

Data sharing not applicable.

Conflicts of Interest

The authors declare no conflict of interest.

Abbreviations and Symbols

τ Age of air
ABLAtmospheric boundary layer
ACHAir exchange rate
ARAspect ratio
ATMean air temperature
BBuoyancy flux
BADBuilding area density
BAFBuilding aerodynamic factor
BARBuilding aspect ratio
BDGBuilding area percentage
BHARBuilding-height aspect ratio
BLBoundary layer
BLARBuilding-length aspect ratio
BSCBuilding Site Coverage
BVCBi-variate correlations
CARCavity aspect ratio
CEACity energy analyst
ECEnvelope characteristics
ETExposure time
FARFloor Area Ratio
FBFractional bias
FrFroude number
g’Reduced gravity
GSCGross Site Coverage
HBuilding height
HVBuildings’ Height Variation
IADIndoor air distribution
IAVIndoor air velocity
IGInternal gains
ISLInertial sublayer
KCAK-means cluster analyses
LDALaser doppler anemometry
MTurbulent entrainment flux
MFMesoscale Factor
MRTMean radiant temperature
MVRMean wind velocity ratio
NEVNet escape velocity
OACEOutdoor air change efficiency
OACHOutdoor air change
OMVROverall mean wind velocity ratio
OSOpening size
OSROpen Space Ratio
OUCOrientation of Urban Canyons
PIFPersonal intake fraction
PALMParallelized LES model
PARPlot area ratio
PAVEPavement area percentage
PCPollutant concentrations
PCHPollutant exchange rate
PDPHPressure difference Pascal hours
PETPhysiologically equivalent temperature
PFRPurging flow rate
PIVParticle image velocimetry
QAir flow rate
RCorrelation coefficient
RaRayleigh number
RANSReynolds-averaged Navier–Stokes equation
RbBulk Richardson number
ReReynolds number
RERRe-entry ratio
RiRichardson number
RKERealizable k ϵ turbulence model
RNGRenormalization group k ϵ turbulence model
RTResidence time
SARStreet aspect ratio
SCSite coverage
SCARStreet canyon aspect ratio
SGSolar gains
SKEStandard k ϵ turbulence model
SKOStandard k ω turbulence model
SPStreet patterns
SRSurface roughness
SSTShear-stress Transport k ω turbulence model
STNumber of Stories
SVFSky View Factor
TATree anisotropy
TBHTarget building heights
UBFUrban Building Form
UCLUrban canopy layer
UCPsUrban canopy parameterizations
UDUrban Density
UHIUrban heat island
UPUrban Pattern
UTCIUniversal Thermal Climate Index
VARVolume area ratio
VFVisitation frequency
VRwSpatially-averaged wind velocity ratio
WDWind direction
WOTWindow opening type
WSWindow size
WTEWind tunnel experiment

References

  1. The World’s Cities in 2018: Data Booklet. New York. 2018. Available online: https://www.un-ilibrary.org/content/books/9789210476102 (accessed on 11 April 2019).
  2. World Urbanization Prospects-The 2018 Revision. New York. 2019. Available online: https://www.un-ilibrary.org/content/books/9789210043144 (accessed on 11 April 2019).
  3. Hang, J.; Li, Y.; Sandberg, M. Experimental and numerical studies of flows through and within high-rise building arrays and their link to ventilation strategy. J. Wind. Eng. Ind. Aerodyn. 2011, 99, 1036–1055. [Google Scholar] [CrossRef]
  4. Ramponi, R.; Blocken, B.; Laura, B.; Janssen, W.D. CFD simulation of outdoor ventilation of generic urban configurations with different urban densities and equal and unequal street widths. Build. Environ. 2015, 92, 152–166. [Google Scholar] [CrossRef] [Green Version]
  5. Dai, Y.; Mak, C.M.; Ai, Z. Flow and dispersion in coupled outdoor and indoor environments: Issue of Reynolds number independence. Build. Environ. 2019, 150, 119–134. [Google Scholar] [CrossRef]
  6. King, M.F.; Gough, H.L.; Halios, C.; Barlow, J.F.; Robertson, A.; Hoxey, R.; Noakes, C.J. Investigating the influence of neighbouring structures on natural ventilation potential of a full-scale cubical building using time-dependent CFD. J. Wind. Eng. Ind. Aerodyn. 2017, 169, 265–279. [Google Scholar] [CrossRef]
  7. Lee, D.S.H. Impacts of surrounding building layers in CFD wind simulations. Energy Procedia 2017, 122, 50–55. [Google Scholar] [CrossRef]
  8. Gao, C.; Lee, W.L. The influence of surrounding buildings on the natural ventilation performance of residential dwellings in Hong Kong. Int. J. Vent. 2012, 11, 297–310. [Google Scholar] [CrossRef]
  9. Tong, Z.; Chen, Y.; Malkawi, A. Estimating natural ventilation potential for high-rise buildings considering boundary layer meteorology. Appl. Energy 2017, 193, 276–286. [Google Scholar] [CrossRef]
  10. Padilla-Marcos, M.Á.; Meiss, A.; Feijó-Muñoz, J. Proposal for a simplified CFD procedure for obtaining patterns of the age of air in outdoor spaces for the natural ventilation of buildings. Energies 2017, 10, 1252. [Google Scholar] [CrossRef] [Green Version]
  11. Balczó, M.; Tomor, A. Wind tunnel and computational fluid dynamics study of wind conditions in an urban square. Q. J. Hung. Meteorol. Serv. 2016, 120, 199–229. [Google Scholar]
  12. Salizzoni, P.; Soulhac, L.; Mejean, P. Street canyon ventilation and atmospheric turbulence. Atmos. Environ. 2009, 43, 5056–5067. [Google Scholar] [CrossRef]
  13. Li, Z.; Shi, T.; Wu, Y.; Zhang, H.; Juan, Y.H.; Ming, T.; Zhou, N. Effect of traffic tidal flow on pollutant dispersion in various street canyons and corresponding mitigation strategies. Energy Built Environ. 2020, 1, 242–253. [Google Scholar] [CrossRef]
  14. Di Sabatino, S.; Kastner-Klein, P.; Berkowicz, R.; Britter, R.; Fedorovich, E. The modelling of turbulence from traffic in urban dispersion models—Part I: Theoretical considerations. Environ. Fluid Mech. 2003, 3, 129–143. [Google Scholar] [CrossRef]
  15. Park, S.J.; Kim, J.J.; Choi, W.; Kim, E.R.; Song, C.K.; Pardyjak, E.R. Flow characteristics around step-up street canyons with various building aspect ratios. Bound. Layer Meteorol. 2020, 174, 411–431. [Google Scholar] [CrossRef] [Green Version]
  16. Cheng, W.; Liu, C.H.; Leung, D.Y. Computational formulation for the evaluation of street canyon ventilation and pollutant removal performance. Atmos. Environ. 2008, 42, 9041–9051. [Google Scholar] [CrossRef]
  17. Chen, Z.D.; Li, Y.; Mahoney, J. Experimental modelling of buoyancy-driven flows in buildings using a fine-bubble technique. Build. Environ. 2001, 36, 447–455. [Google Scholar] [CrossRef]
  18. Tan, Z.; Tan, M.; Sui, X.; Jiang, C.; Song, H. Impact of source shape on pollutant dispersion in a street canyon in different thermal stabilities. Atmos. Pollut. Res. 2019, 10, 1985–1993. [Google Scholar] [CrossRef]
  19. Song, J.; Fan, S.; Lin, W.; Mottet, L.; Woodward, H.; Davies Wykes, M.; Arcucci, R.; Xiao, D.; Debay, J.E.; ApSimon, H.; et al. Natural ventilation in cities: The implications of fluid mechanics. Build. Res. Inf. 2018, 46, 809–828. [Google Scholar] [CrossRef]
  20. Duan, G.; Ngan, K. Influence of thermal stability on the ventilation of a 3-D building array. Build. Environ. 2020, 183, 106969. [Google Scholar] [CrossRef]
  21. Fellini, S.; Ridolfi, L.; Salizzoni, P. Street canyon ventilation: Combined effect of cross-section geometry and wall heating. Q. J. R. Meteorol. Soc. 2020, 146, 2347–2367. [Google Scholar] [CrossRef]
  22. Kim, J.J.; Baik, J.J. Effects of street-bottom and building-roof heating on flow in three-dimensional street canyons. Adv. Atmos. Sci. 2010, 27, 513–527. [Google Scholar] [CrossRef]
  23. Hang, J.; Chen, X.; Chen, G.; Chen, T.; Lin, Y.; Luo, Z.; Zhang, X.; Wang, Q. The influence of aspect ratios and wall heating conditions on flow and passive pollutant exposure in 2D typical street canyons. Build. Environ. 2020, 168, 106536. [Google Scholar] [CrossRef]
  24. Linden, P.F. The fluid mechanics of natural ventilation. Annu. Rev. Fluid Mech. 1999, 31, 201–238. [Google Scholar] [CrossRef] [Green Version]
  25. Chung, D.H.J.; Hien, W.N.; Jusuf, S.K. Anthropogenic heat contribution to air temperature increase at pedestrian height in Singapore’s high density Central Business District (CBD). In Proceedings of the 9th International Conference on Urban Climate, Toulouse, France, 20–24 July 2015. [Google Scholar]
  26. He, B.J.; Ding, L.; Prasad, D. Enhancing urban ventilation performance through the development of precinct ventilation zones: A case study based on the Greater Sydney, Australia. Sustain. Cities Soc. 2019, 47, 101472. [Google Scholar] [CrossRef]
  27. Javanroodi, K.; Nik, V.M. Interactions between extreme climate and urban morphology: Investigating the evolution of extreme wind speeds from mesoscale to microscale. Urban Clim. 2020, 31, 100544. [Google Scholar] [CrossRef]
  28. Mosteiro-Romero, M.; Maiullari, D.; Pijpers-van Esch, M.; Schlueter, A. An integrated microclimate-energy demand simulation method for the assessment of urban districts. Front. Built Environ. 2020, 6, 553946. [Google Scholar] [CrossRef]
  29. Zhang, R.; Mirzaei, P.A. CFD-CFD coupling: A novel method to develop a fast urban microclimate model. J. Build. Phys. 2021, 44, 385–408. [Google Scholar] [CrossRef]
  30. Jiang, Y.; Wu, C.; Teng, M. Impact of residential building layouts on microclimate in a high temperature and high humidity region. Sustainability 2020, 12, 1046. [Google Scholar] [CrossRef] [Green Version]
  31. Chatzidimitriou, A.; Yannas, S. Street canyon design and improvement potential for urban open spaces; the influence of canyon aspect ratio and orientation on microclimate and outdoor comfort. Sustain. Cities Soc. 2017, 33, 85–101. [Google Scholar] [CrossRef]
  32. Chatzimichailidis, A.E.; Argyropoulos, C.D.; Assael, M.J.; Kakosimos, K.E. Implicit Definition of Flow Patterns in Street Canyons—Recirculation Zone—Using Exploratory Quantitative and Qualitative Methods. Atmosphere 2019, 10, 794. [Google Scholar] [CrossRef] [Green Version]
  33. Zhao, Y.; Chew, L.W.; Kubilay, A.; Carmeliet, J. Isothermal and non-isothermal flow in street canyons: A review from theoretical, experimental and numerical perspectives. Build. Environ. 2020, 184, 107163. [Google Scholar] [CrossRef]
  34. Yang, X.; Zhang, Y.; Hang, J.; Lin, Y.; Mattsson, M.; Sandberg, M.; Zhang, M.; Wang, K. Integrated assessment of indoor and outdoor ventilation in street canyons with naturally-ventilated buildings by various ventilation indexes. Build. Environ. 2020, 169, 106528. [Google Scholar] [CrossRef]
  35. Chen, G.; Wang, D.; Wang, Q.; Li, Y.; Wang, X.; Hang, J.; Gao, P.; Ou, C.; Wang, K. Scaled outdoor experimental studies of urban thermal environment in street canyon models with various aspect ratios and thermal storage. Sci. Total. Environ. 2020, 726, 138147. [Google Scholar] [CrossRef]
  36. Nazarian, N.; Martilli, A.; Kleissl, J. Impacts of realistic urban heating, part I: Spatial variability of mean flow, turbulent exchange and pollutant dispersion. Bound. Layer Meteorol. 2018, 166, 367–393. [Google Scholar] [CrossRef]
  37. Li, Z.; Xu, J.; Ming, T.; Peng, C.; Huang, J.; Gong, T. Numerical simulation on the effect of vehicle movement on pollutant dispersion in urban street. Procedia Eng. 2017, 205, 2303–2310. [Google Scholar] [CrossRef]
  38. Lo, K.; Ngan, K. Characterizing ventilation and exposure in street canyons using Lagrangian particles. J. Appl. Meteorol. Climatol. 2017, 56, 1177–1194. [Google Scholar] [CrossRef]
  39. Peng, Y.; Ma, X.; Zhao, F.; Liu, C.; Mei, S. Wind driven natural ventilation and pollutant dispersion in the dense street canyons: Wind Opening Percentage and its effects. Procedia Eng. 2017, 205, 415–422. [Google Scholar] [CrossRef]
  40. Cheng, W.C.; Liu, C.H.; Leung, D.Y. On the comparison of the ventilation performance of street canyons of different aspect ratios and Richardson number. Build. Simul. 2009, 2, 53–61. [Google Scholar] [CrossRef]
  41. Ricci, A.; Kalkman, I.; Blocken, B.; Burlando, M.; Repetto, M. Impact of turbulence models and roughness height in 3D steady RANS simulations of wind flow in an urban environment. Build. Environ. 2020, 171, 106617. [Google Scholar] [CrossRef]
  42. Li, J.; Peng, Y.; Ji, H.; Hu, Y.; Ding, W. A wind tunnel study on the correlation between urban space quantification and pedestrian–level ventilation. Atmosphere 2019, 10, 564. [Google Scholar] [CrossRef] [Green Version]
  43. Izadyar, N.; Miller, W.; Rismanchi, B.; Garcia-Hansen, V. Numerical simulation of single-sided natural ventilation: Impacts of balconies opening and depth scale on indoor environment. In Proceedings of the IOP Conference Series: Earth and Environmental Science; IOP Publishing: Bristol, UK, 2020; Volume 463, p. 012037. [Google Scholar]
  44. Aly, A.M.; Khaled, F.; Gol-Zaroudi, H. Aerodynamics of low-rise buildings: Challenges and recent advances in experimental and computational methods. Aerodynamics 2020, 18, 1–22. [Google Scholar]
  45. He, Y.; Schnabel, M.A.; Mei, Y. A novel methodology for architectural wind environment study by integrating CFD simulation, multiple parametric tools and evaluation criteria. Build. Simul. 2020, 13, 609–625. [Google Scholar] [CrossRef]
  46. Jiang, Y.; Alexander, D.; Jenkins, H.; Arthur, R.; Chen, Q. Natural ventilation in buildings: Measurement in a wind tunnel and numerical simulation with large-eddy simulation. J. Wind. Eng. Ind. Aerodyn. 2003, 91, 331–353. [Google Scholar] [CrossRef]
  47. Li, B.; Luo, Z.; Sandberg, M.; Liu, J. Revisiting the ‘Venturi effect’ in passage ventilation between two non-parallel buildings. Build. Environ. 2015, 94, 714–722. [Google Scholar] [CrossRef]
  48. Liu, X.; Wu, X.; Wu, M.; Shi, C. The impact of building surface temperature rise on airflow and cross-contamination around high-rise building. Environ. Sci. Pollut. Res. 2020, 27, 11855–11869. [Google Scholar] [CrossRef] [PubMed]
  49. Mou, B.; He, B.J.; Zhao, D.X.; Chau, K.w. Numerical simulation of the effects of building dimensional variation on wind pressure distribution. Eng. Appl. Comput. Fluid Mech. 2017, 11, 293–309. [Google Scholar] [CrossRef] [Green Version]
  50. Wang, Q.; Sandberg, M.; Lin, Y.; Yin, S.; Hang, J. Impacts of urban layouts and open space on urban ventilation evaluated by concentration decay method. Atmosphere 2017, 8, 169. [Google Scholar] [CrossRef] [Green Version]
  51. Zhang, X.; Weerasuriya, A.U.; Zhang, X.; Tse, K.T.; Lu, B.; Li, C.Y.; Liu, C.H. Pedestrian wind comfort near a super-tall building with various configurations in an urban-like setting. Build. Simul. 2020, 13, 1385–1408. [Google Scholar] [CrossRef]
  52. Zheng, S.; Guldmann, J.M.; Liu, Z.; Zhao, L.; Wang, J.; Pan, X.; Zhao, D. Predicting the influence of subtropical trees on urban wind through wind tunnel tests and numerical simulations. Sustain. Cities Soc. 2020, 57, 102116. [Google Scholar] [CrossRef]
  53. Zheng, J.; Tao, Q.; Li, L. Wind pressure coefficient on a multi-storey building with external shading louvers. Appl. Sci. 2020, 10, 1128. [Google Scholar] [CrossRef] [Green Version]
  54. Ai, Z.; Mak, C.M. Potential use of reduced-scale models in CFD simulations to save numerical resources: Theoretical analysis and case study of flow around an isolated building. J. Wind. Eng. Ind. Aerodyn. 2014, 134, 25–29. [Google Scholar] [CrossRef]
  55. Aristodemou, E.; Mottet, L.; Constantinou, A.; Pain, C. Turbulent flows and pollution dispersion around tall buildings using adaptive large eddy simulation (LES). Buildings 2020, 10, 127. [Google Scholar] [CrossRef]
  56. Buccolieri, R.; Santiago, J.L.; Martilli, A. CFD modelling: The most useful tool for developing mesoscale urban canopy parameterizations. Build. Simul. 2021, 14, 407–419. [Google Scholar] [CrossRef]
  57. da Graça, G.C.; Linden, P. Ten questions about natural ventilation of non-domestic buildings. Build. Environ. 2016, 107, 263–273. [Google Scholar] [CrossRef] [Green Version]
  58. Ding, C.; Lam, K.P. Data-driven model for cross ventilation potential in high-density cities based on coupled CFD simulation and machine learning. Build. Environ. 2019, 165, 106394. [Google Scholar] [CrossRef] [Green Version]
  59. Du, Y.; Mak, C.M.; Tang, B.s. Effects of building height and porosity on pedestrian level wind comfort in a high-density urban built environment. Build. Simul. 2018, 11, 1215–1228. [Google Scholar] [CrossRef]
  60. Duan, G.; Ngan, K. Sensitivity of turbulent flow around a 3-D building array to urban boundary-layer stability. J. Wind. Eng. Ind. Aerodyn. 2019, 193, 103958. [Google Scholar] [CrossRef]
  61. Ernest, D.; Bauman, F.; Arens, E.A. The Prediction of Indoor Air Motion for Occupant Cooling in Naturally Ventilated Buildings; ASHRAE Transactions Symposia; The Regents of the University of California: Oakland, CA, USA, 1991. [Google Scholar]
  62. Gupta, A.; Tripathi, B. Study of building aerodynamics for designing natural ventilation system. In NIET Journal of Engineering and Technology; ResearchGate: Berlin, Germany, 2015; ISSN 2229-5828. [Google Scholar]
  63. Ignatius, M.; Wong, N.; Martin, M.; Chen, S. Virtual Singapore integration with energy simulation and canopy modelling for climate assessment. In Proceedings of the IOP Conference Series: Earth and Environmental Science; IOP Publishing: Bristol, UK, 2019; Volume 294, p. 012018. [Google Scholar]
  64. Mittal, H.; Sharma, A.; Gairola, A. A review on the study of urban wind at the pedestrian level around buildings. J. Build. Eng. 2018, 18, 154–163. [Google Scholar] [CrossRef]
  65. Peng, Y.; Gao, Z.; Ding, W. An approach on the correlation between urban morphological parameters and ventilation performance. Energy Procedia 2017, 142, 2884–2891. [Google Scholar] [CrossRef]
  66. Peng, Y.; Gao, Z.; Buccolieri, R.; Ding, W. An investigation of the quantitative correlation between urban morphology parameters and outdoor ventilation efficiency indices. Atmosphere 2019, 10, 33. [Google Scholar] [CrossRef] [Green Version]
  67. Rizk, A.; El Morsi, M.; Elwan, M. A review on wind-driven cross–ventilation techniques inside single rooms. Int. J. Sci. Eng. Res 2018, 6, 75–93. [Google Scholar]
  68. sanchez ramos, J.; Salmerón, J.; Sánchez de la Flor, F.; Álvarez, S.; Molina, J. Ventilación natural: Estudio aerodinámico mediante CFD de extractores pasivos y captadores de viento. Rev. Ing. ConstruccióN 2011, 27, 40–56. [Google Scholar] [CrossRef] [Green Version]
  69. Toparlar, Y.; Blocken, B.; Maiheu, B.; Van Heijst, G. A review on the CFD analysis of urban microclimate. Renew. Sustain. Energy Rev. 2017, 80, 1613–1640. [Google Scholar] [CrossRef]
  70. Wang, B. Urban wind energy evaluation with urban morphology. In Modeling, Simulation and Optimization of Wind Farms and Hybrid Systems; IntechOpen: London, UK, 2020; Volume 101. [Google Scholar]
  71. Chen, G.; Rong, L.; Zhang, G. Numerical simulations on atmospheric stability conditions and urban airflow at five climate zones in China. Energy Built Environ. 2021, 2, 188–203. [Google Scholar] [CrossRef]
  72. Javanroodi, K.; Mahdavinejad, M.; Nik, V.M. Impacts of urban morphology on reducing cooling load and increasing ventilation potential in hot-arid climate. Appl. Energy 2018, 231, 714–746. [Google Scholar] [CrossRef]
  73. Gu, K.; Fang, Y.; Qian, Z.; Sun, Z.; Wang, A. Spatial planning for urban ventilation corridors by urban climatology. Ecosyst. Health Sustain. 2020, 6, 1747946. [Google Scholar] [CrossRef] [Green Version]
  74. Masoumi, H.R.; Nejati, N.; Ahadi, A.a. Learning from the heritage architecture: Developing natural ventilation in compact urban form in hot-humid climate: Case study of Bushehr, Iran. Int. J. Archit. Herit. 2017, 11, 415–432. [Google Scholar] [CrossRef]
  75. Mora-Pérez, M.; Guillen-Guillamón, I.; López-Patiño, G.; López-Jiménez, P.A. Natural Ventilation Building Design Approach in Mediterranean Regions—A Case Study at the Valencian Coastal Regional Scale (Spain). Sustainability 2016, 8, 855. [Google Scholar] [CrossRef] [Green Version]
  76. Poh, H.J.; Chan, W.L.; Wise, D.J.; Lim, C.W.; Khoo, B.C.; Gobeawan, L.; Ge, Z.; Eng, Y.; Peng, J.X.; Raghavan, V.S.; et al. Wind load prediction on single tree with integrated approach of L-system fractal model, wind tunnel, and tree aerodynamic simulation. AIP Adv. 2020, 10, 075202. [Google Scholar] [CrossRef]
  77. Tong, S.; Wong, N.H.; Jusuf, S.K.; Tan, C.L.; Wong, H.F.; Ignatius, M.; Tan, E. Study on correlation between air temperature and urban morphology parameters in built environment in northern China. Build. Environ. 2018, 127, 239–249. [Google Scholar] [CrossRef]
  78. Wang, J.W.; Yang, H.J.; Kim, J.J. Wind speed estimation in urban areas based on the relationships between background wind speeds and morphological parameters. J. Wind. Eng. Ind. Aerodyn. 2020, 205, 104324. [Google Scholar] [CrossRef]
  79. Wong, N.H.; He, Y.; Nguyen, N.S.; Raghavan, S.V.; Martin, M.; Hii, D.J.C.; Yu, Z.; Deng, J. An integrated multiscale urban microclimate model for the urban thermal environment. Urban Clim. 2021, 35, 100730. [Google Scholar] [CrossRef]
  80. Yahia, M.W.; Johansson, E.; Thorsson, S.; Lindberg, F.; Rasmussen, M.I. Effect of urban design on microclimate and thermal comfort outdoors in warm-humid Dar es Salaam, Tanzania. Int. J. Biometeorol. 2018, 62, 373–385. [Google Scholar] [CrossRef] [PubMed] [Green Version]
  81. Belleri, A.; Dutton, S.; Oberegger, U.F.; Lollini, R. A sensitivity analysis of natural ventilation design parameters for non residential buildings. Build. Simul. Chambery 2013. [Google Scholar] [CrossRef]
  82. Du, Y.; Mak, C.M. Improving pedestrian level low wind velocity environment in high-density cities: A general framework and case study. Sustain. Cities Soc. 2018, 42, 314–324. [Google Scholar] [CrossRef] [PubMed]
  83. Du, Y.; Mak, C.M.; Kwok, K.; Tse, K.T.; Lee, T.c.; Ai, Z.; Liu, J.; Niu, J. New criteria for assessing low wind environment at pedestrian level in Hong Kong. Build. Environ. 2017, 123, 23–36. [Google Scholar] [CrossRef] [Green Version]
  84. Ignatius, M.; Wong, N.H.; Jusuf, S.K. Urban microclimate analysis with consideration of local ambient temperature, external heat gain, urban ventilation, and outdoor thermal comfort in the tropics. Sustain. Cities Soc. 2015, 19, 121–135. [Google Scholar] [CrossRef]
  85. Javanroodi, K.; Nik, V.M. Evaluating the Impacts of Urban Form on the Microclimate in the Dense Areas. In Proceedings of the 16th IBPSA Conference, Milan, Italy, 2–4 September 2019; pp. 3586–3593. [Google Scholar]
  86. Kouhirostami, M. Natural Ventilation through Windows in a Classroom (CFD Analysis Crossventilation of Asymmetric Openings: Impact of Wind Direction and Louvers Design). Master’s Thesis, Texas Tech University, Lubbock, TX, USA, 2018. [Google Scholar]
  87. Luo, X.; Vahmani, P.; Hong, T.; Jones, A. City-scale building anthropogenic heating during heat waves. Atmosphere 2020, 11, 1206. [Google Scholar] [CrossRef]
  88. Nugrahanti, F.I.; Lubis, I.H.; Kusyala, D. The Impact of Building Mass Configuration Towards Wind-Driven Natural Ventilation in Apartment in Jakarta. In Proceedings of the IOP Conference Series: Earth and Environmental Science; IOP Publishing: Bristol, UK, 2018; Volume 213, p. 012042. [Google Scholar]
  89. Pawar, P.; Zhang, D.; Wu, X.; Lang, W. Investigation of wind flow patterns in dense urban environment of an equitorial tropical city: A case study in singapore. In Proceedings of the BauSIM 2020-8th Conference of IBPSA Germany and Austria, Vienna, Austria, 23–25 September 2020; pp. 210–218. [Google Scholar]
  90. Qi, R.; Lu, L.; Yang, H. Impact of climate change on ventilation load and energy use of air conditioning systems in buildings of Hong Kong. Int. J. Low-Carbon Technol. 2012, 7, 303–309. [Google Scholar] [CrossRef] [Green Version]
  91. Shi, Z.; Fonseca, J.A.; Schlueter, A. A parametric method using vernacular urban block typologies for investigating interactions between solar energy use and urban design. Renew. Energy 2021, 165, 823–841. [Google Scholar] [CrossRef]
  92. Yang, L.; Zhang, G.; Li, Y.; Chen, Y. Investigating potential of natural driving forces for ventilation in four major cities in China. Build. Environ. 2005, 40, 738–746. [Google Scholar] [CrossRef]
  93. Plörer, D.; Hammes, S.; Hauer, M.; van Karsbergen, V.; Pfluger, R. Control strategies for daylight and artificial lighting in office buildings—A bibliometrically assisted review. Energies 2021, 14, 3852. [Google Scholar] [CrossRef]
  94. Eck, N.J.V.; Waltman, L. How to normalize cooccurrence data? An analysis of some well-known similarity measures. J. Am. Soc. Inf. Sci. Technol. 2009, 60, 1635–1651. [Google Scholar] [CrossRef] [Green Version]
  95. Van Eck, N.J.; Waltman, L. VOSviewer Manual version 1.6.16; Univeristeit Leiden: Leiden, The Netherlands, 2020; pp. 1–52. [Google Scholar]
  96. Jiang, F.; Li, Z.; Zhao, Q.; Tao, Q.; Yuan, Y.; Lu, S. Flow field around a surface-mounted cubic building with louver blinds. Build. Simul. 2019, 12, 141–151. [Google Scholar] [CrossRef]
  97. Dascalaki, E.; Santamouris, M.; Argiriou, A.; Helmis, C.; Asimakopoulos, D.; Papadopoulos, K.; Soilemes, A. On the combination of air velocity and flow measurements in single sided natural ventilation configurations. Energy Build. 1996, 24, 155–165. [Google Scholar] [CrossRef]
  98. Addepalli, B.; Pardyjak, E.R. Investigation of the flow structure in step-up street canyons—mean flow and turbulence statistics. Bound. Layer Meteorol. 2013, 148, 133–155. [Google Scholar] [CrossRef]
  99. Blocken, B.; Stathopoulos, T.; Carmeliet, J. Wind environmental conditions in passages between two long narrow perpendicular buildings. J. Aerosp. Eng. 2008, 21, 280–287. [Google Scholar] [CrossRef] [Green Version]
  100. Xu, F.; Gao, Z.; Zhang, J. Effects of roadside morphologies and moving vehicles on street canyon ventilation. Build. Environ. 2022, 218, 109138. [Google Scholar] [CrossRef]
  101. Peng, Y.; Gao, Z.; Buccolieri, R.; Shen, J.; Ding, W. Urban ventilation of typical residential streets and impact of building form variation. Sustain. Cities Soc. 2021, 67, 102735. [Google Scholar] [CrossRef]
  102. Zheng, X.; Yang, J. CFD simulations of wind flow and pollutant dispersion in a street canyon with traffic flow: Comparison between RANS and LES. Sustain. Cities Soc. 2021, 75, 103307. [Google Scholar] [CrossRef]
  103. Papp, B.; Kristóf, G.; Istók, B.; Koren, M.; Balczó, M.; Balogh, M. Measurement-driven Large Eddy Simulation of dispersion in street canyons of variable building height. J. Wind. Eng. Ind. Aerodyn. 2021, 211, 104495. [Google Scholar] [CrossRef]
  104. Zhao, Y.; Li, H.; Kubilay, A.; Carmeliet, J. Buoyancy effects on the flows around flat and steep street canyons in simplified urban settings subject to a neutral approaching boundary layer: Wind tunnel PIV measurements. Sci. Total. Environ. 2021, 797, 149067. [Google Scholar] [CrossRef] [PubMed]
  105. Chen, G.; Charlie Lam, C.K.; Wang, K.; Wang, B.; Hang, J.; Wang, Q.; Wang, X. Effects of urban geometry on thermal environment in 2D street canyons: A scaled experimental study. Build. Environ. 2021, 198, 107916. [Google Scholar] [CrossRef]
  106. Štěpán, N.; Kluková, Z.; Jakubcová, M.; Jaňour, Z. The effect of courtyard buildings on the ventilation of street canyons: A wind-tunnel study. J. Wind. Eng. Ind. Aerodyn. 2022, 220, 104885. [Google Scholar] [CrossRef]
  107. Cui, D.; Li, X.; Liu, J.; Yuan, L.; Mak, C.M.; Fan, Y.; Kwok, K. Effects of building layouts and envelope features on wind flow and pollutant exposure in height-asymmetric street canyons. Build. Environ. 2021, 205, 108177. [Google Scholar] [CrossRef]
Figure 1. Streamlines representing air flow around buildings: change in colours represents the variation in magnitude intensity of air velocity.
Energies 16 02577 g001
Figure 2. Wind-driven air flows inside and around buildings: velocity (on the left) and pressure (on the right) contour plots.
Energies 16 02577 g002
Figure 3. Yearly distribution of studies on ventilation.
Energies 16 02577 g003
Figure 4. Grouping of studies depending on type of urban area (actual or fictitious) and by presence of comparison with experimental or analytical data.
Energies 16 02577 g004
Figure 5. VOSviewer keywords map.
Energies 16 02577 g005
Table 1. Overview of studies of fictitious urban areas with comparison with experimental or numerical data: type of building, city, experiment and simulation code.
No.AuthorBuilding/City TypeExperimentSimulation Codes/Instruments Used
1Aly et al., 2021 [44]Low-rise buildingWTE-
2Chen et al., 2001 [17]Single-zone buildingFine-bubble technique-
3Dai et al., 2019 [5]An isolated multi-story building, an array of multi-story buildingsTracer gas decay method on a full-scale building modelAnsys Fluent 13.0
4Hang et al., 2011 [3]High-rise square building arraysWTECode “Ventair” using Fortran language for CFD
5Hang et al., 2020 [23]Idealized 2D street canyonsWTEAnsys Fluent
6He et al., 2020 [45]Square form and scattered configurationWTEFlow Simulation
7Jiang et al., 2003 [46]Cubic buildingBL WTE with LDA-
8Kim and Baik, 2010 [22]Group of infinitely repeated cubical buildingsWTE-
9Li et al., 2015 [47]Non-parallel converging and diverging buildingsWTEAnsys Fluent 14.0
10Li et al., 2017 [37]Constant height buildingsWTEAnsys Fluent 14.0
11Liu et al., 2020 [48]Scaled high-rise buildingWTEAnsys Fluent 15.0
12Mou et al., 2017 [49]-WTEAnsys Fluent 14.0
13Padilla-Marcos et al., 2017 [10]Cubical buildingWTEAnsys Fluent 15.1
14Park et al., 2020 [15]16 step-up street-canyon with different aspect ratiosWTE-
15Salizzoni et al., 2009 [12]Simplified model of the urban canopy, made up of a uniform arrayWTE with PIV-
16Tan et al., 2019 [18]-Atmospheric diffusion WTEAnsys Fluent
17Wang et al., 2017 [50]7-row and 11-column cubic building arrayWTEAnsys Fluent 6.3
18Yang et al., 2020 [34]Simple cubic buildingWTEAnsys Fluent
19Zhang et al., 2020 [51]A tall buildingWTEAnsys Fluent v19.2
20Zheng et al., 2020 [52]-BL WTEAnsys Fluent 15.0
21Zheng et al., 2020 [53]Multi-floor and multi-row buildingsWTEAnsys Fluent
Table 2. Overview of studies of fictitious urban areas with validation comparison with experimental or numerical data: adopted turbulence models and parameters, and listed keywords.
No.AuthorTurbulence ModelsParametersKeywords
1Aly et al., 2021 [44]LES-aerodynamics, wind engineering, open-jet testing, wind tunnel, atmospheric boundary layer, low-rise buildings
2Chen et al., 2001 [17]-M, g’, B, Rabuoyancy; modelling; natural ventilation; similarity
3Dai et al., 2019 [5]LESPC, RER, ReCFD simulation; coupled outdoor and indoor environment; natural ventilation; pollutant dispersion; Reynolds number independence criteria; coupled outdoor and indoor environment; Reynolds number independence criteria
4Hang et al., 2011 [3] k ϵ SAR, BAD, Hhigh-rise building array; numerical simulation; turbulence; urban canopy; velocity; wind tunnel
5Hang et al., 2020 [23]RNGAR, P_IF, Re, Ri, Fraspect ratio (AR); computational fluid dynamic (CFD) simulations; Froude number; street canyon; street intake fraction <P_IF>; wall heating
6He et al., 2020 [45]Modified k ϵ -CFD; integrated methodology; optimum design; parametric tools; wind environment
7Jiang et al., 2003 [46]LES-large-eddy simulation (LES); filtered dynamic subgrid-scale model; wind tunnel; laser Doppler anemometry (LDA); cross ventilation; single-sided ventilation
8Kim and Baik, 2010 [22]RNGBAR, SCARbuilding-roof heating; cfd model; street canyon flow; street-bottom heating
9Li et al., 2015 [47]SKE, RNG, RKE-building passage; pedestrian wind comfort; urban wind; ventilation
10Li et al., 2017 [37]SKE-dynamic mesh; moving vehicles; pollutant dispersion; urban street canyon; vehicle-induced turbulence
11Liu et al., 2020 [48]RNGRiconcentration; high-rise building; pollutant; temperature; vortex core
12Mou et al., 2017 [49]RKE-building dimensions; computational fluid dynamics; height–thickness scenario; height–width scenario; mean wind pressure; square-shaped tall buildings
13Padilla-Marcos et al., 2017 [10] k ϵ OACH, OACEage of the outdoor air; building shape impact; computational fluid dynamics (CFD) method; ideal control domain; indoor air quality; urban built environment; wind profile
14Park et al., 2020 [15]RNGBHAR, BLAR, Ribuilding-length aspect ratio; computational fluid dynamics; building-length aspect ratio; development and mature stages; flow characteristics; step-up street canyon
15Salizzoni et al., 2009 [12]--dispersion models; street canyon; turbulent mass transfer; urban air pollution
16Tan et al., 2019 [18]LES-numerical simulation; pollutant dispersion; source shape; street canyon; thermal stratification
17Wang et al., 2017 [50]SKE-air change rate per hour (ACH); computational fluid dynamics (CFD) simulation; concentration decay method; small open space; urban age of air
18Yang et al., 2020 [34]RNGSAR, WS, ACH, MAA, PFRage of air ( τ ); air change rate per hour (ACH); building natural ventilation; computational fluid dynamics (CFD); purging flow rate (PFR); urban ventilation
19Zhang et al., 2020 [51]RKE-building configuration; computational fluid dynamics simulation; pedestrian wind comfort; super-tall building; urban wind environment
20Zheng et al., 2020 [52] k ϵ -tree drag coefficient; turbulent flow model; urban heat island; urban ventilation; wind tunnel test
21Zheng et al., 2020 [53]RKE-CFD simulation; rotation angle; shading louvers; wind pressure coefficient
Table 3. Overview of studies of fictitious urban areas without validation comparison with experimental or numerical data: type of building, city, experiment and simulation code.
No.AuthorBuilding/City TypeExperimentSimulation Codes/Instruments Used
1Ai and Mak, 2014 [54]Building-Ansys Fluent 13.0
2Aristodemou et al., 2020 [55]High-rise buildings-FLUIDITY
3Buccolieri et al., 2020 [56]---
4Carrilho da Graça and Linden, 2016 [57]Non-domestic building--
5Chatzimichailidis et al., 2019 [32]2 building blocks-OpenFoam
6Chen et al., 2020 [35]Hollow and sand building modelsScaled outdoor field experiment (sonic anemometers, thermocouples, infrared camera, weather station)-
7Cheng et al., 2008 [16]2D idealized street canyon-Ansys Fluent, 2008
8Cheng et al., 2009 [40]13 identical 2D street canyons regularly placed in the streamwise direction-Ansys Fluent, 2008
9di Sabatino et al., 2003 [14]-LDA-
10Ding and Lam, 2019 [58]Urban form-scSTREAM v13
11Du et al., 2018 [59]Isolated building surrounded by three building heights-Ansys 2010
12Duan and Ngan, 2019 [60]Regular building arrayWind tunnel data-
13Duan and Ngan, 2020 [20]Cubical building array-PALM
14Ernest et al., 1991 [61]2 single-room modelsBL WTE-
15Fellini et al., 2020 [21]Idealized urban geometryClosed-circuit WTE-
16Gupta and Tripathy, 2015 [62]Cylindrical, cuboidal and back stair type buildings-Ansys (2D, 3D)
17Ignatius et al., 2019 [63]Urban canopy-BESCAM, EnergyPlus, CityGML, IFC-BIM
18Li et al., 2020 [13]5 street canyon structures-Ansys Fluent 15.0
19Mittal et al., 2018 [64]---
20Nazarian et al., 2017 [37]Idealized 3D urban configuration-PALM
21Peng et al., 2017 [65]Urban morphology--
22Peng et al., 2017 [39]Ten identical buildings--
23Peng et al., 2019 [66]Urban morphology-Ansys Fluent 15.06
24Ramponi et al., 2015 [4]Buildings with different urban densities and equal and unequal street widths--
25Rizk et al., 2018 [67]Single rooms with different opening configurations--
26Sanchez et al., 2012 [68]---
27Toparlar et al., 2017 [69]---
28Zhang and Mirzaei., 2020 [29]--CFDf- CFX, CFDc- Ansys Fluent 19.1, BES- EnergyPlus
29Zhao et al., 2020 [33]Urban formPIV-
Table 4. Overview of studies of fictitious urban areas without validation comparison with experimental or numerical data: adopted turbulence models and parameters, and listed keywords.
No.AuthorTurbulence ModelsParametersKeywords
1Ai and Mak, 2014 [54]RNG-CFD; mesh number; model scale; numerical resources; reduced-scale model
2Aristodemou et al., 2020 [55]Adaptive LES-air pollution dispersion; large eddy simulation; tall buildings; turbulence
3Buccolieri et al., 2020 [56]-UCL, UCPs, ISL-
4Carrilho da Graça and Linden, 2016 [57]--day lighting; natural ventilation; single sided ventilation; stack; vortex shedding
5Chatzimichailidis et al., 2019 [32]LES-atmospheric dispersion models; large eddy simulations; machine learning; street canyon
6Chen et al., 2020 [35]-SARaspect ratio; daily temperature cycle; daily temperature range (DTR); scaled outdoor measurement of urban climate; street canyon; thermal storage
7Cheng et al., 2008 [16]RNGACH, PCH, θ , τ air quality; computational fluid dynamics (CFD); k ϵ turbulence model; Reynolds-averaged Navier–Stokes (RANS) equations; street canyon
8Cheng et al., 2009 [40]RNGACH, PCH, RiRNG k ϵ turbulence model; air exchange rate (ACH); ground heating; street canyons; ventilation
9di Sabatino et al., 2003 [14]--dispersion modelling; low wind conditions; pollutant dispersion; street canyon; traffic produced turbulence; urban areas
10Ding and Lam, 2019 [58]RNGUD, TBH, HV, OS, WD, OUCcoupled CFD simulation; data-driven model; early design support; high-density city; machine learning; urban ventilation
11Du et al., 2018 [59]RNGOMVRbuilding height; building porosity; computational fluid dynamics (CFD) simulation; pedestrian level wind comfort
12Duan and Ngan, 2019 [60]LESRbcomputational fluid dynamics; error statistics; flow-regime transition; large-eddy simulation; quadrant analysis; stratification
13Duan and Ngan, 2020 [20]LES-flow regime; pollutant dispersion; stable stratification; tracer age; urban boundary layer
14Ernest et al., 1991 [61]---
15Fellini et al., 2020 [21]-CARsolar radiation; street canyon; thermal effects; urban air pollution; wind-tunnel experiments
16Gupta and Tripathy, 2015 [62]Laminar flowBAFair flow affecting ventilation system; building aerodynamics; building ventilation
17Ignatius et al., 2019 [63]---
18Li et al., 2020 [13]SKE, RNG, RKEIF_pcomputational fluid dynamics (CFD); intake fraction; street canyon; wind catchers
19Mittal et al., 2018 [64]--building design; CFD; urban wind climate; wind comfort; wind tunnel test
20Nazarian et al., 2017 [37]LES-computational fluid dynamics; pollutant dispersion; realistic heating distribution; three-dimensional street canyon; turbulent transfer
21Peng et al., 2017 [65]SKE, IMERSOL radiation model, Boussinesq approximation for buoyancyFAR, BSC, VR_w, ATcorrelation research; morphological parameter; ventilation performance
22Peng et al., 2017 [39]SKE-full numerical simulation; pollutants dispersion; urban street canyon; wind driven natural ventilation; window opening percentage
23Peng et al., 2019 [66]SKEFAR, BSC, Q, MAA, NEV, PFR, VF, TPbuilding site coverage; outdoor ventilation; urban morphology; ventilation efficiency
24Ramponi et al., 2015 [4]SKE, RNG, RKE-building aerodynamics; CFD; natural ventilation; urban physics; urban wind flow; ventilation efficiency
25Rizk et al., 2018 [67]--cross-ventilation techniques; hot; outdoor wind conditions; single room space; velocity and temperature; wind driven
26Sanchez et al., 2012 [68] k ϵ -windcatcher; passive elements; natural ventilation; pressure coefficient; CFD
27Toparlar et al., 2017 [69]--adaptation measures; building energy consumption; computational fluid dynamics (CFD); sustainability; urban physics
28Zhang and Mirzaei., 2020 [29]CFD_f: modified k ϵ , CFD_c: SKE-computational fluid dynamics, cross-ventilation, coupling, urban climate, natural ventilation, building energy simulation
29Zhao et al., 2020 [33]RANS, LES-computational fluid dynamics; scaling analysis; turbulence models; urban street canyon flows; wind tunnel measurements
Table 5. Overview of studies of real urban areas with validation comparison with experimental or numerical data: name and type of studied location and type of experiments.
No.AuthorStudy Location into ConsiderationBuilding/City TypeExperiment
1Balczó and Tomor, 2016 [11]József Nádor Square, BudapestTypical urban squareGöttingen-type WTE with LDV
2Biao Wang, 2016 [70]Beijing, ChinaUrban form, high residential buildingsWTE
3Chatzidimitriou and Yannas, 2017 [31]Thessaloniki, Greece18 central street canyonsAirflow measurements during both summer and winter
4Chen et al., 2020 [71]Guangzhou, Kunming, Shanghai, Beijing, Harbin (China)Idealized building arraysWTE
5Gao and Lee, 2012 [8]Hong Kong, ChinaResidential estatePrevailing wind conditions measurements around representative building
6Hii et al., 2014 [25]SingaporeHigh-density Central Business District (CBD)Weather station, roadside measurements
7Izadyar et al., 2020 [43]Brisbane, AustraliaResidential buildingMeasurements using anemometer, relative humidity sensors, temperature sensors
8Javanroodi et al., 2018 [72]Tehran, IranHigh-rise building surrounded by different urban configurationsAvailable in-site measurements and wind tunnel tests data
9Kangkang et al., 2020 [73]Bozhou, ChinaCentral area of the cityHourly wind speed data of Bozhou Weather Station
10King et al., 2017 [6]Bedford, UKAn isolated cube and an irregular nine-cube arrayExperiments using the Silsoe cube
11Masoumi et al., 2017 [74]Bushehr, IranCompact urban formWind velocity measurements by anemometer
12Mora-Pérez et al., 2016 [75]Valencia, SpainResidential houseWind measurements and statistics data measurement
13Mosteiro-Romero et al., 2020 [28]Central Zurich, SwitzerlandDistrict levelWind speed, air temperature and relative humidity measurements from weather station
14Poh et al., 2020 [76]SingaporeReduced-scale treeWTE with PIV
15Ricci et al., 2020 [41]Quartiere La Venezia, Livorno, ItalyDistrict of Livorno, ItalyClosed-loop subsonic WTE
16Song et al., 2018 [19]Clarence Centre in Borough of Southwark, LondonThree-storey test buildingWTE
17Tong et al., 2017 [9]Miami, Houston, Los Angeles, New York City, Chicago, Minneapolis (USA)High-rise buildings in 6 climate zone in USHourly air velocity surface data measurement
18Tong et al., 2018 [77]Tianjin, ChinaSino-Singapore Tianjin Eco-city (SSTEC) in Tianjin, ChinaWind speed, air temperature and relative humidity measurements
19Wang et al., 2020 [78]Gangnam-gu, Yangcheon-gu in Seoul; Pyeongtaek City in Gyeonggi-do, Republic of KoreaThree target areas with high-rise buildingsWind speeds measurement
20Wong et al., 2021 [79]Kent Ridge campus, National University of Singapore (NUS), Singapore-Wind speed, dry-bulb temperature, relative humidity, solar radiation and rainfall measurements
21Yahia et al., 2018 [80]Dar es Salaam, TanzaniaSingle- or two-story housesOn-site long-term measurements of wind speed, air temperature and relative humidity
Table 6. Overview of studies of real urban areas with validation comparison with experimental or numerical data: adopted simulation codes, turbulence models and parameters.
No.AuthorSimulation Codes/Instruments UsedTurbulence ModelsParameters
1Balczó and Tomor, 2016 [11]MISKAM flow and dispersion microscale modelModified k ϵ -
2Biao Wang, 2016 [70]Ansys 12.0--
3Chatzidimitriou and Yannas, 2017 [31]ENVI-met v4--
4Chen et al., 2020 [71]CitySimSKERi
5Gao and Lee, 2012 [8]AIRPAK (Ansys, 2008)RNGMAA, BVC, KCA
6Hii et al., 2014 [25]Ansys Fluent 14RKE-
7Izadyar et al., 2020 [43]Ansys Fluent V19.0RNGIAV, IAD
8Javanroodi et al., 2018 [72]Autodesk CFD, Ansys Fluent, Energy PlusSKEUD, UBF, UP
9Kangkang et al., 2020 [73]Help of GIS-SVF, SR, UHI
10King et al., 2017 [6]OpenFoam, Ansys FluentOpenFoam: SAS; Fluent: SAS, SST-
11Masoumi et al., 2017 [74]Ansys 14.5 CFX k ϵ -
12Mora-Pérez et al., 2016 [75]STAR-CCM+SKE-
13Mosteiro-Romero et al., 2020 [28]ENVI-Met 4.4, CEALES-
14Poh et al., 2020 [76]OpenFOAM 2.4 k ϵ and LES with porous mediaTA, LAD
15Ricci et al., 2020 [41]OpenFOAM 2.3.0SKE, RKE, RNG, SKO, SSTFB, R
16Song et al., 2018 [19]FLUIDITYLES-
17Tong et al., 2017 [9]MATLAB--
18Tong et al., 2018 [77]3D GIS model-GnPR, SVF, PAVE, BDG
19Wang et al., 2020 [78]LDAPS-CFD toolRNG-
20Wong et al., 2021 [79]WRF, OpenFOAM, EnergyPlus--
21Yahia et al., 2018 [80]Envi-Met-MRT, PET, SP, H
Table 7. Overview of studies of real urban areas with validation comparison with experimental or numerical data: listed keywords.
No.AuthorKeywords
1Balczó and Tomor, 2016 [11]urban square, flow field, velocity fluctuation, urban vegetation, wind tunnel
2Biao Wang, 2016 [70]urban wind energy, wind environment, urban form, urban block, CFD simulation
3Chatzidimitriou and Yannas, 2017 [31]canyon aspect ratio; canyon axis orientation; monitoring; outdoor thermal comfort; PET; simulations; street canyon geometry; urban design; urban microclimate
4Chen et al., 2020 [71]atmospheric stability; CFD; CitySim; solar-induced thermal boundary conditions; urban airflow
5Gao and Lee, 2012 [8]natural ventilation; openings configurations; prevailing wind; residential buildings; surrounding buildings; window types
6Hii et al., 2014 [25]anthropogenic heat; CFD; high density; high rise; pedestrian height; site measurement; tropical
7Izadyar et al., 2020 [43]balcony; CFD; geometry; indoor air distribution (IAD); natural ventilation; residential
8Javanroodi et al., 2018 [72]cooling load; high-rise buildings; hot-arid climate; urban energy; urban morphology; ventilation
9Kangkang et al., 2020 [73]ventilation corridors; heat island intensity; urban climatology; ventilation potential; wind environment
10King et al., 2017 [6]benchmark; CFD; external airflow; indoor air quality; OpenFoam; Silsoe; ventilation
11Masoumi et al., 2017 [74]compact urban form; hot-humid climate; natural ventilation; passive cooling; urban sustainability; vernacular architecture
12Mora-Pérez et al., 2016 [75]computational fluid dynamics; energy efficient buildings; low carbon technologies; natural ventilation; wind energy
13Mosteiro-Romero et al., 2020 [28]City Energy Analyst (CEA); ENVI-met; building energy demand; district scale; model coupling; urban microclimate
14Poh et al., 2020 [76]ecology; centre for urban greenery; department of mechanical engineering; national parks board; National University of Singapore; Singapore botanic gardens
15Ricci et al., 2020 [41]3D steady RANS; roughness height; turbulence models; urban canopy layer; urban wind flow
16Song et al., 2018 [19]air pollutants; air quality; buildings; dispersion; microclimates; modelling; natural ventilation; urban design
17Tong et al., 2017 [9]natural ventilation; high-rise building; mixed-mode ventilation; meteorology; atmospheric boundary layer (ABL); NV hour
18Tong et al., 2018 [77]air temperature evaluation; geographical information system; multiple linear regression; northern China; urban morphology parameters
19Wang et al., 2020 [78]CFD model; local data assimilation and prediction system; morphological parameter; wind speed estimation; wind speed reduction rates
20Wong et al., 2021 [79]multi-scale; multi-physics; urban microclimate; virtual buildings and modelling; field measurement
21Yahia et al., 2018 [80]-
Table 8. Overview of studies of real urban areas with validation comparison with experimental or numerical data: name and type of studied location and type of experiments.
No.AuthorStudy Location into ConsiderationBuilding/City TypeExperiment
1Belleri et al., 2013 [81]Bolzano (Italy), Palermo (Italy), San Francisco (USA)Four-story office building north–south oriented-
2Du and Mak, 2020 [82]Hong Kong Polytechnic University, Hong Kong (China)-WTE
3Du et al., 2017 [83]Hong Kong Polytechnic University, Hong Kong (China)University campusClosed-circuit subsonic BL WTE
4He et al., 2019 [26]Greater Sydney, AustraliaUrban city-
5Ignatius et al., 2015 [84]Singapore9-hectare office precinct-
6Javanroodi and Nik, 2019 [85]Tehran, IranTwelve-story office building-
7Javanroodi and Nik, 2020 [27]Stockholm, SwedenComplex geometric urban forms (mesoscale to microscale)-
8Jiang et al., 2020 [30]Wuhan, ChinaSix typical parallel type residential building layouts-
8Kouhirostami et al., 2018 [86]Lubbock, USAClassroom-
10Lee, 2017 [7]Copenhagen, DenmarkActual city model of Copenhagen-
11Li et al., 2019 [42]Nanjing, ChinaTypical urban areaBack-flow, ABL WTE
12Lo and Ngan, 2017 [38]Hong Kong, ChinaIdealized and realistic urban domain-
13Luo et al., 2020 [87]Los Angeles, CaliforniaCity-
14Nugrahanti et al., 2018 [88]Cilincing, IndonesiaWalk-up apartment (vertical housing)-
15Pawar et al., 2020 [89]SingaporeHigh-rise commercial buildings set-
16Qi et al., 2012 [90]Hong Kong, ChinaTypical local hotel buildingHourly meteorological data measurement
17Shi et al., 2020 [91]SingaporeBuilt urban form-
18Yang et al., 2004 [92]Beijing, Shanghai, Guangzhou, Urumqi (China)Low-rise residential buildings-
Table 9. Overview of studies of real urban areas with validation comparison with experimental or numerical data: adopted simulation codes, turbulence models and parameters.
No.AuthorSimulation Codes/Instruments UsedTurbulence ModelsParameters
1Belleri et al., 2013 [81]EnergyPlus-IG, SG, EC, WG, WOT
2Du and Mak, 2020 [82]--MVR, OMVR
3Du et al., 2017 [83]--OMVR
4He et al., 2019 [26]---
5Ignatius et al., 2015 [84]--FAR, GSC, OSR, ST
6Javanroodi and Nik, 2019 [85]Autodesk CFDSKEUD, VAR, SC, PAR
7Javanroodi and Nik, 2020 [27]Autodesk CFD, Ansys FluentSKE with radiationMF
8Jiang et al., 2020 [30]Envi-Met-UTCI
9Kouhirostami et al., 2018 [86]Autodesk CFD--
10Lee, 2017 [7]Ansys Fluent 18.0RKE-
11Li et al., 2019 [42]--Openness, area, shape
12Lo and Ngan, 2017 [38]PALMLESRT, ET
13Luo et al., 2020 [87]WRF-UCM 4.1.2, EnergyPlus 9.1.0--
14Nugrahanti et al., 2018 [88]Ansys Fluent--
15Pawar et al., 2020 [89]STL, Cham-Phoenics k ϵ -
16Qi et al., 2012 [90]---
17Shi et al., 2020 [91]City Energy Analyst--
18Yang et al., 2004 [92]--PDPH
Table 10. Overview of studies of real urban areas with validation comparison with experimental or numerical data: listed keywords.
No.AuthorKeywords
1Belleri et al., 2013 [81]-
2Du and Mak, 2020 [82]evaluation criterion; general design framework; pedestrian level wind environment; improvement measures, high-density cities
3Du et al., 2017 [83]exceedance probability; pedestrian level wind comfort; threshold mean wind velocity; wind comfort criteria
4He et al., 2019 [26]microclimate; performance-based planning; precinct ventilation zone; urban morphology; urban ventilation
5Ignatius et al., 2015 [84]district energy performance; district heat gain; outdoor temperature; outdoor thermal comfort; thermal load units; urban heat island; urban ventilation
6Javanroodi and Nik, 2019 [85]-
7Javanroodi and Nik, 2020 [27]air temperature; extreme weather conditions; metrological mesoscale model; numerical simulations; urban microscale model; wind speed
8Jiang et al., 2020 [30]ENVI-met; microclimate; residential building layout; universal thermal climate index
9Kouhirostami et al., 2018 [86]windows, CFD, natural ventilation, classroom, cross ventilation, air flow rate, air velocity magnitude, Louver, wind direction, building orientation
10Lee, 2017 [7]building layers; CFD simulations; outdoor airflow; pedestrian level wind; urban wind simulations
11Li et al., 2019 [42]correlation research; pedestrian level wind; urban space; wind tunnel experiment
12Lo and Ngan, 2017 [38]air pollution; Lagrangian circulation/transport; large eddy simulations; Urban meteorology
13Luo et al., 2020 [87]anthropogenic heat; building heat emissions; heat wave; urban building energy model; urban microclimate; WRF-UCM
14Nugrahanti et al., 2018 [88]wind-driven natural ventilation; green design; passive thermal comfort; walk-up apartment
15Pawar et al., 2020 [89]-
16Qi et al., 2012 [90]climate warming; latent load; sensible load; urban heat island effect; ventilation load
17Shi et al., 2020 [91]solar energy penetration; capital costs; urban form; block typology; energy-driven urban design
18Yang et al., 2004 [92]natural ventilation; natural ventilation potential; prediction method; pressure difference Pascal hours
Disclaimer/Publisher’s Note: The statements, opinions and data contained in all publications are solely those of the individual author(s) and contributor(s) and not of MDPI and/or the editor(s). MDPI and/or the editor(s) disclaim responsibility for any injury to people or property resulting from any ideas, methods, instructions or products referred to in the content.

