Article

Numerical Investigation on the Performance of IT-SOEC with Double-Layer Composite Electrode

1
College of Energy and Mechanical Engineering, Shanghai University of Electric Power, Shanghai 200090, China
2
Shanghai Non-Carbon Energy Conversion and Utilization Institute, Shanghai 200240, China
3
School of Mechanical Engineering & Hydrogen Energy Research Centre, Beijing Institute of Petrochemical Technology, Beijing 102617, China
*
Author to whom correspondence should be addressed.
Energies 2023, 16(6), 2525; https://doi.org/10.3390/en16062525
Submission received: 12 February 2023 / Revised: 28 February 2023 / Accepted: 2 March 2023 / Published: 7 March 2023

Abstract

:
The double-layer composite electrode has attracted increasing attention in the field of intermediate-temperature solid oxide electrolysis cells (IT-SOEC). To investigate the effects of the cathode diffusion layer (CDL) and cathode functional layer (CFL) structure on performance, a three-dimensional multi-scale IT-SOEC unit model is developed. The model comprehensively considers the detailed mass transfer, electrochemical reaction and heat transfer processes. Meanwhile, percolation theory is adopted to preserve the structural characteristics and material properties of the composite electrode. The mesostructure model and the macroscopic model are coupled in the solution. The effects of the porosity of the CDL, the electrode particle size and the composition of the composite electrode in the CFL on the mass transport process and electrolysis performance of the IT-SOEC unit are analyzed. The results show that the appropriate mass flux and energy consumption in the electrode are obtained with a CDL porosity in the range of 0.3–0.5. The decrease in the electrode particle size is conducive to the improvement of the electrolysis reaction rate. The maximum reaction rate in the CFL increases by 32.64% when the radius of the electrode particle is reduced from 0.5 μm to 0.3 μm. The excellent performance can be obtained when the volume fractions of the electrode phase and electrolyte phase in the CFL tend to be uniform. This study will provide guidance for the performance optimization of IT-SOEC and further promote the development of IT-SOEC hydrogen production technology in engineering applications.

1. Introduction

Hydrogen is an energy source with high calorific value, is non-polluting, storable, and offers various forms of utilization [1,2]. Hydrogen production from water electrolysis is one of the essential technologies for hydrogen energy production [3]. There are three main technical routes for hydrogen production by electrolysis of H2O: alkaline electrolysis cell (AEC), proton exchange membrane electrolysis cell (PEMEC), and solid oxide electrolysis cell (SOEC) [4,5]. Compared with the other two hydrogen production methods, SOEC has more advantages in thermodynamics, reaction kinetics, and energy conversion efficiency [6]. SOEC is regarded as one of the most important electrolysis technologies for achieving low-carbon energy development and power-to-X systems due to its high energy conversion efficiency [7].
Most of the early SOEC operating temperatures were around 1273 K. However, due to the limitations of material properties and manufacturing technology, the higher working temperature makes the life of SOEC shorter [8]. Therefore, scholars have focused on intermediate-temperature solid oxide electrolysis cells (IT-SOEC) with operating temperatures between 723 K and 1073 K [9,10,11]. Since the reduction in operating temperature had some negative effects on cell performance, many researchers have concentrated on the development of electrode materials for IT-SOEC and electrode structures [12,13,14,15]. However, the guiding theory related to the optimization of IT-SOEC electrode structure needs further development [8,16].
In addition, in the research on electrodes for solid oxide cells (SOCs), the utilization of composite electrodes is an important means to optimize the performance of cells [16,17]. The composite electrode is a multi-phase object composed of electrolyte materials with high oxygen ion conductivity and electrode materials. Compared with traditional single-phase electrode materials, composite electrode materials can effectively increase the active sites of electrochemical reaction and extend the electrochemical reaction to the entire electrode domain [18,19,20].
The composite electrode is the main place where complex coupling processes occur in the electrolysis cell. Some experiments and simulations have shown that the internal mesostructure of the composite electrode inevitably affects the complex multi-physical process and electrode performance [21,22,23,24,25,26]. Compared with microscopic simulation using density function theory (DFT) and other methods, the development of a mesoscopic mathematical model can better analyze the microporous structure of the electrode, as well as the internal mass transport phenomenon and chemical reaction [27]. In previous studies, scholars have carried out relevant mesoscopic-scale simulation work to explore the effect of the internal mesostructure of the composite electrode on the performance of the electrode [28,29,30]. These numerical methods can accurately analyze the electrode structure and performance characteristics. However, for the optimization and mechanism analysis of the overall performance of the electrolysis cell, these methods are limited by the high computation cost and complexity.
There is a growing number of effective and comprehensive mathematical models to explore the impact of microstructures [8,20]. Percolation theory is valid as one of the analytical models and is widely used in the study of mesostructured electrodes [26,31]. Many scholars have used the mathematical model based on the percolation theory to explore the influence of the mesostructure of the composite electrode [21,32,33,34,35,36,37,38]. Li et al. [36] proposed a SOC model incorporating percolation theory. They investigated the effects of the microstructure, thickness, and temperature of electrodes on the performance of SOECs and SOFCs. Ni et al. [39] established a mathematical model coupled with percolation theory to simulate the electrochemical reaction in SOECs. In their study, the optimal volumetric fractions of electronic particles that minimize the total overpotential of the electrode and the concept of “functionally graded materials” to reduce the SOEC potential were introduced. These investigations on the structural influences of composite electrodes mostly compared variations in overall electrochemical performance.
In the numerical studies of SOECs, few studies have focused on the influence of the cathode diffusion layer (CDL)/cathode functional layer (CFL) structure on its internal mass transport process and the performance of the SOEC unit [39,40]. In one SOEC unit, the CDL does not only play a supporting role; it also has an important impact on the mass transport process of each gas component. Meanwhile, it is also very important to explore the influence of the internal structure of the CFL as the area with the most intense electrochemical reaction. However, few studies have analyzed the influence of the internal mesostructure of the CFL on the composite electrode, such as the effect of the internal composition of the CFL, particle size, etc., on the multi-physical processes inside the electrode. In addition, the development of IT-SOECs needs more findings to guide the optimization of the composite electrode structure. Therefore, it is necessary to study the influence of the structural changes in different areas of the electrolysis cell on the performance of the IT-SOEC unit and further optimize the composite electrode structure.
In this study, to investigate the performance of the IT-SOEC with various structural properties of a double-layer composite electrode, a three-dimensional multi-scale mathematical model of the IT-SOEC unit is developed. Meanwhile, by coupling the mesoscopic model based on percolation theory, the internal structure characteristics of the composite electrode on the mesoscopic scale are effectively preserved. The geometric model, model assumptions, and the three-dimensional multi-scale mathematical model of the multi-physical processes in the IT-SOEC unit are introduced in Section 2. These are used to analyze the influence of the internal structure parameters of the double-layer composite electrode on the internal mass transport process and on the electrolysis performance of the electrode. In Section 3, the mathematical model is validated according to the experimental data. The simulation results obtained by the multi-scale model at different temperatures and inlet conditions are in good agreement with the experimental data. Based on the multi-scale model, the effects of different CDL porosity and different CFL internal composition and particle size on the internal diffusion flux, overpotential, heat source, and electrochemical reaction rate of the electrolysis cell are investigated. This study will provide guidance for the performance optimization, design, and manufacture of the IT-SOEC unit and promote the development of IT-SOECs in the hydrogen production industry.

2. Model Development

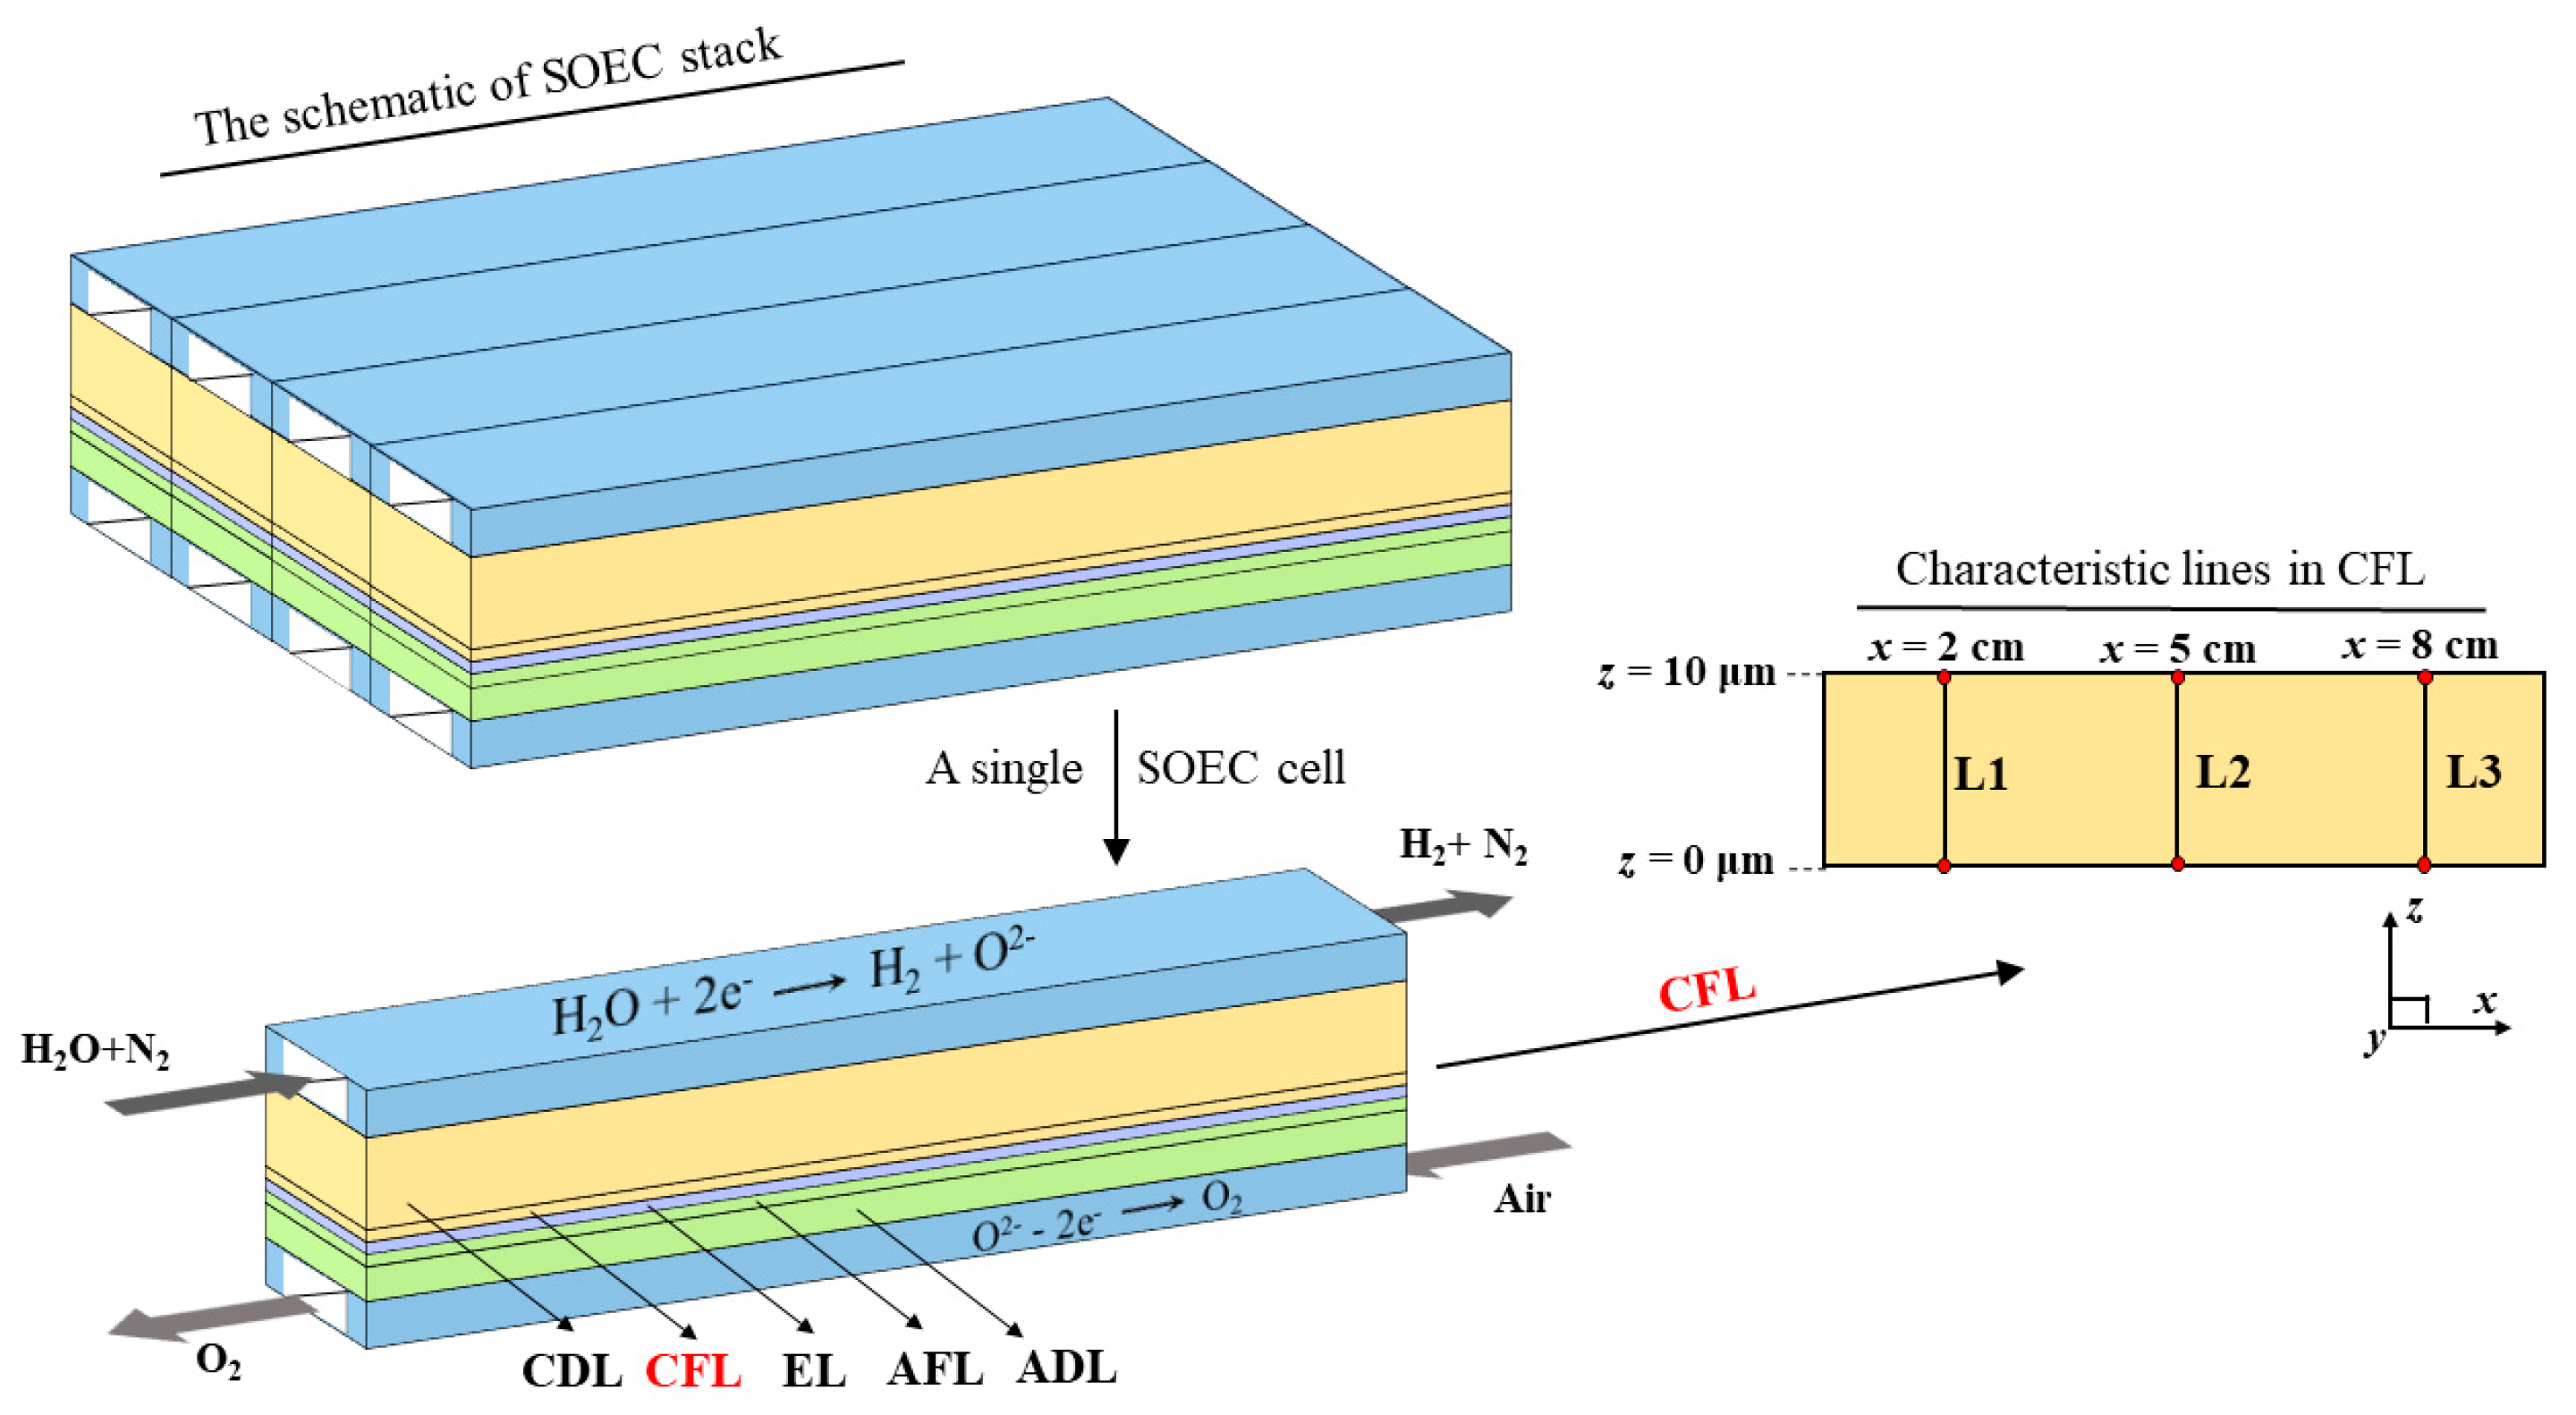
2.1. Geometric Model

The established geometric model of a complete IT-SOEC unit mainly includes the cathode channel, composite cathode, electrolyte layer, composite anode, and anode channel. The composite cathode and composite anode are composed of a functional layer and a gas diffusion layer. La0.8Sr0.2MnO3-Sc2O3-stabilized ZrO2 (LSM-SCSZ) and Ni-SCSZ constitute the anode functional layer (AFL) and the CFL, respectively. The electrolyte layer is composed of SCSZ. Meanwhile, the cathode and anode flow channels in the model are arranged in countercurrent mode. To quantitatively analyze the results of different positions in the composite cathode, three characteristic lines (L1, L2, and L3) are set on the cross section of the CFL at y = 0.5 mm. L1, L2, and L3 are respectively located at the inlet section (x = 2 cm), the middle section (x = 5 cm), and the outlet section (x = 8 cm). Figure 1 shows the working process, geometric model, and characteristic line of the IT-SOEC unit. The x, y, and z axes represent the lengthwise direction of the channel, the thickness direction of the unit (i.e., the wall-normal direction from channel to cathode), and the spanwise direction of the unit, respectively. The specific geometric parameters and basic working parameters are listed in Table 1.

2.2. Assumptions and Governing Equations

The multi-scale model established in this study completely describes the electrochemical reaction process, ion/electron transfer process, multi-component gas transport process, flow process, and heat transfer processes in the IT-SOEC unit.
During the modeling process, the following assumptions are considered [38,41]:
  • Steady state.
  • The gases are assumed to be ideal gas.
  • IT-SOEC operates at the adiabatic state.
  • Electrochemical reactions take place in the anode and cathode function layers.
  • The radiation heat exchange inside the cell is ignored.
  • The effect of gravity is ignored.

2.2.1. Electrochemical Reactions Model

The charge conservation equations can be adopted to describe the ionic\electronic charge transfer process in the composite electrode and electrolyte [42,43]. The corresponding governing equations are described in detail in our previous work [16]. Because there are electrochemical reactions in the functional layer of the composite electrode, the corresponding net charge source terms are introduced. These source terms can be expressed as [21,31]:
Q elec , ca = Q ion , ca = i 0 , ca A TPB , ca eff ( exp ( α ca n F η act , ca R T ) exp ( ( 1 α ca ) n F η act , ca R T ) )
Q elec , an = Q ion , an = i 0 , an A TPB , an eff ( exp ( α an n F η act , an R T ) exp ( ( 1 α an ) n F η act , an R T ) )
where Qion and Qelec represent the net ionic and electronic charge source terms. α is the transfer coefficient, and n is the number of reaction electrons. F and R are the Faraday constant and the universal gas constant, respectively. T is the operating temperature. ηact represents the activation overpotential. A TPB eff is the effective three-phase interface area of reaction per unit volume. i0 represents the exchange current density, and it can be expressed as [31]:
i 0 , ca = γ ca ( P H 2 O TPB , ca P H 2 O ref , ca ) m ( P H 2 TPB , ca P H 2 ref , ca ) j exp ( E act , ca R T )
i 0 , an = γ ca ( P O 2 TPB , an P O 2 ref , ca ) k exp ( E act , an R T )
where P H 2 TPB , ca , P H 2 O TPB , ca , and P O 2 TPB , an are the partial pressures of each gas component on the three-phase interface. P H 2 ref , ca , P H 2 O ref , ca , and P O 2 ref , ca are the partial pressures of each gas component under the reference state. Eact is the reaction activation energy of the corresponding electrode. γ is the corresponding pre-exponential factor. k, m, and j are the adjustable parameters that relate to the reaction kinetics.

2.2.2. Energy Conservation Model

In different areas of the IT-SOEC unit, the heat transfer mode is different. In the channel, the main heat transfer mode is heat convection. In the electrode and electrolyte domain, the main heat transfer modes are heat conduction and heat radiation, accompanied by the generation of ohmic heat sources, reversible heat sources, and irreversible heat sources. To simplify the problem, the influence of thermal radiation is ignored [44]. The specific equations are as follows:
( λ eff T ) = Q heat   ,   c o m p o s i t e   e l e c t r o d e
( λ T + ρ C p T u ) = 0   ,   c h a n n e l
where λ is the thermal conductivity. λeff is the effective thermal conductivity. Cp is the specific heat capacity. Qheat is the heat source, and it can be calculated by the following equations [44]:
Q heat = { Q ohm + Q rev + Q irr   ,   c o m p o s i t e   e l e c t r o d e Q ohm   ,   e l e c t r o l y t e
Q ohm = { i 2 ion δ ion eff + i 2 elec δ elec eff ,   c o m p o s i t e   e l e c t r o d e i 2 ion δ ion eff   ,   e l e c t r o l y t e
Q rev = { Q ion , ca A TPB , ca eff T ( S H 2 O + 2 S e S H 2 S O 2 - ) 2 F   ,   C F L Q ion , an A TPB , an eff T ( S O 2 - 1 2 S O 2 2 S e ) 2 F   ,   A F L
Q irr = { | Q ion , ca η ca | , C F L | Q ion , an η an | , A F L
where S is the molar entropy of each component, Qohm is the ohmic heat source, Qrev is the reversible heat source, Qirr is the irreversible heat source.

2.2.3. Momentum, Mass and Component Conservation Model

The Navier–Stokes equation, Brinkman equation and component conservation equation are adopted to describe the momentum, mass, and component conservation inside the flow channel and composite electrodes. The corresponding governing equations are described in detail in our previous work [16].

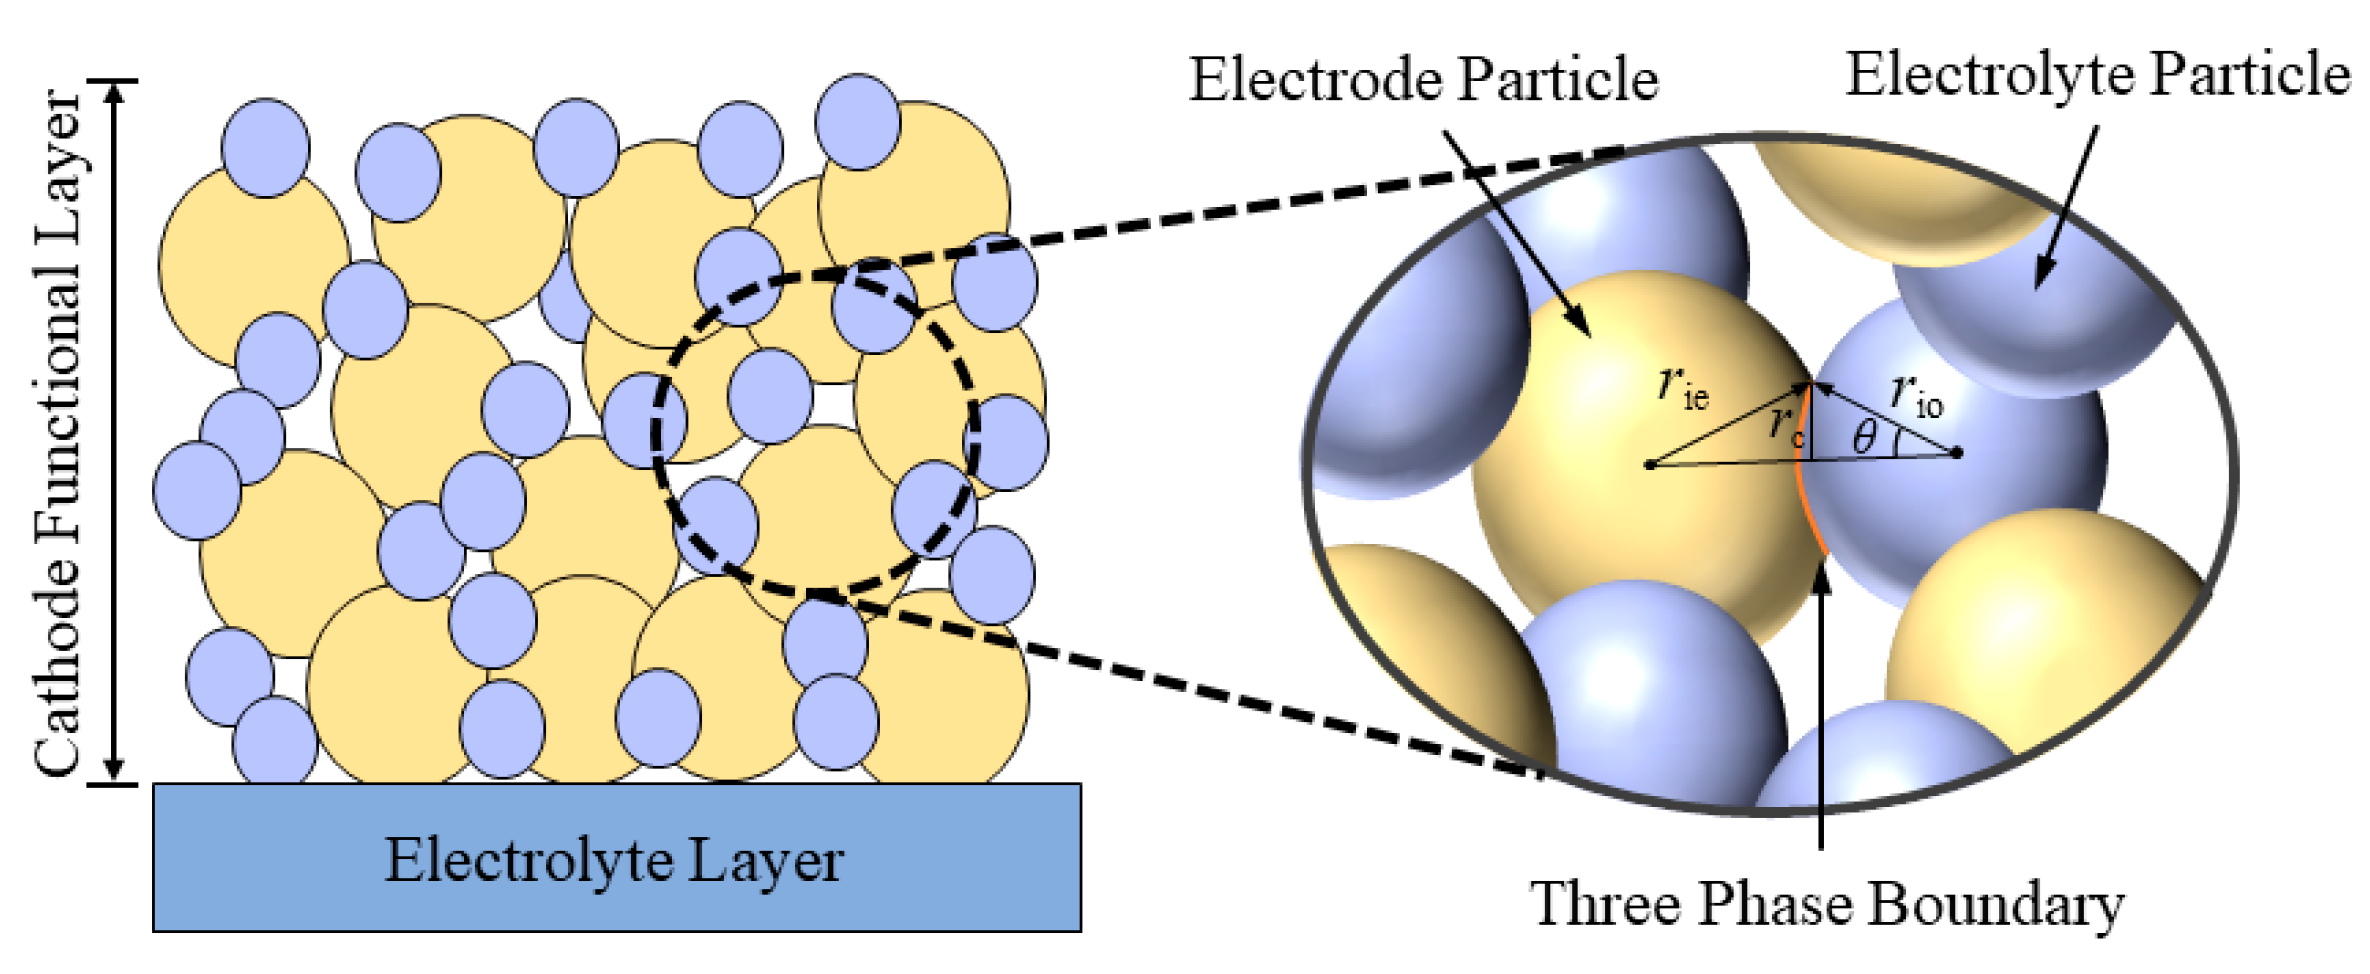
2.3. Mesostructure Model of Composite Electrode

The material properties, such as electronic conductivity, ionic conductivity, and three-phase interface length, are important factors affecting the performance of composite electrodes. The percolation theory based on random accumulation is used as an analysis and prediction model. By analyzing the structural parameters, including the particle radius, contact angle, volume fraction of electrode phase (ie) and electrolyte phase (io), coordination number of particles, and the percolation threshold, the internal structure characteristics of the composite electrode can be effectively retained on the mesoscopic scale, and then the qualitative and quantitative prediction of the composite electrode material properties can be realized. The schematic diagram of the mesostructure of the composite electrode is shown in Figure 2.
The composite electrode is usually made of conductive particles and ionic particles sintered at high temperature. The volume fraction of each phase in the composite electrode meets the following equation [20,34]:
ψ ie + ψ io + ψ p = 1
where ψie and ψio are the corresponding volume fractions of the electrode phase and electrolyte phase inside the composite electrode, respectively. ψp is the volume fraction of the gas-phase working medium. It is also the volume fraction of the working medium.
The effective percolation TPB area per unit volume is expressed as the following equation to effectively and accurately reflect the TPB area in the composite electrode.
A TPB eff = π r c 2 n ie V Z ie , io P ie P io
where rc is the neck radius, rc = min (rie, rio)sinθ. rie and rio is the electrode particle and electrolyte particle radius, respectively. θ is the contact angle between different particles (also shown in Figure 2). nieV is the number of electrode particles per unit volume within the entire composite electrode domain. Zie,io is the average number of electrode particles in contact with electrolyte particles. Pie and Pio represent the probability of electrode and electrolyte particles belonging to percolated clusters, respectively. The value of these structural variables can be calculated by following equations [15,33]:
n ie V = ( 1 ψ p ) ψ ie 4 π r ie 3 / 3
Z ie , io = 0.5 ( 1 + r ie 2 / r io 2 ) Z ¯ ( ψ ie / r ie ψ ie / r ie + ψ io / r io )
P ie = ( 1 ( 3.764 Z ie , ie 2 ) 2.5 ) 0.4
P io = ( 1 ( 3.764 Z io , io 2 ) 2.5 ) 0.4
where Z ¯ is the overall average coordination number of all solid particles. Here it is set to six for a random packing of spheres [15,25]. The coordination number among the same kind of particles Zie,ie and Zio,io can be estimated as the following:
Z ie , ie = Z ¯ ( ψ ie / r ie ψ ie / r ie + ψ io / r io )
Z io , io = Z ¯ ( ψ io / r io ψ ie / r ie + ψ io / r io )
The average pore radius (hydraulic pore radius) in composite electrodes is described as follows [33]:
r ¯ p = 2 3 1 1 ψ p 1 ψ ie / r ie + ψ io / r io
By combing with the Bruggeman model, the effective ionic conductivity δ elec eff and effective electronic conductivity δ ion eff can be expressed as [45,46]:
δ elec eff = δ ie ( ( 1 ψ p ) P ie ψ ie ( ψ ie + ψ io ) ) 0.5
δ ion eff = δ io ( ( 1 ψ p ) P io ψ io ( ψ ie + ψ io ) ) 0.5
where δ ie and δ io are the electrode conductivity and electrolyte conductivity, respectively.

2.4. Boundary Conditions and Model Parameters

The boundary conditions are consistent with our previous work [16]. In addition, the fuel and air inlet flowrates for the cathode and anode are set as 150 mL/min and 300 mL/min, respectively. These conditions are consistent with the specified experiment. The cathode inlet fuel is composed of 40% H2O, 50% N2, and 10% H2, and the anode inlet air is composed of 79% N2 and 21% O2.
The characteristic parameters of gas-phase and solid-phase material required for model establishment are consistent with the previous work [16,36,44], and the additional supplementary parameters are listed in Table 2. The thermophysical parameters of the gas-phase working medium, such as thermal conductivity, specific heat capacity, density, and viscosity, are calculated by using the equations proposed by Todd et al. [47]. The structural parameters of the composite electrode used for the mesoscopic model refer to the study of Li et al. [36]. The contact angle between the electronic and ionic particles is set to 15° and the average pore diameter of the electrode is set to 0.322 μm. The structural parameters involved in the analysis are listed in Table 3. In addition, in the validation of the multi-scale model, the geometric parameters and corresponding operating parameters of the electrolysis cell are consistent with the experimental conditions described in the literature [22,48], and the relevant parameters are listed in Table 4.

2.5. Model Solution

The commercial software COMSOL Multiphysics 5.6 is adopted to solve the three-dimensional macroscopic model introduced in Section 2.2 through the finite element method. The mesostructure model of the composite electrode introduced in Section 2.3 is coupled to the macroscopic model through the user defined functions. These functions describe the updated structural parameters and material properties and participate in the solution of the macroscopic model.

3. Results and Discussion

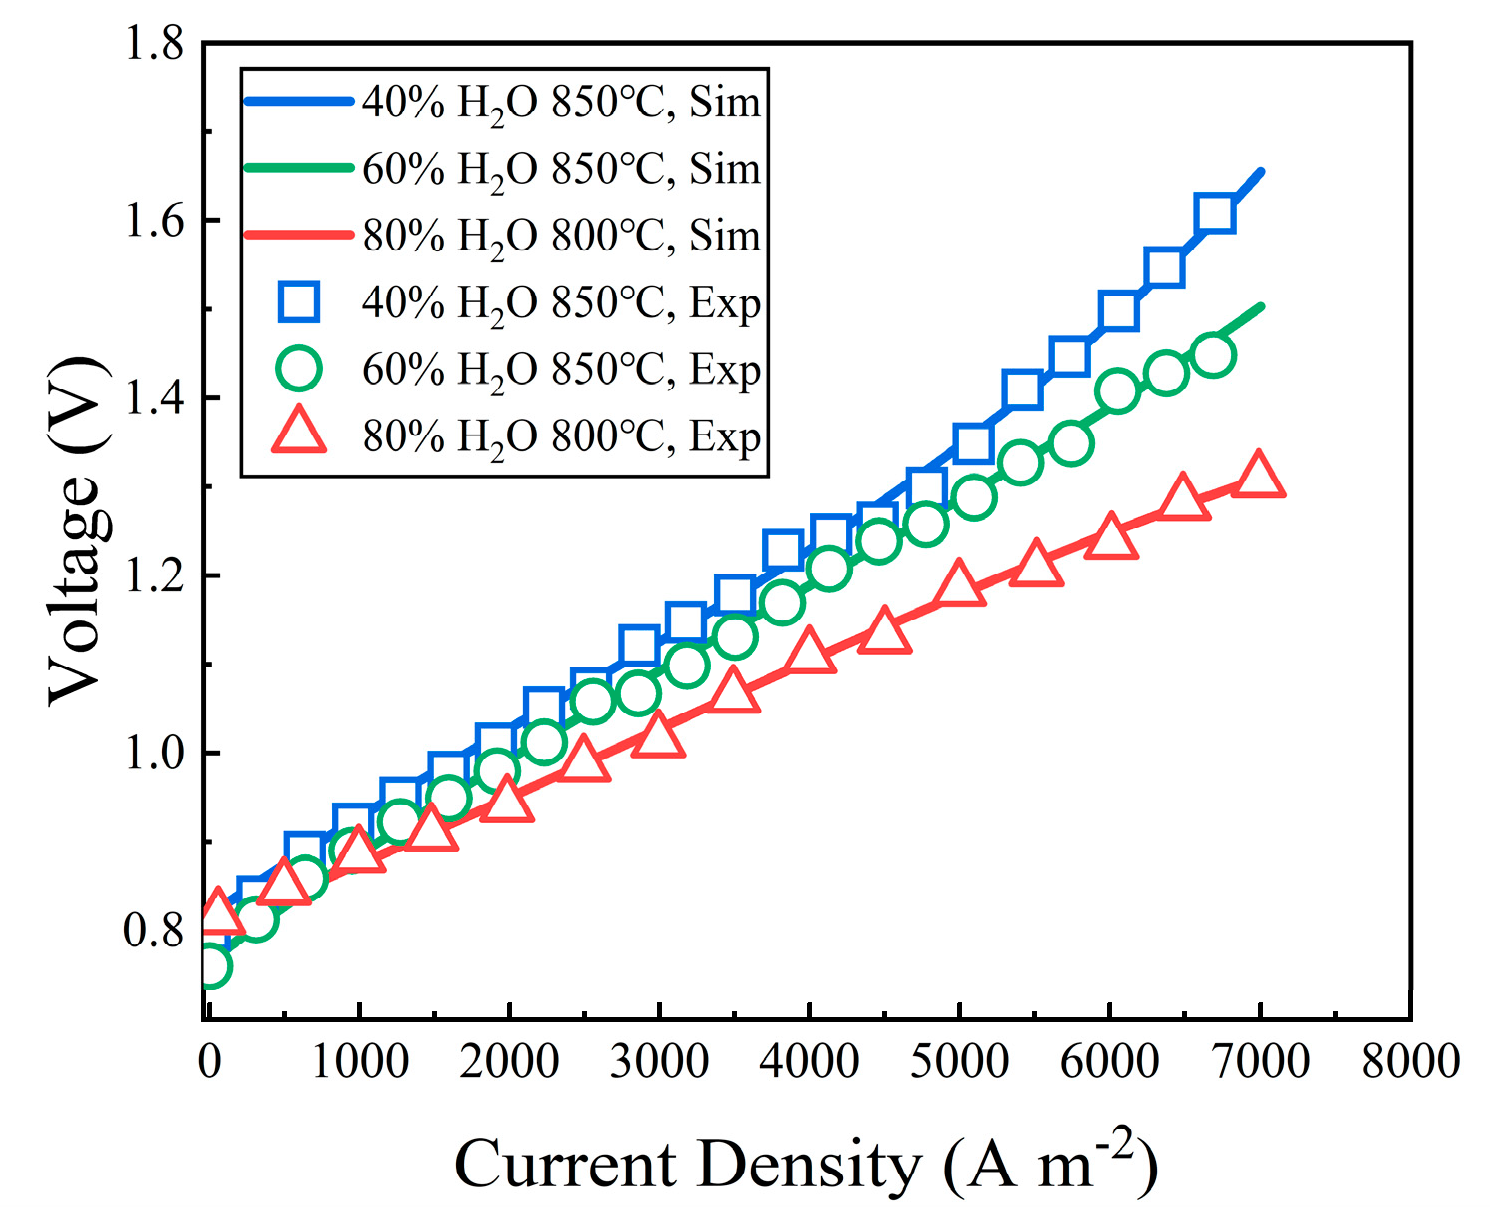
3.1. Model Validation

The accuracy of the model is verified by comparing the simulation results with the existing experimental results of water electrolysis in an IT-SOEC. The model parameters are consistent with the experimental parameters involved in the literature [22,48], including the geometric parameters and corresponding operating parameters of the electrolysis cell. Figure 3 shows the I–V curves predicted by numerical simulation under the operation at 850 °C with 40% and 60% H2O input [48] and at 800 °C with 80% H2O input [22] with the measured results. Under different working conditions, the maximum relative errors between the calculated value and the experimental value are 1.54%, 1.12%, and 1.11%, respectively. It reflects that the simulation results are in good agreement with the experimental results. Thus, the accuracy of the multi-scale model is verified.

3.2. Effects of CDL Porosity

As an important structural parameter of CDL, porosity has a significant influence on the mass transport process and the subsequent multi-physical processes in the whole electrolysis cell. This section analyzes the influence of the change in the porosity of the CDL on the internal mass transport process, the electrolysis performance of the electrochemical reaction in the CFL, and the overall energy consumption of the electrolysis cell.

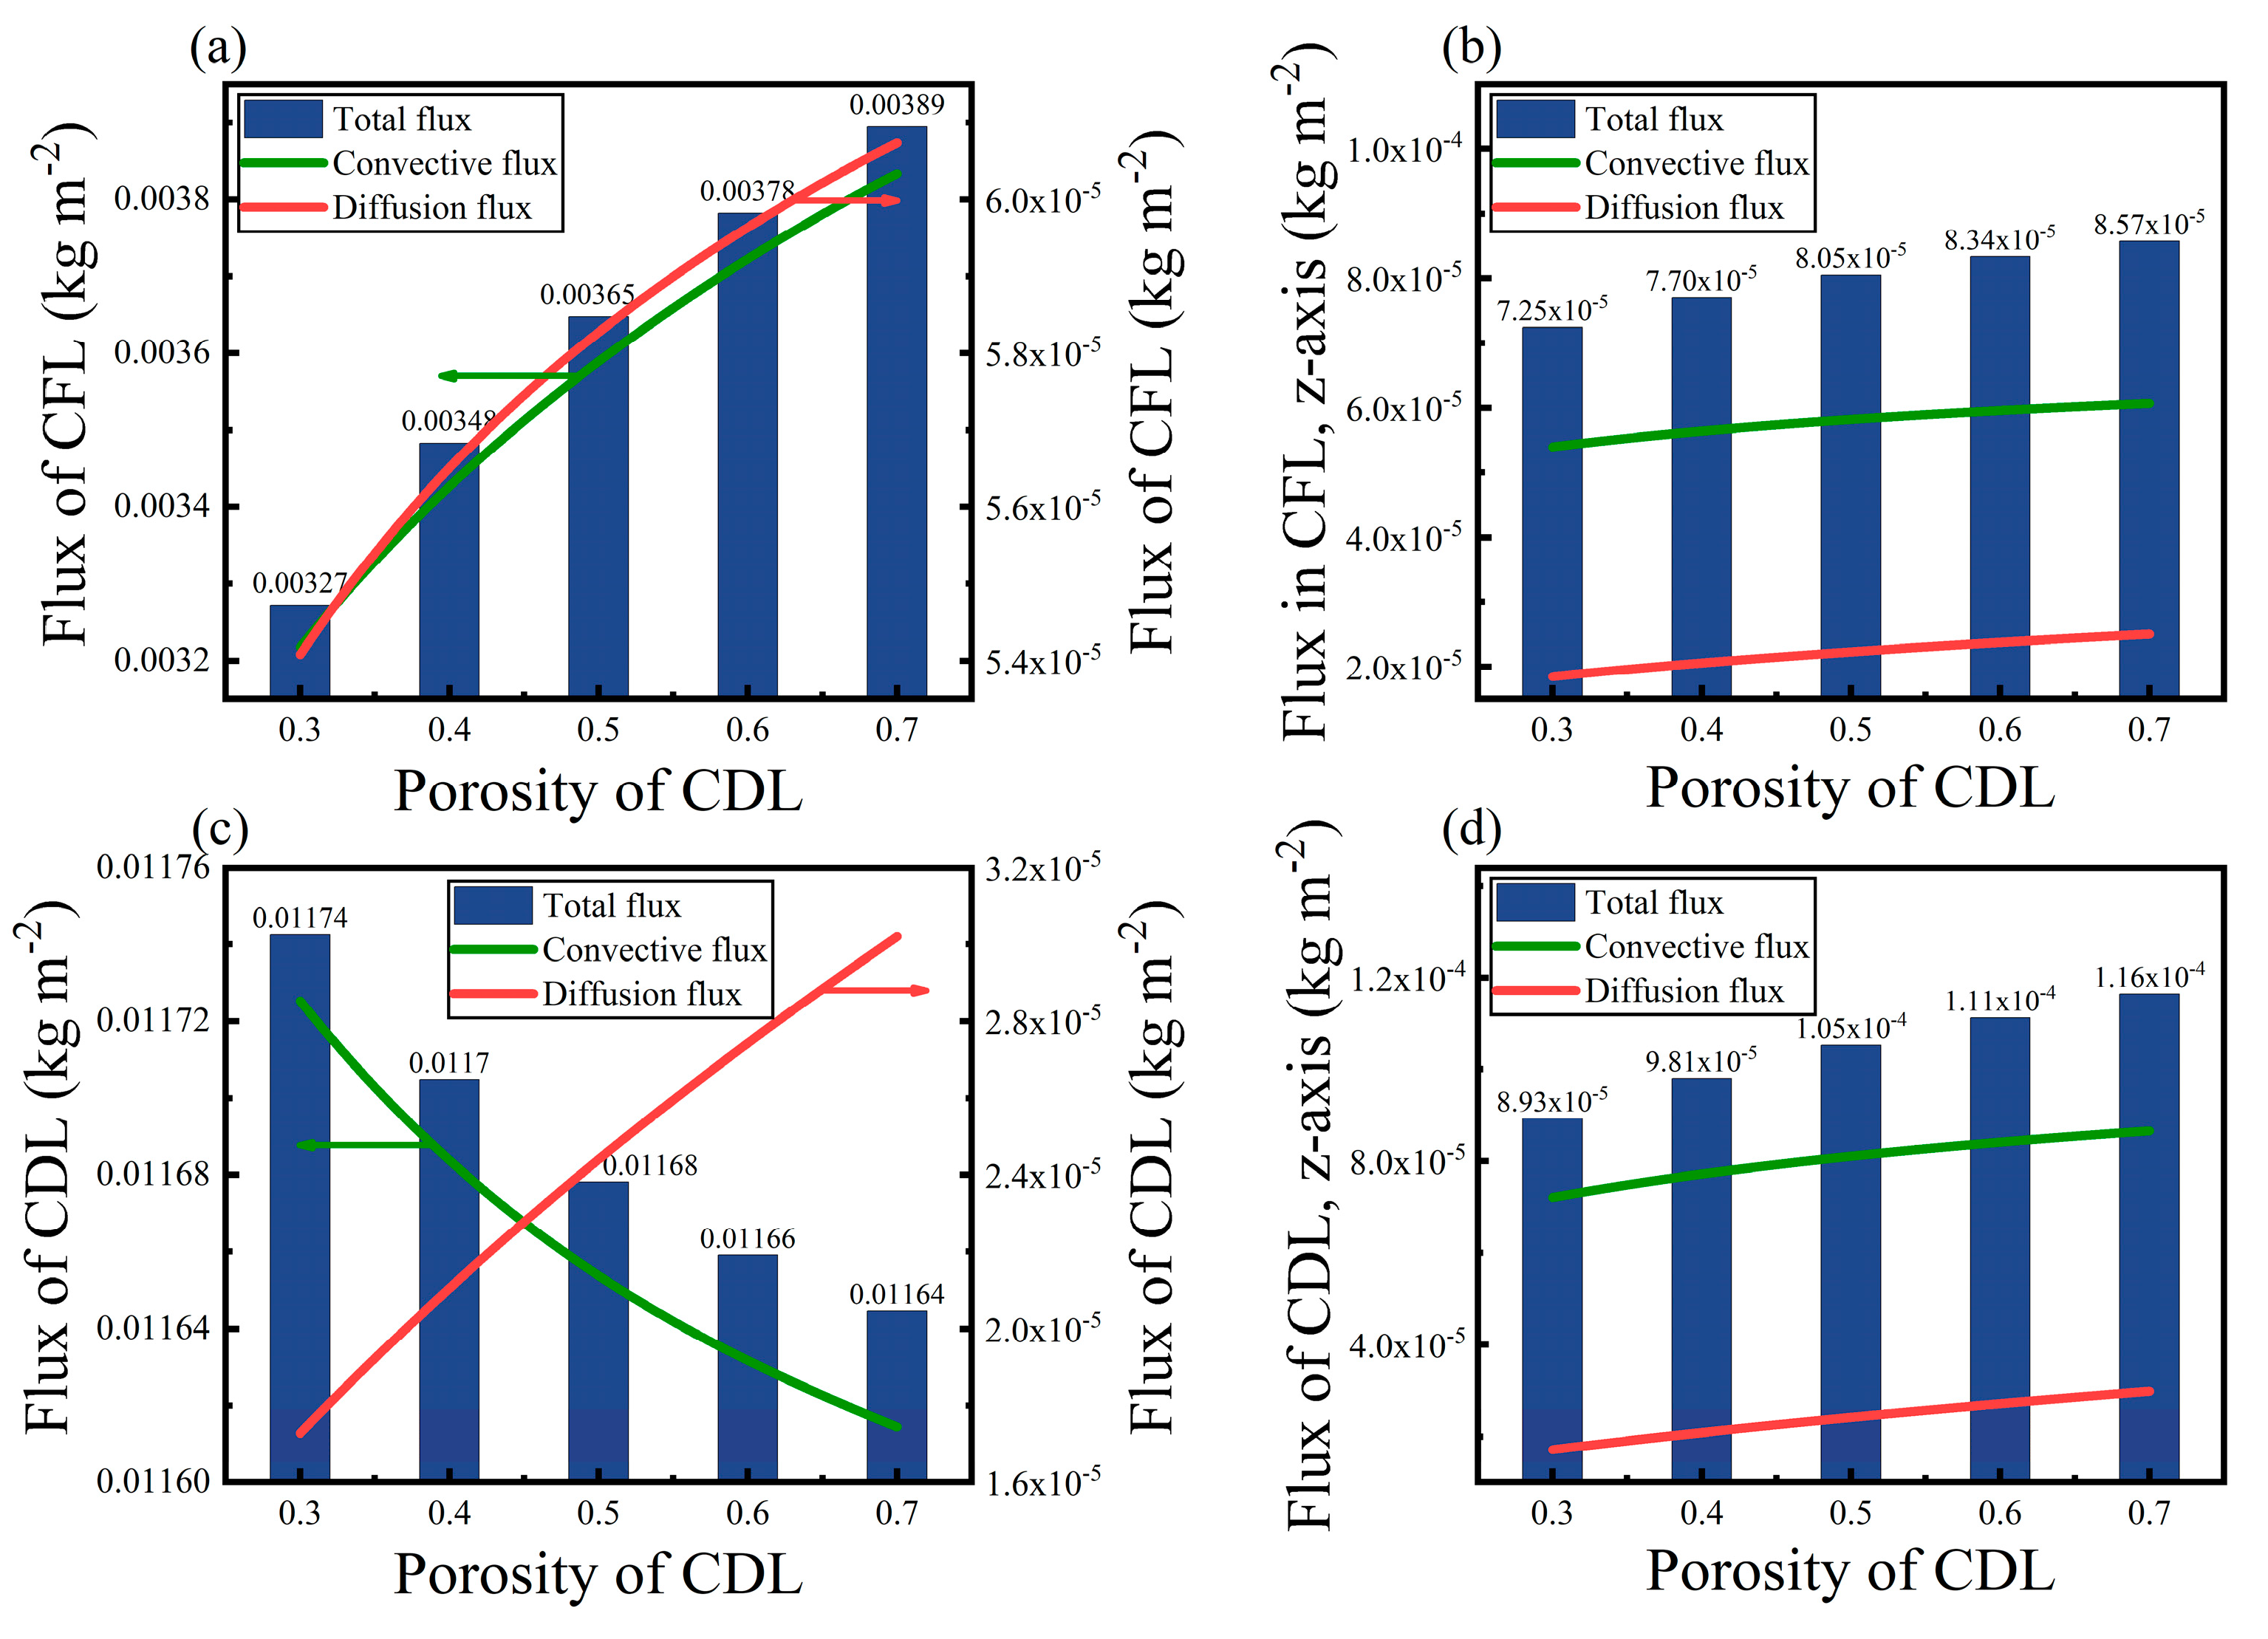
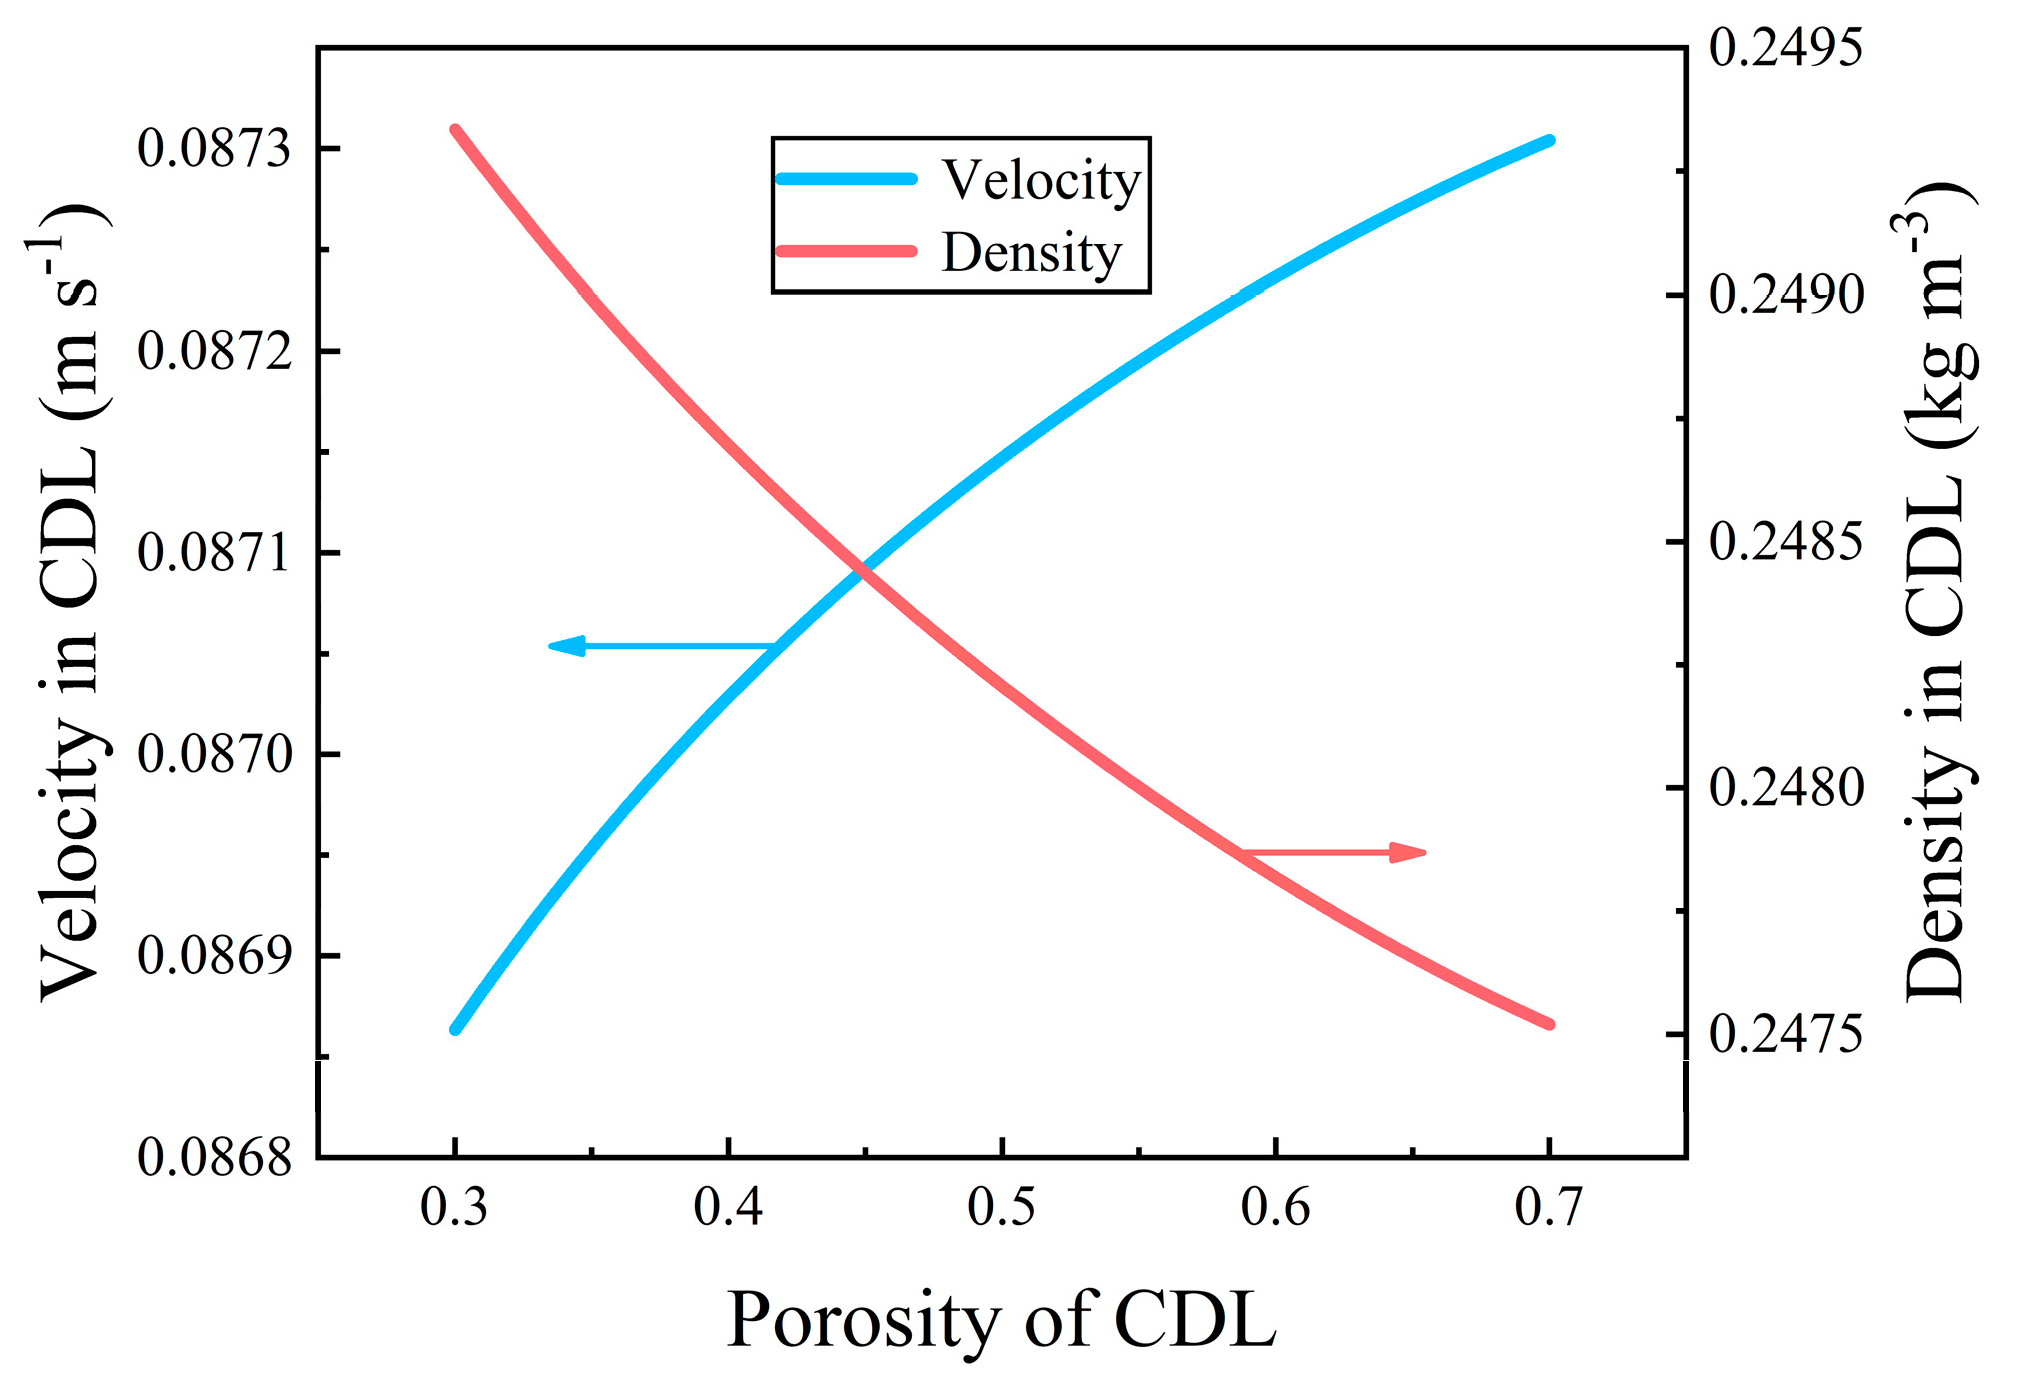
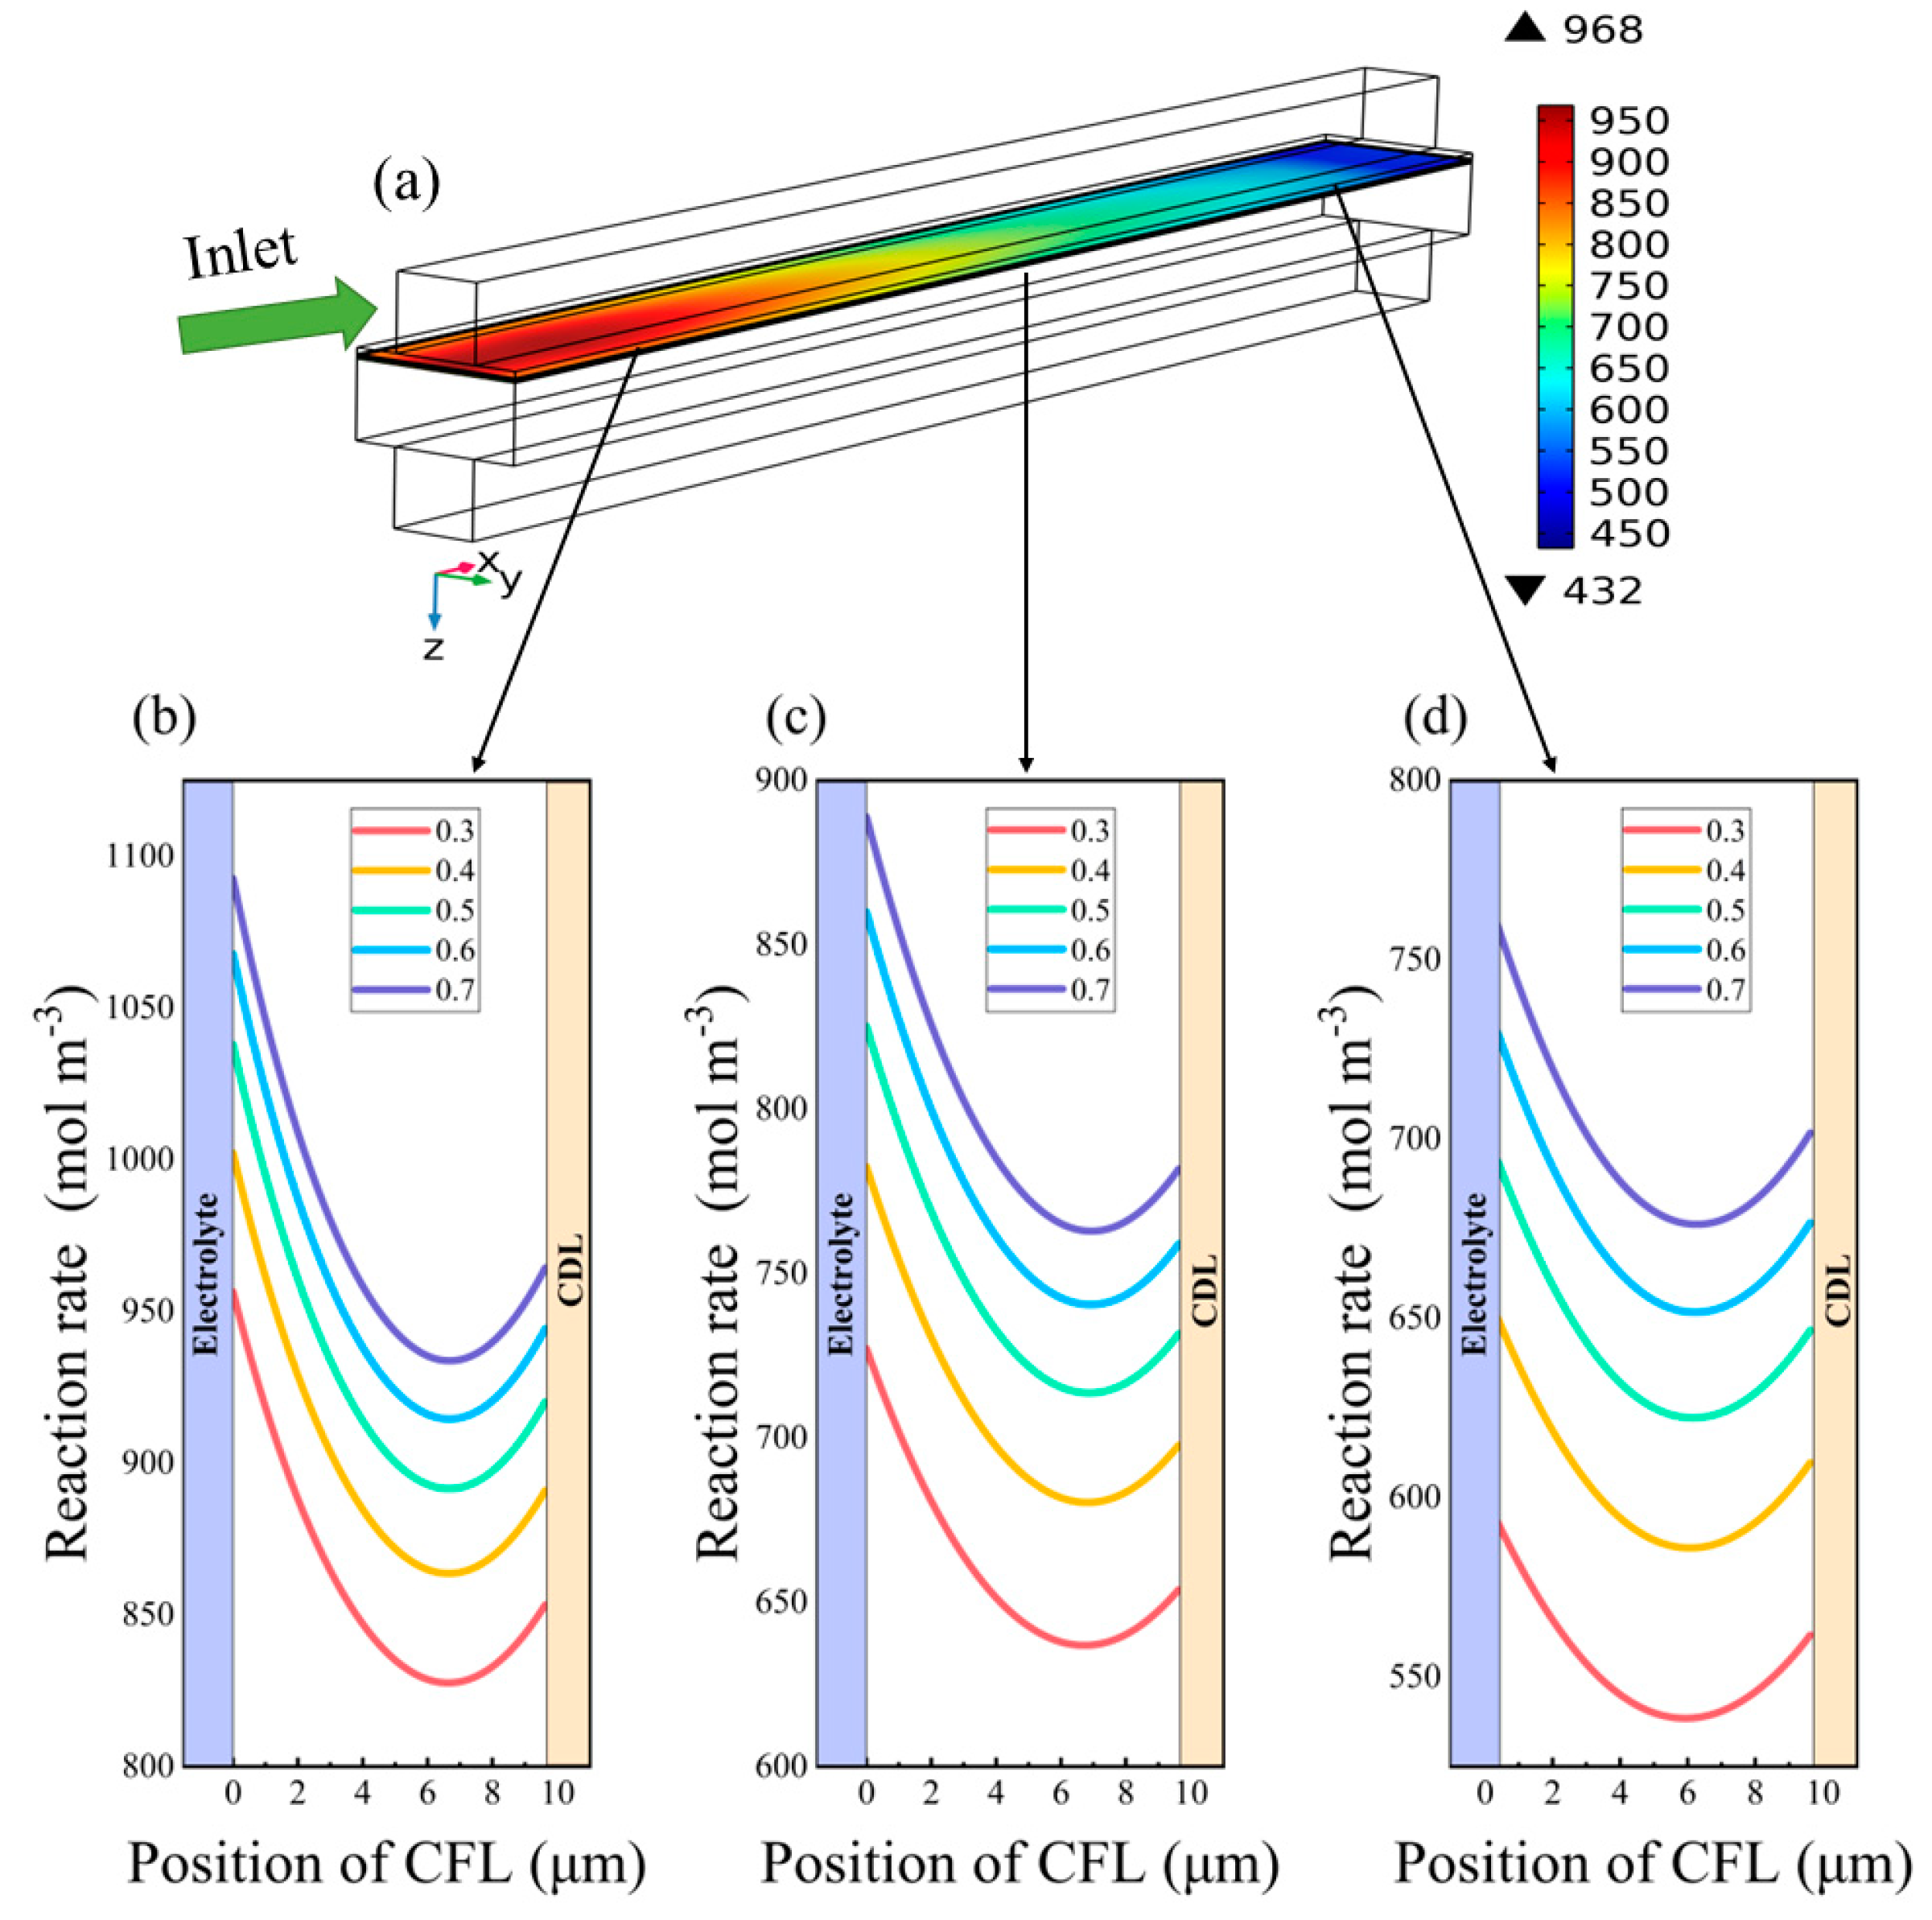
3.2.1. Effects on Mass Transport Process

In the actual operation process of the electrolysis cell, the mass transport process is carried out simultaneously in the x, y, and z directions. The three-dimensional multi-scale model established in this study can accurately predict the mass transport process in these three directions. However, the influence of the mass transport process along the thickness direction (z-axis direction) on the multi-physical processes in the CDL and CFL is more important [37,44] compared with the other two directions. Under the influence of the electrochemical reaction in the CFL, the distribution of each gas species in the x-axis and y-axis directions tend to be homogeneous, while the distribution of each gas species in the z-axis direction changes significantly [40]. Figure 4a–c shows the change in overall mass flux in the CFL and CDL, respectively, when the porosity of the CDL increases from 0.3 to 0.7. Figure 4b–d shows the corresponding mass flux changes along the z-axis direction.
As shown in Figure 4a, the increase in CDL porosity effectively increases the total mass flux in the CFL. Thus, the increase in CDL porosity is conducive to the development of the internal mass transport process of the CFL. According to the component conservation equation, the total flux is mainly composed of diffusion flux and convection flux [16,44]. When the porosity of the CDL increases from 0.3 to 0.7, the molecular diffusion flux and the convection flux in the CFL are found to increase by 12.30% and 19.13%, respectively. These result in an increase in the total flux in the CFL.
Figure 4b shows the relationship between the flux in the CFL along the z-axis and the CDL porosity. As expected, the increase in CDL porosity also promotes the expansion of the total flux in the CFL along the z-axis direction. When the porosity increases from 0.3 to 0.7, the total flux in the z-axis direction increases from 7.25 × 10⁻⁵ kg/m2 to 8.57 × 10⁻⁵ kg/m2. In addition, the molecular diffusion flux and convection flux in the z-axis direction are found to increase with the increase in porosity. Meanwhile, the convection flux is greater than the diffusion flux in the CFL in the present study.
As shown in Figure 4c, it can be found that the influence of CDL porosity on the total flux in the CDL is contrary to the influence law in the CFL. The effect of convection diffusion on the mass transport process in the CDL is greater than that of molecular diffusion. The molecular diffusion flux increases by 74.72% and the convection flux decreases by 1.12% when the porosity increases from 0.3 to 0.7. These make the total flux in the CDL reduce from 0.01174 kg/m2 to 0.01164 kg/m2. Moreover, as shown in Figure 4d, the relationship between the flux in the CDL along the z-axis and the porosity in the CDL is the same as that in the CFL along the z-axis. That is, the increase in porosity is only conducive to the development of the internal mass transport process of CDL in the z-axis direction.
The convection flux is mainly affected by the density and velocity of the working medium [16,44]. To further explore the correlation between the CDL porosity and the CDL internal convection flux, the relationship between the density and the porosity in the CDL is shown in Figure 5, as well as the relationship between the velocity and the porosity. It is found that when the porosity increases from 0.3 to 0.7, the velocity in the CDL increases by 0.51% and the density of the working medium in the CDL decreases by 0.73%. This indicates that the density of the working medium and convection flux in the CDL have similar changing trends with the varying porosities.
Based on the above results, it can be concluded that the increase in CDL porosity is conducive to the development of the mass transport process of the CFL but unfavorable for the development of the mass transport process of the CDL. When the CDL porosity is set to 0.6, the total flux inside the CDL is decreased by 0.681% compared with the value of 0.3, although the total flux inside the CFL is increased by 15.596%. This is because the change of CDL porosity has different effects on the convection flux and diffusion flux in CDL and CFL. The increase in CDL porosity effectively increases the diffusion flux and convection flux in CFL. However, with the increase in CDL porosity, the diffusion flux and convection flux in the CDL increase simultaneously only in the z-axis direction.

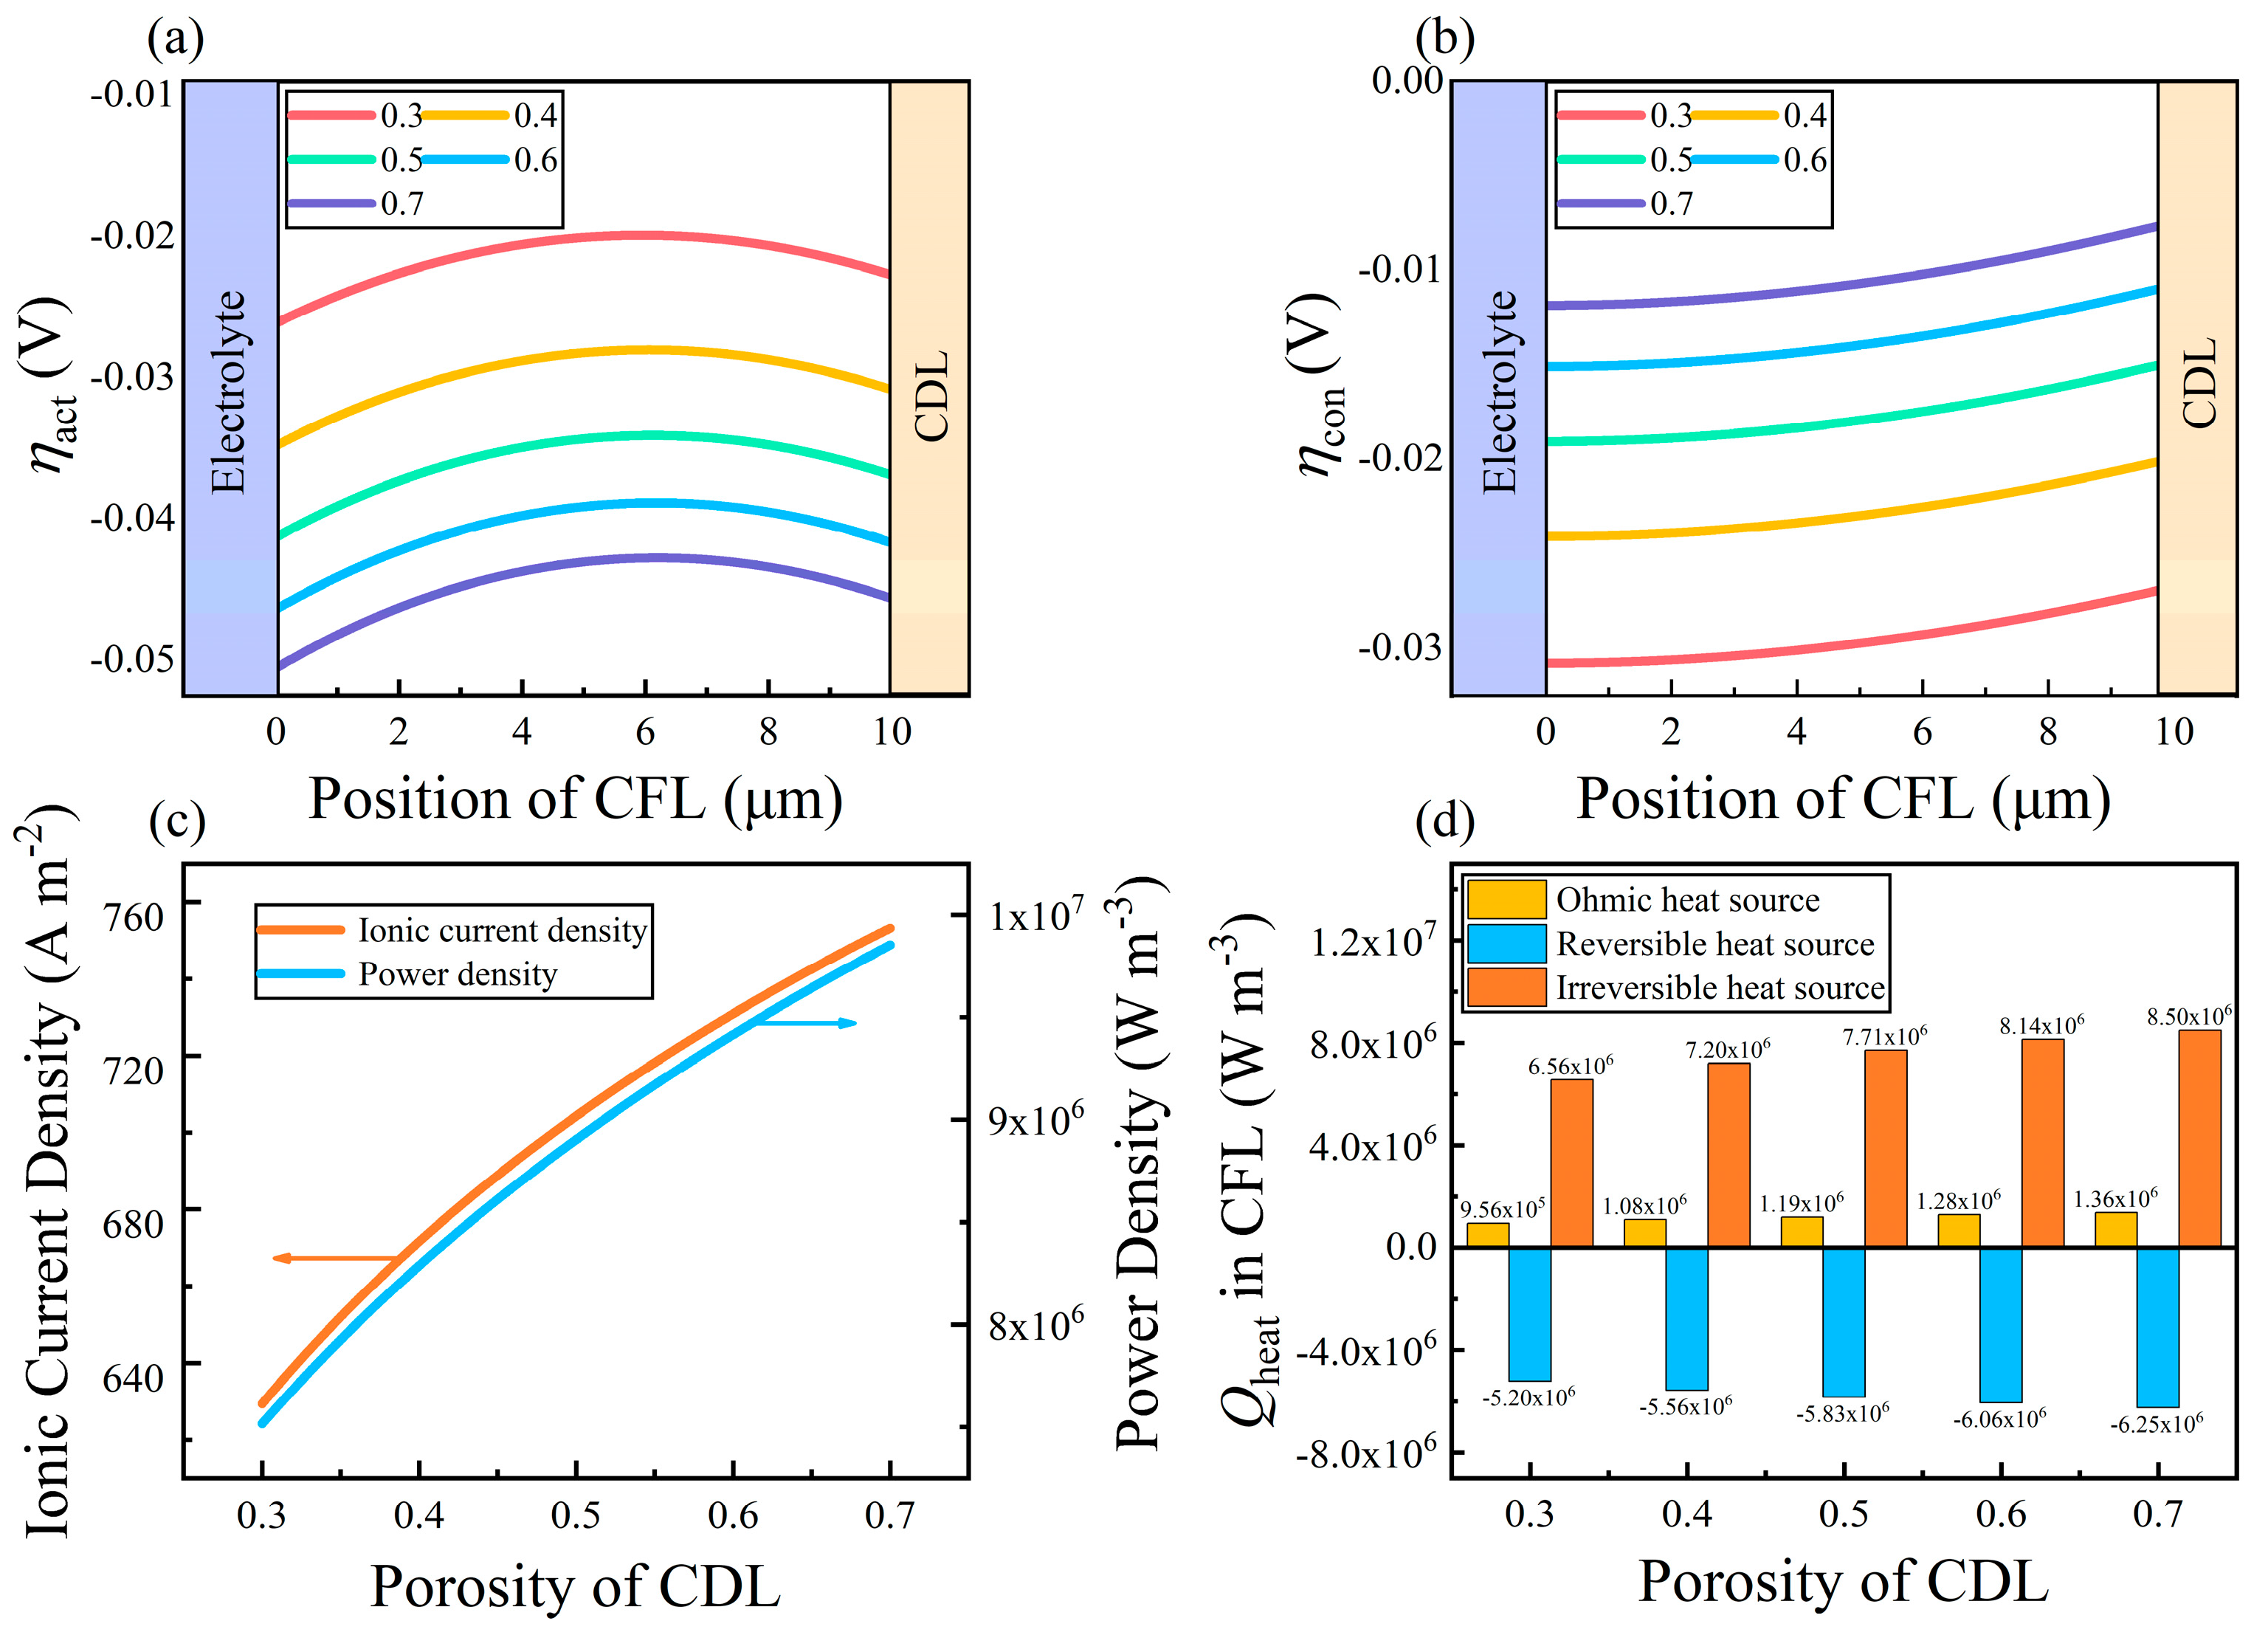
3.2.2. Effects on Electrolysis Performance

Figure 6a shows the distribution of electrochemical reaction rate in the CFL when the ψp of the CDL is set to 0.3. It shows that the electrochemical reaction is most intense near the inlet section and the reaction rate gradually decreases along the fuel flow direction. Figure 6b–d show the electrochemical reaction rate along the thickness direction (z-axis direction) in the CFL at the inlet section (L1), the middle section (L2), and the outlet section (L3) under different CDL porosities. It can be seen that the increase in the CDL porosity is beneficial to improving the overall level of the electrochemical reaction rate in the CFL. The electrochemical reaction is most intense in the area near the electrolyte under certain porosities. Moreover, the distributions of the electrochemical reaction rate along the z-axis direction under various porosities at three characteristic lines are similar.
Figure 7a,b show the magnitude and distribution of activation overpotential and concentration overpotential in the CFL along the z-axis direction in the middle of an electrolysis cell (at L2) under different CDL porosity conditions. It can be seen that the activation overpotential in the CFL increases with the increase in CDL porosity. According to Equations (20) and (21), this is mainly attributed to the fact that the capacity of charge transport in the CDL decreases with increasing ψp. In addition, based on the study by Recalde et al. [49], the concentration overpotential can be affected by the mass transport process inside the electrode. Figure 7b shows that the increase in porosity will reduce the concentration overpotential in the CFL. This can be explained by the enhanced internal mass transport process of the CFL, and the corresponding results were discussed in the previous section.
To further explore the effect of the CDL porosity on the overall performance of the electrolysis cell, the electrolyte current density and power density of the electrolysis cell are simulated as the technical indicators of the electrochemical reaction intensity and the overall energy consumption in the SOEC unit, respectively. As shown in Figure 7c, when the CDL porosity increases from 0.3 to 0.7, the ionic current density inside the electrolysis cell increases by 19.68%, while the power density of the electrolysis cell increases by 31.14%. These results indicate that the change in power density is more significant than the change in ion current density affected by the porosity of the CDL.
Figure 7d shows the variation of each heat source within the CFL under different CDL porosities. It can be seen that all three heat sources increase with increasing porosity and the change in the ohmic heat source is the largest. When the porosity increases from 0.3 to 0.7, the ohmic, reversible, and irreversible heat sources are found to increase by 41.91%, 20.12%, and 29.54%, respectively.
Combining the above simulation results, it can be found that the variation of porosity can directly affect the development of the internal mass transport process of the CDL and CFL, and indirectly affect the change in the electrolysis performance of the electrolysis cell. The larger total flux is conducive to the diffusion process inside the composite electrode, thus reducing the concentration polarization loss of the electrode and the energy consumption. The electrolysis reaction rate increases gradually when the porosity increases from 0.3 to 0.7. However, it cannot be ignored that the increase in porosity increases the energy consumption of the IT-SOEC unit. When the porosity exceeds the range of 0.3–0.5, the increase in the electrolysis reaction rate in each domain of the unit is significantly lower than that in the range of 0.3–0.5, and the energy consumption remains significantly higher. Therefore, from the perspective of reducing energy consumption and enhancing reaction rate, 0.3–0.5 is considered the optimal range of CDL porosity in the present study.

3.3. Effects of Internal Mesostructure of CFL

The electrode phase volume fraction and electrode particle radius play important roles in the reaction rate and energy consumption of the CFL. In this section, the effects of internal the mesostructural parameters, including the volume fraction of the electrode phase and the electrode particle radius on the mass transport process, electrochemical reaction process, and heat generation process inside the CFL are investigated.

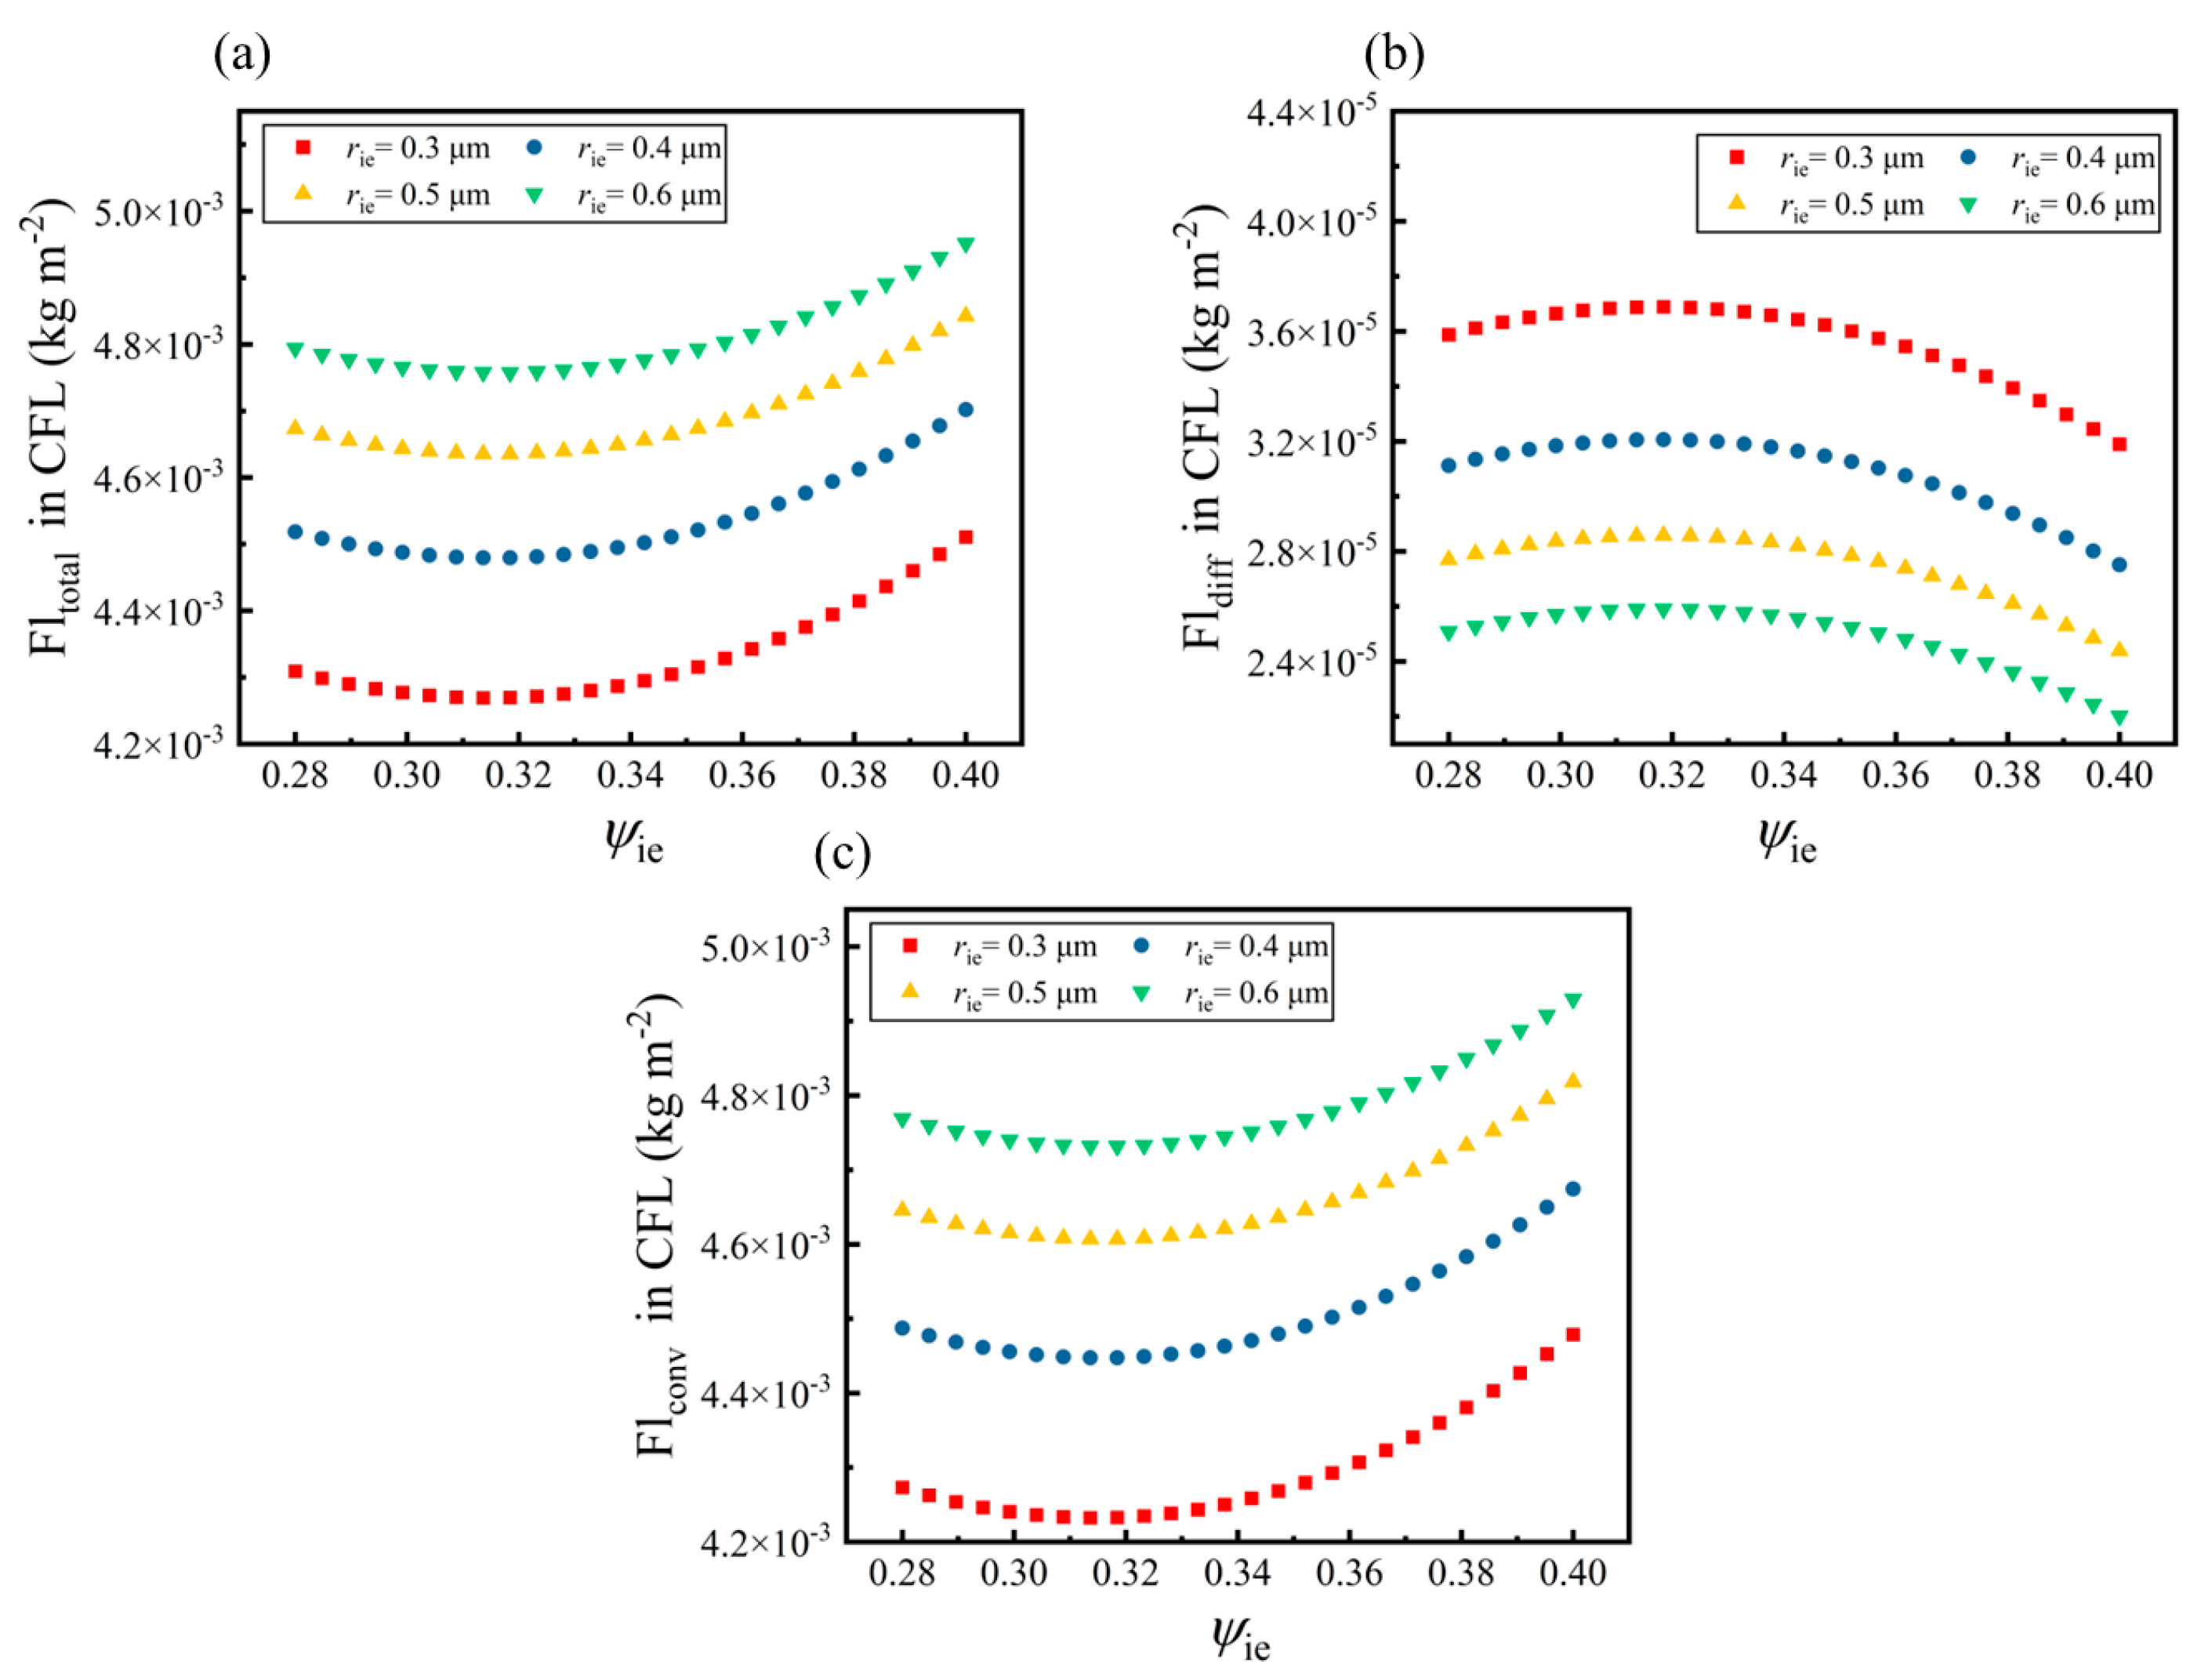
3.3.1. Effects on Mass Transport Process

To investigate the effects of various volume fractions of the electrode phase (ψie) inside the CFL, the gas-phase volume fraction (ψp) of the CFL is fixed at 0.36 based on the range of porosity values reported in reference [50], and the radius ratio of electrode particle to electrolyte particle is fixed at 1 to eliminate the influence of the particle size ratio of solid particles [51,52]. Under this condition, according to Equations (15) and (16), the percolation thresholds of both electrode particles and electrolyte particles can be obtained as 0.405 and 0.275, respectively. Chen et al. [33] demonstrated in their study that ψie < 0.275 and ψie > 0.405 are detrimental to the electrode performance and limit the expansion of the effective percolation TPB area. Therefore, in present study, we focus on ψie in the range of 0.28–0.40.
Figure 8a–c shows the effects of the volume fraction of the electrode phase in the CFL and electrode particle radius on total mass flux, molecular diffusion flux, and convection flux. It can be seen that when the volume fraction of the electrode phase in the CFL approaches the percolation threshold, the total flux and convection flux reach their peak values. This is conducive to the development of the mass transport process. However, the molecular diffusion flux decreases when the volume fraction of the electrode phase in the CFL approaches the percolation threshold. However, it has little effect on the total flux due to its low order of magnitude. It is worth noting that, regardless of the electrode particle radius, the total flux and the convection flux reach the minimum value at ψie = 0.32 (i.e., ψie:ψio = 1), while the molecular diffusion flux reaches the maximum value. That is because the electrolysis reaction is more intense under this structural condition. The concentration gradient inside the CFL is increased and the molecular diffusion process is promoted. In addition, it can be seen that the increase in the radius of the electrode particle limits the molecular diffusion process to a certain extent but facilitates the convective diffusion process and ultimately the mass transport process in the CFL. It can be suggested that the gas flow velocity of the different gas components inside the CFL decreases with an increase in the electrode particle radius. This decrease in gas flow velocity hinders the development of the convective diffusion process inside the CFL.
Figure 9a–c show the influences of different ψie and rie of the CFL on the mass transport process in the z-axis direction. It can be found that, regardless of the electrode particle radius, the total flux in the z-axis direction reaches its peak value when ψie = 0.32. This indicates that the uniform volume fraction of the electrode phase and electrolyte phase is conducive to the mass transport process in the z-axis direction of CFL. According to Figure 9b,c, it can be seen that the molecular diffusion flux is greater than the convection diffusion flux in the z-axis direction. In addition, the influence of the electrode particle radius on the mass transport process in the z-axis direction of the CFL is different from that on the overall transport process in the CFL. In the z-axis direction, the increase in the electrode particle radius is unfavorable for the development of the internal mass transport process because the molecular diffusion process and the convection diffusion process are limited. This may be due to the fact that the increase in the electrode particle radius hinders the progress of the electrolysis reaction inside the CFL. This will casus the decrease in the concentration gradient along the z-axis inside the CFL and the reduction of the driving force of the molecular diffusion process.

3.3.2. Effects on Electrolysis Performance

Figure 10a–c shows the influence of different electrode phase volume fractions and electrode particle radii on the generated ohmic heat source, reversible heat source, and irreversible heat source. As shown in Figure 10a, it can be found that the larger the ψie is, the greater the ohmic heat source at any electrode particle radius. When rie = 0.3 μm, the ohmic heat corresponding to ψie = 0.40 is 2.14 times greater than that corresponding to ψie = 0.28. In addition, the increase in the electrode particle radius can inhibit the production of ohmic heat. When rie = 0.3 μm, the ohmic heat produced is 81.76% greater than that at rie = 0.6 μm under the condition of ψie = 0.40. From Figure 10b, it can be seen that when ψie = 0.32, the reversible heat source reaches the maximum value, and with the increase in the electrode particle radius, the peak value of the reversible heat source also decreases. The peak value corresponding to rie = 0.6 μm is –4.06 × 10⁶ W/m3, and the peak value corresponding to rie = 0.3 μm is –3.05×10⁶ W/m3. As shown in Figure 10c, when the volume fraction of the electrode phase in the CFL approaches to the percolation threshold of the electrode particles, the irreversible heat source reaches the minimum value. This trend is evident at rie = 0.3 μm. Moreover, it is also seen that the irreversible heat source achieves a maximum value at rie = 0.4 μm and a minimum value at rie = 0.6 μm under the same condition at any ψie.
As shown in Figure 10d, it can be seen that when ψie is around 0.32, the effective percolation TPB area inside the CFL is relatively large, and the effective percolation TPB area reaches its peak value under ψie = 0.32. Moreover, the smaller the radius of the electrode particle is, the wider the area covered by the effective percolation TPB area inside the CFL. The peak value of the effective percolation TPB area corresponding to rie = 0.3 μm is 2.1 times larger than that for rie = 0.6 μm. Moreover, the effective percolation TPB area decreases slowly as rie increases, especially when rie > 0.4 μm. This indicates that the effect of increasing the radius of electrode particles on the effective percolation TPB area starts to gradually decay when rie > 0.4 μm.
The effects of different structure characteristics of the CFL inside the electrolysis cell on the electrochemical reaction rate inside the CFL along the z-axis direction are shown in Figure 11a–d. It can be seen that the maximum electrochemical reaction rate in CFL decreases as the radius of the electrode particle increases. When the radius of electrode particles is reduced from 0.5 μm to 0.3 μm, the maximum reaction rate inside the CFL increases by 32.64%. The overall profiles also indicate that the electrochemical reaction inside the CFL diminishes with the increasing radius of the electrode particle when the volume fraction of the electrode phase is fixed.
It is also seen in Figure 11 that the overall level of the electrochemical reaction rate in the CFL along the z-axis direction gradually decreases with the increasing ψie. When ψie = 0.32, the electrochemical reaction rate in the CFL reaches its peak value at the fixed position. Meanwhile, there is a relatively intensive electrochemical reaction near the electrolyte layer. This phenomenon can be attributed to the change in the number of electrode particles and electrolyte particles in the CFL. With the increase in the number of electrode particles, most of the electrode particles can form percolation clusters. However, due to the limited number of electrolyte particles, there are only some short connection networks near the electrolyte [33]. This confirms the fact that most of the effective percolation TPB interface appears in the short connection network domain and the electrochemical reaction mainly occurs in these domains. Moreover, according to the study by Chen et al. [33], the continuous transfer process of ionic charge in the domains far away from the electrolyte is restricted, thus limiting the occurrence of electrochemical reactions. It can be also confirmed from Figure 11 that the electrolytic reaction rate near the electrolyte layer with enough electrode particles is higher than that in the domain over 4 μm in the z-axis direction, based on the reaction rates of ψie = 0.28 and ψie = 0.36 in the CFL.

4. Conclusions

In this study, a three-dimensional multi-scale model describing the multi-physical processes occurring in the double-layer IT-SOEC unit for water electrolysis is established. The electrolysis process includes the heat transfer, mass transfer and the electrochemical reaction of multi-component gases. The structural characteristics of the composite electrode and the material properties are preserved through percolation theory. Under the condition of intermediate temperature, the effects of key structural parameters of the cathode diffusion layer (CDL) and the cathode functional layer (CFL) on the performance are determined by a numerical computation. The conclusions are as follows:
  • The increase of the CDL porosity promotes the development of the internal mass transport process of the CFL, but hinders the development of the overall mass transport process in the CDL. The convection flux decreases by 1.12% when the porosity of the CDL increases from 0.3 to 0.7. The increase of the CDL porosity also increases the overall energy consumption. The energy consumption at the porosity of 0.5 decreases by 9.64% compared with the porosity of 0.7. The appropriate value of the CDL porosity is determined in the range of 0.3–0.5.
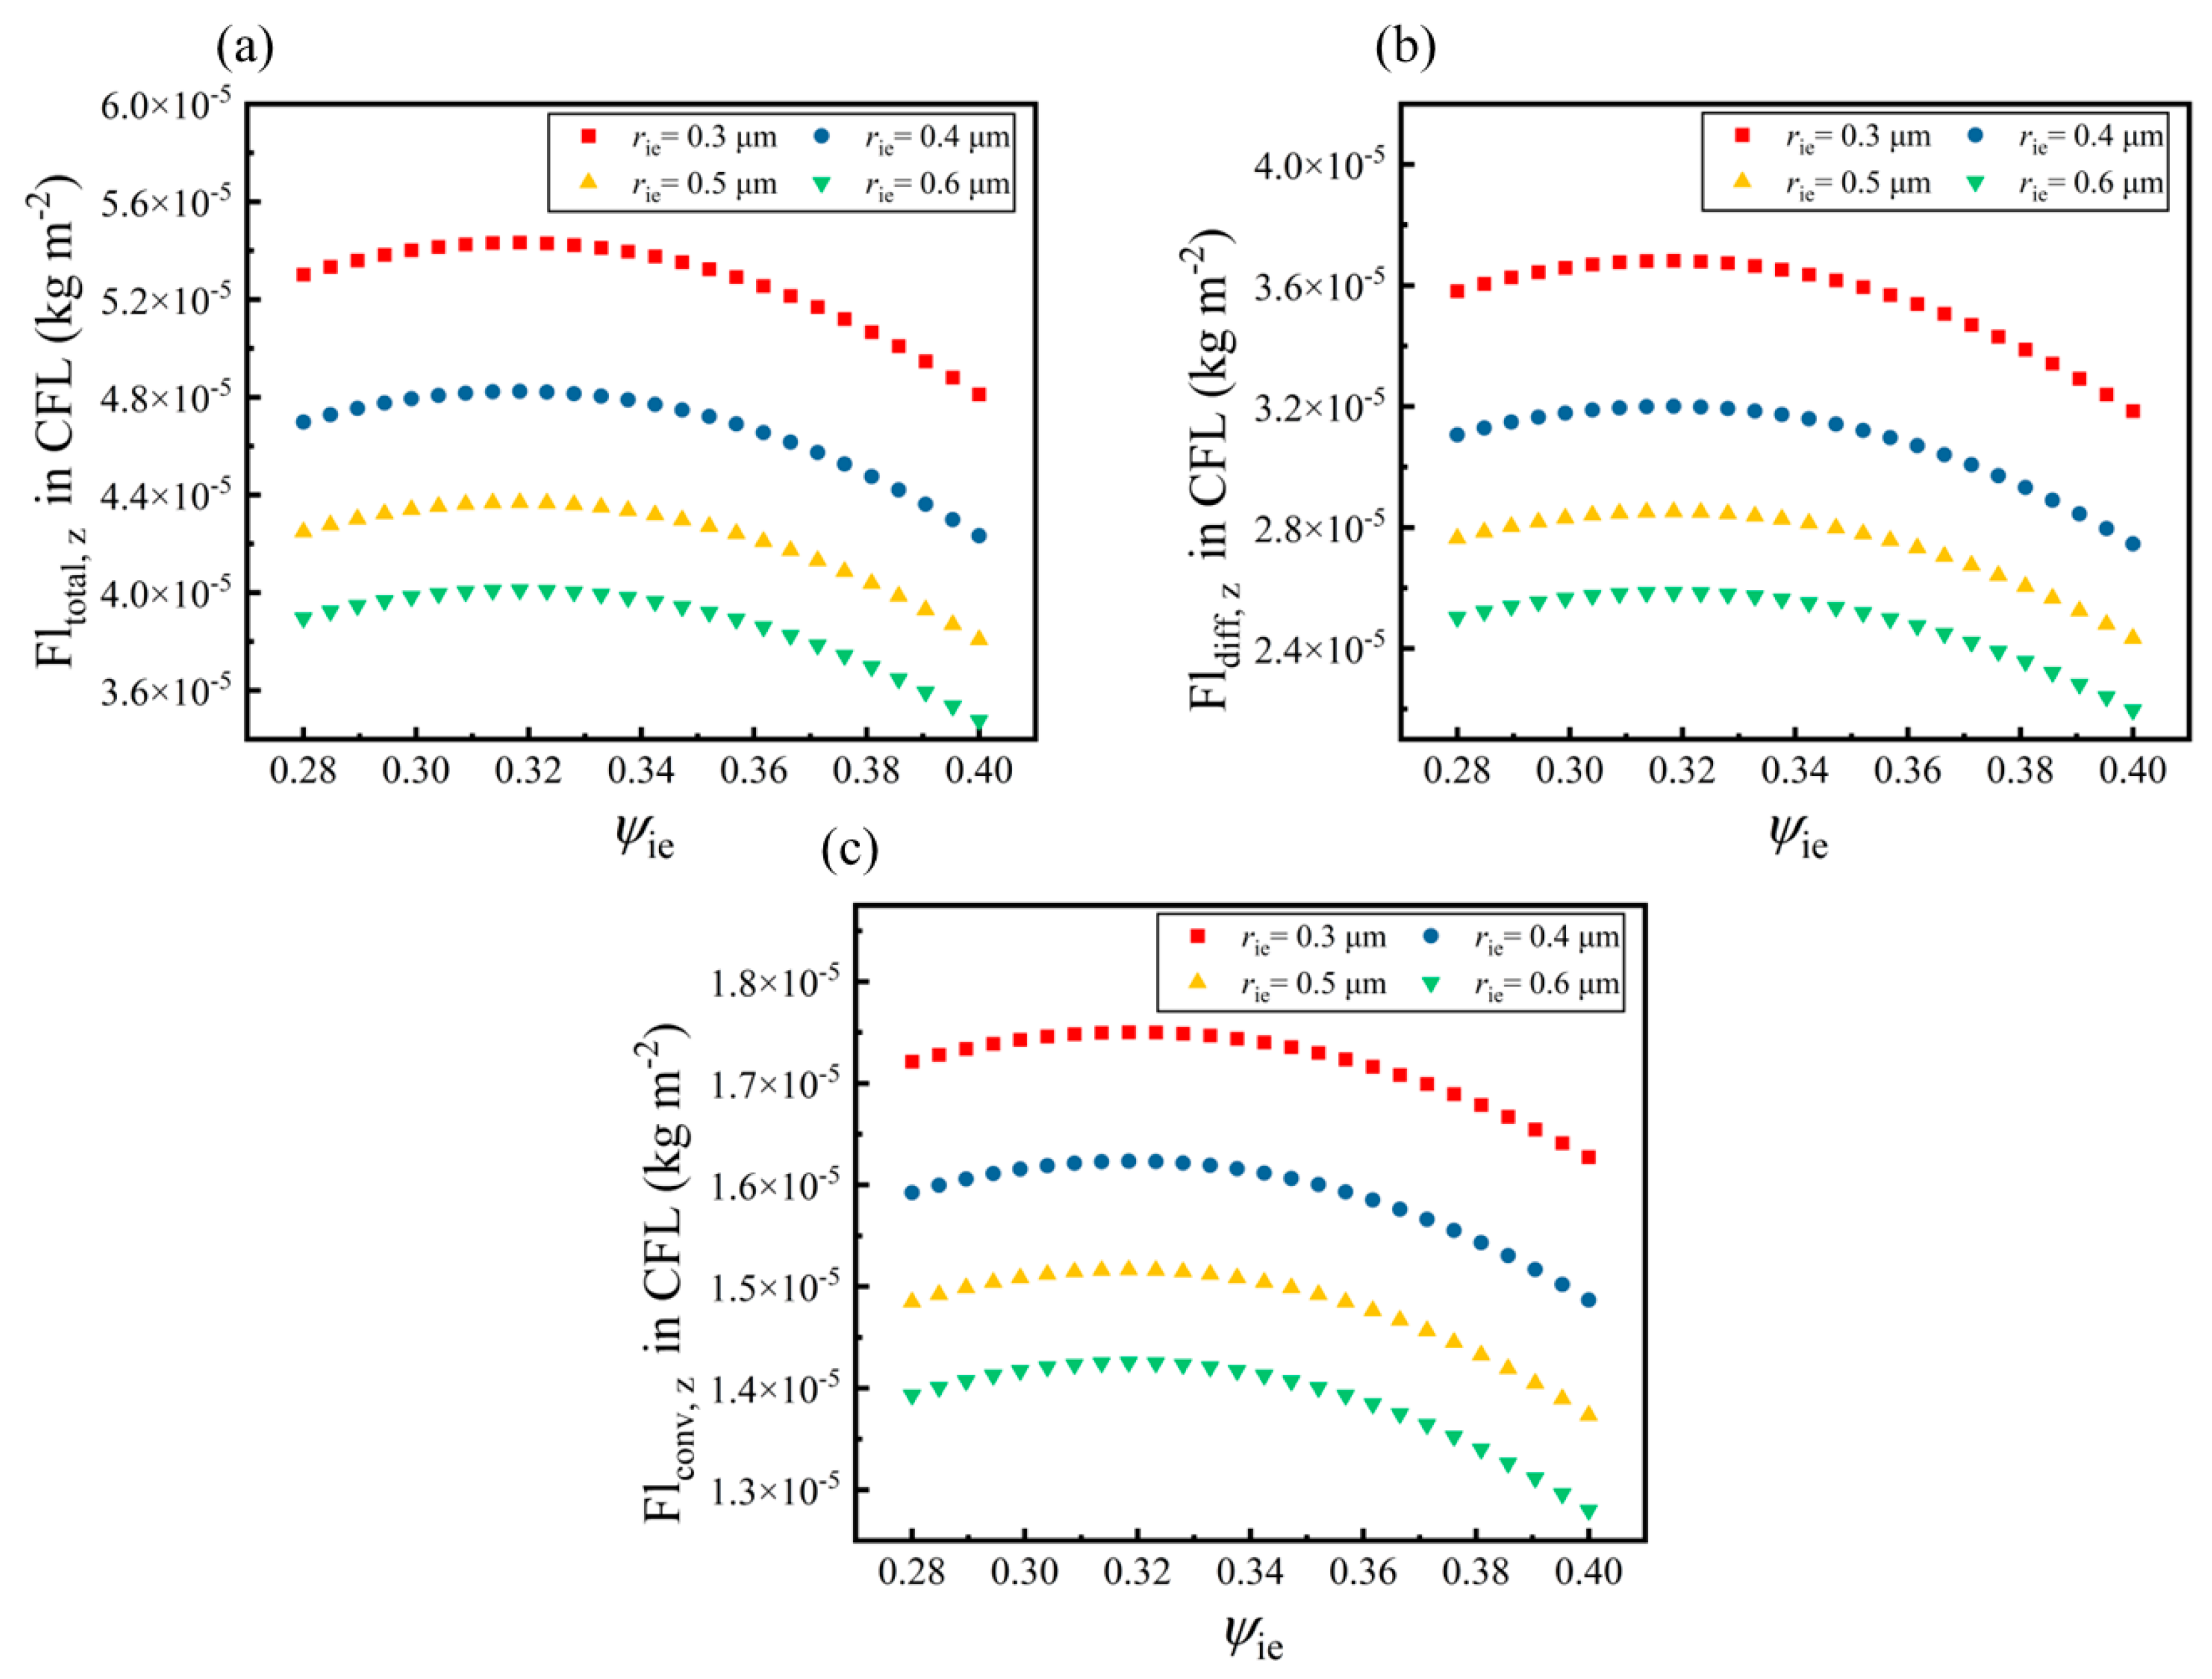
  • The equal volume fractions of the electrode phase (ψie) and electrolyte phase (ψio) in the CFL can enhance the mass transport process along the wall-normal direction from the channel to the cathode. The total mass flux along the wall-normal direction reaches the maximum value in the CFL when ψie = 0.32.
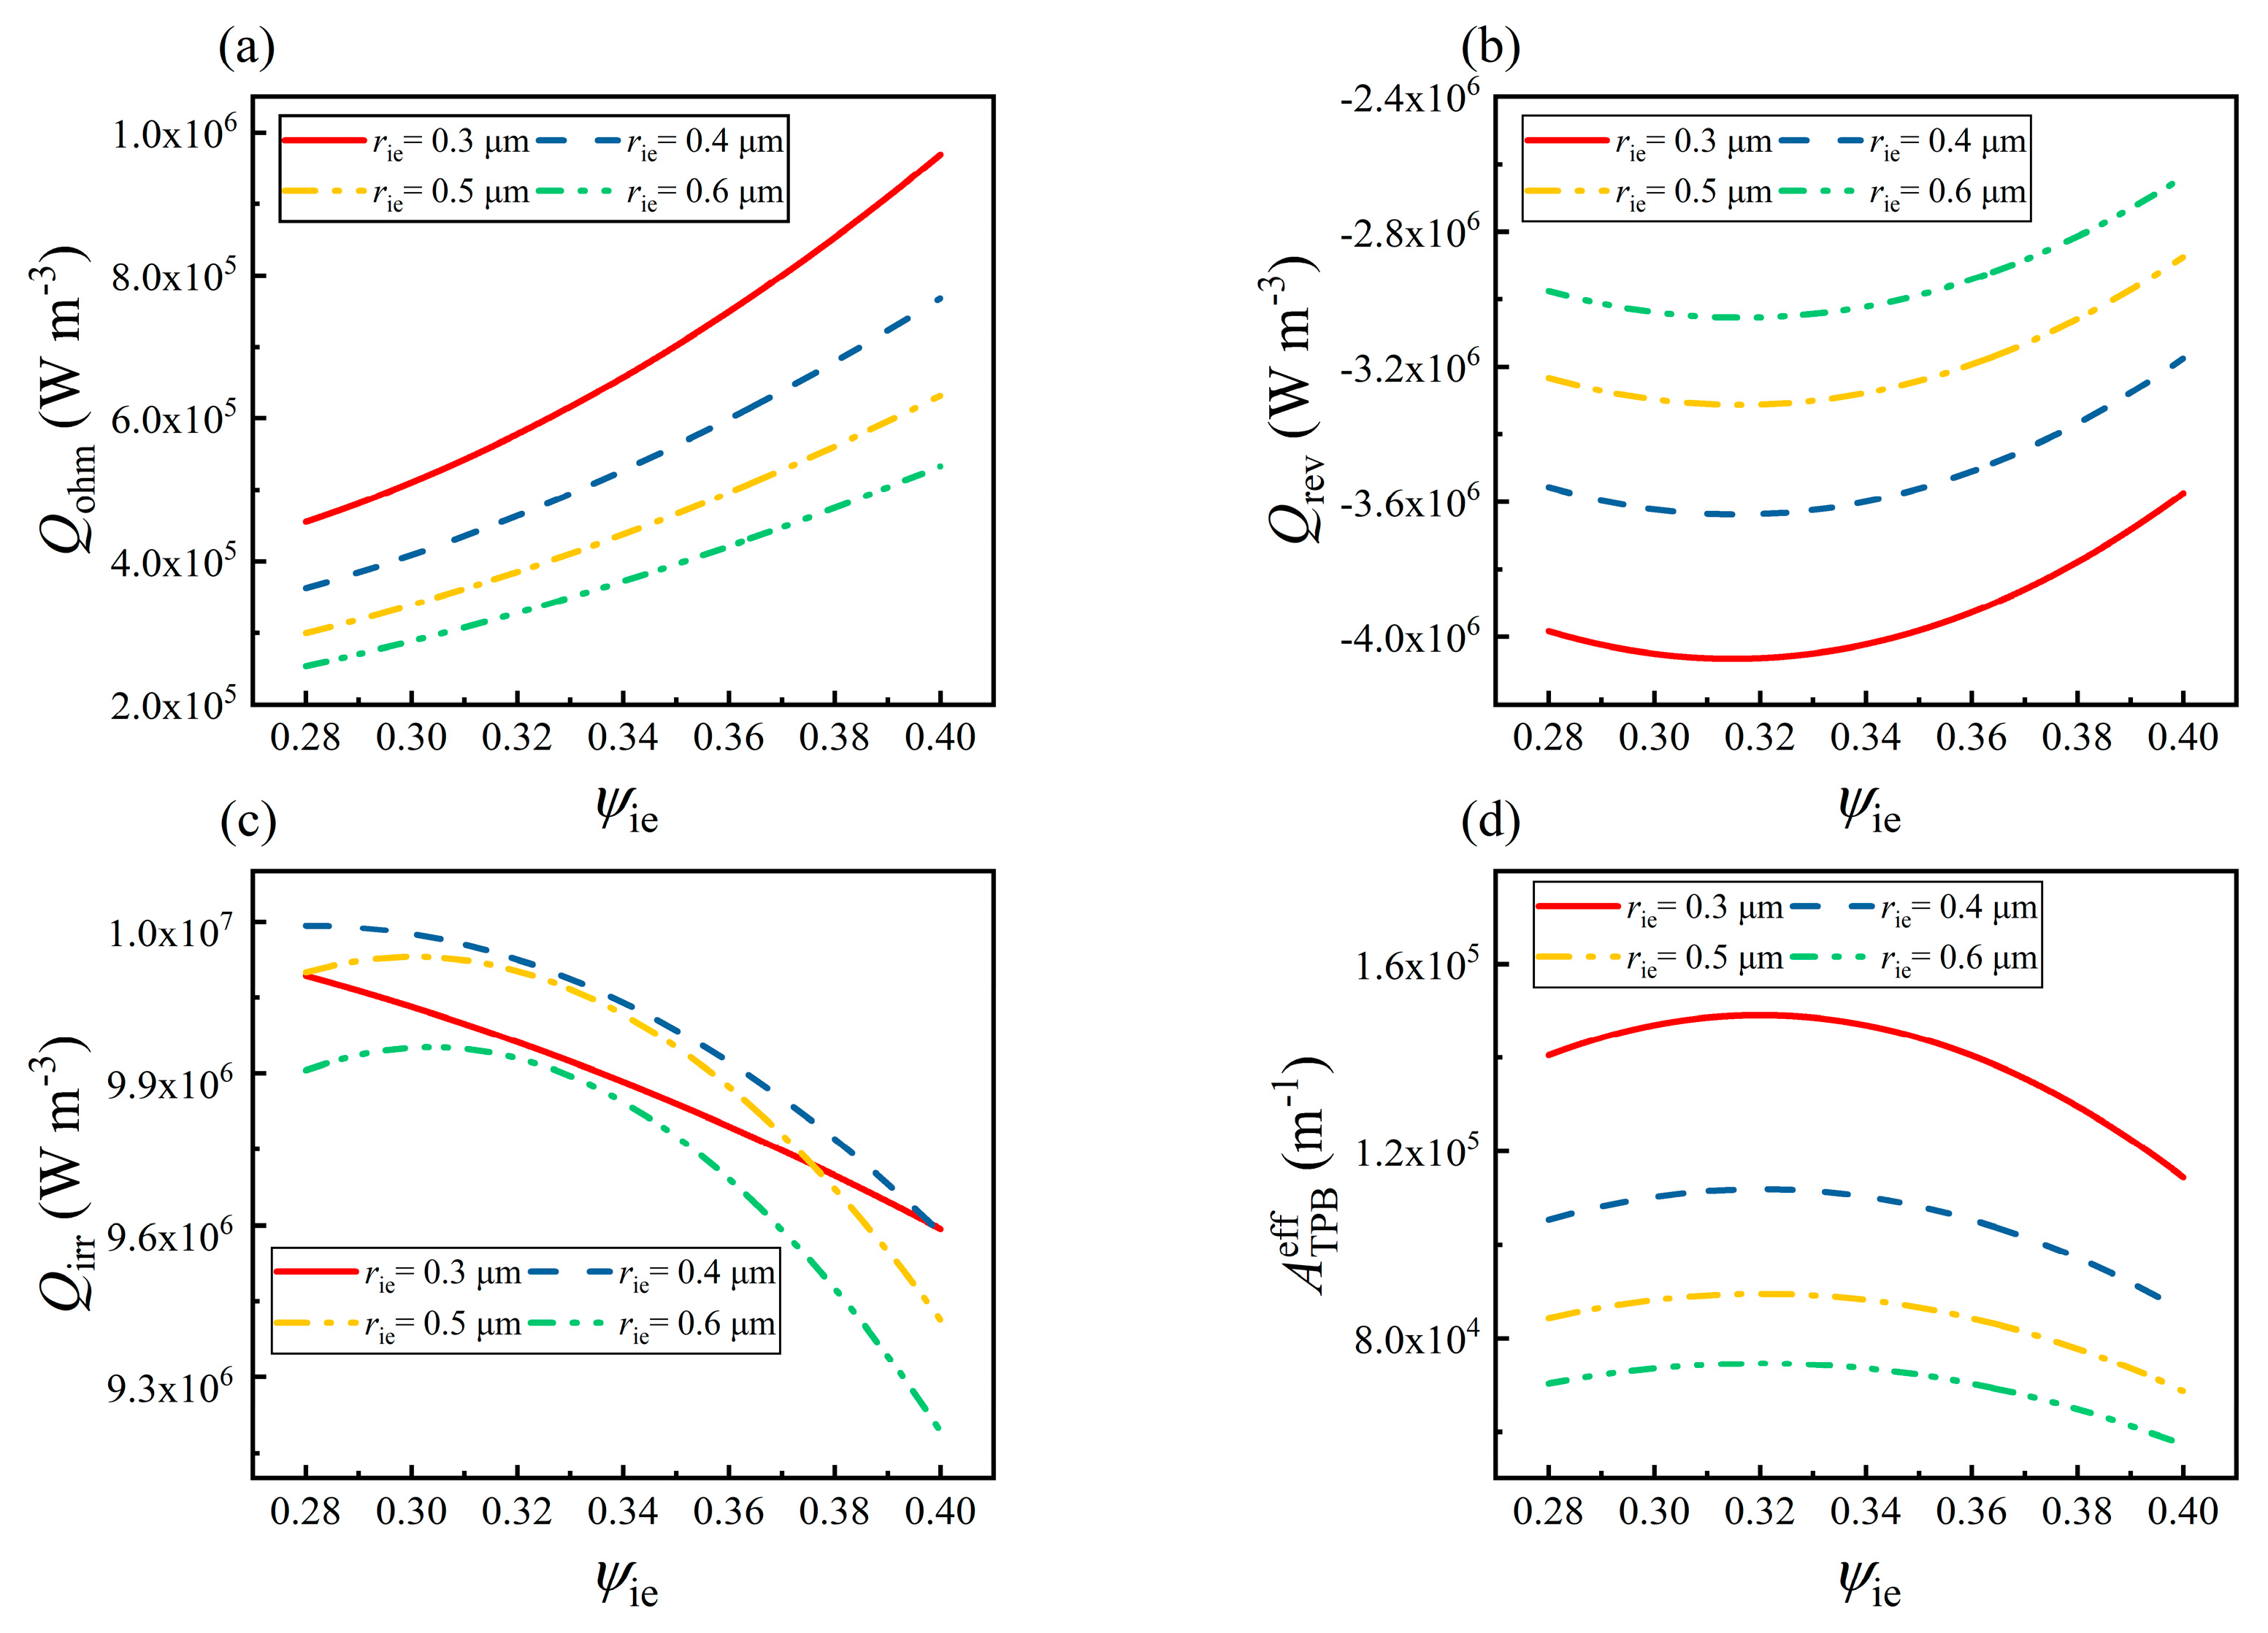
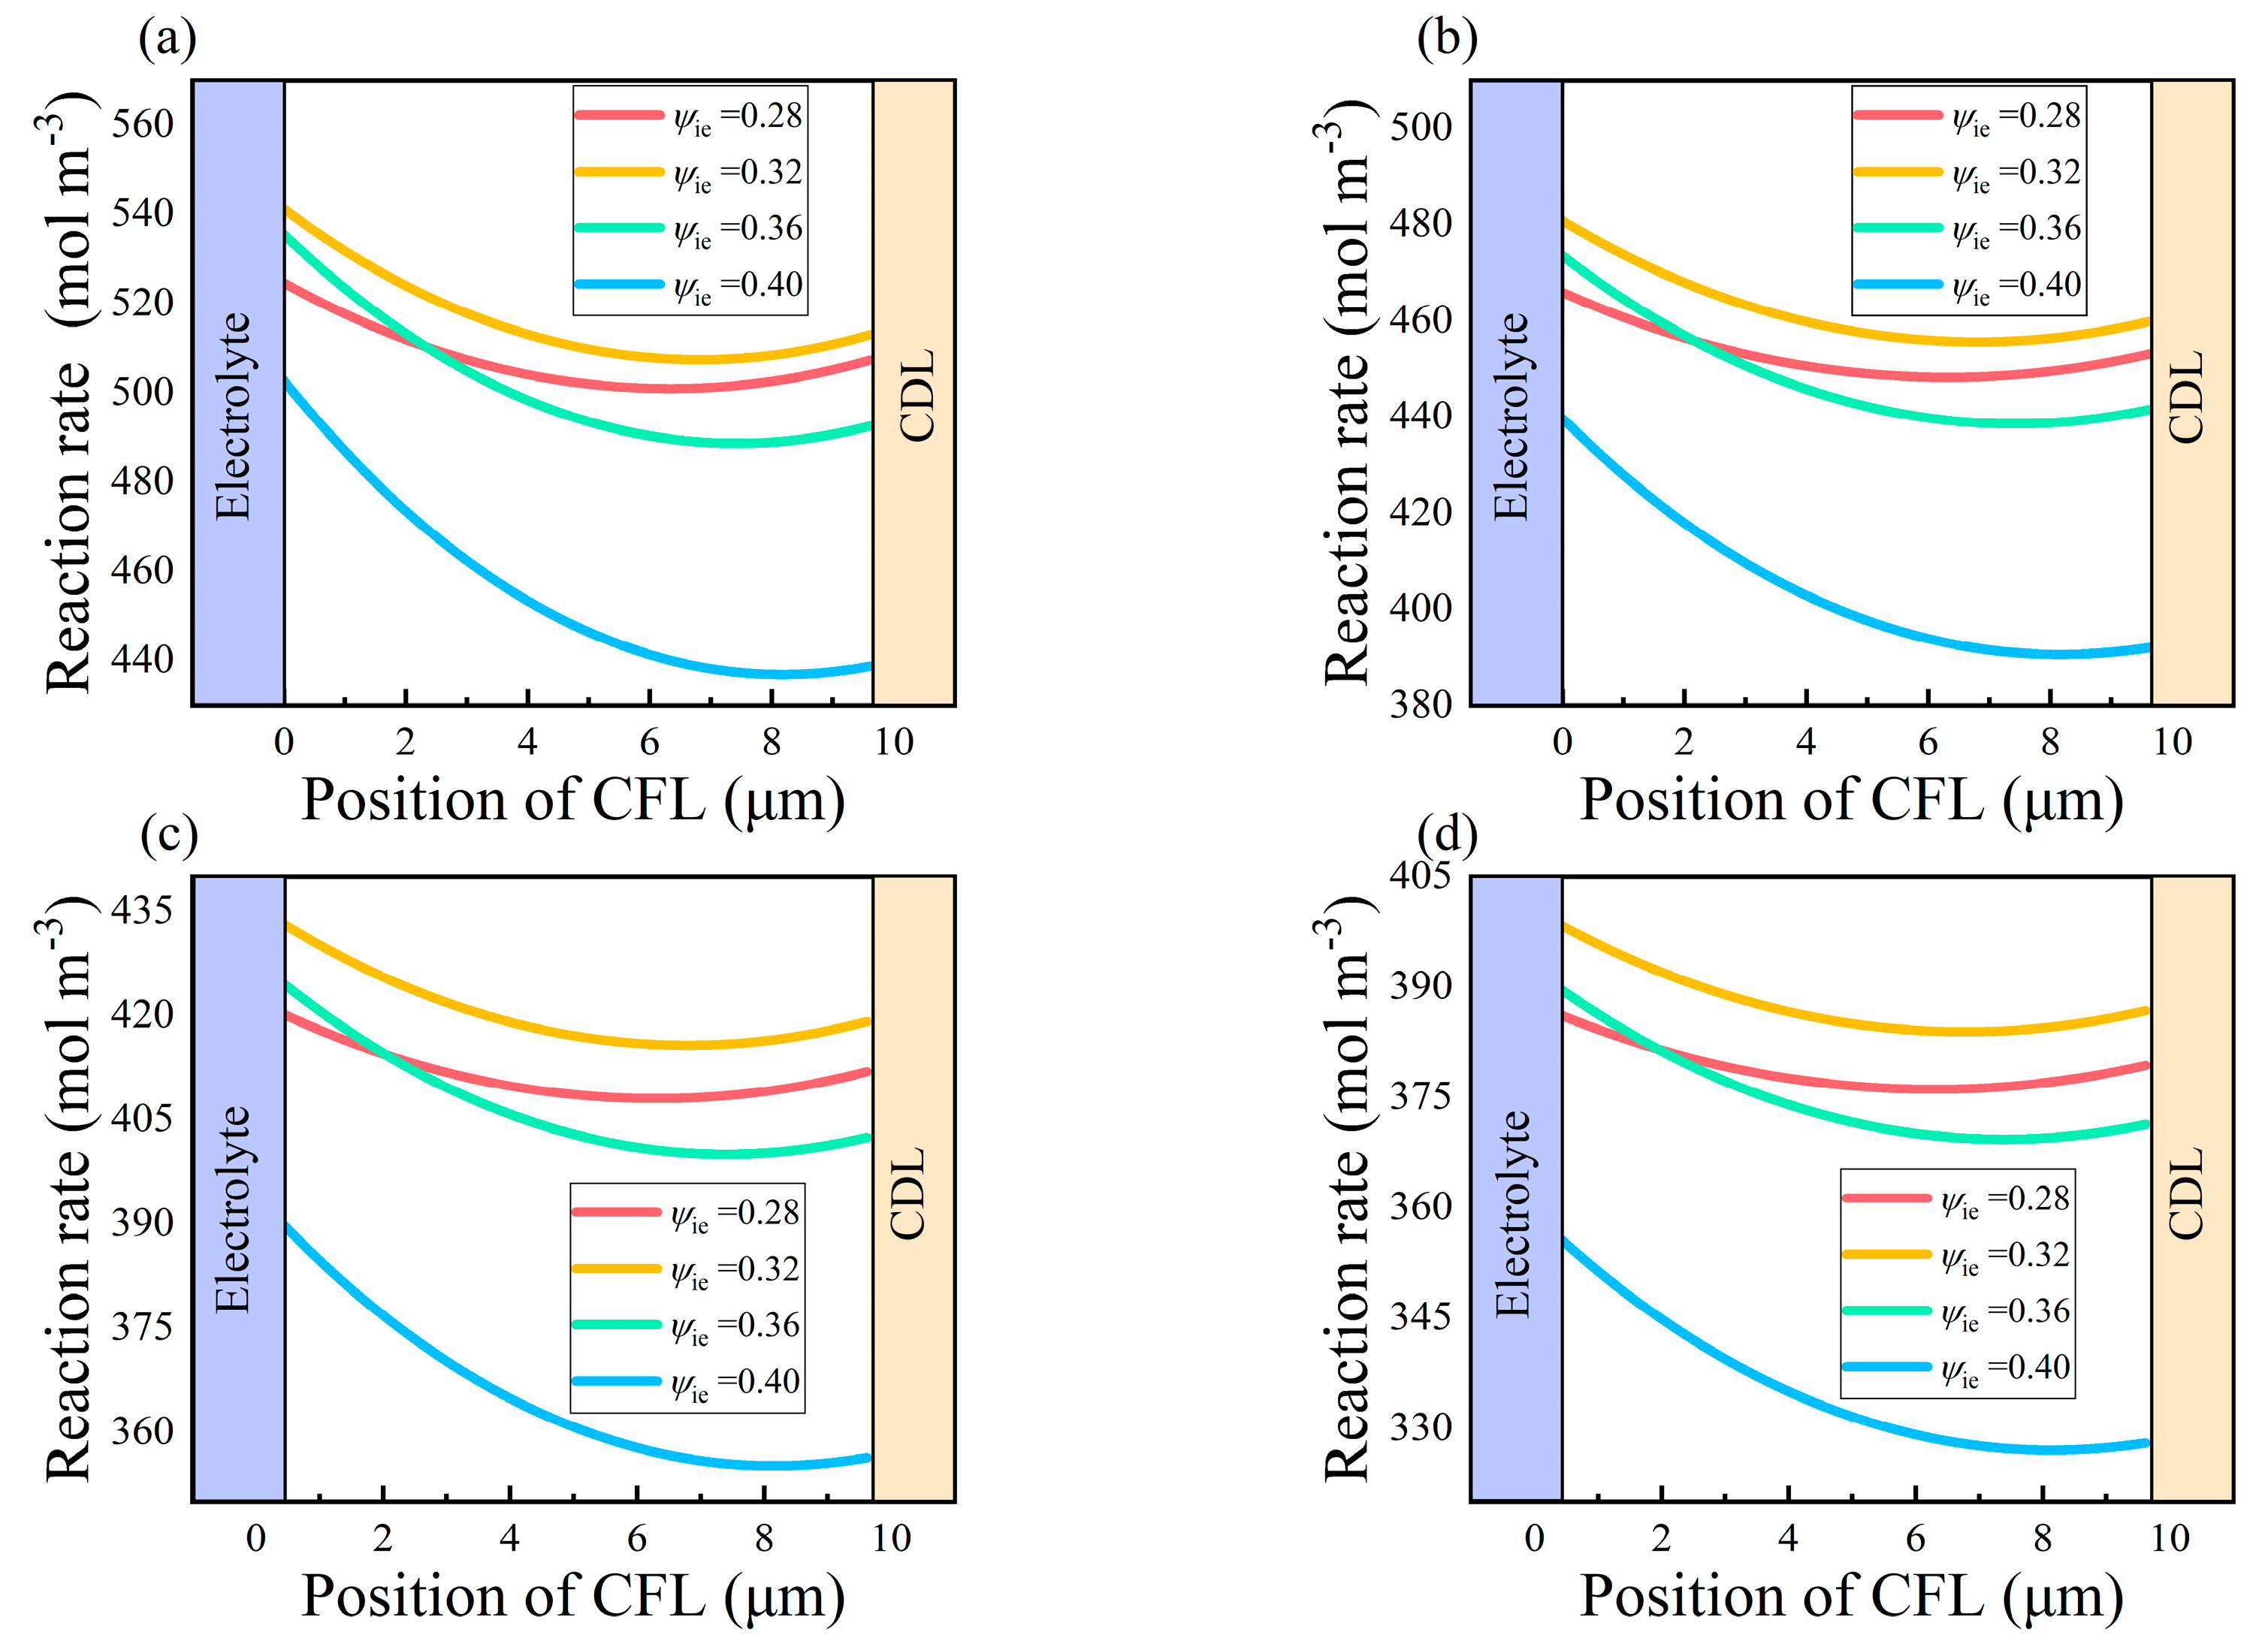
  • The maximum reaction rate inside the CFL increases by 32.64% when the radius of the electrode particle is reduced from 0.5 μm to 0.3 μm. It reaches the maximum in the area near the electrolyte. The optimal value of ψie in the CFL is determined to be 0.32 according to its effects on the mass transport processes and electrochemical reactions.
These also indicate that the performance analysis of the IT-SOEC unit with a double-layer composite electrode can be realized by solving the three-dimensional multi-scale model proposed in this study. This will further help to provide guidance for the design of the electrode structure on the mesoscopic scale and for the numerical analysis of the water electrolysis in IT-SOECs. In the future, the transient terms would be introduced to the governing equations to analyze the dynamic response of IT-SOECs with different internal structural parameters of composite electrodes. Moreover, a radiative transfer equation would also be involved in the solution of the multi-scale model to reflect the influence of radiative heat transfer on the temperature distribution and electrolysis performance of IT-SOECs.

Author Contributions

Conceptualization, Z.F. and Y.L.; Methodology, Y.L. and Y.S.; Validation, Z.F. and Y.S.; Formal analysis, Z.F. and Y.L.; Investigation, Y.L. and Y.S.; Writing—original draft preparation, Y.L., Y.S., and J.L.; Writing—review and editing, Z.F. and Y.S.; Supervision, Q.Z., Z.F., and J.L.; Funding acquisition, J.L. All authors have read and agreed to the published version of the manuscript.

Funding

This study is supported by the National Key R&D Program of China (No. 2021YFB4001602).

Data Availability Statement

Not applicable.

Conflicts of Interest

The authors declare no conflict of interest.

Nomenclature

AeffTPBEffective TPB area of per unit volume (m2/m3)
CpSpecific heat capacity (J/(kg·K))
DBinary diffusion coefficient (m2/s)
EactReaction activation energy (J/mol)
FFaraday constant (C/mol)
iionIonic current density (A/m2)
ielecLocal current density (A/m2)
i0Exchange current density (A/m2)
jAdjustable parameters
kAdjustable parameters
MMole mass (kg/mol)
mAdjustable parameters
nElectrons numbers involved in the reaction
PTPBPressure on the TPB interface (atm)
PrefPressure under the reference state (atm)
PieProbability of electrode particle belonging to percolated clusters
PioProbability of electrolyte particle belonging to percolated clusters
pOperating pressure (atm)
QionNet reaction ion current density (A/m2)
QheatHeat source (W/m3)
QohmOhmic heat source (W/m3)
QrevReversible heat source (W/m3)
QirrIrreversible heat source (W/m3)
RUniversal gas constant (J/(mol·K))
rParticle radius (μm)
SMolar entropy (J/(mol·K))
TOperating temperature (K)
Greek Symbols
αTransfer coefficient
γPre-exponential factor (A/m2)
δieElectronic conductivity (S/m)
δioIonic conductivity (S/m)
δeffEffective conductivity (S/m)
ηOverpotential (V)
ηactActivation overpotential (V)
θContact angle between the electronic and ionic particles (°)
λThermal conductivity (W/(m·K))
λeffEffective thermal conductivity (W/(m·K))
τFluid tortuosity factor
Superscripts and Subscripts
anAnode
caCathode
elecElectronic
ieElectrode
ioElectrolyte
ionIonic
iGas species
pGas-phase
TPBThree-phase boundary

References

  1. Ebbesen, S.D.; Knibbe, R.; Mogensen, M. Co-electrolysis of steam and carbon dioxide in solid oxide cells. J. Electrochem. Soc. 2012, 159, F482–F489. [Google Scholar] [CrossRef] [Green Version]
  2. Shimada, H.; Fujimaki, Y.; Fujishiro, Y. Highly active and durable La0.4Sr0.6MnO3-δ and Ce0.8Gd0.2O1.9 nanocomposite electrode for high-temperature reversible solid oxide electrochemical cells. Ceram. Int. 2020, 46, 19617–19623. [Google Scholar] [CrossRef]
  3. Tan, K.; Yan, X.M.; Zhu, Z.Y.; Zhou, M.Y.; Tian, F.Y.; Liu, J. Solid oxide cells with cermet of silver and gadolinium-doped-ceria symmetrical electrodes for high-performance power generation and water electrolysis. Int. J. Hydrogen Energy 2022, 47, 25090–25103. [Google Scholar] [CrossRef]
  4. Jolaoso, L.A.; Asadi, J.; Duan, C.; Kazempoor, P. A novel green hydrogen production using water-energy nexus framework. Energy Convers. Manag. 2023, 276, 116344. [Google Scholar] [CrossRef]
  5. Hauch, A.; Küngas, R.; Blennow, P.; Hansen, A.B.; Hansen, J.B.; Mathiesen, B.V.; Mogensen, M.B. Recent advances in solid oxide cell technology for electrolysis. Science 2020, 370, eaba6118. [Google Scholar] [CrossRef]
  6. Abbasi, T.; Abbasi, S.A. ‘Renewable’ hydrogen: Prospects and challenges. Renew. Sust. Energy Rev. 2011, 15, 3034–3040. [Google Scholar] [CrossRef]
  7. Min, G.B.; Choi, S.; Hong, J.S. A review of solid oxide steam-electrolysis cell systems: Thermodynamics and thermal integration. Appl. Energy 2022, 328, 120145. [Google Scholar] [CrossRef]
  8. Lei, B.; Boulfrad, S.; Traversa, E. Steam electrolysis by solid oxide electrolysis cells (SOECs) with proton-conducting oxides. Chem. Soc. Rev. 2014, 43, 8255–8270. [Google Scholar] [CrossRef]
  9. Meng, H.J.; Tian, N.; Qu, Y.M.; Wang, M.; Zhao, S.; Yu, J. Improved performance of a lanthanum strontium manganite–based oxygen electrode for an intermediate-temperature solid oxide electrolysis cell realized via ionic conduction enhancement. Ceram. Int. 2019, 45, 7945–7949. [Google Scholar] [CrossRef]
  10. Wang, Z.W.; Mori, M.; Araki, T. Steam electrolysis performance of intermediate-temperature solid oxide electrolysis cell and efficiency of hydrogen production system at 300 Nm3 h−1. Int. J. Hydrogen Energy 2010, 35, 4451–4458. [Google Scholar] [CrossRef]
  11. Chen, T.; Liu, M.Q.; Yuan, C.; Zhou, Y.C.; Ye, X.F.; Zhang, Z.L.; Xia, C.R.; Wang, S.R. High performance of intermediate temperature solid oxide electrolysis cells using Nd2NiO4+δ impregnated scandia stabilized zirconia oxygen electrode. J. Power Sources 2015, 276, 1–6. [Google Scholar] [CrossRef]
  12. Liu, S.M.; Yu, B.; Zhang, W.Q.; Zhai, Y.C.; Chen, J. Electrochemical performance of Co-containing mixed oxides as oxygen electrode materials for intermediate-temperature solid oxide electrolysis cells. Int. J. Hydrogen Energy 2016, 41, 15952–15959. [Google Scholar] [CrossRef]
  13. Gaudillere, C.; Navarrete, L.; Serra, J.M. Syngas production at intermediate temperature through H2O and CO2 electrolysis with a Cu-based solid oxide electrolyzer cell. Int. J. Hydrogen Energy 2014, 39, 3047–3054. [Google Scholar] [CrossRef]
  14. Liu, C.L.; Ma, B.; Lin, Z.; Zhou, Y.K.; Wu, K.M. Exploring (1-x)CuFe2O4-xGd0.1Ce0.9O1.95 composites as the cathode materials for solid oxide fuel cells. Mater. Lett. 2022, 325, 132860. [Google Scholar] [CrossRef]
  15. Guo, M.T.; He, Q.J.; Cheng, C.; Zhao, D.Q.; Ni, M. New interconnector designs for electrical performance enhancement of solid oxide fuel cells: A 3D modelling study. J. Power Sources 2022, 533, 231373. [Google Scholar] [CrossRef]
  16. Fu, Z.G.; Wang, Z.J.; Li, Y.W.; Li, J.F.; Shao, Y.; Zhu, Q.Z.; Weng, P.F. Effects of composite electrode structure on performance of intermediate-temperature solid oxide electrolysis cell. Energies 2022, 15, 7173. [Google Scholar] [CrossRef]
  17. Li, H.; Su, C.X.; Wang, C.Q.; Lü, Z. Electrochemical performance evaluation of FeCo2O4 spinel composite cathode for solid oxide fuel cells. J. Alloys Compd. 2020, 829, 154493. [Google Scholar] [CrossRef]
  18. Araújo, A.J.M.; Loureiro, F.J.A.; Raimundo, R.A.; Macedo, D.A.; Paskocimas, C.A.; Fagg, D.P. The effects of polarisation on the performance of the Ba2Co9O14-Ce0.8Gd0.2O2-δ composite electrode for fuel cells and electrolysers. Int. J. Hydrogen Energy 2022, 47, 11270–11278. [Google Scholar] [CrossRef]
  19. Nechache, A.; Hody, S. Alternative and innovative solid oxide electrolysis cell materials: A short review. Renew. Sust. Energ. Rev. 2021, 149, 111322. [Google Scholar] [CrossRef]
  20. Dumortier, M.; Sanchez, J.; Keddam, M.; Lacroix, O. Theoretical considerations on the modelling of transport in a three-phase electrode and application to a proton conducting solid oxide electrolysis cell. Int. J. Hydrogen Energy 2012, 37, 11579–11594. [Google Scholar] [CrossRef] [Green Version]
  21. Rashidi, R.; Karimi, N.; Sunden, B.; Kim, K.C.; Olabi, A.G.; Mahian, O. Progress and challenges on the thermal management of electrochemical energy conversion and storage technologies: Fuel cells, electrolysers, and supercapacitors. Prog. Energy Combust. 2022, 88, 100966. [Google Scholar] [CrossRef]
  22. Kim, S.; Joh, D.W.; Lee, D.Y.; Lee, J.; Kim, H.S.; Khan, M.Z.; Hong, J.E.; Lee, S.B.; Park, S.J.; Song, R.H.; et al. Microstructure tailoring of solid oxide electrolysis cell air electrode to boost performance and long-term durability. Chem. Eng. J. 2021, 410, 128318. [Google Scholar] [CrossRef]
  23. Mehran, M.T.; Khan, M.Z.; Lee, S.B.; Lim, T.H.; Park, S.; Song, R.H. Improving sulfur tolerance of Ni-YSZ anodes of solid oxide fuel cells by optimization of microstructure and operating conditions. Int. J. Hydrogen Energy 2018, 43, 11202–11213. [Google Scholar] [CrossRef]
  24. Bertei, A.; Nucci, B.; Nicolella, C. Microstructural modeling for prediction of transport properties and electrochemical performance in SOFC composite electrodes. Chem. Eng. Sci. 2013, 101, 175–190. [Google Scholar] [CrossRef]
  25. Ni, M.; Leung, M.K.H.; Leung, D.Y.C. Micro-scale modelling of solid oxide fuel cells with micro-structurally graded electrodes. J. Power Sources 2007, 168, 369–378. [Google Scholar] [CrossRef]
  26. Vijay, P.; Tadé, M.O.; Shao, Z.P. Model based evaluation of the electrochemical reaction sites in solid oxide fuel cell electrodes. Int. J. Hydrogen Energy 2019, 44, 8439–8459. [Google Scholar] [CrossRef]
  27. Li, Z.; Zhang, H.; Xu, H.R.; Xuan, J. Advancing the multiscale understanding on solid oxide electrolysis cells via modelling approaches: A review. Renew. Sust. Energy Rev. 2021, 141, 110863. [Google Scholar] [CrossRef]
  28. Monaco, F.; Effori, E.; Hubert, M.; Siebert, E.; Geneste, G.; Morel, B.; Djurado, E.; Montinaro, D.; Laurencin, J. Electrode kinetics of porous Ni-3YSZ cermet operated in fuel cell and electrolysis modes for solid oxide cell application. Electrochim. Acta 2021, 389, 138765. [Google Scholar] [CrossRef]
  29. Théodon, L.; Laurencin, J.; Hubert, M.; Cloetens, P.; Debayle, J. A stochastic geometrical 3D model for time evolution simulation of microstructures in SOC-electrodes. Comp. Mater. Sci. 2022, 212, 111568. [Google Scholar] [CrossRef]
  30. Hubert, M.; Laurencin, J.; Cloetens, P.; Sliva, J.C.D.; Lefebvre-Joud, F.; Bleuet, P.; Nakajo, A.; Siebert, E. Role of microstructure on electrode operating mechanisms for mixed ionic electronic conductors: From synchrotron-based 3D reconstruction to electrochemical modeling. Solid State Ion. 2016, 294, 90–107. [Google Scholar] [CrossRef]
  31. Beale, S.B.; Andersson, M.; Boigues-Muñoz, C.; Frandsen, H.L.; Lin, Z.J.; Mcphail, S.J.; Ni, M.; Sundén, B.; Weber, A.; Weber, A.Z. Continuum scale modelling and complementary experimentation of solid oxide cells. Prog. Energy Combust. Sci. 2021, 85, 100902. [Google Scholar] [CrossRef]
  32. Kushi, T. Heat balance of dry reforming in solid oxide fuel cell systems. Int. J. Hydrogen Energy 2017, 42, 11779–11787. [Google Scholar] [CrossRef]
  33. Chen, D.F.; Bi, W.X.; Kong, W.; Lin, Z.J. Combined micro-scale and macro-scale modeling of the composite electrode of a solid oxide fuel cell. J. Power Sources 2010, 195, 6598–6610. [Google Scholar] [CrossRef]
  34. Moussaoui, H.; Sharma, R.K.; Debayle, J.; Gavet, Y.; Delette, G.; Laurencin, J. Microstructural correlations for specific surface area and triple phase boundary length for composite electrodes of solid oxide cells. J. Power Sources 2019, 412, 736–748. [Google Scholar] [CrossRef]
  35. Wei, Y.H.; Bao, C.; Jiang, Z.Y.; Zhang, X.X. Numerical study on TPB density and percolation properties of microstructure reconstruction of nickel/yttria stabilized zirconia cermet anode based on discrete element method. Int. J. Hydrogen Energy 2022, 47, 28061–28073. [Google Scholar] [CrossRef]
  36. Li, W.Y.; Shi, Y.X.; Luo, Y.; Cai, N.S. Theoretical modeling of air electrode operating in SOFC mode and SOEC mode: The effects of microstructure and thickness. Int. J. Hydrogen Energy 2014, 39, 13738–13750. [Google Scholar] [CrossRef]
  37. Shi, Y.X.; Cai, N.S.; Li, C.; Bao, C.; Croiset, E.; Qian, J.Q.; Hu, Q.; Wang, S.R. Modeling of an anode-supported Ni-YSZ|Ni-ScSZ|ScSZ|LSM-ScSZ multiple layers SOFC cell: Part II. Simulations and discussion. J. Power Sources 2007, 172, 235–245. [Google Scholar] [CrossRef]
  38. Wu, C.R.; Yang, Z.R.; Huo, S.; Najmi, A.U.H.; Du, Q.; Jiao, K. Modeling and optimization of electrode structure design for solid oxide fuel cell. Int. J. Hydrogen Energy 2018, 43, 14648–14664. [Google Scholar] [CrossRef]
  39. Ni, M.; Leung, M.K.H.; Leung, D.Y.C. Mathematical modeling of the coupled transport and electrochemical reactions in solid oxide steam electrolyzer for hydrogen production. Electrochim. Acta 2007, 52, 6707–6718. [Google Scholar] [CrossRef]
  40. Navasa, M.; Graves, C.; Chatzichristodoulou, C.; Theis, L.S.; Sundén, B.; Frandsen, H.L. A three-dimensional multiphysics model of a solid oxide electrochemical cell: A tool for understanding degradation. Int. J. Hydrogen Energy 2018, 43, 11913–11931. [Google Scholar] [CrossRef]
  41. Wang, Y.; Wu, C.R.; Wang, Y.; Yang, Z.B.; Du, Q.; Jiao, K. Assessment of CO2 enrichment mechanism in integrated coal gasification fuel cell combined cycle system with carbon capture. Front. Energy Res. 2023, 10, 1017829. [Google Scholar] [CrossRef]
  42. Ni, M. An electrochemical model for syngas production by co-electrolysis of H2O and CO2. J. Power Sources 2012, 202, 209–216. [Google Scholar] [CrossRef] [Green Version]
  43. Sun, Y.; Zheng, W.J.; Ji, S.Y.; Sun, A.; Shuai, W.; Zheng, N.; Han, Y.; Xiao, G.; Ni, M.; Xu, H.R. Dynamic behavior of high-temperature CO2/H2O co-electrolysis coupled with real fluctuating renewable power. Sustain. Energy Technol. 2022, 52, 102344. [Google Scholar] [CrossRef]
  44. Luo, Y.; Shi, Y.X.; Li, W.Y.; Cai, N.S. Comprehensive modeling of tubular solid oxide electrolysis cell for co-electrolysis of steam and carbon dioxide. Energy 2014, 70, 420–434. [Google Scholar] [CrossRef]
  45. Newman, J.S.; Thomas-Alyea, K.E. Electrochemical Systems, 3rd ed.; John Wiley & Sons Ltd.: Hoboken, NJ, USA, 2004; pp. 449–486. [Google Scholar]
  46. Astaneh, M.; Maggiolo, D.; Ström, H. Finite-size effects on heat and mass transfer in porous electrodes. Int. J. Therm. Sci. 2022, 179, 107610. [Google Scholar] [CrossRef]
  47. Todd, B.; Young, J.B. Thermodynamic and transport properties of gases for use in solid oxide fuel cell modelling. J. Power Sources 2002, 110, 186–200. [Google Scholar] [CrossRef]
  48. Mehran, M.T.; Yu, S.B.; Lee, D.Y.; Hong, J.E.; Lee, S.B.; Park, S.J.; Song, R.H.; Lim, T.H. Production of syngas from H2O/CO2 by high-pressure coelectrolysis in tubular solid oxide cells. Appl. Energy 2018, 212, 759–770. [Google Scholar] [CrossRef]
  49. Recalde, M.; Amladi, A.; Venkataraman, V.; Woudstra, T.; Aravind, P.V. Thermodynamic analysis of supercritical water gasification combined with a reversible solid oxide cell. Energy Convers. Manag. 2022, 270, 116208. [Google Scholar] [CrossRef]
  50. Weng, F.B.; Dlamini, M.M.; Jung, G.B.; Lian, C.X. Analyses of reversible solid oxide cells porosity effects on temperature reduction. Int. J. Hydrogen Energy 2020, 45, 12170–12184. [Google Scholar] [CrossRef]
  51. Völker, B.; McMeeking, R.M. Impact of particle size ratio and volume fraction on effective material parameters and performance in solid oxide fuel cell electrodes. J. Power Sources 2012, 215, 199–215. [Google Scholar] [CrossRef]
  52. Timurkutluk, B.; Ciflik, Y.; Altan, T.; Genc, O. Synthetical designing of solid oxide fuel cell electrodes: Effect of particle size and volume fraction. Int. J. Hydrogen Energy 2022, 47, 31446–31458. [Google Scholar] [CrossRef]
Figure 1. Geometric model of the IT-SOEC.
Energies 16 02525 g001
Figure 2. Schematic diagram of the mesostructure of the composite electrode.
Energies 16 02525 g002
Figure 3. Comparison with experimental data for operation at 850 °C with 40% and 60% H2O input [48], and at 800 °C with 80% H2O input [22].
Energies 16 02525 g003
Figure 4. Flux distribution in CFL and CDL under different CDL porosity: (a) in CFL; (b) in CFL along the z-axis; (c) in CDL; and (d) in CDL along the z-axis.
Energies 16 02525 g004
Figure 5. The distribution of density and velocity of the working fluid in the CDL under different CDL porosities.
Energies 16 02525 g005
Figure 6. The distribution of electrochemical reaction rates in the CFL under different CDL porosities: (a) along x-axis direction; (b) at L1; (c) at L2; and (d) at L3.
Energies 16 02525 g006
Figure 7. Typical indicators of electrolysis performance in the CFL under different CDL porosities: (a) activation overpotential; (b) concentration overpotential; (c) ion current density and power density; and (d) heat source.
Energies 16 02525 g007
Figure 8. The mass flux in the mass transport process of the CFL under different ψie and rie: (a) total mass flux; (b) molecular diffusion flux; and (c) convection flux.
Energies 16 02525 g008
Figure 9. The mass flux in the mass transport process of the CFL along the z-axis direction under different ψie and rie: (a) total flux; (b) molecular diffusion flux; and (c) convection flux.
Energies 16 02525 g009
Figure 10. Typical indicators of electrolysis performance in the CFL under different ψie and rie: (a) ohmic heat source; (b) reversible heat source; (c) irreversible heat source; and (d) effective percolation TPB area.
Energies 16 02525 g010
Figure 11. The electrolysis reaction rate inside CFL along the z-axis direction under different ψie at: (a) rie = 0.3 μm; (b) rie = 0.4 μm; (c) rie = 0.5 μm; and (d) rie = 0.6 μm.
Energies 16 02525 g011
Table 1. Geometric parameters and basic operating parameters.
ParametersValue
Channel width0.5 mm
Channel height0.5 mm
Channel length10 cm
Rib width0.25mm
Cathode width1 mm
Thickness of CDL300 μm
Thickness of CFL10 μm
Thickness of anode diffusion layer (ADL)30 μm
Thickness of AFL15 μm
Thickness of electrolysis layer10 μm
Operating pressure1 atm
Operating temperature973.15 K
Table 2. Modeling parameters.
ParametersValue
Thermal conductivity of composite cathode6.23 W/(m·K)
Thermal conductivity of composite anode9.6 W/(m·K)
Thermal conductivity of electrolyte2.7 W/(m·K)
Heat capacity of composite cathode420 J/(kg·K)
Heat capacity of composite anode390 J/(kg·K)
Heat capacity of electrolyte420 J/(kg·K)
Table 3. Parameter analysis.
Porosity of CDLElectrode Phase Volume FractionParticle Radius
ψp of CDL0.3–0.70.40.4
ψie0.320.28–0.40.28–0.4
rie (μm)110.3–0.6
Table 4. Geometric parameters and basic operating parameters for model validation.
ParametersValue
Electrolyte thickness9.82 μm [48], 7.27 μm [22]
Composite cathode thickness11.7 μm [48], 48.2 μm [22]
Composite anode thickness16.8 μm [48], 37.5 μm [22]
Operating pressure1 atm [22,48]
Cathode flowrate150 mL/min [48], 500 mL/min [22]
Anode flowrate300 mL/min [48], 300 mL/min [22]
Disclaimer/Publisher’s Note: The statements, opinions and data contained in all publications are solely those of the individual author(s) and contributor(s) and not of MDPI and/or the editor(s). MDPI and/or the editor(s) disclaim responsibility for any injury to people or property resulting from any ideas, methods, instructions or products referred to in the content.

