Article

Air Conditioning Operation Strategies for Comfort and Indoor Air Quality in Taiwan’s Elementary Schools

1
Department of Electrical Engineering, National Cheng Kung University, Tainan 701, Taiwan
2
Department of Mechanical and Energy Engineering, National Chiayi University, Chiayi 600, Taiwan
*
Author to whom correspondence should be addressed.
Energies 2023, 16(5), 2493; https://doi.org/10.3390/en16052493
Submission received: 8 February 2023 / Revised: 2 March 2023 / Accepted: 4 March 2023 / Published: 6 March 2023
(This article belongs to the Section B: Energy and Environment)

Abstract

:
The Executive Yuan in Taiwan plans to install air-conditioning (A/C) in all elementary schools within two years. However, besides the associated energy consumption and environmental issues, the use of A/C will inevitably result in the doors and windows of the classroom being closed, which will increase the accumulation of carbon dioxide (CO2) within the classroom. An excessive indoor CO2 concentration can result in reduced cognitive performance and an impaired learning efficiency. Therefore, the moderate introduction of external air into the classroom is essential to increase the air exchange rate (AER) and reduce the CO2 concentration level. Accordingly, the present study conducts a numerical investigation into the effects of various A/C operation strategies on the CO2 concentration within the classroom given different proportions of students remaining in the classroom during the recess. Overall, the results indicate that the optimal usage strategy is to operate the A/C over the full school day (08:00~15:50 p.m.) in conjunction with a mechanical ventilation system providing a fresh air exchange rate of 5 l/s for every person in the room. However, the use of a mechanical ventilation system inevitably incurs an additional hardware and energy consumption. Thus, an alternative recommendation is also proposed, in which the windows are opened and the air conditioner is turned off at every recess and during the lunchtime period. It is shown that the resulting CO2 concentration in the classroom is still consistent with the Taiwan Environmental Protection Administration (EPA) regulations and the thermal comfort of the students is achieved for more than three-quarters of the school day.

1. Introduction

Taiwan’s summer temperatures continue to hit record highs. This poses a significant challenge to local education authorities in providing a cool and comfortable learning environment for the students. Schools have turned increasingly to ceiling fans, water mist systems, natural ventilation, strategically-placed windows, sun visor systems, and so on, to reduce the temperature in the classroom. Local authorities have also encouraged students to wear cool, breathable and comfortable clothing in order to reduce their body temperature. However, it has become apparent that such measures are no longer sufficient, and more drastic steps are required. Accordingly, the Executive Yuan in Taiwan plans to install air-conditioning (A/C) in all elementary schools throughout Taiwan within two years [1]. However, while this will undoubtably improve student comfort, it will also have significant energy consumption and environmental implications. Furthermore, the use of A/C will inevitably result in the doors and windows of the classroom being closed, thereby degrading the indoor air quality (IAQ). Thus, in considering the ramifications of the proposed policy, it is necessary to consider not only the energy consumption and environmental issues, but also the impact of the policy on students’ health and learning efficiency.
In a clean indoor environment, the concentration of CO2 is close to that in the atmosphere, i.e., around 400 ppm [2]. However, in rooms with poor ventilation, or containing a large number of occupants, the concentration of CO2 (and other contaminants) rises rapidly. Many studies have shown that an excessive CO2 concentration can result in breathing difficulties, headaches, lethargy, hyporeflexia, and fatigue. Furthermore, in classroom environments, high CO2 levels reduce students’ cognitive performance and degrade their learning efficiency [3]. According to the World Health Organization (WHO), buildings with poor IAQ may induce a wide variety of unpleasant side-effects, including inflammation of the eyes, nose and throat, dry mucous membranes and skin, mental fatigue, inattention, headache, nausea and dizziness, nasal congestion, difficulty breathing and chest tightness. Indoor pollutants responsible for this so-called Sick Building Syndrome (SBS) include particulate matter (PM), volatile organic compounds (VOCs), and oxidizing gases, such as nitrogen dioxide (NO2) and ozone. However, the CO2 concentration is also regarded as a powerful indicator of the IAQ and plays a key role in determining the SBS effect. Thus, according to the review of Seppanen et al. [4], the indoor CO2 concentration should be maintained at a level lower than 800 ppm in order to protect the occupants’ health and well-being. The literature shows that different ventilation strategies have different effects on improving air quality and removing contaminants [5,6].
Many studies have reported a direct correlation between the IAQ and the performance and health of the students. The impact of the IAQ on student health is particularly severe in young children (e.g., 7 to 12 years old) since their bodies are still developing, and hence they are particularly susceptible to respiratory infections [7,8]. In addition, their learning performance is significantly dependent on their mental concentration, which depends in turn largely on the level of fresh air in the classroom. One of the main causes of poor IAQ, particularly in poorly-ventilated environments, is the CO2 exhaled by the occupants as part of the natural respiratory cycle. In school settings, the CO2 concentration within the classroom varies with the number of students in the room, the usage time of the classroom, the amount of outdoor fresh air entering the room, the size of the classroom, and the outdoor CO2 concentration. The ASTM International Ventilation Guide [9] states that the CO2 concentration in indoor spaces should be less than 1000 ppm to protect human health and wellbeing. Thus, developing effective classroom management policies and ventilation strategies is essential in controlling the CO2 concentration within the classroom and improving the students’ performance and health as a result.
Although CO2 itself is not considered to be an indoor air pollutant, a high CO2 concentration frequently indicates insufficient ventilation. Generally speaking, the CO2 concentration level is easily measured using inexpensive real-time digital air monitoring equipment. As a result, it provides a simple and cost-effective means of evaluating the air quality in indoor environments and determining the adequacy (or otherwise) of the existing ventilation. Wang et al. [10] examined the average indoor CO2 concentration in a classroom environment fitted with a mechanical ventilation system and found that while the system promoted the rapid dilution of the indoor air pollutants, the distribution of the pollutants became increasingly uneven as the mechanical ventilation rate increased. Mechanical ventilation systems are widely used for improving the IAQ. However, such systems not only incur an initial procurement cost, but also an ongoing energy and maintenance cost. Thus, in practice, it is frequently necessary to optimize the usage of the ventilation system in some way as to maintain a reasonable IAQ while simultaneously reducing the energy consumption. Kusiak et al. [11] employed a multi-objective optimization model to maintain the IAQ in a HVAC-controlled environment within a certain user-defined range subject to an imposed constraint on the energy cost. Xaman et al. [12] emphasized the importance of exploiting natural ventilation to improve the thermal comfort and air quality of indoor environments. The ASHRAE standard [13] recommends a minimum ventilation rate of 8 l/s per person and a recommended ventilation rate of 10 l/s for maintaining an acceptable IAQ. However, in a survey of 156 schools in Washington and Idaho, Prill et al. [14] found that most of the schools lacked sufficient ventilation. Furthermore, regardless of whether or not mechanical ventilation systems were installed, 42% of the common classrooms and 66% of the portable classrooms surveyed showed CO2 levels higher than 1000 ppm. You et al. [15] investigated the ventilation conditions in various university settings in China and derived the air exchange rate (AER) from the measured CO2 concentration attenuation curves. The results showed that the average AER in the considered classrooms varied in the range of 1.1 to 1.6 h−1.
Allen et al. [16] showed that CO2 concentrations as low as 1000 ppm produce a moderate reduction in the decision-making ability of adults, while concentrations higher than 2500 ppm have a substantial effect [17]. Furthermore, many studies have reported a strong association between poor IAQ and adverse health effects in children, including asthma, absenteeism and poor test scores [18,19,20,21,22]. In addition, many studies have shown that schools in the US [19,22] and Europe [19,21,23,24] frequently lack sufficient fresh air supply, even when mechanical ventilation systems are installed. Chan et al. [25] surveyed the CO2 level in 104 classrooms equipped with a new type of HVAC system in the US, and found that all of the classrooms had an excessive CO2 concentration as a result of poor ventilation due to incorrect HVAC installation or lack of maintenance. The authors suggested that the inadequate ventilation rate was a major contributory factor in explaining the low student learning efficiency and high level of absenteeism observed in the class. Johnson et al. [26] used a transient mass balance modeling approach to examine the fresh air ventilation rate in the third-grade classrooms of 12 elementary schools in in the US under cold, warm and mild season conditions. The results revealed that most of the surveyed classrooms lacked adequate fresh air ventilation. Moreover, the inadequacy of the ventilation varied with both changes in the class size and the seasonal conditions. Fisk [27] reviewed many published studies on the impact of CO2 in the classroom, and concluded that higher ventilation rates can improve the learning efficiency of students by as much as 15%. However, it was recognized that this performance improvement is obtained at the expense of a higher energy consumption and cost.
As discussed above, the Executive Yuan in Taiwan plans to install air-conditioning (A/C; split air conditioners, brands and models are handed over to county and city governments for centralized procurement) in all elementary schools in Taiwan within two years. However, while this move has been broadly welcomed by the public in terms of its effect in creating a more conducive learning environment, there are concerns regarding the associated energy consumption and environmental implications. Moreover, the effects of the closed-door policy resulting from the use of A/C on the IAQ in the classroom is also an important concern. Accordingly, the present study conducts a numerical investigation into the CO2 concentration in a typical elementary school classroom in Taiwan with particular regard to the effects of the A/C operation strategy (i.e., the turn-on and turn-off time) and proportion of students (0%, 50% and 100%) remaining within the classroom during the recess periods. Based on the simulation results, five recommendations for possible A/C operation strategies are devised, where these recommendations are ranked in terms of the extent to which they satisfy the Taiwan EPA guidelines for the indoor concentration of CO2 (1000 ppm) and the Executive Yuan requirement for thermal comfort throughout the entire school day. The results provide a useful source of reference for implementing the proposed A/C policy of the Executive Yuan in elementary schools in Taiwan, and are expected to be instrumental in improving the learning efficiency, health and well-being of young students as a result.

2. Analysis

Assuming that the internal air is fully mixed, and taking the classroom as the control volume, the change in CO2 in the classroom over time is equal to the amount of CO2 produced by the schoolchildren minus the amount of CO2 removed by ventilation. That is,
V d C i n d o o r d t = n × G s Q C i n d o o r C o u t d o o r ,
where n is the number of people within the classroom, Gs is the CO2 generation rate of each schoolchild, Cindoor is the CO2 concentration within the classroom, Coutdoor is the CO2 concentration in the outdoor environment, Q is the volume flow rate of inlet air, and V is the volume of the classroom.
If all the parameters shown in Equation (1) are constant (i.e., do not vary over time), and the initial CO2 concentration in the classroom ( C i n d o o r t = 0 ) is denoted as C0, Equation (1) reduces to a first-order linear ordinary differential equation and has a theoretical solution as follow
C i n d o o r = C o u t d o o r + n × G s Q + C 0 C o u t d o o r n × G s Q e Q V t .
Turanjanin et al. [23] proposed the following theoretical equation for the CO2 concentration in an empty classroom:
C i n d o o r = C o u t d o o r + C 0 C o u t d o o r e Q V t .
It is seen that Equation (3) is simply a special case of Equation (2) for the case of n = 0. Hence, the validity of Equation (1) as the governing equation for solving the change in CO2 concentration over time is confirmed.

2.1. Numerical Analysis Method

As described in Section 1, the aim of the present study is to investigate the effects of the A/C usage strategy and proportion of students remaining within the classroom during the recess period on the IAQ. In performing the analysis, it is assumed that mechanical ventilation is not employed. As a result, n and Q both vary over time, and thus Equation (2) cannot be applied. Hence, the present simulations evaluate the CO2 concentration in the classroom under different conditions using the following finite difference equation derived from Equation (1):
C i n d o o r , i + 1 = C i n d o o r , i + t V n t × G s Q t × C i n d o o r , i C o u t d o o r ,
where  t  is the time interval and i is the time step.
The validity of the numerical model (Equation (4)) was investigated by comparing the simulation results for the CO2 concentration in the classroom with those obtained experimentally. The experimental results were obtained in a grade 11 classroom at a national girls’ school in southern Taiwan. The volume of classroom (V) is 248 m3. The class contained a total of 31 people (1 teacher and 30 students) and the only ventilation was that provided naturally by leaving the doors and windows open (i.e., the A/C was not turned on at any time). There was no one in the classroom before the experiment started, and the CO2 concentration inside and outside the classroom was equal because the doors and windows were open. After the experiment started at 08:00, teacher and students entered the classroom for class and did not leave until the end of the experiment at 10:00. CO2 measurements were obtained at 5-min intervals from 08:00 to 10:00 on the experimental day using two CO2 sensors (model: Telaire 7000). The accuracy of the Telaire 7000 CO2 sensor was ±40 ppm or ±3% of the reading (whichever was greater). One CO2 sensor was located in the center of the classroom, and the other CO2 sensor was located on the teacher’s desk. The CO2 concentration in the classroom was measured to be 420 ppm before the experiment started. In addition, since the doors and windows were open and the students were not indoors, it was assumed that the outdoor CO2 concentration was also 420 ppm. Because the experiment was only 2 h, it is also assumed that the outdoor CO2 concentration remains unchanged at 420 ppm.
In performing the numerical simulations, the number of people in the classroom (n) was set as 31 and the CO2 generation rate (Gs) was set as 0.0052 l/s for each individual in the classroom in accordance with the recommendation of Persily and Jonge [28]. (Note that the teacher was a 38-year-old male and 30 students were all female because of the girls’ school, being grade 11 students, their age was around 17 years old.) In addition, the classroom volume (V) was set as 248 m3 and natural ventilation rate with the A/C turned off (Q(t)) where assigned the values at  0.44   m 3 / s  based on the findings reported in [29]. The initial value of the CO2 concentration in the classroom (C0) is set equal to the outdoor CO2 concentration ( C o u t d o o r ), and is given a value of 420 ppm. The process of numerical simulation is as follows: First, substitute the parameter values such as n, V, Gs, Q, Coutdoor, and initial value (i.e., t = 0) of Cindoor (i.e., Cindoor,i=0 = C0 = 420 ppm) into Equation (4), then the value of Cindoor at the 1st time step (i.e., Cindoor,i=1) can thus be calculated. Then substitute this value back into Equation (4) to obtain the value of Cindoor at the 2nd time step (i.e., Cindoor,i=2). In this way, iteration of time step by time step can obtain the Cindoor value at all-time point. This study used Python language to write computer programs to perform this iteration calculation and to solve Equation (4). In order to ensure the accuracy, the time step in this study was set to 1 s.
Figure 1 compares the experimental and simulation results for the variation of the CO2 concentration level within the classroom over the considered two-hour period. (Note that the experimental values represent the average values obtained over the two measurements in each case.) It is seen that the experimental values fluctuate over the measurement period as a result of natural variations in the ventilation rate and an uneven diffusion of the CO2 respiratory concentration within the room. By contrast, the simulation results stabilize at a value of approximately 813 ppm at 08:40 and remain constant thereafter. The average experimental value of the CO2 concentration is equal to 787 ppm. Thus, the simulation and experimental results deviate by just 26 ppm (i.e., 3.2%). In other words, the basic validity of the numerical model is confirmed.

2.2. Student Timetable and Simulation Settings

Table 1 shows the daily timetable of a typical elementary school in Taiwan [30]. As shown, the school day runs from 07:35, when the students first arrive at school and check in with the homeroom teacher, until 15:50, when the last class finishes and the students leave school. The day consists of seven classes, each with a duration of forty minutes, separated by a recess period of 10~15 min. The morning classes finish at 12:00, and are followed by a lunchtime and teeth brushing period (40 min) and nap time (also 40 min).
Table 2 summarizes the parameter settings used in the present simulations. It is seen that the value assigned to the natural ventilation flow rate, Q, varies depending on the A/C operation strategy. Chang [29] has conducted air quality research on elementary school classrooms in Taiwan. Her research results show that the typical volume of elementary school classrooms in Taiwan is 248  m 3 , the average ventilation rate is 0.052   m 3 / s  when the doors and windows are closed, and the average ventilation rate is 0.44  m 3 / s  when the doors and windows are opened. According to Chang [29], the volume of the classroom is set as 248  m 3 , QAC/on is set as  0.052   m 3 / s  when the A/C is turned on (i.e., the classroom doors and windows are closed) and is increased to  0.44   m 3 / s  when the A/C is turned off (i.e., the classroom doors and windows are open). The number of people within the room (29 students and 1 teacher) is set in accordance with the regulations of the Ministry of Education of Taiwan [31]. The CO2 generation rate is set as 0.0052 l/s for the teacher and 0.0029 l/s for each elementary school student in the class in accordance with the study of Persily and Jonge [28]. In addition, the initial value of the CO2 concentration in the classroom (C0) is set equal to the outdoor CO2 concentration, and is given a value of 420 ppm in accordance with the findings of Chang et al. [32] for metropolitan areas of Taiwan.

2.3. A/C Operation Strategies

The study commenced by analyzing the variation of the CO2 concentration in the classroom over the school day for the two most common situations in elementary schools in Taiwan, namely (1) A/C is not installed and mechanical ventilation is not employed (Case 0) and (2) A/C is installed and is operated continuously (without mechanical fresh air ventilation) from 08:00 (mentor time) until 15:50 (end of school day) (Case 1). The simulations then considered a further hypothetical case in which the A/C was operated for the entire school day and mechanical ventilation was additionally applied at the rate needed to maintain the average CO2 concentration in the classroom at a level lower than 1000 ppm (as recommended by the Taiwan EPA) (Case 2).
In Cases 1 and 2, the A/C is operated continuously for the entire school day. Furthermore, in Case 2, mechanical ventilation is applied as required to maintain an average CO2 concentration of less than 1000 ppm. However, while both cases maximize the thermal comfort of the students, they also greatly increase the energy consumption. Accordingly, the present study considers two additional strategies aimed at reducing the energy expenditure while still maintaining the thermal comfort, namely (1) turning off the A/C (or delaying the turn-on time) and opening the classroom windows for natural ventilation during certain periods of the day, and (2) encouraging the students to leave the classroom and spend time outdoors during the recess periods.
Regarding the first strategy, the temperature in the morning is invariably cooler than that at midday or in the mid-to-late afternoon. Accordingly, the potential exists to reduce the energy consumption by delaying the time at which the A/C is turned on. Thus, three further cases were investigated in which the A/C was not turned on until the beginning of the 1st (08:45), 2nd (09:35) and 3rd (10:30) classes, respectively (see Cases 3~5 in Table 3). Referring to Table 1, the period of 12:00~12:40 in each school day is assigned to eating lunch and brushing teeth. Since this period is a non-class period and is associated with both a frequent movement of students in and out of the classroom and a need to ventilate the room in order to remove food smells, the scope exists to turn of the A/C for the entire period. Moreover, the 6th class (14:15–14:55) is frequently assigned to physical education or lessons in other classrooms (e.g., the computer skills classroom), and thus this period (together with the recess times before and after it) can also be treated as a non-A/C usage period (14:05–15:10). Accordingly, a further eight cases were defined in which the A/C was turned off during the lunch and brushing period and was or was not turned on in the 6th class (see Cases 6~9 and 10~13 in Table 3, respectively). A final case was then defined in which the A/C was turned on from the beginning of the mentor time (08:00) to the end of the school day (15:50), but was turned off every recess and during the lunch and teeth brushing period (Case 14).
Regarding the second strategy, namely that of encouraging the students to leave the classroom during the recess periods, for each of the 14 cases described above, the simulations considered three different proportions of students leaving the classroom, namely 0%, 50% and 100%, respectively. (Note that the corresponding situations are denoted as (a), (b) and (c) for each case in Table 3).
This study used the Python language to write computer programs to solve Equation (4) and its corresponding operation strategies (cases 0–14). Due to (1) turning off the A/C (or delaying the turn-on time) and opening the classroom windows for natural ventilation during certain periods of the day, and (2) encouraging the students to leave the classroom and spend time outdoors during the recess periods. Both of these need to be considered in the numerical simulations.

3. Results and Discussion

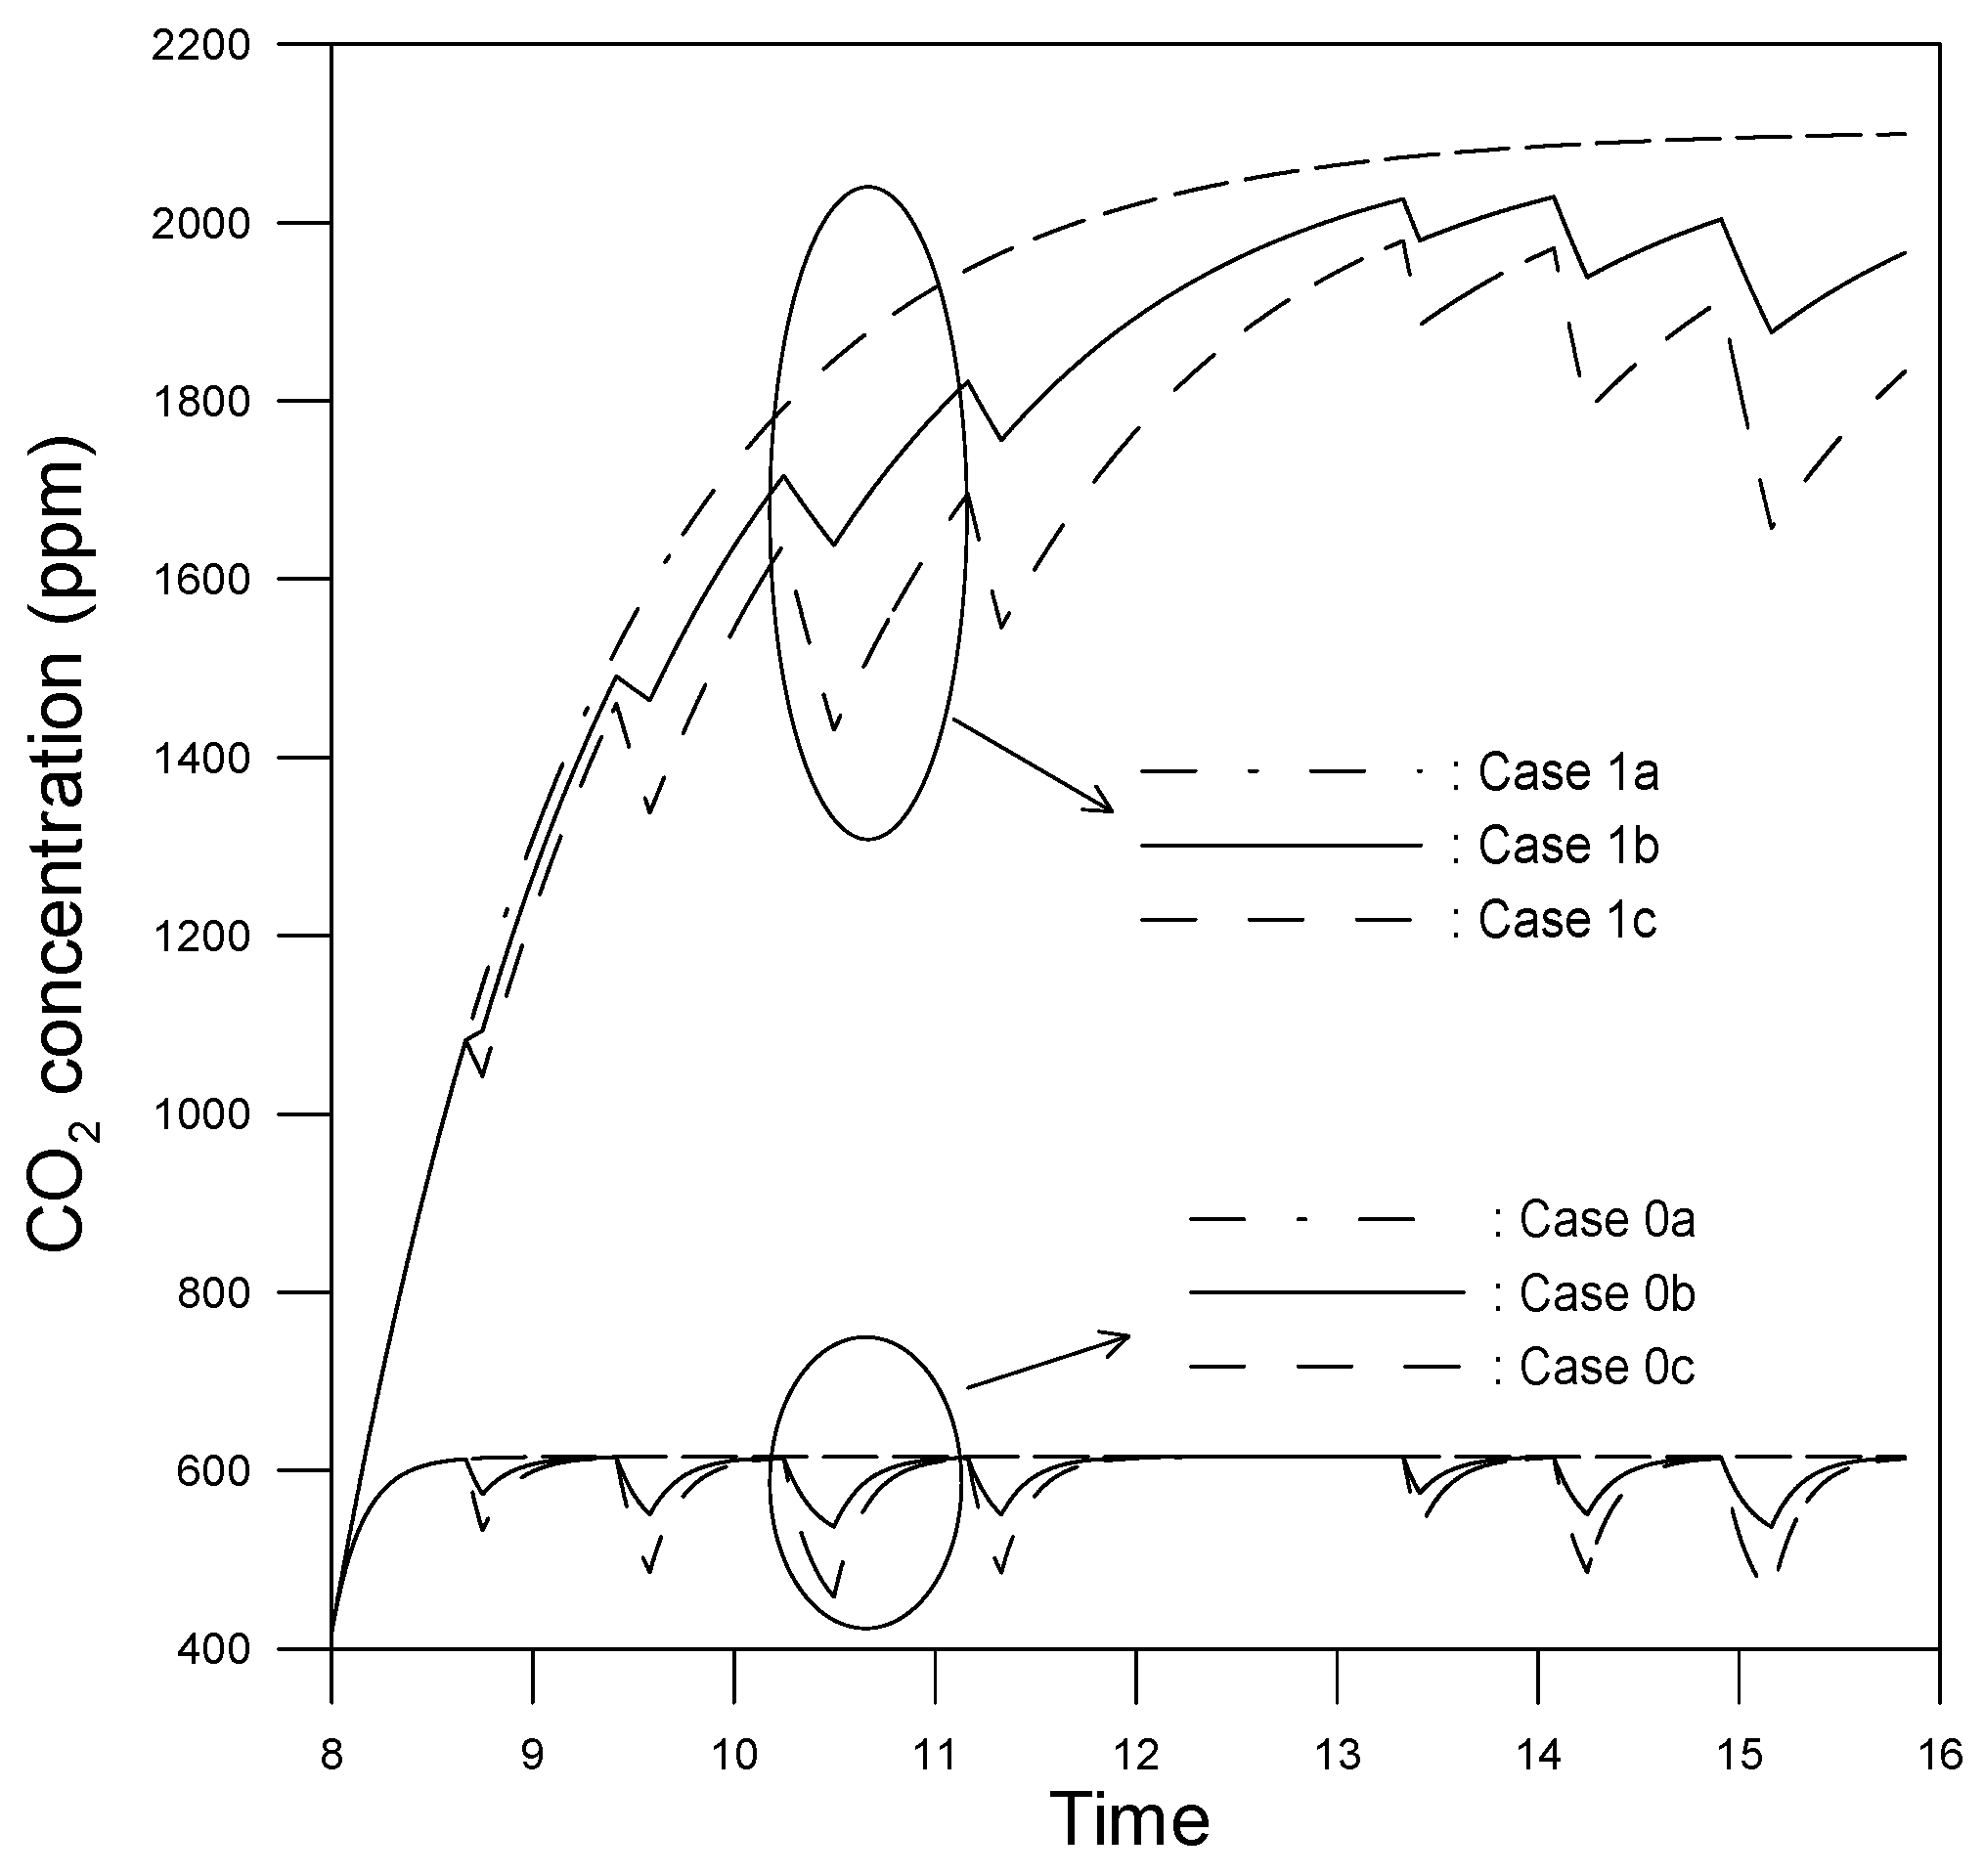
3.1. Current Situation (Case 0) and A/C Operated all Day without Mechanical Fresh Air Ventilation (Case 1)

Figure 2 shows the simulation results for the variation of the CO2 concentration in the considered elementary school classroom for the current A/C usage situation (i.e., no A/C installed, Case 0) and the case where the A/C is run all day (i.e., 08:00~15:50) without mechanical fresh air ventilation (Case 1). For the Case 0 condition, the CO2 concentration varies between 459 and 616 ppm. In other words, the 8-h average CO2 concentration is less than the EPA requirement (1000 ppm), irrespective of whether or not the students leave the classroom during the recess period. For the Case 1 condition, the CO2 concentration rises rapidly from the moment the A/C is turned on and approaches a value significantly higher than that in the Case 0 condition within 90 min. A close inspection of the simulation results shows that for the case where none of the students leave the classroom during the recess period (i.e., Case 1(a)), the CO2 concentration exceeds the EPA standard of 1000 ppm at 08:34 and exceeds 2000 ppm at 11:43. Moreover, the CO2 concentration reaches a maximum value of 2099 ppm at the end of the school day (15:50). The average CO2 concentration over the period of 08:00~15.50 is thus equal to 1818 ppm. When all of the students leave the classroom during the recess periods (Case 1(c)), the CO2 concentration drops rapidly during each break period, and then increases once again when the class resumes. As shown, the CO2 concentration exceeds 1000 ppm at 08:34 and reaches a maximum value of 1979 pm at 13:20 (end of nap time). The average CO2 concentration over the school day (08:00~15.50) is found to be 1612 ppm, which is lower than that of Case 1(a), but still significantly higher than the EPA standard of 1000 ppm. As expected, when 50% of the students leave the classroom during the recess periods (Case 1(b)), the CO2 concentration values lie between those of Cases 1(a) and 1(b), respectively, and the average CO2 concentration over the school day is equal to 1715 ppm.
In general, the results presented for Case 1 in Figure 2 show that encouraging the students to leave the classroom during the recess periods leads to an effective reduction in the average CO2 concentration in the classroom. However, the 8-h average CO2 concentration is still higher than the EPA standard of 1000 ppm. In other words, running the A/C continuously all day with the assistance of natural ventilation only degrades the IAQ in the classroom and thus has a negative impact on the health and learning efficiency of the students.

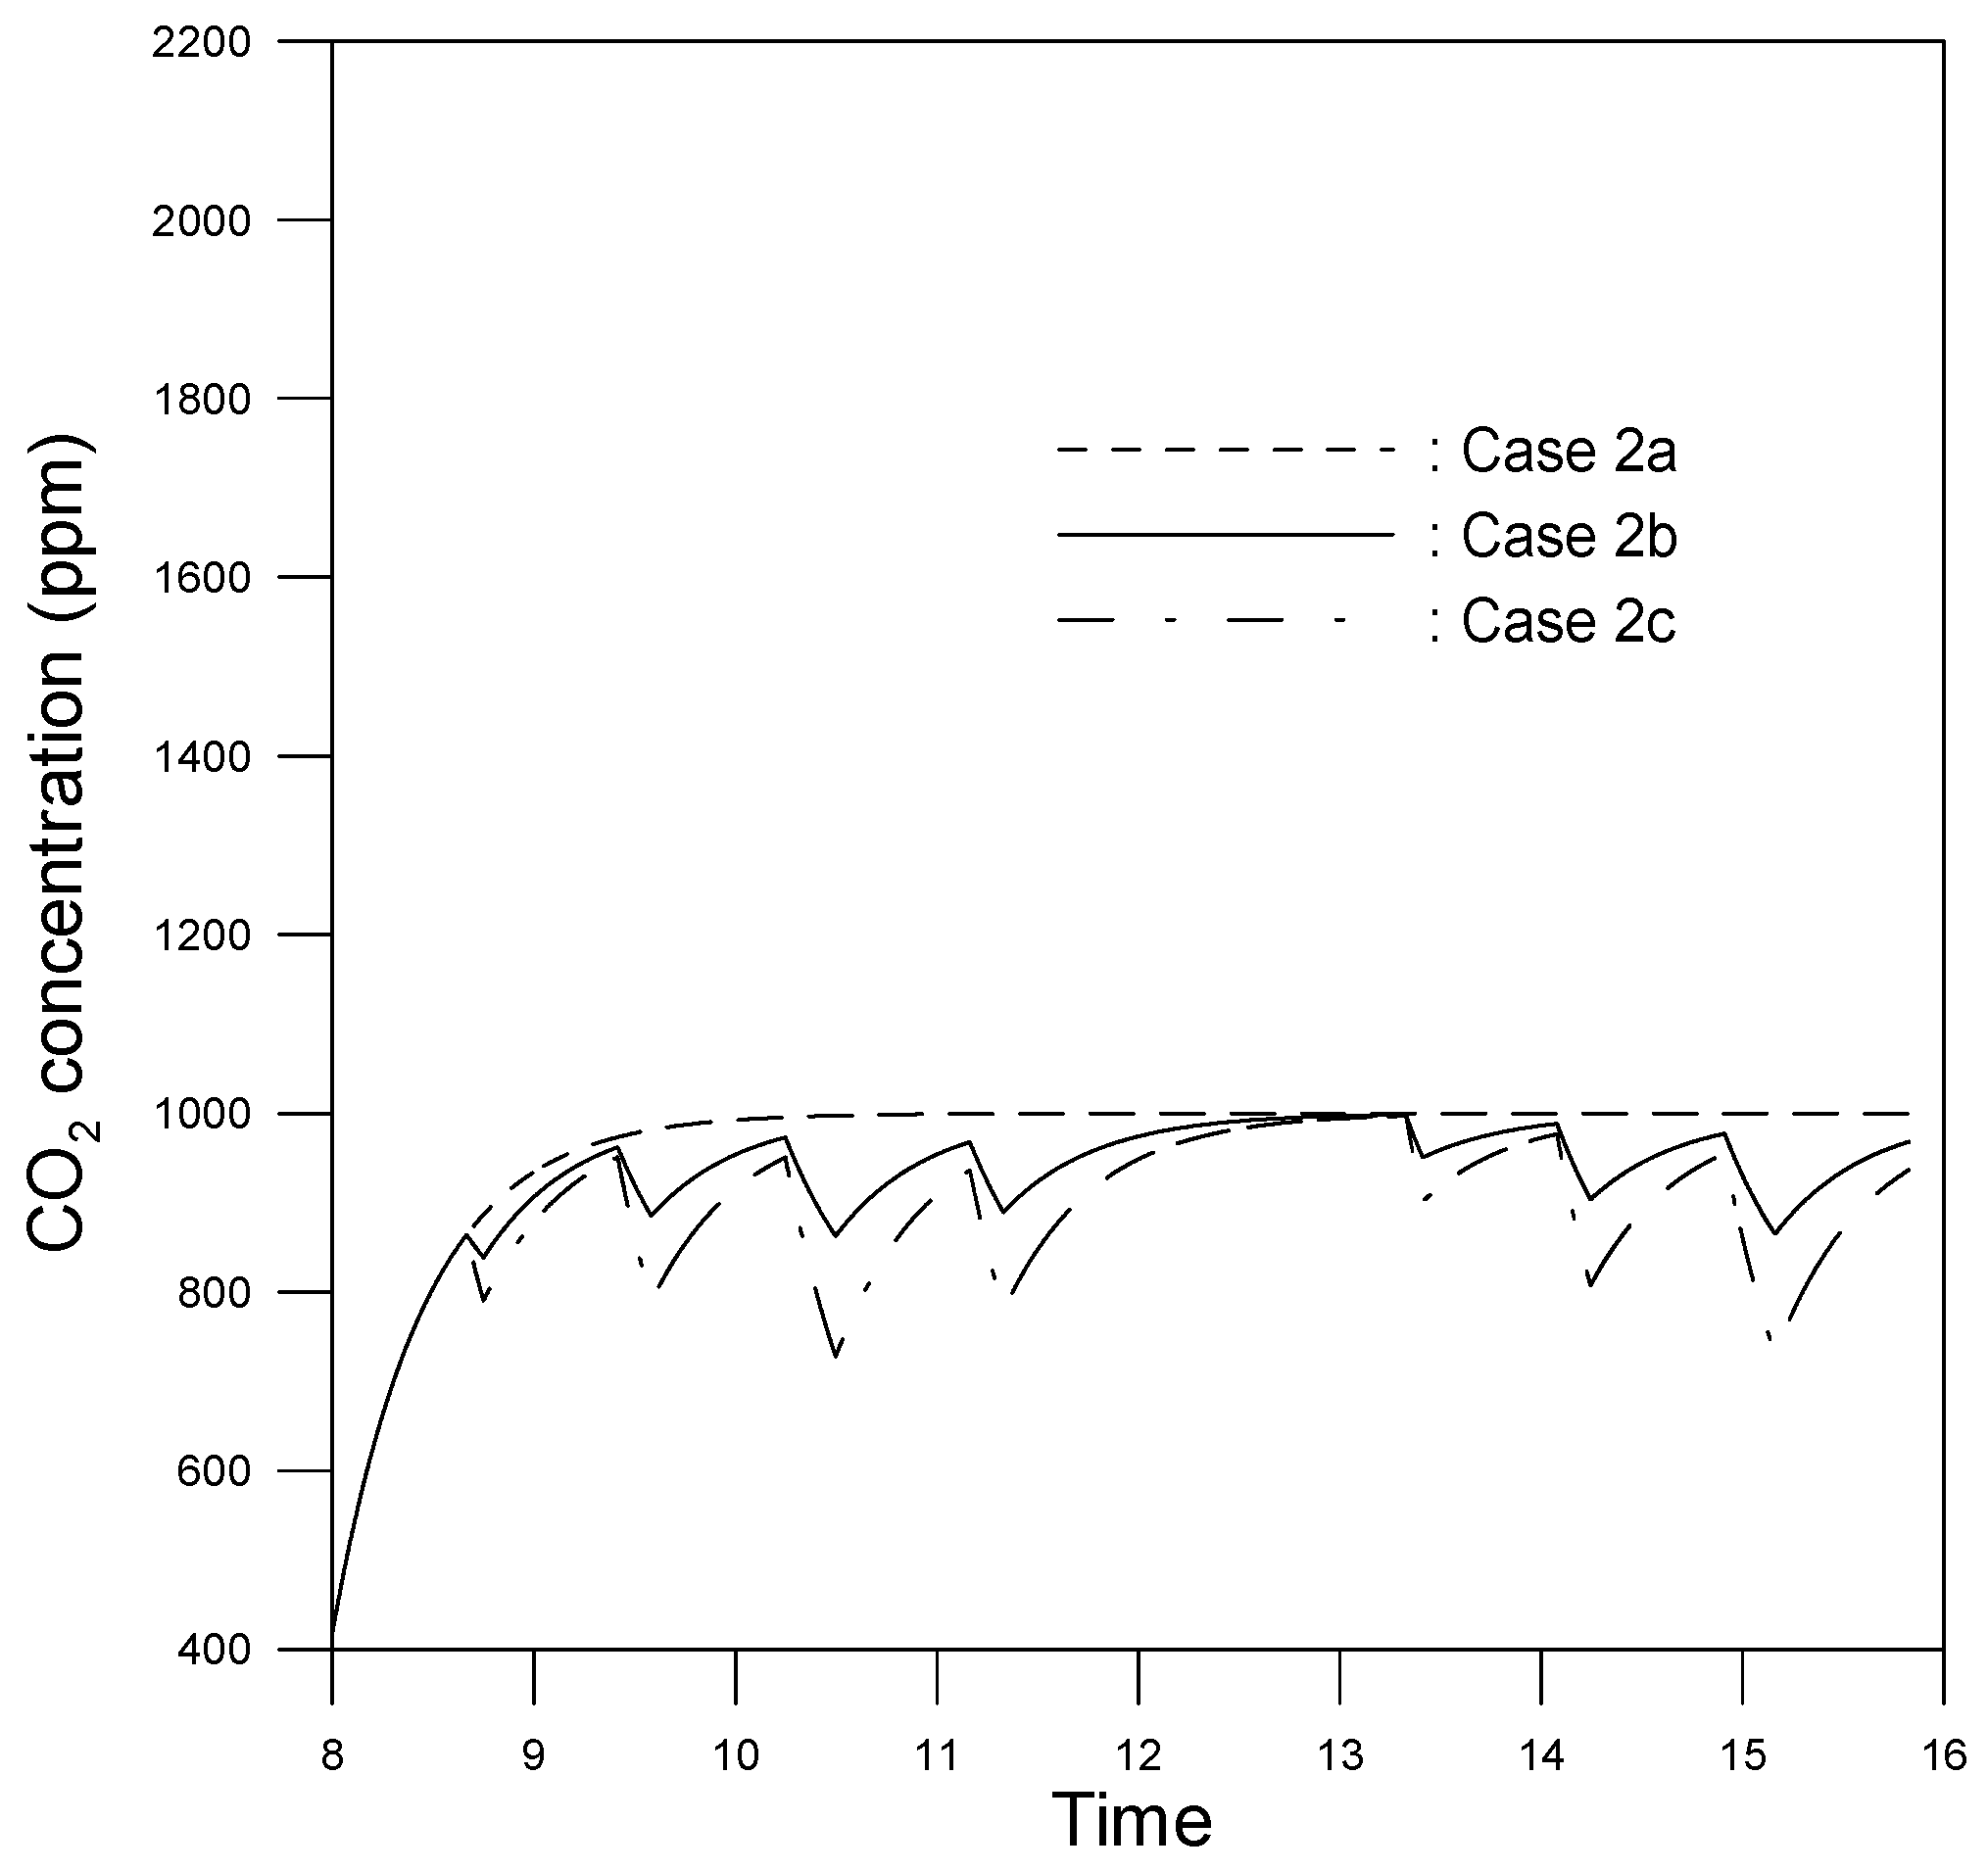
3.2. Installation of Mechanical Fresh Air Ventilation System (Case 2)

To address the problem described above, a further series of simulations was performed in which the A/C was again assumed to be operated for the entire school day, but a mechanical fresh air ventilation system was additionally used to maintain the average CO2 concentration at a level lower than 1000 ppm (Case 2 in Table 3). From a process of trial-and-error, the minimum mechanical fresh air flow rate was determined to be 5 l/s per person; corresponding to  Q m e c h  = 0.09  m 3 / s  for the considered case of 1 teacher and 29 elementary school students. Figure 3 shows the corresponding simulation results for the variation of the CO2 concentration in the classroom over the course of the school day for various proportions of students remaining within the classroom during the recess periods. As shown, when none of the students leave the classroom (Case 2(a)), the CO2 concentration stabilizes at a value of about 996 ppm at around 10:30. Moreover, for Cases 2(b) and 2(c), in which half of the students and all of the students, respectively, leave the classroom, the average CO2 concentration is around 952 ppm and 909 ppm. Notably, all three values are lower than the EPA threshold of 1000 ppm. Overall, the results show that if the A/C is to be run for the entire school day in order to maximize the thermal comfort of the students, an additional mechanical fresh air ventilation system should be installed to provide a ventilation rate of 5 l/s per person in order to achieve the EPA standard of an 8-h average CO2 concentration of less than 1000 ppm, irrespective of whether or not the students leave the classroom during the recess periods.

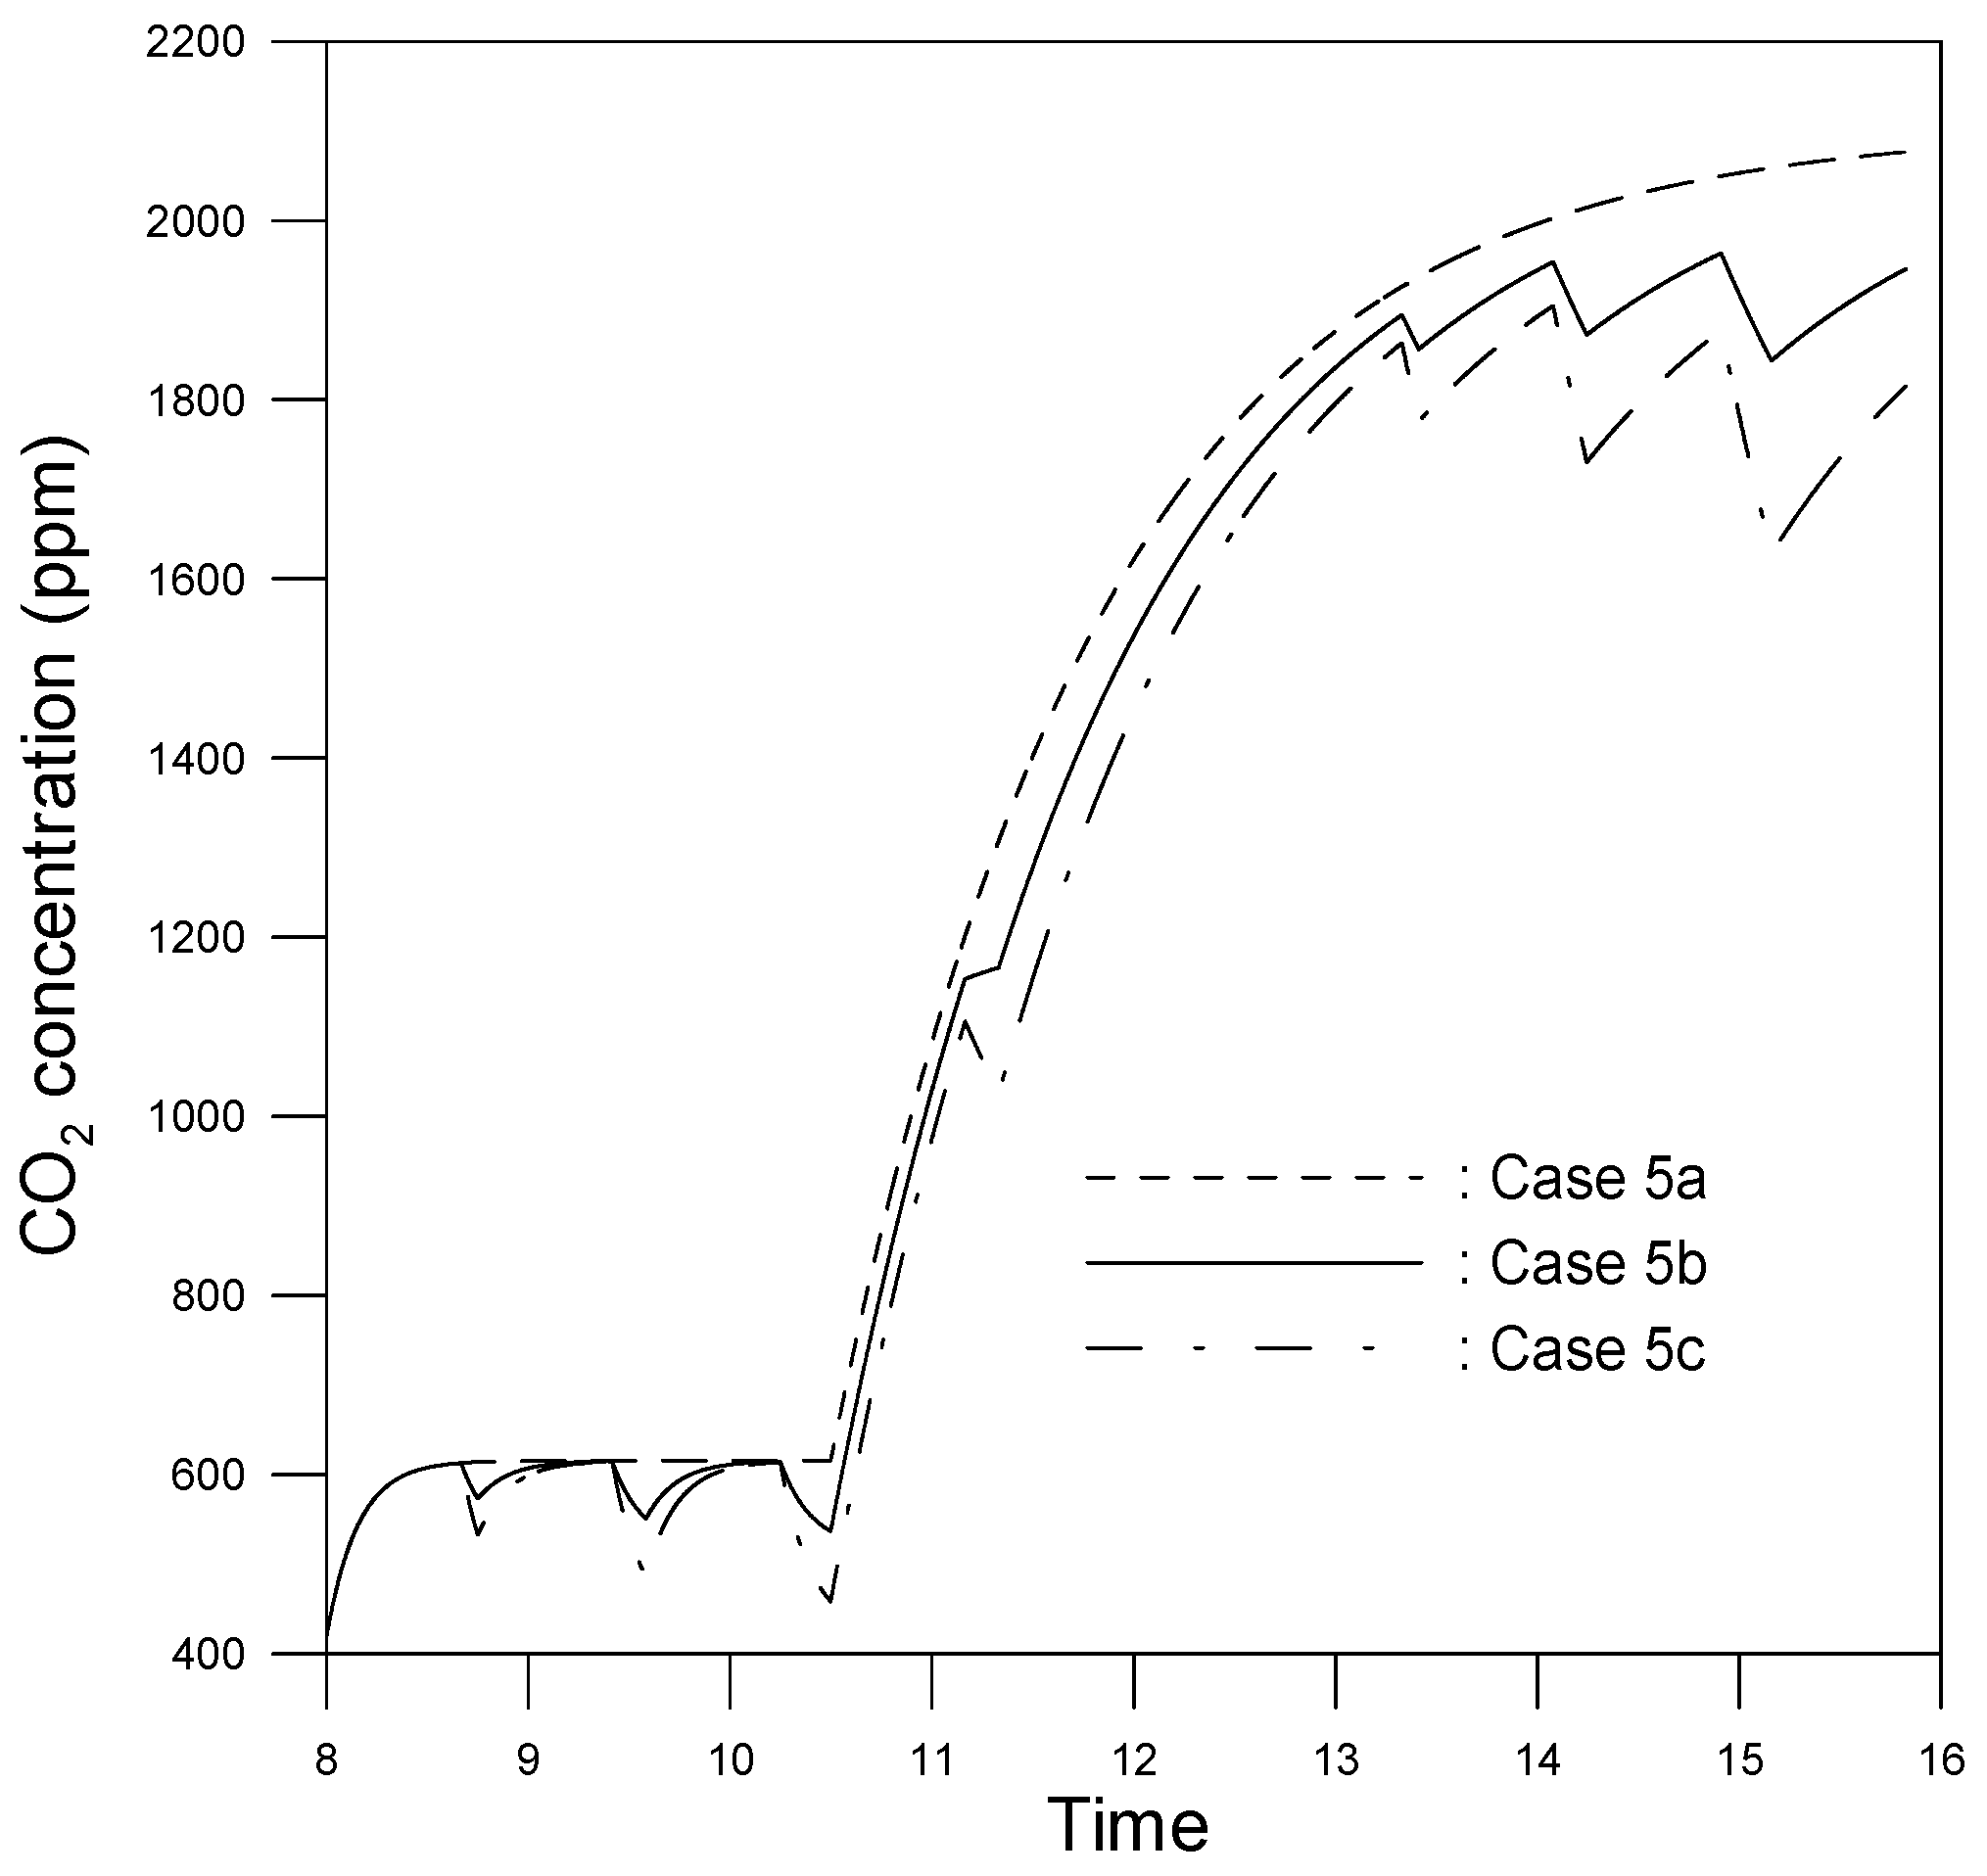
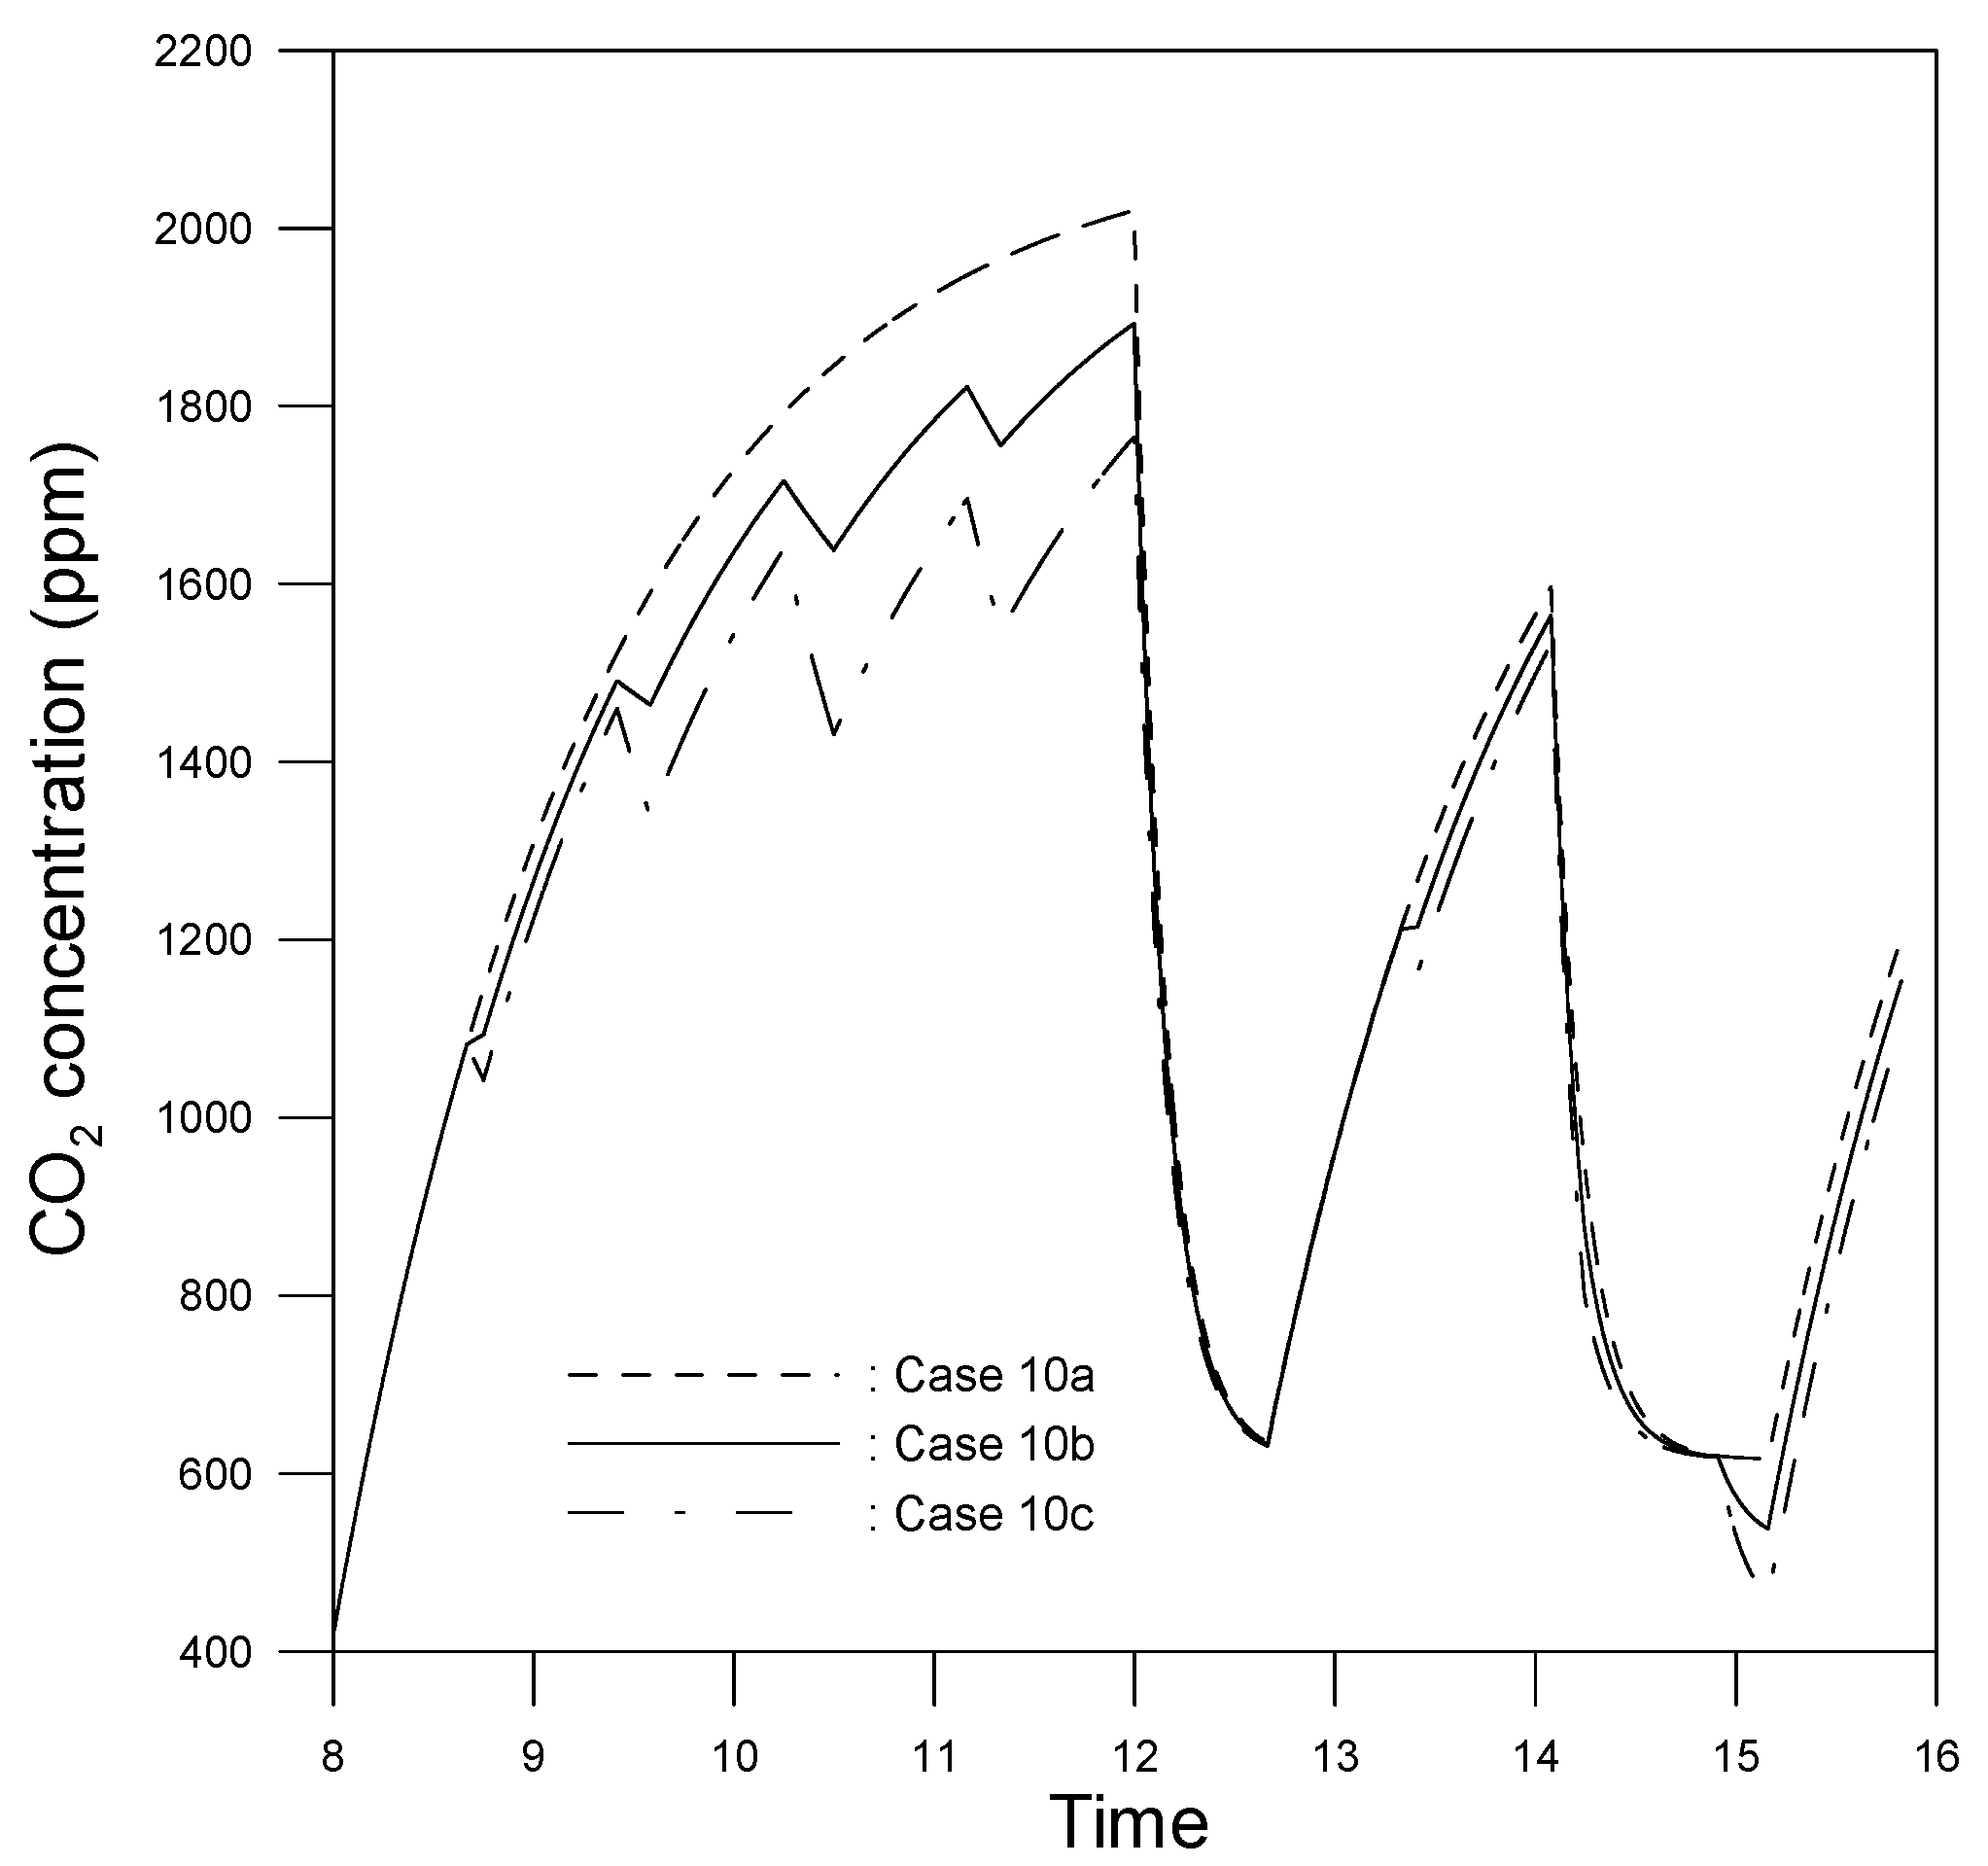
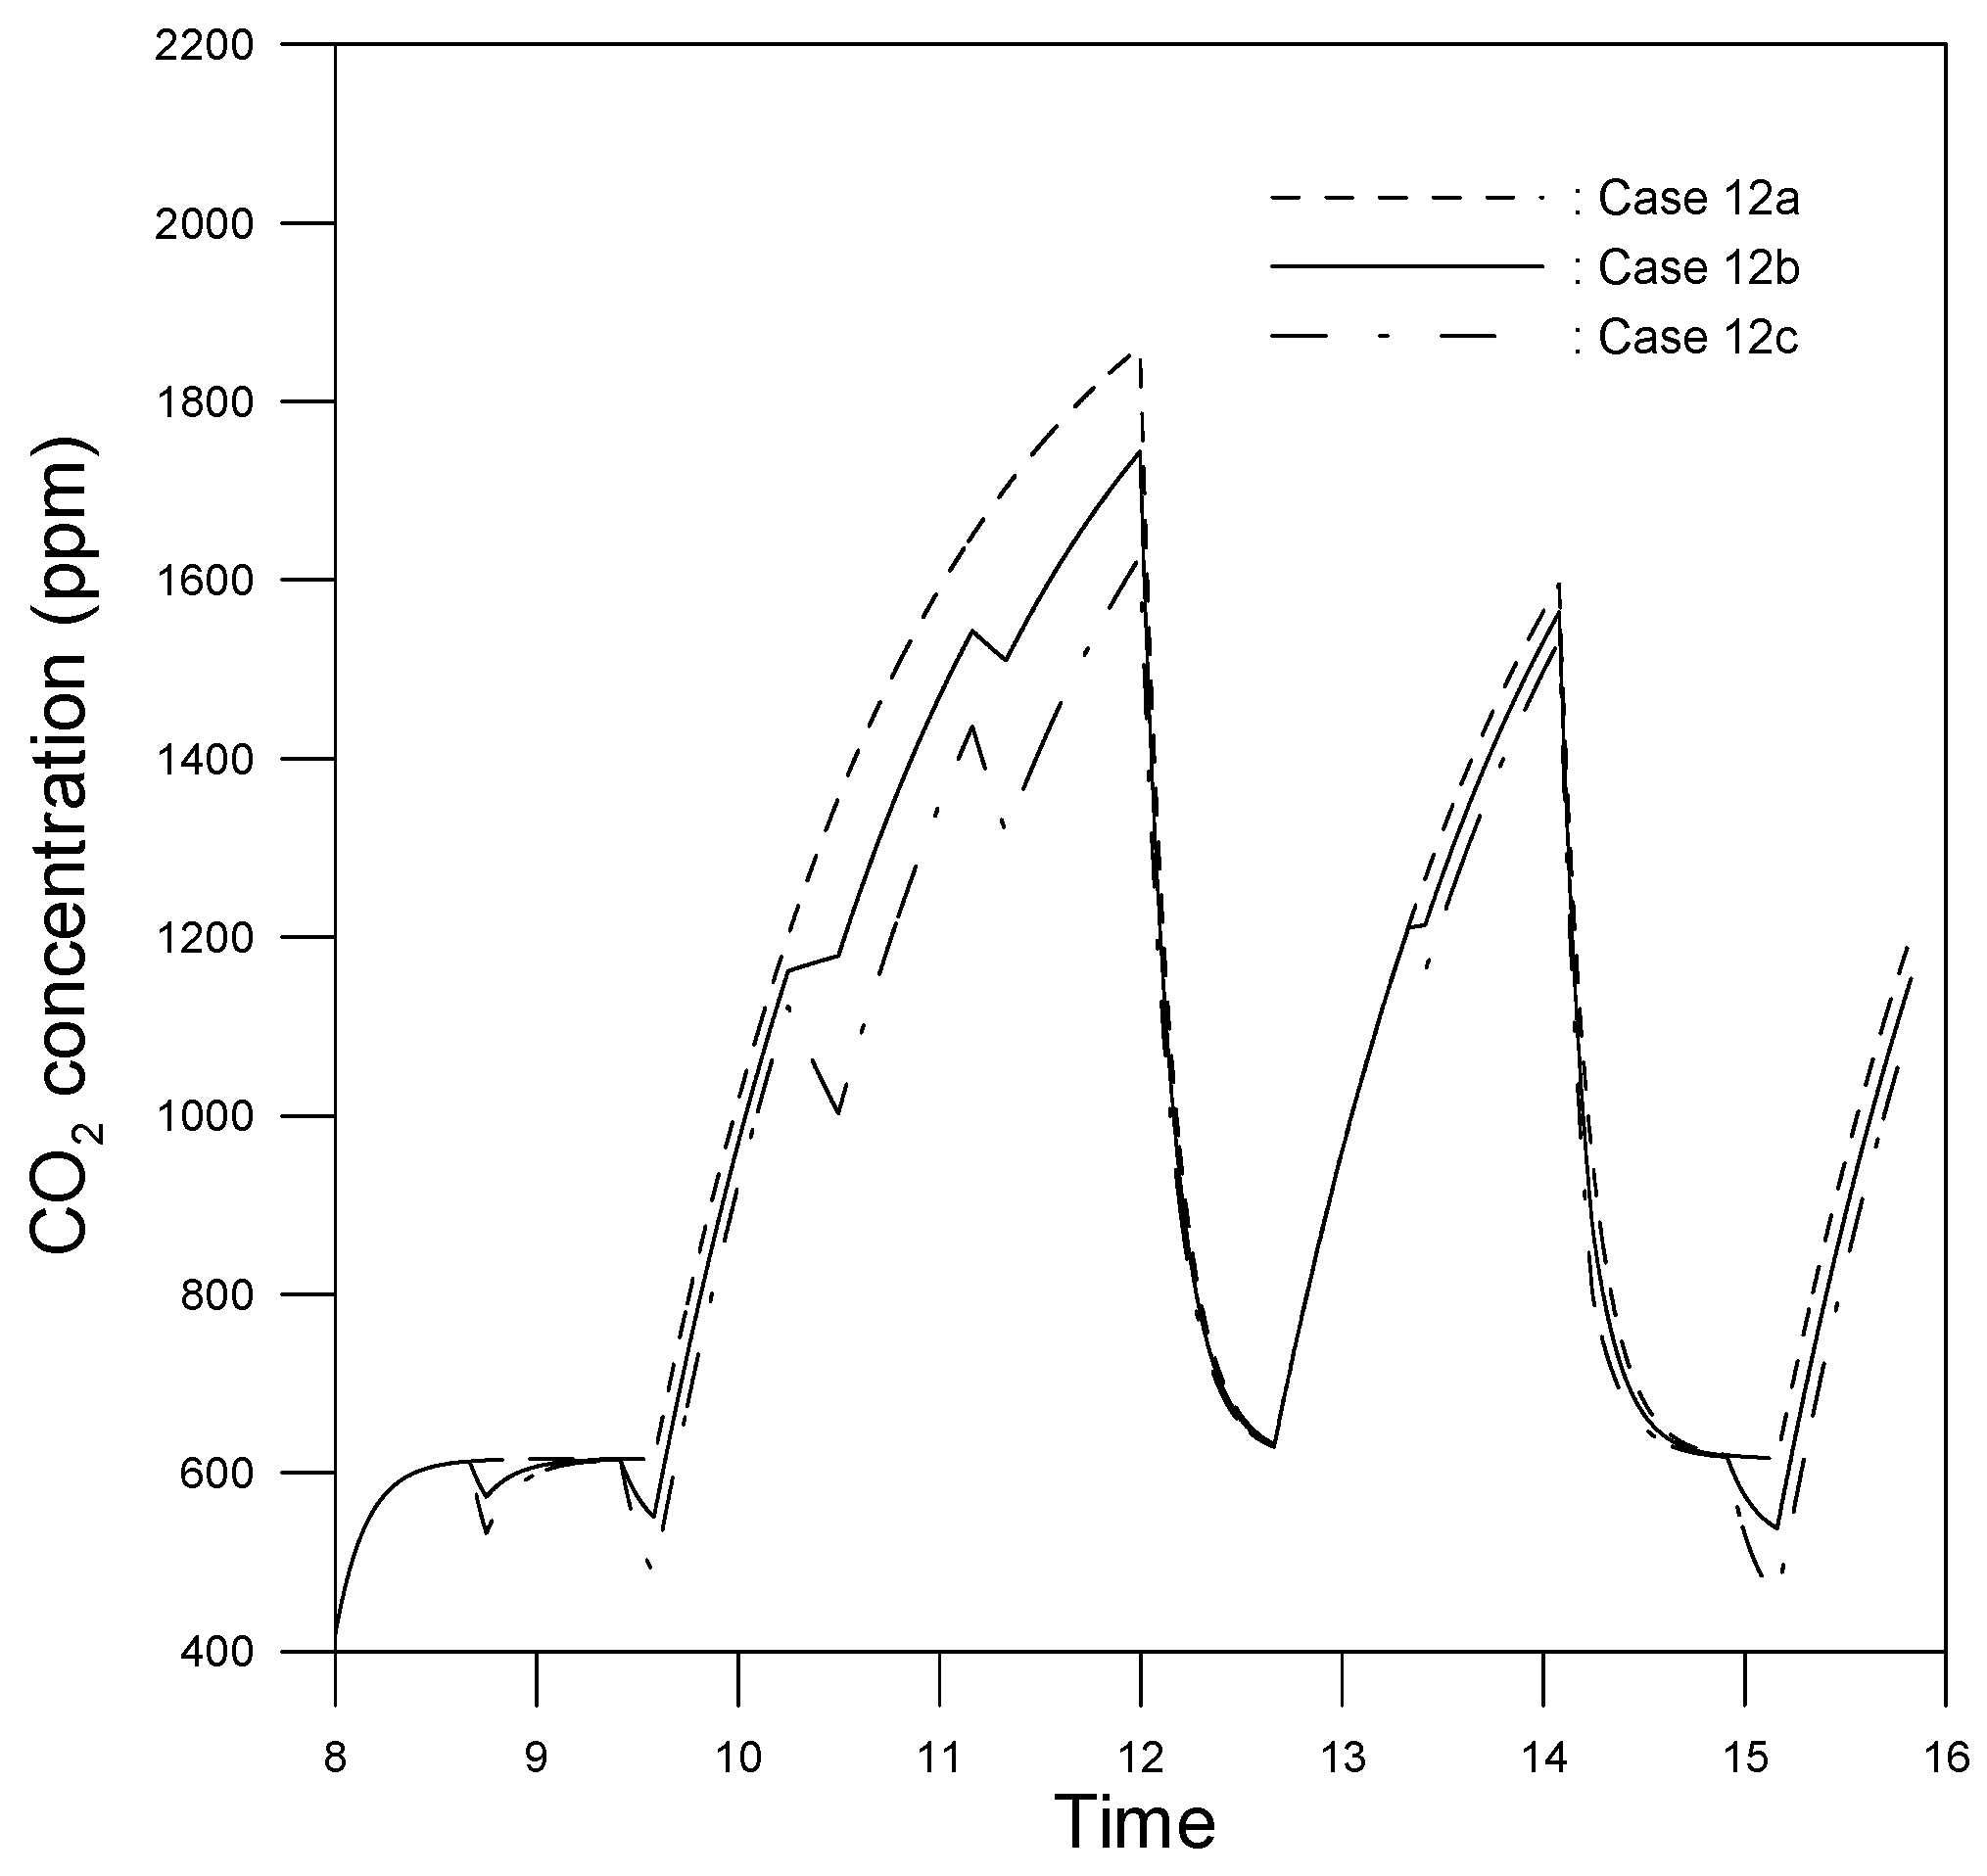
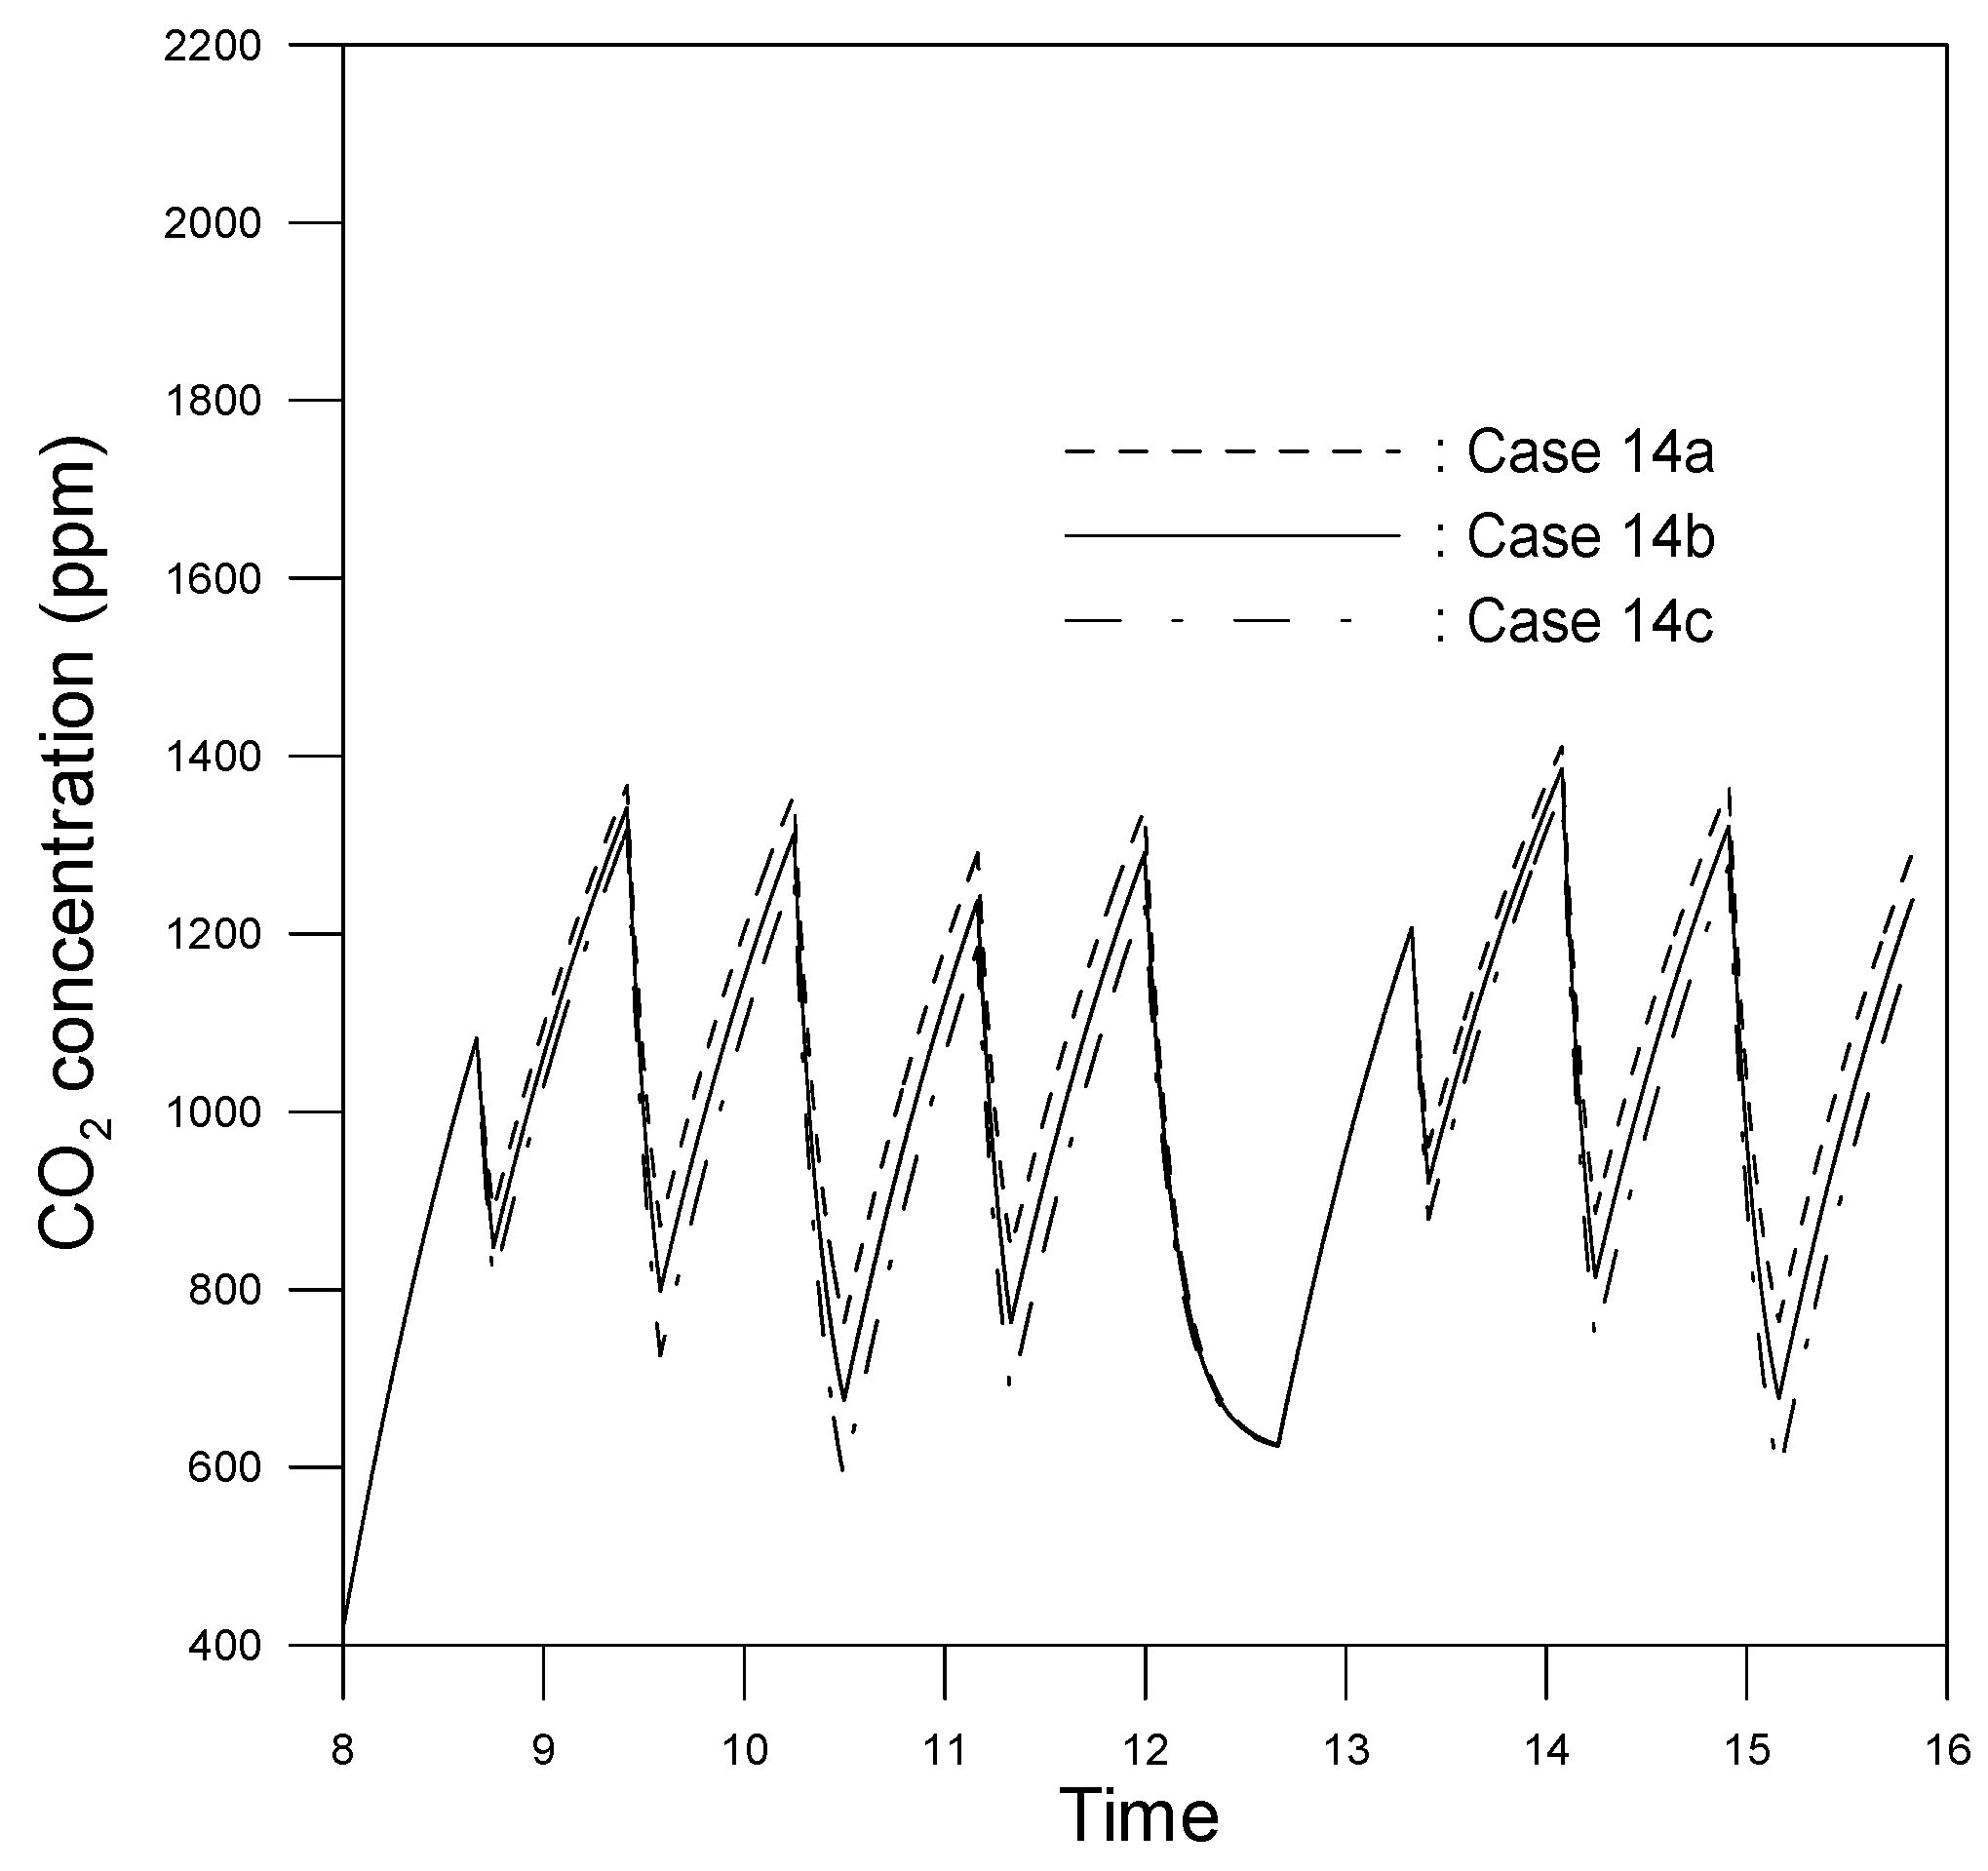
3.3. Turn off Air-Conditioning during Certain Periods

Table 4 shows the average CO2 concentrations and total A/C operation times for the 14 cases considered in the present simulations (see Table 3). The table also shows the average CO2 concentration experienced by the students for the case where they leave the classroom during the recess periods. (Note that the outdoor CO2 concentration level is assumed to be 420 ppm in every case.) As discussed above, for Cases 0~2, the EPA standard of 1000 ppm is satisfied only when the A/C is not operated at all (i.e., natural ventilation only), or the A/C is run during the entire school day with an additional mechanical fresh air ventilation system. It is seen that for Cases 3~5, in which the turn-on time of the A/C is progressively delayed to 08:45, 09:35 and 10:30, respectively, the average CO2 concentration in the classroom is effectively reduced compared to that of Case 1, but is still higher than the EPA standard of 1000 ppm. Taking Case 5 for illustration purposes, and assuming that none of the students leave the classroom during recess (i.e., Case 5(a)), Figure 4 shows that the CO2 concentration reaches approximately 615.6 ppm before the A/C is turned on at 10:30. After the A/C is turned on, the CO2 concentration increases rapidly and exceeds the EPA standard of 1000 ppm at 10:54. Moreover, the CO2 concentration exceeds 2000 ppm at 14:03 and reaches a maximum value of 2077 ppm at the end of the school day (15:50). As shown in Table 4, the average CO2 concentration in the classroom over the entire school day is thus equal to 1376 ppm.
In general, the results presented in Figure 2 and Figure 4 show that, in the absence of additional mechanical fresh air ventilation, the CO2 concentration in the classroom steadily increases with time after the A/C is turned on. Accordingly, as discussed above, various scenarios were considered in which the A/C was turned off during the lunchtime and teeth brushing period (12:00~12:40) and was additionally turned off during the 6th class and associated break periods (14:05~15:10). (Note that each time the A/C was turned off, the doors and windows were opened to obtain natural fresh air ventilation.) The considered scenarios are listed as Cases 6~13 in Table 3, respectively. For Cases 6 and 10, the A/C is turned on from the beginning of the mentor time (08:00) and is turned off at lunchtime (Case 6 and Case 10) and during the 6th class and recess periods (Case 10 only). For Cases 7~9, the A/C turn-on time is delayed over the course of the morning (as in Cases 3, 4 and 5, respectively) and is additionally turned off at lunch time. Finally, for Cases 11, 12 and 13, the A/C is also turned off during the 6th class and recess periods.
Referring to Table 4, the average CO2 concentration values in the classroom for Cases 1(a), 6(a) and 10(a) are 1818, 1505 and 1283 ppm, respectively. In other words, turning the A/C off during the lunch time and brushing period (12:00–12:40) and 6th class (14:05–15:10) yields an effective reduction in the average CO2 concentration in the classroom. However, the CO2 concentration level is still higher than the EPA recommendation of 1000 ppm. Figure 5 shows the variation of the CO2 concentration in the classroom in Case 10, where the A/C is turned off both at lunch time and during the 6th class. For the case where all of the students remain within the classroom, the CO2 concentration exceeds 1000 ppm at 08:34 and passes 2000 ppm at 11:43 (as discussed earlier for Case 1(a)). It reaches a maximum value of 2020 ppm at 12:00, but then drops rapidly when the A/C is turned off and the doors and windows are opened during the lunch and teeth brushing period. The CO2 concentration reduces to a value of 635 ppm at 12:40, but then rises once again when the A/C is turned back on at the end of the lunch recess and the class resumes (with the doors and windows closed). The CO2 concentration reaches 1596 ppm at the end of the 5th class, but then drops to 617 ppm at 15:10 after the A/C is turned off during the 6th class and associated recess periods. Following the 6th class recess, the A/C is turned on once again (at 15:10) and the CO2 concentration rises steadily to a value of 1201.6 ppm at the end of the school day (15:50). A similar trend is observed for Cases 10(b) and 10(c), in which 50% and 100% of the students, respectively, leave the classroom during the recess periods.
Comparing the results presented in Table 4 for Cases 7~9 with those presented for Cases 3~4, it is seen that turning off the A/C at lunch time yields an effective reduction in the average CO2 concentration in the classroom. For example, in Case 9(a), where the A/C is turned on at 10:30 and turned off at lunch time, the average CO2 concentration is 1119 ppm, whereas in Case 3(a), where the A/C is turned on at the same time, but is then left to run for the remainder of the school day, the average CO2 concentration is 1705 ppm. Comparing the results presented in Table 4 for Cases 11~13 (the A/C is turned off both at lunch time and during the 6th class) with those presented for Cases 7–9 (the A/C is turned off at lunch time only), it is noted that the average CO2 concentration is significantly reduced when the A/C is also turned off during the 6th class.
For illustration purposes, Figure 6 shows the variation of the CO2 concentration in the classroom for Case 12, where the A/C is turned on at 09:35 (second class) and is then turned off both at lunch time and during the 6th class. Taking the case where all of the students remain in the classroom during the recess periods (Case 12(a)), it is seen that the CO2 concentration has a value of 616 ppm before the A/C is turned on, but then increases rapidly when the A/C is switched on, and exceeds the EPA limit of 1000 ppm at 09:59. It then reaches a maximum value of 1861 ppm at 12:00 before dropping rapidly when the A/C is turned off and the doors and windows are opened for the lunch time recess. The CO2 concentration drops to 632 ppm at 12:40, and then rises once again during the 5th class to a local maximum value of 1595 ppm at 14:05. The CO2 concentration then reduces over the period of 14:05 to 15:10, for which the A/C is turned off and the windows are opened, and reaches a value of 617 ppm at 15:10. It then rises once again during the 7th class, and reaches 1202 ppm at the end of the school day (15:50). Similar tendencies in the average CO2 concentration variation are also observed for Cases 12(b) and (c), in which half of the students and all of the students, respectively, leave the classroom during the recess periods.
Notably, the results presented in Table 4 show that in Case 12(b), the average CO2 concentration in the classroom is equal to 982 ppm, and is hence consistent with the EPA guidelines. Furthermore, for the case where all of the students leave the classroom (Case 12(c)), the average CO2 concentration in the classroom further reduces to 928 ppm. For Case 13, where the A/C turn-on time is further delayed to 10:30, the average CO2 concentrations in the classroom are equal to 897, 860 and 824 ppm, when none of the students, half of the students, and all of the students leave the classroom during the recess periods, respectively. In other words, the results show that the EPA guideline for the 8-h average CO2 concentration in the classroom can be achieved by delaying the A/C turn-on time, turning the A/C off both at lunch time and during the 6th period, and encouraging the students to leave the classroom during the recess periods.
As mentioned above, Table 4 also shows the average CO2 concentration experienced by the students for the case where they leave the classroom during the recess periods and are hence exposed to the ambient CO2 concentration of 420 ppm. The results presented in Table 4 show that when the A/C turn-on time is delayed to 10:30, the A/C is turned off during the lunch period, and all of the students leave the classroom during every recess (i.e., Case 9(c)), the average CO2 concentration experienced by the students is 987 ppm, and is hence consistent with the EPA guidelines. A similar result is also obtained in Cases 11(c), 12(b), 12(c), 13(b) and 13(c). In other words, the results confirm the importance of encouraging the students to leave the classroom during the recess periods in order to further reduce their exposure to CO2.
As shown in Table 3, the study considered an additional case (Case 14), in which the A/C was operated continuously from the mentor time (08:00) to the end of the school day (15:50), but was turned off at lunch time and during every recess period. The aim of the strategy was thus to achieve a trade-off between the thermal comfort, the energy expenditure and the IAQ. Figure 7 shows the corresponding results for the variation of the CO2 concentration in the classroom over the school day. For the case where none of the students leave the classroom during the recess periods (Case 14(a)), the maximum CO2 is 1410.7 ppm at 14:05 (end of 5th class). It is noted that this value is significantly lower than the corresponding values in Figure 4, Figure 5 and Figure 6 (i.e., 2076.5 (Case 5), 2020 (Case 10) and 1860.9 ppm (Case 12), respectively). Furthermore, Table 4 shows that the average CO2 concentrations in the classroom are equal to 986, 944 and 902 ppm for the case where none of the students, half of the students and all of the students, respectively, leave the classroom during the recess periods. While these values are higher than those in Cases 12 and 13, they are lower than the EPA standard. In other words, simply turning off the A/C and opening the windows for ventilation every break time and during the lunch and brushing period provides an effective approach for improving the IAQ within the classroom while also preserving the thermal comfort and reducing the energy consumption.

3.4. Ranking of Different A/C Operation Strategies

Referring to the results presented in Table 4, it is seen that just five of the considered cases satisfy the EPA requirement for an 8-h average CO2 concentration of less than 1000 ppm, i.e., Cases 0, 2, 12, 13 and 14. Hence, the remaining discussions focus only on these particular A/C operation cases. In evaluating and comparing the effectiveness of the different cases, it is necessary to consider not only the ability of the case to satisfy the EPA guideline, but also its ability to maximize the thermal comfort of the students. Accordingly, two comparison indexes (A and B) were introduced, where index A relates to the EPA guideline and index B relates to the thermal comfort. In particular, index A indicates the extent to which the case satisfies the EPA guideline and is assigned a value between 0 and 1 depending on the number of sub-cases (a, b and c) which achieve a CO2 concentration of less than 1000 ppm. Meanwhile, index B indicates the extent to which the case satisfies the Executive Yuan’s policy for improving the thermal comfort in the classroom through A/C usage. In particular, index B is assigned a value between 0 and 1 depending on the proportion of the school day for which the A/C is run. A final index (index C) was then introduced to evaluate the overall effectiveness of the case by taking the product of indices A and B (i.e., C = A × B).
Table 5 shows the index values for each of the five cases. For Case 0 (i.e., the current case of no A/C usage and natural A/C ventilation only), the average CO2 concentration is less than 1000 ppm for all three sub-cases, and hence A = 1. However, the A/C usage time is 0 h, and hence the thermal comfort is extremely poor. Thus, the thermal comfort index is set as B = 0. As a result, the overall effectiveness (i.e., recommendation level) of the case has a value of C = 0 (i.e., not recommended). For case 2 (i.e., the A/C is run all day and is supported by mechanical fresh air ventilation), all three sub-cases yield an average CO2 concentration of less than 1000 ppm, and hence index A is set equal to 1. Furthermore, since the A/C is run all day, the thermal comfort requirement is also satisfied throughout the entire school day. Hence, index B is also set to 1. Consequently, the recommendation index (C = A × B) also has a value of 1. In other words, the A/C usage strategy is highly recommended. However, its implementation requires the installation and operation of a mechanical fresh air ventilation system, which adds to the financial burden on the school. For case 12 (the A/C turn-on time is delayed until the 2nd class (09:35) and the A/C is turned off both at lunch time and during the 6th class), the EPA guideline for the average CO2 concentration is satisfied only for sub-cases (b) and (c) (i.e., half of the students and all of the students, respectively, leave the classroom during recess). Thus, index A is assigned a value of A = 2/3. Referring to Table 4, the total A/C operation time for Case 12 is 4 h 30 min. Hence, index B is set as B = 4 h 30 min/7 h 50 min = 0.574. In other words, the thermal comfort of the students is assured for only half (approximately) of the school day. The overall recommendation index of Case 12 is thus just C = 2/3 × 0.574 = 0.383. For Case 13 (the A/C turn-on time is delayed until the 3rd class (10:30) and the A/C is turned off both at lunch time and during the 6th class), the EPA guideline for the average CO2 concentration is satisfied for all three sub-cases, and hence index A is set as A = 1. However, the total A/C operation time is reduced to 3 h 35 min, and hence index B has a value of B = 3 h 35 min/7 h 50 min = 0.457. In other words, the thermal comfort requirement is satisfied for less than half of the school day. As a result, the overall recommendation index of Case 13 is C = 1 × 0.457 = 0.457. Finally, for Case 14 (the A/C is run continuously all day, but is turned off at lunch time and during every recess period), the EPA guideline for the average CO2 concentration is satisfied for all three sub-cases, and hence index A has a value of 1. Moreover, the total A/C usage time is 6 h, and hence index B has a value of B = 6 h/7 h 50 min = 0.766. In other words, the thermal comfort requirement is satisfied for more than three-quarters of the school day. Thus, Case 14 has a relatively high recommendation index value of C = 1 × 0.766 = 0.766.
Overall, the results presented in Table 5 indicate that the optimal A/C usage strategy in terms of meeting the Taiwan EPA guidelines for the IAQ and the Executive Yuan’s requirement for thermal comfort in the classroom is that of running the A/C all day in conjunction with a mechanical fresh air ventilation system (especially an energy recovery ventilator) set to provide fresh air at a rate of 5 l/s per person. However, this strategy incurs an additional hardware and energy consumption. Hence, an alternative approach is to run the A/C system all day with the exception of the lunch time and recess periods, during which time the doors and windows of the classroom should be opened to provide natural ventilation.

4. Conclusions

The present study has conducted a numerical investigation into the effects of various A/C usage strategies on the 8-h average CO2 concentration in the classroom. In particular, the simulations have considered running the A/C all day; delaying the turn-on time of the A/C system in the morning; turning the A/C system off during the lunch time period; and turning the A/C system off during one class each afternoon, where this class is assigned to out-of-class activities, such as sports or lessons in another classroom (e.g., the computer classroom). For each strategy, the simulations have investigated the IAQ for three student behaviors during each recess period, namely (i) none of the students leave the classroom, (ii) half of the students leave the classroom, and (iii) all of the students leave the classroom. The relative merit of each strategy has been evaluated in terms of the extent to which it satisfies the EPA guideline for the 8-h average CO2 concentration in the classroom (<1000 ppm), and the Executive Yuan’s requirement for thermal comfort (i.e., A/C usage throughout the entire school day). The main contributions and findings of this study can be summarized as follows.
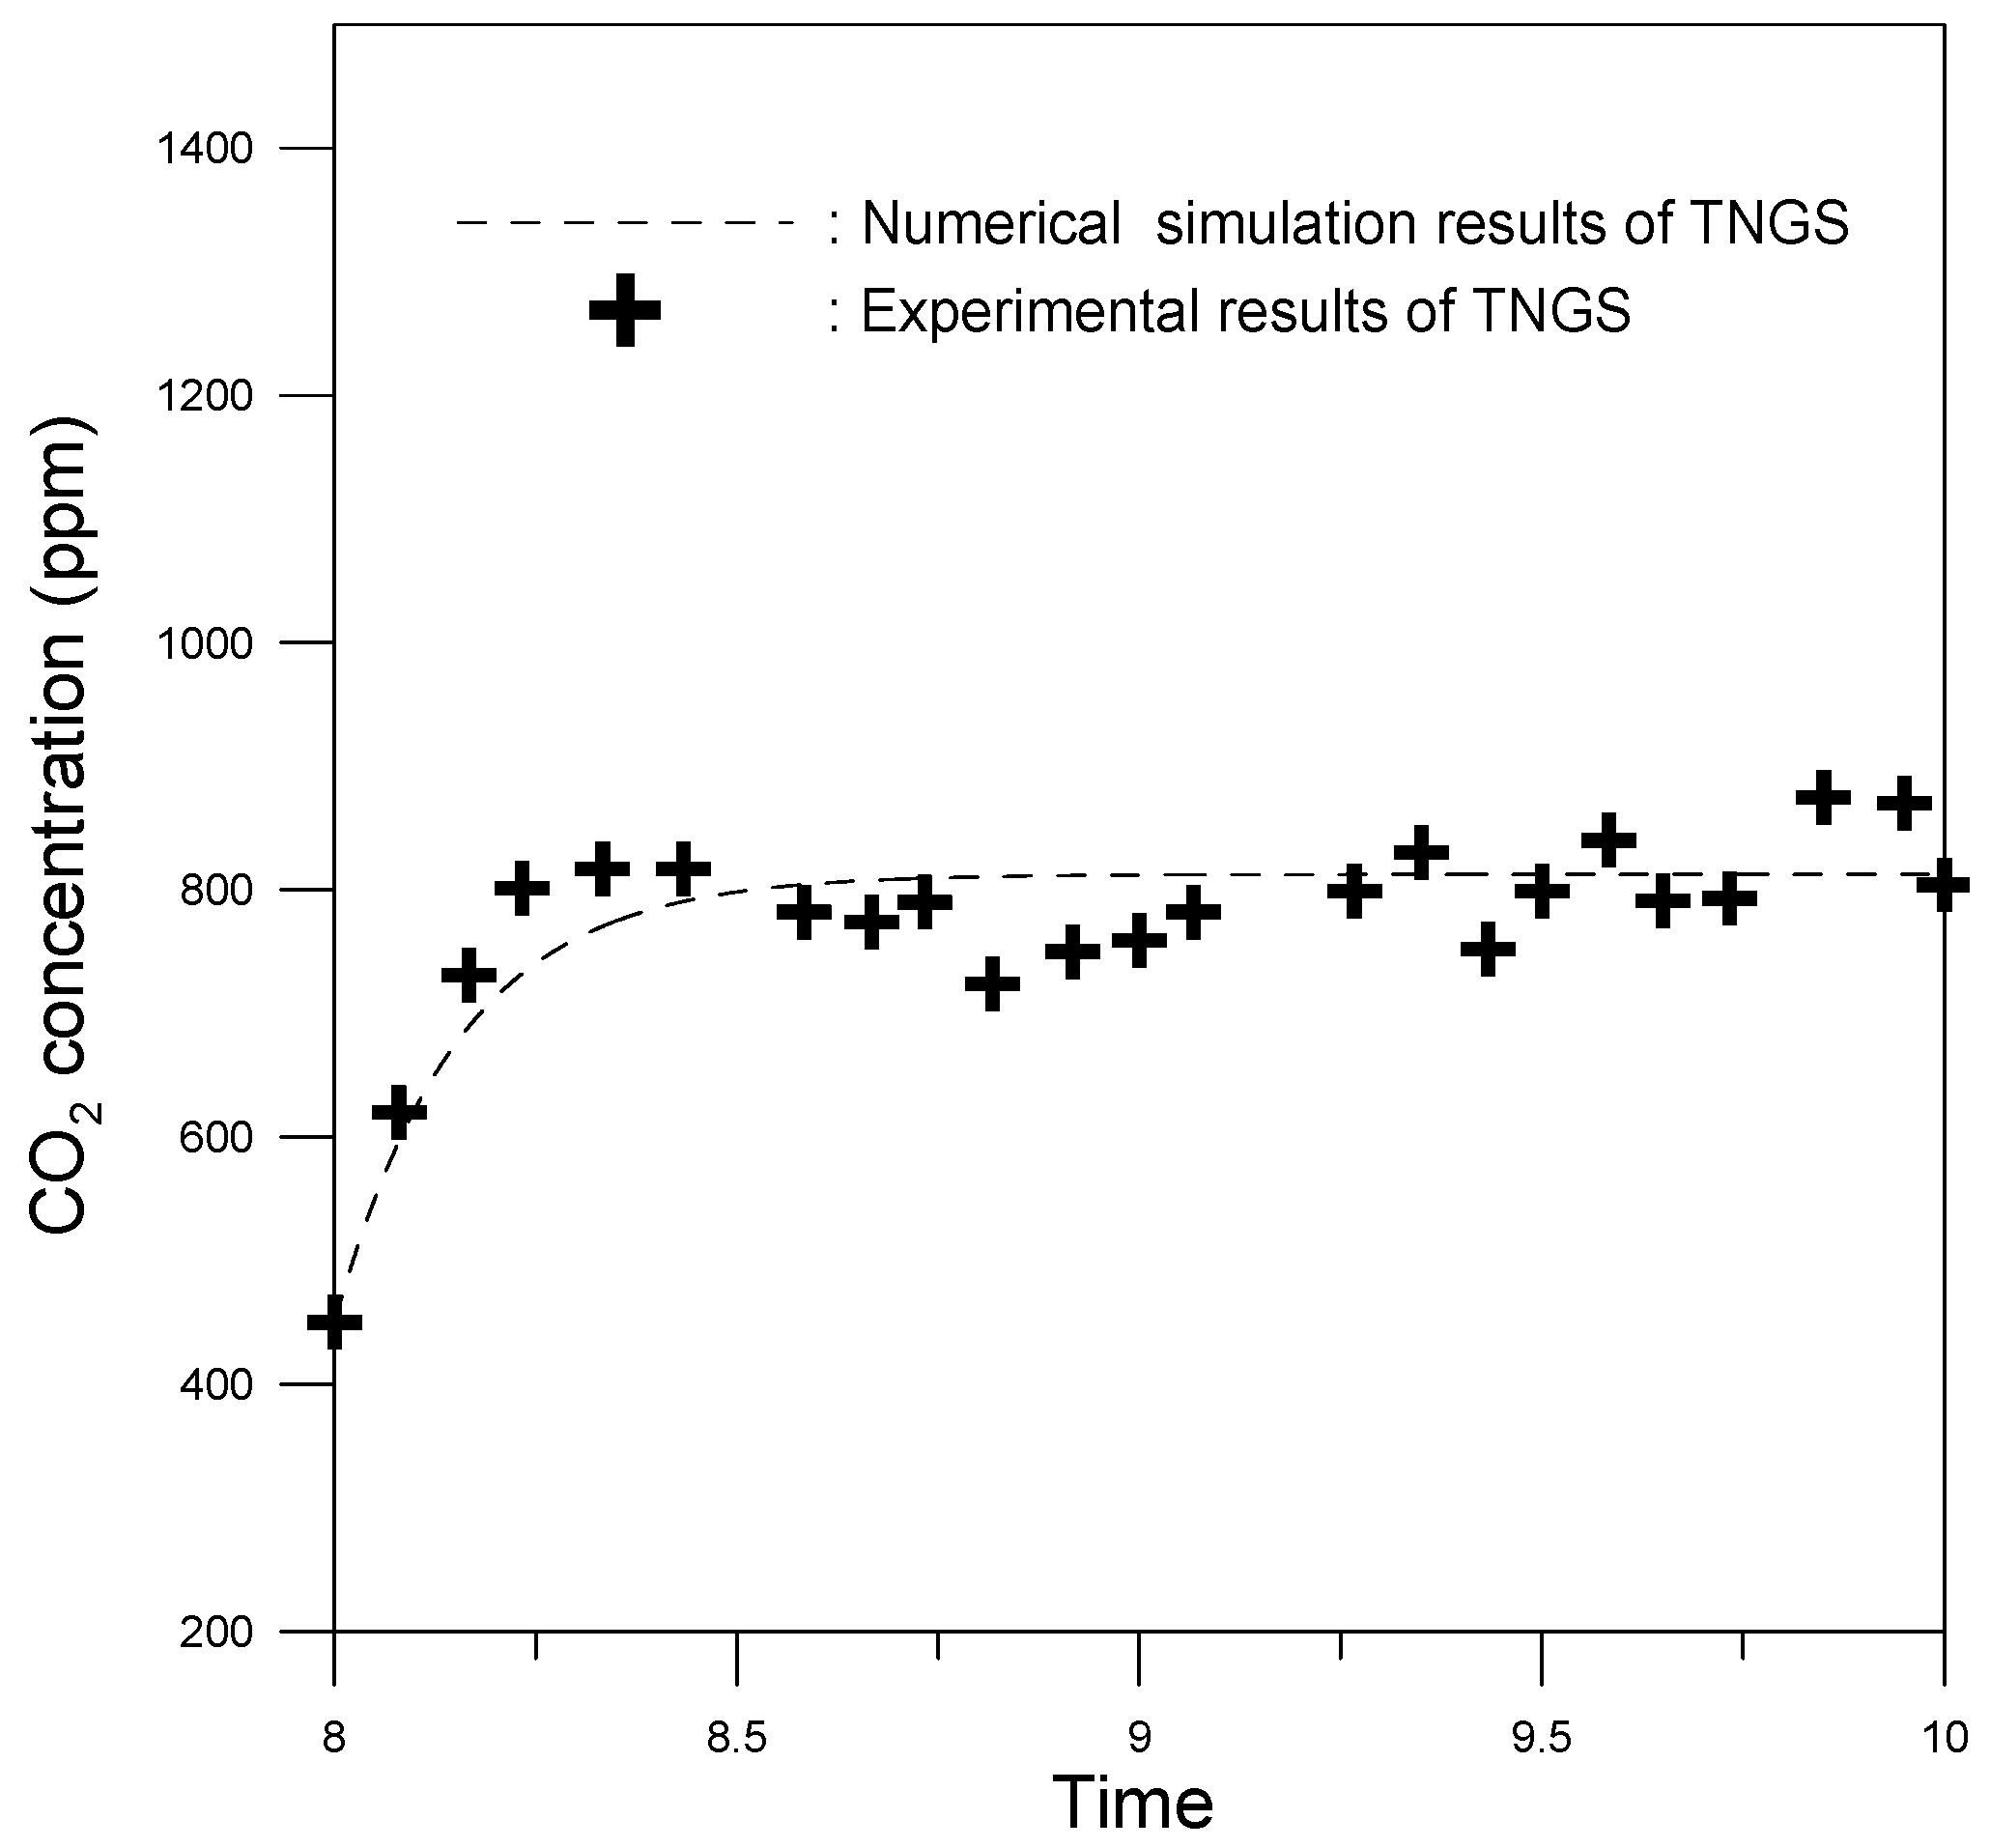
  • The validity of the numerical model used in the present simulations has been confirmed. It has been shown that the simulated value deviates from the measured value by no more than 3.2%.
  • In the case where A/C is not installed, i.e., the classroom is cooled and ventilated by natural ventilation only, the average CO2 within the classroom varies between 583~612 ppm, depending on the proportion of students leaving the classroom at recess. The IAQ is thus consistent with the EPA guideline. However, the thermal comfort is extremely poor.
  • The IAQ can be further improved through encouraging the students to leave the classroom and go outdoors every recess.
  • To satisfy both the Executive Yuan requirement for thermal comfort over the full school day and the EPA guideline for the IAQ (an 8-h average CO2 concentration in the classroom of less than 1000 ppm), it is necessary to run the A/C system continuously the entire day (08:00~15:50) and to provide mechanical fresh air ventilation at a rate of 5 l/s per person in the classroom of an elementary school.
  • As a lower energy consumption alternative, the A/C system can be operated from 08:00 to 15:50, but turned off during every recess period and at lunch time.
  • The A/C energy consumption can be reduced by delaying the A/C turn-on time until the 3rd class (10:30) and then turning the A/C off both at lunch time and during the 6th class.
  • As a final alternative, the A/C turn-on time can be delayed until the 2nd class (09:35) and then run for the remainder of the school day with the exception of the lunch time period and the 6th class.

Author Contributions

T.-B.C. contributed to conceive and design the experiments, analyze the data, and write the paper; L.-Y.C. contributed to investigation, perform the numerical simulation and experiments. All authors have read and agreed to the published version of the manuscript.

Funding

This research was funded by the Ministry of Science and Technology (MOST) of Taiwan, grant numbers MOST 109-2221-E-415-006-MY2 and MOST 111-2221-E-415-008.

Data Availability Statement

Not applicable.

Conflicts of Interest

The authors declare no conflict of interest.

References

  1. Taiwan Executive Yuan Official Website. Available online: https://english.ey.gov.tw/Page/61BF20C3E89B856/4665e854-bfb8-43e0-a975-34d8b4602d33 (accessed on 2 November 2022).
  2. Chang, T.; Sheu, J.; Huang, J. Vehicle air leakage ventilation and its effect on cabin indoor air quality, Proceedings of the Institution of Mechanical Engineers, Part E. J. Process Mech. Eng. 2017, 231, 1226–1234. [Google Scholar] [CrossRef]
  3. Tham, K. Indoor air quality and its effects on humans-A review of challenges and developments in the last 30 years. Energy Build. 2016, 130, 637–650. [Google Scholar] [CrossRef]
  4. Seppanen, O.; Fisk, W.; Mendell, M. Association of ventilation rates and CO2 concentrations with health and other responses in commercial and institutional buildings. Indoor Air 1999, 9, 226–252. [Google Scholar] [CrossRef] [PubMed] [Green Version]
  5. Szczepanik-Scislo, N.; Antonowicz, A.; Scislo, L. PIV measurement and CFD simulations of an air terminal device with a dynamically adapting geometry. SN Appl. Sci. 2019, 1, 370. [Google Scholar] [CrossRef] [Green Version]
  6. Szczepanik-Scislo, N.; Flaga-Maryańczyk, A. Indoor air quality modelling and measurements of a studio apartment with a mechanical exhaust system. E3S Web Conf. 2018, 44, 00171. [Google Scholar] [CrossRef] [Green Version]
  7. Chung, S.-C.; Lin, Y.-P.; Yang, C.; Lai, C.-M. Natural Ventilation Effectiveness of Awning Windows in Restrooms in K-12 Public Schools. Energies 2019, 12, 2414. [Google Scholar] [CrossRef] [Green Version]
  8. Lin, Y.-P. Natural Ventilation of Toilet Units in K–12 School Restrooms Using CFD. Energies 2021, 14, 4792. [Google Scholar] [CrossRef]
  9. ASTM. Standard Guide for Using Indoor Carbon Dioxide Concentrations to Evaluate Indoor Air Quality and Ventilation; ASTM International: West Conshohocken, PA, USA, 2012. [Google Scholar]
  10. Wang, Y.; Zhao, F.; Kuckelkorn, J.; Liu, D.; Liu, L.; Pan, X. Cooling energy efficiency and classroom air environment of a school building operated by the heat recovery air conditioning unit. Energy 2014, 64, 991–1001. [Google Scholar] [CrossRef]
  11. Kusiak, A.; Tang, F.; Xu, G. Multi-objective optimization of HVAC system with an evolutionary computation algorithm. Energy 2011, 36, 2440–2449. [Google Scholar] [CrossRef]
  12. Xaman, J.; Ortiz, A.; Alvarez, G.; Chavez, Y. Effect of a contaminant source (CO2) on the air quality in a ventilated room. Energy 2011, 36, 3302–3318. [Google Scholar] [CrossRef]
  13. ASHRAE Standard 62.1-2019; Ventilation for acceptable indoor air quality. American Society of Heating. Refrigeration and Air conditioning Engineers; ASHRAE: Peachtree Corners, GA, USA, 2019.
  14. Prill, R.; Blake, D.; Hales, D. School Indoor Air Quality Assessment and Program Impementation; Washington State University: Pullman, WA, USA, 2012. [Google Scholar]
  15. You, Y.; Bai, Z.; Jia, C.; Hu, X.; Ran, W.; Zhang, J. Ventilation conditions and the related symptoms in selected indoor environments in a University. In Proceedings of the 6th International Conference on Indoor Air Quality, Ventilation & Energy Conservation in Buildings IAQVEC, Sendai, Japan, 28–31 October 2007. [Google Scholar]
  16. Allen, J.; MacNaughton, P.; Satish, U.; Vallarino, J.; Spengler, J. Associations of congnitive function scores with carbon dioxide, ventilation, and volatile organic compound exposures in office workers: A controlled exposure study of Green and conventional office environments. Environ. Health Perspect. 2016, 124, 805–812. [Google Scholar] [CrossRef] [Green Version]
  17. Satish, U.; Mendell, M.; Shekhar, K.; Hotchi, T.; Sullivan, D.; Streufert, S.; Fisk, W. Is CO2 an indoor Pollutant? Direct effects of low-to-moderate CO2 concentrations on human decision-making performance. Environ. Health Perspect. 2012, 120, 1671–1677. [Google Scholar] [CrossRef] [PubMed] [Green Version]
  18. Chuah, Y.K.; Yang, J.J. A Integrated Dedicated Outdoor Air System to Optimize Energy Saving. Sustainability 2020, 12, 1051. [Google Scholar] [CrossRef] [Green Version]
  19. Haverinen-Shaughnessy, U.; Shaughnessy, R. Effects of classroom ventilation rate and temperature on students’ test scores. PLoS ONE 2015, 10, e0136165. [Google Scholar] [CrossRef] [PubMed]
  20. Szczepanik-Scislo, N.; Schnotale, J. An Air Terminal Device with a Changing Geometry to Improve Indoor Air Quality for VAV Ventilation Systems. Energies 2020, 13, 4947. [Google Scholar] [CrossRef]
  21. Bako-Biro, Z.; Clements-Croome, D.; Kochhar, N.; Awbi, H.; Williams, M. Ventilation rates in schools and pupils’ performance. Build. Environ. 2012, 48, 215–223. [Google Scholar] [CrossRef]
  22. Mendell, M.; Eliseeva, E.; Davies, M.; Lobscheid, A. Do classroom ventilation rates in California elementary schools influence standardized test scores? Results from a prospective study. Indoor Air 2016, 26, 546–557. [Google Scholar] [CrossRef]
  23. Turanjanin, V.; Vucicevic, B.; Jovanovic, M.; Mirkov, N.; Lazovic, I. Indoor CO2 measurements in Serbian schools and ventilation rate calculation. Inside Energy 2014, 77, 290–296. [Google Scholar] [CrossRef]
  24. Gao, J.; Wargocki, P.; Wang, Y. Ventilation system type, classroom environmental quality and pupils’ perceptions and symptoms. Build. Environ. 2014, 75, 46–57. [Google Scholar] [CrossRef]
  25. Chan, W.R.; Li, X.; Singer, B.C.; Pistochini, T.; Vernon, D.; Outcault, S.; Sanguinetti, A.; Modera, M. Ventilation rates in California classrooms: Why many recent HVAC retrofits are not delivering sufficient ventilation. Build. Environ. 2020, 167, 106426. [Google Scholar] [CrossRef]
  26. Johnson, D.L.; Lynch, R.A.; Floyd, E.L.; Wang, J.; Bartels, J.N.J.B. Indoor air quality in classrooms: Environmental measures and effective ventilation rate modeling in urban elementary schools. Build. Environ. 2018, 136, 185–197. [Google Scholar] [CrossRef]
  27. Fisk, W.J.J.I.A. The ventilation problem in schools: Literature review. Indoor Air 2017, 27, 1039–1051. [Google Scholar] [CrossRef] [PubMed] [Green Version]
  28. Persily, A.; de Jonge, L. Carbon dioxide generation rates for building occupants. Indoor Air 2017, 27, 868–879. [Google Scholar] [CrossRef] [PubMed] [Green Version]
  29. Chang, J.J. The Study of Indoor Air Quality in the Computer Classrooms of Elementary School in Pintung Area. Master’s Thesis, Tajen University, Pingtung, Taiwan, 2015. [Google Scholar]
  30. Daily Timetable of Elementary School. Available online: https://sites.google.com/a/kyes.tn.edu.tw/kyes104501/ban-ji-ke-biao (accessed on 2 November 2022).
  31. Ministry of Education of Taiwan, Elementary and Secondary School Class Organization and Staffing Guidelines, National Law Database. Available online: https://law.moj.gov.tw/LawClass/LawAll.aspx?pcode=H0070006 (accessed on 13 March 2021).
  32. Chang, T.B.; Sheu, J.J.; Huang, J.W.; Lin, Y.S.; Chang, C.C. Development of a CFD model for simulating vehicle cabin indoor air quality. Transp. Res. Part D Transp. Environ. 2018, 62, 433–440. [Google Scholar] [CrossRef]
Figure 1. Comparison of experimental results and simulation results for CO2 concentration in classroom of Tainan National Girls School (TNGS) in Taiwan.
Energies 16 02493 g001
Figure 2. Variation of CO2 concentration in classroom for Case 0 and Case 1.
Energies 16 02493 g002
Figure 3. Variation of CO2 concentration in classroom for Case 2.
Energies 16 02493 g003
Figure 4. Variation of CO2 concentration in classroom for Case 5.
Energies 16 02493 g004
Figure 5. Variation of CO2 concentration in classroom for Case 10.
Energies 16 02493 g005
Figure 6. Variation of CO2 concentration in classroom for Case 12.
Energies 16 02493 g006
Figure 7. Variation of CO2 concentration in classroom for Case 14.
Energies 16 02493 g007
Table 1. Daily timetable of elementary school in Taiwan [30].
PeriodProgram
7:35–8:00Student check-in
8:00–8:40Mentor time
8:40–8:45Break time
8:45–9:251st class
9:25–9:35Break time
9:35–10:152nd class
10:15–10:30Break time
10:30–11:103rd class
11:10–11:20Break time
11:20–12:004th class
12:00–12:40Lunch & brushing time
12:40–13:20Nap time
13:20–13:25Break time
13:25–14:055th class
14:05–14:15Break time
14:15–14:556th class
14:55–15:10Break time
15:10–15:507th class
15:50–End of school/Pickup time
Table 2. Parameters used in analysis.
ParametersSetting ValueSource of Setting Value
Volume of classroom (V)248 m3Chang [29]
The natural ventilation flow rates when A/C is turned on (QAC/on)   0.052   m 3 / s Chang [29]
The natural ventilation flow rates when A/C is turned off (QAC/off)   0.44   m 3 / s Chang [29]
Number of person in classroom (n)29 children and 1 teacherThe regulations of the Ministry of Education of Taiwan 「Regulations governing the establishment of classes and staffs for elementary and secondary schools」 [31]
The CO2 generation rate per person (Gs)   Child :   2.9 × 10 6   m 3 / s
  Teacher :   5.2 × 10 6 m 3 / s
Persily and Jonge [28]
The initial value of the CO2 concentration in the classroom C0420 ppmChang et al. [32]
The outdoor CO2   concentration   C o u t d o o r  420 ppmChang et al. [32]
Table 3. A/C operation strategies analyzed in present study.
The Beginning Time for Turning-On the A/CWhether the A/C is on or Not during Lunch & Brushing TimeWhether the A/C is on or Not in the 6th ClassThe Proportion of Students Leaving the Classroom to Outdoor Activities during the Break TimeCase Number
Current situation without A/C------0%0a
50%0b
100%0c
Mentor time/08:00
(Natural ventilation)
ONON0%1a
50%1b
100%1c
Mentor time/08:00
(with additional mechanical ventilation rate at 5 l/s per person, i.e.,  Q m e c h   = 0.15   m 3 / s )
ONON0%2a
50%2b
100%2c
1st class/08:45ONON0%3a
50%3b
100%3c
2nd class/09:35ONON0%4a
50%4b
100%4c
3rd class/10:30ONON0%5a
50%5b
100%5c
Mentor time/08:00OFFON0%6a
50%6b
100%6c
1st class/08:45OFFON0%7a
50%7b
100%7c
2nd class/09:35OFFON0%8a
50%8b
100%8c
3rd class/10:30OFFON0%9a
50%9b
100%9c
Mentor time/08:00OFFOFF0%10a
50%10b
100%10c
1st class/08:45OFFOFF0%11a
50%11b
100%11c
2nd class/09:35OFFOFF0%12a
50%12b
100%12c
3rd class/10:30OFFOFF0%13a
50%13b
100%13c
Mentor time/08:00
(the A/C was turned on from the beginning of the mentor time (08:00) to the end of the school day (15:50), but was turned off every recess and during the lunch and teeth brushing period)
OFFON0%14a
50%14b
100%14c
Table 4. Average CO2 concentration in classroom and total A/C operation time for different A/C operation strategies.
Case NumberThe Average CO2 Concentration in ClassroomThe Average CO2 Concentration Experienced by the Students for the Case Where They Leave the Classroom during the Recess PeriodsTotal A/C Operation Time
0a612--0
0b597584
0c583573
1a1818--7 h 50 min
1b17151616
1c16121524
2a966--7 h 50 min
2b925883
2c883847
3a1705--7 h 5 min
3b16041524
3c15031432
4a1548--6 h 15 min
4b14591407
4c13711326
5a1376--5 h 20 min
5b13091283
5c12411220
6a1505--7 h 10 min
6b14201322
6c13351247
7a1399--6 h 25 min
7b13161235
7c12321161
8a1258--5 h 35 min
8b11851132
8c11131068
9a1119--4 h 40 min
9b10641038
9c1008987
10a1283--6 h 5 min
10b12171118
10c11511062
11a1176--5 h 20 min
11b11121031
11c1048977
12a1035--4 h 30 min
12b982929
12c928883
13a897--3 h 35 min
13b860835
13c824803
14a986--6 h
14b944905
14c902868
Table 5. Ranking of different recommendations.
Index AIndex BIndex C
(C = A × B)
Ranking
Case 0100Not recommended
Case 21111st
Case 122/30.5740.3834th
Case 1310.4570.4573rd
Case 1410.7660.7662nd
Disclaimer/Publisher’s Note: The statements, opinions and data contained in all publications are solely those of the individual author(s) and contributor(s) and not of MDPI and/or the editor(s). MDPI and/or the editor(s) disclaim responsibility for any injury to people or property resulting from any ideas, methods, instructions or products referred to in the content.

