Article

An Optimal Scheduling Method of Shared Energy Storage System Considering Distribution Network Operation Risk

1
School of Electrical and Information Engineering, Tianjin University, Tianjin 300072, China
2
State Grid Corporation of China, Beijing 100031, China
3
State Grid Jibei Electric Power Company Limited, Beijing 065300, China
*
Author to whom correspondence should be addressed.
Energies 2023, 16(5), 2411; https://doi.org/10.3390/en16052411
Submission received: 31 January 2023 / Revised: 24 February 2023 / Accepted: 1 March 2023 / Published: 2 March 2023

Abstract

:
Shared energy storage systems (SESS) have been gradually developed and applied to distribution networks (DN). There are electrical connections between SESSs and multiple DN nodes; SESSs could significantly improve the power restoration potential and reduce the power interruption cost during fault periods. Currently, a major challenge exists in terms of how to consider both the efficiency of the operation and the reliability cost when formulating the SESS scheduling scheme. A SESS optimal scheduling method that considers the DN operation risk is proposed in this paper. First, a multi-objective day-ahead scheduling model for SESS is developed, where the user’s interruption cost is regarded as the reliability cost and it is the product of the occurrence probability of the expected accident and the loss of power outage. Then, an island partition model with SESS was established in order to accurately calculate the reliability cost. Via the maximum island partition and island optimal rectification, the SESS was carefully integrated into the power restoration system. Furthermore, in order to minimize the comprehensive operation cost, an improved genetic algorithm for the island partition was designed to solve the complex SESS optimal scheduling model. Finally, a case study on the improved PG&E 69 bus system was analyzed. Moreover, we found that the DN’s comprehensive operation cost decreased by 6.6% using the proposed method.

1. Introduction

A carbon peaking and neutralization target is proposed in this paper. To achieve this target, a significant amount of renewable power was generated and integrated into the distribution network (DN), which significantly improved the reliability of the power supply [1]; however, the generated renewable power supply fluctuated, and thus, the supply was unstable [2]. By prioritizing the large-scale distributed generation (DG) of power and integrating it into DN, it will be possible to increase renewable energy consumption and reduce dependence upon wind and solar energy sources [3]. In order to promote renewable energy consumption and increase utilization efficiency, an appropriate portion of energy can be stored in order to stabilize DG output; however, investing in separate energy stores may lead to high operation and maintenance costs. In recent years, shared energy storage systems (SESS) have been carefully developed, and they have gradually replaced traditional methods for storing energy; such traditional methods usually involve separate energy storage modes. Integrating SESS into the distribution network ensures that the network is flexibly regulated, thus enabling renewable energy consumption. When there is a sufficient level of remaining electricity in the SESS, the SESS can participate In auxiliary services, such as peak load shifting, and it can improve the efficiency and reliability of the DN operation [4]. Moreover, it is important to consider both the operation risks and the operation’s efficiency; therefore, quickly formulating the SESS’s optimal scheduling scheme has become a key research area in power engineering.
Appropriate operation control strategies are necessary to achieve the expected benefits of SESS. There has been a great deal of research on SESS operation strategies. Complex dynamic variations, such as the randomness of load demand, the intermittence of photovoltaic (PV) equipment, and fluctuating electricity prices, are often due to the behavior of individual consumers. An effective control strategy is designed in [5], wherein individual consumers were allowed to make SESS operation decisions in order to achieve economic energy sharing and reduce PV curtailment. Moreover, [6] focuses on the concept, market design, and key technologies of SESS. Integrating SESS into the shared economy has been found to improve the operational conditions of the system and increase energy utilization efficiency; for instance, it has been integral to the formulation of the smart grid. Additionally, [7] proposes a distributed real-time shared-control strategy based on the Lyapunov theory. A group of household consumers with the ability to generate renewable power, controllable loads, and with integrated SESS, were regarded as the objects of the study. The charging and discharging strategies of SESS were jointly optimized in a distributed way in order to coordinate the electricity produced by household consumers. This strategy can improve the utilization rate of renewable power and decrease the cost of electricity consumption. The operational benefits of SESS in promoting DG consumption, peak load shifting, frequency modulation, and delaying equipment investment were fully considered in [8]; indeed, a two-level model of the installed capacity and operation strategy of SESS with integrated DG was established, and the model was solved with a genetic algorithm. The actual operational benefit of the community SESS was regarded as the research object in [9]; by comparing optimal operation strategies under independent and sharing conditions, it was found that the operating benefits and utilization rate, when the strategies were placed under sharing conditions, were significantly better than when they were placed under independent conditions. It also provided suggestions and guidance for the allocation and scheduling strategies of SESS. In [10], a genetic algorithm and New Best algorithm were proposed and adopted in order to realize the optimal allocation of the SESS’s capacity. Furthermore, it also demonstrated the effect of the improved utilization rate on community PV equipment under different permeability conditions after the SESSs were integrated. In [11], a SESS allocation framework for the community PV equipment is proposed. The allocation scheme for SESS included three options for private energy storage and community public energy storage. The power operation cost was optimized based on the mixed integer linear programming model.
A large number of electric vehicles are integrated into smart grid. For the scheme of vehicle integration, electric vehicles are expected to become a new distributed SESS device to realize the balance between power supply and load demand of the power system. Electric vehicles, DGs and energy storage systems are often non-schedulable due to intermittency and uncertainty. Aiming at the problem, ref. [12] proposes a scheduling framework to deal with a virtual power plant (involving photovoltaic, wind turbine, energy storage system, electric vehicle and diesel generator) by considering relevant operation and safety constraints. In addition, the demand response of the flexible load demand is also considered to improve the economic operation of the virtual power plant. In [13], a novel event-triggered scheduling scheme for vehicle-to-grid operation based on the scenario of stochastic electric vehicle integration into the smart grid is proposed. The contradiction between the mobility of electric vehicles and the highly uncertain availability of SESS in power system are overcome. In [14], a novel robust framework for day-ahead energy scheduling of a smart grid with SESS considering the users’ behavior uncertainty is carried out. The energy payment is saved due to the feasible energy transaction between customers and the power grid in the presence of data uncertainty.
In addition to the operation strategy of SESS, some researchers have studied the economic operations and pricing strategies of SESS; such research is based on the shared economy business model. Indeed, ref. [15] proposes a community-oriented energy storage approach, a sharing framework, and a profit allocation model based on the asymmetric Nash bargaining model and shared storage contribution rate index. The study found that as opposed to individual independent investments, the introduction of SESS can reduce operating costs and improve the utilization rate of renewable power. In order to improve the efficiency of renewable energy usage and to reduce the cost of renewable energy, a SESS framework that considers both power and electricity is proposed in [16]. The study introduced Nash equilibrium theory into the operation strategy, and different non-cooperative game models were used for different consumers; then, the alternative direction multiplier algorithm was used to solve the model. In [17,18], reducing the initial investment cost of SESS and improving the utilization rate of the stored energy were the main tasks of the respective studies; this resulted in the construction of a peer-to-peer energy trading market equilibrium model that considered the consumers in the SESS operation. The market equilibrium problem can be solved using Karush–Kuhn–Tucker optimality conditions and linearization technology; then, it can be transformed into a mixed-integer linear programming solution. In [19], a three-level planning model for different scenarios was established, and the charging and discharging uncertainty of electric vehicles was measured. Profit distribution was based on the Shapley value in order to enhance enthusiasm for individual cooperation in sharing economies; however, most existing studies focus on economic scheduling and the pricing strategy of SESS under normal conditions. The DN operation risk factors are often ignored during the modeling process, and thus, the emergency support capability of SESS during fault periods needs to be taken into account.
There has been a great deal of research on the risk assessments of active distribution networks. In [20], a risk assessment concerning the cascading failures in flexible interconnected DN and the optimal load curtailment model was carried out. The influence of fault locations and DG permeability on risk assessments was also analyzed. In [21], a new risk assessment model is proposed in order to determine the possibility of potential interference in a power system. It was found that the probability of failure, with regard to the regional DN and transmission network, can be calculated accurately based on this new risk assessment model. The failure probability of two dimensions was combined using topology analysis in order to provide accurate suggestions for renewable energy transactions. In [22], an improved online data-driven risk assessment method for flexible DNs is proposed. The study selected 25 basic operational indicators to indirectly reflect the risks of DNs. The complex relationship between indicators and risk is characterized by entropy weights and gray correlation degrees; these weights and degrees can provide information that may culminate in a warning, which can enable the emergency scheduling of flexible DNs. In [23], a risk assessment method concerning power quality variation is proposed for the large-scale integration of PV equipment in low-voltage DNs. Regarding abnormal events that cause variations in power quality, such as voltage amplitude change and phase imbalance, the sequential Monte Carlo method has been used to simulate the probability of risk; this method is based on the proposed site and system indexes. In [24], a new prediction framework based on the DN’s operation risk is proposed. The risk assessment was based on the correlation between possibility and failure impact, and the resilience of the framework was enhanced by improving the perception of power grid’s status; however, most studies have not accurately analyzed the reasons behind power outages in certain scenarios. The capability of peak load shifting and the reliability of the energy that was stored was not considered in the optimization model. Moreover, the risk assessment model is easy to apply.
In order to exploit the power restoration potential of DG when a fault has occurred, the IEEE 1547.4-2011 standard encourages the development of a conscious island partition in an active DN [25]. Island partition is integral to DN risk assessments when a fault has occurred, and it enables the flexible topology change in a DN to be fully considered when a fault has occurred [26]. Via the construction of an island, the power restoration potential of DG can be exploited, and the maximum power outage load can be recovered; therefore, the reliability cost can be maximally reduced. Existing research on island partition has found that the problem can be modeled on the following: mixed-integer nonlinear model [27,28], mixed-integer second-order cone model [29,30,31], and mixed-integer linear programming model [32,33,34]. Of these, the mixed-integer linear programming model is the most widely used due to convenience and its high calculation speed. To solve the island partition, it can be divided using the graph theory partition method [35], the intelligent algorithm [36], and the heuristic algorithm [37]. The graph theory partition method comprises the undirected graph model and directed graph model method. The former usually converts the island partition problem into the minimum spanning tree problem, which is a typical NP hard problem, whereas the current graph theory partition method struggles to reconcile computational speed and accuracy. Regarding the intelligent algorithm, the local searching direction is random; thus, it is not suitable for solving DN island partition problems with radial constraints. The heuristic algorithm can overcome the issue of low calculation speed, which is caused by the repeated iteration of the intelligent algorithm, and it can quickly obtain an island partition scheme with several benefits. It can be applied to DN operations and planning problems as well as risk assessments; however, a SESS is electrically connected to multiple microgrids in DN. The load restoration ability of each DG needs to be comprehensively considered when a fault has occurred; hence, the existing island partition methods are no longer applicable.
In sum, the existing research on SESS optimal scheduling has the following limitations: (1) only explicit operation cost under normal conditions have been considered, meaning that DN operation risks have been ignored in SESS scheduling modeling; (2) the power restoration potential of DG when a fault has occurred has not been fully exploited in existing DN risk assessment models, and the peak load shifting capability and reliability of the stored energy have not been considered; and (3) the island partition model is complex to solve and the convergence speed is low.
In view of the shortcomings of the existing research, a SESS optimal scheduling method that considers the DN operation risk is proposed in this paper. The DN explicit operation cost and reliability cost are both considered in the SESS optimal scheduling model. The main innovations of this paper are as follows:
(1)
A SESS optimal scheduling model, considering both the explicit operation cost and risk, is established. The user’s interruption cost is considered a potential operation risk, and thus, it is regarded as the reliability cost.
(2)
An island partition model with SESS is established to accurately evaluate the reliability cost. The complex island partition model can be solved skillfully through maximum island partition and island optimal rectification.
(3)
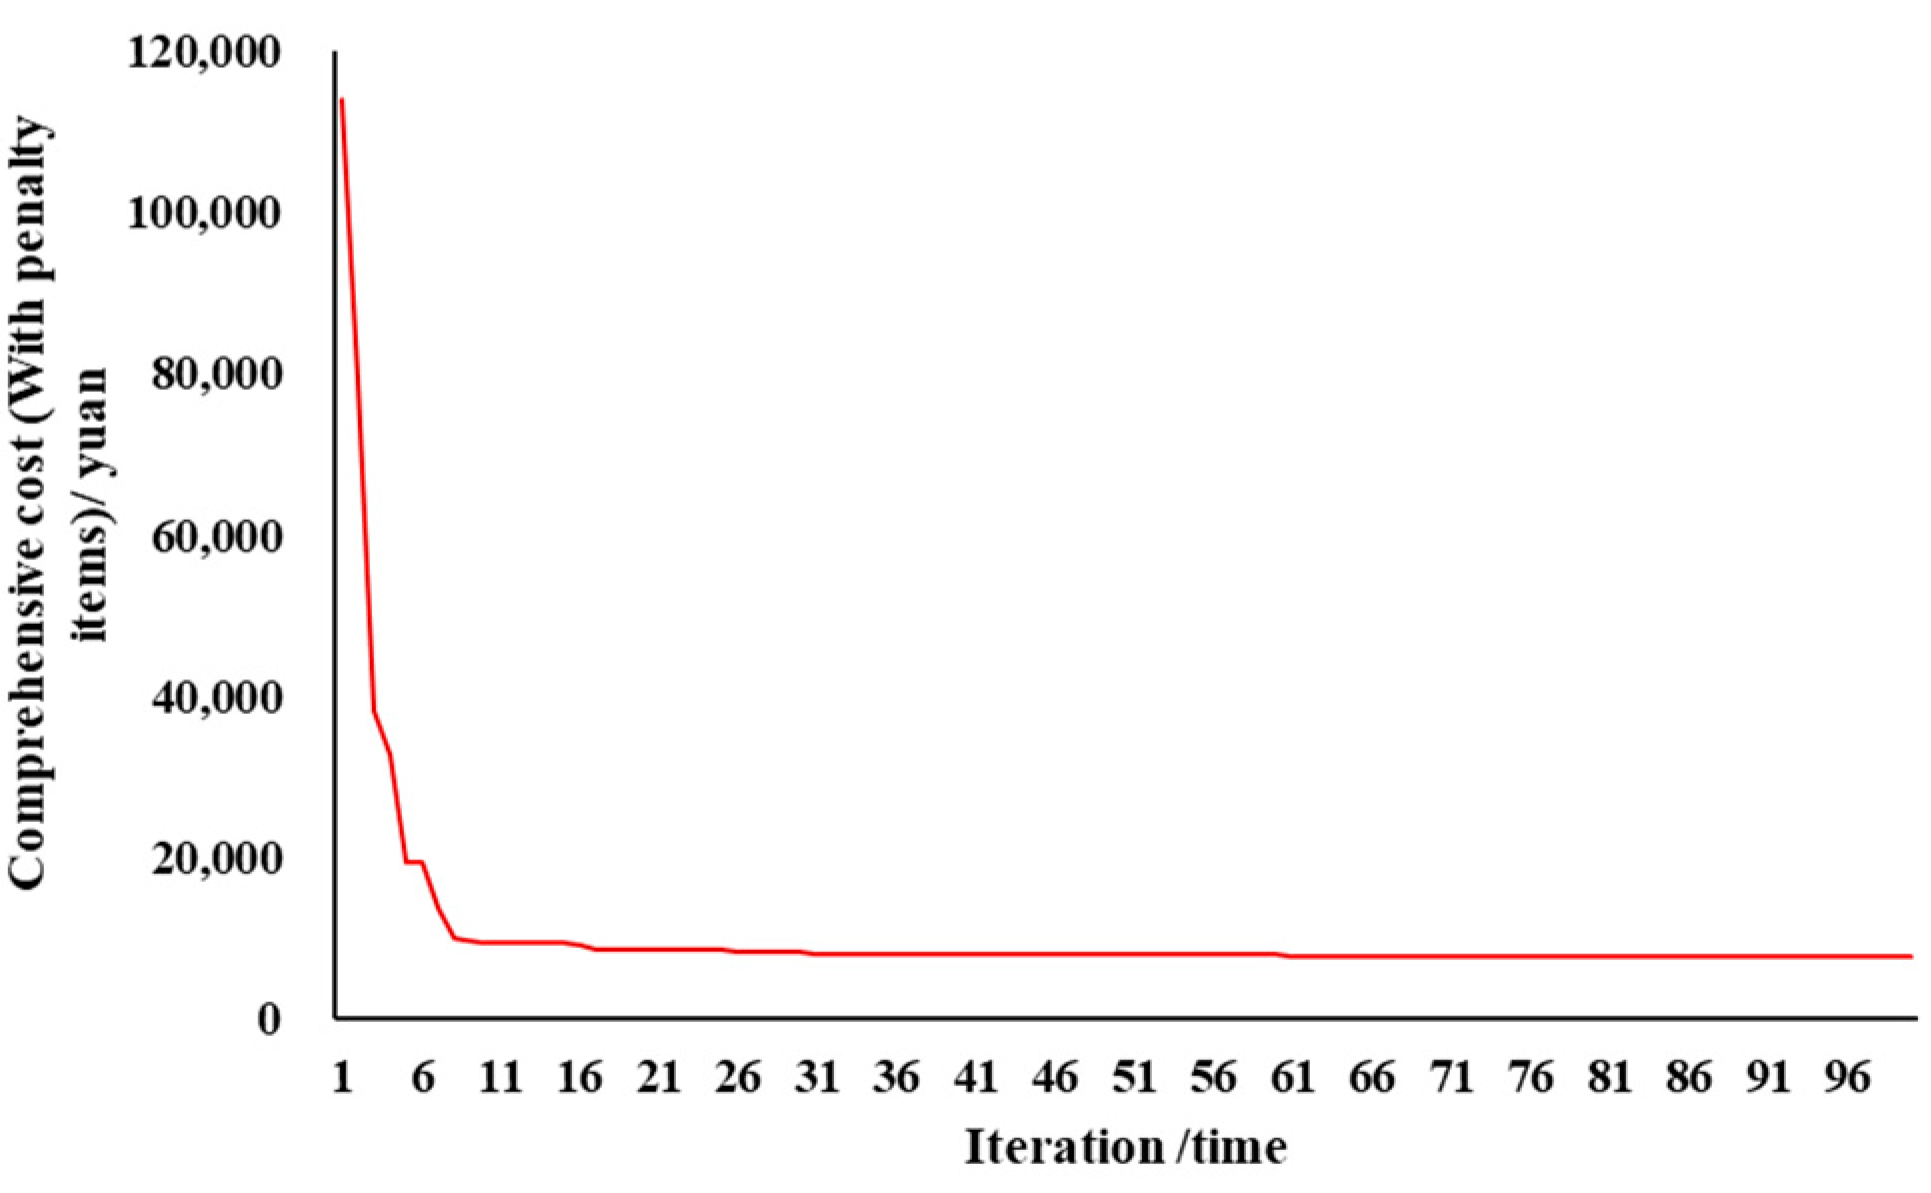
A solving method for the SESS optimal scheduling model, based on a genetic algorithm, is designed. The results show that the proposed method can comprehensively reduce the operation cost by 6.6%.

2. SESS Optimal Scheduling Model Considering DN Operation Risk

Due to climate change, extreme weather events now occur more frequently. Extreme events, such as typhoons and snowstorms, often increase the probability of power system component failures, which cause significant economic losses. The power distribution system comprises one of the final stages of the power system, and customers obtain electricity from the DN directly. An increasing level of attention has been paid the reliability level of DNs, in particular how to effectively enhance DN reliability in order to cope with such extreme weather events. In this paper, it is assumed that the failure probability of DN components is significantly greater in extreme weather scenarios. When some upstream components of a DN are faulty, the downstream load cannot obtain electricity from the superior power grid, and the load that cannot meet that demand will be cut off. In this scenario, both the DG and SESS will be utilized in order to realize power restoration under fault state.

2.1. Costs Related to SESS Scheduling

A SESS usually serves multiple individuals and provides effective services to users through scientific coordination and control. In order to explore the economic operation of DN, it is important to understand the whole operation system, which involves three main bodies: SESS, superior power grids, and consumers. For a SESS, it can interact with a DN in order to complete the charging and discharging operations. Its income is mainly derived from the rental expenses that are charged by the DN operator, which then enables the system to charge and discharge power. For DN consumers, there are three ways to obtain electricity: ① Configure wind turbines, PV equipment, and other equipment that is related to renewable power generation; ② Purchase electricity from the superior power grid. ③ Obtain electricity from the discharging operation of the SESS. In addition, the DN can also charge the SESS or sell electricity to the superior power grid when a great deal of renewable power has been generated. The calculation method of the DN operation cost is as follows: In the paper, four operation costs are considered for DN day-ahead operation and scheduling. The sum of these four costs is the comprehensive operation cost. Among these, C1 + C2 + C3 is the cost of accurate data based on the meter measurement information, which is regarded as “explicit operation cost”. For C4, it is an effective consideration of the potential expected fault scenarios, and its occurrence is a probability event. At present, the compensation mechanism for customer power outage has not been promoted in our country. This cost is not obvious, and it is regarded as an “implicit operation cost”.
(1)
The cost of purchasing and selling electricity with superior power grid C1
C 1 = t = 1 T ( C t , buy grid P t , buy grid C t , sell grid P t , s e l l grid )
where, T denotes the operation period. P t , buy grid denotes the power purchased from the superior power grid at time t. C t , buy grid denotes the unit price of the purchased power from the superior power grid. P t , sell grid denotes the power sold to the superior power grid at time t. C t , sell grid denotes the unit price of sold power to the superior power grid and it is different from C t , buy grid .
(2)
The line loss cost in the DN operation C2
C 2 = C t , buy grid i N I i j 2 r i j j N B i
where, N denotes the load node set of the DN. NBi denotes the adjacent load nodes of node i. r i j denotes the resistance between node i and node j (nodes i and j are connected). I i j 2 denotes the square of the branch current between node i and node j.
(3)
Rental expenses charged by the DN operator C3
C 3 = C ES t = 1 T max { P i , t dis , P i , t cha }
where C ES denotes the loss cost equivalent to 1 kWh of charging/discharging. P i , t dis denotes discharging power of node i at time t. P i , t cha denotes charging power of node i at time t.
(4)
Reliability cost C4
In the same way that the DN operation and equipment maintenance incur losses, people’s social lives also suffer greatly when power failure occurs in important loads. This can be regarded as reliability cost C4, and it can be calculated as shown in Equation (4):
C 4 = p r o k t = t 1 t 2 i F C EENS P R i P i , t load
where, CEENS denotes the cost of the unit power outage. prok denotes the probability of the kth fault scenario occurring. t1 denotes the initial moment of the fault. t2 denotes the end moment of the fault. PRi denotes the load priority of load i. P i , t load denotes the active load demand of node i at time t. F denotes the set of cutting load nodes.

2.2. The Operation Constraints of the DN with SESS

(1)
The security constraints of the node voltage and branch current
The voltage amplitude between adjacent nodes meets the following voltage drop constraints:
U j , t 2 = U i , t 2 2 ( r i j P i j , t + x i j Q i j , t ) + ( r i j 2 + x i j 2 ) I i j , t 2
I i j , t 2 = P i j , t 2 + Q i j , t 2 U i , t 2
The operating state of the DN is limited to a safe range, and the branch current and node voltage amplitude are constrained, as follows:
I i j , t 2 I i j , max 2
U i , min U i , t U i , max
where, U i , t and U j , t denote the voltage amplitudes of node i and j at time t, respectively. It should be noted that node i is the head node of branch ij and node j is the end node. x i j denotes the branch reactance of branch ij. P j i , t and Q j i , t denote the active and reactive power from node j to node i at time t, respectively. U i , min and U i , max denote the lower and upper voltage amplitudes of node i. I i j , max denotes the upper current limit of each branch.
(2)
Active and reactive power balance constraints
The power injected into each node is required to meet the power balance constraints; the following constraints were designed in accordance with the DistFlow power flow model.
P j i , t r i j I i j , t 2 k H ( i ) P i k , t = P i , t load P i , t PV P i , t WT P i , t ES
Q i , t load = Q j i , t x i j I i j , t 2 k H ( i ) Q i k , t  
where, H(i) denotes the node set connected with node i. Q i , t load denotes the reactive load demand of node i at time t. P i , t PV denotes the output of the PV equipment of node i at time t. P i , t WT denotes the output of the wind turbine of node i at time t. The item is 0 if the DG is not installed at node i. P i , t ES denotes the discharging power of integrated node i at time t. The item is negative if the SESS is in a charging state.
(3)
Radial operation constraints of the DN
β i j + β j i = ω i j i N , j N B i
β k j = 0 k j k N
β i j { 0 , 1 } i N , j N B i
j N E i β i j = 1 i N , i k
0 ω i j 1 i N , j N B i
where, β i j and β j i are 0–1 variables of branch ij, and they assist in judging whether the DN maintains its radial operation capabilities. ω i j is a 0–1 variable that can judge the switch status of branch ij. When the line is closed, ω i j is 1. Otherwise, ω i j is 0.
(4)
Upper limit constraint of the DG output
P i , t PV P i , t PV , max i Λ DG
P i , t WT P i , t WT , max i Λ DG
where, P i , t PV denotes the PV equipment output of node i at time t. P i , t PV , max denotes the maximum PV equipment output of node i at time t. P i , t WT denotes the wind turbine output of node i at time t. P i , t WT , max denotes the maximum wind turbine output of node i at time t. Λ DG denotes the load nodes with DG integration.
(5)
Operation constraints of SESS
Upper and lower limit constraints of the SESS remaining power
E min E i , t E max i Λ ES , t [ 1 , T ]
where, Ei,t denotes remaining power of the SESS of node i at time t. Emin and Emax denote the lower and upper limits of the remaining power. If multiple SESS are integrated to the DN, Λ ES denotes the load nodes that are integrated with a SESS.
Initial remaining power state constraint of SESS
E i , t = E i , T last i Λ ES t = 1
where, t = 1 denotes the initial moment during the operation period, and the remaining power from this moment can be obtained depending on the remaining power E i , T last from the last simulation period.
SESS charging and discharging operation
E i , t = E i , t 1 P i , t dis + P i , t cha i Λ ES , t [ 1 , T ]
Constraints restricting SESS from charging and discharging at the same time
0 u i , t cha + u i , t dis 1 i Λ ES , t [ 1 , T ]
where, u i , t cha is a 0–1 variable of the charging state; it is 1 when the SESS is charging, and it is 0 when discharging. u i , t dis is a 0–1 variable of the discharging state; it is 1 when the SESS is discharging.
Upper and lower limit constraints on charging and discharging
E max u i , t cha β min P i , t cha E max u i , t cha β max i Λ ES , t [ 1 , T ]
E max u i , t dis β min P i , t dis E max u i , t dis β max i Λ ES , t [ 1 , T ]
where, βmin and βmax are the upper and lower limits representing the charging and discharging states.

2.3. SESS Optimal Scheduling Model

Based on the DN and SESS operation constraints, the SESS optimal scheduling model, which minimizes the comprehensive operation cost, was established, and is shown in Equation (24).
min C = C 1 + C 2 + C 3 + C 4 s . t . { Equations   ( 1 ) ( 4 )   DN   operation   cos t   calculation   method Equations   ( 5 ) ( 8 )   Node   voltage   and   branch   current   constraints Equations   ( 9 )   and   ( 10 )   Active   and   reactive   power   balance   constraints Equations   ( 11 ) ( 15 )   DN radial   operation   constraint Equations   ( 16 )   and   ( 17 )   DG   output   upper   limit   constraint Equations   ( 18 ) ( 23 )   SESS operation   constraints
The SESS optimal scheduling model with complex constraints cannot be directly solved. However, it is evident that the comprehensive cost is divided into two parts: the explicit operation cost and reliability cost. These two factors can be calculated using the SESS day-ahead economic scheduling model and the DN risk assessment model, respectively; therefore, the optimal scheduling problem can be converted into a multi-objective programming problem, and it can be solved satisfactorily using an intelligent algorithm. In a DN explicit operation cost, the day-ahead economic scheduling model can be transformed into a second-order cone optimization problem using the variable substitution method [38]; then, it can be solved quickly using commercial software. For reliability cost C4, the island partition is an effective and accurate method for DN risk assessment; however, the SESS sequential characteristic and secondary outage constraints need to be considered in the risk assessment model, which makes the island partition a complex problem. Moreover, the island partition model is usually solved using an intelligent algorithm; however, the convergence speed is low, so it is not suitable for the optimal scheduling problem.

3. Reliability Cost Evaluation Based on Island Partition

In order to accurately calculate the reliability cost, the island partition scheme is formulated for specific fault scenarios that are based on the power restoration ability of the SESS and DG; then, the island partition result is converted into the reliability cost, and it is included in the SESS optimal scheduling model. Island partition is a unique problem; when a fault occurs, the DG and SESS may be considered as a backpack, which has the ability to output the remaining power. The downstream load nodes may be considered as the items that can be put into the backpack, and the load demand is the weight of the backpack. The product of the load demand, and the ability to prioritize what is put into the backpack, is a benefit of island partition. However, compared with the common knapsack problem, the sequential characteristics of DG, load demand, and the SESS’s remaining electricity need to be considered during island partition. Moreover, the load nodes that are drawn into the island need to meet the connectivity constraints, as well as other important constraints. The interwoven constraints mean that island partition is a complex NP-hard problem.
In this paper, a two-stage solving method was used to formulate the alternating island partition scheme so that the final scheme could be obtained quickly. During the first stage, a maximum island partition scheme was formulated in order to obtain the potential optimal version of the scheme based on the sufficiency information from DG and SESS. During the second stage, the maximum island partition scheme was rectified based on the power balance information. The obtained scheme after island optimal rectification is the final version of the island partition scheme. The key to realizing two-stage island partition is to break down the island partition model into the following: the maximum island partition model and the island optimal rectification model.

3.1. Maximum Island Partition Model

(1)
Objective function
In order to restore power to as many important loads as possible, the load nodes are prioritized in accordance with the level of importance. A high priority indicates that the load is important. The product of prioritizing the loads in the island is regarded as benefit B1. The benefit value is also the objective function of the island partition model:
B 1 = i N [ ( 1 S T i ) t = t 1 t 2 ( P i , t load P R i ) ]
(2)
Secondary outage constraint
During fault periods [t1, t2], the load nodes that are drawn into the island shall be satisfied at all moments:
S T i = { 1 i f s t i , t = 1 i N , t [ t 1 , t 2 ] 0 i f s t i , t = 0 i N , t [ t 1 , t 2 ]
s t i , t = { 1 i f i a = 1 A Ω a i N , t [ t 1 , t 2 ] 0 i f i a = 1 A Ω a i N , t [ t 1 , t 2 ]
where, STi and sti,t are 0–1 binary variables relating to the secondary outage constraint. sti,t is 1 if node i is drawn into the island at time t; otherwise, it is 0. If all values of sti,t are 1 during fault periods [t1, t2], STi is 1; otherwise, it is 0. Ω a denotes the load node set of the ath island. A denotes the number of islands.
(3)
Non-intersections of each island
Ω a Ω b = a [ 1 , A ] , b [ 1 , A ] , a b
Λ a DG Λ b DG = a [ 1 , A ] , b [ 1 , A ] , a b
where, Λ a DG denotes the DG set of the ath island. The above equation denotes that the intersection of the islands in the DN is empty; this means that two islands cannot hold the same load nodes at the same time.
(4)
Maximum electricity sufficiency constraint
During fault periods, the sum of the SESS’s remaining electricity at the initial moment and the total DG output at each moment is regarded as the maximum electricity sufficiency value. The value needs to be higher than the load demand of the nodes that are drawn into the island. This process aims to determine the potential optimal island range and maximum electricity sufficiency constraint; the process is as follows:
t = t 1 t 2 i Ω a P i , t load s t i , t E i , t 1 + t = t 1 t 2 i Λ a DG P i , t PV + P i , t WT a [ 1 , A ]
Based on the above constraints, the maximum island partition model is established as follows:
min B 1 = i N [ ( 1 S T i ) t = t 1 t 2 ( P i , t load P R i ) ] s . t . { Equations   ( 26 )   and   ( 27 ) Sec ondary   outage   constraint Equations   ( 28 ) ( 29 )   Non - intersection   of   each   island constraint Equation   ( 30 ) Maximum   electricity   sufficiency   constraint Equations   ( 11 ) ( 15 )   DN radial   operation   constraint Equations   ( 16 )   and   ( 17 ) DG   output   upper   limit   constraint Equation   ( 19 ) SESS   initial   remaining   power   constraint

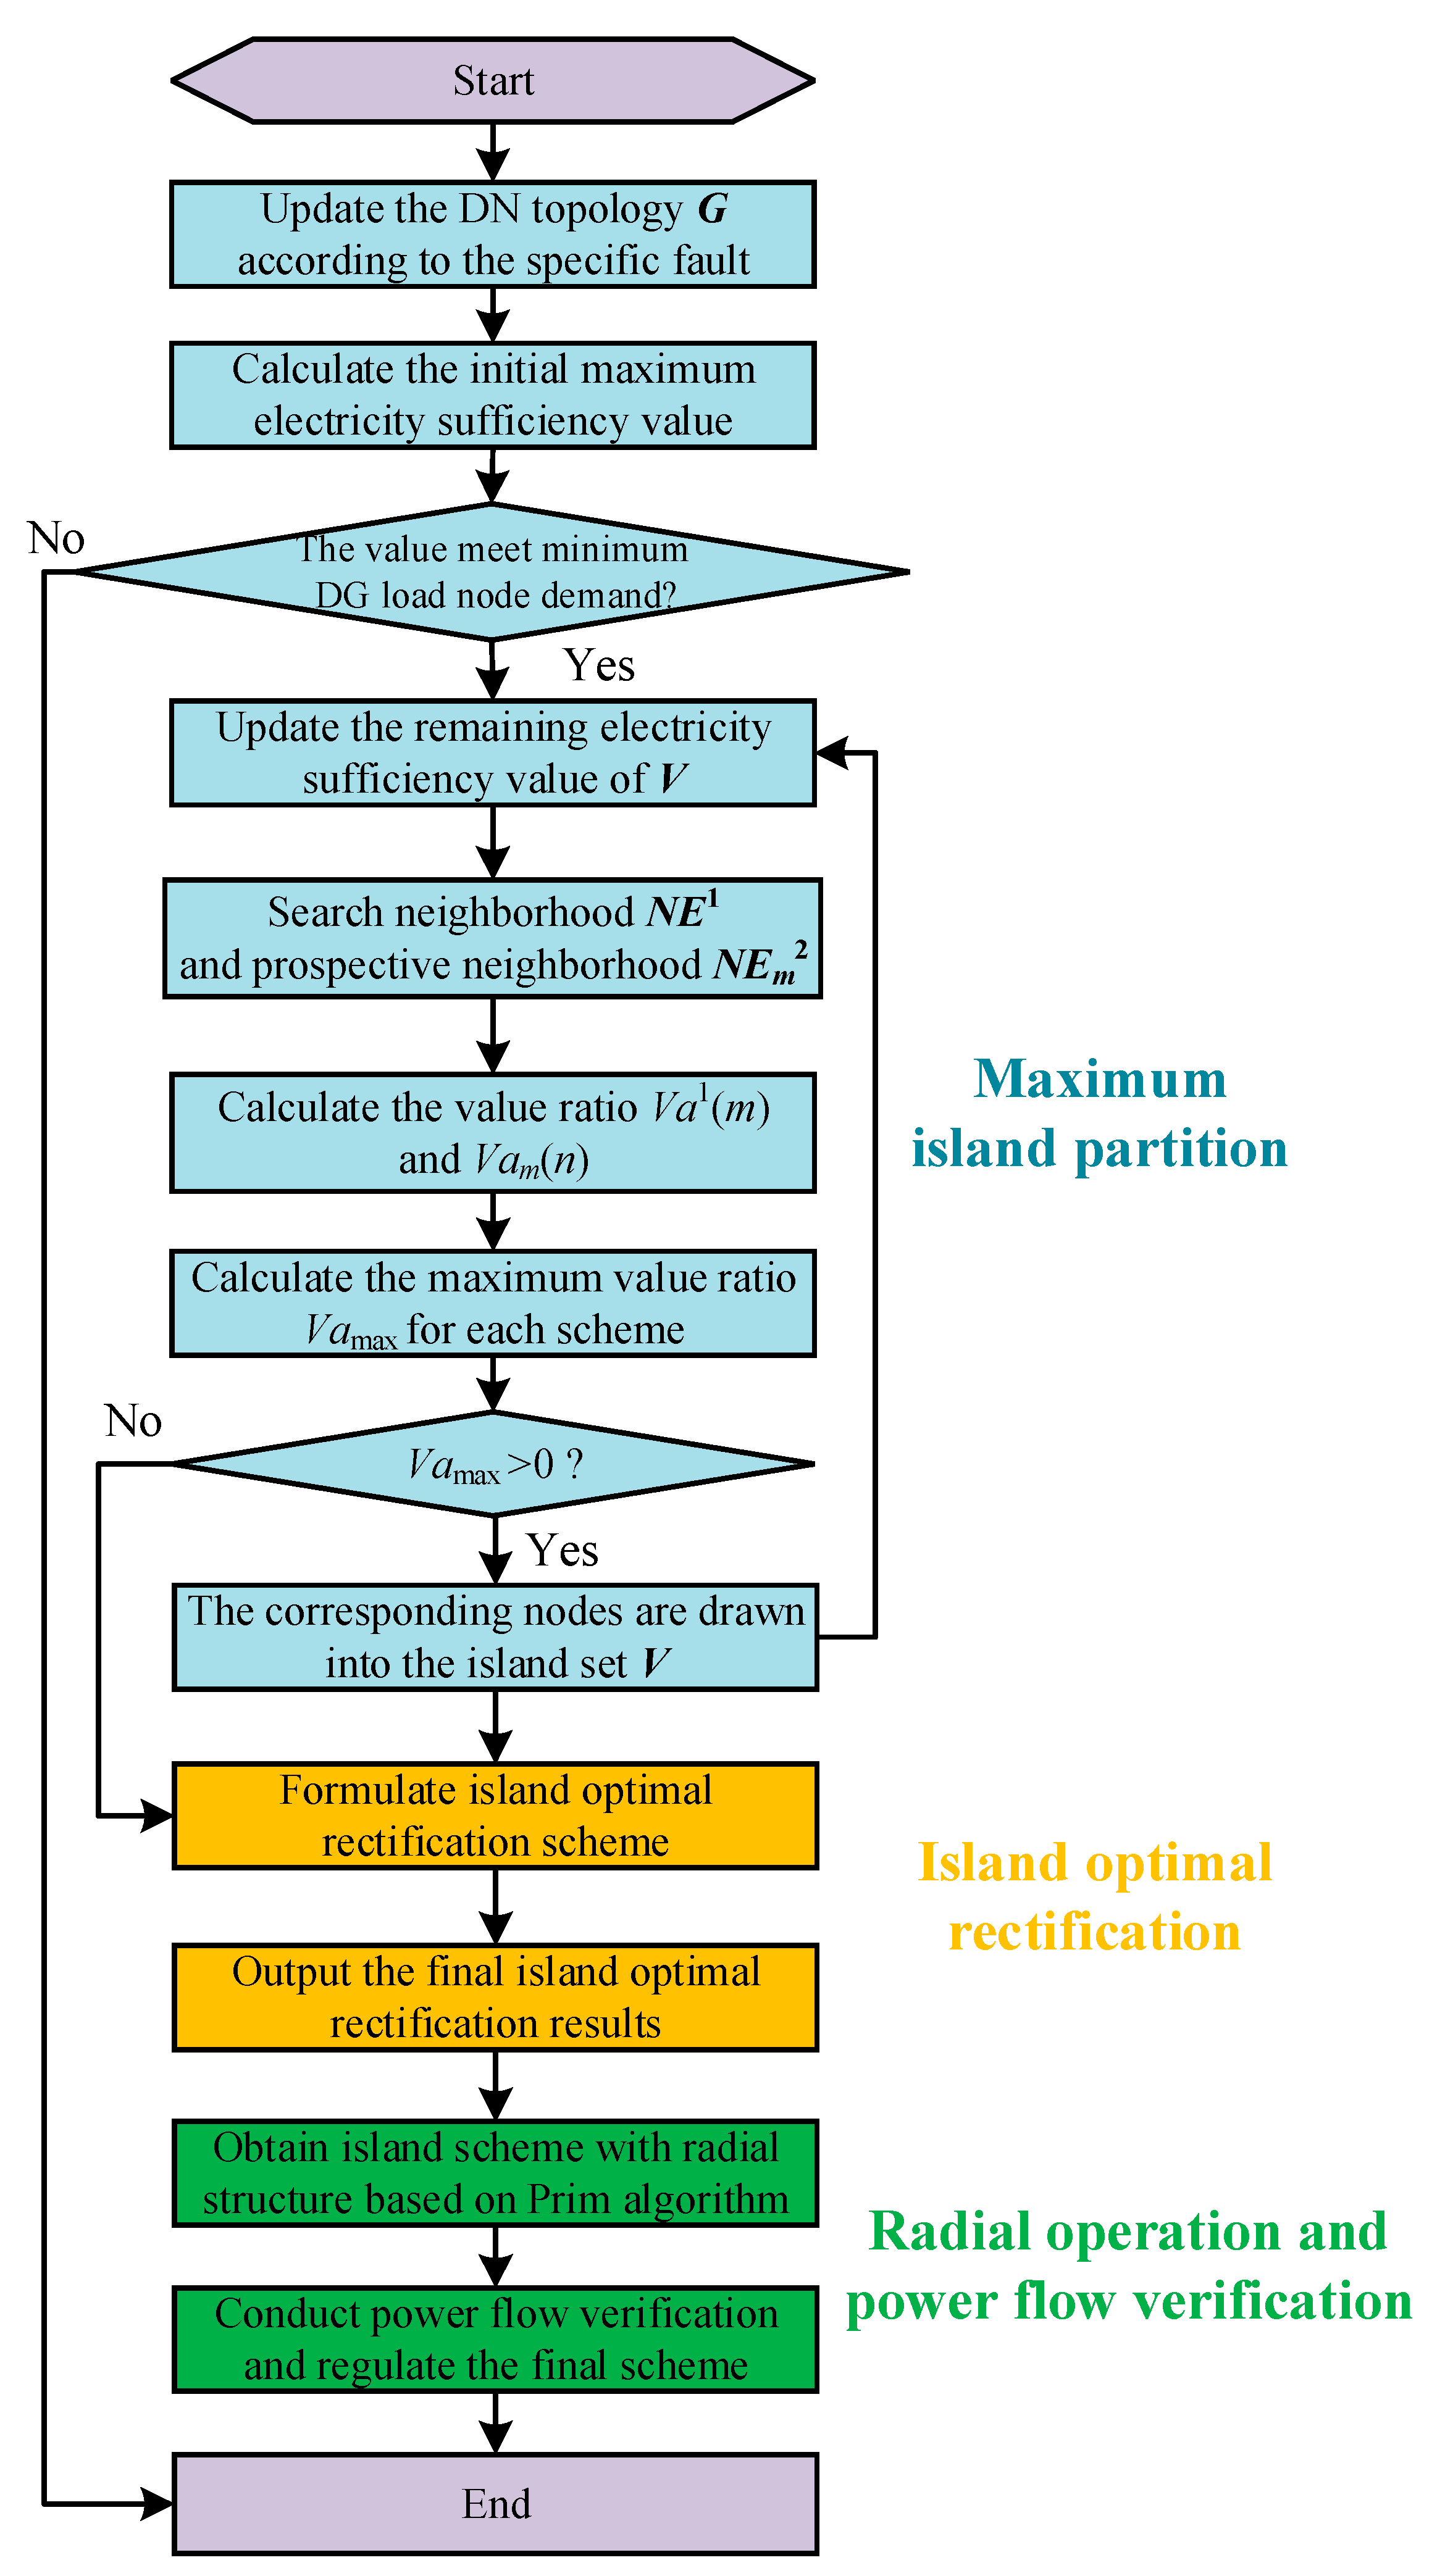
3.2. Heuristic Prospective Greedy Algorithm

The maximum island partition model can be quickly solved using the heuristic prospective greedy algorithm [26]. Compared with the common intelligent algorithm, the heuristic algorithm effectively overcomes the slow computation problem that is caused by repeated iterations of the algorithm. The limitations of a single-step selection are effectively avoided by introducing a prospective neighborhood; this is because the introduction of the neighborhood extends the search for power restoration. The solution speed for island partition and the benefits of island partition can thus be reconciled.
It is assumed that the component l is faulty, and the downstream load of the DN cannot obtain power from the superior power grid. The load nodes in the outage area are denoted as G, and the number of DGs in G is NDG. The calculation process for the heuristic prospective greedy algorithm is as follows:
(1)
Calculate the initial maximum electricity sufficiency value in accordance with the following equation to determine whether the NDG integrated nodes can be restored. If all integrated nodes cannot be restored, the fault will result in the power failure of all loads in set G.
C R = E i , t 1 + t = t 1 t 2 i Λ a DG ( P i , t PV + P i , t WT ) t = t 1 t 2 i V P i , t load t [ t 1 , t 2 ] , a [ 1 , A ]
(2)
Update the maximum electricity sufficiency value in accordance with the above equation. Search the neighborhood and prospective neighborhood of island set V and calculate the value ratio.
For the neighborhood set NE1 of island set V, each node in set NE1 does not belong to V and it is connected with at least one node in V. For the prospective neighborhood set NEm2 of island set V, each node in set NEm2 does not belong to V and NE1. However, the nodes in NEm2 are connected with at least one node in NE1. After searching the NE1 and NEm2, calculate the value ratio of each combination. For the mth node NE1 (m) in NE1 (m = 1, 2, …, N0), its value ratio Va1 (m) can be calculated as follows:
V a 1 ( m ) = { t = t 1 t 2 P N E 1 ( m ) , t load P R i t = t 1 t 2 P N E 1 ( m ) , t load , i f t = t 1 t 2 P N E 1 ( m ) , t load C R m { 1 ,   2 , , N 0 } 0 , i f t = t 1 t 2 P N E 1 ( m ) , t load > C R m { 1 ,   2 , , N 0 }
Regarding the combination between the mth node NE1 (m) in NE1 and the nth node NEm2 (n) in NEm2 (n = 1, 2, …, Nm), the value ratio Vam (n) can be calculated as follows:
V a m ( n ) = { t = t 1 t 2 P N E 1 ( m ) , t load P R i + t = t 1 t 2 P N E m 2 ( n ) , t load P R i t = t 1 t 2 P N E 1 ( m ) , t load + t = t 1 t 2 P N E m 2 ( n ) , t load , i f t = t 1 t 2 P N E 1 ( m ) , t load + t = t 1 t 2 P N E m 2 ( n ) , t load C R m { 1 ,   2 , , N 0 } , n { 1 ,   2 , , N m } 0 , i f t = t 1 t 2 P N E 1 ( m ) , t load + t = t 1 t 2 P N E m 2 ( n ) , t load > C R m { 1 ,   2 , , N 0 } , n { 1 ,   2 , , N m }
(3)
Select the combination with the best value ratio and draw the nodes into the island. The best value ratio Vamax is the maximum value ratio in set NE1 and NEm2:
V a max = max { max { V a 1 ( m ) } , max { V a m ( n ) } } m { 1 , 2 , , N 0 } , n { 1 , 2 , , N m }
If Vamax is greater than 0, the corresponding combination will be drawn into the island; then, refer to step (2). If multiple combinations have the same value ratio, the combination with the highest load demand will be accepted. If Vamax is 0, the searching process is complete.
(4)
Judge whether each part of the island satisfies the radial operation constraints of the DN. If there is a ring network, the minimum spanning tree Prim algorithm [39] will be used to break the ring network, and the maximum island partition scheme with a radial structure is obtained.

3.3. Island Optimal Rectification Model

The solution scheme obtained by the maximum island partition model is a scheme that can potentially satisfy the electricity sufficiency constraint. It is also necessary to rectify the scheme based on the power balance information in order to obtain the final scheme. The power balance constraints are as follows:
i Ω a P i , t load s t i , t = j Λ a DG P j , t dis P j , t cha + P j , t PV + P j , t WT
The optimal rectification model based on power balance information is given in (37). Compared with the maximum island partition model, the relevant constraints concerning power balance information and SESS operations are added to the rectification model. Moreover, the optimized scheme, in accordance with the objective function, occurs in island set V, not in load node set N. The flow diagram depicting island partition is shown in Figure 1. It should be noted that the final island scheme is required to meet the node voltage and branch current constraints. If the limit is exceeded, load cutting or wind and solar curtailment must be carried out to ensure the safe and stable operation of the island when a fault has occurred. Next, the power outage loss index of the final island scheme is obtained, and the reliability cost can be calculated based on Equation (4).
min B 2 = i V [ ( 1 S T i ) t = t 1 t 2 ( P i , t load P R i ) ] s . t . { Equations   ( 25 )   and   ( 26 ) Sec ondary   outage   constraint Equations   ( 11 ) ( 15 )   DN radial   operation   constraint Equations   ( 16 )   and   ( 17 ) DG   output   upper   limit   constraint Equations   ( 18 ) ( 23 )   SESS operation   constraints Equation   ( 36 ) Power balance constraint

4. Method to Solve the SESS Optimal Scheduling Model
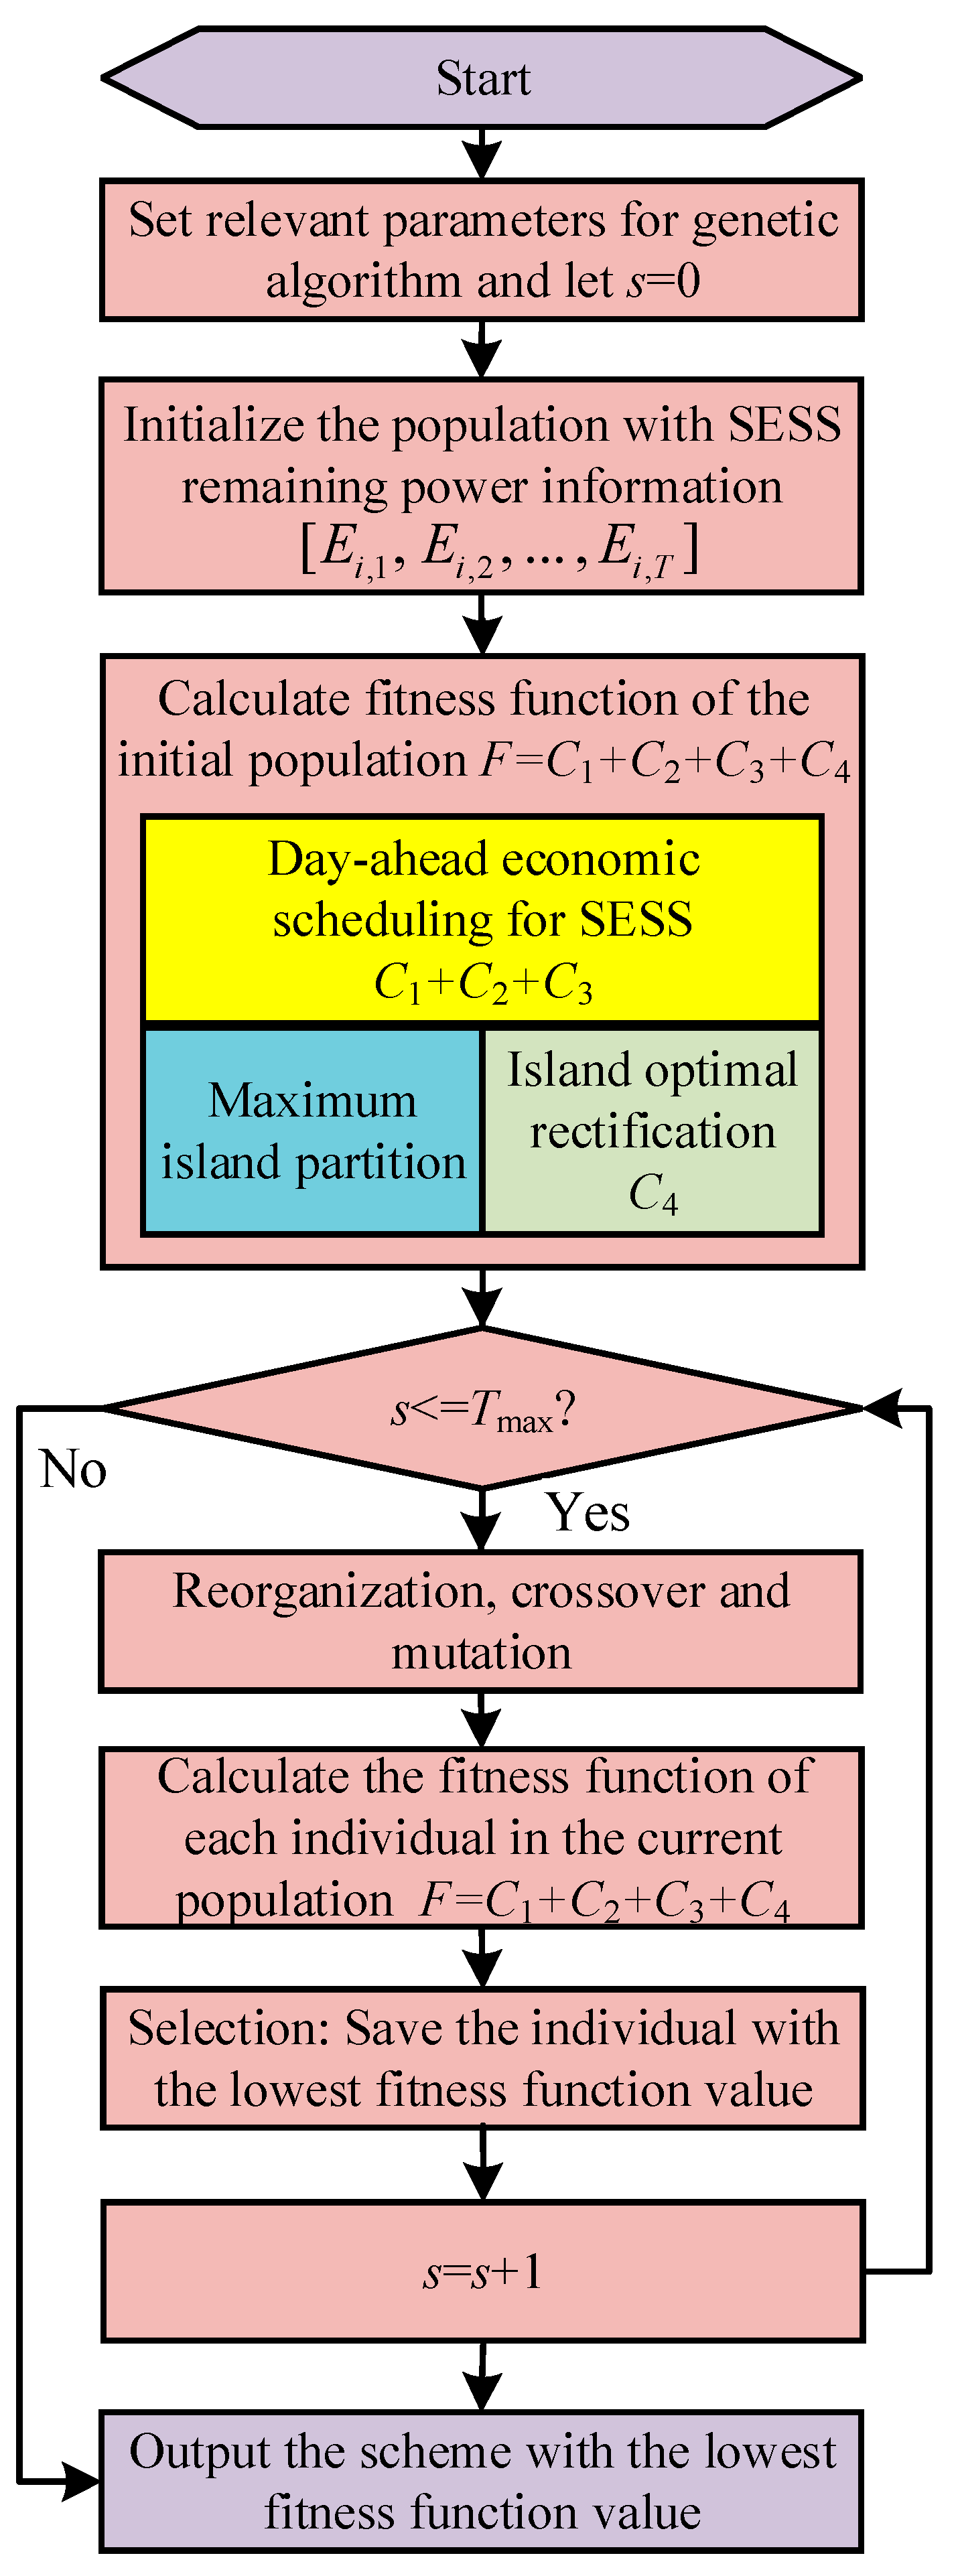
The decision variable of the model is the SESS scheduling strategy. The optimal scheme is difficult to obtain directly via the complex model; however, the SESS optimal scheduling model, when it considers the DN operation risks, can be divided into the day-ahead economic scheduling model (under normal conditions) and the reliability cost evaluation model (under faulty conditions). Moreover, the explicit operation cost and reliability cost can be calculated quickly using the respective two models; therefore, the intelligent algorithms are effective methods to solve this multi-objective optimization problem. In this paper, the genetic algorithm is used to solve the SESS optimal scheduling model that considers the DN operation risks. The genetic algorithm is designed and proposed in accordance with the law of evolution in nature. The evolution process, which involves processes such as selection, crossover, and mutation, is simulated during the iterative calculation process, and the optimal solution can be obtained after controlling the search process in an adaptive manner. When solving complex combinatorial optimization problems, a genetic algorithm can usually obtain better optimization results compared with conventional optimization algorithms [40]. The steps of genetic algorithm [41] are as follows. The solution process of the SESS optimal scheduling model considering DN operation risk is shown in Figure 2. The steps required for the genetic algorithm are as follows:
(1)
Initialization and information setting: Set the maximum evolution iteration number Tmax. Set the number of evolution iterations s to 0. Set the number of chromosomes and gene dimensions, and the probability of selection, crossover, and mutation. Set the information for the maximum DG output, load demand curve, and other important data during the simulation period.
(2)
Individual fitness assessment: m individuals are randomly generated to represent the initial population. Each individual impacts the remaining electricity of the SESS [ E i , 1 , E i , 2 , , E i , T ] at each moment during the simulation period. Calculate the explicit operation cost and reliability cost in accordance with the above-mentioned information. The sum of the two costs is regarded as the fitness function. A low fitness function value indicates a better SESS optimal scheduling scheme.
(3)
Selection: Select the individual with the lowest fitness function in the population, save the remaining electricity, and record the individual’s information. The purpose of the selection process is to ensure that the next generation directly inherits the optimized traits.
(4)
Crossover: The crossover plays a key role in the genetic algorithm. The crossover operation adopts the “monarch scheme”; that is, it ranks the population according to the fitness value and uses the best individual to cross with all other individuals with even numbers. After each crossover, two new individuals are generated.
(5)
Mutation: After crossover operators, mutation operators are conducted. Each individual in the population will have a certain mutation rate to change the gene of some individual strings in the population. It guarantees the richness and diversity of genes in the population. The individual before mutation is called the parent individual and the individual after mutation is called the sub-individual. Multiple genes are mutated on the newly generated parent-individual base on mutation rate 0.1 and then calculate the individual fitness value. The sub-individual and parent individual are merged and ranked according to the fitness value. This assumes that the number of the initial individual is NP and the NP individuals with the highest fitness value are drawn into the next iteration.
(6)
Each generation is obtained after the selection, crossover, and mutation processes; these processes are based on the population of the previous generation. When the number of iterations s reaches the maximum upper limit Tmax, the output of the individual with the lowest fitness function, SESS, and remaining electricity is the optimal scheme; in this instance, the iteration calculation is over. Otherwise, return to Step (2).

5. Case Study

5.1. System Parameters

In this section, the SESS optimization scheduling model that considers the DN operation risks is carried out for the improved PG&E 69-bus system. The topology of the improved PG&E 69-bus system is shown in Figure 3. In this system, a 2 MW wind turbine is integrated into node 5, and 3 MW PV equipment is integrated into nodes 18 and 52, respectively. All integrated DGs are directly connected to the SESS, and the maximum capacity of the SESS is 8 MW. Initially, the remaining electricity of the SESS reaches half the maximum capacity, that is, 4 MW. The maximum charging and discharging capacity are 2 MW for each moment. The interconnection switches, 11–66, 13–21, 15–69, 27–54, and 39–48, in the DN are considered to be open switches under normal conditions. The load priority of each node in the system is shown in Appendix A. The variations in DG output and load demand during simulations are shown in Appendix B. In the day-ahead economic scheduling stage, DN consumers can purchase or sell electricity from the superior power grid based on ‘peak and valley’ electricity prices. The specific information on electricity prices is given in Appendix C. In addition, the SESS charges 0.3 yuan per kWh for each charge or discharge.

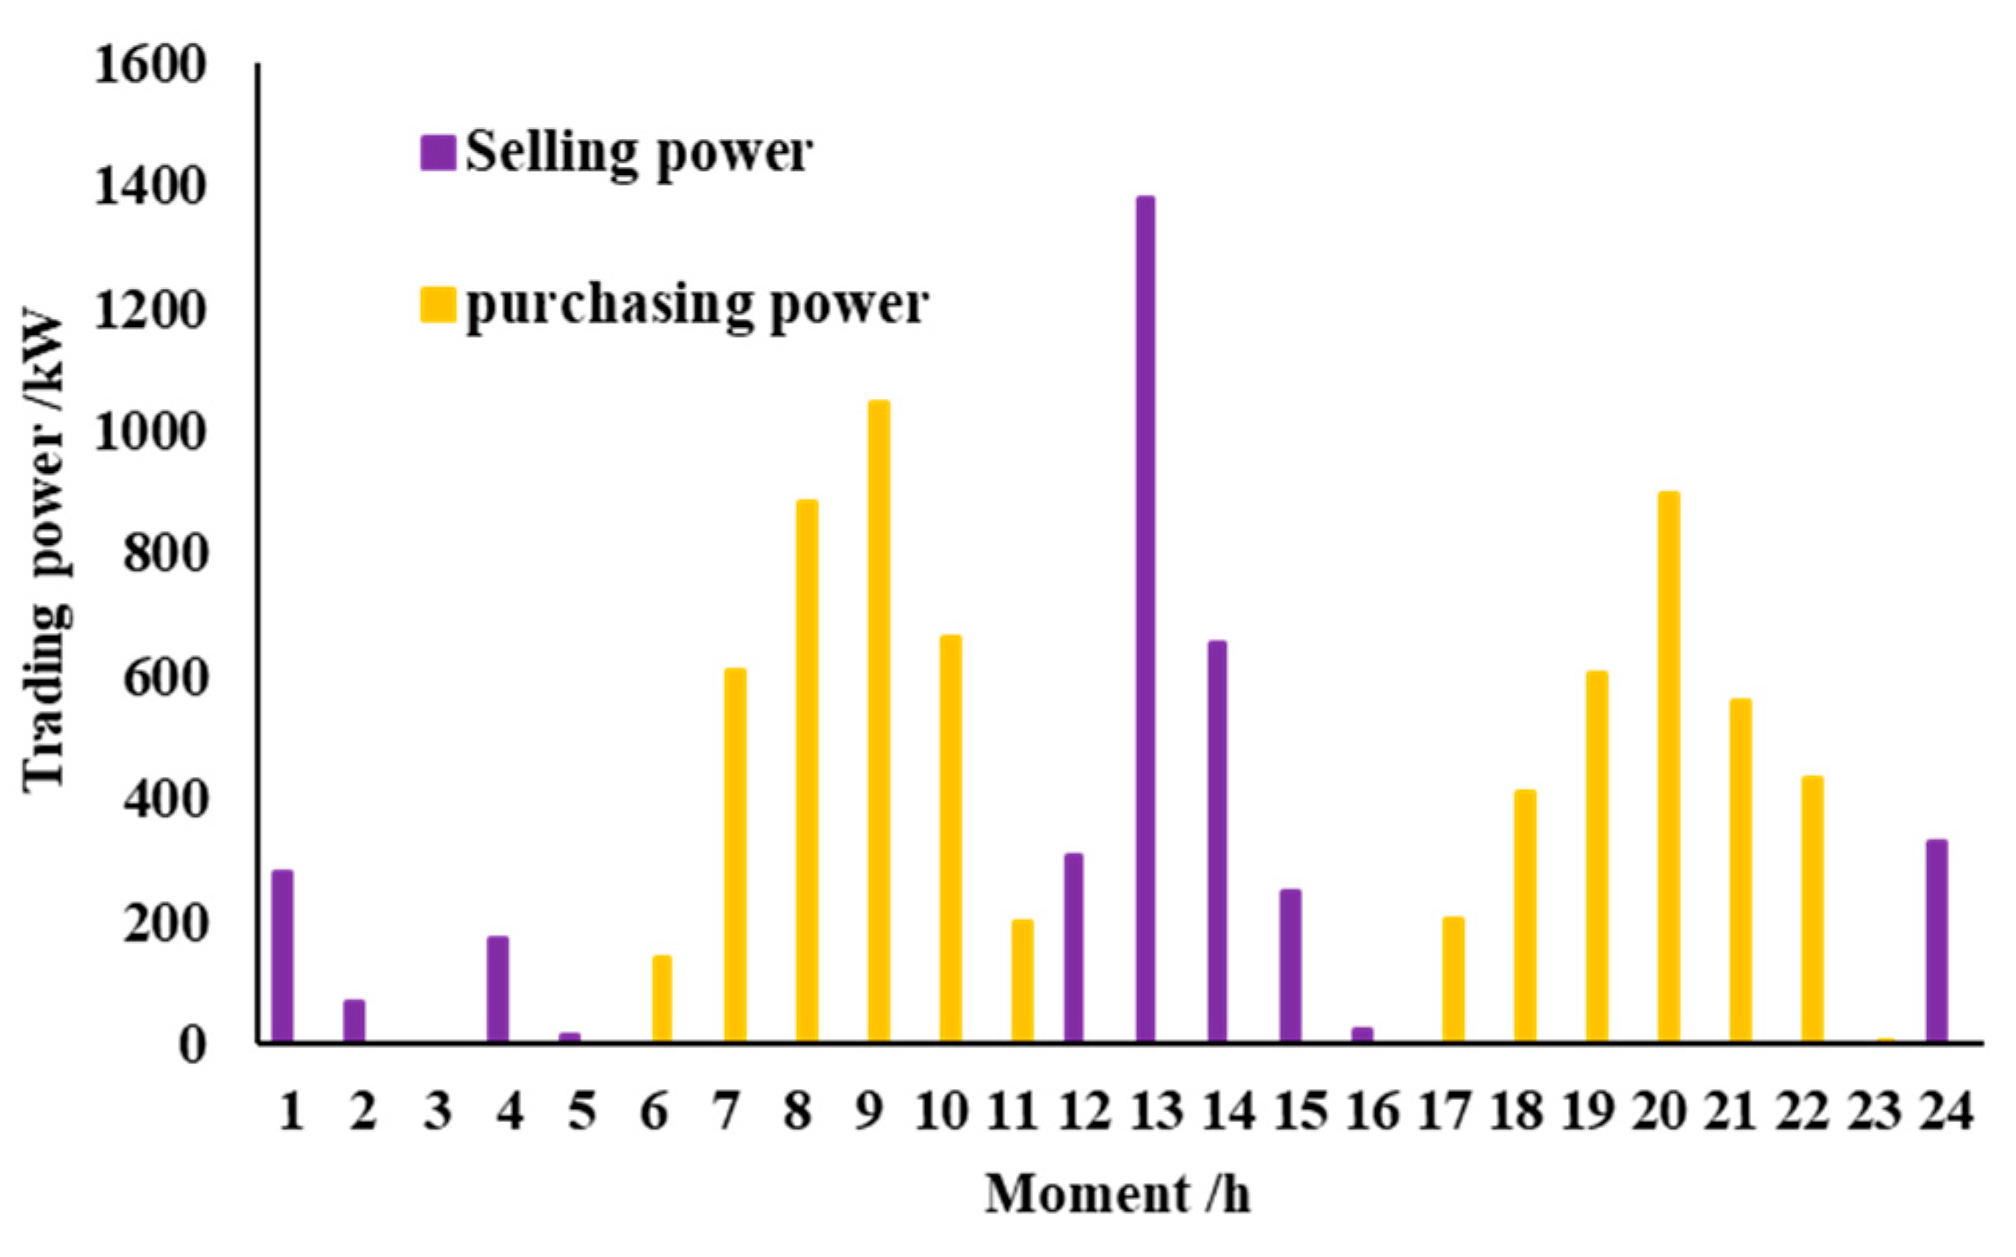
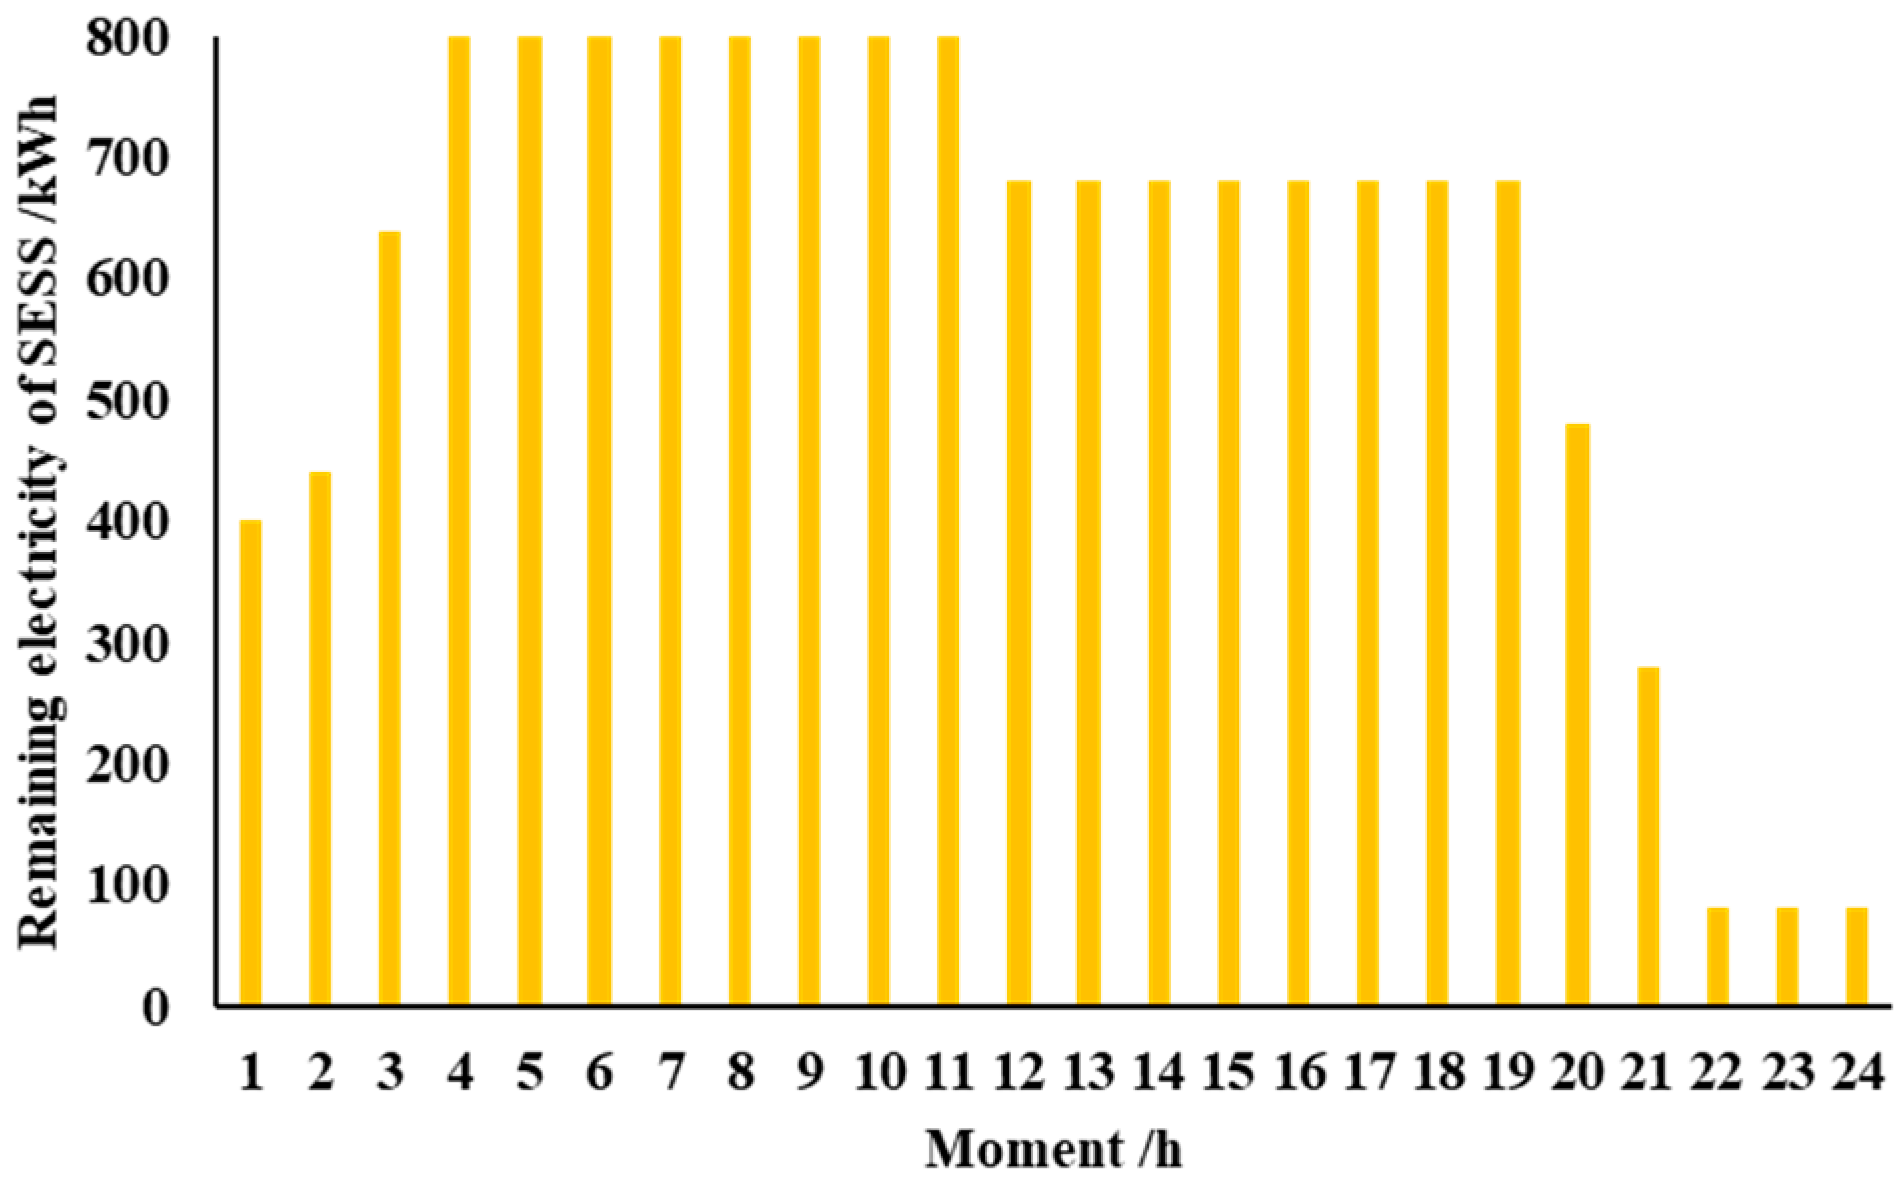
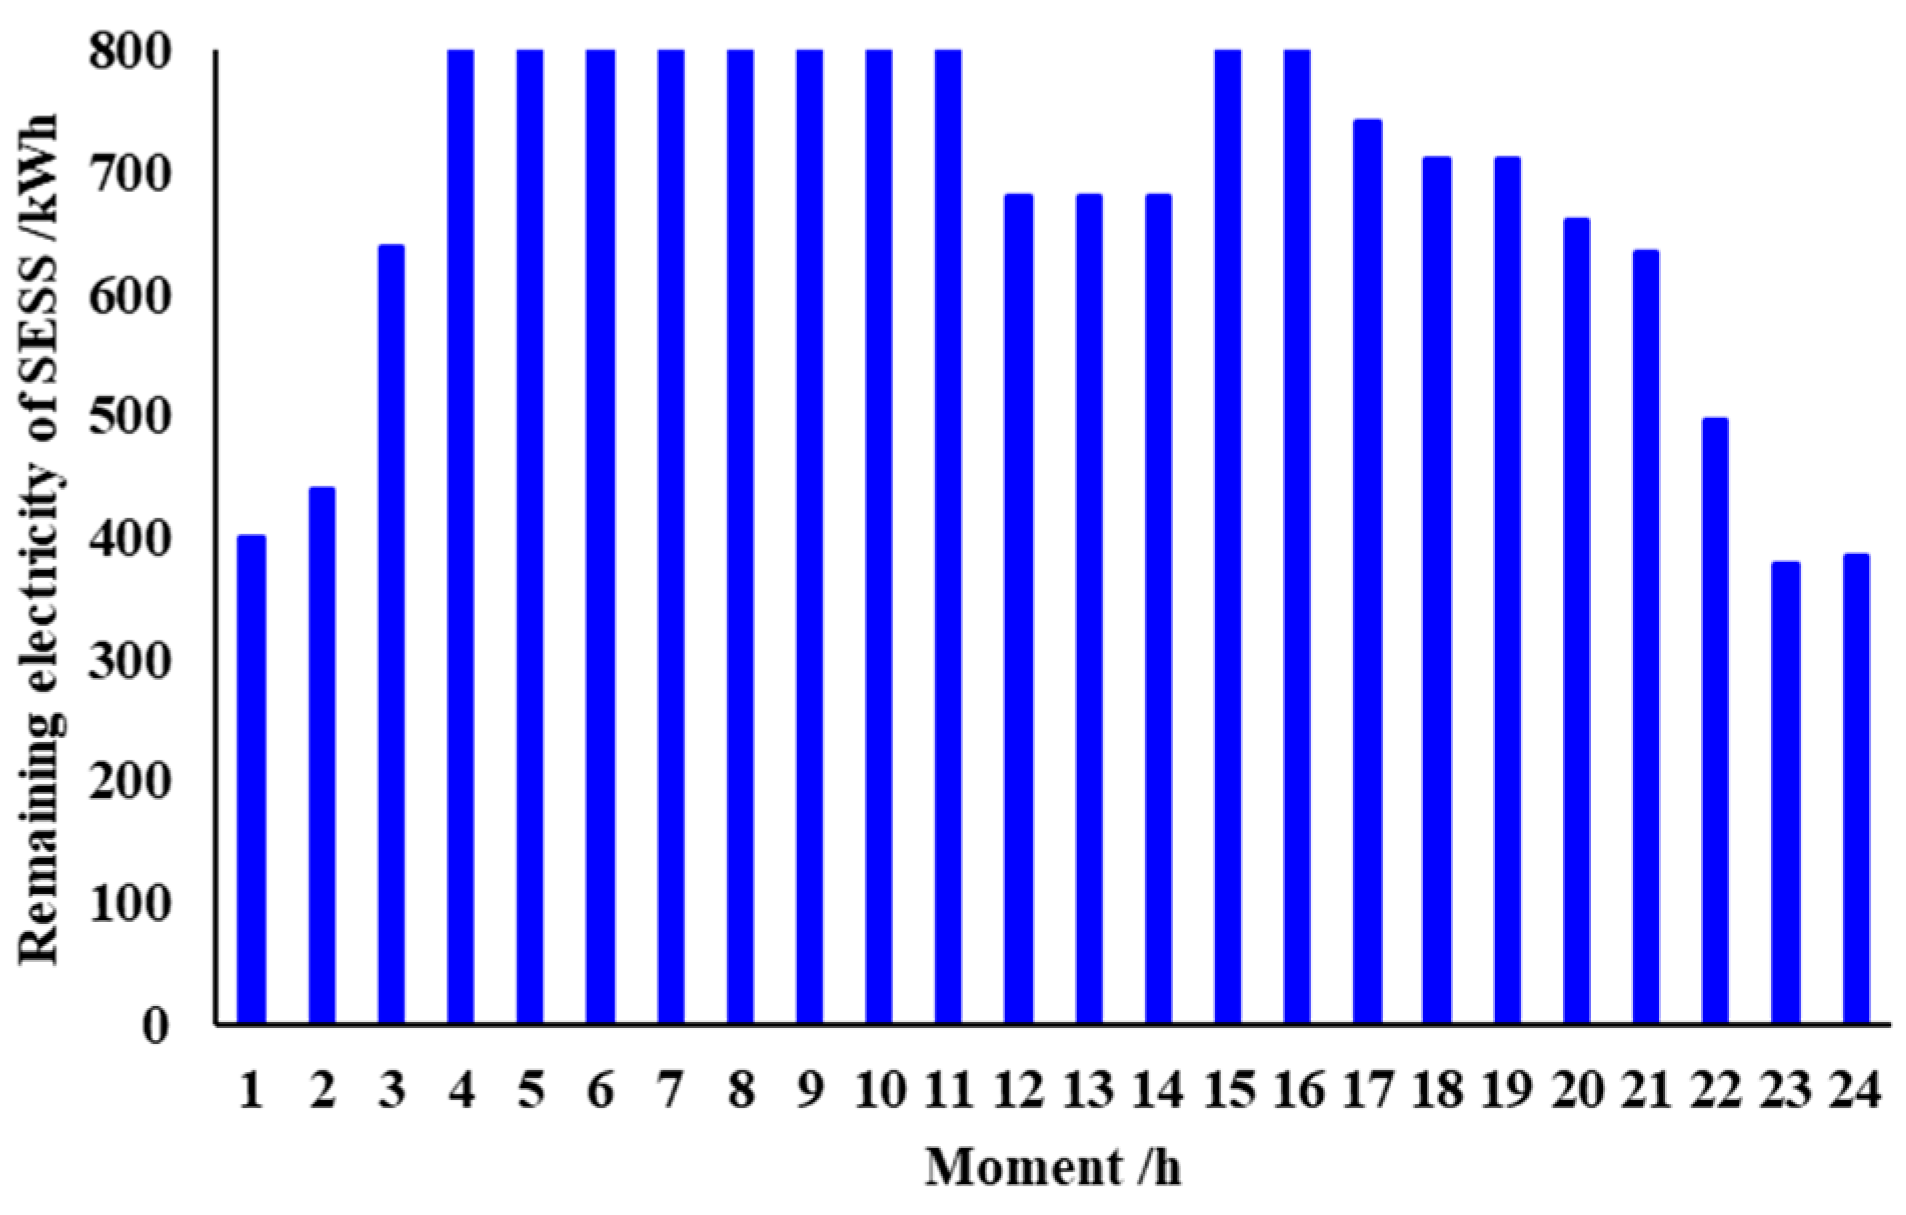
5.2. SESS Day-Ahead Economic Scheduling Scheme

Regarding the day-ahead economic scheduling stage, DN consumers can purchase or sell electricity from the superior power grid, which then intersects with the SESS. SESS day-ahead economic scheduling was carried out to minimize the operation cost of the DN. It was found that the reliability cost is 5133.5 yuan and the explicit operation cost is 3235.6 yuan only when the explicit operation cost is considered in the SESS scheduling model. The total cost is 8369.1 yuan. The purchase and sale of the DN’s electricity during the simulation is shown in Figure 4. The final day-ahead economic scheduling scheme is shown in Table 1 and Figure 5.

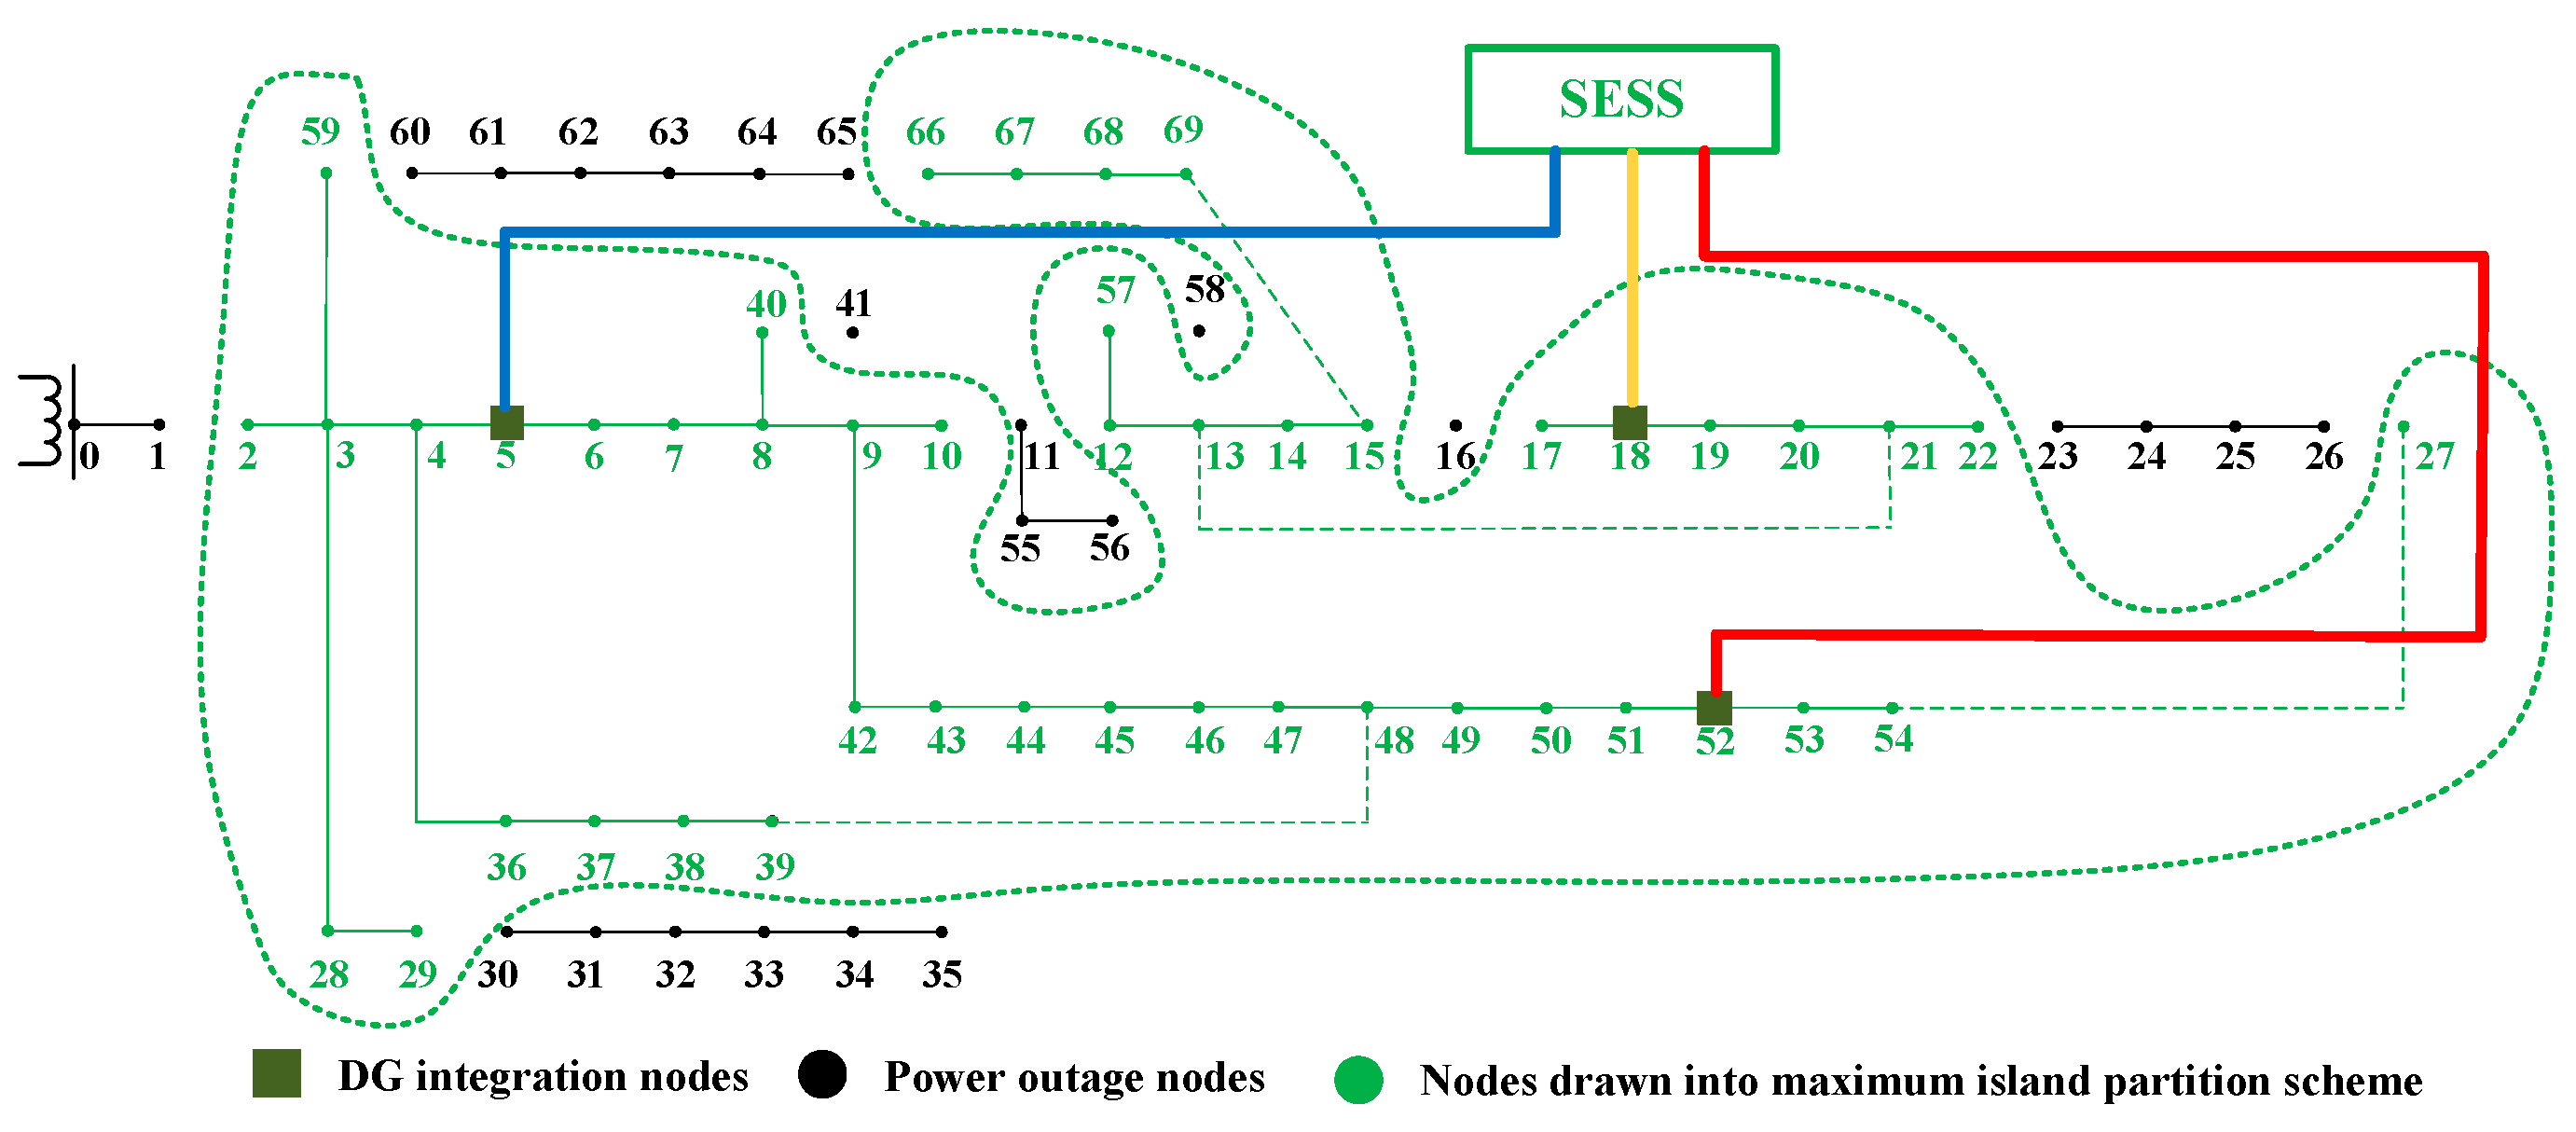
5.3. Island Partition Scheme

5.3.1. Maximum Island Partition Based on the Prospective Greedy Algorithm

The maximum island partition is core to the DN island partition, which can be solved quickly using the prospective greedy algorithm. Using a fault scenario as an example, branch 0–1 is interrupted after 18–23 h, and the downstream load cannot obtain electricity from the superior power grid. It is necessary to formulate an island partition scheme in accordance with the information from the DG output and the initial remaining electricity of the SESS at the 18th hour. It is assumed that the remaining electricity is 400 kWh at the initial fault moment (the 18th hour). The total DG output during the fault period is 11,514.2 kW, and the maximum electricity sufficiency value is 11,914.2 kWh; however, the total load demand of DN consumers during the fault period is 15,017.3 kWh, and thus, the electricity is not sufficient. Some non-critical load nodes cannot be recovered if a fault such as this occurs. The maximum island partition scheme based on the prospective greedy algorithm is formulated as follows:
Search the neighborhood load nodes using the integration nodes of DG and SESS. For the first search of the neighborhood, the neighborhood nodes should be the DG integrated nodes (5, 18, 52) and the prospective neighborhood nodes involve ((5, 4), (5, 6), (18, 17), (18, 19), (52, 51), (52, 53)). Compare the value ratios of different combinations and draw the nodes with the highest values to the island. The value ratio from the first search is shown in Table 2. It should be noted that the load nodes that are closed to DGs may have a higher priority. The combination with the largest load demand will be restored first if the value ratio of multiple combinations is the same; therefore, nodes ((18, 17)) are drawn into the island. Moreover, the search of the neighborhood and prospective neighborhood of island set V continues. For the second search, nodes ((52, 51)) are drawn into the island. When the value ratio of all options is 0, it indicates that the maximum electricity sufficiency value is not enough for load restoration; then, the searching process is complete, and the obtained maximum island partition scheme is shown in Figure 6.

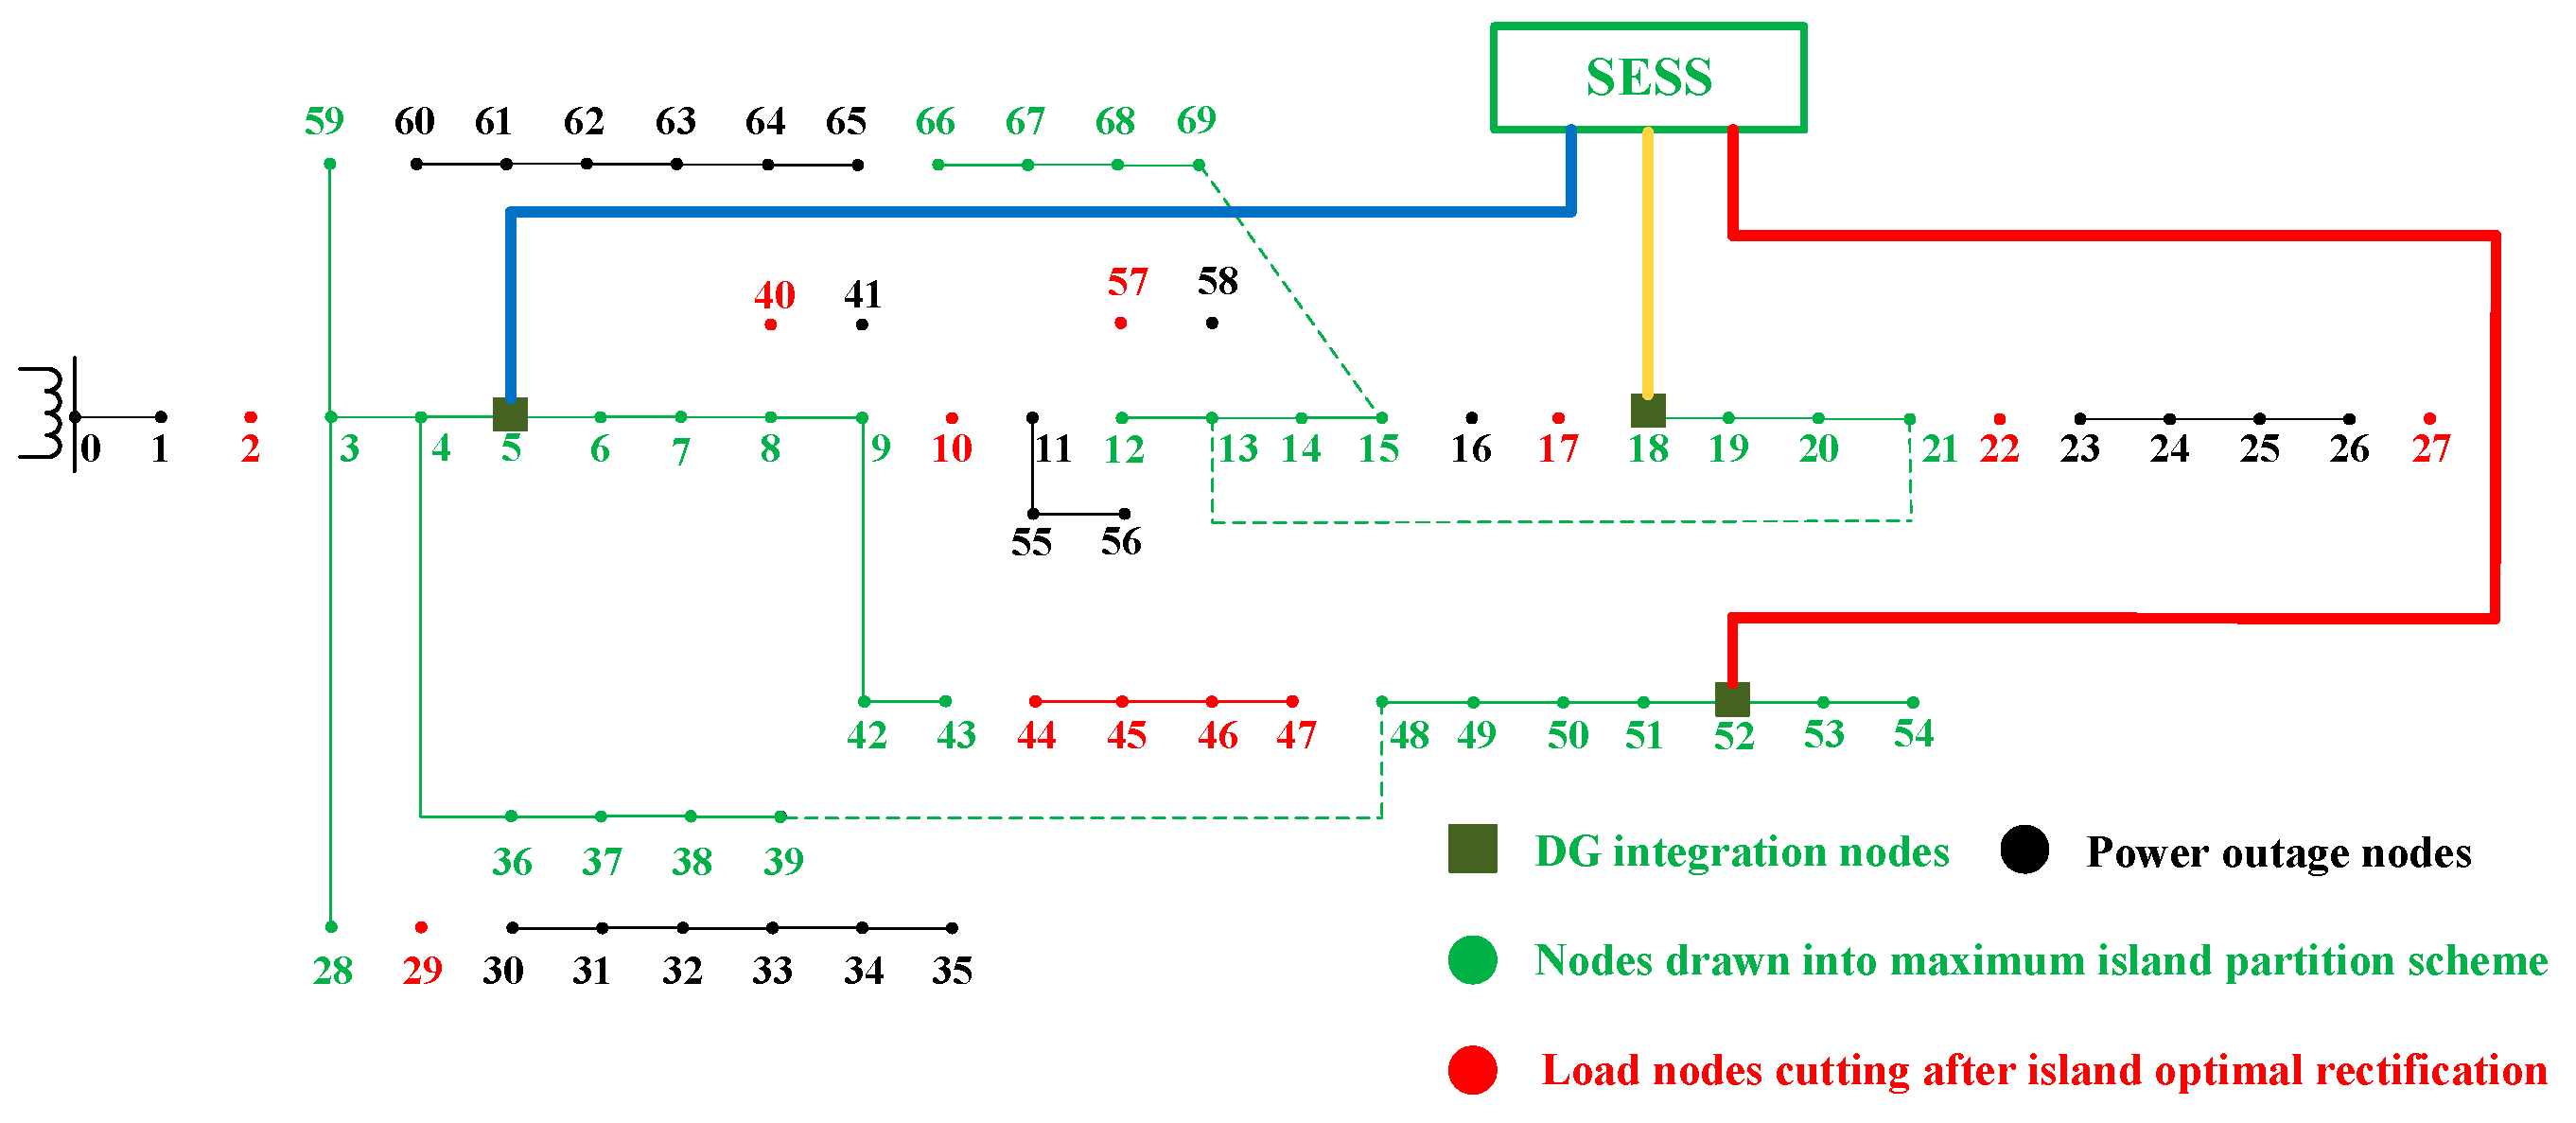
5.3.2. Island Optimal Rectification

The maximum island partition scheme based on the prospective greedy algorithm is only a preliminary scheme that satisfies the electricity sufficiency constraint. The scheme may cause large deviations in the power restoration results as the sequential power balance information may have been ignored. Island optimal rectification is necessary to verify whether the SESS can cooperate with DGs to smooth the output of all moments during the fault period. The final island scheme after rectification is shown in Figure 7. After rectification, the load nodes (5, 10, 17, 22, 27, 29, 40, 57) are cut off in order to satisfy the power balance constraint.
Compared with the maximum island partition scheme, it was found that the power supply restoration scheme fluctuates before and after the rectification; however, if the SESS is not integrated into the DN, and only the DGs supply power for load restoration, then the optimal island rectification is not suitable. Furthermore, the final scheme comprises the intersection of the maximum island partition scheme at each moment under faulty conditions. Regarding the scenario in Section 5.3.1, when the configured capacity of SESS is 0, the load nodes (3, 4, 5, 6, 17, 18, 19, 28, 36, 37, 51, 52, 59) were drawn into the island. Moreover, comparisons showed that the integration of a SESS can significantly improve the effect of island partition. This is because DG output fluctuates during fault periods; thus, the scheme is easily affected by moments with low DG output. After the integration of a SESS, the DG output can be smoothed so that the power restoration potential of renewable power generation can be utilized to its greatest extent. The allocation of appropriate energy stores in the DN is conducive to increasing power restoration capability during fault periods, as well as improving the reliability of the power supply.

5.3.3. The Effect of Prospective Greedy Algorithm on Island Partition with Variable Steps

The prospective greedy algorithm is a heuristic algorithm with strong searching abilities and high solution speeds; this is suitable for solving the maximum island partition searching problem. Compared with the ordinary greedy algorithm, the prospective greedy algorithm can expand the searching path and overcome the limitations of single-step selection. Compared with intelligent algorithms such as the genetic algorithm [41] and the particle swarm optimization algorithm [42], the prospective greedy algorithm overcomes the randomness of population generation and slow iterative calculations. It is perfectly compatible with the main operation and planning problem. In addition, the solution for the prospective greedy algorithm is relatively stable, whereas the results based on the intelligent algorithm are affected by the parameter settings. Recalling the scenario in Section 5.3.1, here, the number of prospective steps was changed in order to explore the impact of variable steps on the island partition effect. The results of the comparison are shown in Table 3.
For the scheme with SESS integration under variable steps, it can be seen that more prospective steps are conducive to a better solution. The reliability cost of the maximum island partition scheme is 4934.4 when only an ordinary greedy algorithm (one-step) is applied, and the reliability cost is 4639.8 when the number of perspective steps is two. When the perspective steps increased to three, the reliability cost is stable at 4561.3. As the number of steps increases, the searching ability of the algorithm gradually stabilize. In order to reconcile the efficiency and accuracy of island partition, two perspective steps are selected in maximum island partition searching.
For the solving speed of maximum island partition, it can be seen that the calculation speed of the prospective greedy algorithm is significantly higher than that of the genetic algorithm. In addition, the reliability cost of the scheme obtained from genetic algorithm is the same as the prospective greedy algorithm with three perspective steps. It can be concluded that the proposed method is able to reconcile the island partition benefit and calculation speed.
For the comparation with the independent energy storage, the integration mode of SESS is special and it is directly connected with the DG integrated node. This integration mode is able to strengthen the searching ability of the prospective greedy algorithm, and the large-capacity SESS can achieve the capability of peak load shifting. When the independent energy storage with an installed capacity of 2667 kWh is integrated into nodes 5, 18 and 52 respectively, the reliability cost is increased, showing that the peak load shifting capability of independent energy storage is not as good as SESS.

5.4. SESS Scheduling Scheme That Considers the DN Operation Risks

This section illustrates how the SESS optimal scheduling model that considers the DN operation risks can be solved using a genetic algorithm. The parameters of the genetic algorithm were set as follows: the initial population number was set to 50; the genes stored the remaining electricity at different moments; and the gene dimension was 24. The sum of the reliability cost and explicit operation cost of the DN was regarded as the fitness function. The iteration limit was set to 100 generations. The crossover rate was 0.8 and the mutation rate was 0.1. It should be noted that not all the genes satisfied the SESS operation constraints after initializing the population; for example, the difference between two adjacent moments, with regard to the remaining electricity, should not be greater than 2 MW. If the charging and discharging capacity limit was exceeded, a penalty factor was added to the fitness function. That which exceeded the charging and discharging limit was multiplied by the penalty factor as an additional cost. The penalty factor was 1000.
For DN risk assessment, the proposed method mainly focuses on specific scenarios caused by extreme weather scenarios. Assuming that an extreme weather event occurs 15 h after the day begins, the DG output would be lower than the load demand in the subsequent few hours, and the probability of system failure would be significantly increased. It is thus necessary to carry out a DN risk assessment and quantify the reliability cost in order to obtain the optimal scheduling scheme with the lowest costs. During the risk assessment stage, the potential faults were selected for the fault scenario set. It was assumed that the components near the superior power grid fail after 15–24 h, and the duration of a fault lasts for 6 h. The probability of each potential fault occurring was 0.01. For different load nodes, the economic losses caused by power outages were proportional to the priority ranking of the load. The reliability cost of the category I load is 1000 yuan per kWh. The costs of category II and III load are 100 and 10 yuan per kWh, respectively. Then, an island partition scheme for each fault in the scenario set is formulated and the total reliability cost calculated.
After comprehensively considering the operation risk and explicit operation cost of the DN, the optimal SESS scheduling scheme is shown in Figure 8. The convergence curve of the genetic algorithm is shown in Figure 9. In accordance with the obtained scheduling scheme, the explicit operation cost is 3713.9 yuan and reliability cost is 4102.1 yuan. The total cost is 7816.0 yuan. Compared with the day-ahead economic scheduling scheme, the total cost is reduced by 553.1 yuan.

6. Discussion

An optimal scheduling method concerning a shared energy storage system (SESS) that considers distribution network (DN) operation risk is proposed in the paper. A multi-objective SESS day-ahead scheduling model was established, wherein the user’s interruption cost is regarded as the reliability cost; however, a SESS optimal scheduling model with complex constraints cannot be solved in a straightforward manner. For convenience’s sake, the optimal scheduling model can be deconstructed into a SESS day-ahead economic scheduling model and a DN risk assessment model, respectively. To confront the issue of the DN risk assessment, the SESS sequential characteristics and secondary outage constraints are necessarily considered in the risk assessment; this means that island partition is a complex problem. Moreover, the island partition model is usually solved by an intelligent algorithm and the convergence speed is low; this is not conducive to solving the optimal scheduling problem. To overcome the abovementioned problems, an island partition model with a SESS was established to accurately evaluate the reliability cost. A heuristic prospective greedy algorithm was proposed in order to search the island scheme, and the complex island partition model can be solved via maximum island partition and optimal island rectification. Finally, a method to solve the SESS optimal scheduling model, based on a genetic algorithm, was designed to obtain the final version of the SESS scheduling scheme.
The improved PG&E 69-bus system was analyzed in the case study in this paper. The proposed method is universal for all radial distribution networks. In accordance with the results, the prospective greedy algorithm is a heuristic algorithm with a strong searching ability and high speed (in terms of how quickly it can find a solution). Compared with intelligent algorithms, such as the genetic algorithm, the calculation speed of the prospective greedy algorithm is significantly quicker, and the benefits of island partition are also guaranteed. The comprehensive DN operation costs decreased by 6.6% after considering the operation risks, which suggests that the operation risk factors cannot be ignored in DN operations. In addition, a SESS is able to be directly electrically connected to multiple DG integrated nodes. As a result of this integration mode, the reliability cost may decrease by 16.1%, compared with the distributed integration mode. The results suggest that an integrated means of energy storage has an important effect on the ability to restore power when a fault occurs.
Furthermore, there are many kinds of faults that may occur in the DN, and only the key potential accidents are considered in DN risk assessments. There are still huge challenges in terms of how to take all potential accidents into account with regard to the fault scenario set. It is necessary to continue to increase the speed at which DN risk assessments are carried out, on the basis of the proposed method and to improve the convergence speed of intelligent algorithms.

7. Conclusions

A SESS optimal scheduling method considering the DN operation risk is proposed in this paper, and a scheme reconciling the explicit operation cost and DN operation risk is obtained. Firstly, a SESS optimal scheduling model that considers both the explicit operation cost and the DN operation risks was established. Then, a risk assessment was carried out based on the island partition model with SESS sequential characteristics and secondary outage constraints. Via maximum island partition and island optimal rectification, the reliability cost can be obtained. Furthermore, an improved genetic algorithm was designed in order to solve the complex SESS optimal scheduling model. Finally, a case study concerning the improved PG&E 69-bus system was analyzed, and it was found that:
(1)
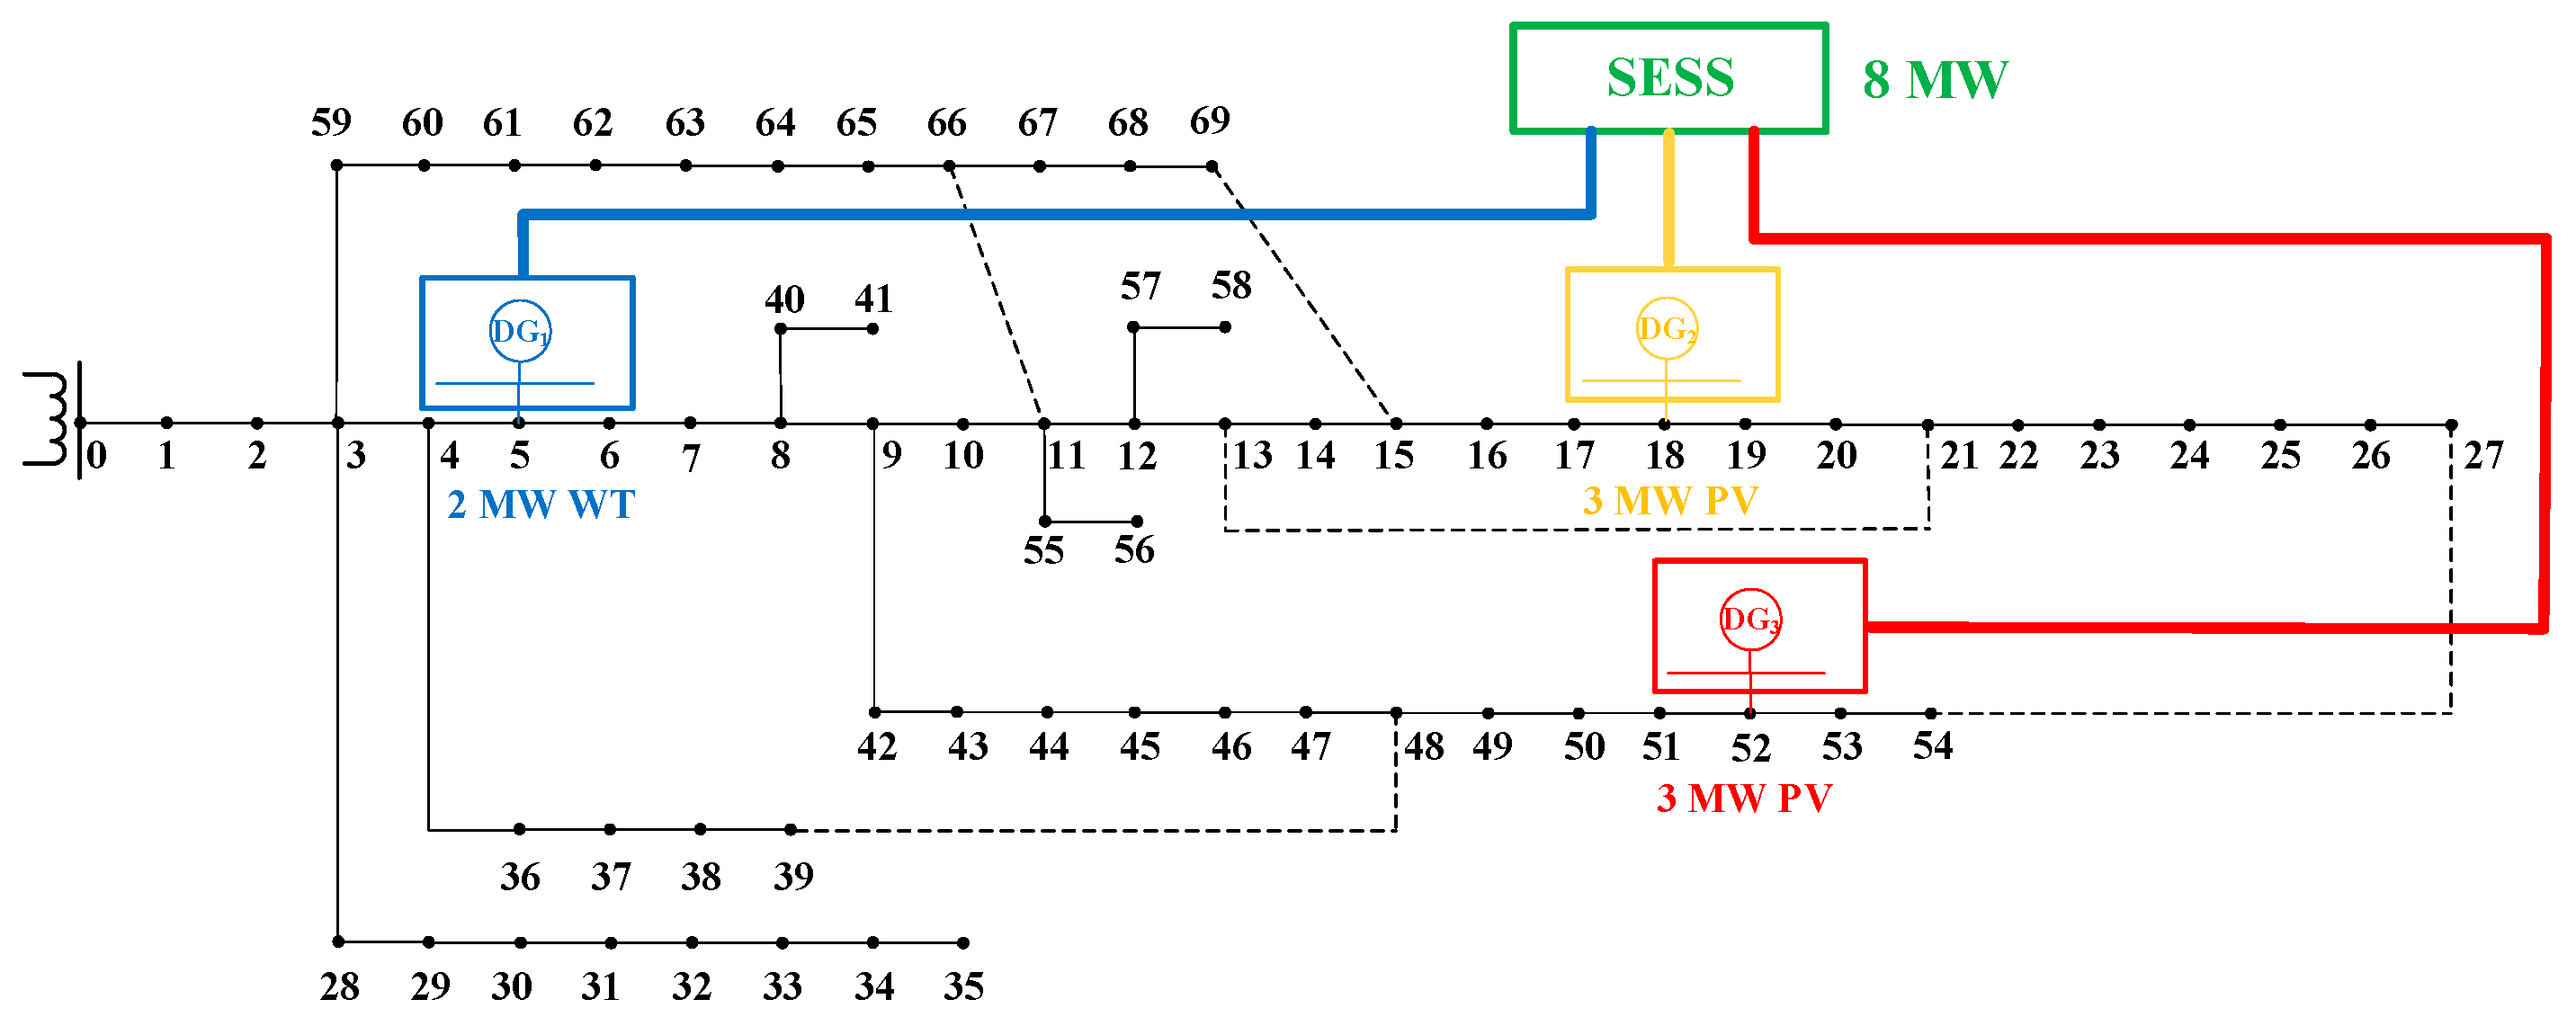
The independent energy storage is often integrated into a single DG node, whereas a SESS can be directly electrically connected to multiple DG integrated nodes. Owing to the SESS integration mode, the reliability cost may decrease by 16.1%.
(2)
The DN comprehensive operation cost may decrease by 6.6% when operation risks are taken into consideration. Indeed, although the explicit operation cost increases by 14.78%, the reliability cost caused by failures decreases by 20.09%.

Author Contributions

Conceptualization, J.C. and B.S.; methodology, J.C.; software, J.C.; validation, B.S., Y.Z. and R.J.; formal analysis, B.S.; investigation, J.W.; resources, S.D.; data curation, J.C.; writing—Original draft preparation, J.C.; writing—Review and editing, B.S.; visualization, R.J.; supervision, J.W.; project administration, Y.Z.; funding acquisition, J.W. All authors have read and agreed to the published version of the manuscript.

Funding

This research was funded by “the State Grid scientific and technological projects of China, SGJSZJOOKJJS2200798”, “the National Natural Science Foundation of China, No.52177106” and “Tianjin Science and technology planning project, 22ZLGCGX00050”.

Data Availability Statement

Not applicable.

Conflicts of Interest

The authors declare no conflict of interest.

Appendix A

Table A1. Load priority of each load point in PG&E 69-bus system.
Load CategoryLoad PriorityLoad Nodes Number
I1003 4 5 6 13 14 17 18 19 27 28 29
II101 2 7 8 9 10 11 12 15 16 20 21 22 23 26 30 31 32 38 40 42 43 44 45 46 47 48 49 50 53 55 57 63 64 65 67 68
III124 25 33 34 35 41 56 58 60 61 62

Appendix B

Figure A1. DG output variation during simulation day.
Energies 16 02411 g0a1
Figure A2. Load demand variation during simulation day.
Energies 16 02411 g0a2

Appendix C

Table A2. Peak and valley electricity price.
Hour/h12345678
Price/yuan0.38180.38180.38180.38180.38180.38180.38180.8395
Hour/h910111213141516
Price/yuan0.83950.83951.32221.32221.32221.32221.32220.8395
Hour/h1718192021222324
Price/yuan0.83950.83951.32221.32221.32220.83950.83950.3818

References

  1. Sun, B.; Li, Y.; Zeng, Y.; Yang, T.; Dong, S. The total social cost evaluation of two wind and PV energy development modes: A study on Henan of China. Energy Rep. 2021, 7, 6565–6580. [Google Scholar] [CrossRef]
  2. Sun, B.; Yu, Y.; Qin, C. Should China focus on the distributed development of wind and solar photovoltaic power generation? A comparative study. Appl. Energy 2017, 185, 421–439. [Google Scholar] [CrossRef]
  3. Sun, B.; Li, Y.; Zeng, Y.; Chen, J.; Shi, J. Optimization Planning Method of Distributed Generation Based on Steady-state Security Region of Distribution Network. Energy Rep. 2022, 8, 4209–4222. [Google Scholar] [CrossRef]
  4. Chen, J.; Sun, B.; Li, Y.; Jing, R.; Zeng, Y.; Li, M. An evaluation method of distributed generation credible capacity based on island partition. Energy Rep. 2022, 8, 11271–11287. [Google Scholar] [CrossRef]
  5. Walker, A.; Kwon, S. Design of structured control policy for shared energy storage in residential community: A stochastic optimization approach. Appl. Energy 2021, 298, 117182. [Google Scholar] [CrossRef]
  6. Song, M.; Meng, J.; Lin, G.; Cai, Y.; Gao, C.; Chen, T.; Xu, H. Applications of shared economy in smart grids: Shared energy storage and transactive energy. Electr. J. 2022, 35, 107128. [Google Scholar] [CrossRef]
  7. Zhu, H.; Ouahada, K. A distributed real-time control algorithm for energy storage sharing. Energy Build 2021, 230, 110478. [Google Scholar] [CrossRef]
  8. Ma, M.; Huang, H.; Song, X.; Peña-Mora, F.; Zhang, Z.; Chen, J. Optimal sizing and operations of shared energy storage systems in distribution networks: A bi-level programming approach. Appl. Energy 2022, 307, 118170. [Google Scholar] [CrossRef]
  9. Walker, A.; Kwon, S. Analysis on impact of shared energy storage in residential community: Individual versus shared energy storage. Appl. Energy 2021, 282, 116172. [Google Scholar] [CrossRef]
  10. Tercan, S.M.; Demirci, A.; Gokalp, E.; Cali, U. Maximizing self-consumption rates and power quality towards two-stage evaluation for solar energy and shared energy storage empowered microgrids. J. Energy Storage 2022, 51, 104561. [Google Scholar] [CrossRef]
  11. Chang, H.C.; Ghaddar, B.; Nathwani, J. Shared community energy storage allocation and optimization. Appl. Energy 2022, 318, 119160. [Google Scholar] [CrossRef]
  12. Sadeghian, O.; Shotorbani, A.M.; Mohammadi-Ivatloo, B. Risk-averse scheduling of virtual power plants considering electric vehicles and demand response. Sched. Oper. Virtual Power Plants 2022, 227–256. [Google Scholar]
  13. Jian, L.; Zheng, Y.; Xiao, X.; Chan, C.C. Optimal scheduling for vehicle-to-grid operation with stochastic connection of plug-in electric vehicles to smart grid. Appl. Energy 2015, 146, 150–161. [Google Scholar] [CrossRef]
  14. Hosseini, S.M.; Carli, R.; Dotoli, M. Robust energy scheduling of interconnected smart homes with shared energy storage under quadratic pricing. In Proceedings of the 2019 IEEE 15th International Conference on Automation Science and Engineering (CASE), Vancouver, BC, Canada, 22–26 August 2019; pp. 966–971. [Google Scholar]
  15. Li, L.; Cao, X.; Zhang, S. Shared energy storage system for prosumers in a community: Investment decision, economic operation, and benefits allocation under a cost-effective way. J. Energy Storage 2022, 50, 104710. [Google Scholar] [CrossRef]
  16. Xiao, J.; Yang, Y.; Cui, S.; Liu, X.K. A new energy storage sharing framework with regard to both storage capacity and power capacity. Appl. Energy 2022, 307, 118171. [Google Scholar] [CrossRef]
  17. Zheng, B.; Wei, W.; Chen, Y.; Wu, Q.; Mei, S. A peer-to-peer energy trading market embedded with residential shared energy storage units. Appl. Energy 2022, 308, 118400. [Google Scholar] [CrossRef]
  18. Zhang, W.; Zheng, B.; Wei, W.; Chen, L.; Mei, S. Peer-to-peer transactive mechanism for residential shared energy storage. Energy 2022, 246, 123204. [Google Scholar] [CrossRef]
  19. Gao, J.; Gao, F.; Yu, Y.; Haoyu, W.; Yi, Z.; Pengcheng, L. Configuration optimization and benefit allocation model of multi-park integrated energy systems considering electric vehicle charging station to assist services of shared energy storage power station. J. Clean. Prod. 2022, 336, 130381. [Google Scholar]
  20. Liu, W.; Yao, Q.; Shi, Q.; Xue, Y.; Wang, Y. Risk assessment of cascading failure of distribution network with flexible multi-state switch. Int. J. Electr. Power Energy Syst. 2022, 142, 108290. [Google Scholar] [CrossRef]
  21. Chen, X.; Qiu, J.; Reedman, L.; Dong, Z.Y. A statistical risk assessment framework for distribution network resilience. IEEE Trans. Power Syst. 2019, 34, 4773–4783. [Google Scholar] [CrossRef]
  22. Lin, C.; Liu, F.; Zhang, L.; Li, G.; Chen, C.; Bie, Z. An online data-driven risk assessment method for resilient distribution systems. CPSS Trans. Power Electron. Appl. 2021, 6, 136–144. [Google Scholar] [CrossRef]
  23. Pukhrem, S.; Basu, M.; Conlon, M.F. Probabilistic risk assessment of power quality variations and events under temporal and spatial characteristic of increased PV integration in low-voltage distribution networks. IEEE Trans. Power Syst. 2018, 33, 3246–3254. [Google Scholar] [CrossRef]
  24. Leite, J.; Mantovani, J.; Dokic, T.; Yan, Q.; Chen, P.C.; Kezunovic, M. Resiliency assessment in distribution networks using GIS-based predictive risk analytics. IEEE Trans. Power Syst. 2019, 34, 4249–4257. [Google Scholar] [CrossRef]
  25. IEEE Std 1547.4-2011; Photovoltaics, D.G.; Storage, E. IEEE Guide for Design, Operation, and Integration of Distributed Resource Island Systems with Electric Power Systems. IEEE: New York, NY, USA, 2011.
  26. Chen, J.; Sun, B.; Li, Y.; Jing, R.; Zeng, Y.; Li, M. Credible capacity calculation method of distributed generation based on equal power supply reliability criterion. Renew. Energy 2022, 201, 534–547. [Google Scholar] [CrossRef]
  27. Zhao, J.; Zhang, M.; Yu, H.; Ji, H.; Song, G.; Li, P.; Wu, J. An islanding partition method of active distribution networks based on chance-constrained programming. Appl. Energy 2019, 242, 78–91. [Google Scholar] [CrossRef]
  28. Ji, H.; Wang, C.; Li, P.; Song, G.; Wu, J. SOP-based islanding partition method of active distribution networks considering the characteristics of DG, energy storage system and load. Energy 2018, 155, 312–325. [Google Scholar] [CrossRef]
  29. Lin, W.; Zhu, J.; Yuan, Y.; Wu, H. Robust optimization for island partition of distribution system considering load forecasting error. IEEE Access 2019, 7, 64247–64255. [Google Scholar] [CrossRef]
  30. Ding, T.; Lin, Y.; Bie, Z.; Chan, C. A resilient microgrid formation strategy for load restoration considering master-slave distributed generators and topology reconfiguration. Appl. Energy 2017, 199, 205–216. [Google Scholar] [CrossRef]
  31. Wang, C.; Song, G.; Li, P.; Ji, H.; Zhao, J.; Wu, J. Optimal configuration of soft open point for active distribution network based on mixed-integer second-order cone programming. Energy Procedia 2016, 103, 70–75. [Google Scholar] [CrossRef]
  32. Guimaraes, I.G.; Bernardon, D.P.; Garcia, V.J.; Schmitz, M.; Pfitscher, L.L. A decomposition heuristic algorithm for dynamic reconfiguration after contingency situations in distribution systems considering island operations. Electr. Power Syst. Res. 2021, 192, 106969. [Google Scholar] [CrossRef]
  33. Ding, T.; Sun, K.; Huang, C.; Bie, Z.; Li, F. Mixed-integer linear programming-based splitting strategies for power system islanding operation considering network connectivity. IEEE Syst. J. 2015, 12, 350–359. [Google Scholar] [CrossRef]
  34. El-Sayed, W.T.; Farag, H.E.Z.; Zeineldin, H.H.; El-Saadany, E.F. Formation of islanded droop-based microgrids with optimum loadability. IEEE Trans. Power Syst. 2021, 37, 1564–1576. [Google Scholar] [CrossRef]
  35. Slota, G.M.; Root, C.; Devine, K.; Madduri, K.; Rajamanickam, S. Scalable, multi-constraint, complex-objective graph partitioning. IEEE Trans. Parallel Distrib. Syst. 2020, 31, 2789–2801. [Google Scholar] [CrossRef]
  36. Oboudi, H.; Hooshmand, R.; Karamad, A. A feasible method for controlled intentional islanding in microgrids based on PSO algorithm. Swarm Evol. Comput. 2017, 35, 14–25. [Google Scholar] [CrossRef]
  37. Wen, J.; Yang, J.; Wang, T. Path planning for autonomous underwater vehicles under the influence of ocean currents based on a fusion heuristic algorithm. IEEE Trans. Veh. Technol. 2021, 70, 8529–8544. [Google Scholar] [CrossRef]
  38. Ding, T.; Liu, S.; Wu, Z.; Bie, Z. Sensitivity-based relaxation and decomposition method to dynamic reactive power optimization considering DGs in active distribution networks. IET Gener. Transm. Distrib. 2017, 11, 37–48. [Google Scholar] [CrossRef]
  39. Ahangar, A.; Gharehpetian, G.; Baghaee, H. A Review on Intentional Controlled Islanding in Smart Power Systems and Generalized Framework for ICI in Microgrids. Int. J. Electr. Power Energy Syst. 2020, 118, 105709. [Google Scholar] [CrossRef]
  40. Pathan, M.I.; Al-Muhaini, M.; Djokic, S.Z. Optimal reconfiguration and supply restoration of distribution networks with hybrid microgrids. Electr. Power Syst. Res. 2020, 187, 106458. [Google Scholar] [CrossRef]
  41. Vatani, M.; Solati Alkaran, D.; Sanjari, M.J.; Gharehpetian, G.B. Multiple distributed generation units’ allocation in distribution network for loss reduction based on a combination of analytical and genetic algorithm methods. IET Gener. Transm. Distrib. 2016, 10, 66–72. [Google Scholar] [CrossRef]
  42. Tawfeek, T.S.; Ahmed, A.H.; Hasan, S. Analytical and particle swarm optimization algorithms for optimal allocation of four different distributed generation types in radial distribution networks. Energy Procedia 2018, 153, 86–94. [Google Scholar] [CrossRef]
Figure 1. Flow diagram showing island partition.
Energies 16 02411 g001
Figure 2. The flow diagram of the SESS optimal scheduling model that considers DN operation risk.
Energies 16 02411 g002
Figure 3. PG&E 69-bus system topology.
Energies 16 02411 g003
Figure 4. The purchase and sale of the DN’s electricity during the simulation.
Energies 16 02411 g004
Figure 5. The final day-ahead economic scheduling scheme.
Energies 16 02411 g005
Figure 6. Maximum island partition scheme based on the prospective greedy algorithm.
Energies 16 02411 g006
Figure 7. Final island partition scheme after island optimal rectification.
Energies 16 02411 g007
Figure 8. Convergence curve of the genetic algorithm.
Energies 16 02411 g008
Figure 9. SESS optimal scheduling scheme considering the DN operation risk.
Energies 16 02411 g009
Table 1. Remaining electricity in SESS for each moment in day-ahead economic scheduling scheme.
Hour/h12345678
Remaining electricity/kWh400439639800800800800800
Hour/h910111213141516
Remaining electricity/kWh800800800680680680680680
Hour/h1718192021222324
Remaining electricity/kWh680680680480280808080
Table 2. The value ratio from the first searching process.
Neighborhood SetThe Load Node or CombinationTotal Load Demand under 18–23 h/kWLoad PriorityValue Ratio
Neighborhood nodes NE1519.22100100
18230.60100100
5219.22100100
Prospective neighborhood nodes NEm2(5, 4)38.43(100, 100)100
(5, 6)29.20(100, 100)100
(18, 17)461.21(100, 100)100
(18, 19)249.82(100, 100)100
(52, 51)142.20(100, 100)100
(52, 53)891.67(100, 10)11.94
Table 3. Maximum island partition scheme with variable steps.
Steps1 (Ordinary Greedy Algorithm)2345Improved Genetic Algorithm [41]Independent Energy Storage
Maximum island partition scheme{2–8, 12–15, 16–29, 36–39, 42–54, 57, 59, 66–69}{2–10, 12–15, 17–22, 27–29, 36–40, 42–54, 57, 59, 66–69}{2–10, 12–22, 27–29, 36–39, 42–54, 57, 59, 66–69}{2–10, 12–22, 27–29, 36–39, 42–54, 57, 59, 66–69}{2–10, 12–22, 27–29, 36–39, 42–54, 57, 59, 66–69}{2–10, 12–22, 27–29, 36–39, 42–54, 57, 59, 66–69}{2–10, 12–22, 27–29, 36–40, 42–49, 51–54 57–59, 69}
Reliability cost/yuan4934.44639.84561.34561.34561.34561.35519.1
Average calculation time/s2.753.153.834.024.1352.556.30
Disclaimer/Publisher’s Note: The statements, opinions and data contained in all publications are solely those of the individual author(s) and contributor(s) and not of MDPI and/or the editor(s). MDPI and/or the editor(s) disclaim responsibility for any injury to people or property resulting from any ideas, methods, instructions or products referred to in the content.

