Article

Induced Pre-Saturation Tower: A Technological Innovation for Oily Water Treatment in Semi-Industrial Scale

by
Leonardo Bandeira dos Santos
1,2,
Rita de Cássia Freire Soares da Silva
2,
Leonildo Pereira Pedrosa, Jr.
1,2,
Rodrigo Dias Baldo
3,
Mohand Benachour
2,4,
Attilio Converti
5,
Leonie Asfora Sarubbo
1,2,6,* and
Valdemir Alexandre dos Santos
1,2,6
1
UNICAP-ICAM TECH International School, Catholic University of Pernambuco (UNICAP), Rua do Príncipe, n. 526, Boa Vista, Recife 50050-900, PE, Brazil
2
Advanced Institute of Technology and Innovation (IATI), Rua Potira, 31, Prado, Recife 50751-310, PE, Brazil
3
Centrais Elétricas da Paraíba—EPASA, Rua Projetada, s/n, Engenho Triunfo—Estrada do Aterro Sanitário, Km 1, João Pessoa 58071-973, PB, Brazil
4
Department of Chemical Engineering, Federal University of Pernambuco, Av. dos Economistas, s/n, Recife 50740-590, PE, Brazil
5
Department of Civil, Chemical and Environmental Engineering, Pole of Chemical Engineering, Università degli Studi di Genova (UNIGE), Via Opera Pia 15, I-16145 Genova, Italy
6
Northeast Biotechnology Network, Federal Rural University of Pernambuco, Rua. Manoel de Medeiros, s/n, Dois Irmãos, Recife 52171-900, PE, Brazil
*
Author to whom correspondence should be addressed.
Energies 2023, 16(5), 2278; https://doi.org/10.3390/en16052278
Submission received: 31 October 2022 / Revised: 15 January 2023 / Accepted: 23 February 2023 / Published: 27 February 2023
(This article belongs to the Special Issue Green Technologies for Energy Transition)

Abstract

:
In this work, an induced pre-saturation tower (IPST) for oil–water separation was built on a semi-industrial scale, based on experimental results obtained on a laboratory scale prototype. The main strategy for generating these criteria was to increase the efficiency of the bench scale prototype, which is limited by conditions of low levels of automation and control, with the use of a biosurfactant as an auxiliary collector. The validation of the developed criteria allowed the construction of an IPST with three stages, all fed with previously saturated effluents. The IPST was built in stainless steel, with multistage centrifugal pumps and adapted to generate microbubbles without the use of saturation tanks or compressors. The most relevant operational parameters were selected using a fractional factorial design, while a central composite rotatable design (CCRD) followed by the application of the desirability function allowed to optimize the conditions for partial and global variables, the latter with desirability of 95%. A nominal flow rate of approximately 1000 L·h−1, a recycle flow rate of 450 L·h−1, a scraper rotation speed of 80 rpm, an average pressure of the microbubble pumps of 11 bar, and an effluent temperature from IPST of about 38 °C ensured optimized operation for the proposed technological development.

1. Introduction

Oils and fats are common industrial pollutants whose removal is usually carried out by gravitational separation, such as decantation, centrifugation, and flotation, among others. Complex processes that require a high investment have been adopted, but the idea of minimizing the costs of classic methods challenges many researchers. Thus, technologies to improve process efficiencies, such as flotation, have received important and frequent contributions [1].
Due to its simplicity, dissolved air flotation (DAF) has received special attention from oily water treatment process researchers. Thus, a recent “preferential coalescence-adsorption” process for water–oil separation was developed using a cyclonic and flotation column within a single structure [2]. The flotation column is fed from the top, where a flow of air microbubbles and coal particles adsorb the oil droplets in this region. However, with the relative increase achieved by the combined efficiencies of the two processes, an additional component, such as coal particles, can give rise to the generation of effluents requiring new separation techniques.
Despite the increased contact time, due to the longer oil and grease removal section, the performance of column type flotation has not translated into improved efficiency [3]. Researchers’ efforts to implement floaters with geometric shapes that require less physical space continue to show the need for better operational conditions, such as simpler and cheaper mechanisms for generating microbubbles, more efficient control for effluent saturation by microbubbles, a higher degree of mixing for gas–liquid contact, and a narrow range of diameters for microbubbles [4].
This study aimed at the experimental development of a flotation device with innovative features. Such characteristics involved a column-type floater in the form of a tower with stages. Like any technological innovation in engineering, a bench prototype was preliminarily built [5]. Thus, due to the limitations of automation and control on small scales, a biosurfactant was used as an auxiliary collector to define operational parameters for a change of scale in operating conditions close to those of equipment optimization.
Important operational and structural parameters of a bench scale IPST were determined [6] and used as the primary strategy for generating the scale-up criteria for a semi-industrial IPST project. The main parameters and strategies were: (i) kinetic constants of oil and grease removal [7]; (ii) hydraulic detection time [8]; (iii) flotation chamber dimensions [8,9,10]; (iv) siphon diameter and level [11]; (v) use of scraper for oily foam collection [12]; (vi) individual pumps for the stages [13,14]; and (vii) use of biosurfactant [15,16]. Based on this premise and the physical arrangement used in distillation towers, the purpose of this work was to reproduce adequate conditions on a semi-industrial scale water–oil separation in flotation equipment in the form of a tower with stages from a bench-scale prototype [5].

2. Materials and Methods

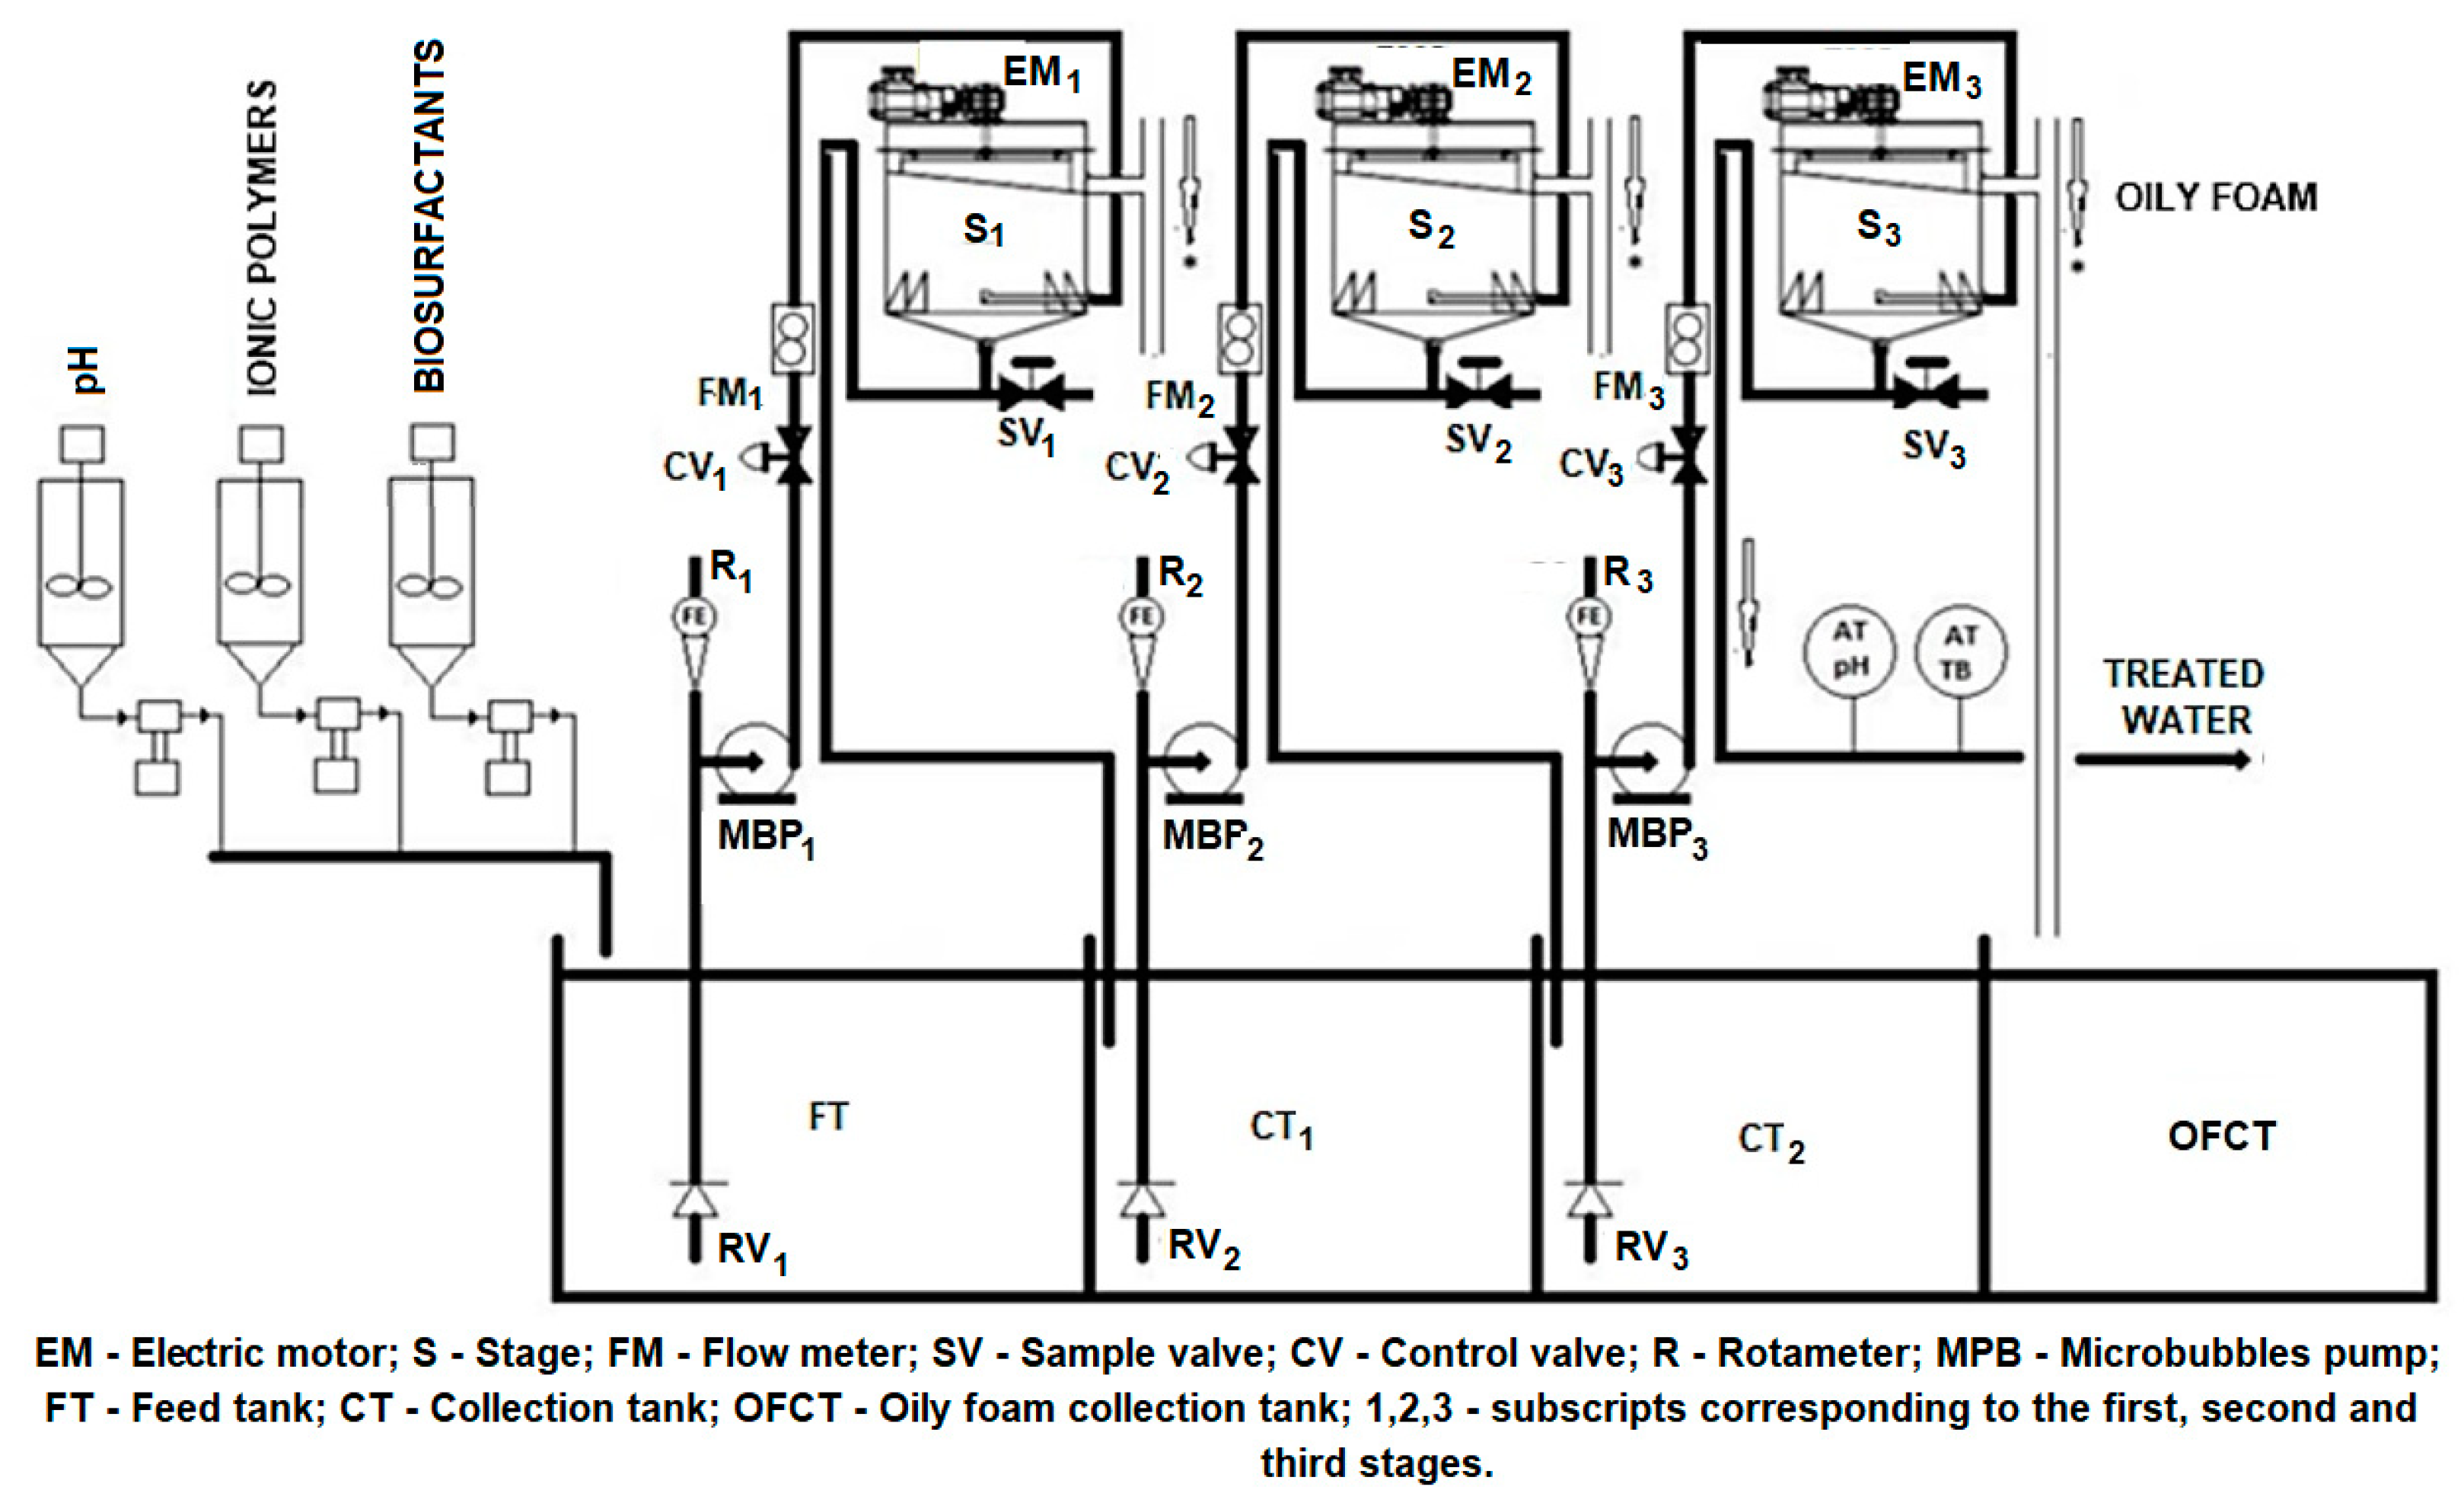
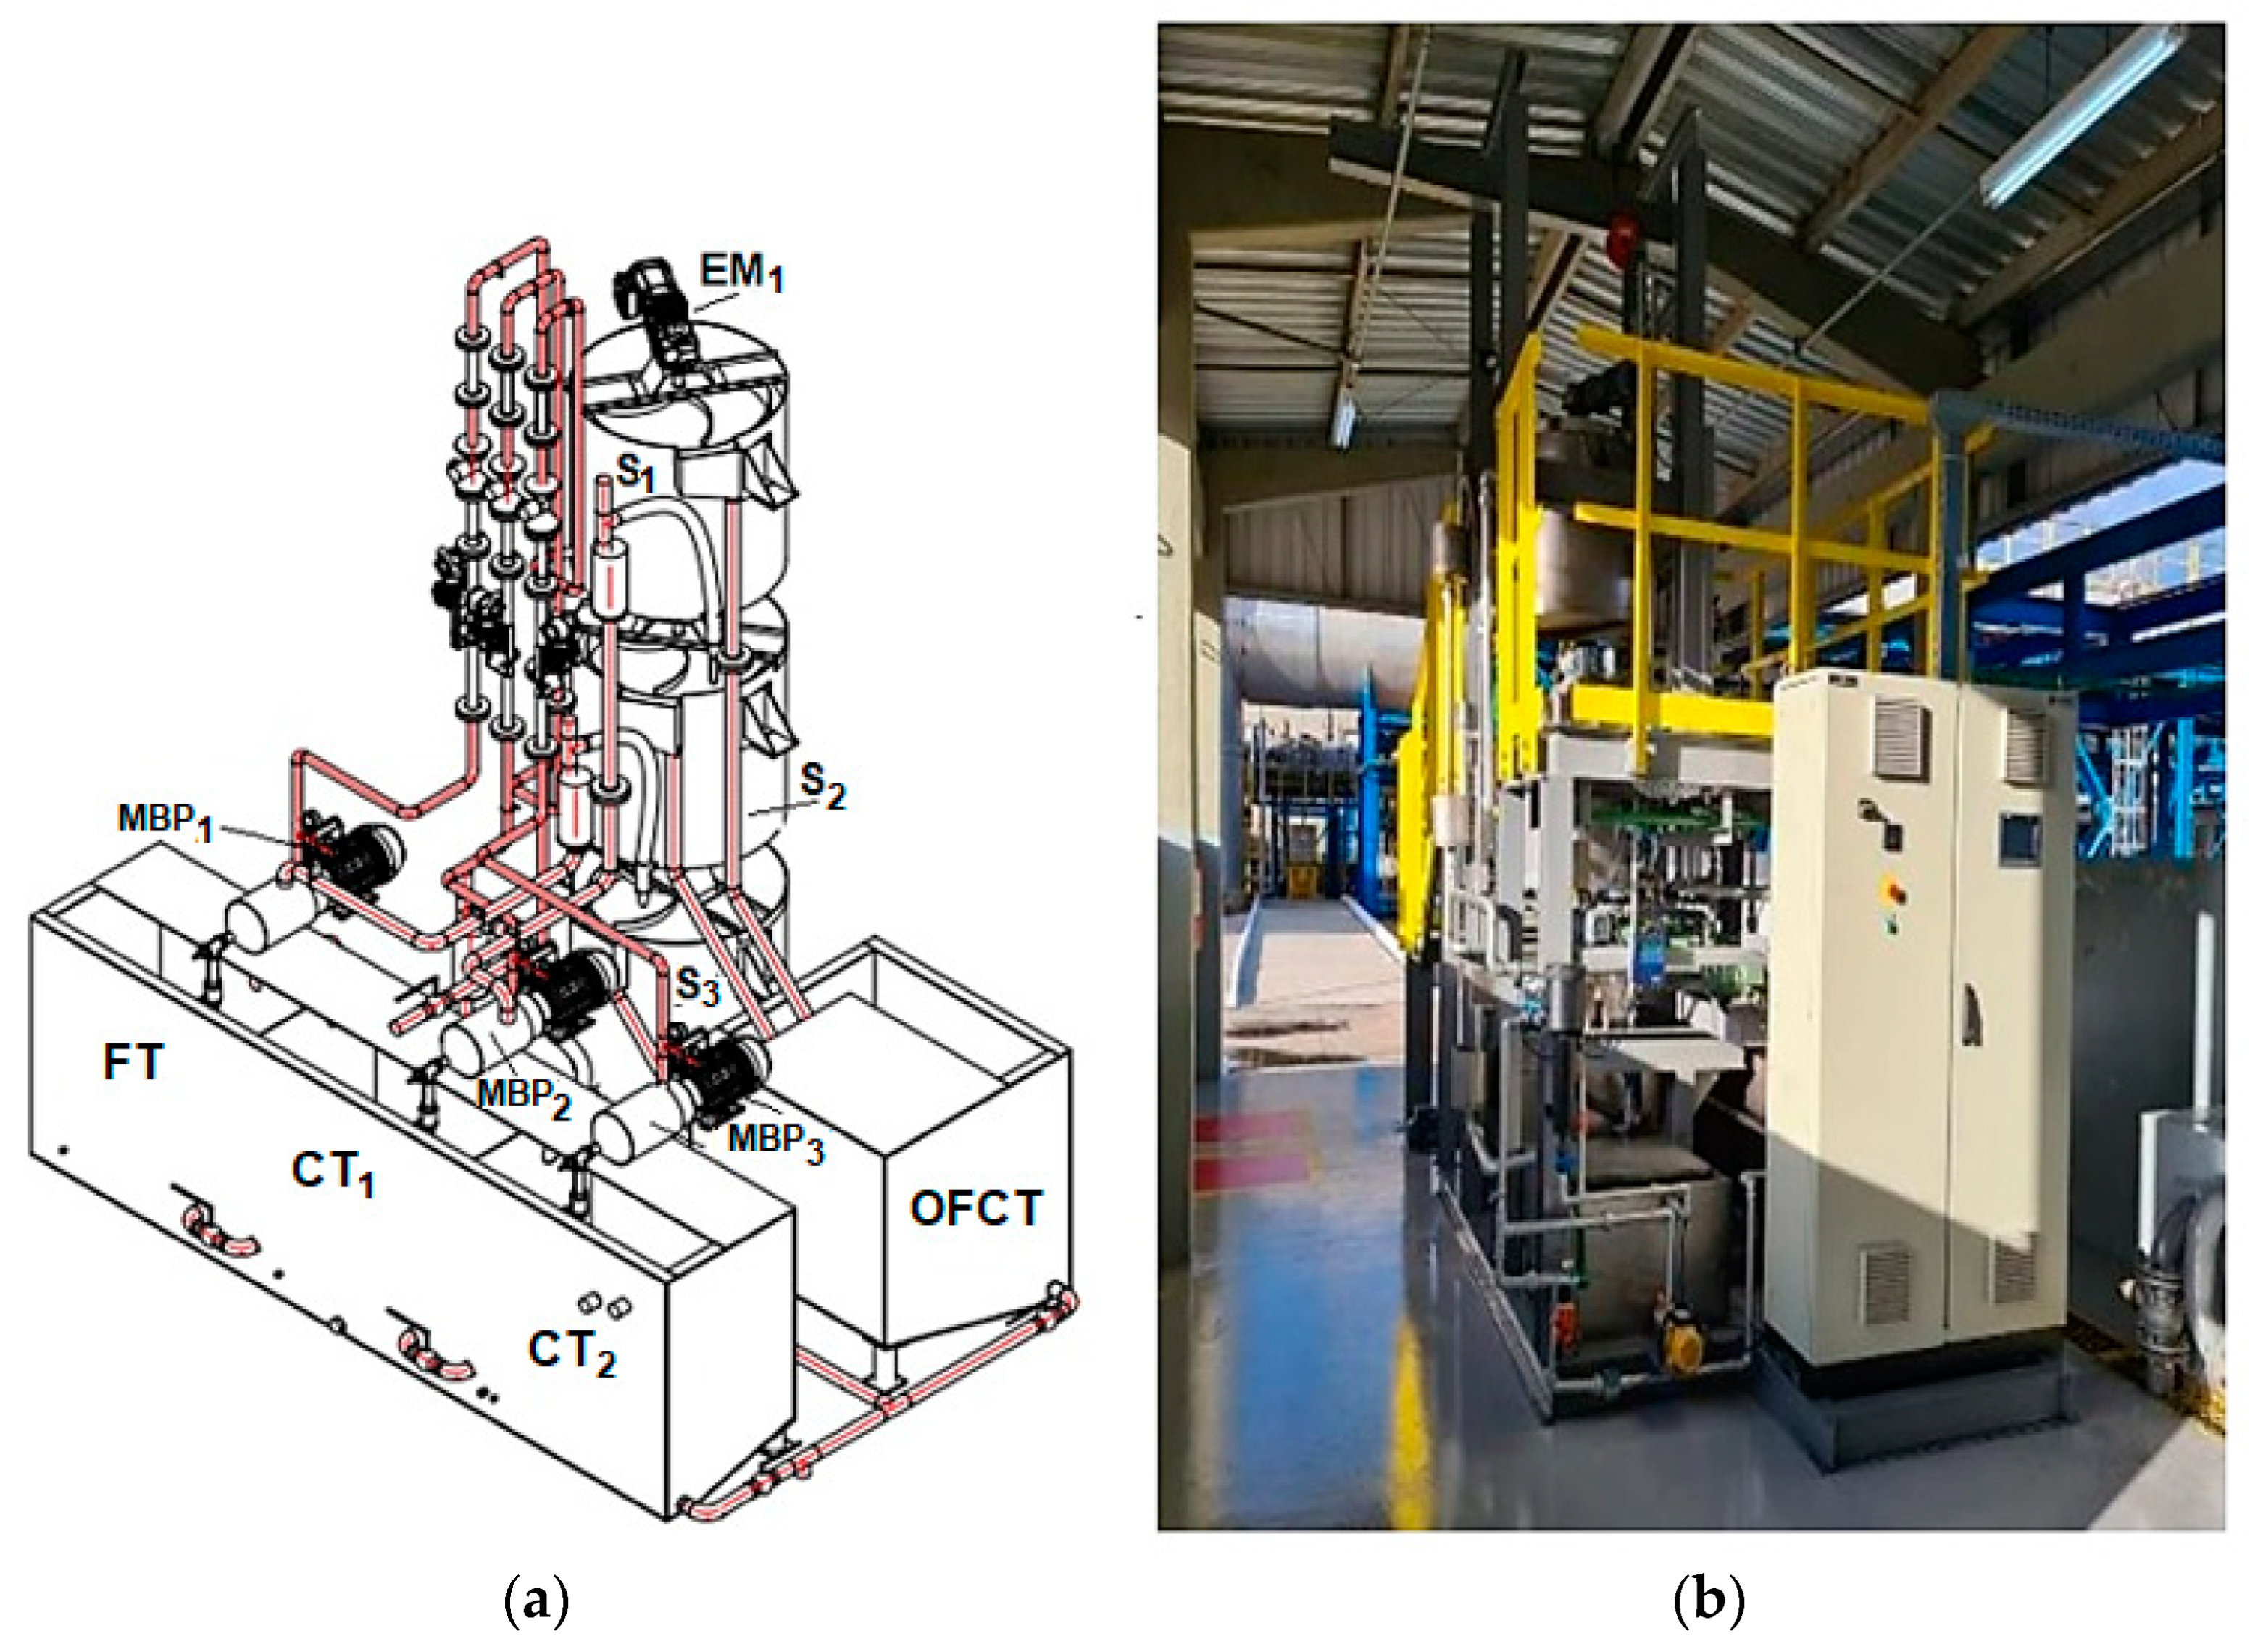
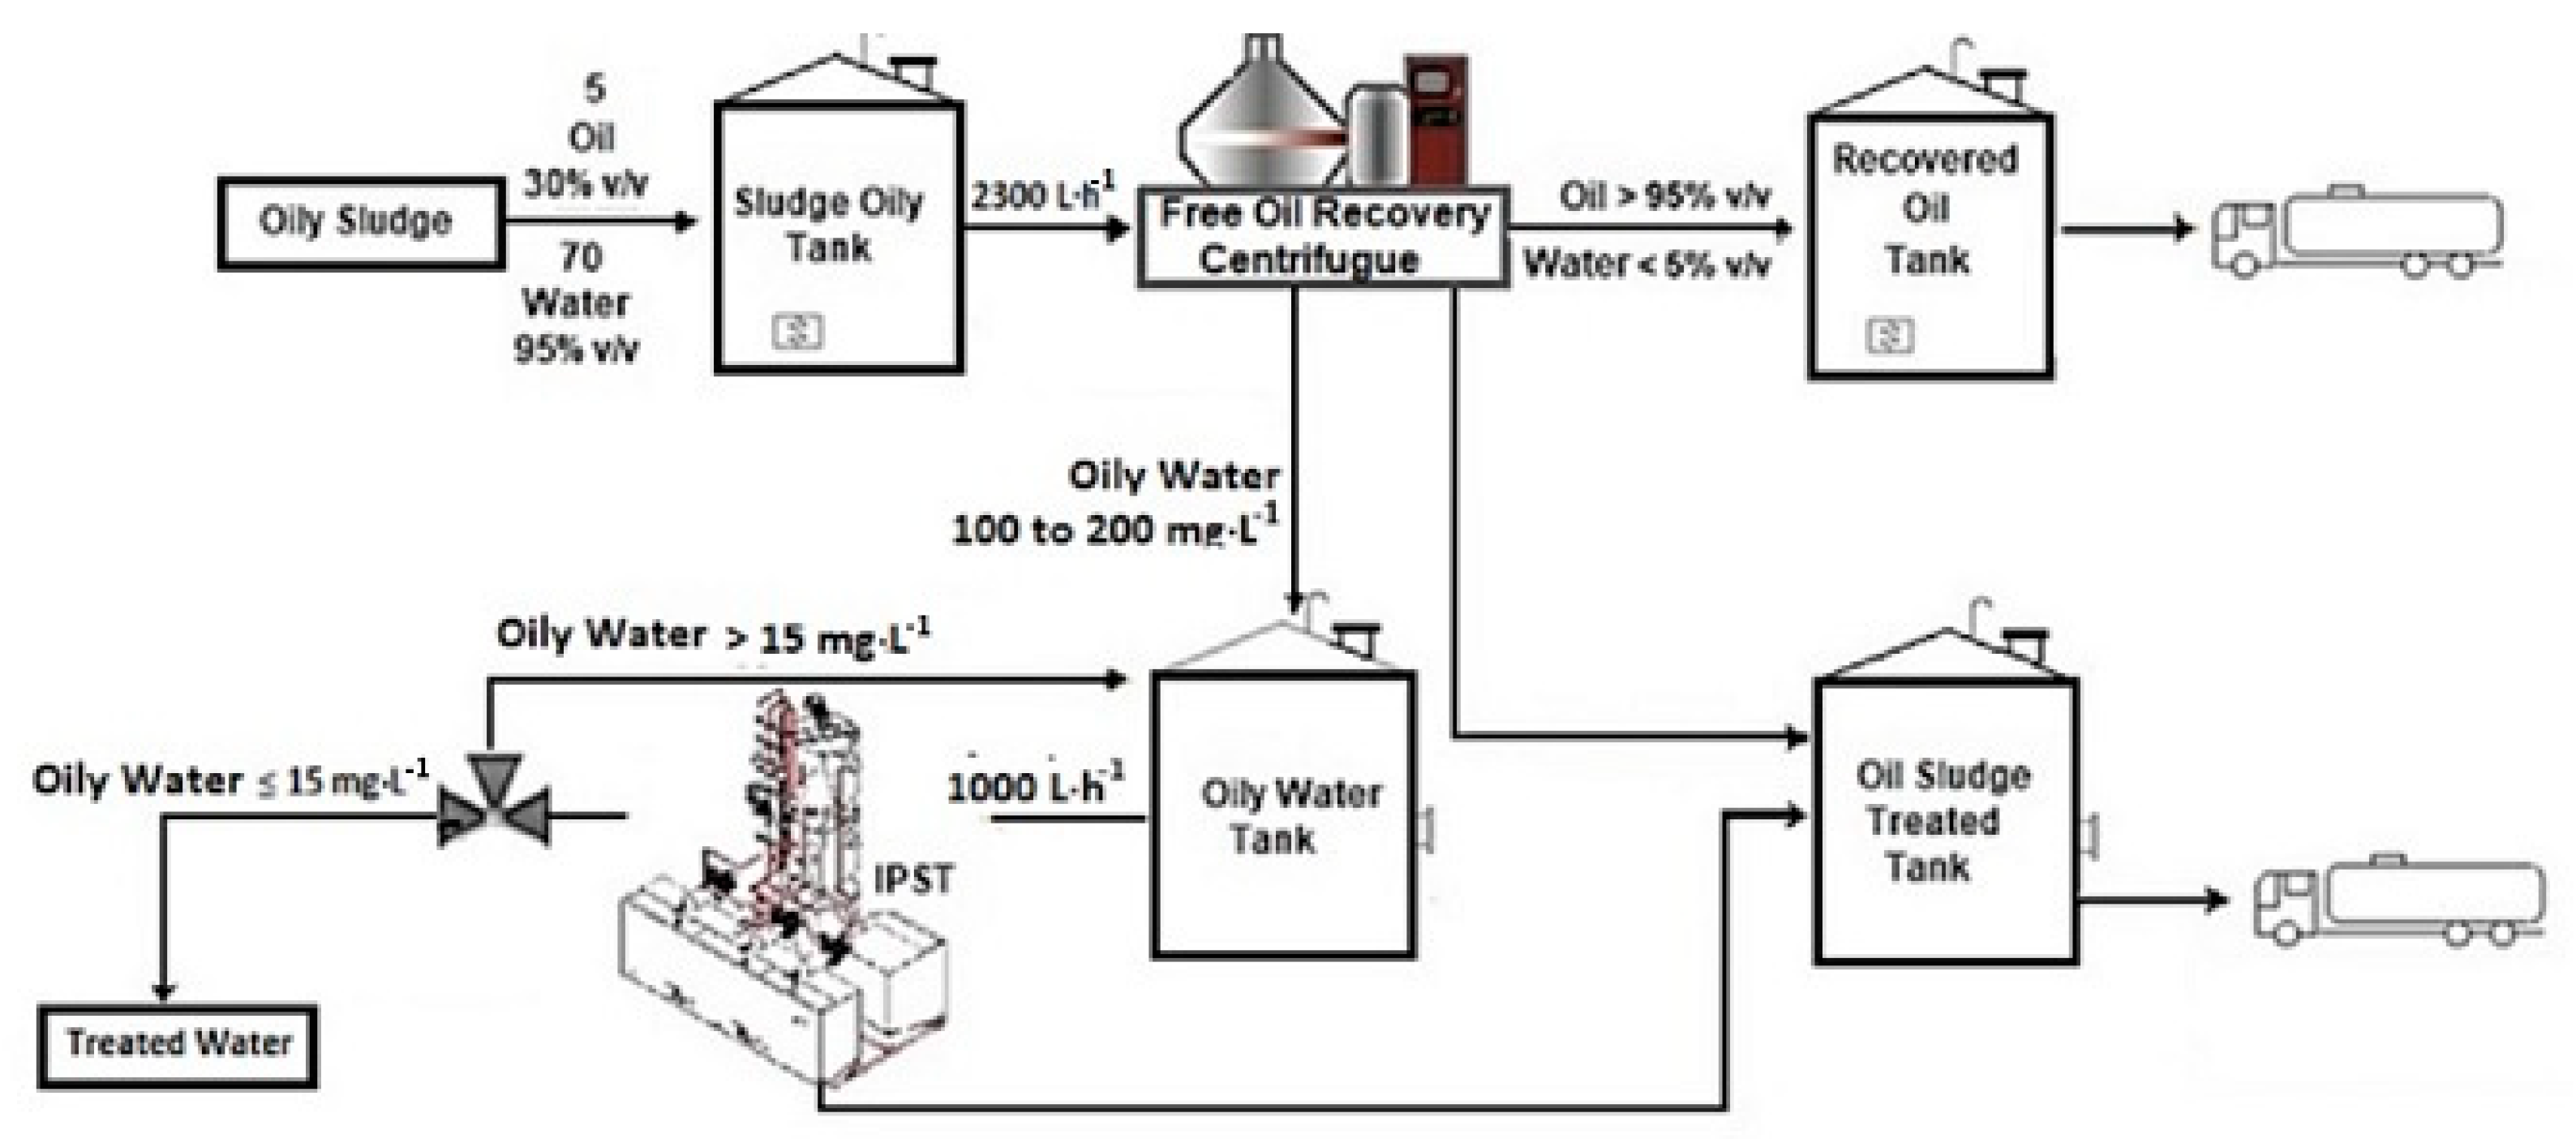
2.1. Semi-Industrial Induced Pre-Saturation Tower

The semi-industrial IPST built during this project has three stages, represented by three flotation chambers arranged in series. The shape of the stages is cylindrical, with a truncated conical base. Figure 1 presents a schematic diagram with the main components of the tower. The feed tank (FT) of the first stage (S1) receives the oily effluent to be treated. A level control sensor in the referred tank activates the feed pump (MBP1) of the first stage, which is also responsible for generating air microbubbles. This is a multistage centrifugal pump, adequately adapted to promote the saturation of the oily effluent while simultaneously sucking in atmospheric air, monitored by a rotameter (R1). Microbubble generation is adjusted by passing the liquid–gas mixture through a flow control valve (CV1) and a flow meter (FM1) before entering the S1 located at the top of the IPST. Upon reaching this stage of the flotation chamber at the top of the tower (E1), the foam formed in the flotation chamber rises and is homogeneously distributed on the free surface of the liquid column. Propellers driven by an electric motor installed on top of this stage (EM1) scrape off this oily foam to dispose of it in the oily foam collection tank (OFCT). The liquid with residual oil flows through the base of the S1 flotation chamber through a height-adjustable siphon to adjust the level of the liquid column inside the first stage. The liquid that flows through the siphon of the first stage goes to a collection tank of the residual oily effluent of the first stage (CT1), which also serves as a feed tank for the second stage (S2). The effluent treated in the first stage can be withdrawn for laboratory analysis through a sampling valve (SV1). Upon reaching the operating level established for CT1, the booster and microbubbles generation pump for the second stage (MBP2) supplies the same amount of energy to the residual effluent generated by the first stage, sucking it together with atmospheric air (R2), then pressing this mixture into the S2. Again, the effluent is aspirated together with atmospheric air, and the liquid–air mixture is pressurized and passes through a control valve (CV2) and a flow meter (FM2) before reaching the second stage flotation chamber (S2). The S2 oily foam is removed with the aid of scrapers in the form of propellers driven by an electric motor (EM2), the residual effluent from the second stage passes through a siphon to maintain the level of the liquid column in the second stage, and the effluent is collected by the second stage collection tank (CT2), or third stage feed tank. The effluent treated in the second stage can be withdrawn for laboratory analysis through the sampling valve SV2. The process is repeated for the third stage (S3). The water treated by S3 goes down from the S3 collection tank to a treated water tank. The effluent treated in the third stage can be withdrawn for laboratory analysis through the sampling valve SV3.
Connected to the feed tank (FT), 3 dosing systems are installed and equipped with dosing pumps for the possible use of auxiliary collectors such as ionic polymers, chemical surfactants or biosurfactants, and solutions for pH adjustment [17,18]. At the outlet of the treated effluent, there is a control strategy for the quality of the effluent from the tower, and, in a passage box, pH and turbidity sensors are installed. The mechanism used in generating microbubbles for the IPST was essential for obtaining a compact system that characterized the installation on a semi-industrial scale. Multi-stage centrifugal pumps replaced conventional centrifugal pumps to obtain pressures above 7 bar. Thus, the microbubble generation technique made it possible to alternate the range of work and the quality of the microbubbles generated in each stage according to the need for removal efficiency without using chemical or biological auxiliary collectors.

2.2. Automation and Control Strategies

Flotation is a conceptually simple operation. However, as a multiphase process with inherent instability, it exhibits complex dynamics, and an efficient way to increase its performance is the implementation of adequate controllers [19]. A fully automated prototype of this treatment process was built in order to deal with the increase in separation efficiency obtained with the addition of biosurfactant. Control loops were implemented to handle the operating conditions of the flotation system in order to regulate the turbidity of water at the prototype outlet.
The semi-industrial IPST was dimensioned for a nominal flow of 1000 m3·h−1, with each flotation chamber, per stage, having an effective capacity of 0.30 m3 (Figure 2). The three-stage collection and feeding tanks have a volume of 0.38 m3, and the oily sludge tank has a capacity of 0.35 m3. Four-stage centrifugal pumps, Schneidern (Recife, PE, Brazil), model ME-BR 1850 N, feed the three flotation stages and are also adapted to generate air microbubbles. These same pumps are driven by 5 hp motors and have a maximum manometric head of 90 bar. The oily foam scraper propellers are driven by 0.5-hp gearmotors, model SA37 DRS71S4 (SEW-Eurodrive, Bruchsal, Germany). A heat exchanger, model ART-1-1-700/702-SA-A/ALL-S-1V (Artica Equipamentos Industriais Ltda, São Paulo, SP, Brazil), developed on demand in specific, non-standard industrial processes, was installed at the inlet of the semi-industrial IPST to control the temperature of the effluent to be treated. Thus, a considerable loss of water–oil separation efficiency was avoided at temperatures above 40 °C [20,21].
Based on an established logic, the automation system guarantees the continuous functioning of the IPST. In addition to ensuring the maintenance of tank levels and the generation of microbubbles, the automation and control system monitors and analyzes the turbidity and alkalinity of the treated oily water. This system consists of four reservoirs (FT, CT1, CT2, and OFCT) and three stages (S1, S2, and S3), in addition to pumps (MBP1, MBP2, and MBP3), flow meters (FM1, FM2, FM3), control valves (SV1, SV2, SV3), and turbidity and water alkalinity sensors. Other systems, such as oily foam scrapers, dosing tank agitators, and valves controlling the flow of microbubbles (MBP1, MBP2, and MBP3), had their controls in closed and individualized loops.
The entire system was designed to be monitored with a dedicated Programmed Logic Controller (PLC), supervised and controlled by supervisory software on a Human Machine Interface (HMI) touchscreen terminal. A selection key on the front of the general panel makes it possible to opt for local control (in the field) of the system components. A small-size PLC manufactured by Allen Bradley Micrologix 1200 series was chosen. Communication with the Graphic Interface is achieved via RS485 through the NET-AIC modules, which allow for optical isolation and enable interconnections of up to 1200 m between the PLC and the Graphic Interface.

2.3. Statistical Data Treatment

Three independent repetitions were made for each test, and the results were presented as mean values. Moreover, both the uncertainty of the mean of a given parameter and its propagation were correlated. Data were submitted to analysis of variance (ANOVA), and the Tukey’s test was performed to identify significant differences among mean values [22]. The Principal Component Analysis (PCA) was also applied for preliminary identification to assess associations between factors, and between these and the oil and grease removal efficiency selected as a response. PCA was applied with the aid of Statistica software from StatSoft® (Tulsa, OK, USA), Version 10.
Optimization of the IPST experimental conditions consisted of obtaining a global response with the aid of the maximum local conditions. For this, the desirability function [23] was applied, observing the transformation of the estimated response (Yi) to the desired value (di), where 0 ≤ di ≤ 1. If the objective T is in the answer, Yi is the maximum, that is:
d i = { 0   Y 1 < L ( Y 1 L T L ) r   L Y i T   1   Y i < T
If the objective T is in the response,  Y i is the minimum value, that is:
d i = { 1   Y 1 < T ( U Y i U T ) r   T Y i U   0   Y i < U
In this case, L is the lower limit, and U is the upper limit.
The convenience function is linear when the weight r is equal to 1. When the chosen r is > 1, there will be greater emphasis on values close to the target. If the preference is 0 < r < 1, it will have minor importance. The individual desirability values (di) were combined through a geometric mean to form a global or general convenience (D). This unique value of D (0, 1) provides the overall assessment of combined convenience and the response levels, and D increases as the balance of properties becomes more favorable.

2.4. Oil and Grease Content Analysis

Quantitative analyses were carried out on the industrial effluent of the EPASA (Centrais Elétricas da Paraíba, João Pessoa, PB, Brazil) at the inlet and outlet of the IPST semi-industrial prototype to check the oil-eater removal efficiency. Samples of effluent treated by the semi-industrial IPST were collected for analysis of oil and grease content before discharging treated water for disposal into a river. When the values of the oil and grease content were higher than the limit imposed by the environmental agency (20 mg·L−1) [24], the IPST effluent was sent to be reprocessed by the tower.
The following laboratory equipment was used to perform oil and grease content analysis in the EPASA chemical laboratory: analytical balance, heating plate, oven, hood, semi-analytical balance, desiccator, 50 mL and 250 mL beakers, 10 mL pipettes, and 1000 mL separatory funnels. Sulfuric acid and hexane, both of p.a. grade, were used as chemical reagents.
The gravimetric partition method uses a standard mixture of hexadecane/stearic acid 1:1 by mass, at a concentration of 2 mg·mL−1 for each substance in acetone, used as the extraction solvent. According to the procedure described in this method [25], first, the level of the lower meniscus of the liquid/air interface must be marked on the sample storage flask for later determination of its volume. Then, the sample is placed in a separatory funnel, and 30 mL of the standard mixture is added. Mix for 2 min and wait until the phases separate. After separating the phases, the aqueous phase is drained into the original sample storage flask, and the phase containing the standard mixture, i.e., the extraction solvent and the extracted oil, into a flat-bottomed flask, through a funnel fitted with filter paper and 10 g of sodium sulfate. The procedure for extracting the oil from the sample is repeated twice more, adding 30 mL of the standard mixture to the separation funnel containing the sample, mixing for 2 min, and waiting for the separation and subsequent drainage of the phases. In the end, another 10 mL of extraction solvent is added to the flat-bottomed flask through the funnel containing the filter paper. The total volume of extraction solvent added to the flat-bottomed flask should be approximately 100 mL After this procedure, the distillation of the extraction solvent contained in the flat-bottomed flask must be carried out using an apparatus for distillation and recovery of solvents with the aid of a vacuum chamber. Once the distillation of all the solvents has been completed, the oil contained in the sample and the known residues of the extraction solvent will remain in the flat-bottomed flask. Using the mass difference between the empty flat-bottomed flask at the beginning of the test and after the distillation of the solvent, the mass of oil contained in the sample can be calculated. To determine the initial volume of the sample, fill the sample storage bottle with water up to the position of the inferior meniscus of the liquid/air interface, noted at the beginning of the test, and with the aid of a graduated cylinder, determine the volume. The oil concentration can be determined through the ratio between the oil mass in the sample, in mg, and the volume, calculated in liters.

2.5. Experimental Design

A sequence of experimental designs was planned to identify the recommended operating conditions for the semi-industrial IPST. First, a 28-4 fractional factorial design [26] was applied, with the objective of identifying the statistically relevant independent variables. After a possible reduction in factors, a complete factorial design [27] was applied to identify the regions with probability of occurrence of optimal operating conditions. After a second screening, a central composite rotational design (CCRD) [28] should be applied in order to identify the partially optimized operating conditions for the tower.

3. Results and Discussion

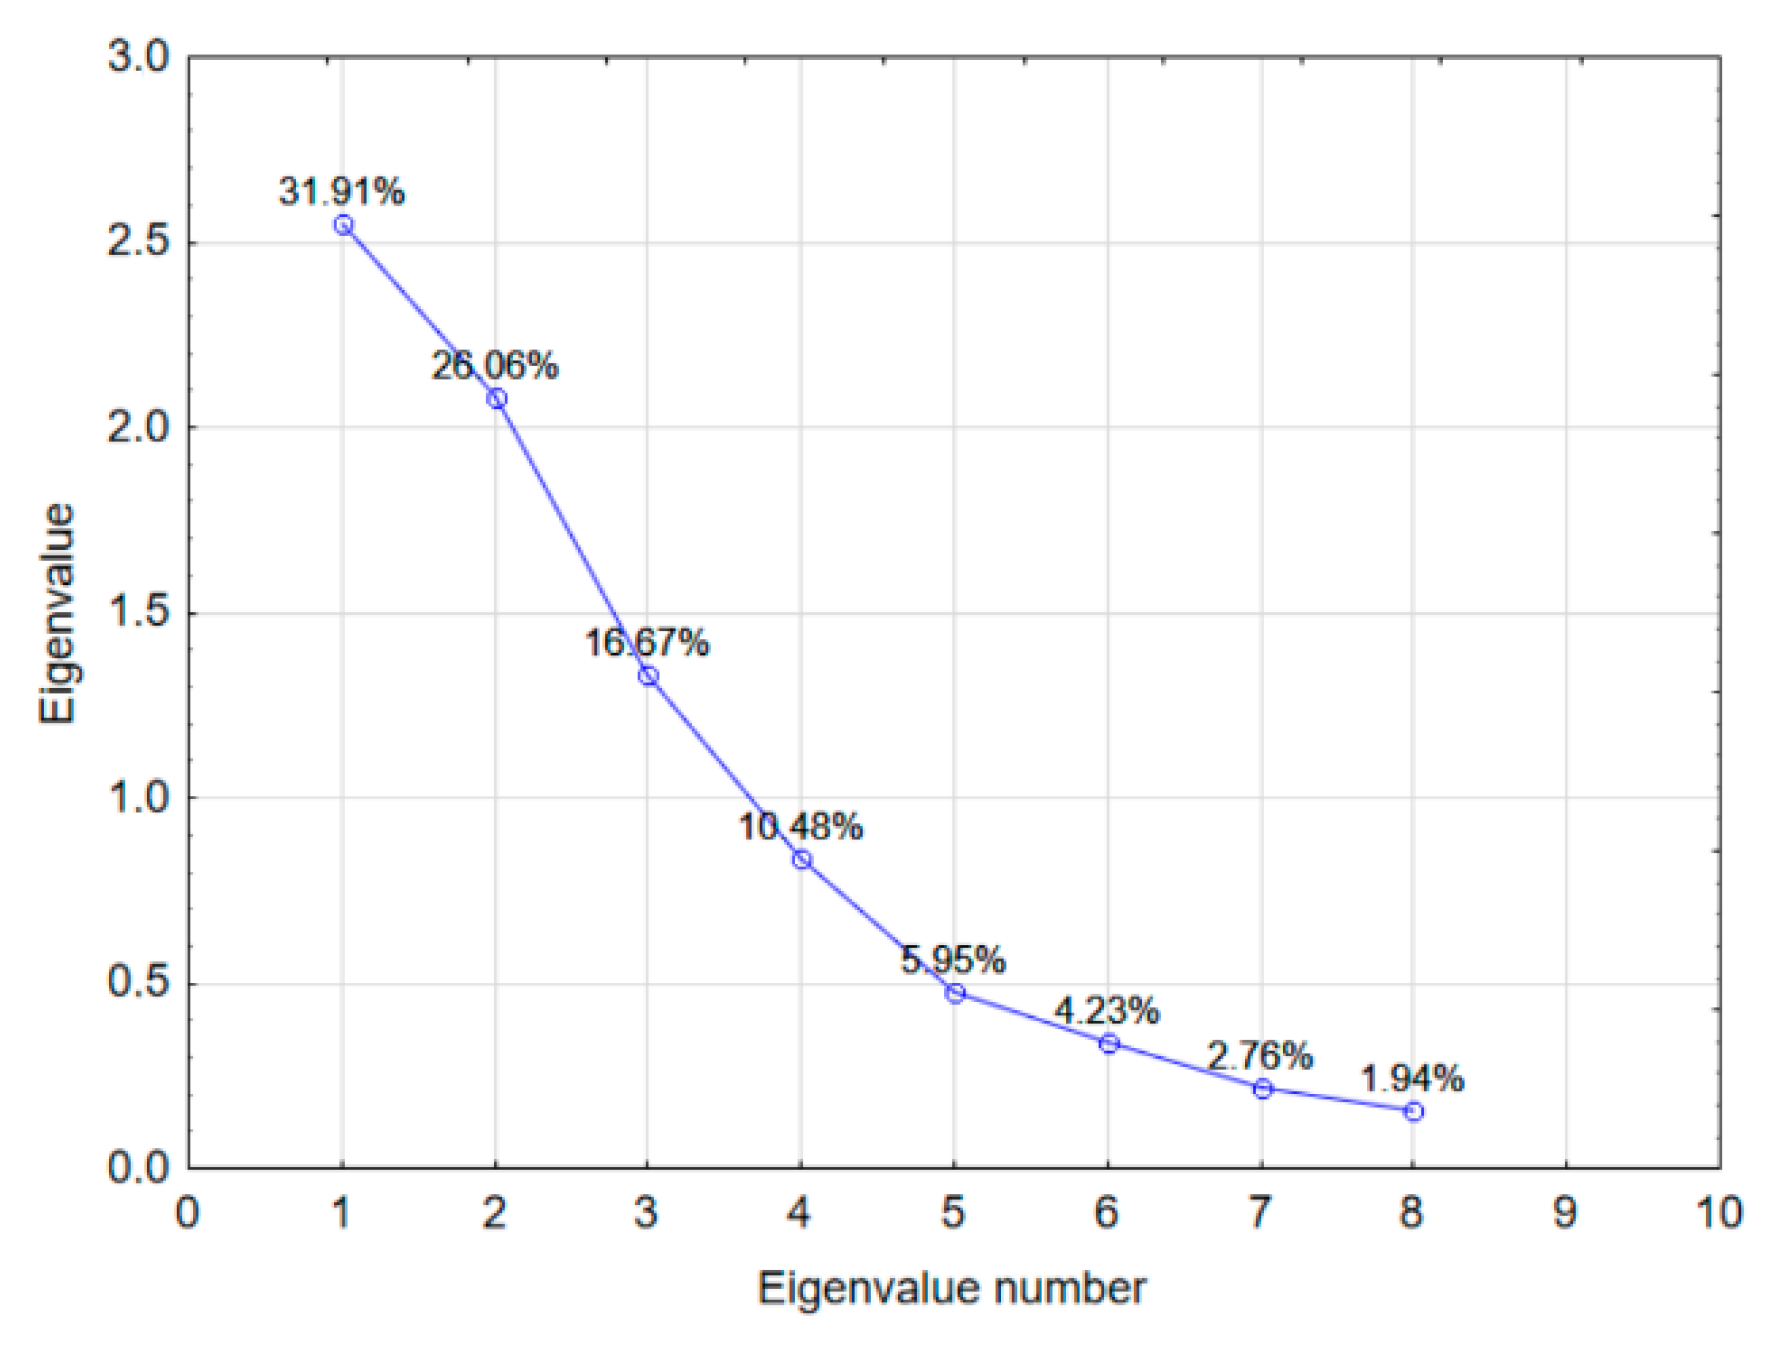
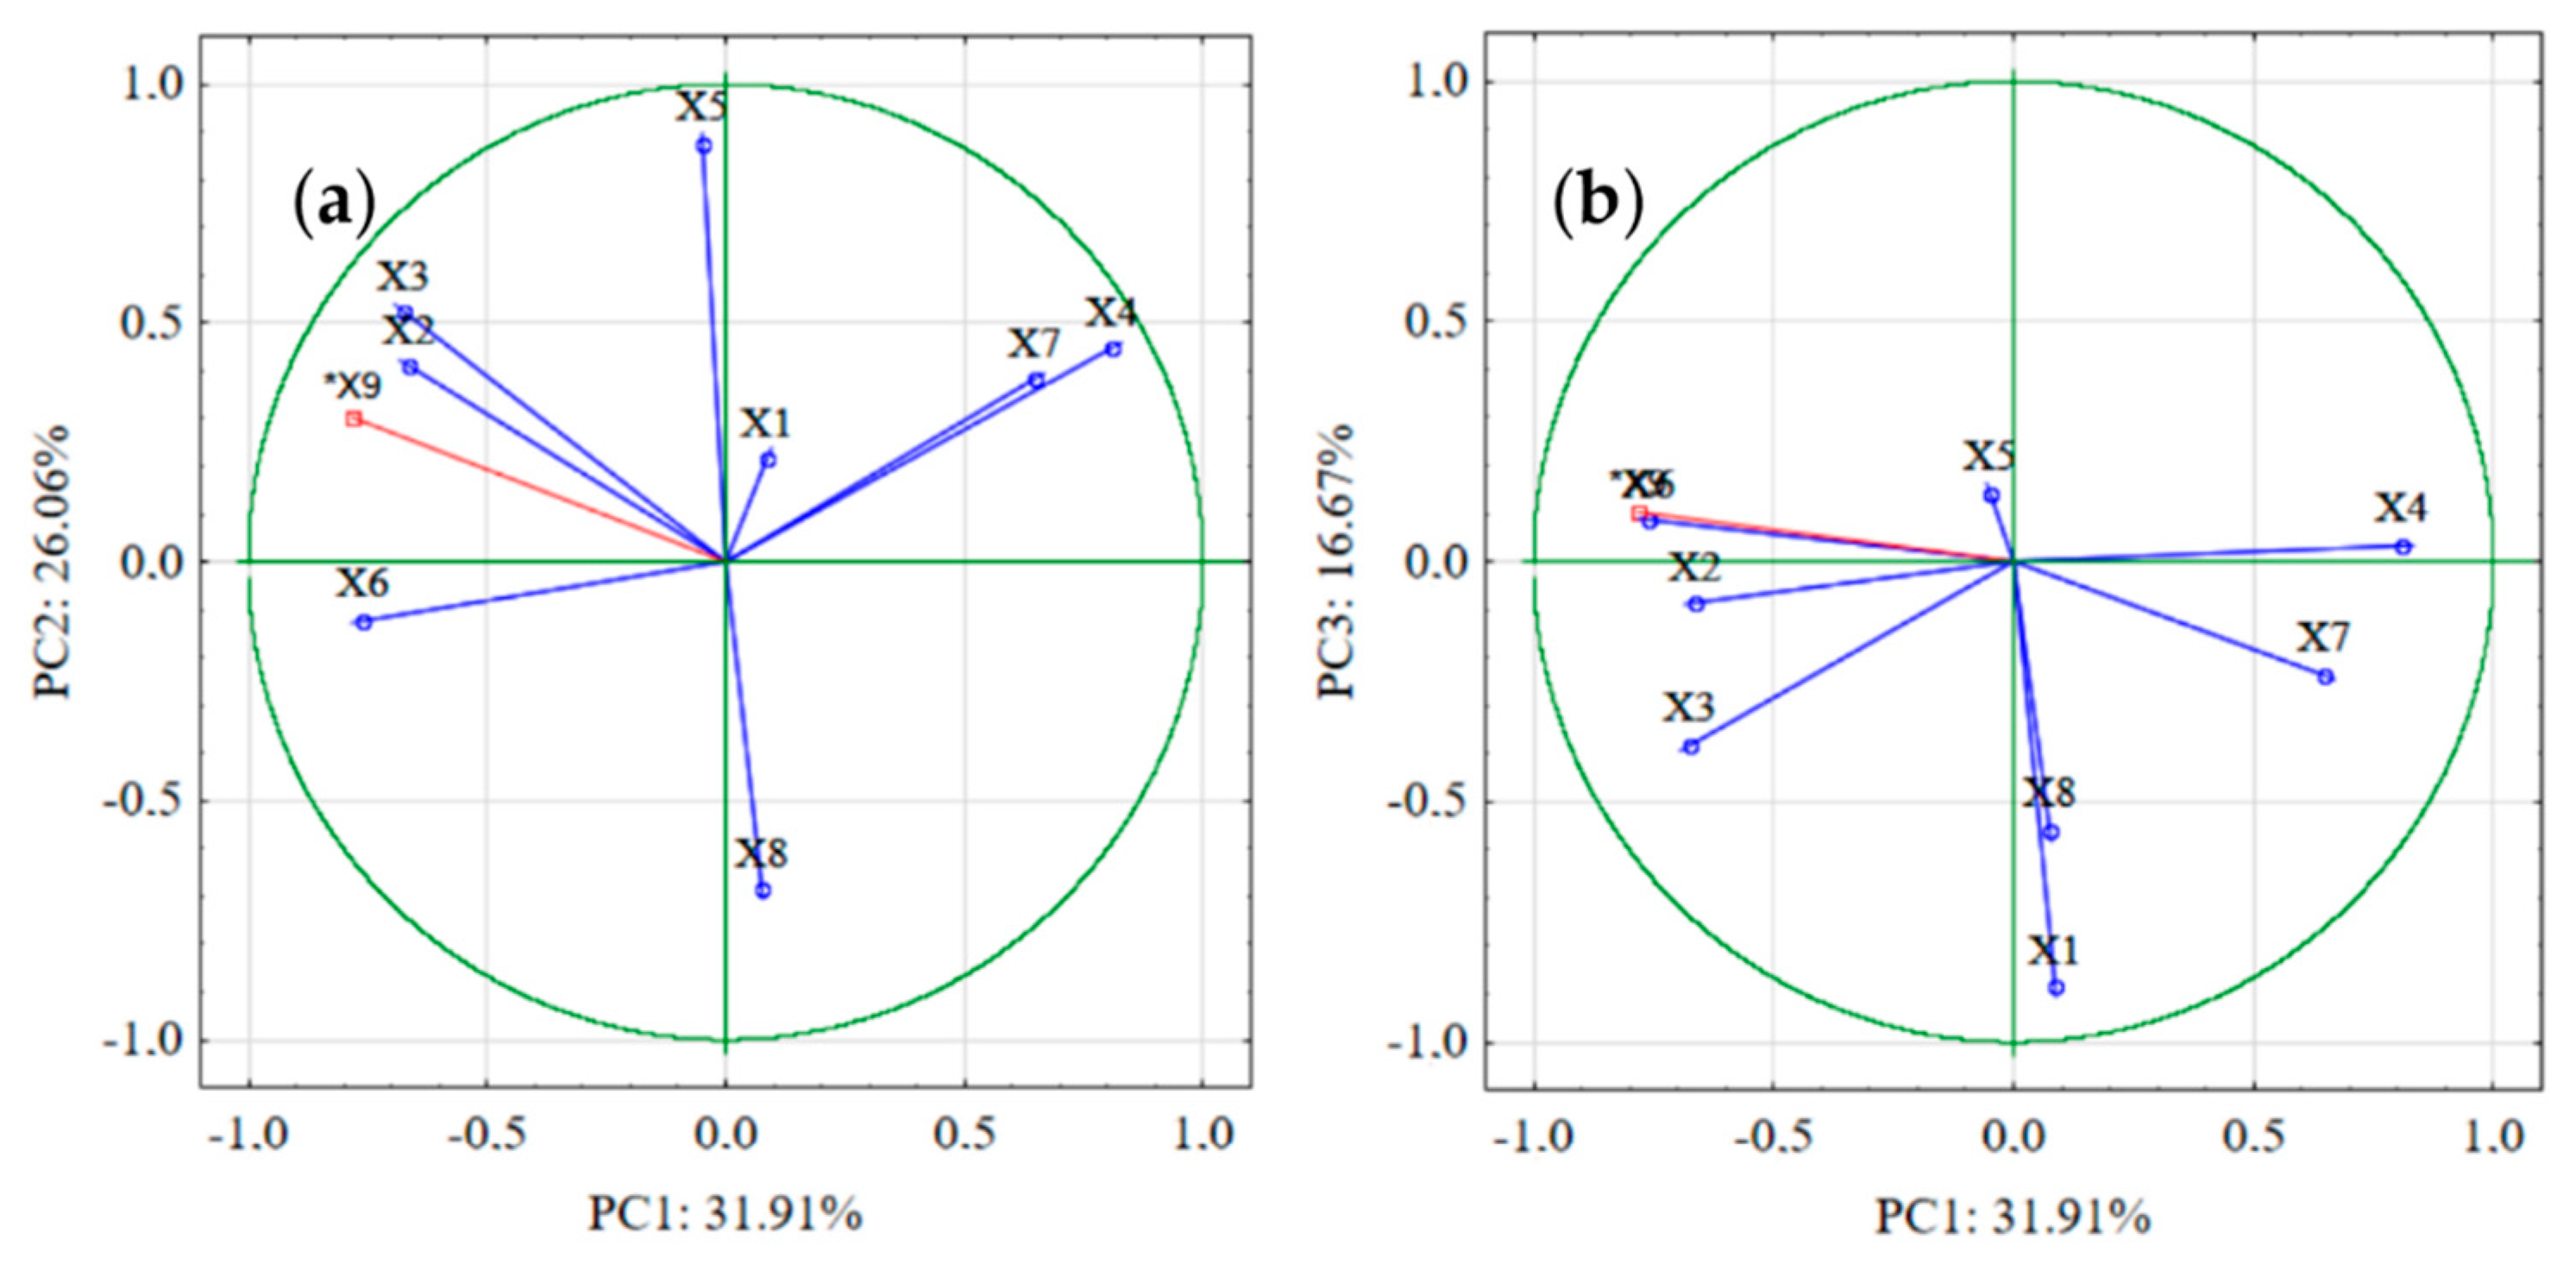
3.1. Principal Component Analysis

Principal component analysis (PCA) calculates the eigenvalues and corresponding eigenvectors of a correlation matrix. In this symmetric matrix, the main diagonal elements are the variances of the standardized absolute frequencies of each class (standardized variables), and the other elements are the covariance values between pairs of standardized variables [29]. The independent variables involved in the PCA for IPST were: X1—Feed volumetric flow (L·h−1); X2—Recycle flow rate (L·h−1); X3—Scraper velocity (rpm); X4—Average pressure of the microbubble pumps (bar); X5—Volumetric air flow rate for microbubble generation, expressed in normal liters per hour (NL·h−1); X6—Oil and grease content in the effluent to be treated (mg·L−1); X7—Temperature of the effluent to be treated (°C); and X8—pH of the effluent to be treated. On the other hand, the oil and grease removal efficiency (%) (X9) was the response variable. The standardized form of each variable (Yij) was obtained by dividing the deviations from its mean (Xij −  X ¯ j ) by its standard deviation S( X ¯ j ), according to the Equation (3):
Y i j = X i j X ¯ j S ( X ¯ j )
with  X ¯ j being the mean of the jth original variable.
As a result of this application, three principal components (PCs) were obtained with three eigenvalues above 1 (Figure 3). In other words, following Kaiser’s criteria [28], the first three principal components together explained about 75% of the variability of the phenomenon of removal of oils and greases by IPST.
In the assembly of equations corresponding to PCs, Table 1 provides the weights of variables within each PC. From these data, linear combinations representing PCs from 1 to 3 could be written, with each variable being accompanied by its respective weight (Equations (4)–(6)):
PC1 = −0.66·X2 − 0.67·X3 + 0.81·X4 − 0.76·X6 + 0.67·X7
PC2 = 0.41·X2 − 0.52·X3 + 0.45·X4 − 0.87·X5 − 0.69·X8
PC3 = −0.88·X1 − 0.38·X3 + 0.56·X8
With the selection of three main components, reducing the dimension from eight original variables to three principal components was quite reasonable, considering that reducing variables can happen without losing a large volume of information about the observed phenomenon. The hyperspheres shown in Figure 4 help identify critical existing correlations between the pairs PC1 and PC2, and PC1 and PC3, respectively. According to that figure, variables X4 and X6 are the most prominent variables in main component 1 (PC1). The pressure controls of the microbubble generator pumps and the oil and grease content in the feed of the IPST are the most important recommendations for obtaining the first principal component (PC1) in interpreting the IPST responses to the related control variables in this study. Still, from the aforementioned figure, variables X4 and X7, as well as variables X2 and X3, two by two, present very similar contributions to PC1, since the vectors representing these variables, two by two, form a very acute angle. Regarding the pairs of variables mentioned above, X4–X7 and X2–X3, the opposite signs of these pairs indicate that each of these combinations of variables interferes oppositely with the variations of PC1. The pairs of variables X3–X5 and X5–X6, that is, the scraper’s rotation speed and the volumetric flow of the air to generate microbubbles, respectively, showed very low correlation with each other because they present an angle close to 90° between them. Variables X5 and X8 are the ones with the greatest significance concerning the contribution of both to PC2 (Figure 4). Both variables are closer to the ends of the circles that make up these hyperspheres.

3.2. Fractional Factorial Design

A 28-4-type fractional design was applied to the operating conditions of the IPST to select the statistically relevant variables [30]. All eight independent variables (X1 to X8) were tested, and the percentage efficiency of oil and grease removal was selected as the response variable. The variables recommended as statistically important for the oil and grease removal efficiency, according to Table 2, were: X2, X3, X4, and X7.

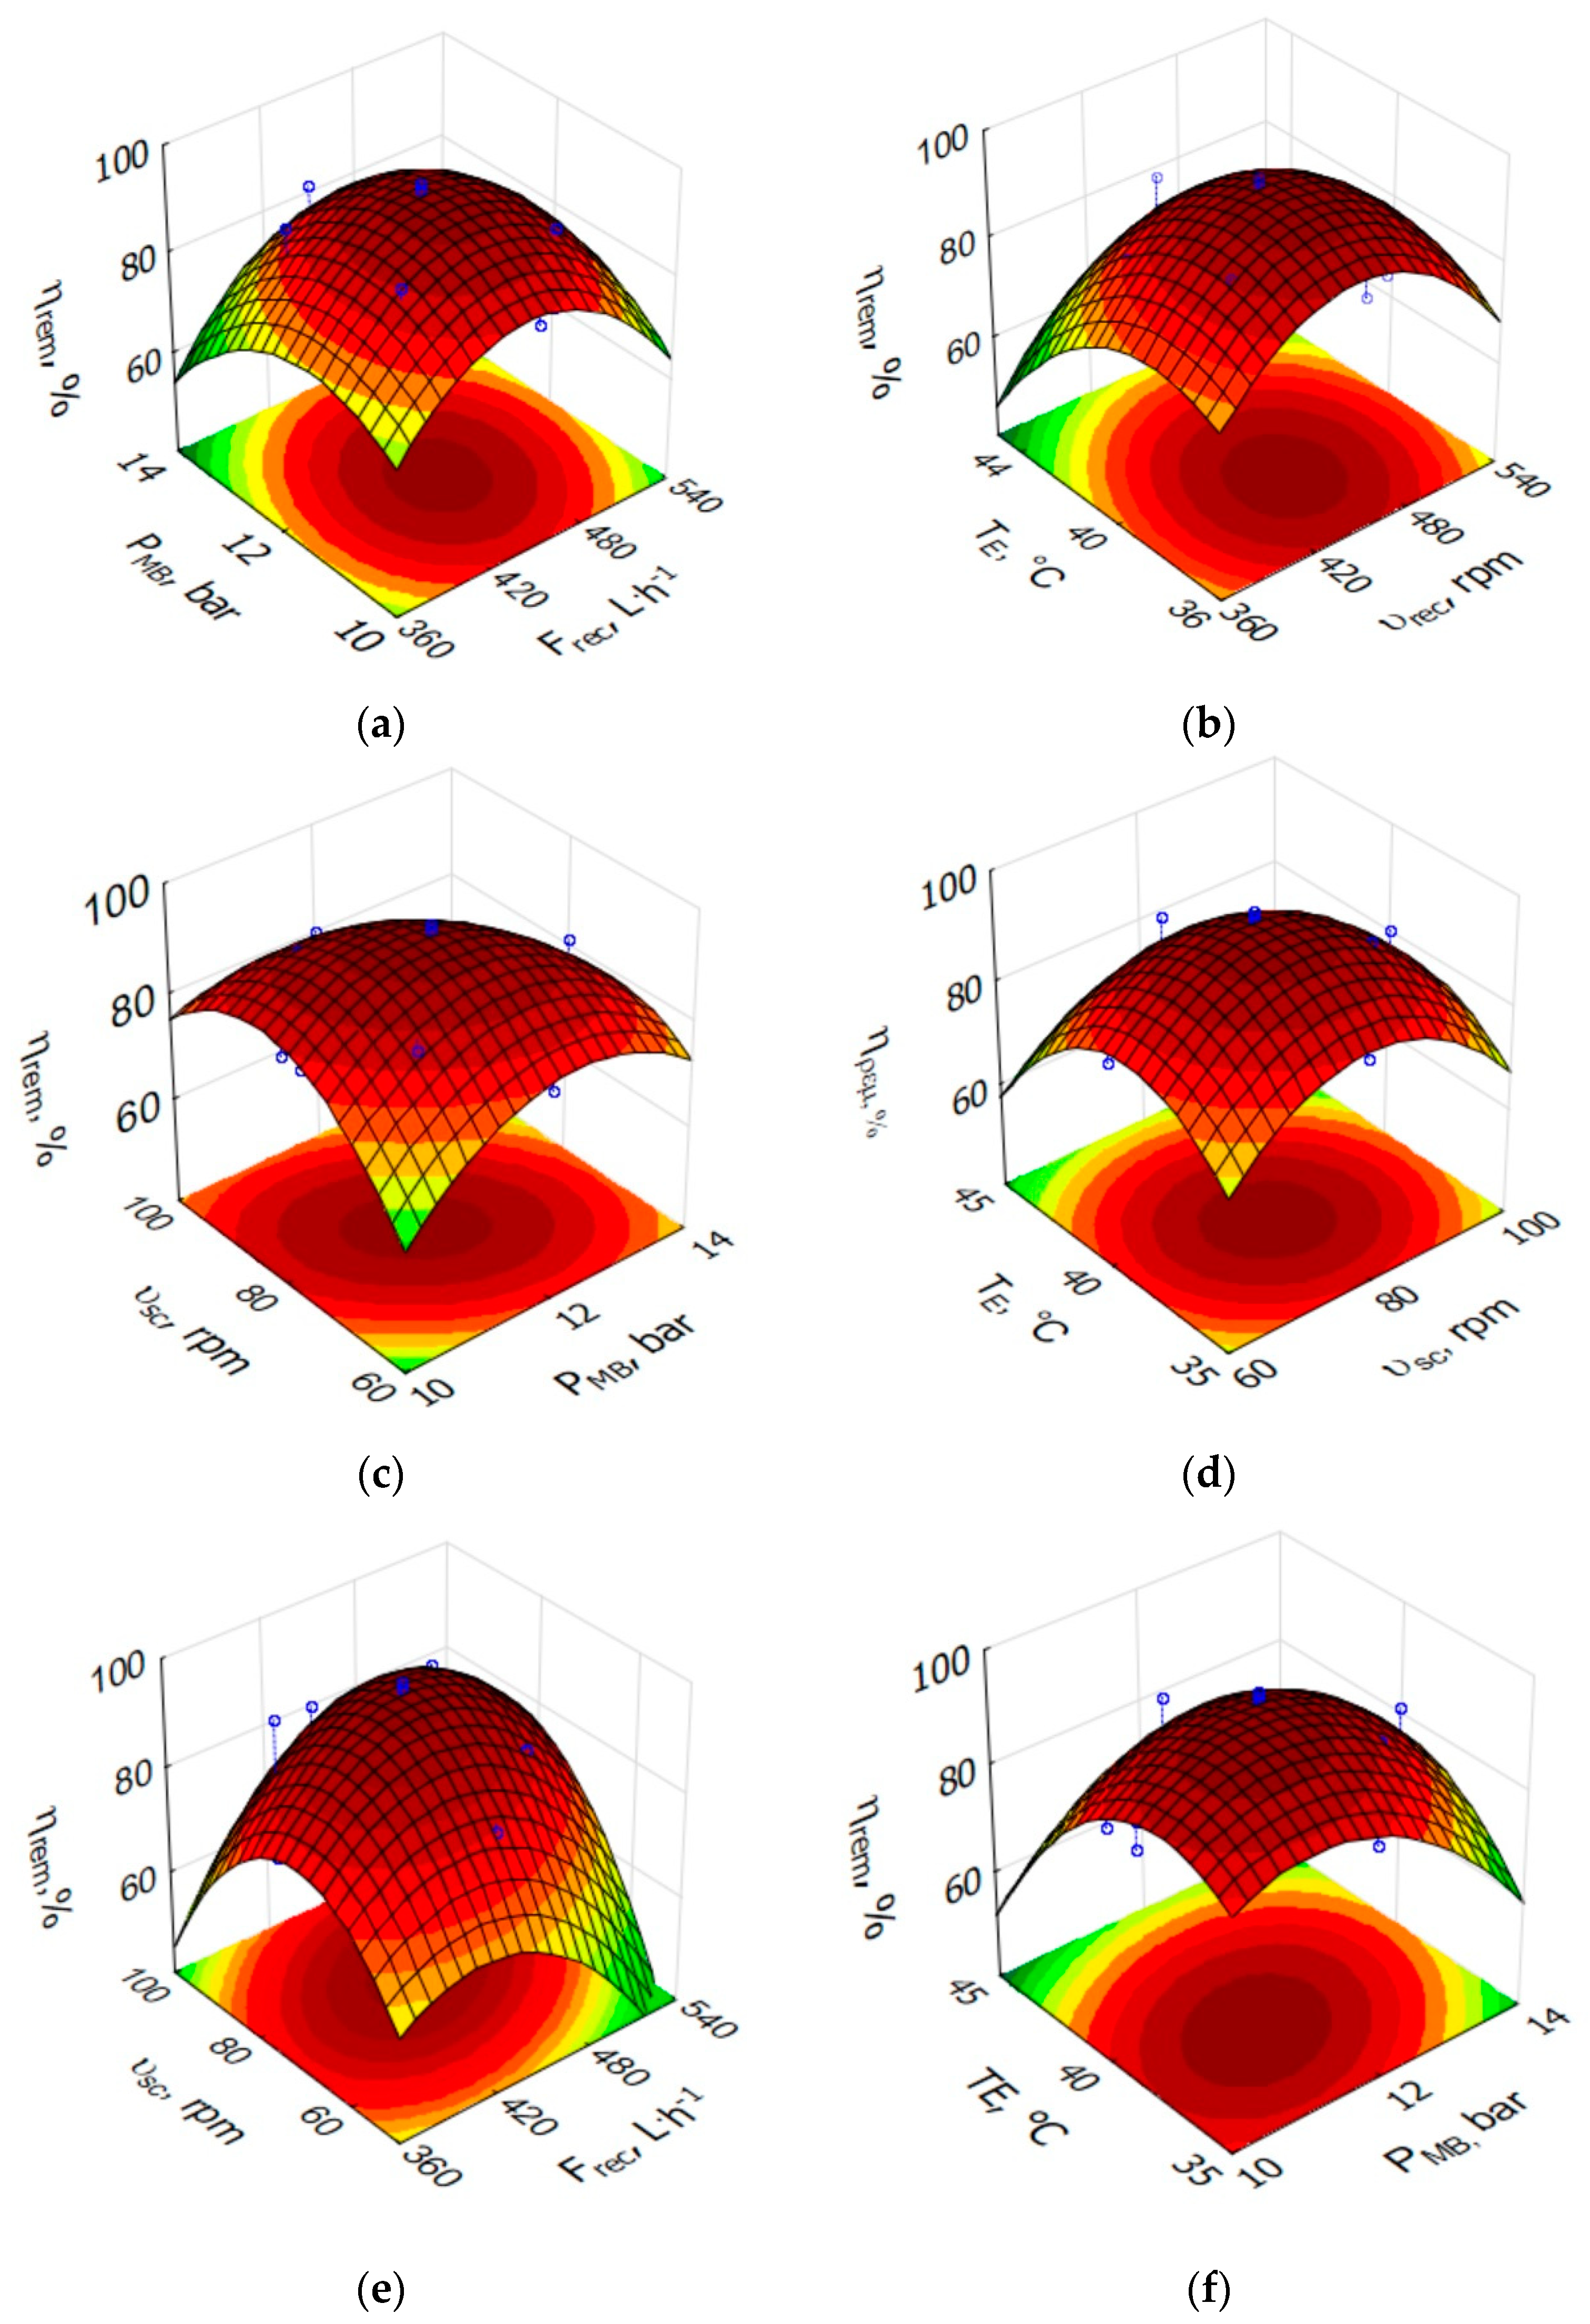
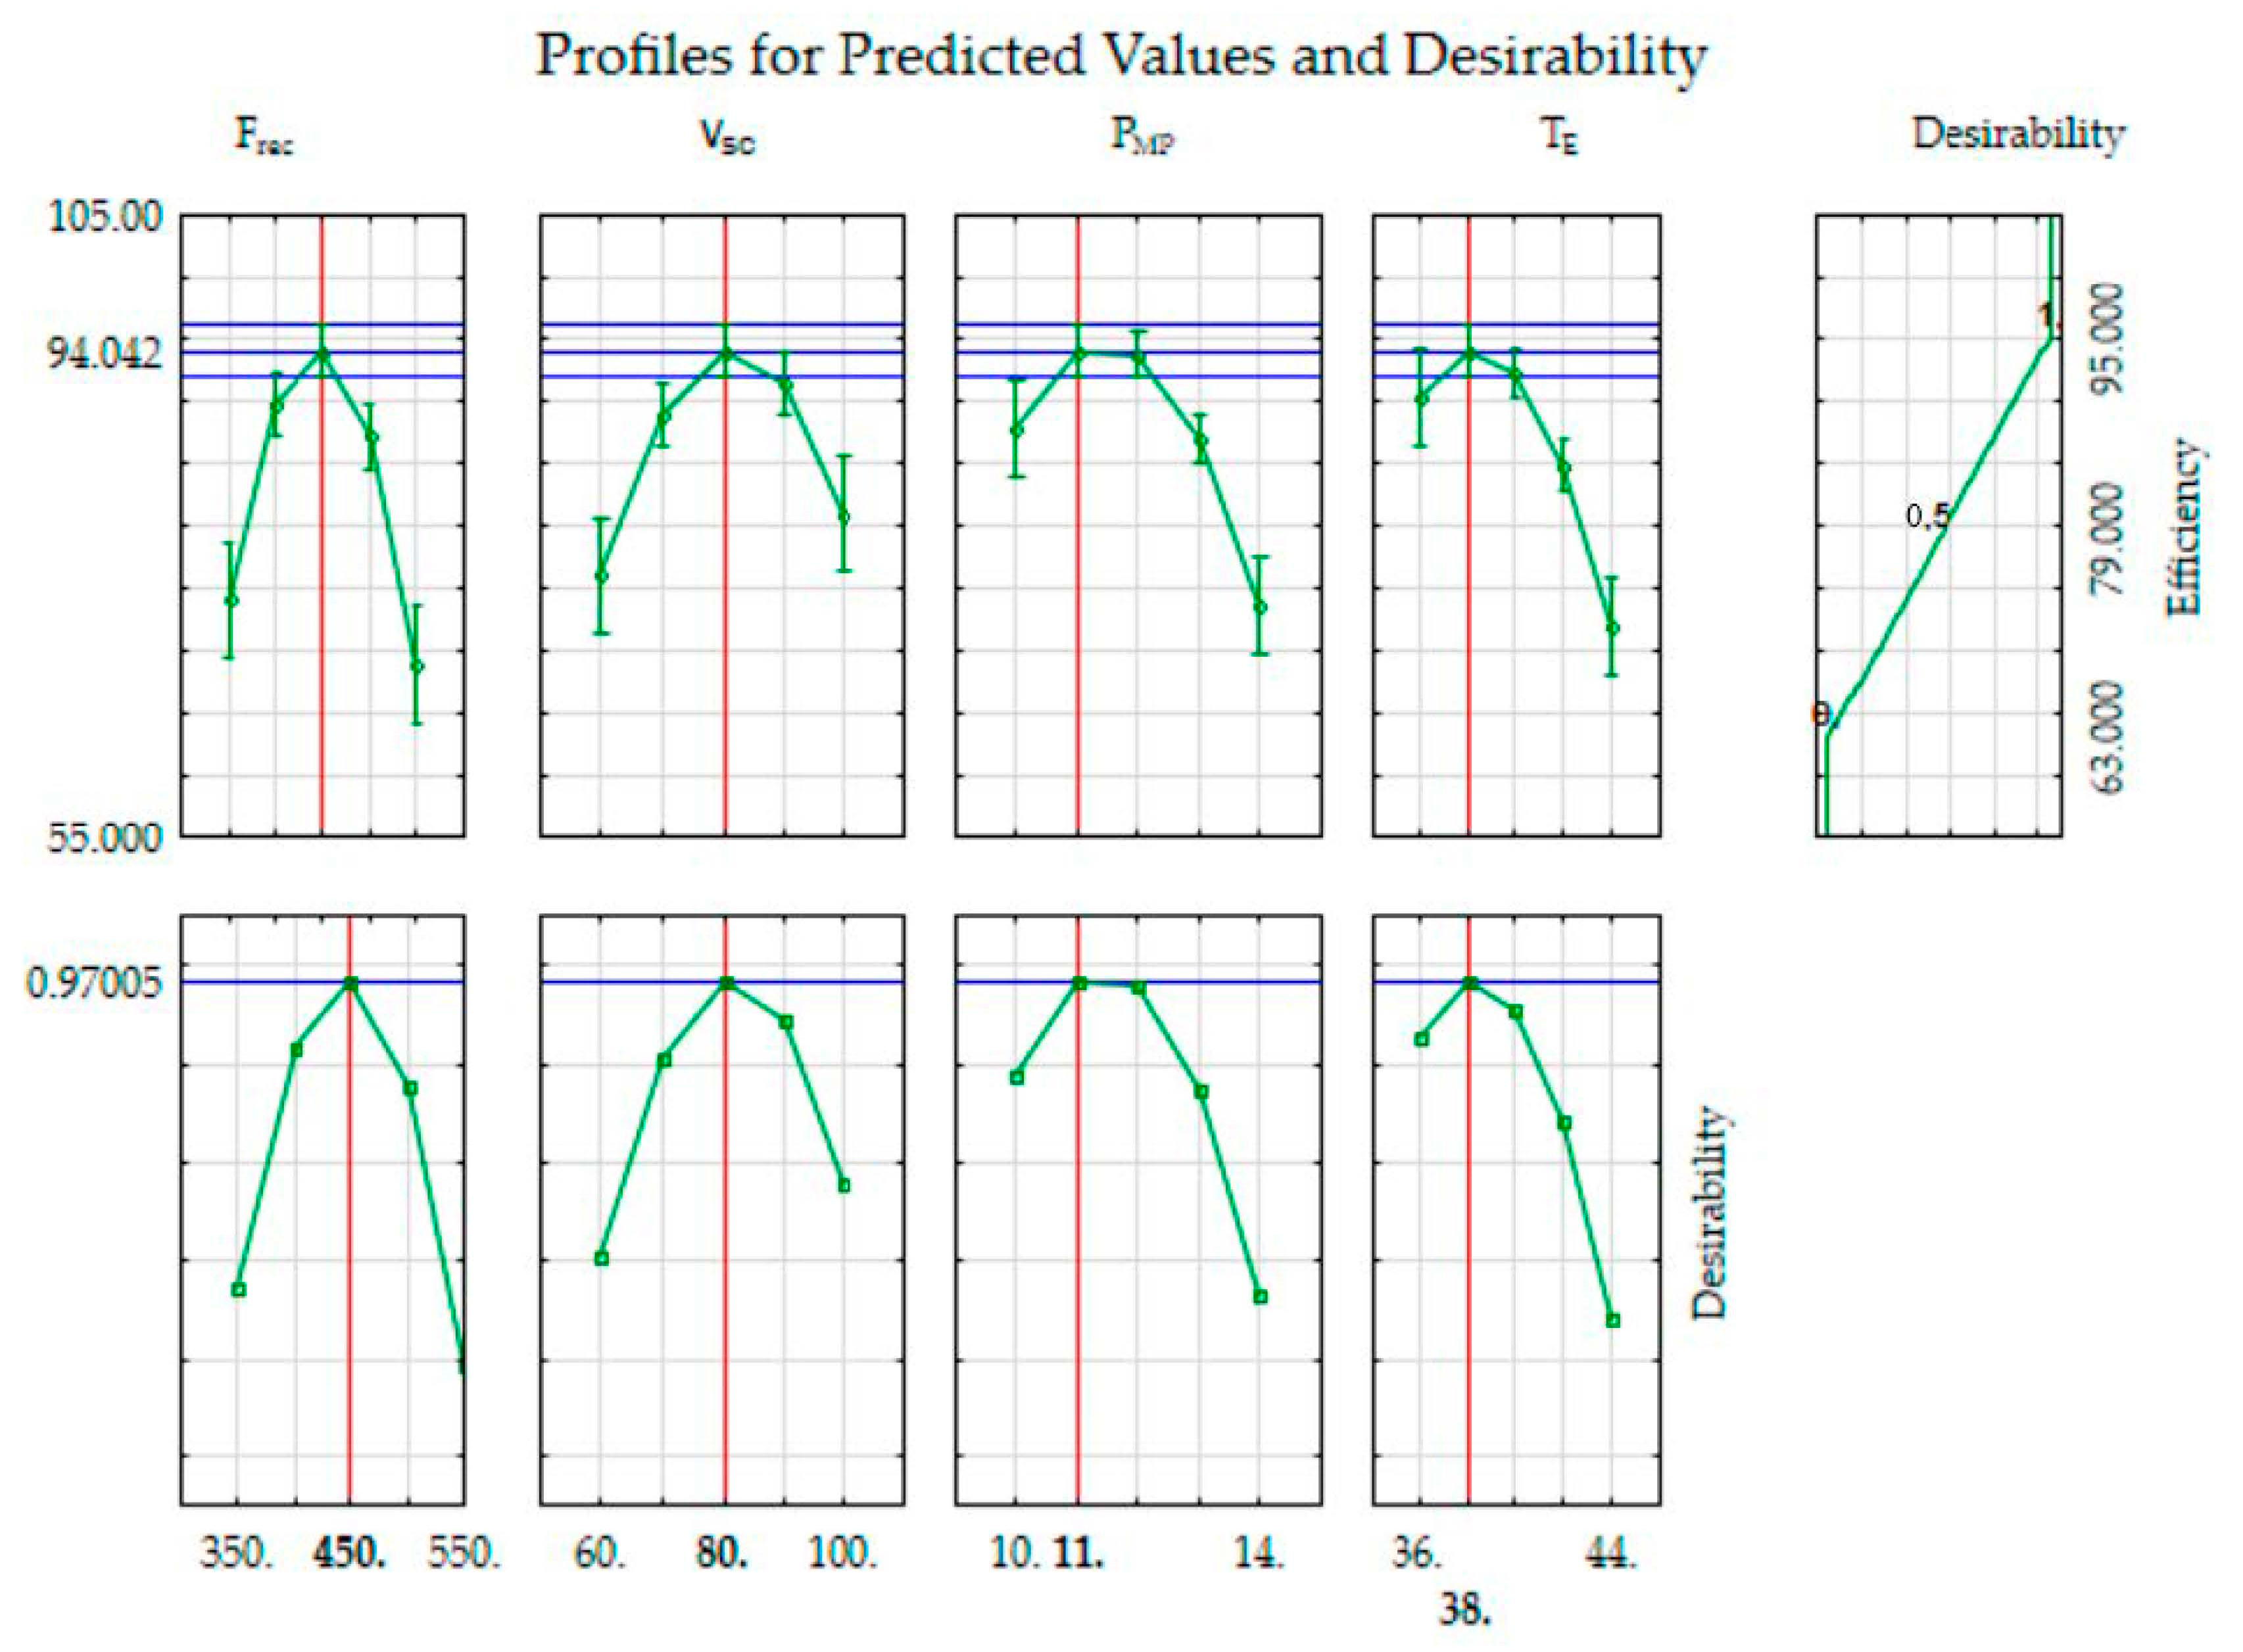
3.3. Application of a Central Composite Rotational Design to the Induced Pre-Saturation Tower

Once the statistically relevant variables were defined in the previous step, a central composite rotational design (CCRD) was applied to the four selected factors. This type of procedure was used to identify optimal operating conditions for the IPST based on the variations of the factors selected on the tower’s efficiency in the percentage removal of oils and greases. A probing strategy on the location of regions with likely optimized conditions, using a complete factorial design [31], was discarded due to the performance of experimental tests with IPST and prior identification of likely regions with this characteristic.
Data on coded and actual factors for the CCRD are shown in Table 3, while Table 4 lists the planning matrix with the results of experiments carried out according to the CCRD.
From these experimental results, the highest oil and grease removal efficiency values were obtained at the central point, denoting that discarding the execution of preliminary experiments to locate the best-performing region of the tower, before applying the CCRD, was a successful strategy. A finding in that table, according to Fanaie et al. [21], was that the influence of the temperature increase, above 40 °C, contributes to a reduction in the efficiency of the flotation process.
For the interaction between the recycle flow and the rotation of the scrapers, it was observed that a simultaneous increase in these two parameters decreases the IPST’s oil and grease removal efficiency. The reason is that an increase in the recycle flow occurs with the reduction in the oil and grease contents, and, probably, the oily foam collected by the highest rotation of the scrapers has its water content increased in relation to the oil and grease contents. Unlike most publications on the flotation of oils and greases in water, the IPST uses pressures well above 6 bar, a value that limits the operating conditions of the conventional flotation column to promote the saturation of the effluent used to reduce the concentration of residual oil [32,33].
The results verified the significance of a model for applying prediction in the IPST operation. Significant coefficients at a 95% confidence level are given in Table 5. Among the main effects of the factors on the oil removal efficiency, only the linear character of the recycle flow was not significant (p > 0.05). Among the second-order interactions, those of the recycle flow with the pressure of the microbubble pumps and the temperature were also insignificant. Four of the six binary interactions between the independent variables were statistically significant, while the two remaining binary interactions, i.e., between the recirculation flow and the pressure of the microbubble pumps and between the scraper rotation speed and the effluent temperature, were not statistically relevant.
In the forecast model analysis, it was observed that the response showed evidence of a lack of fit, with the ratio between the calculated and tabulated Fisher constant values more significant than the 95% confidence value for the degrees of freedom of the mean square of the lack of adjustment. This suggests a need for more accuracy for the model in describing the investigated operational conditions. However, a verified experimental error of less than 1%, an explained variance with a percentage of the order of 87%, and an adjustment coefficient of 0.72 positively reinforce the prediction for semi-industrial scale equipment subjected to experiments.
In light of the results obtained, the regression coefficients established Equation (7) for the allowed model to predict the removal efficiency of the semi-industrial IPST:
η rem   =   1511.76     1.00 F rec   +   6.58 v sc     0.04 v sc 2   +   54.10 P MB     3.26 P MB 2   +   41.91 T E     0.69 T E 2   +   0.01 F rec v sc     0.22 v sc P MB   +   0.78 P MB
where ηrem is the oil and grease removal efficiency, Frec the recycle flow rate, vsc the scraper rotation speed, PMB the microbubble pump pressure, and TE the effluent temperature.
The interactions between the parameters chosen to analyze the response surfaces were determined by evaluating the significant terms (p < 0.05). Figure 5 presents the most representative ternary models for describing the semi-industrial IPST.
The ranges of values used for the chosen independent variables gave rise to peaks in oil and grease removal efficiency. This is evidence that the adopted forecast model can lead to optimized analytical values for all pairs of factors. Thus, there is an increase in efficiency and, subsequently, a reduction in this response variable within the operating ranges to which the IPST was subjected.
Based on the optimization conditions shown in Figure 5, the next step in the study of the IPST-CS at EPASA was using the desirability function [23]. This tool was used to identify an acceptable global operating condition with the semi-industrial IPST since specific requirements were known in isolated operating conditions. As is known, this function can range from 0 to 1, and the closer to unity its value, the better the overall optimization. Moreover, high values of this function indicate that the individual optima for each response are close to each other, with an experimental condition able to simultaneously satisfy them.
Figure 6 shows the individual and global desirability profiles under the conditions established for the experiments carried out in this analysis.
The achieved overall desirability was 95% or 0.95. This value can range from 0 to 1. The closer to the full unit, the better for concurrent optimization. Based on the optimization condition shown by the graphs for the behavior of the response surfaces, the next step of this research was the use of the desirability function to identify an adequate global operating condition with the semi-industrial TPSI. Figure 6 shows the individual and global desirability profiles under the conditions established for the experiments carried out in the TPSI analysis. This value indicates that the individual optima corresponding to each response are close to each other and that there may be an experimental condition that satisfies simultaneously. This is a price to pay in concurrent optimization, however small. Thus, the best operating conditions for oil and grease removal were: recycle flow rate of 450 L·h−1; scraper rotation speed of 80 rpm; average pressure of 11 bar microbubble pumps, and feed effluent temperature of 38 °C. Using these parameters, good water and oil recoveries can be obtained using the semi-industrial TPSI.

3.4. Validation of Scale-Up Strategies Used for the Semi-Industrial IPST

The installation of a free oil recovery centrifuge upstream of IPST was the strategy adopted to supply a stable effluent to benefit the operating conditions of the flotation tower. Another important point was the concentration of the oily effluent to be treated by the tower. In this case, the centrifuge has, as one of its effluents, an oil water with oil and grease contents below 200 mg·L−1, demanding a high performance from the IPST due to the low concentration of oil and grease in the feed [34]. A flow chart of a possible industrial process for the treatment of oily effluents, including a free oil recovery centrifuge upstream of IPST, is illustrated in Figure 7.
Validating the kinetic correlation, aiming to scale up the IPST, an electronic spreadsheet was used to calculate the oil and grease removal efficiency of the oily effluent generated by the free oil recovery centrifuge. Oils and greases concentration values between 100 and 200 mg·L−1 were adopted in the IPST feed, with a hydraulic retention time of around 15 min, or a volume of each stage of 300 L, and a nominal operating flow rate of 1000 L·h−1 for the semi-industrial IPST. The average efficiency simulated by the spreadsheet was 94.2%, with a precision in the order of 99%.
Comparing the IPST with the oil–water separation system, a multi-stage loop-flow flotation column (MSTLFLO), developed by Gu and Chiang [35] for continuous operation, the oil removal efficiencies range from 90 to 93% for feed rates of 60–230 L·h−1, for a feed concentration of 500 mg·L−1. Regarding the experimental system of coalescence–airflotation–carrier preferential adsorption process on the flotation column, elaborated by Huang et al. [36], operating with a feed flow of 1250 L·h−1 and a concentration of oil and grease in water of 2873.86 mg·L−1 achieved a removal efficiency of 90.85%. Furthermore, it is worth mentioning that the IPST offers operational flexibility and simpler automation compared to the two aforementioned oil–water separation systems, while maintaining a high oil and grease removal efficiency.

4. Conclusions

The scale-up criteria proposed in this work were successful with the construction and experimental tests of an Induced Pre-Saturation Tower (IPST) with stages on a semi-industrial scale. Such scale-up criteria were based on the IPST’s operational needs, aiming at an oil and grease removal efficiency equal to or greater than 95% with an oil and grease inlet concentration of 100 to 200 mg·L−1.
The high level of automation and control implemented in the semi-industrial IPST allowed an oil and grease removal efficiency of 95% to be achieved. Associated with this, a combination of experimental designs, such as fractional factorial design and Rotational Central Composite Design (CCRD), allowed the definition of partially optimized conditions. In the final step, adopting a statistical desirability function allowed the selection of overall optimized global condition for the IPST: recycle flow rate of 450 L·h−1; scraper rotation speed of 80 rpm; average pressure of 11 bar microbubble pumps; and feed effluent temperature of 38 °C.
In the planning of future strategies for complementary adjustments to increase the efficiency of oil and grease removal by an IPST, the following are suggested: (i) Measures to maintain the temperature of the effluent in the feed equal to or less than 40 °C; (ii) Implementation of an online oil and grease content analyzer in the treated effluent outlet piping to minimize possible errors in the disposal of treated effluent with the oil and grease concentration levels above (20 mg·L−1) that permitted by the current environmental agency (The Brazilian National Environmental Council—CONAMA); (iii) Study of the angle of the oily foam scraper propellers.

Author Contributions

Conceptualization, L.B.d.S. and V.A.d.S.; methodology, L.B.d.S., R.d.C.F.S.d.S., L.P.P.J., R.D.B. and M.B.; investigation, L.B.d.S., R.d.C.F.S.d.S., L.P.P.J., R.D.B. and M.B.; validation, M.B., V.A.d.S. and L.A.S.; writing—original draft preparation, L.B.d.S., M.B., V.A.d.S., L.A.S. and A.C.; writing—review and editing, R.d.C.F.S.d.S., L.A.S., V.A.d.S. and A.C.; visualization, L.A.S. and V.A.d.S.; supervision, L.A.S. and V.A.d.S.; project administration, V.A.d.S.; funding acquisition, V.A.d.S., L.A.S. and A.C. All authors have read and agreed to the published version of the manuscript.

Funding

This study was funded by the Research and Development Programme of the National Agency of Electrical Energy (ANEEL—PD-07236-0006/2016) and Thermoelectric EPASA (Centrais Elétricas da Paraíba), the Foundation for the Support of Science and Technology of the State of Pernambuco (FACEPE), the National Council for Scientific and Technological Development (CNPq), and the Coordination for the Advancement of Higher Education Personnel (CAPES—Finance Code 001). The authors are grateful to the Centre of Sciences and Technology of the Catholic University of Pernambuco and to the Advanced Institute of Technology and Innovation (IATI), Brazil.

Institutional Review Board Statement

Not applicable.

Informed Consent Statement

Not applicable.

Data Availability Statement

The data presented in this study are available on request from the corresponding author. The data are not publicly available due to privacy.

Acknowledgments

The authors are grateful to the laboratories from the UNICAM Icam Tech School of the Catholic University of Pernambuco (UNICAP), Northeast Biotechnology Network (RENORBIO) and from the Advanced Institute of Technology and Innovation (IATI), Brazil.

Conflicts of Interest

The authors declare that the research was conducted in the absence of any commercial or financial relationships that could constitute a potential conflict of interest.

References

  1. Piccioli, M.; Aanesen, S.V.; Zhao, H.; Dudek, M.; Øye, G. Gas flotation of petroleum produced water: A review on status, fundamental aspects and perspectives. Energy Fuels 2020, 34, 15579–15592. [Google Scholar] [CrossRef]
  2. Li, X.; Xu, H.; Liu, J.; Zhang, J.; Li, J.; Gui, Z. Cyclonic state micro-bubble flotation column in oil-in-water emulsion separation. Sep. Purif. Technol. 2016, 165, 101–106. [Google Scholar] [CrossRef]
  3. Mesa, D.; Brito-Parada, P.R. Scale-up in froth flotation: A state-of-the-art review. Sep. Purif. Technol. 2019, 210, 950–962. [Google Scholar] [CrossRef]
  4. Azevedo, A.; Etchepare, R.; Rubio, J. Raw water clarification by flotation with microbubbles and nanobubbles generated with a multiphase pump. Water Sci. Technol. 2017, 75, 2342–2349. [Google Scholar] [CrossRef]
  5. Camburn, V.; Viswanatham, V.; Linsev, J.; Anderson, D.; Jansen, D.; Crawford, R.; Wood, K. Design prototyping methods: State of the art in strategies, techniques and guidelines. Des. Sci. 2017, 3, E13. [Google Scholar] [CrossRef] [Green Version]
  6. Santos, L.B.; Silva, R.C.F.S.; Brasileiro, P.P.F.; Baldo, R.D.; Sarubbo, L.A.; Santos, V.A. Oily water treatment in a multistage tower operated under a novel induced pre-saturation process in the presence of a biosurfactant as collector. Biotechnol. Rep. 2021, 30, 00638. [Google Scholar] [CrossRef]
  7. Crynes, B.L. Rate of Reaction, Sensitivity, and Chemical Equilibrium; AIChE Modular Instruction. Series E; Kinetics, Crynes, B.L., Fogler, H.S., Eds.; AIChE: New York, NY, USA, 1981; Volume 1, p. 94. [Google Scholar]
  8. Rocha e Silva, F.C.P.; Rocha e Silva, N.M.P.; Silva, I.A.; Brasileiro, P.P.F.; Luna, M.J.; Rufino, R.D.; Santos, V.A.; Sarubbo, L.A. Oil removal efficiency forecast of a Dissolved Air Flotation (DAF) reduced scale prototype using the dimensionless number of Damköhler. J. Water Process Eng. 2018, 23, 45–49. [Google Scholar] [CrossRef]
  9. Otálvaro-Marín, H.L.; Machuca-Martínez, F. Sizing of reactors by charts of Damköhler’s number for solutions of dimensionless design equations. Heliyon 2020, 6, 05386. [Google Scholar] [CrossRef]
  10. Boatwright, A.; Hughes, S.; Barry, J. The height limit of a siphon. Sci. Rep. 2015, 5, 16790. [Google Scholar] [CrossRef] [Green Version]
  11. Jera, T.M.; Bhondayi, C. A review of flotation physical froth flow modifiers. Minerals 2021, 11, 864. [Google Scholar] [CrossRef]
  12. Mukandi, M.R.; Basitere, M.; Okeleye, B.I.; Chidi, B.S.; Ntwampe, S.K.O.; Thole, A. Influence of diffuser design on selected operating variables for wastewater flotation systems: A review. Water Pract. Technol. 2021, 16, 1049–1066. [Google Scholar] [CrossRef]
  13. Brasileiro, P.P.F.; Santos, L.B.; Chaprão, M.J.; Almeida, D.J.; Soares da Silva, R.C.F.; Roque, B.A.C.; Santos, V.A.; Sarubbo, L.A.; Benachour, M. Construction of a microbubble generation and measurement unit for use in flotation systems. Chem. Eng. Res. Des. 2020, 153, 212–219. [Google Scholar] [CrossRef]
  14. Silva, E.S.; Silva, I.A.; Brasileiro, P.P.F.; Correa, P.F.; Almeida, D.G.; Rufino, R.D.; Luna, M.J.; Santos, V.A.; Sarubbo, L.A. Treatment of oily effluent using a low-cost biosurfactant in a flotation system. Biodegradation 2019, 30, 335–350. [Google Scholar] [CrossRef]
  15. Chakrabortty, S.A.; Madhubonti, P.A.; Mousumi, R.B.; Parimal, P.A. Water treatment in a new flux-enhancing, continuous forward osmosis design: Transport modelling and economic evaluation towards scale up. Desalination 2015, 365, 329–342. [Google Scholar] [CrossRef]
  16. Henauth, R.C.S.; Vasconcelos, R.S.; Moura, A.E.; Sarubbo, L.A.; Santos, V.A. Microbubble generation with the aid of a centrifugal pump. Chem. Eng. Technol. 2017, 40, 138–144. [Google Scholar] [CrossRef]
  17. Saththasivam, J.; Loganathan, K.; Sarp, S. An overview of oil-water separation using gas flotation systems. Chemosphere 2016, 144, 671–680. [Google Scholar] [CrossRef]
  18. Quintanilla, P.; Neethling, S.J.; Brito-Parada, P.R. Modelling for froth flotation control: A review. Miner. Eng. 2021, 162, 106718. [Google Scholar] [CrossRef]
  19. Fonseca, R.R.; Thompson, J.P., Jr.; Franco, I.C., Jr.; Silva, F.V. Automation and control of a dissolved air flotation pilot plant. IFAC-PapersOnLine 2017, 50, 3911–3916. [Google Scholar] [CrossRef]
  20. Shannon, W.T.; Buisson, D.H. Dissolved air flotation in hot water. Water Res. 1980, 14, 759–765. [Google Scholar] [CrossRef]
  21. Fanaie, V.R.; Khiadani, M.; Sun, G. Effect of salinity and temperature on air dissolution in an unpacked air saturator of a dissolved air flotation system. Desalin. Water Treat. 2019, 170, 91–100. [Google Scholar] [CrossRef]
  22. Ali, Z.; Bhaskar, S.B. Basic statistical tools in research and data analysis. Indian J. Anaesth. 2016, 60, 662–669. [Google Scholar] [CrossRef] [PubMed]
  23. Pandey, N.; Thakur, C.; Ghosh, P.; Hiwarkar, A.D. Desirability analysis of multiple responses for electrocoagulation remediation of paper mill wastewater by using a central composite design. J. Inst. Eng. India Ser. E 2021, 102, 115–125. [Google Scholar] [CrossRef]
  24. CONAMA, Conselho Nacional do Meio Ambiente, Ministerio do Meio Ambiente. Resolução N 500, 19 de Outubro 2020. Available online: http://www2.mma.gov.br/port/conama/legiabre.cfm?codlegi=751 (accessed on 30 October 2022). (In Portuguese)
  25. American Public Health Association (APHA); American Water Works Association (AWWA); Water Environment Federation (WEF). Standard Methods for the Examination of Water and Wastewater, 22nd ed.; APHA/AWWA/WEF: Washington, DC, USA.
  26. Shanmugam, B.K.; Vardhan, H.; Govinda Raj, M.; Kaza, M.; Sah, R.; Hanumanthappa, H. Application of fractional factorial design for evaluating the separation performance of the screening machine. Int. J. Coal Prep. Util. 2022, 42, 3369–3379. [Google Scholar] [CrossRef]
  27. Oliveira, M.; Lima, V.M.M.; Yamashita, S.M.; Alves, P.S.; Portella, A.C.F. Experimental planning factorial: A brief review. Int. J. Adv. Eng. Res. Sci. 2018, 5, 166–177. [Google Scholar] [CrossRef]
  28. Khidhir, A.G.; Hamadi, A.S. Central composite design method for the preparation, stability and properties of water-in-diesel nano emulsions. Adv. Chem. Eng. Sci. 2018, 8, 176–189. [Google Scholar] [CrossRef] [Green Version]
  29. Jolliffe, I.T.; Cadima, J. Principal component analysis: A review and recent developments. Philos. Trans. A Math. Phys. Eng. Sci. 2016, 374, 20150202. [Google Scholar] [CrossRef] [Green Version]
  30. Gunst, R.F.; Mason, R.L. Fractional factorial design. WIREs Comput. Stat. 2009, 1, 234–244. [Google Scholar] [CrossRef]
  31. Durakovic, B. Design of experiments application, concepts, examples: State of the art. Period. Eng. Nat. Sci. 2017, 5, 401–439. [Google Scholar] [CrossRef]
  32. Etchepare, R.; Oliveira, H.; Azevedo, A.; Rubio, J. Separation of emulsified crude oil in saline water by dissolved air flotation with micro and nanobubbles. Sep. Purif. Technol. 2017, 186, 326–332. [Google Scholar] [CrossRef]
  33. Li, X.; Liu, J.; Wang, Y.; Wang, C.; Zhou, X. Separation of oil from wastewater by column flotation. J. China Univ. Min. Technol. 2007, 17, 546–551, 577. [Google Scholar] [CrossRef]
  34. Al-Dulaimi, S.L.; Al-Yaqoobi, A.M. Separation of oil/water emulsions by microbubble air flotation. IOP Conf. Ser. Mater. Sci. Eng. 2021, 1076, 012030. [Google Scholar] [CrossRef]
  35. Gu, X.; Chiang, S.H. A novel flotation column for oily water cleanup. Sep. Purif. Technol. 1999, 16, 193–203. [Google Scholar] [CrossRef]
  36. Huang, G.; Xu, H.; Wu, L.; Li, X.; Wang, W. Research of novel process route and scale-up based on oil-water separation flotation column. J. Water Reuse Desalin. 2018, 8, 111–122. [Google Scholar] [CrossRef] [Green Version]
Figure 1. Schematic diagram of the main components of the semi-industrial IPST.
Energies 16 02278 g001
Figure 2. (a) Isometric drawing of the semi-industrial induced pre-saturation tower (IPST); (b) IPST installed in an industrial unit (authors’ photography).
Energies 16 02278 g002
Figure 3. Scree plot for principal components.
Energies 16 02278 g003
Figure 4. Biplot: (a) PC1 × PC2; (b) PC1 × PC3.
Energies 16 02278 g004
Figure 5. Response surfaces for oil and grease removal efficiency (ηrem, %) as function of: (a) Recycle flow rate (Frec, L·h−1) and Microbubbles pump pressure (PMB, bar); (b) Recycle flow rate (RFR, RFR, L·h−1) and Feed effluent temperature (FET, °C); (c) Microbubbles pump pressure (MPP, bar) and Scraper rotation speed (SRS, rpm); (d) Feed effluent temperature (FET, °C) and Microbubbles pump pressure (MPP, bar); (e) Recycle flow rate (L·h−1) and scraper rotation speed (rpm); (f) Scraper rotation speed (rpm) and Feed effluent temperature (FET, °C).
Energies 16 02278 g005
Figure 6. Profiles of individual (left) and global (right) desirability of the conditions established for the experiments carried out in the semi-industrial IPST analysis.
Energies 16 02278 g006
Figure 7. IPST flowchart downstream of a free oil recovery centrifuge in an industrial sector for the treatment of oily effluents.
Energies 16 02278 g007
Table 1. Values of the weights of variables within the main components.
VariablePC1PC2PC3
X10.0848000.213500−0.884371
X2−0.6632970.410467−0.086754
X3−0.6714570.522040−0.381560
X40.8065490.4455450.034676
X5−0.0511580.8756070.142789
X6−0.759234−0.1220630.085505
X70.6476950.383396−0.236199
X80.074145−0.686134−0.559848
Table 2. Results of the analysis of variance (ANOVA) applied to data of percentage efficiency of oil and grease removal collected in tests carried out with the semi-industrial IPST according to the fractional factorial design.
FactorSums of Squares (SS)Degree of Freedom (df)Mean Squares (MS)F-Statisticp-Value
X112.250112.25000.609240.460650
X2306.2501306.250015.230910.005879
X3240.2501240.250011.948490.010595
X4121.0001121.00006.017760.043906
X549.000149.00002.436940.162475
X60.00010.00000.000001.000000
X7156.2501156.25007.770870.027000
X816.000116.00000.795740.401993
Error140.750720.1071
Total SS1041.75015
Table 3. Coded and actual values of factors for the application of the central composite rotational design to the semi-industrial induced pre-saturation tower.
Factor−2−10+1+2
Recycle flow rate (L·h−1)350400450500550
Scraper rotation speed (rpm)60708090100
Microbubble pump pressure (bar)1011121314
Effluent temperature (°C)3638404244
Table 4. Matrix of the central composite rotational design with coded (between brackets) and actual values of the independent variables. Response variable: oil and grease removal efficiency (ηrem).
ExperimentRecycle Flow Rate (L/h)Scraper Rotation Speed (rpm)Microbubble Pump Pressure (bar)Effluent Temperature (°C)ηrem
(%)
1(−1) 400(−1) 70(−1) 11(−1) 3885
2(−1) 400(−1) 70(−1) 11(+1) 4280
3(−1) 400(−1) 70(+1) 13(−1) 3886
4(−1) 400(−1) 70(+1) 13(+1) 4276
5(−1) 400(+1) 90(−1) 11(−1) 3889
6(−1) 400(+1) 90(−1) 11(+1) 4267
7(−1) 400(+1) 90(+1) 13(−1) 3867
8(−1) 400(+1) 90(+1) 13(+1) 4263
9(+1) 500(−1) 70(−1) 11(−1) 3882
10(+1) 500(−1) 70(−1) 11(+1) 4272
11(+1) 500(−1) 70(+1) 13(−1) 3880
12(+1) 500(−1) 70(+1) 13(+1) 4273
13(+1) 500(+1) 90(−1) 11(−1) 3887
14(+1) 500(+1) 90(−1) 11(+1) 4277
15(+1) 500(+1) 90(+1) 13(−1) 3876
16(+1) 500(+1) 90(+1) 13(+1) 4275
17(−2) 35080124072
18(+2) 55080124073
19450(−2) 60124079
20450(+2) 100124080
2145080(−2) 104083
2245080(+2) 144081
234508012(−2) 3685
244508012(+2) 4483
2545080124094
2645080124092
2745080124093
2845080124095
Table 5. Results of the analysis of variance (ANOVA) applied to data of percentage efficiency of oil and grease removal collected in tests carried out with the semi-industrial IPST according to the CCRD.
FactorSums of Squares (SS)Degree of Freedom (df)Mean Squares (MS)F-Statisticp-Value
(1) Frec (L)0.04210.04170.02500.884411
Frec (Q)790.6281790.6276474.37660.000212
(2) vsp (L)18.375118.375011.02500.045041
vsp (Q)382.0031382.0026229.20160.000626
(3) PMB (L)135.3751135.375081.22500.002884
PMB (Q)271.6901271.6901163.01410.001037
(4) TE (L)165.3751165.375099.22500.002153
TE (Q)196.9401196.9401118.16410.001666
1L by 2L217.5621217.5625130.53750.001439
1L by 3L1.56311.56250.93750.404342
1L by 4L33.062133.062519.83750.021064
2L by 3L39.062139.062523.43750.016812
2L by 4L14.062114.06258.43750.062262
3L by 4L76.563176.562545.93750.006564
Lack of Fit261.9171026.191715.71500.022115
Pure Error5.00031.6667
Total SS1992.10727
Frec = recycle flow rate; vsc = scraper rotation speed; PMB = microbubble pump pressure; TE = effluent temperature; L = linear terms’ coefficients; Q = quadratic terms’ coefficients.
Disclaimer/Publisher’s Note: The statements, opinions and data contained in all publications are solely those of the individual author(s) and contributor(s) and not of MDPI and/or the editor(s). MDPI and/or the editor(s) disclaim responsibility for any injury to people or property resulting from any ideas, methods, instructions or products referred to in the content.

